Use of Inductively Coupled Plasma-Mass Spectrometry in Boron-lO Stable Isotope Experiments with Plants, Rats, and Humans Richard A. Vanderpool1, Deb Hoff1, and Phyllis E. Johnson2 'United States Department of Agriculture, Agricultural Research Service, Grand Forks, North Dakota; 2United States Department of Agriculture, Agricultural Research Service, Albany, California The commercial availability of inductively coupled plasma-mass spectrometry technology (ICP-MS) has presented the opportunity to measure the boron concentrations and isotope ratios in a large number of samples with minimal sample preparation. A typical analytical sequence for fecal sam- ples consists of 25 acid blanks, 1 digestion blank, 5 calibration solutions, 4 standard reference material solutions, 10 samples, and 4 natural abun- dance bias standards. Boron detection limits (3 x 1a) for acid blanks are 0.11 ppb for '0B, and 0.40 ppb for " B. Isotope ratios were measured in fecal samples with 20 to 50 ppb boron with <2% relative standard deviation. Rapid washout and minimal memory effects were observed for a 50 ppb beryllium internal standard, but a 200 ppb boron biological sample had a 1.0 ppb boron memory after a 6-min washout. Boron isotope ratios in geo- logical materials are highly variable; apparently this variability is reflected in plants. The lack of a fixed natural abundance value for boron requires that a natural abundance ratio be determined for each sample or related data set. The natural abundance variability also prevents quantitation and calcula- tion of isotope dilution by instrument-supplied software. To measure boron transport in animal systems, 20 pg of '°B were fed to a fasted rat. During the 3 days after a 10B oral dose, 95% of the '0B was recovered from the urine and 4% from the feces Urinary isotope ratios, I B/°0B, changed from a natural abundance of 4.1140 to an enriched value of 0.9507, a 77% change. The '°B label in perfused rat livers peaked within 3 hr (>90% recovery, 56% change in " B/`B) and returned to a natural abundance ratio within 24 hr. In summary, boron concentrations and enriched isotope ratios have been measured successfully in rat urine and feces by using ICP-MS. - Environ Health Perspect 102(Suppl 7):13-20 (1994) Key words: ICP-MS, I0B, memory, stable isotopes, matrix, beryllium, boron Introduction The lack of a suitably available radioactive isotope of boron has prevented the perfor- mance of typical experiments reported for other minerals of nutritional interest. While thermal ionization-mass spectrome- try (TI-MS) could be used for stable boron isotope experiments, most kinetic work is limited by sample preparation and analysis time. However, with the introduction of commercially available inductively coupled plasma-mass spectrometry (ICP-MS) tech- nology, boron concentrations and isotope ratios can be determined for large numbers of samples with minimal sample prepara- tion. During the previous year, protocols have been developed to measure boron in biological samples using ICP-MS and for "B stable isotope kinetics experiments with plants and animals. Experimental Design Preliminary results from two '°B isotope experiments are illustrated in Figure 1. In a typical experiment designed to measure 5.00 - 4.00 - lm _m T- 3.00 - 2.00 - 1.00 - 0.00 - boron transport and kinetics in rats, 20 pig of '°B were fed to rats. Urine and fecal samples were collected in a metabolic cage, and liver samples were obtained from a This paper was presented at the International Symposium on Health Effects of Boron and Its Compounds held 16-17 September 1992 at the University of California, Irvine, California. Address correspondence to Dr. Richard A. Vanderpool, USDA, ARS, GFHNRC, PO Box 7166, University Station, Grand Forks, ND 58202-7166. Telephone (701) 795-8416. Fax (701) 795-8395. 0 1 2 3 4 5 6 7 8 9 10 11 12 Days Figure 1. Boron (B) isotope ratios measured in microwave-digested rat urine and livers. Urine samples, Rco,,, (LI1) collected in a metabolic chamber and liver samples, RCorr, (@) collected from individual rats given a similar 'B containing test meal on day four after morning urine samples were collected. Environmental Health Perspectives 13
Transcript
Use of Inductively Coupled Plasma-MassSpectrometry in Boron-lO Stable IsotopeExperiments with Plants, Rats, and HumansRichard A. Vanderpool1, Deb Hoff1, and Phyllis E. Johnson2'United States Department of Agriculture, Agricultural Research Service, Grand Forks, North Dakota; 2UnitedStates Department of Agriculture, Agricultural Research Service, Albany, California
The commercial availability of inductively coupled plasma-mass spectrometry technology (ICP-MS) has presented the opportunity to measure theboron concentrations and isotope ratios in a large number of samples with minimal sample preparation. A typical analytical sequence for fecal sam-ples consists of 25 acid blanks, 1 digestion blank, 5 calibration solutions, 4 standard reference material solutions, 10 samples, and 4 natural abun-dance bias standards. Boron detection limits (3 x 1a) for acid blanks are 0.11 ppb for '0B, and 0.40 ppb for " B. Isotope ratios were measured in fecalsamples with 20 to 50 ppb boron with <2% relative standard deviation. Rapid washout and minimal memory effects were observed for a 50 ppbberyllium internal standard, but a 200 ppb boron biological sample had a 1.0 ppb boron memory after a 6-min washout. Boron isotope ratios in geo-logical materials are highly variable; apparently this variability is reflected in plants. The lack of a fixed natural abundance value for boron requires thata natural abundance ratio be determined for each sample or related data set. The natural abundance variability also prevents quantitation and calcula-tion of isotope dilution by instrument-supplied software. To measure boron transport in animal systems, 20 pg of '°B were fed to a fasted rat. Duringthe 3 days after a 10B oral dose, 95% of the '0B was recovered from the urine and 4% from the feces Urinary isotope ratios, I B/°0B, changed froma natural abundance of 4.1140 to an enriched value of 0.9507, a 77% change. The '°B label in perfused rat livers peaked within 3 hr (>90% recovery,56% change in " B/`B) and returned to a natural abundance ratio within 24 hr. In summary, boron concentrations and enriched isotope ratios havebeen measured successfully in rat urine and feces by using ICP-MS. - Environ Health Perspect 102(Suppl 7):13-20 (1994)
IntroductionThe lack of a suitably available radioactiveisotope of boron has prevented the perfor-mance of typical experiments reported forother minerals of nutritional interest.While thermal ionization-mass spectrome-
try (TI-MS) could be used for stable boronisotope experiments, most kinetic work islimited by sample preparation and analysistime. However, with the introduction ofcommercially available inductively coupledplasma-mass spectrometry (ICP-MS) tech-nology, boron concentrations and isotoperatios can be determined for large numbersof samples with minimal sample prepara-
tion. During the previous year, protocolshave been developed to measure boron inbiological samples using ICP-MS and for"B stable isotope kinetics experiments withplants and animals.
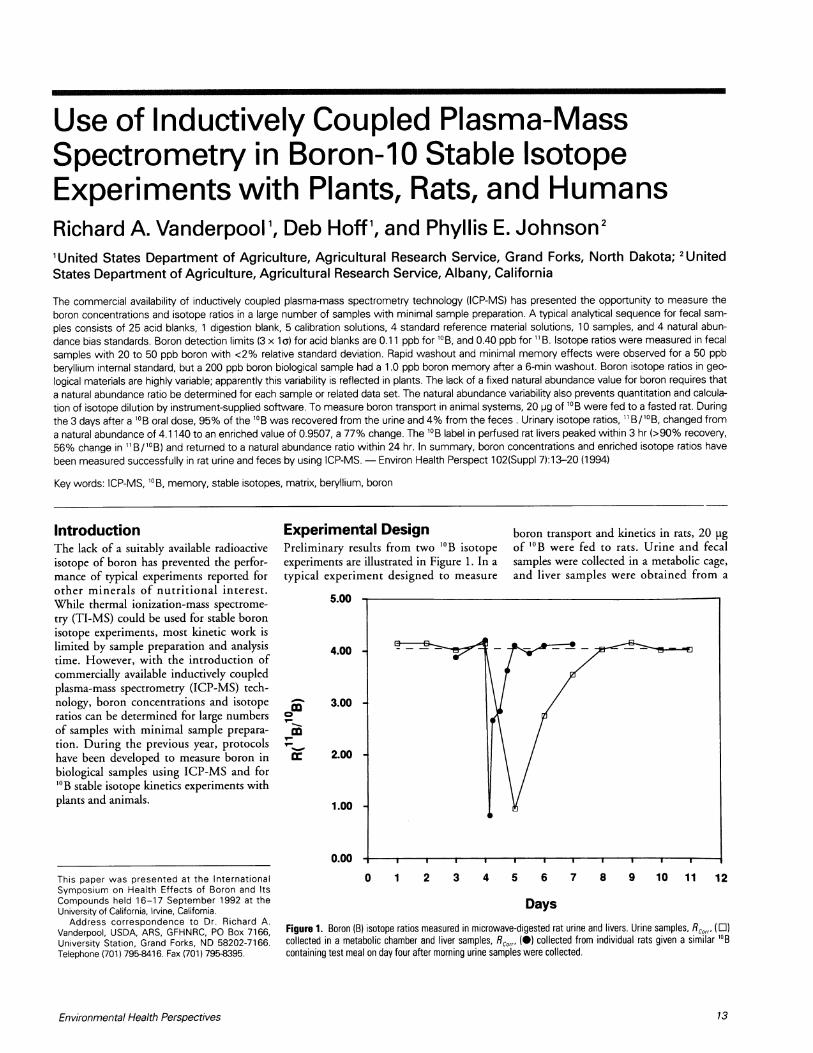
Experimental DesignPreliminary results from two '°B isotopeexperiments are illustrated in Figure 1. In atypical experiment designed to measure
5.00 -
4.00 -
lm
_mT-
3.00 -
2.00 -
1.00 -
0.00 -
boron transport and kinetics in rats, 20 pigof '°B were fed to rats. Urine and fecalsamples were collected in a metabolic cage,and liver samples were obtained from a
This paper was presented at the InternationalSymposium on Health Effects of Boron and ItsCompounds held 16-17 September 1992 at theUniversity of California, Irvine, California.
Address correspondence to Dr. Richard A.Vanderpool, USDA, ARS, GFHNRC, PO Box 7166,University Station, Grand Forks, ND 58202-7166.Telephone (701) 795-8416. Fax (701) 795-8395.
0 1 2 3 4 5 6 7 8 9 10 11 12
DaysFigure 1. Boron (B) isotope ratios measured in microwave-digested rat urine and livers. Urine samples, Rco,,, (LI1)collected in a metabolic chamber and liver samples, RCorr, (@) collected from individual rats given a similar 'Bcontaining test meal on day four after morning urine samples were collected.
Environmental Health Perspectives 13
VANDERPOOL ETAL.
Table 1. Offline calculations summary.
1 9/ l0/ l1 / Raw peak integrals2 /No=Ix(9I / 9 ) Normalize/run3 'Avg, RSD Average and statistics4 ICot (USmp/ - 'Abik (Db/k - Abik) Blank subtraction (acid and digestion)5 Robs= Corr / 0ICorr Observed isotope ratio6 RCorr = SmPRObs x (SRmit / SRmRObs Bias correction7 11 B = ('aICort - b) / m Regression curve and nmole/ml8 0°BTot= "Bx( 0B/11B) nmole/ml "B9 9OBNA = BNAX(10B/1B)NA nmole/ml NA 10B10 0BSk=10BTot- lBNA nmole/ml 0OB spike
Abbreviations: 9/, raw peak integral, 9beryllium (Be); 0/, raw peak integral, 10Be; ll/, raw peak integral, llBe; /Nornormalized integral, 'Avg average integral for each isotope; 'Cotr corrected integral; 'Smp' integral of sample; 'Ablkintegral for acid blank, 'Dblk' integral for digestion blank; RObs isotope ratios; 11 /Cor corrected integral for "boron(B); 0ICaort, corrected integral for 0OB; RCort, corrected ratio; smP/RObs' observed isotope ratios for each sample;SRMR/it / SRMRObs , standard reference to correct for instrument bias; b, intercept of regression curve; m, slope ofregression curve; "OBTat' total 0°B concentration; 0OBNA, naturally occurring B in sample; Bsk, spiked 0OB; n, sample
series of individual animals. During thefirst 3 days after the test meal, 95% of the'°B isotope was detected in the urine and4% in the feces. The urinary boron iso-tope ratio, " B/1'B (R5,.,, Table 1),changed from a natural abundance of 4.1 1to an enrichment of 0.951, a 77%increase in '°B. The '°B isotope, measuredin rat livers after saline perfusion, peakedwithin 3 hr (>90% recovery, 56% change
in " B / '°B ratio) and returned to tural abundance ratio within 24 hr.
InstrumentBoron measurements were made byVG Elemental PlasmaQuad2+ ICThe ICP-MS system (Figure 2) coran autosampler with a peristaltic pimove a sample to a nebulizer, whizverts the liquid sample into anusing an argon gas stream. The ae
Table 2. ICP-MS system and boron experiment parameters.
Scott-type double bypassBorosilicate glass6°CNickel, 1.0 mm orificeNickel, 0.75 mm orifice10 mm from load coil1.7 mbar<0.0 x 10⁻⁴ mbar1lOX 10-6 mbar0.64 ml/min2.55.09Be, '0B, B
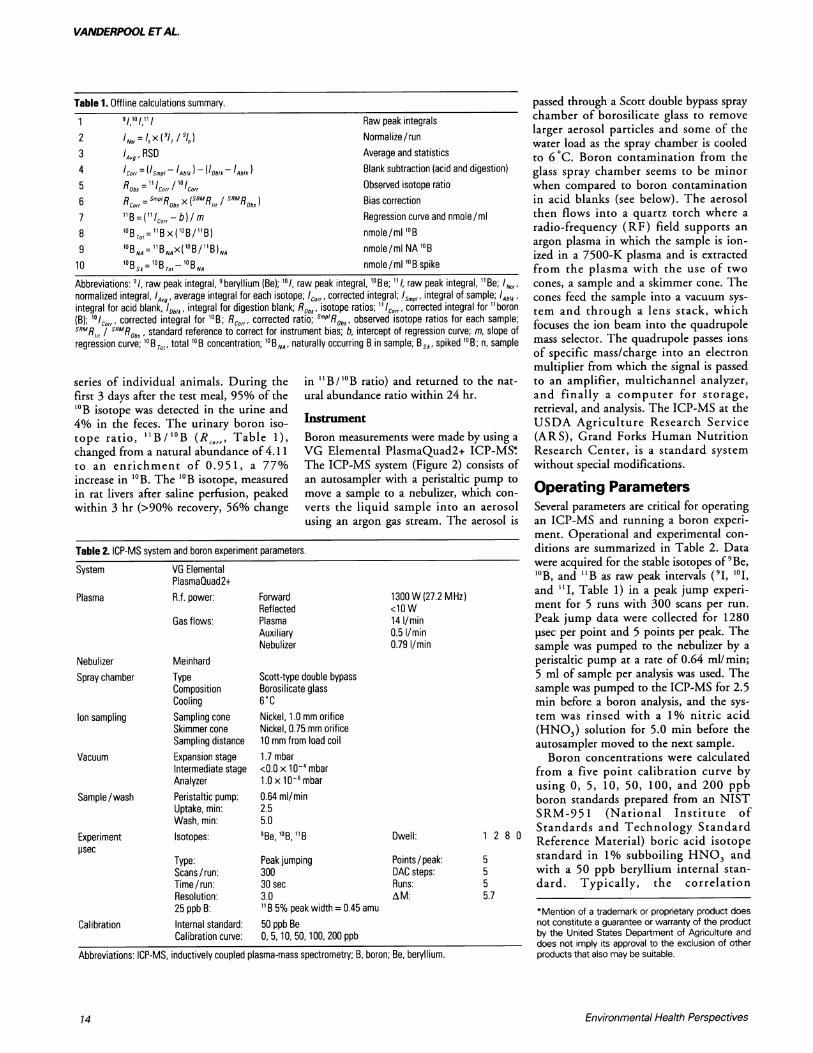
passed through a Scott double bypass spraychamber of borosilicate glass to removelarger aerosol particles and some of thewater load as the spray chamber is cooledto 6 0C. Boron contamination from theglass spray chamber seems to be minorwhen compared to boron contaminationin acid blanks (see below). The aerosolthen flows into a quartz torch where aradio-frequency (RF) field supports anargon plasma in which the sample is ion-ized in a 7500-K plasma and is extractedfrom the plasma with the use of twocones, a sample and a skimmer cone. Thecones feed the sample into a vacuum sys-tem and through a lens stack, whichfocuses the ion beam into the quadrupolemass selector. The quadrupole passes ionsof specific mass/charge into an electronmultiplier from which the signal is passedto an amplifier, multichannel analyzer,and finally a computer for storage,retrieval, and analysis. The ICP-MS at theUSDA Agriculture Research Service(ARS), Grand Forks Human NutritionResearch Center, is a standard systemwithout special modifications.
ch con- Operating Parametersaerosol Several parameters are critical for operatingrosol is an ICP-MS and running a boron experi-
ment. Operational and experimental con-ditions are summarized in Table 2. Datawere acquired for the stable isotopes of 9Be,iiB, and iiB as raw peak intervals (9I, 'I,and "ii, Table 1) in a peak jump experi-ment for 5 runs with 300 scans per run.Peak jump data were collected for 1280psec per point and 5 points per peak. Thesample was pumped to the nebulizer by aperistaltic pump at a rate of 0.64 ml/min;5 ml of sample per analysis was used. Thesample was pumped to the ICP-MS for 2.5min before a boron analysis, and the sys-tem was rinsed with a 1% nitric acid(HNO3) solution for 5.0 min before theautosampler moved to the next sample.Boron concentrations were calculated
from a five point calibration curve byusing 0, 5, 10, 50, 100, and 200 ppbboron standards prepared from an NISTSRM-951 (National Institute ofStandards and Technology Standard
1 2 B 0 Reference Material) boric acid isotope5 standard in 1% subboiling HNO3 and5 with a 50 ppb beryllium internal stan-5 dard. Typically, the correlation5.7
*Mention of a trademark or proprietary product doesnot constitute a guarantee or warranty of the productby the United States Department of Agriculture anddoes not imply its approval to the exclusion of otherproducts that also may be suitable.
Environmental Health Perspectives
System
Plasma
NebulizerSpray chamber
Ion sampling
Vacuum
Sample/wash
Experimentpsec
Calibration
Abbreviations: ICP-MS, inductively coupled plasma-mass spectrometry; B, boron; Be, beryllium.
R, isotope ratio. RSD, Relative standard deviation. a50 ppb beryllium (Be) and 50 ppb boron (B) (National Instituteof Standards and Technology Standard Reference Material 951); average of 20 accumulations per isotope for anaverage 9Be peak integral of 16,891 ± 200. bn = 10 for 5120 psec dwell.
Table 4. Inductively coupled plasma-mass spectrometry autosampler load sequence for fecal sample. a
Acid blank5 ppb standard
Acid blank10 ppb standard
Acid blank50 ppb standard
Acid blank100 ppb standard
Acid blank200 ppb standard
Acid blankDigestion blank 1 a
Acid blankSample 1 a
Acid blankBias standard 1
Acid blankSample 2 a
Acid blankSRM standard 1ab
Acid blankSample 3 a
Acid blankSample 4 a
Acid blankBias standard 2
Acid blankSample 5 a
Acid blankSRM standard 2
Acid blankSample 6 a
Acid blankSample 7 a
Acid blankBias standard 3
Acid blankSample 8 a
Acid blankSRM standard 3
Acid blankSample 9 a
Acid blankSample 10 a
Acid blankBias standard 4
Acid blankSRM standard 4
a Indicates the 12 samples digested per turntable in microwave oven procedure. b Digested standard referencematerial (SRM) standard diluted to prepare SRM standards 1 to 4.
DE7ECTOR QUADRUPOFLE LEESES IN1FACE ICP
Figure 2. Schematic of an inductively coupled plasma-mass spectrometer (ICP-MS). Overall schematic of an ICP-MS, consisting of: a peristaltic pump, Meinhard nebulizer, spray chamber, torch, skimmer cone, sampler cone, lensstack, quadrupole, electron multiplier, associated electronics, and vacuum pumps. Reprinted with permission fromVG Elemental (1).
coefficient, R, was greater than 0.999 forthe calibration curve. The 1% HNO3blank used in the calibration ranged from3 to 5 ppb with much of the boron cont-amination coming from the laboratoryprepared subboiling distilled HNO3.Detection limits were determined as threetimes the standard deviation (3 x la) ofan acid blank by collecting 10, 1-mincounts in single ion monitoring. Thedetection limit for "B was calculated at0.4 ppb and that for '°B at 0.2 ppb. Inpractice, sample digest blanks were typi-cally 10 ppb, so sample concentrationswere prepared to be at or above 10 ppbfor routine boron analysis.
Several factors control accuracy, precis-ion, and signal intensity in a boron analy-sis. Factors such as the degree of elemen-tal ionization in the plasma are uncon-trollable. The degree of ionization for anelement in the torch plasma is relateddirectly to the first ionization energy ofthe element (2). For lithium, the firstionization energy is low and ionization inthe plasma is near 100%. Bromine has amuch higher first ionization energy and,therefore, the ionization level in the plas-ma is 3%. Boron and beryllium have sim-ilar masses and ionization energies, withionization levels in the plasma around70%. This makes beryllium an excellentinternal standard for boron analysis.
Dwell time defines the period of timethat counts are collected for each pointdefined in the peak jump acquisitionexperiment (Table 2). Long dwell timestranslate to longer collection times andfewer scans for a set collection time peri-od. For a 50 ppb boron solution, therewere not large changes in the RSD formost dwell times other than 80 jisec forour ICP-MS system (Table 3). Therefore,the dwell time for our boron analyses wasset at 1280 psec. This finding may be
3000-
4O
00
is IO
- .-
2.5 3.5 4.5 5.5 6.5
Minutes
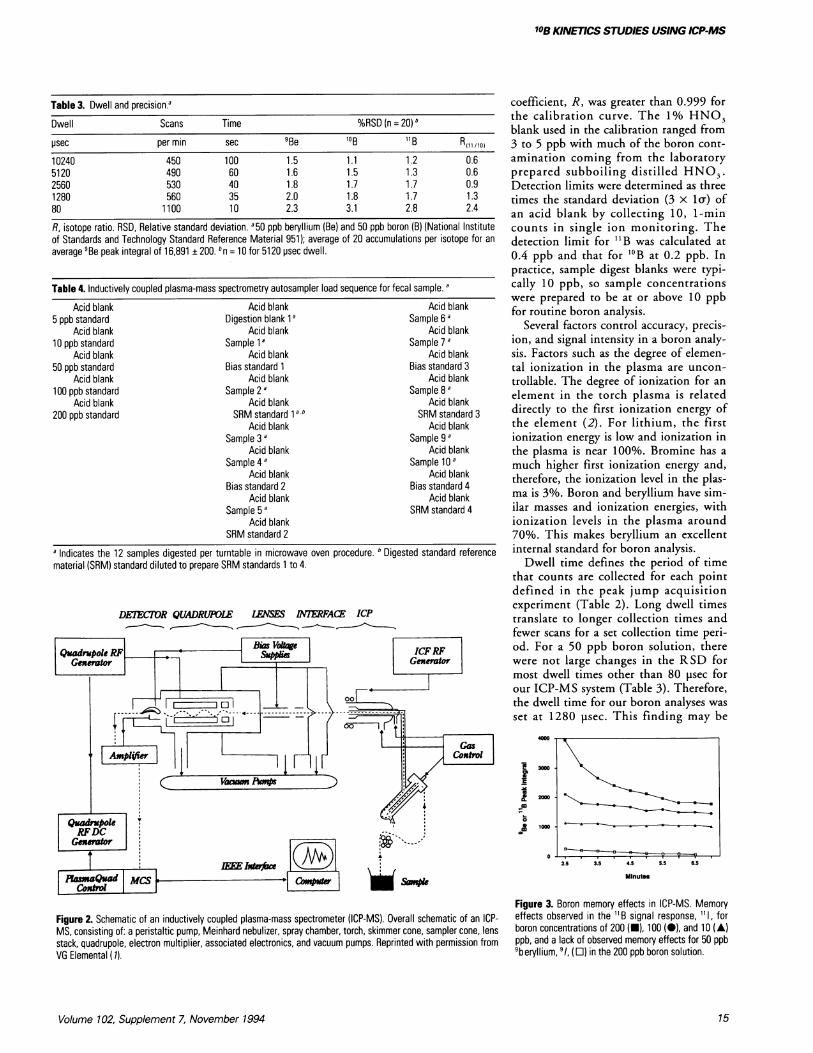
Figure 3. Boron memory effects in ICP-MS. Memoryeffects observed in the 11B signal response, 111, forboron concentrations of 200 (U), 100 (0), and 10 (A)ppb, and a lack of observed memory effects for 50 ppb'beryllium, 9/, (C) in the 200 ppb boron solution.
Volume 102, Supplement 7, November 1994 15
VANDERPOOL ETAL.
3000
a)4o.. 2000
:L_. 1000
0
2.5 3.5 4.5 5.5 6.5Minutes
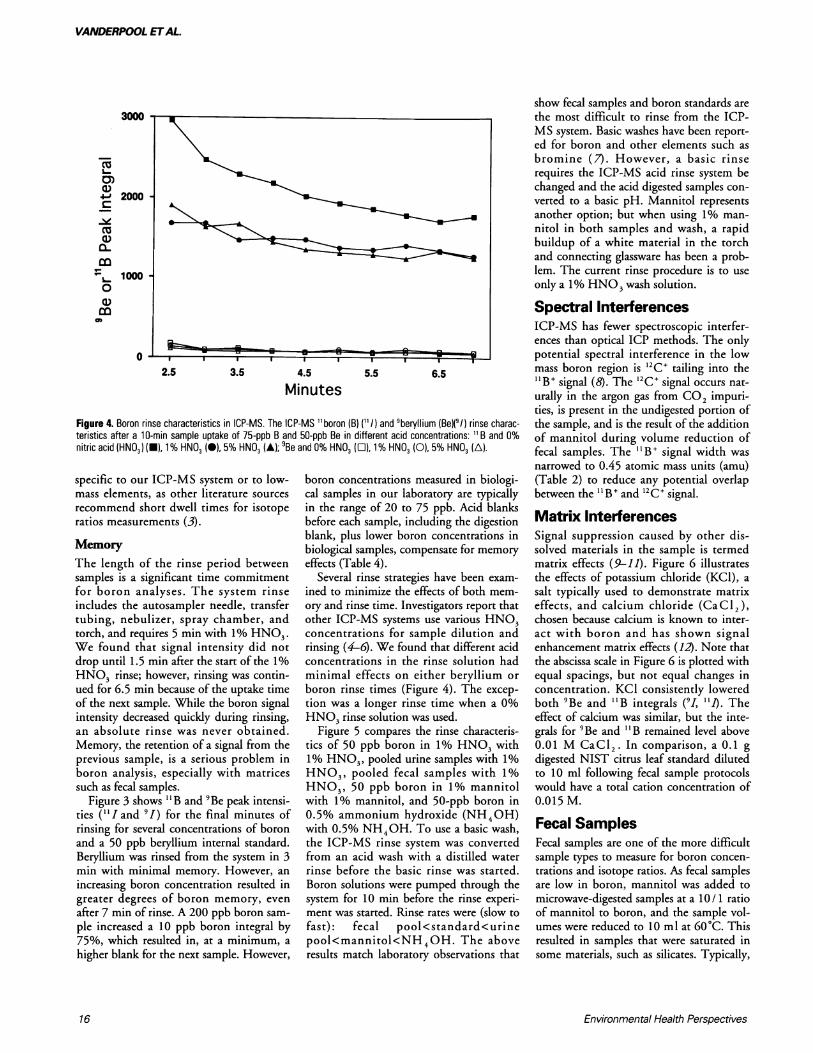
Figure 4. Boron rinse characteristics in ICP-MS. The ICP-MS "boron (B) ('I) and 'beryllium (Be)('I) rinse charac-teristics after a 10-min sample uptake of 75-ppb B and 50-ppb Be in different acid concentrations: " B and 0%nitric acid (HNO3) (-), 1% HNO3 (-), 5% HNO3 (A); 9Be and 0% HNO3 (O), 1% HN03 (0), 5% HN03 (A).
specific to our ICP-MS system or to low-mass elements, as other literature sourcesrecommend short dwell times for isotoperatios measurements (3).
MemoryThe length of the rinse period betweensamples is a significant time commitmentfor boron analyses. The system rinseincludes the autosampler needle, transfertubing, nebulizer, spray chamber, andtorch, and requires 5 min with 1% HNO3.We found that signal intensity did notdrop until 1.5 min after the start of the 1%HNO3 rinse; however, rinsing was contin-ued for 6.5 min because of the uptake timeof the next sample. While the boron signalintensity decreased quickly during rinsing,an absolute rinse was never obtained.Memory, the retention of a signal from theprevious sample, is a serious problem inboron analysis, especially with matricessuch as fecal samples.
Figure 3 shows "B and 'Be peak intensi-ties (" I and 'I) for the final minutes ofrinsing for several concentrations of boronand a 50 ppb beryllium internal standard.Beryllium was rinsed from the system in 3min with minimal memory. However, anincreasing boron concentration resulted ingreater degrees of boron memory, evenafter 7 min of rinse. A 200 ppb boron sam-ple increased a 10 ppb boron integral by75%, which resulted in, at a minimum, ahigher blank for the next sample. However,
boron concentrations measured in biologi-cal samples in our laboratory are typicallyin the range of 20 to 75 ppb. Acid blanksbefore each sample, including the digestionblank, plus lower boron concentrations inbiological samples, compensate for memoryeffects (Table 4).
Several rinse strategies have been exam-ined to minimize the effects of both mem-ory and rinse time. Investigators report thatother ICP-MS systems use various HNO3concentrations for sample dilution andrinsing (4-6). We found that different acidconcentrations in the rinse solution hadminimal effects on either beryllium orboron rinse times (Figure 4). The excep-tion was a longer rinse time when a 0%HNO3 rinse solution was used.
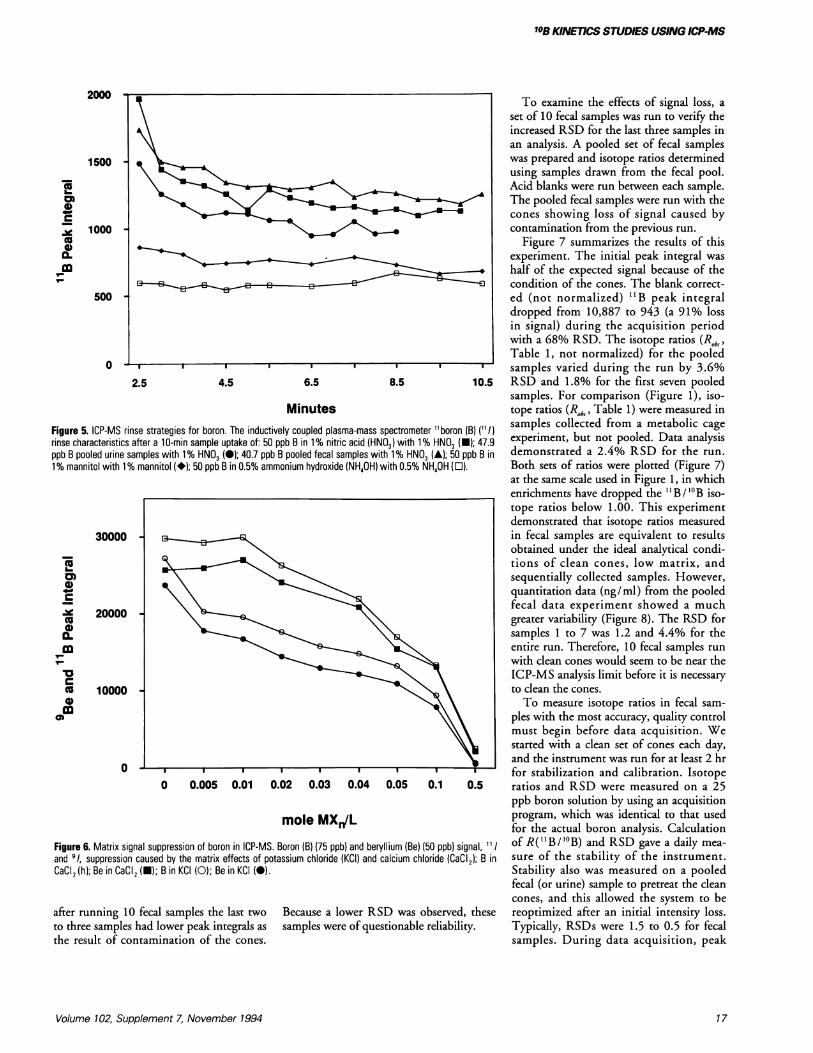
Figure 5 compares the rinse characteris-tics of 50 ppb boron in 1% HNO3 with1% HNO3, pooled urine samples with 1%HNO3, pooled fecal samples with 1%HNO3, 50 ppb boron in 1% mannitolwith 1% mannitol, and 50-ppb boron in0.5% ammonium hydroxide (NH40H)with 0.5% NH40H. To use a basic wash,the ICP-MS rinse system was convertedfrom an acid wash with a distilled waterrinse before the basic rinse was started.Boron solutions were pumped through thesystem for 10 min before the rinse experi-ment was started. Rinse rates were (slow tofast): fecal pool<standard<urinepool<mannitol<NH4OH. The aboveresults match laboratory observations that
show fecal samples and boron standards arethe most difficult to rinse from the ICP-MS system. Basic washes have been report-ed for boron and other elements such asbromine (7). However, a basic rinserequires the ICP-MS acid rinse system bechanged and the acid digested samples con-verted to a basic pH. Mannitol representsanother option; but when using 1% man-nitol in both samples and wash, a rapidbuildup of a white material in the torchand connecting glassware has been a prob-lem. The current rinse procedure is to useonly a 1% HNO3 wash solution.
Spectral InterferencesICP-MS has fewer spectroscopic interfer-ences than optical ICP methods. The onlypotential spectral interference in the lowmass boron region is '2C+ tailing into the"B+ signal (8). The '2C+ signal occurs nat-urally in the argon gas from CO2 impuri-ties, is present in the undigested portion ofthe sample, and is the result of the additionof mannitol during volume reduction offecal samples. The "B+ signal width wasnarrowed to 0.45 atomic mass units (amu)(Table 2) to reduce any potential overlapbetween the "B+ and '2C+ signal.
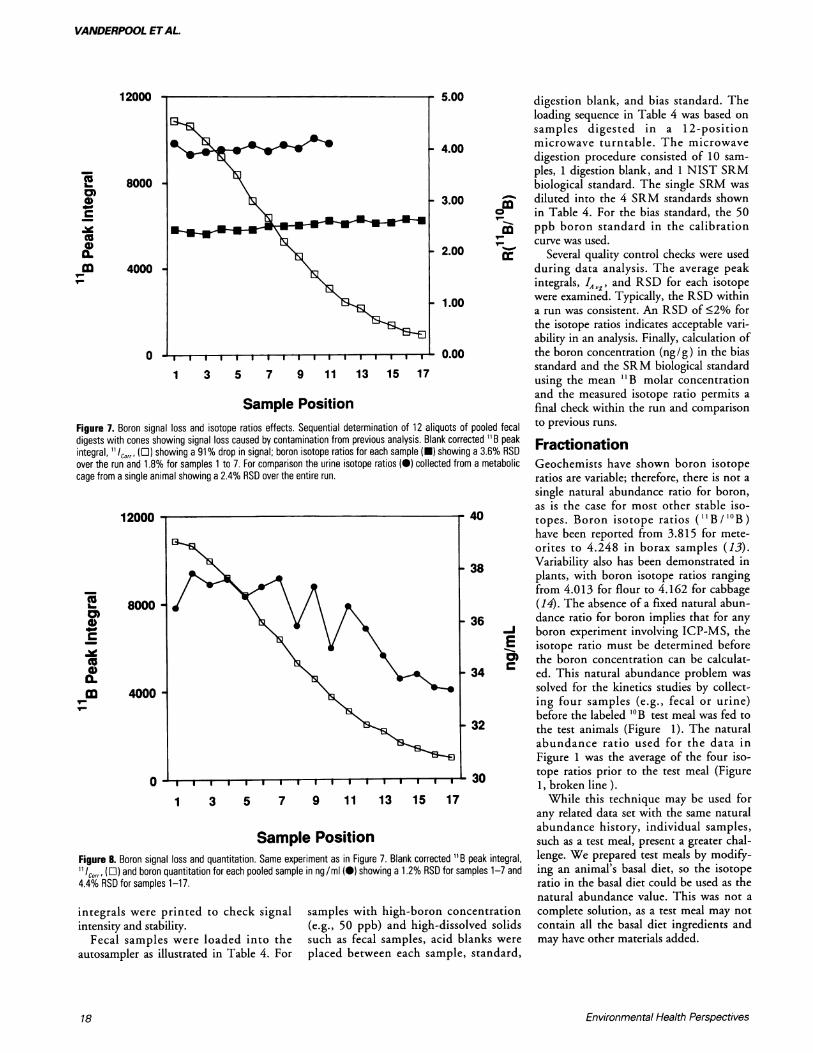
Matrix InterferencesSignal suppression caused by other dis-solved materials in the sample is termedmatrix effects (9-11). Figure 6 illustratesthe effects of potassium chloride (KCl), asalt typically used to demonstrate matrixeffects, and calcium chloride (CaC12),chosen because calcium is known to inter-act with boron and has shown signalenhancement matrix effects (12). Note thatthe abscissa scale in Figure 6 is plotted withequal spacings, but not equal changes inconcentration. KCI consistently loweredboth 9Be and "B integrals ('I, "1). Theeffect of calcium was similar, but the inte-grals for 9Be and "B remained level above0.01 M CaCl2. In comparison, a 0.1 gdigested NIST citrus leaf standard dilutedto 10 ml following fecal sample protocolswould have a total cation concentration of0.015 M.
Fecal SamplesFecal samples are one of the more difficultsample types to measure for boron concen-trations and isotope ratios. As fecal samplesare low in boron, mannitol was added tomicrowave-digested samples at a 10/ 1 ratioof mannitol to boron, and the sample vol-umes were reduced to 10 ml at 60°C. Thisresulted in samples that were saturated insome materials, such as silicates. Typically,
Environmental Health Perspectives16
10B KINETICS STUDIES USING ICP-MS
2000
1500
yW 1000co00.
soo-
00
2.5 4.5 6.5 8.5 10.5
MinutesFigure 5. ICP-MS rinse strategies for boron. The inductively coupled plasma-mass spectrometer "boron (B) (11/)rinse characteristics after a 10-min sample uptake of: 50 ppb B in 1% nitric acid (HNO3) with 1% HNO3 (-); 47.9ppb B pooled urine samples with 1% HN03 (@); 40.7 ppb B pooled fecal samples with 1% HN03 (A); 50 ppb B in1% mannitol with 1% mannitol (-); 50 ppb B in 0.5% ammonium hydroxide (NH40H) with 0.5% NH40H (Z).
30000
0)CL.: 20000 V
Cu
co 10000
0
0 0.005 0.01 0.02 0.03 0.04 0.05 0.1 0.5
mole MXW/L
Figure 6. Matrix signal suppression of boron in ICP-MS. Boron (B) (75 ppb) and beryllium (Be) (50 ppb) signal, I /and 9/, suppression caused by the matrix effects of potassium chloride (KCI) and calcium chloride (CaCI2); B inCaCI2 (h); Be in CaCI2 (-); B in KCI (0); Be in KCI (@).
after running 10 fecal samples the last twoto three samples had lower peak integrals asthe result of contamination of the cones.
Because a lower RSD was observed, thesesamples were of questionable reliability.
To examine the effects of signal loss, aset of 10 fecal samples was run to verify theincreased RSD for the last three samples inan analysis. A pooled set of fecal sampleswas prepared and isotope ratios determinedusing samples drawn from the fecal pool.Acid blanks were run between each sample.The pooled fecal samples were run with thecones showing loss of signal caused bycontamination from the previous run.
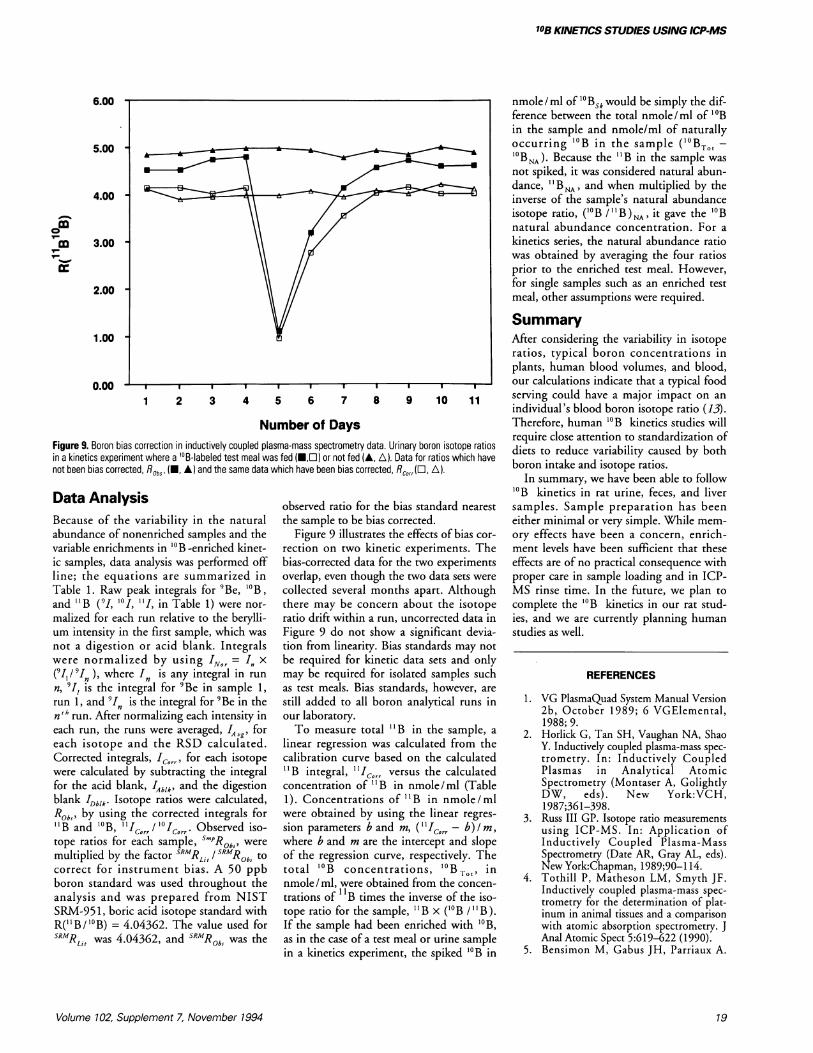
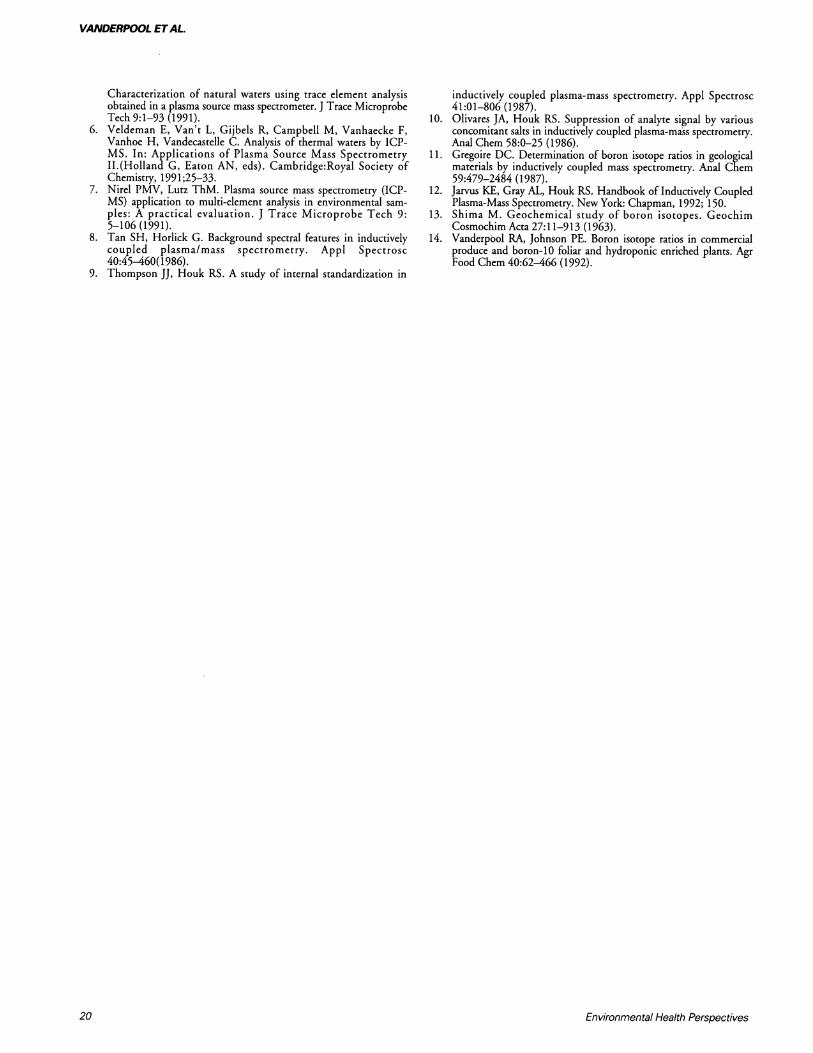
Figure 7 summarizes the results of thisexperiment. The initial peak integral washalf of the expected signal because of thecondition of the cones. The blank correct-ed (not normalized) 11B peak integraldropped from 10,887 to 943 (a 91% lossin signal) during the acquisition periodwith a 68% RSD. The isotope ratios (R,b,,Table 1, not normalized) for the pooledsamples varied during the run by 3.6%RSD and 1.8% for the first seven pooledsamples. For comparison (Figure 1), iso-tope ratios (Rb,,, Table 1) were measured insamples collected from a metabolic cageexperiment, but not pooled. Data analysisdemonstrated a 2.4% RSD for the run.Both sets of ratios were plotted (Figure 7)at the same scale used in Figure 1, in whichenrichments have dropped the B/ 10B iso-tope ratios below 1.00. This experimentdemonstrated that isotope ratios measuredin fecal samples are equivalent to resultsobtained under the ideal analytical condi-tions of clean cones, low matrix, andsequentially collected samples. However,quantitation data (ng/ml) from the pooledfecal data experiment showed a muchgreater variability (Figure 8). The RSD forsamples 1 to 7 was 1.2 and 4.4% for theentire run. Therefore, 10 fecal samples runwith clean cones would seem to be near theICP-MS analysis limit before it is necessaryto clean the cones.To measure isotope ratios in fecal sam-
ples with the most accuracy, quality controlmust begin before data acquisition. Westarted with a clean set of cones each day,and the instrument was run for at least 2 hrfor stabilization and calibration. Isotoperatios and RSD were measured on a 25ppb boron solution by using an acquisitionprogram, which was identical to that usedfor the actual boron analysis. Calculationof R(IB/'°B) and RSD gave a daily mea-sure of the stability of the instrument.Stability also was measured on a pooledfecal (or urine) sample to pretreat the cleancones, and this allowed the system to bereoptimized after an initial intensity loss.Typically, RSDs were 1.5 to 0.5 for fecalsamples. During data acquisition, peak
Volume 102, Supplement 7, November 1994 17
VANDERPOOL ETAL.
12000 - 5.00
- 4.00
X 8000 -
CD 400 -3.00
X~~~~ 2.0000 4000
- 1.00
O 0|l 0.00
1 3 5 7 9 11 13 15 17
Sample PositionFigure 7. Boron signal loss and isotope ratios effects. Sequential determination of 12 aliquots of pooled fecaldigests with cones showing signal loss caused by contamination from previous analysis. Blank corrected 11 B peakintegral, " ICorr, (°) showing a 91% drop in signal; boron isotope ratios for each sample (U) showing a 3.6% RSDover the run and 1.8% for samples i to 7. For comparison the urine isotope ratios (0) collected from a metaboliccage from a single animal showing a 2.4% RSD over the entire run.
12000 - 40
38
Dm 8000 l0 ~~~~~~~~~~~~~~36
E
0D 340.co 4000
I-l
32
0 I -T I I -. I I I I I I I* 1 30
1 3 5 7 9 11 13 15 17
Sample PositionFigure 8. Boron signal loss and quantitation. Same experiment as in Figure 7. Blank corrected 1B peak integral,'1 Corr, (l) and boron quantitation for each pooled sample in ng/ml (0) showing a 1.2% RSD for samples 1-7 and4.4% RSD for samples 1-17.
integrals were printed to check signalintensity and stability.
Fecal samples were loaded into theautosampler as illustrated in Table 4. For
samples with high-boron concentration(e.g., 50 ppb) and high-dissolved solidssuch as fecal samples, acid blanks wereplaced between each sample, standard,
digestion blank, and bias standard. Theloading sequence in Table 4 was based onsamples digested in a 12-positionmicrowave turntable. The microwavedigestion procedure consisted of 10 sam-ples, 1 digestion blank, and 1 NIST SRMbiological standard. The single SRM wasdiluted into the 4 SRM standards shownin Table 4. For the bias standard, the 50ppb boron standard in the calibrationcurve was used.
Several quality control checks were usedduring data analysis. The average peakintegrals, IA,V8 and RSD for each isotopewere examined. Typically, the RSD withina run was consistent. An RSD of <2% forthe isotope ratios indicates acceptable vari-ability in an analysis. Finally, calculation ofthe boron concentration (ng/g) in the biasstandard and the SRM biological standardusing the mean 1B molar concentrationand the measured isotope ratio permits afinal check within the run and comparisonto previous runs.
FractionationGeochemists have shown boron isotoperatios are variable; therefore, there is not asingle natural abundance ratio for boron,as is the case for most other stable iso-topes. Boron isotope ratios (11B1/0B)have been reported from 3.815 for mete-orites to 4.248 in borax samples (13).Variability also has been demonstrated inplants, with boron isotope ratios rangingfrom 4.013 for flour to 4.162 for cabbage(14). The absence of a fixed natural abun-dance ratio for boron implies that for anyboron experiment involving ICP-MS, theisotope ratio must be determined beforethe boron concentration can be calculat-ed. This natural abundance problem wassolved for the kinetics studies by collect-ing four samples (e.g., fecal or urine)before the labeled 10B test meal was fed tothe test animals (Figure 1). The naturalabundance ratio used for the data inFigure 1 was the average of the four iso-tope ratios prior to the test meal (Figure1, broken line ).While this technique may be used for
any related data set with the same naturalabundance history, individual samples,such as a test meal, present a greater chal-lenge. We prepared test meals by modify-ing an animal's basal diet, so the isotoperatio in the basal diet could be used as thenatural abundance value. This was not acomplete solution, as a test meal may notcontain all the basal diet ingredients andmay have other materials added.
Environmental Health Perspectives18
10B KINETICS STUDIES USING ICP-MS
6.00 -
5.00 -
4.00
'm 3.00 -
2.00 -
1.00 -
0.001 2 3 4 5 6 7 8 9 10 11
Number of DaysFigure 9. Boron bias correction in inductively coupled plasma-mass spectrometry data. Urinary boron isotope ratiosin a kinetics experiment where a 0IB-labeled test meal was fed (D,O) or not fed (A, A). Data for ratios which havenot been bias corrected, RoS, ( 0, A) and the same data which have been bias corrected, RcOJrr(, A).
Data AnalysisBecause of the variability in the naturalabundance of nonenriched samples and thevariable enrichments in "'B -enriched kinet-ic samples, data analysis was performed offline; the equations are summarized inTable 1. Raw peak integrals for 'Be, `'B,and "B ('I, "'I, "I, in Table 1) were nor-malized for each run relative to the berylli-um intensity in the first sample, which wasnot a digestion or acid blank. Integralswere normalized by using INo = In x('II1 In ), where In is any integral in run
n, 'I, is the integral for 'Be in sample 1,run 1, and 'In is the integral for 'Be in thenth run. After normalizing each intensity ineach run, the runs were averaged, IAVg, foreach isotope and the RSD calculated.Corrected integrals, ICo,,, for each isotopewere calculated by subtracting the integralfor the acid blank, I and the digestionblank IDblk- Isotope ratios were calculated,Robs, by using the corrected integrals for" B and "' B, I I ICorr I'0' Corr 'Observed iso-tope ratios for each sample, SmPRobsI weremultiplied by the factor sRMRL / sRMRobs tocorrect for instrument bias. A 50 ppbboron standard was used throughout theanalysis and was prepared from NISTSRM-95 1, boric acid isotope standard withR("1B/I"B) = 4.04362. The value used forSRMR Lit was 4.04362, and SRMR was the
observed ratio for the bias standard nearestthe sample to be bias corrected.
Figure 9 illustrates the effects of bias cor-rection on two kinetic experiments. Thebias-corrected data for the two experimentsoverlap, even though the two data sets werecollected several months apart. Althoughthere may be concern about the isotoperatio drift within a run, uncorrected data inFigure 9 do not show a significant devia-tion from linearity. Bias standards may notbe required for kinetic data sets and onlymay be required for isolated samples suchas test meals. Bias standards, however, arestill added to all boron analytical runs inour laboratory.To measure total "B in the sample, a
linear regression was calculated from thecalibration curve based on the calculated"B integral, 'COrr versus the calculatedconcentration of "B in nmole / ml (Table1). Concentrations of " B in nmole / mlwere obtained by using the linear regres-sion parameters b and m, ("'Corr - b) I m,where b and m are the intercept and slopeof the regression curve, respectively. Thetotal '0B concentrations, '°BTotI innmole /ml, were obtained from the concen-trations of 1 B times the inverse of the iso-tope ratio for the sample, "B x ('0B /"B).If the sample had been enriched with '°B,as in the case of a test meal or urine samplein a kinetics experiment, the spiked "'B in
nmole/ml of "BSk would be simply the dif-ference between the total nmole /ml of '°Bin the sample and nmole/ml of naturallyoccurring "'B in the sample ('°BTo, -"'BNA). Because the "B in the sample wasnot spiked, it was considered natural abun-dance, "BNA' and when multiplied by theinverse of the sample's natural abundanceisotope ratio, ("'B / " B) NA, it gave the "Bnatural abundance concentration. For akinetics series, the natural abundance ratiowas obtained by averaging the four ratiosprior to the enriched test meal. However,for single samples such as an enriched testmeal, other assumptions were required.
SummaryAfter considering the variability in isotoperatios, typical boron concentrations inplants, human blood volumes, and blood,our calculations indicate that a typical foodserving could have a major impact on anindividual's blood boron isotope ratio (13).Therefore, human "'B kinetics studies willrequire close attention to standardization ofdiets to reduce variability caused by bothboron intake and isotope ratios.
In summary, we have been able to follow"'B kinetics in rat urine, feces, and liversamples. Sample preparation has beeneither minimal or very simple. While mem-ory effects have been a concern, enrich-ment levels have been sufficient that theseeffects are of no practical consequence withproper care in sample loading and in ICP-MS rinse time. In the future, we plan tocomplete the "'B kinetics in our rat stud-ies, and we are currently planning humanstudies as well.
REFERENCES
1. VG PlasmaQuad System Manual Version2b, October 1989; 6 VGElemental,1988; 9.
2. Horlick G, Tan SH, Vaughan NA, ShaoY. Inductively coupled plasma-mass spec-trometry. In: Inductively CoupledPlasmas in Analytical AtomicSpectrometry (Montaser A, GolightlyDW, eds). New York:VCH,1987;361-398.
4. Tothill P, Matheson LM, Smyth JF.Inductively coupled plasma-mass spec-trometry for the determination of plat-inum in animal tissues and a comparisonwith atomic absorption spectrometry. JAnal Atomic Spect 5:619-622 (1990).
5. Bensimon M, Gabus JH, Parriaux A.
Volume 102, Supplement 7, November 1994 19
VANDERPOOL ETAL.
Characterization of natural waters using trace element analysisobtained in a plasma source mass spectrometer. J Trace MicroprobeTech 9:1-93 (1991).
6. Veldeman E, Van't L, Gijbels R, Campbell M, Vanhaecke F,Vanhoe H, Vandecastelle C. Analysis of thermal waters by ICP-MS. In: Applications of Plasma Source Mass SpectrometryII.(Holland G, Eaton AN, eds). Cambridge:Royal Society ofChemistry, 1991;25-33.
7. Nirel PMV, Lutz ThM. Plasma source mass spectrometry (ICP-MS) application to multi-element analysis in environmental sam-ples: A practical evaluation. J Trace Microprobe Tech 9:5-106 (1991).
8. Tan SH, Horlick G. Background spectral features in inductivelycoupled plasma/mass spectrometry. Appl Spectrosc40:45-460(1986).
9. Thompson JJ, Houk RS. A study of internal standardization in
10. Olivares JA, Houk RS. Suppression of analyte signal by variousconcomitant salts in inductively coupled plasma-mass spectrometry.Anal Chem 58:0-25 (1986).
11. Gregoire DC. Determination of boron isotope ratios in geologicalmaterials by inductively coupled mass spectrometry. Anal Chem59:479-2484 (1987).
12. Jarvus KE, Gray AL, Houk RS. Handbook of Inductively CoupledPlasma-Mass Spectrometry. New York: Chapman, 1992; 150.
13. Shima M. Geochemical study of boron isotopes. GeochimCosmochim Acta 27:11-913 (1963).
14. Vanderpool RA, Johnson PE. Boron isotope ratios in commercialproduce and boron-10 foliar and hydroponic enriched plants. AgrFood Chem 40:62-466 (1992).