1. R[NG ANALYSIS OF HIGH OXYGEN CONTENT SAMRES; A MODlFICAT[ON OF THE n-d-M METHOD I' Clarence Karr, Jr. and Joseph R. Cornberiati Low-Temperature Tar Laboratory, Bureau of Mines U. S. Department of the lnterior, Morgantown, W. Va. Ring analysis of hydrocarbon samples is a technique.of longstanding use. The n-d-M method o f VanNes and VanWesten is one of the time-tested procedures (6). Hazelwood has presented'a m3dification of this method for use with highly aromatic samples (3). However, no ri-ng analysis method has ever been reported for high oxygen content samples. Such materials are not infrequently encountered in various fields of rejearci-.. In work on low-temperature coal tars, various oxygen containing fractions are obtained, such as tar acids containing phenolic compounds, neutral oils containing aromatic ethers, and pitch resins, containing both phenolic hydroxyl and aromatic ether groups. This paper describes a modification of the n-d-M method t h a t makes it possible -fo obtain acceptable ring analyses of high oxygen content samples in which ihe oxygen is present in aromatic ether groups and/or,phenolic hydroxyl groups. This modificstion is based on the comparison of the refractive indices and den- si;ies of B very large number of oxygen compounds with the values for the struc- turally ana!r,gous hydrocarbons. The physical properties of over 1200 oxygen compooncs have been Sithered. Those for low-boiling phenols have been published (4); 2 similar list for aromatic ethers will appear shortly as a Bureau of Mines publica- 'fim. The values for the analogous hydrocarbons are available from current American P?irc!eum Institute lata sheets (f) and Egloff (2). The appiicatility of this modification is demonstrated with a variety of These samples consist of synthetic blends of pure sanples ji k.?own ring contents. aroca-ic oxygen compounds, the refractive indices and densities bei.ng determined ?xperime??al !y on ihe mixtures. DER [VATION OF EQUATIONS With an increasing proportion of alkyl groups the refractive index and dcns i ry of aroma? ic hydrocarbons and the i r oxygen ana I ogs gradua I I y change toward the values for the limiting paraffin or paraffin of infinite molecular weight, namely, flp 1.475 and d$ 0.851. (Both normal and branched alkyl groups through butyl were included in the present study, that is, a l l isomers for which data were evailab,la.) The r a t e of this change is approximately I inear with respect t o the reciprocal 07 the molecular weight, and may be expressed as follows: dy - 0.851 dd = dM IOOOIM -
Transcript
1.
R[NG ANALYSIS OF HIGH OXYGEN CONTENT SAMRES; A MODlFICAT[ON OF THE n-d-M METHOD
I '
Clarence Karr , Jr. and Joseph R . Cornberiat i
Low-Temperature Tar Laboratory , Bureau o f Mines U . S. Department of t he l n t e r i o r , Morgantown, W . Va.
R ing a n a l y s i s o f hydrocarbon samples i s a t e c h n i q u e . o f longstanding use. The n-d-M method o f VanNes and VanWesten i s one of t h e t ime- tes ted procedures ( 6 ) . Hazelwood has p resen ted 'a m 3 d i f i c a t i o n o f t h i s method f o r use w i t h h i g h l y a romat i c samples ( 3 ) .
However, no r i - n g a n a l y s i s method has eve r been r e p o r t e d for h igh oxygen c o n t e n t samples. Such m a t e r i a l s a r e n o t i n f r e q u e n t l y encountered i n va r ious f i e l d s o f rejearci-. . I n work on low-temperature coa l t a r s , v a r i o u s oxygen c o n t a i n i n g f r a c t i o n s a r e obtained, such as t a r a c i d s c o n t a i n i n g pheno l i c compounds, n e u t r a l o i l s c o n t a i n i n g aromat ic e thers, and p i t c h r e s i n s , c o n t a i n i n g both phenol ic hyd roxy l and aromat ic e t h e r groups.
This paper descr ibes a m o d i f i c a t i o n o f t h e n-d-M method t h a t makes it p o s s i b l e -fo o b t a i n acceptable r i n g analyses o f h i g h oxygen c o n t e n t samples i n which i h e oxygen i s p resen t i n a romat i c e t h e r groups a n d / o r , p h e n o l i c hydroxy l groups. T h i s m o d i f i c s t i o n i s based on t h e comparison of t h e r e f r a c t i v e i nd i ces and den- si;ies o f B v e r y l a r g e number o f oxygen compounds w i t h t h e va lues f o r t h e s t r u c - t u r a l l y ana!r,gous hydrocarbons. The phys i ca l p r o p e r t i e s of over 1200 oxygen compooncs have been S i the red . Those f o r l o w - b o i l i n g phenols have been pub l i shed (4); 2 s i m i l a r list f o r a romat i c e t h e r s w i l l appear s h o r t l y as a Bureau o f Mines p u b l i c a -
' f i m . The va lues f o r t h e analogous hydrocarbons a r e a v a i l a b l e f rom c u r r e n t American P?irc!eum I n s t i t u t e l a t a sheets ( f ) and E g l o f f ( 2 ) .
The a p p i i c a t i l i t y o f t h i s m o d i f i c a t i o n i s demonstrated w i t h a v a r i e t y of These samples c o n s i s t o f s y n t h e t i c blends o f pure sanples j i k.?own r i n g con ten ts .
a roca - i c oxygen compounds, t h e r e f r a c t i v e i n d i c e s and d e n s i t i e s bei.ng determined ?xperime??al ! y on i h e m i x t u r e s .
DER [VATION OF EQUATIONS
W i t h an i nc reas ing p r o p o r t i o n o f a l k y l groups t h e r e f r a c t i v e index and dcns i ry of aroma? i c hydrocarbons and t h e i r oxygen ana I ogs gradua I I y change toward the values f o r t h e l i m i t i n g p a r a f f i n or p a r a f f i n o f i n f i n i t e mo lecu la r weight, namely, flp 1.475 and d$ 0.851. (Both normal and branched a l k y l groups through b u t y l were i nc luded in t h e present study, t h a t i s , a l l isomers fo r which data were evai lab, la . ) The r a t e of t h i s change i s app rox ima te l y I inear w i t h r e s p e c t t o t h e r e c i p r o c a l 07 t h e mo lecu la r weight, and may be expressed as f o l l o w s :
d y - 0.851 dd = dM IOOOIM -
The average r e f r a c t i v e index o r d e n s i t y f o r t h e isomers o f a g i ven molecu la r weight, i f i n s e r t e d i n t h e approp r ia te equat ion a long w i t h t h e molecular weight, w i l l g i v e the r a t e o f change. weights the degree of l i n e a r i t y may be observed and t h e average r a t e s f o r a c l a s s o f oxygen compound (0), and i t s analogous hydrocarbon (HI, may be obtained. n o t a t i o n s f o r these a r e as fo l l ows :
With t h e r e f r a c t i v e index and d e n s i t y a t severa l molecular
The
(*T i [*)O
(41
The d i f f e r e n c e between t h e r e f r a c t i v e index or dens i t y of an oxygen com- pound m i x t u r e and i t s analogous hydrocarbon m i x t u r e a t a g i ven average molecu la r we igh t may be ob ta ined from t h e f o l l o w i n g equat ions :
c
The f go i ng as f o
(7)
These may be expressed w i t h t h e s imp le r n o t a t i o n of p r o p o r t i o n a l i t y con- s tan ts , i n t h e f o l l o w i n g manner:
[ - y - (*)j = kn
[(*)o - (dj = kd ( a )
The d i f f e rences shown i n Equat ions 5 and 6 would be less when cons ider ing m ix tu res c o n s i s t i n ? only i n p a r t o f oxygen compounds. [n t h i s ins tance the d i f - ference i s decreased by t he f a c t o r OM/1600, where 0 i s t he weight percent o f oxygen.
na l equat ions f o r de termin ing t h e change i n r e f r a c t i v e index o r d e n s i t y i n from an oxygen compound m i x t u r e t o the s t r u c t u r a l l y analogous hydrocarbons are I ows :
An: = k, 6 = k: 0 (9)
i? Ad? = k 0 = kd 0
d 1.6
OETERM [NAT ION OF FRO WORT I ONAL [lY CONSTANTS
( I O )
The r a t e s o f change o f r e f r a c t i v e index and d e n s i t y w i t h mo lecu la r weigh for I / d i f f e r e n t c lasses of oxygen compounds and the s t r u c t u r a l l y analogous hydro- carbons a re presented i n Table I . The average phys ica l p r o p e r t i e s o f t h e isomers a t va r ious molecu la r weights, from which the r a t e s were determined, a re a l s o g iven
I
Z ? ? (8 0 ' c o o N
- m m m I".?
r - U Y
I
I I
I N U Y I n * : -- I
2 i s ? ? ? 1 0 0 0 0 I I I - O N - 1 - r - r - r- 1 0 0 0 0
1 0 0 0 0 f ? ? ? 4
r m m n d, Z ? ? ? m e m N >
-000
I
I NIOO I n e 0 I --- I I I
l U \ * * e p I l n r - U Y r n I - - - - '0 f X m n M 1 m N M e m IWqn" :3ss:M3 1 9 9 9 9 9 f ? ? ? ? ? ! ? ? ? ? ? i ? ? ? ? : ? ? ? ? ? 1 0 0 0 0 0 1 0 0 0 0 0 IO 0 0 0 0 1 0 0 0 0 ~ 0 0 0 0 0 / - - - - I 1 1 : I
l o ~ n r n ~ f g g g n g l g
f 0 0 0 0 0 0 f ?????I? I
I
I
I - - -Ncu I I I
lrxt8si28
I I O N N N N I M o N d f c o C o _ m m j m jlijBls i ? ? ? ? ? f ? ? ? ? I O 0 0 0 0 1 0 0 0 0 !
m m m o c u C W d N a 0 0 0
I m e l n n r - ZNr -0 f ? t ? d . 7 I ? ? ? I m L n m * * I l n m l n I I
I I
I I
I
I - - - N N
I
I 0 e m U Y o I Nu30 i r - r n m a d I b m I I I
0,
m
I
f . m o * U Y 01 I r - m m m 00
I ? ? ? ? 9 f 0 0 0 0 0
I O 0 0 0 0
h U m 3 C
4.
I I I rQmr-rncn I m c n \ o \ o \ m I 0 0 0 0 0
I 0 0 0 0 0 I 99999 I
I
I
I I -- I
I ? ? ? ? jooo =T 0
I
. I ' . 2. 0 0 F a 2 0. 0. a cn i m o ,
a - - L 3 L
I 1
I
I
I O 0 I 22: g o o 0 A E???
vl??8 c m ( u 0 0 P r - F
I O 0 0 1
m > Lo
I I ? ? ? ? ? N R R r ; [ , I I ? ? ? ? ? X B W E y I ? ? ? ? I SG41B 1 0 0 0 0 0 1 0 0 0 0 0 1 0 0 0 0 I I I
A
I
I
I
The proportional ity constants kn and kd were determined from the dif- ferences In the rates, as indicated In Equations 7 and 8, and these are presented in Table 1 1 . density for each I percent increase in oxygen content of the sample as compared to the structurally analogous hydrocarbons.
The values of k: and k$ indicate the increase in refractive index and
EXPERIMENTAL
n slsted of pure oxygen compounds and thelitjmthetic blends. - A I I of the blends were IIquids, although In some instances individual components, like dlbenzofuran, were
A variety of samples of known ring contents were examined. rhese con-
4 sol Ids.
The physlcal properties were determined on these samples by semlmicro methods essentially the same as those described by Sullivan, Fries, McClenahan, and Wllllngharn (5).
The values of An? and Ad%o were determined from Equations 9 and 10, US ing the known oxygen contents and the average k: and k$ for e ither aromatic ethers or phenollc compounds. These values were subtracted from the experimental values of refractive index and density, respectively, in order to obtain the approximate physical properties of the structurally analogous aromatic hydrocarbons. The ring analysis method of Hazelwood (31 for highly aromatic hydrocarbon samples was then applied. sented in Table [ I [ . The ring analysis values found without taking the oxygen content into consideratio are glven in parentheses. The known ring contents are given for comparison.
The resulting values of np and dy are given in Table 111.
The resulting values for total rings, 3, and aromatic rings, RA, are pre-
The r ing conten values for both synthetic On the other hand, if it
D fSCUSS ION
s found by the modified method agree well with the known blends of oxygen compounds and individual constituents. s assumed that there is no oxygen presenl', ring contents
are found which are very much different from the known values.
The small discrepancies observed with the modified method are probably as much owing to the inherent limitations of the Hazelwood method (at least for pure compounds and their simple mixtures) as to the small errors inherent in the modifi- cation. In ail instances in which it is assumed that there is no oxygen present the values of H are much too large while the values of RA are much too smal l . With the modified m$Thod the values of RT are just 51 ightly too large while the values of RA are slightly too small.
In some instances it may be desired to obtain ring analyses on samples which contain both aromatic ethers and phenolic compounds in an undetermined Tatio. Since the effect of oxygen in either form is up to ten times greater for density than for refractive index the values of kz are of primary significance. A mixture with a small proportion of phenolic compounds would require a kz of about 0.008 * whereas a mixture with a large proportion of phenolic compounds would require a kd of about 0.010. The aromatic ether ki, 0.007, and the phenol IC compound k:, 0.01 I, give an average value of 0.009. 0.008 and 0.010 mentioned previously. Therefore, the average k;, 0.009, could be used for an unknown mixture of aromatic ethers and phenolic compounds.
This differs by only 0.001 from the values of
6 .
Table t ! .
Oxvoen Commund Class
Aromatic Ethers:
Monoal koxybenzenes
D i a I koxy ben zenes
Alkenoxybenzenes
Phenoxybenzenes
A I koxynaphthalenes
Di hydrobenzofurans
Chroma ns
Benzofurans
Benzopyrans
R e n o l ic Compounds:
Pheno I s
Catechols
R o p o r t i o n a I I t y Constants for Use In Equations 9 and IO
kn
0.0013
0.0034/2a
0.0013
0.6007
0;ooi l
0.001 I
0.0007
0.0007
0.001 I
k" n
0.0008
0.001 I
0.0008
0 .00w
0.0007
0.0007
0 .oow 0.0004
0.0007
kd
0.01 I
.O .026/ 2a
0.010
0.009 .
0.01 I
0.012
0.01 I
0.010
0.010
avg.. 0.0007
0.0037 0.0023
0.0075/2= 0.0023
avg. 0.0023
- k:
0.007
0.008
0.006
0.006
0.007
0.008
0.007
0.006
0.006 - avg. 0.007
0.017 0.01 I
O.O36/P 0.01 I
avg. 0.011 -
,/i
c
a Divided by 2 since there a r e oxygen atoms per molectile.
i
I
7 .
9 . cu
? cu
1 N
. ? c u '
c5
a'.'? .o- 0..
U
cc - r - . . -0
v
0
,? -0
U.
0 cu- oil;
U
c.
C u . T - c u
U
n
t? -cu 2
0
m * "! -
0 cu M m -
P m a, "! - t
m a, I
C m 0) > X 0
a
4
5 0) c I
VI 0
m cn
? ? ? r-! r- M r-l M M
"ll V i M M " r - M
? ? ? M r n M M M M
0 2
C
L 3 + 0
C a,
m
n E ? a , " , 0
I m
VI a,
m L t a, I x
m i L .- t u f I
f W I
W - - ' X E - - N N ' L L - > c c t c i - c a l m m u a , m o o a n n I LLTLJ
t 3 - 1 0 1
> o 0 0 5
c-- T S T
L u I M C
C c u L a 1 3 E - + 0 > o L I S N L t c V c u a ,
- m
- a n
- > L + E .- a -t. cu C -
VI
2 0 >
cu M m a, m
a. L r n n J R E c m
( I1 API Research P r o j e c t 44, "Selected Values o f R o p e r t i e s o f Hydrocarbons and Related Compounds," Carnegie I n s t i t u t e of Technology, Pit tsburgh, Fa.
Eg lo f f , G., "Physical Constants of Hydrocarbons," Reinhold, New York, 1957. (2)
(3) Hazelwood, R . N., Anal. Chern. 26, 1073 (1954).
(4) Karr, C., Jr., u. 2. &. Mines, Inform. C i r c . &. 7802. 15 pp. (1957). 7
(5) Su l l i van , L. J., Fr ies, R. J., McClenahan, W . S., Willingham, C. B., Anal. - Chern. 29. 1333 (1957).
(6) VanNes, K., VanWesten, H. A,, "Aspects o f the Cons t i t u t i on o f Mineral Oils," (
E lsevier, New York, 1951.
I
9 .
Shock Tube Testing
Ted A . Erikson
Armour Research Foundation of Illinois Institute of Technology Technology Center
Chicago 16, Illinois
'
L
INTRODUCTION
A shock consists of a high-pressure (driver) sect ionand a low -pressure {driven) section which a r e separated from each other by a rupture diaphragm. e ra tes a shock wave into the low-pressure medium. shock-heated and shock-compressed driven gas produced in this manner can be utilized to cause the initiation of condensed-phase , unstable (explosive) systems.
When the diaphragm is ruptured, the compression wave quickly gen- The t ransient zone of
This paper indicates the background and nature of such shock tube techniques and briefly summarizes the technique employed in pure environmental shock tes ts (PEST) at the Armour Research Foundation.
G E N E R A L BACKGROUND
The f i r s t application of a shock tube technique for assessing the explosivej
tes ts secsitivity of condensed-phase systems was reported by Gey andBennett in 1955. For mafiy yehrs the Foundation has employed this technique in qualitative4* of the explosive sensitivity of various unstable mater ia l s , and more recently in a quantitative study of the initiation of lead azide. reported the use of the shock tube for the initiation of severa l composite propellants. Currently the Foundation is extending these studies to liquid monopropellant s y s terns.
Other investigator^'*,^*^^ lo have
Briefly, the shock tube i s used a s a research tool for producing a transient
Under cer ta in conditions, zone of shock-heated acd shock-compressed driven gas which can be made to con- tact the surface of a condensed-phase, unstable system. a time delay can be measured from shock contact to the detection of a n explosive response or reaction runaway.
A shock tube i s operated by adjusting the driven g a s p ressure and slowly increasicg the dr iver (usually helium) g a s p ressure until the diaphragm ruptures . The compression wave rapidly generates a shock wave which propagates a t nearly con.stant velocity into the low-pressure medium. behind the incident and the reflected shock front can be calculated from the driver-to-driven gas pressure rat io a t the instant of diaphragm rupture and the initial state of the driven gas . The calculated properties can be experimentally confirmed with suitable instrumentation to measure shock p res su res , shock temperatures and t raverse velocities between two o r more fixed .stations.
State propert ies of the driven gas
The surface of a tes t sample may be exposed to a quiescent o r a flowing shocked gas envirocment wherein conductive and forced convective heating effects a r e respectively enhanced. flush-mounticg a test sample on the end plate of a shock tube. sample surface i s exposed to the twice shocked (incident and ref lected) driven gas environment, which remains essentially static until the rarefaction wave ar r ives f rom the dr iver section.
An ideal quiescent condition can be generated by In this location, the
A flowing condition is generated by mounting a test s a m p l e
10.
aerodynamically in the center o r along the periphery, of the shock tube. In such positions, the sample is exposed to the transient zone of shocked gaa environment which sweeps across the surface.
When the surface of a condensed-phase, unstable system is exposed to the quiescent o r flowing shocked g a s environment, the following experimental data a r e known o r can be calculated o r measured at time of contact:
C T g - temperature of the shock-heated driven gas
P T o - surface temperature of the condensed-phase system. .
A time delay to explosive response can be measured, during which interval
- composition of the dr iven gas
- pressure of the shock-compressed driven g a s g
it is practically impossible to monitor the infinitesimal variations in T gs P and T t (the surface temperature a t time t ) , o r the extent of decomposition near%e surface, Basically then, the experimental data that a r e measured or controlled in such shock testing techniques include: (1) a definition of the state of the shocked driven gas in te rms of s a y , composition, temperature , and pressure (2) the initial surface temperature of the tes t sample exposed to said environment and (3) a time interval (delay) from moment of contact to detection of explosive response.
Explosive response can be determined by various experimental techniques. For example, the time at which p res su re , e lectr ical conductivity, or luminosity transitions occur can be recorded respectiv*ely by pressure t ransducers , conductivity probes, and a photographic (or, photocell) record of flame luminosity. has employed the detection of the generated explosion."noise'! o r vibration upon the end plate mount as a simple technique for identifying a n explosive response. should also be mentioned that the res-ulting time delay should be within the relatively constant conditions of the f i r s t incident and/or reflected shock exposure, . so that the analytical complications that can be incurred because of subsequent shocks of diminished intensity can be avoided.
The Foundation
It
Based on a heat t ransfer analysis , T t c a n be estimated. The correlation of T t with the time delay, td, then se rves to indicate reaction mechanisms by per- mitting the identificatior of runaway temperatures , activation energies , and other initiating phenom'ena. Whether the ignition mechanism involves a runaway reaction in the condensed-phase, a s developed by Hicks, l1 or the establishment of a gaseous reaction zone adjaceat to the surface, as suggested by McAlevy, 5 &. , 9 appears to be in doubt. adequately estimated by a heat t ransfer analysis. Severe complications can a r i se due to surface i r regular i t ies in the case of solids (unless single crystal faces a r e employed), and to vapor p re s su re and vaporization-phenomena in the case of liquids.
The difficulty in these approaches is the assumption that Tt can be '
Recently, a a m b e r of thermodynamic models have been proposed" for various steady-rate processes . thermodynamics to relate the flow of mass , volume and heat to the properties (chemical potential, p ressure and temperature) of t e r m i m l par t s of a system which a re linked b y a gradient region o r part-on-the-line. this procedure is in order f o r the problem of explosion initiation, o r sensitivity,
'because of the likelihood that definable stationary states exist across the gradient regions of steady -rate f lames.
These models utilize the arguments of ordinary
A simplified application of
One objective of studies conducted a t the Foundation is based on the premise that the order of explosive response (i. e . , sustaining decomposition, deflagration and detonation) for an unstable system is characterized by a unique energetic situation. Thus, contact of an energy-r ich zone (e. g. , the flame zone or an
1
11.
artif icial environment) with a potentially energy-r ich zone ( e . g . , a layer of relatively undisturbed explosive) can result in a character is t ic time delay for a subsequent ra te of propagation. f rom an artif icial environment to the surface of an unstable medium, i t should be possible to evaluate specific energetic susceptibilities of unstable systems.
By varying the magnitude, ra te , and mode of energy release
For example, in the pure environmental shock tes t , relative measures of the magnitude, ra te and mode of energy release from the shocked driven gas environment to the surface of a condensed-phase system might be ascertained from the shock intensity, the pressure , and the composition of the driven gas (varying degrees of freedom), respectively.
EXPERIMENTAL
A schematic diagram of the shock tube used for a study of $he initiation of lead azide at the Armour Research Foundation i s shown in F i g . 1, indicates a detailed time -distance sequence of events. The sample was positioned on the back plate of the shock tube a s shown in F i g . 2 , which indicates the composite a r r a y of equipment, instrumentation and electr ical circuitry.
which also
Transient shock pressures were recorded by photographing the output of a Kistler P Z -6 miniature pressure transducer and PT -6 amplifier -calibrator unit on a Tektronix 535 oscilloscope. effected internally by the reception of the shock pressure output from the Kistler gage, and both the pressure and the V L voltage of the conductivity circuit (see F ig . 2 ) were simultaneously displayed at the 100-kc chopping rate of a Tektronix 53 /54-c dual preamplifier.
Triggering of the Tektronix 535 oscilloscope w a s
Triggering of the Tektronix 545 oscilloscope sweep was effected by l e s s than a 0 . 1 -volt r i s e in V1 (of the conductivity c i rcui t ) , and both the negative voltage output of the Kistler gage and Vl were displayed a t the 100-kc chopping rate of a CA dual preamplifier unit. of the extiemely fast conductivity transient.
This was done a s a means of obtaining magnified records
The criterion of explosion response w a s the character is t ic "ring" of the Kistler gage output when explosion noise was generated a t the sample site and transmitted through the end plate and w a l l of the shock tube to the gage position. The response t ine was calibrated by spark initiation of lead azide samples.
The results of typical tests a r e shown in F i g . 3. Photographs of oscilloscope t races with and without azide samples a r e included to enable the identification of the respective t races . "ring"), and conductivity voltage transients a r e recorded. The data for these tests a r e summarlzed in Table 1. Since the driver-to-driven gas pressure ratio (P4/Pl) was accurately measured, this value was used to define the Mach number of the incident shock, M,, from a report by Alpher and White. l 3 F r o m M,, the values of the reflected shock pressure and temperature , P and Tg (the former usually being confirmed by the oscilloscope record) , were obtained by the use of tables. l 4 Tes ts have been conducted with nitrogen, helium, argon and carbon dioxide as driven gases over Mach numbers ranging from about 2 to 7 .
It can be seen that the shock p res su re , a time delay (due to
g
~ ~~~
8 Final Reports on Contract No. DA-11-022-501-ORD-2731, June, 1959, and Contract No. DA-11-022-ORD-3120, June, 1960. Supported by the Picatinny Arsenal ,
12.
Table 1
DATA FROM PURE ENVIRONMENTAL SHOCK TESTS WITH LEAD AZIDE AND NITROGEN DRIVEN GAS
DISCUSSION OF RESULTS
The data from our pure environmental shock testing of polycrystalline lead azide can be simply represented-by plotting the logarithm of the product of the square of the reflected shock p res su re and the t ime delay, log (P function of the reciprocal of the reflected shock temperature , 1 / f g . F igure 4 displays such a plot for shock t e s t data obtained with nitrogen as a driven gas. Additional data with other dr iven gases a r e presented in this form in F i g . 5. Attempts were made to evaluate the data by a heat t ransfer analysis based on published d a t a l 5 and independent calculations a t the Foundation. surface temperature was est imated to vary f rom 10 to 50°C. such analyses i s that a flat planar surface must be assumed, which is experimentally inadequate unless single c r y s t a l faces a r e exposed to the shock environment.
The vaporization of fuel and a- subsequent gas phase runaway reaction
td), as a
The increase in The difficulty with
mechanism9 appears to explain the resul ts obtained in solid propellant tests: how- ever the possibility of such a mechanism being operative i n the decomposition of lead azide seems remote. shock tube resul ts is inappropriate at this time. must be delayed until sufficient data a r e available for the development of composite views.
F u r t h e r conjecture regarding the interpretation of A more sophisticated analysis
1.
2.
3.
4.
5.
6.
RE F E RE NCE S
Bleakney, W . , Weimer, D. K., and Fletcher , C. H., "The Shock Tube - A Facili ty f o r Investigations in Fluid Dynamics, I ' R e v . Sci. Instr . 5, 807 (1949).
Res le r , E . , Lin, S . , and Kantrowitz, A . , "The Production of High Temperature Gases in Shock Tubes ," J. Appl. Phys. 23, 1390 (1952).
Gey, W . E . , and Bennett , A . , "Sensitivity of Explosives to Pure Shocks," J. Chem. Phys. - 23, 1979 (1955).
Erikson, T. A., "Pure Shock Testing," Paper presented at the Second Explosive Sensitivity Conference, Silver Spring, Maryland, September , 1957.
Erikson, T. A . , "Pure Environmental Shock Testing of Condensed-Phase, Unstable Mater ia ls ," ARS Journal 30, 190 (1960).
Erikson, T . A. , "Pure Environmental Shock Testing of Condensed Phases , I' ONR Symposium Report , ACR-52, Vol. 1 , pp. 24-41, September 26-28, 1960.
-
T , "K P , p i a td, p s e c Tes t No. PI, psia P 4 / P ~ - M S - 115 0.467 .500 5. 09 3100 97 .5 103 116 0.460 517 5. 1 1 3200 100 119 0.767 3 0 1 4.69 2700 13 4 69 120 0.770 304 4. 69 2700 13 5 - 13 1 1 . 5 5 150 4. 18 2220 20 6 24 13 2 1.545 156 4. 19 223 0 20 6 -
7.
8.
9.
10.
11.
12.
13.
14.
15.
Summerfield, M., and McAlevy, R . , *Shock Tube as a Tool for Solid Propellant Resea rch , t t Je t Prop. 28, 478 (1958).
Bae r , A. O . , Ryan, N. W., a n d s a l t , D. L., "Propellant Ignitionby High Convective Heat F luxes , I t Paper presented a t ARS Solid Propellant Conference, Pr inceton, N. J . , January 28-29, 1960.
McAlevy, R. F. , Cowan, P. L., and Summerfield, M. , "Mechanism of Ignition of Composite Solid Propellants , I t Paper presented a t ARS Solid Propellant Conference. Princeton, N. J., January 28-29, 1960.
Solid Propellant Rocket Research, Vol. 1 , October, 1960, Academic P r e s s , New York, edited by Martin Summerfield, Princeton University.
Hicks, B. L., IITheory of Ignition Considered as a Thermal Reaction," J. Chem. Phys. 22, 414 (1954).
Tykodi, R . J . , and Erikson, T . A . , "Thermodynamics, Stationary States and Steady-Rate P rocesses (ser ies of six papers ) , " J. Chem. Phys. 31, 1506-1525 (1959): - 33, 40-49 (1960).
Alpher, R. A . , and White, D. R . , "Ideal Theory of Shock Tubes with Area Change Near Diaphragm, 1957, Schenectady, New York.
Strehlow, R. , '!One Dimensional Step Shock Calculations for Ideal Gases , Ballistic Research Laboratory Report No. 978, April. 1956, Aberdeen Proving Ground, Maryland.
Rose, P., "Development of a Calor imeter Heat Transfer Gage for Use in Shock Tubes, Avco Research Laboratory Report No. 17, February , 1958.
General Elec t r ic Report No. 57 -RL-1664, January,
A Time, t
h a e c of Reilacrod Shock C ~ d i t h ~
Incidnnt Shock
D i s a e
Diaphragm Position
Fig. 1 Shock Tube Profile and Schematic of Time-Distance Events
I
I
i
4
Fig. 2 Composite Details of Shock Test Set-Up
TestNo.
116 ; {blank)
11 5 -56A
120 (blank)
11 9 -58A
132 (blank)
1 3 1 -65A
Tektronix 535 Tektronix 545 Sweep Speed. Sweep Speed, I
sec lcm sec lcm I
2
20 2
LO I
10 1
i
Fig. 3 Photographs of Pressure-Voltage Transients in Shock Tube Testing
1
7 . 0
7 .4
7 . 0
u U
- 6. 6 - N
+ m a is 2- 6.2 1
N
a* - m 5 . 8 d
5 . 4
5 . 0
Fig. 4 Log (Pr,’td) an a Function of l /Trs for Shock Test Data Obtained with Unpressed Lead Azide and Nitrogen
- (
- I
-
-
Driven Cas Lead Azide
Pressed D Helium Pressed B Argon
Slope = 3110 A Carbon Dioxide Pressed Nitrogen Pre s sed
E’ = 14.3 kcallmole 0 Nitrogen Unp re LI sed
Points enclosed in dashed circle are believed more reliable. Vertical dashed lines indicate greater than.
Fig. 5 Log (PrsZtd) as a Fkction of l /TrS for Shock Test
have 1-
SHOCK TWB STUDIES OF IGNITION CEAU~EUISTICS QF SOMe LIQUID B Y D B O ~ O H S
Ear l W. Malmberg Research and Development Division, Sun O i l Company
Marcus Hook, Pennsylvania
The high temperatures and high exothermicity of combustion reactions in general made t h e experimental study of these reactions especially d i f f i cu l t . arise i n the manifold p rac t i ca l applications of combustion, the lack of funda-
mental information on the processes which a re involved leave only empirical methods with which t o a r r ive a t a solution. tube make it especially useful in overcoming the experimental d i f f i c u l t i e s i n combus- t i on studies. has been taken of t h i s device.
When prob-
Some of the unique charac te r i s t ics of the shock
A number of investigations have already been made i n which advantage
For the spark-ignition engine, knock,surface ign i t ion , and rumble a r e some speci- f i c problems which would p r o f i t from appropriate fundamental studies. t ics of the shock tube which make it useful for these applications a re the freedom from surface e f f ec t s and the instantaneous heating t o a selected high temperature which i a possible. of hydrocarbon-oxygen mixtures w a s begun.
The earlier work in t h i s area by Gay and others is l i s t e d by Stefnberg and Kaskan’); t h i s paper, and t h e discussion there to , very well delineates the p i t f a l l s and necessary precautions f o r t he study of ignit ions in the shock tube. sa t i s fac tory r e su l t s with ign i t i on by the re f lec ted shock wave and the importance of surface d iscaa t inu i t ies in causing anomalous behavior a re described. re f lec ted shock wave has been used t o investigate ignit ion of a spray of Diesel fuel2). A study of the high-temperature ign i t ion charac te r i s t ics of d i f fe ren t fuels vaa made by Mullins3) i n a system i n which was designed t o approximate combustion conditions in a j e t engine. The differences between a number of l iquid fue ls i n re- action with oxygen in a shock tube a t intermediate temperatures has been studied by Halmberg and Wellman. In the present investigation, various charac te r i s t ics of the ign i t ion of several l iqu id hydrocarbons with oxygen were studied in the reflected shock wave.
Two characteris-
Because of these advantages, a shock tube study of t he ignit ion
The more
Ignition i n a
Some e a r l i e r experiments had shown t ha t t he response of a piezoelectric pressure pickup is noticeably d i f fe ren t to an explosion as compared t o an i n i t i a l and reflec- ted shock wave. with, i n general, the detecting elements located in t h e endplate of the reaction section.
The apparatus was constructed to u t i l i z e the reflected shock wave,
The shock tube was made from one-inch Schedule 40 s t a in l e s s s t e e l pipe, with necessary connections f o r evacuation, f i l l i n g , and instrumentation. 88 a dr iver gas. 4 1 a r f i lm, ranging in thickaeas from 0.0035 t o 0.030 inch was used for t h e diaphragms. peak pressures observed in explosions correspauiedwith the peak pressure calculated by assuming instantaneous l i be ra t ion of t he energy. a four-foot dr iver sec t ion and a three-foot reaction sec t ion was used. With the pressures used in &-experiments, the time available f o r reaction at the far end of
Helium w a s used
The tube was designed with a f ac to r of safety of ten; the
For wst of these experiments,
19. the reaction section (before a r r i v a l of the rarefact ion or a re-ref lect ion from the contact front) was always greater than the longest i gn i t i on delays measured.
A miniature S U quartz piezoelectr ic pressure pickup and a quartz vindov were munted in the endplate; the window, which led t o a 1P28 photomultiplier tube looked down the shock tube tovatd the high pressure section. With the photomulti- p l i e r b u s i n g r igidly attached t o the shock tube, anomalous def lect ions can be ob- tained a t the t i m a of breaking of the diaphragm and somewhat less pronounced at the
The first deflection is presumably shock transmitted through the metal of the tube. This behavior amy be the explanation of the "lfght" observed by Steinberg and Kaskan in initial shock vaves in vfiich there was no ignit ion.
of reflection. Shock-proof mounting of the tube solved t h i s problem.
The output from the pressure pickup w a s sent i n to a Kistler Piezo cal ibrator and thence t o one input of a Tektronix 531 oscilloscope v i t h a Type CA dual-trace plug-in unit . A single sveep of the oscilloscope was tr iggered from the breaking of the diaphragm.
The explosive mixtures were made by the method used by Steinberg and Kaskan'),
The method was modified so that mixtures could b e made from liquid hydro- flow of oxygen and the f u e l vapor each through a cri t ical velocity o r i f i c e flow- meter. carbons. the reservoir were held in a constant-temperature oven a t 125'. =re mixed, the hydrocarbon w a e below i t s vapor pressure at room temperature so t h a t it could be led into the evacuated shock tube.
The o r i f i c e s , a reservoir for hydrocarbon vapor, and a pressure gauge on After the gases
The temperaturewhich are used i n the discussion of r e s u l t s are read from a cume made fo r each hydrocarbon; the temperature was calculated from the diaphragm pressure r a t i o by the usual shock wave relat ions. The spec i f i c heat r a t i o f o r the components was assumed constant, and the values of temperature may be as much as 20 percent high. The necessary data, i n general, are not avai lable f o r more accur- ate calculations for these hydrocarbons. values a re the point of i n t e r e s t , and there should be no important deviation i n tha t respect.
However, f o r our purposes, the r e l a t ive
The measurement of length of time before igni t ion, the "ignition delay", was The lower made on the two simultaneous traces.
t r ace is of the pressure transducer; the small i n i t i a l rise is the a r r iva l - r e f l ec t ion of the shock. cal led a %etonation wave". firms the occurence of the explosion. Variations i n t h i s trace w i l l be discussed l a t e r .
An example is shown i n Figure la. The Recond sharp high rise is the explosion, sometimes
The upper t r ace , recorded by the photomultiplier, con-
RESULTS
The measurement of delay t ime vas characterized by a r e l a t ive ly l a rge sca t t e r Two examples a r e shown, Figures 2 and 3, of points, s imilar t o e a r l i e r r e su l t s l ) .
isooctane and benzene respectively. The large number of points a r e available fo r benzene because a number of auxi l iary s tudies were made with t h a t hydrocarbon. photomultiplier t r ace shown i n Figure l A is f o r a high temperature; i.e., a short delay. The small or non-existent "overshoota1 of i n i t i a l eds s$on of l i g h t is charac- terisdcafthe high temperature. As the temperature is lowered, the amount of overshoot is much greater preceding the leveling off which seems t o character ize the explosion- (Figure 1B). Hence, f o r benzene, a n-er of points are shown i n which flame vas observed alumst exclusively (Figure lC) , plus a n u d e r with a l a rge amount of flame, p l w s ~ m e exp4osion. The consistent behavior i n a large number of experiments, including the useful data from the pressure transducer, t he r e s u l t s of experi- ments v i t h a second pressure transducer in t h e s i d e w a l l six inches from the end, and experiments with a qu i t e slow writ ing speed, al l confirm these interpretations. %e high luminosity of the f l ane coqa red t o the explosion is quite s t r fk ing
The
20. when the relative rates of the reactions are compared. that the time required for the explosion to reach the pressure transducer six inches from the end is roughly one-tenth the time required for the reflected shock to arrive.
Rough measurements indicate
Whether explosion or flame was observed, the lowest temperature at vhich reac- tion would occur was quite characteristic of a given hydrocarbon. a limited number of fuels are given in Table I. high-temperature ignition is remarkably parallel to the tendency to produce rumble; hence, the LIB number for each fuel is given in the table as well (Isooctane, high resistance to rumble, LIB number equals 100; benzene, zero).
The results for The behavior of these fuels in
TABLE I
MINIMUM TmERATURE OF IGNITION FOR STOICHIOPIETBIC MIXTURES OF VARIOUS FUELS WITH OXYGEN
Fuel - Pentane Isooc t ane Toluene Benzene
Benzene-isooctane 1:l Toluene-isooctane
Minimum Temperature* of Innition. OK LIB Number *
1350 1340 1220 1155
1250 1250
m 100 50 0
50
Benzene-water 1:l 1350
* ++ LIB nuinbars are determined with lead necessarily present. The benzene iso-
* Not meas-~rable because of its octane number; probably about 100.
Conditions under which ignition occurred in about half the attempts.
octane 1:l mixture is LIB * 50 by definition of the scale.
A number of experimeqts were performed to determine the effect of volatile additives on the minimum temperature of ignition of benzene-oxygen mixtures. The number of experiments in each case is not large enough for an accurate determina- tion of the 50 percent point, but the following preliminary observations were made. Conventional motor mix with tetraethyl lead has a relatively mall effect on the minimum temperature of ignition. The temperature was raised appreciably with tertiarybutyl acetate present in 0.5 percent amount. Tetramethyl lead in a motor mix quite definitely increased the minimum temperature of ignition.
DISCUSSION
The ignition delay and the minimum temperature of ignition are measures of re- actions between hydrocarbons and oxygen which lead to a condition that engenders rapid combustion by flame or explosion. The values of the ignition delay are not particularly useful experimental results because of the large amount of scatter, although there is appreciably less scatter for the aromatics. from benzene-oxygen experiments was used for calculation of rate constants. such as shown in Figure 2, the rate constants will necessarily have a range of values. Bowever, good agreement was obtained among the rate constants which were calculated when the rate expression included only fuel concentration to the first power as compared to the values when the product of the fuel and oxygen concentra- tions each to the first power was used. This result is not surprising vhen it is considered that the reaction under study is an initiation and the mixture is stoichiometric; i.e., 7.5 moles of oxygen per mole of hydrocarbon. Figures 2, 3 and 4, are presented as Arrhenius plots for convenience and for conr parison to results of others.
Part of the data Prom data
The data in
An activation energy calculated from the slope of
I i
21. the best 181Fne10 is based on the assumption t h a t t h i s i n i t i a t i o n react ion leads t o a c r i t i c a l concentration of some act ive species , and t h i s concentration i s the same at a l l temperatures. Values from 10 t o 40 kcal/mole are obtained; c lear ly , the assump- t ion i s not generally va l id i n these cases. The values of t he temperatures a re e r ro r t o a cer ta in extent , as already discussed. Elowever, i n some ea r l i e r work i n which the temperature was obtained by a more accurate method, the beginning of the reversal of the r e l a t ive ease of oxidation of aromatic, as compared to paraff in hydrocarbons, was observed a t 900-950’K. The approximate calculated temperatures i n the present work f i t t h i s general pat tern within the possible error. ’Ln addi- t ion , these resu l t s i n the “crossing o v e P region are i n agreement with the findings of the present investigation.
4 fn
The minFmurn t e q e r a t u r e of igni t ion is shown on Figures 2, 3, and 4, because it demonstrates more concretely the r ea l i t y and va l id i ty of t h i s number. a fev isolated cases of explosion below the l imi t ; however, these were found i n a large number of experiments i n which no react ion occurred. I n addi t ion, when ig- n i t ion did occur below t h i s borderline area, i t usually was marked by some qui te d i f fe ren t character is t ics .
There are
Aa t h e representative t races in Figure 1 indicate , the explosion i n general seem8 t o develop from a flame, except at high temperatures the preliminary spike is a l m s t l o s t . These combustion reactions a re necessar i ly homogeneous. The known facts of surface igni t ion and LIB requirements may be examined from t h i s viewpoint. The correlat ion of the minimum temperature of igni t ion with the LZB number suggests that the character is t ic tendency of aromatic fuels t o produce rumble m y resu l t from a greater ease of the undesired premature ign i t ion from an area of deposit which is act ive i n surface ignition. This igni t ion need r e su l t only from a loca l heating. If t h i s interpretat ion is val id , t h e complexity of the problem of surface igni t ion may be considerably reduced in that the fue l need not necessar i ly enter d i rec t ly into the reactions in the deposit. Rather, the in te rac t ion of .the deposit and oxygen is paramount. This view is consistent with r e su l t s from the measurements of t e m - perature of igni t ion of engine deposits i n an atmosphere of oxygen; a low tempera- ture of igni t ion is correlated with a high L I B requirement f o r the engine i n the test in which the deposit w a s formed.5) i n these experiments. A fue l is not present
The experiments with one mole of water present with benzene i n the stoichio- metric mixture with oxygen confirms the importance of the hormgeneous reaction in rumble. In an engine, the addition of t h i s amount of water t o the benzene fuel eliminates the rumble. In the shock igni t ion experiments, correspondingly, the presence of water increased the minimum temperature of ign i t ion for benzene t o the value for isooctane. Even a t very high temperatures, the presence of water caused many of the igni t ions t o be largely flame rather than explosion.
The experiments with additives were not as def in i t ive as would be desired, largely because a r e l i ab le determination requires a r e l a t ive ly high number of individual determinations. Also, a diaphragm-breaking apparatus , now being b u i l t , vi11 allow more f l e x i b i l i t y i n the control of the diaphragm-breaking pressure. This method i n general o f f e r s considerable promise as a means of studying in uvre d e t a i l the conditions leading t o explosion. I f , f o r example, i n the borderline region differences can be detected spectroscopically o r by some other method be- twen mixtures tha t explode rather than burn wi th a flame, very useful information would be forthcoming.
geceral, other aspects of the invest igat ion are similar t o r e su l t s already Almost a l l of the experiments were run with 100 mm pressure i n the re- described.
act ion section. Small changes in reaction pressure and small changes from stoichi- ometric composition had only small e f fec ts . pressure pickup had rather sharp corrugations. The surface discont inui t ies a t t h i s point & small i r r egu la r i t i e s around the vindow were very sa t i s f ac to r i ly elimina- ted by smothing on Apiezon Sealing Compound Q. A number of experiments yere per- formed d t h pentane and air ra ther than oxygen. The delay times were, in general,
The exposed surface of the miniature
i
22. a b i t longer, as d g h t be expected, but othervise these limited experiments rhoved ILO important differences.
A C K N W U E N T S
The author vishes to acknowledge helpful suggestions and discussions with RelFminary experiments vere performed by Ifr. Robert Zeto; Dr, Jantes L. Lauer.
Ur, Robert Ledley, 111, assis ted in a large anmtmt of the experimental work. The permission of the Sun O i l Company t o publish t h i s work is gratefully acknowledged.
I
1)
2) G. J. khrllaney, lad. Eng. &em. 53 (1958).
BL Steinberg and W. E. gaekan, Fif th Symposium. 4 i
3) B. P. Mullins, puel, 363 (1953).
4)
5)
W. E. Wellman, Ph.D. Diseertation, The Ohio State University, 1960.
J. L. Syspoeium,. Pasadena, California, August, 1960.
Lauer, Paper presented before the Eighth International Combustion
I
Pho tomul t ip l i e r : i n t e n s i t y l e v e l c h a r a c t e r i s t i c of exp los ion
P res su re Transducer
A r r i v a l and r e f l e c t i o n o f shock wave
A . High temperature: s h o r t d e l a y time, exp los ion
L I
B. Intermediate temperature: flame appears i n i t i a l l y
C . Low temperature: mostly flame, weak exp los ion
Fig. 1. Representat ive osc i l l o scope t r a c e s f rom which de lay time and o the r experimental v a r i a b l e s were determined. Wri t ing speed, 2 0 0 P s e c ./cm; t r a c e 10 cm i n l eng th . changed i n these experiments.
V e r t i c a l a m p l i f i c a t i o n un-
1 I I I I I I
cauaafoj. :
0
0 V*OtZT
0
0
0 . \D -9
I I I 1 I I f 0
0
0 (u
I I I I 1 I I I
0
0
0
0
0
0 0
0 0 0
- 0
0
0
- I I I I I 1 I
0 0 0 0 0 0 o m \o =t
0
9
0 9
Q) E d SS m Q Q 0
m ‘0
g 200 0 0, m 0 Ll u d E . 2 l-l 0, 100 -0
c 0 .-I 80 U d c M H
0 0
0
0
-
-
-
0 ‘?F
0
I 0 0 0
0 d d 8
# @
0 0
Q 0 8 80 8
0 0
Q 0 0
0 0 .
#
0
4
In Ln
. O
2 aJ N c
Fig. 3 . Ignition of benzene-oxygen; logarithm of Ignition delay versus the reciprocal of the abso lu te temperature. 0 Explosion; 9 flame and explosion; >J( mostly flame.
I 26.
A SHOCK TUBE TECHNIQUE FOR STUDYING THE KINETICS OF HIGHLY EXOTHERMIC REACTIONS---SHOCK INITIATED DETONATIONS.
Roger A . Strehlow* A e r o n a u t i c a l Engineer ing Department
Univers i t y of I1 l i n o i s Urbana, I l l i n o i s
and
Ar thu r Cohen B a l l i s t i c s Research L a b o r a t o r i e s
Aberdeen Proving Ground, Maryland
INTRODUCTION
The i n c i d e n t shock t echn iques which are so w e l l adapted t o t h e s t u d y o f endothermic r e a c t i o n s ( l ) , a r e i n g e n e r a l , not a p p l i c a b l e t o t h e s tudy of h i g h l y exothermic r e a c t i o n s . Th i s is because a 4 exothermic r e a c t i o n o c c u r r i n g i n a s m a l l r e g i o n of a f lowing g a s causes a n i n c r e a s e of t h e l o c a l p r e s s u r e and i n t h e case of shock wave h e a t i n g t h i s p r e s s u r e i n c r e a s e o c c u r s beh ind and close t o t h e shock f r o n t . S i n c e t h i s r e g i o n is subson ic t h e p r e s s u r e i n c r e a s e w i l l propagate as a wave t o t h e f r o n t and i n c r e a s e t h e v e l o c i t y of t h e f r o n t , t he reby i n c r e a s i n g t h e tempera ture of t h e next element of g a s hea ted by shock compression. T h i s process is s e l f a c c e l - e r a t i n g and i n g e n e r a l a s t e a d y s ta te wave w i l l not be ob ta ined u n t i l t h e wave is t r a v e l i n g a t or above t h e Chapman-Jouget detona- t i o n v e l o c i t y f o r t h e mix tu re . S i n c e i n a l l r e a c t i o n k i n e t i c s work one must f o l l o w t h e h i s t o r y of a f i x e d element of g a s , in- c i d e n t techniques w i l l on ly work i f t h e wave is t r u l y s t e a d y s t a t e i n t i m e . The re fo re h i g h l y exothermic s y s t e m s may be s t u d i e d by i n c i d e n t techniques o n l y i n t h e l i m i t as s t e a d y d e t o n a t i o n waves.
I n t h e endothermic case t h e r e a c t i o n l o c a l l y lowers t h e p r e s s u r e behind t h e shock wave the reby s l i g h t l y lowering shock v e l o c i t y . A s t e a d y shock wave fo l lowed by a r e a c t i o ave can t h e r e f o r e be g e n e r a t e d and s t u d i e d . t h a t s t e a d y waves can also be g e n e r a t e d and s t u d i e d i n weakly ex- o the rmic mix tu res .
S c h o t t and Kinseyq2Y have demonstrated
A d i f f e r e n t s i t u a t i o n exists f o r t h e r e g i o n behind a r e f l e c t e d shock . Here t h e g a s is e s s e n t i a l l y q u i e s c e n t a t t h e back w a l l and f i x e d s t a t i o n o b s e r v a t i o n s shou ld y i e l d meaningful r e s u l t s . Furthermore t h e r e f l e c t e d shock p rov ides n i c e l y c o n t r o l l a b l e i n i - t i a l c o n d i t i o n s f o r obse rv ing t h e d e t a i l s of t h e a c c e l e r a t i n g p r o c e s s .
*On l e a v e from t h e B a l l i s t i c s Research L a b o r a t o r i e s as a Ford Foundat ion V i s i t i n g P r o f e s s o r .
t
R e c e n t l y , w e observed t h a t a h i g h l y exothermic r e a c t i o n o c c u r r i n g behind t h e r e f l e c t e d shock c a n q u i t e r e p r o d u c i b l y g e n e r a t e one dimensional a c c e l e r a t i n g waves t h a t a r e e i $ h e r : 1) "detonat ion" waves which e v e n t u a l l y o v e r t a k e and i n t e r a c t w i t h t h e r e f l e c t e d shock wave, or, 2) p r e s s u r e waves which c a u s e a s i m p l e accelera- t i o n of t h e r e f l e c t e d shock . (3 ) s i o n s concerning d e s i g n l i m i t a t i o n s f o r t h e r e f l e c t e d shock t echn ique , some of o u r f u r t h e r o b s e r v a t i o n s of the a c c e l e r a t i o n phenomena i n t h e hydrogen-oxygen system, and our o b s e r v a t i o n s of a d i a b a t i c e x p l o s i o n d e l a y s i n hydrogen-oxygen m i x t u r e s .
T h i s paper d e s c r i b e s o u r conclu-
DESIGN LIMITATIONS
The s t e p r e f l e c t e d shock produced a t t h e end of a conven t iona l shock t u b e is, w i t h i n c e r t a i n l i m i t a t i o n s , w e l l s u i t e d f o r t h e s t u d y of h i g h l y exothermic r e a c t i o n s . These l i m i t a t i o n s are:
1.
2 .
3.
4 .
5,
R e f l e c t e d shock h e a t i n g is c l e a n ( i . e . t r u l y one d imens iona l ) on ly i f t h e h e a t c a p a c i t y r a t i o of t h e g a s mix tu re is g r e a t e r t h a n 1 . 4 ove r t h e t empera tu re r ange used i n t h e expe r imen t . (4 )
Only r e a c t i o n s which occur r a p i d l y a t h i g h t e m - p e r a t u r e s may b e s t u d i e d . Only a t t h e h i g h e r t empera tu res is t h e r e f l e c t e d shock t e m p e r a t u r e s u f f i c i e n t l y above t h e shock t e m p e r a t u r e t o a l l o w r a p i d r e a c t i o n i n t h i s r e g i o n w i t h o ear l ier r e a c t i o n behind t h e i n c i d e n t s h 0 c k . 4 ~ ) r e a c t i o n is d e f i n e d h e r e as one i n which t h e e v e n t s of i n t e r e s t occu r i n t h e t i m e r a n g e 10 t o 1000 microseconds.
A r a p i d
The e x p l o s i v e m i x t u r e must be s e p a r a t e d from t h e diaphragm by a n i n e r t g a s mix tu re of s i m i l a r prop- e r t ies ( b u f f e r g a s ) and t h e i n t e r f a c e between t h e two g a s e s must not g e n e r a t e r e f l e c t e d shocks when t h e i n c i d e n t shock t r a v e r s e s t h e boundary. Once a g a i n local r e f l e c t e d shocks i n t h e x l o s i v e mix- t u r e c o u l d t r i g g e r e a r l y d e t o n a t i o n . 757
Small c r a c k s and c r e v i c e s i n t h e t u b e w a l l must be e n t i r e l y a b s e n t . These produce local r e f l e c t e d shock waves which c o u l d t r i g g e r e a r l y d e t o n a t i o n . (6)
I n g e n e r a l t h e r e f l e c t e d shock is no t as i d e a l as t h e i n c i d e n t shock wave.(4,7) best c u r r e n t estimate is t h a t t h e r e f l e c t e d shock g a s t empera tu re is approx ima te ly 30° t o 50° below theoretical i n t h e r a n g e 1500°K< Trs< 300O0K.
EXPER I MENTAL
I n pu re a rgon t h e
A f o u r inch i . d . s t a i n l e s s s tee l shock t u b e w i t h a 50 i n c h compression s e c t i o n , a n 88 i n c h b u f f e r s e c t i o n and a 164 inch t e s t s e c t i o n w a s used i n t h e s e expe r imen t s . The b u f f e r s e c t i o n was s e p a r a t e d from t h e t es t s e c t i o n by a f o u r i n c h s t a i n l e s s s tee l b a l l v a l v e ( a s i x and one h a l f i n c h s p h e r e w i t h a f o u r
\
28.
i nch h o l e bored through i t ) which a l lowed und i s tu rbed passage of t h e shock when i n t h e open p o s i t i o n . When c l o s e d t h e va lve was vacuum t i g h t and a l lowed u s t o p l a c e a n i n e r t g a s , of t h e same d e n s i t y as the e x p l o s i v e g a s , i n t h e s e c t i o n nea r t h e diaphragm and i n t h e bore of t h e v a l v e . P r e s s u r e d i f f e r e n t i a l a c r o s s t h e v a l v e w a s a d j u s t e d t o z e r o e x t e r n a l l y and t h e v a l v e was opened abou t 10-20 seconds b e f o r e f i r i n g t h e tube . T h i s e f f e c t i v e l y prevented any premature d e t o n a t i o n s i n i t i a t e d by, non- idea l d i - aphragm burst . A l s o , t h e t e s t s e c t i o n w a s c o n s t r u c t e d t o e l i m - i n a t e a l l i n t e r n a l c r e v i c e s a t t h e j o i n t s and window mountings i n o r d e r t o e l i m i n a t e premature d e t o n a t i o n s caused by l o c a l r e f l e c t e d shocks. S t r i p photographs (x - t ) of r e f l e c t e d shock behav io r were t a k e n w i t h a n . e i g h t i n c h s c h l i e r e n sys tem through 8" X 0.025" s l i t windows a t t h e back w a l l . Other exper imenta l de t a i l s are g iven i n a p rev ious paper . (4)
One d imens iona l s t e a d y s t a t e shock wave and d e t o n a t i o n c a l c u l a - t i o n s w e r e performed on t h e B a l l i s t i c Research L a b o r a t o r i e s ' h igh speed computer, t h e EDVAC. Thermodynamic data f o r t h e g a s e s w a s t aken from r e c e n t Bureau of S tanda rds t a b l e s . Shock c a l c u l a - t i o n s were performed w i t h t h e assumpt ion of no r e a c t i o n or d i s so - c i a t i o n but r a p i d v i b r a t i o n a l r e l a x a t i o n i n t h e shock. Detona- t i o n c a l c u l a t i o n s were performed by assuming complete thermodynam- ic e q u i l i b r i u m i n t h e wave. The C-J v e l o c i t y w a s c a l c u l a t e d u s i n g t h e f rozen e q u i l i b r i u m v e l o c i t y of sound.
RESULTS
S c h l i e r e n s t r i p f i l m ( x - t ) photographs of t h e r e f l e c t e d shock r e g i o n w e r e t aken i n s t o i c h i o m e t r i c hydrogen-oxygen mix tu res d i l u t e d w i t h 7%, 85% and 94% a rgon . ( 9 2 @ O K (T < 1820°K) r e a c t i o n was e v i d e n t behind t h e r e f l e c t e d shock. A f T our photographs i n d i c a t e d t h a t t h e i n i t i a l r e a c t i o n was t y p i c a l of a homogeneous a d i a b a t i c e x p l o s i o n wi th a f i n i t e d e l a y . D e l a y s ranged f r o m 12 to 880 microseconds. I n a d d i t i o n w e observed t h a t t h e wave n a t u r e of t h e h e a t i n g cycle produced a r e a c t i o n wave which t r a v e l e d away from t h e back w a l l a t or above t h e r e f l e c t e d shock v e l o c i t y .
Two t y p e s of a c c e l e r a t i n g wave behavior were observed i n hydrogen- oxygen-argon m i x t u r e s . F i g u r e 1 i l l u s t r a t e s t h e case where t h e r e a c t i o n g e n e r a t e s a weak p r e s s u r e wave which t r a v e l s t o t h e r e f l e c t e d shock caus ing i t t o accelerate t o a new s t e a d y v e l o c i t y . During t h i s process t h e r e a c t i o n zone a l s o accelerates and even- t u a l l y r eaches a new p o s i t i o n c l o s e r t o t h e r e f l e c t e d shock wave . F i g u r e 2 is t y p i c a l of t h e o t h e r t ype of behavior observed . Here t h e p r e s s u r e wave s t e e p e n s i n t o a shock wave b e f o r e i t r eaches t h e r e f l e c t e d shock. T h i s r e a c t i o n shock is fo l lowed by a narrow d a r k zone ( i . e . no g r a d i e n t s ) and t h e n a s t r o n g r a r e f a c t i o n wave ( g r a d i e n t s o p p o s i t e t o t h a t i n t h e s h o c k ) . T h i s wave p a t t e r n a c c e l e r a t e s and grows more compact as it t r a v e l s away from t h e back w a l l of t h e t u b e and f i n a l l y i n t e r a c t s w i t h t h e r e f l e c t e d shock , producing a new h i g h s t r e n g t h shock (now c l o s e l y fo l lowed by t h e r a r e f a c t i o n z o n e ) . The i n t e r a c t i o n wi th t h e r e f l e c t e d shock a l s o produces a c o n t a c t d i s c o n t i n u i t y which is t r a v e l i n g away from the back w a l l i n i t i a l l y bu t qu ick ly decelerates t o z e r o
I n t h e r ange 2.14 <Ms<2.8
'r
I ,
t
v e l o c i t y and a sometimes observed weak r a r e f a c t i o n wave which t r a v e l s toward t h e back w a l l of t h e shock tube a t a c o n s t a n t v e l o c i t y . The s h o c k - r a r e f a c t i o n p a t t e r n which w e observe , both b e f o r e and a f t e r i n t e r a c t i o n w i t h t h e r e f l e c t e d shock wave , s u g g e s t s a d e t o n a t i o n wave. The s t e a d y v e l o c i t y of t h i s wave i n t h e i n c i d e n t g a s a g r e e s w e l l w i t h C-J c a l c u l a t i o n s . However, wave v e l o c i t i e s measured ahead o f t h e i n t e r a c t i o n show t h a t t h e s e a c c e l e r a t i n g waves are t r a v e l i n g a t approximate ly one ha l f t h e C-J v e l o c i t y f o r t h i s r e g i o n . I t is i n t e r e s t i n g t h a t t h i s non- s t e a d y wave has never e x h i b i t e d any of t h e c h a r a c t e r i s t i c s of s p i n n i n g d e t o n a t i o n . Occas iona l ly w e have observed s l i g h t l y non- one-dimensional behavior at t h e s t a r t of wave fo rma t ion bu t i n e v e r y case t h e s e n o n - i d e a l i t i e s were r a p i d l y damped and t h e wave q u i c k l y became a s t r i c t l y one d imens iona l wave pe rpend icu la r t o t h e w a l l of t h e f o u r inch shock tube .
I n a l l cases where r e a c t i o n was observed behind t h e r e f l ec t e_d shock wave t h e de l ay t o a d i a b a t i c e x p l o s i o n a t t h e back w a l l was measured by e x t r a p o l a t i n g t h e wave motions t o t h e back w a l l . These d e l a y s are compared t o S c h o t t and Kinsey ' s (2 ) r e c e n t d a t a i n F i g u r e 3. T h e i r d a t a l i n e r e p r e s e n t s t h e d e i a y t o t h e f i r s t appearance of OH r a d i c a l s i n a b s o r p t i o n w h i l e o u r s r e p r e s e n t s t h e d e l a y t o t h e a c t u a l a d i a b a t i c e x p l o s i o n . D r . S c h o t t h a s i n d i c a t e d i n a p r i v a t e communication t h a t t h e i r d e l a y s t o maximum OH con- c e n t r a t i o n were about one and one-half t i m e s l o n g e r t h a n t h e i r appearance de lays . Our d e l a y s are, on t h e ave rage , 1 . 2 t o 2.0 t i m e s l onge r t h a n S c h o t t and Kinsey ' s d e l a y s . T h i s i n d i c a t e s t h a t a t t h e back $a l l w e are indeed obse rv ing a n exothermic r e a c t i o n under w e l l c o n t r o l l a b l e and c a l c u l a b l e c o n d i t i o n s f r e e from t h e compl i ca t ions of t h e a c c e l e r a t i o n p rocess .
THE MECHANISM OF DETONATION INITIATION
I n t h e "de tona t ion" c a s e d e s c r i b e d above it is obvious t h a t w e a r e d e a l i n g w i t h a ve ry s p e c i a l and i n t e r e s t i n g case of detona- t i o n i n i t i e t i o n . I t is a n i n t e r e s t i n g case because i t is so n i c e l y one d imens iona l and r e p r o d u c i b l e . I t is s p e c i a l because t h e wave t h a t is g e n e r a t e d behind t h e r e f l e c t e d shock has a l l t h e g r o s s c h a r a c t e r i s t i c s of a d e t o n a t i o n b u t t r a v e l s a t approx- imate ly h a l f t h e c a l c u l a t e d C-J v e l o c i t y .
The q u a l i t a t i v e behav io r of t h i s wave sys t em may be d e s c r i b e d i f w e f i rs t make some assumpt ions concern ing t h e r e a c t i o n and then men ta l ly remove them one a t a t i m e . L e t u s assume t h a t : 1) t h e r e a c t i o n starts a f t e r a f i n i t e de l ay t i m e T w h i c h is c o n s t a n t f o r eve ry element of gas, 2) t h e r e a c t i o n ra te is i n f i n i t e ( i . e . t ( t , no r e a c t i o n ; t )r , complete e q u i l i b r i u m ) , 3) no h e a t e v o l u t i o n or molecular weight change o c c u r s du r ing t h e r e a c t i o n . With t h e above assumpt ions t h e r e a c t i o n would appea r as a r e a c t i o n wave t r a v e l i n g a t t h e same v e l o c i t y as t h e r e f l e c t e d shock . 4 t h e d o t t e d l i n e (RW) r e p r e s e n t s . t h i s S i t u a t i o n . I f w e remove c o n d i t i o n t h r e e and alyow t h e r e a c t i o n t o l i b e r a t e a q u a n t i t y of h e a t , t h e r e a c t i o n wave w i l l s e p a r a t e r e g i o n s o f low and h igh tempera ture . t h a t f o r t h i s s i m p l e s i t u a t i o n you w i l l obse rve a c e n t e r e d wave p a t t e r n c o n s i s t i n g of a shock wave ( r e a c t i o n shock) fo l lowed by
I n m u r e
The c o n t i n u i t y e q u a t i o n s of g a s dynamics p r e d i c t
t h e r e a c t i o n wave (RW). These waves s e p a r a t e s t e a d y s ta te reg ions and t h e shock s t r e n g t h is determined by t h e exo the rmic i ty of t h e r e a c t i o n and t h e added c o n d i t i o n t h a t t h e p a r t i c l e v e l o c i t y be e q u a l t o z e r o a t t h e back w a l l . The shock which is produced is i d e n t i c a l t o t h a t o b t a i n e d w i t h a p i s t o n motion drawn as t h e equiv- a l e n t p i s t o n p a t h i n F i g u r e 4 . The l i g h t l i n e s r e p r e s e n t a par- t i c l e p a t h through t h e i d e a l i z e d c e n t e r e d wave p a t t e r n .
Removing assumpt ion number two and a l lowing f i n i t e r e a c t i o n rates w i l l c ause t h e shock wave t o appear some d i s t a n c e from t h e back w a l l . T h i s is e q u i v a l e n t t o a slow a c c e l e r a t i o n of t h e p i s t o n i n s t e a d of t h e impu l s ive motion i l l u s t r a t e d i n F i g u r e 4 , and it c a u s e s t h e wave t o . a c c e l e r a t e nea r t h e r e g i o n of wave format ion . T h i s a c c e l e r a t i o n w i l l l e a d t o a t e r m i n a l shock v e l o c i t y which can be c a l c u l a t e d from t h e e q u i l i b r i u m p r o p e r t i e s of t h e g a s and t h e r e f l e c t e d shock s t r e n g t h . Removal of assumpt ion number two t h e r e f o r e a l lows one t o p r e d i c t t h a t a n approximate ly c e n t e r e d c o n s t a n t v e l o c i t y expanding wave p a t t e r n w i l l appear some d i s t a n c e f rom t h e back w a l l . A close look a t t h i s wave p a t t e r n shows t h a t assumpt ion number one ( c o n s t a n t r ) becomes less and less v a l i d as t h e p a t t e r n expands. Heat ing by t h e r e a c t i o n shock soon causes a n a p p r e c i a b l e d e c r e a s e i n t h e de lay and t h e wave sys tem becomes s e l f a c c e l e r a t i n g . One a d d i t i o n a l f e a t u r e , t h e observed r a r e f a c - t i o n wave, is undoubtably produced because t h e g a s l eav ing t h e a c c e l e r a t e d r e a c t i o n wave has a n e t v e l o c i t y away from t h e back w a l l and must t h e r e f o r e be d e c e l e r a t e d t o z e r o v e l o c i t y .
30
i
I \
1
I
,t , I I
The i n t e r s e c t i o n of t h e a c c e l e r a t i n g wave p a t t e r n and t h e r e f l e c t - e d shock produces t h e i n t e r a c t i o n desc r ibed i n t h e r e s u l t s sec- t i o n . T h i s behavior is a d e q u a t e l y p r e d i c t e d by one dimensional g a s dynamics. A momentum ba lance on t h i s i n t e r a c t i o n shows t h a t t h e forward t r a v e l i n g r e s u l t a n t shock w i l l be moving f a s t e r t h a n t h e c a l c u l a t e d C J v e l o c i t y f o r t h i s r e g i o n . One would t h e r e f o r e expec t t h e r e s u l t a n t wave t o d e c e l e r a t e t o t h e v e l o c i t y of a h igh order d e t o n a t i o n . T h i s is what is observed expe r imen ta l ly .
SUMMARY AND CONCLUSIONS
R e a c t i o n mechanisms may be s t u d i e d u s i n g a r e f l e c t e d shock t ech - n ique even f o r t h e case of h i g h l y exothermic r e a c t i o n s . F ixed s t a t i o n o b s e r v a t i o n s nea r t h e back w a l l w i l l a l l ow t h e s tudy of chemica l s p e c i e s f o r t h e case of homogeneous a d i a b a t i c exp los ions . Fur thermore , i f t h e r a n g e of r e a c t i o n time and t h e geometry of t h e s y s t e m is c a r e f u l l y chosen one shou ld be a b l e t o s tudy t h e r e a c t i o n wi thout t h e bothersome i n f l u e n c e of w a l l e f f e c t s . The t i m e h i s t o r y of t h e e x p l o s i o n w i l l b e s l i g h t l y d i f f e r e n t t h a n i n a c l o s e d v e s s e l : f i r s t because t h e r e a c t i o n w i l l i n g e n e r a l be t r u l y homogeneous , and second , because t h e g a s dynamics a l lows t h e volume of t h e " v e s s e l " t o i n c r e a s e dur ing r e a c t i o n . The a p p l i c a t i o n of t h i s t e c h n i q u e should a l low t h e d i r e c t s t u d y of t h e d e t a i l s of many exo the rmic r e a c t i o n s i n t h e tempera ture range of c u r r e n t i n t e r e s t (1 .e . f lame t e m p e r a t u r e s ) .
The a c c e l e r a t i n g waves observed du r ing our i n v e s t i g a t i o n a r e even more i n t e r e s t i n g . We o b s e r v e a wave p a t t e r n r emin i scen t of a
\
A
i
d e t o n a t i o n under c o n d i t i o n s where t h e " r e a c t i o n wave'' is passed th rough a combust ib le mixture a t a n a r b i t r a r y v e l o c i t y determined by t h e r e f l e c t e d shock v e l o c i t y . (This a r b i t r a r y v e l o c i t y is much h i g h e r t han t h e normal flame p ropaga t ion v e l o c i t y fo r t h e s e mix- t u r e s . ) q u a l i t a t i v e l y u s i n g one dimensional g a s dynamics w i t h h e a t addi - t i o n . An exact t r e a t m e n t of t h e have development w i l l r e q u i r e , t h e u s e of t h e method of c h a r a c t e r i s t i c s and a knowledge of t h e rate of h e a t release i n t h e r e a c t i o n zone and t h e e f f e c t of shock hea t - i n g on t h e de l ay t i m e
From t h e b r i e f a n a l y s i s g iven above i t is e v i d e n t t h a t t h e s e n i c e l y one d imens iona l a c c e l e r a t i n g waves are fluncoupled'' or "weakly coupled" when f i r s t produced. That is, t h e r e a c t i o n wave is phys c l l y w e l l removed from t h e shock wave. H i r s c h f e l d e r and C u r t i s s t8f have r e c e n t l y d i s c u s s e d t h e "coupl ing" of t h e shock wave and r e a c t i o n zone in s t e a d y d e t o n a t i o n waves. A d e t a i l e d s t u d y of t h i s i n i t i a t i o n p rocess f o r a v a r i e t y of exothermic r e a c t i o n s shou ld y i e l d a g r e a t d e a l of i n fo rma t ion on t h e s t r u c - t u r e of s t a b l e d e t o n a t i o n waves for s p e c i f i c e x p l o s i v e mix tu res .
The g e n e r a l f e a t u r e s of t h i s wave p a t t e r n c a n be exp la ined
1.
2.
3.
4.
5.
6 .
7 .
8.
REFERENCES
H . P r i t c h a r d , Q u a r t e r l y Reviews, J&, 46-61, 1960; A . Hertzberg , Appl. Mech. Rev., 9 , 505 , (1960) ; T . C a r r i n g t o n and N. Davidson, JT Phys. Chem., 57, 418, (1953).
G. S c h o t t and J . Kinsey, J. Chem. Phys. , 29, 1177-82, (1958) .
R. Streh low and A . Cohen, Phys. of F l u i d s , - 3, 320, (1960) .
R . S t reh low and A . Cohen, J . Chem. Phys. , 30, 257-65, (1959).
J . Fay, Some Experiments on t h e I n i t i a t i o n of Detona t ion in 2H2 - 02 Mixtures by Uniform Shock Waves, 4 t h Symposium ( I n t e r n a t i o n a l ) on Combustion, 501-7, W i l l i a m s and Wilkens, Bal t imore (1953) .
M . S t e i n b e r g and W. Kaskan, The I g n i t i o n of Combust ible Mixtures by Shock Waves, 5 t h Symposium ( I n t e r n a t i o n a l ) on Combustion, 664-71, Reinhold , New York (1955) .
G . S k i n n e r , J . Chem. Phys. , 3, 268, (1959) .
J . H i r s c h f e l d e r and C . C u r t i s s , J . Chem. Phys . , - 28, 1130-51, (1958) .
F i g u r e 1, (x- t ) S c h l e r i e n photograph of ac$iabatic e x p l o s i o n l ead ing t o s i m p l e a c c e l e r a t i o n of t h e r e f l e c t e d wave. Time i n c r e a s e s toward t h e r i g h t . B8ck w a l l of shock tube a t top. Vertical l i n e is s t a t i o n a r y slit'image. 70% argon,
= 1 c m Hg, Ys I 2.76, T,, = 157009, de lay at back w a l l 31 - 5 microseconds .
F i g u r e 2. (x- t ) S c h l e r i e n photograph of t h e i n i t i a t i o n of de tona t ion behind t h e r e f l e c t e d wave. Notice t h e i n t e r a c t i o n of t h e deve loping d e t o n a t i o n and t h e r e f l e c t e d wave. T ime i n c r e a s e s t o t h e r i g h t . Back w a l l of shock tube at top. 85% axgon, Po = 4 cm Bg, Ms = 2.22, T m = 1160%, de lay a t back w a l l is 135 microseconds .
// W
w w
P
Y
I-
0 o' 0
I
f I,
34.
I
A Study of Combustion and Other Free Radica l - Processes i n t h e Chemical Shock Tube
*" X i l l i a m E. Lee*and E a r l N. Malmberg
Department of Chemistry, The Ohio S t a t e U n i v e r s i t y , Columbus, Ohio
Present address: %astn?an Kodak Co., Rochester , N. Y.
The d i f f i c u l t i e s which a r e i n h e r e n t i n the s tudy of c e r t a i n
"'Sun O i l Co., Marcus Hook, Pa.
thermal r e a c t i o n s and i n combustion r e s e a r c h a r e w e l l known: d i f f i c u l t y of i n i t i a t i o n , the very h i g h r a t e of r e a c t i o n once begun, t h e complexity of t h e r e s u l t i n g mixture , and i n some c a s e s , s u r f a c e e f f e c t s . A need f o r understanding the mechanism of these high temperature r e a c t i o n s s t i l l remains a b a s i c problem. The k i n e t i c s and e n e r g e t i c s of a number of r e a c t i o n s i n v e s t i g a t e d a t l o w temperatures appear t o be a t l e a s t par- t i a l l y Understandable. However, cons iderable d e v i a t i o n from theory i s i n d i c a t e d a s the r e a c t i o n temperature i s increased .
The outs tanding f e a t u r e t h a t d i s t i n g u i s h e s h i g h temperature k i n e t i c s from low or moderate temperature k i n e t i c s i s the much l a r g e r amount of energy p r e s e n t i n t h e r e a c t i o n system. A 3 the r e s u l t of t h i s h i g h energy conten t , p o s e i b l e d e v i a t i o n s from low temperature k i n e t i c s may a r i s e . The sources of theae d e v i a t i o n s a r e l i s t e d a3 follows:
1. Reaction i n t e r m e d i a t e s t h a t may be somewhat s t a b l e a t low temperature may decompose r a p i d l y a t e l e v a t e d temperature , supply ing cha in c a r r i e r s t h a t may com- p l e t e l y change t h e k i n e t i c s o f t h e r e a c t i o n .
2. Non-equi l ibr lun energy d i s t r i b u t i o n s mag appear among r e a c t a n t s and products i n f a s t , h i g h temperature r e a c t i o n s .
3 . Diatomic and t r i a t o m i c r a d i c a l s may be formed i n addi - t i o n t o the polyatomic r a d i c a l s which a r e u s u a l l y observed a t low temperature
4. Large nunbelsof atoms and r a d i c a l s may be produced which a r e unknown a t lower temperatures .
I
-. The convent iona l k i n e t i c systems a r e i m p r a c t i c a l f o r t he
s tudy of h igh temperature r e a c t i o n s s i n c e t h e r e a c t a n t s must be hea ted r a p i d l y t o a h igh tempera ture wi thout a p p r e c i a b l e re- a c t i o n occur r ing be fo re t h e d e s i r e d temperature i s a t t a i n e d . The s i n g l e impulse shock tub? which has been d e s c r i b e d by Gl ick , Squ i re , and Hertzberg o f f e r s a meam of cons ide rab le f l e x i b i l i t y f o r ob ta in ing more fundamental chemical d a t a . A wide range of r e a c t i o n temperature i s p o s s i b l e , concen t r a t ions of r e a c t a n t s can be v a r i e d w i t h i n wide l i m i t s and su r face e f f e c t s a r e e l imina ted . With t h e s i n g l e impulse shock tube , t he r e a c t i o n occurs fo l lowing t h e r e f l e c t e d shock wave, and then i s quenched by a s t r o n g r a r e f a c t i o n . The r e a c t i o n pro- duc t s can be f l u s h e d f r o m the t u b e and analgsed.
Apparatus and Jda ter ia l s
The s ingle- impulse shock tube was made of two-inch s t a i n - l e s s s t e e l p ipe ; t h ree - foo t s e c t i o n s were assembled and he ld i n proper alignment by b o l t e d f l a n g e s . The g e n e r a l cons t ruc- t i o n i s e s s e n t i a l l y t h a t d e s c r i b e d by. Gl ick , Squ i re and Hertzberg.1 A f e w minor mod i f i ca t ions were r e q u i r e d t o over- come c e r t a i n mechanical d i f f i c u l t i e s .
The arrangement used i n t h e s e s t u d i e s was determined by the r e a c t i o n t ime d e s i r e d . A t y p i c a l arrangement proceeding f r o m one end of the appa ra tus t o the o ther , i s as fo l lows: Expansion tank ( twenty g a l l o n c a p a c i t y ; s i x - f o o t h igh pressure d r i v e r s e c t i o n ; t h ree - foo t b u f f e r s e c t i o n ( I ) ; t h r e e - f o o t r e a c t i o n s e c t i o n ; s i x - f o o t b u f f e r s e c t i o n (11); end p l a t e . Two SLM quar t z p i e z o - e l e c t r i c p r e s s u r e pick-ups were mounted i n b u f f e r s e c t i o n I1 t o measure t h e v e l o c i t y o f t h e shock wave by f eed ing the proper s i g n a l t o t h e s t a r t and s t o p of a Berkeley EPUT and Timer model No. 7360. A shock-proof mounting was r equ i r ed f o r t h e c r y s t a l p r e s s u r e pick-ups.
s tudy of pressure- t ime t r a c e s du r ing t h e o p e r a t i o n of t he tube wi th t h e p re s su re pick-up i n d i f f e r e n t p o s i t i o n s . These t r a c e s were made by using t h e K i s t l e r Ins t rument Company p iezo c a l i - b r a t o r . The output of the c a l i b r a t o r was recorded photo- g r a p h i c a l l y wi th a Tek t ron ix Model 535 o s c i l l o s c o p e w i t h No. 53c plug-In d u a l beam p r e a m p l i f i e r u n i t . chosen f o r t h e r e a c t i o n s e c t i o n r e s u l t e d i n t h e r e a c t i o n occurr - ing i n a s e c t i o n which w a s f r e e f r o m anomalous p r e s s u r e peaks in t h e t r a c e .
The p o s i t i o n of the r e a c t i o n s e c t i o n was chosen a f t e r a
The p o s i t i o n which was
Two s p e c i a l quick-opening va lves were used t o i s o l a t e the r e a c t i o n mixture from t h e b u f f e r i n g gas p r i o r t o r e a c t i o n .
These va lues were plug type va lves in which t h e plug was bored e x a c t l y t o the i n s i d e d i ame te r of t h e shock tube . Leakage ,
ac ross t h e valve and t o the atmosphere was e l imina ted by the u s e of O-rings i n a p p r o p r i a t e grooves.
propane, were r e s e a r c h g rade chemicals s u p p l i e d by P h i l l i p s Petroleum Company. The compressed gases were commercially a v a i l a b l e . The azomethane used was prepared by the ox ida t ion of dimethylhydrazine w i t h mercuric oxide accord ing t o the method of Renaud and Lei tch.2
All of t h e hydrocarbons used wi th the except ion of cyclo-
Experimental Procedure
I n p r e p a r a t i o n f o r a r e a c t i o n , a l l p a r t s of the system were evacuated , f l u s h e d w i t h helium, evacuated aga in , and then f i l l e d wi th helium t o t h e r equ i r ed p res su re . The r e a c t i o n mix- t u r e was prepared by in t roduc ing helium, and t h e reac tan ts , i n t o a s t a i n l e s s s t e e l c y l i n d e r and mixing by imposing a s t r o n g thermal convect ion. The b u f f e r and r e a c t i o n s e c t i o n s were a l l f i l l e d t o e x a c t l y t h e same p r e s s u r e , and t h e quick-opening valve was opened t e n - f i f t e e n seconds be fo re t h e b u r s t i n g of t he main diaphragm.
s t ream o f helium th rough two t r a p s cooled i n l i q u i d n i t rogen ; the second t r a p was f i l l e d w i t h adsorbent cha rcoa l which had been a c t i v a t e d by h e a t i n g t o 30OoC. in a s t ream o f helium.
The conten ts of the t r a p s were t r a n s f e r r e d t o gas holders . f o r a n a l y s i s . Convent ional gas chromatographic methods were used; the fo l lowing ana lyses were performed wi th t h e r e spec t ive columns :
The r e a c t i o n products were f l u s h e d from t h e shock tube i n a
1.
2. S i l i c a g e l 40': e thane , e thene , and carbon d ioxide . 3.
4. Polyethylene g l y c o l 40°: oxygenated compounds.
A Gow-Mac f i l a m e n t type c e l l was used w i t h t h e f i r s t t h r e e
Linde Molecular Se ive 5A, 117': hydrogen, carbon mon- oxide, and methane.
Dowtherm A 40°: propane, propene, and a l l t h e C4 .hydro- carbons , pentane , and the pentenes.
columns; a very s e n s i t i v e t h e r m i s t o r c e l l was used in the sea rch f o r oxygenated compounds.
In almost a l l of t h e runs , the composi t ion of t h e mixture in the r e a c t i o n s e c t i o n was approximately f i v e mole percent or l e s s .
Other r e a c t i o n products t h a t could n o t be s e p a r a t e d by g a s chromatography were determined by o t h e r convent iona l methods o f a n a l y s i s . The r e a c t e d gas was passed i n t o water and formalde- hyde was d e t e r a n e d a s t h e 2,4-dinitrophenglhydrazone; t h e a c i d e q u i v a l e n t , by t i t r a t i o n ; and peroxides , by t i t r a t i n g w i t h hydrogen iodide accord ing t o t h e procedure of S a t t e r f i e l d , i+ilsOn, LeCla i r and R e i d . 3
Re s u l t s
Thermal Decompos'i t i on of Az ome thane
Azomethane was thermal ly decomposed a t t empera tures ranging f r o m 437.5 t o 635.2OC. and r e a c t i o n times of 0.6 t o 3.8 m i l l i - seconds. A t t h e lower temperatures and a t low c o n c e n t r a t i o n the dominant r e a c t i o n l e a d s t o t h e format ion of ethane. A t h i g h e r temperatures and h i g h e r i n i t i a l c o n c e n t r a t i o n s , methane, e thylene and propane a r e formed i n large amounts. L i n e a r r e l a t i o n s h i p s a r e obta ined when t h e l o g azomethane c o n c e n t r a t i o n a t a par - t i c u l a r temperature i s p l o t t e d a g a i n s t t h e r e a c t i o n t i m e . The r a t e express ion f o r t h e t h e r m 1 decomposi t ion of azomethane was de te rn ineC t o be
-46,200 -1 . k = 1.24 X 10¹⁵ exp Rt
i t
Yethyl Radical React ion w i t h Oxygen
I Methyl r a d i c a l s , which were g e n e r a t e d by t h e r m a l l y decom- posing azometnane,were al lowed t o r e a c t w i t h oxygen a t 522OC. and a t var ious oxygen-radical r a t i o s . The r e s u l t s f o r a 5 : l oxygen-azonethane r a t i o a r e g i v e n i n Table I. The a c i d formed f r o 3 the methyl radical-oxygen via3 determined i n only one ex?eriment. Zrom 442xb4 m o f azomethane under the above con- d i t i o m , 26.6 microequiva len ts of a c i d was formed. To t e s t t h e s t a b i l i t y of sone o f t h e r e a c t i o n products under t h e r e a c t i o n c o n ? i t i o n q s e v e r a l r e a c t i o n s between methanol and oxygen and carbon aonoxide and oxygen were c a r r i e d o u t . For t h e water - ca ta lyzed r e a c t i o n of C O and oxygen a t 632OC. p r a c t i c a l l y a l l of the CO was recovered unchanged. A t 13OO0C., however, more than 90 p e r c e n t of the CO was conver ted i n t o G O z .
38.
I
Table I React ion of Methyl Radicals and Oxygen i n the
Shock Tube a t Pql. = 14.66, T = 522OC. (Oxygen-Azomethane Rat io = 5:l)
12-50-(3) ( 4 ) (5jb ( 6 ) ( 7 ) Exp. No. I
React ion T i m e 2.6 2 .2 0 . 8 1.5 3 . 0 ( m i l l i s e c o n d s ) Azomethane , p m .
i n i t i a l 416 464 440.4 456.4 476 unreac t e d 14.5 42.8 a a a
Products 45.6 35 .4 a 18.9 72.7 '2'6 96 .3 79.0 a 52 .4 117.3
co 197 176 a 138.4 286.4 27.6 20.5 a 11.2 82.7
CH4
co2 H2 176 181.6 a 118.2 a
8.3 9 .3 a 6 . 4 33.2 HC HO 273 a 92.8 378.2 235.0 CH30H a 2 .0 a a a
Carbon ba lance 85.8 46.8 10.6 69.1 98.2
a Experimental d i f f i c u l t i e s prevented a n a l y s i s of t h e s e c ompounda .
b A complete set of analyses f o r formaldehyde at this temperature shows a maximum in concentration at 2 d u S e C .
2'4
-
Cyclopropane and n-pentane Reactions
r e a d i l y a t 76OoC. and h i g h e r a l though a t long r e a c t i o n times methane, e t h y l e n e , bu tene and hydrogen a r e a l s o formed. The methyl rad ica l - induced decomposition of cyclopropane was a l s o s t u d i e d . A t 76OoC. the induced r e a c t i o n l e a d s t o heavy carbon d e p o s i t s on the w a l l s of the shock tube. When t h e induced reac- t i o n waa c a r r i e d out w i t h added oxygen t r a c e s of acetaldehyde, formaldehyde and a c r o l e i n were d e t e c t e d aa t h e 2 , 4 DNPH d e r i v a t i v e s .
The i s o m e r i z a t i o n of cyclopropane t o propylene occurs
The products formed by t h e r e a c t i o n of n-pentane w i t h oxygen a r e those g e n e r a l l y expec ted of hTdrocarbon oxida t ion a t high temperature . A s e r i e s of experiments were c a r r i e d out a t 877OC.
? I
f
in which the r e a c t i o n time was v a r i e d from 2.2 t o 3.4 m i l l i - seconds. The only oxygenated products found were carbon mon- oxide and carbon d i o x i d e . Oxygenated products w i t h any v e s t i g e of the o r i g i n a l carbon s k e l e t o n a r e a b s e n t even a t v e r y s h o r t r e a c t i o n t imes.
Discuss ion
The thermal r e a c t i o n of azomethane i n t h e shock tube appears t o proceed by a unimolecular process when t h e i n i t i a l azomethane c o n c e n t r a t i o n i s reasonably low, t h e r e a c t i o n time i s s h o r t and t h e r e a c t i o n temperature i s n o t t o o high. The f o r n a t i o n of pro- pane i n t h e r e a c t i o n system a t the higher temperatures and a t long r e a c t i o n times sugges t t h a t e t h y l r a d i c a l s a r e present i n g r e a t abundance. Products involv ing methyl a d d i t i o n t o azomethane t o form t e t ra rne thylhyaraz ine were n o t d e t e c t e d i n any of the experiments which i n d i c a t e s t h a t t h i s r e a c t i o n i s n o t important a t these h i g h tempera tures .
r e a c t i o n i s i n reasonably good agreement w i t h the l i t e r a t u r e values .
The Arrhenius a c t i v a t i o n energy of 46,200 c a l f o r t h e thermal
The r e a c t i o n of methyl r a d i c a l s and oxygen a t h i g h tempera- t u r e s i s extremely complicated. There i s a n i n c r e a s e i n the r a t e o f decomposition of azomethane i n the presence of oxygen somewhat ove? t h a c of the pure thermal r e a c t i o n . Although t h e r e s u l t s a r e not q u a n t i t a t i v e n o r complete, t h i s evidence sugges ts t h a t c h a i n r e s c t i o n s involv ing methyl r a d i c a l s , oxygen or r e a c t i v e i n t e r - mediates become important a t these h i g h tempera tures .
Prevlous i n v e s t i g a t o r s have e x p l a i n e d t h e major products o f t h e r e a c t i o n of methyl r a d i c a l s and oxygen by t h e s e r e a c t i o n s
CH3 t O2 CH3 t o2 Cii300 HC HO
CH3 t HCHO
CHO +- OH 2 CH300
2 CHBO CH30 t RH
CHO + O2
CH300 HCHO + OH HCHO + O H H + CO
CH4 f CHO
HCOOH 2 CH 0 f O2
3 CH30H t HCHO CH30H + R
C 0 2 + OH
2
I 5
I
A number of r e a c t i o n pa ths a r e a v a i l a b l e t o account f o r the products found i n low y i e l d i n th i s r e a c t i o n and a r e of minor importance.
t h e i n i t i a l r e a c t i o n of methyl r a d i c a l s and oxygen. A t tempera- t u r e s from OOC. t o a t l e a s t 200°C., r e a c t i o n I i s a t t r a c t i v e s i n c e the subsequent r e a c t i o n s (eq . 5 a , Sb) can adequate ly ex- p l a i n methanol format ion . React ion I1 l e a d s t o no p l a u s i b l e mechanism by which methanol i s formed. Only t r a c e s of methanol were formed i n t h e o x i d a t i o n r e a c t i o n s a t 5 0 3 O C . Methanol i s r e l a t i v e l y s t a b l e a t t h i s temperature, b u t o n l y t r a c e s of methanol were found. React ions 5b ana 5c do nor; appear important a t t h i s temperature .
Xethoxy r a d i c a l s , f o r m e d from dimethylperoxide and ther- mal ly decomposed y i e l d formaldehyde and methanol a s major pro- d u c t s . l h e n oxygen i s p r e s e n t , only t r a c e s o f methanol a r e detected and C02 becomes the major product.
A comparison of the C02 ana lyses from methyl and methoxy r a d i c a l experiment s u p p l i e s evidence t h a t t h e t o t a l amount of methyl r a d i c a l s t ha t go through a methoxy i n t e r m e d i a t e i s pro- bably a good d e a l l e a s t h a n 5 p e r c e n t .
t h e r e a c t i o n r e f l e c t s i t s importance a s an in te rmedia te i n the o x i d a t i o n mechanism. The r e a c t i o n o f methyl r a d i c a l s and f o m a l 3 e h y d e , and p o s s i b l y the fornfyl r a d i c a l , p a r t i a l l y e x p l a i n t h e h i g h methane c o n c e n t r a t i o n . Zhen the e a s i l y a b s t r a c t a b l e hydrogen of formaldehyde become r e a d i l y a v a i l a b l e , e s p e c i a l l y a t t h e l a t e r s t a g e s of the r e a c t i o n , methane becomes a major product .
Cbnsiderable u n c e r t a i n i t y s t i l l e x i s t s a s t o the n a t u r e of
The l a r g e amount of formaldehyde formed i n a l l s t a g e s of
Reaction involv ing peroxide, hydrogen peroxide oy hydro- peroxide format ion a p p a r e n t l y do not t a k e p lace t o any appre- c i a b l e e x t e n t a t t h e s e tempera tures .
The convers ion of CO t o C02 a t 632OC. is a very slow r e a c t i o n and a l though a small amount of C 0 2 may be formed from C O , o t h e r r e a c t i o n s l e a d i n g t o C 0 2 a r e much more l i k e l y t o occur .
Although many o f the r a d i c a l s descr ibed have been i d e n t i - f i e d i n combination r e a c t i o n s by mass spec t romet ry t h e impor- tance of many of t h e s e s p e c i e s in a c h a i n mechanism a t high temperature s t i l l cannot be confirmed.
between the simple hydrocarbons and h i g h e r molecular weight Pentane was chosen f o r t h i s s tudy s i n c e i t i s in te rmedia te
I 40.
i”
< 1
t
I I
41.
hydrocarbons which a r e important l i q u i d f u e l s . Pentane, a r e l a t i v e l y s imple hydrocarbon undergoes r e a c t i o n s t h a t a r e d i f f i c u l t t o i n t e r p r e t . Oxygenated o r g a n i c products , a ldehyde, ke ton , or a c i d s a r e a b s e n t i n the products . Evident ly , once a pentane molecule becomes a r a d i c a l i n t h e presence of oxygen a t h i g h temperature it r a p i d l y undergoes complete d e g r a d a t i o n t o carbon monoxide and carbon d i o x i d e . A c e r t a i n amount of r a a i c a l decomposition l e a d s t o o l e f i n p l u s a lower a l k y l r a d i c a l . The r a t h e r uniform r a t e of o x i d a t i o n of pentane over a wide range of oxygen c o n c e n t r a t i o n s u g g e s t s t h a t t h e r a d i c a l cha ins a r e long.
out s u c c e s s f u l l y i n the chemical shock tube. The o x i d a t i o n reac- t i o n can be c a r r i e d only t o t h e d e s i r e d s t a g e and s topped.
W i l e t h e exper imenta l r e su l t s do n o t permit a r e a c t i o n mechanism t o be proposea, a n i n s i g h t of the h i g h temperature problem, w i t h a l l of i t s c o m p l e x i t i e s , has been obta ined .
C e r t a i n h i g h temperature combustion s t u d i e s can be c a r r i e d
Reference 3
1. Gl ick , H . , S q u i r e , Vi. and Hertzberg, A . , F i f t h Symposium
2 . Rer.aud, R. and L e i t c h , L. C . , Can. J. Chem., 32, 545 (1954) . 3. S a t t e r f i e l d , C. N . , k i l s o n , R. E . , LeCla i r , R . and Reid, R . C.,
( I n t e r n a t i o n a l ) on Combustion, p. 393.
Anal. Chen., g, 1792 (1954) .
Boundary Iayer Effects on psrOlysis Behind Paflected Shock ?laves in Narrow Tubes
K.E. 1,Ic.lcCulloh and R.E. Ferguson National Bureau of Standards, Washington, D.C.
Introduction
I n some experiments on the t h e w decomposition of propane i n a flow system a t temperatures between 1100°K and l400"K, t h e usual d i f f i c u l t y was experienced in evaluat- ing t h e ro le of surface reactions i n the chain decomposition. To try t o avoid this difficulty, fur ther experiments were performed using a small diameter, l o r p r e s s u r e shock tube with helium a s t h e dr iver gas, and emploSing the reflected shock wave tech- nique t o heat a propane-argon mixture t o calculated temperatures i n t h e range 1800°K to 2260OK. A study of the products and the dependence of extent of decomposition on cal- culated temperature behind t h e reflected shock wave revealed strong evidence of no- idea l behavior, undoubtedly related t o Duff's [11 observations of t h e marked effects on the main stream of boundary layer development behind the incident shock wave. ment of t h e distance between contact surface and incident shock confirmed the conclusions drawn from the chemical evidence: that i n narrow lowpressure shock tubes t h e loss of gas from the hot flow region behind t h e incident shock t o t h e boundary layer i s appreciable, and only part of the reactant gas i s heated t o high temperature by the reflected shock wave.
Experhental
5Ieasure-
The goal was t o study t h e decomposition of C13-labelled propane; since only a smal l am0w.t was available, a smal l (25 mm i.d.) lowpressure shock tube was employed. Reaction temperatures in the neighborhood of 2000°K were obtained behind the reflected shock wave. The low-pressure section, 120 cm long, w s of standard-wall pSrex tbbing selected f o r l lnifomity of bore. Diaphragm (one-mil cellophane) were pmctured by a solenoid-driven needle.
The brass dr iver section was 61 cm long.
Helium at an initial pressure of 1.3 atm was used as the dr iver gas i n all experi- ments. I n i t i a l pressures of the reactant gas mix tu re i n the low-pressure section ranged from 3.3 t o 7.5 mm 'dg depending on the de- s i red shock strength. (%theson research grade) and 10.0 mole per cent propane. confirmed the absence of s ignif icant impurities i n these gases. reactants and products was adequate t o avoid introduction of impurities exceeding one mole per cent of the ini t ia l propane i n any given experiment.
Incident shock wave speeds were determined from oscillograms which displayed timing marks a t 10 ~.r sec in te rva ls together with signals from three shock wave detectors located 75, 95, and n5 an from t h e diaphragm. oxide res i s tors Nhich have been described elsewhere [2].
The ambient temperature was 300 It 2°K.
This mixture contained i n all cases 9.0 mole per cent argon
Vacuum handling of Gas chromatographic analyses
The detectors were thin-film nickel
These measurements indicated that shock wave attenuation was negligible, l e s s than It appeared t h a t small discrepancies (7 or 8 per c a t ) one per cent in 20 cm of travel.
43.
betveen observed veloci t ies and those calculated from t h e init ial pressures could be adequately explained by assuming that s l igh t f l o v obstructions resulted from incom- p le te d$aphrag removal. ;feasurements made with a detector i n t h e end p la te showed t h a t t h s high-temperature & f e l l time a f t e r t h e shock was ref lected was onem sec or greater .
Products were collected f o r analysis by pumping the en t i re contents of the shock tube through two t raps i n ser ies , both cooled with l iqu id nitrogen. The first, a &-loop renntrant tra?, collected condensables; the second contained Linde Iblecular Sieve jA t o re ta in methane and argon. Condensables were determined quant i ta t ively by %as chromatography, using a t h e m 1 conductivity detector calibrated s e p a r a t e b f o r each prodact of interest .
Calculations
Using the usual one-dimensional shock xave theory, conditions behind the incident and reflected shock imves were com?uted fron the observed incident shock mve speeds. Calculations were rrade assuming unreacted gas i n in te rna l thermal equilibrium a t high temperature. 3nthalpy data for propane below 1500°K were taken from published tables c31, a d values a t higher temperatures were computed on t h e bas i s of Pitzer 's vibra- t iona l assismefit [&I and Pi tzer and Gwinn*s treatment of hindered rotat ion C51.
Since idea l ons-dbensional shock tube behavior was not realized i n these ex- ?sri?%r.ts, these calculations should not be taken very seriously. f lscted shock te?;Deratures a re presented here 00 t o provide a rough indication of e:geri-?ental con+itions. rpflected shock temperatures i n three eweriments a r e l i s t e d a t the top
The calculated re-
'3e observed incident shock wave speeds and the calculated of the table.
Ees-jlts of Three Zxperiments on Decomposition of Propane by the Paflected Shock 2ave Technique
?m 1 R u n 2 b 3
Shock :ave s 9 e d (incldent) 1.12 m/p sec 1.19 mm/p sec 1.31 mm/cr sec 2a lcda ted T behind ref lected
shock 180O0K l96OoK 2 2 6 0 0 ~ propane ( i r i t i a l ) 0.581 C U ~ 0 .a 0.255 PrGpane ( f ina l ) -283 .204 .E7 Fraction deconposed -513 507 .502
Products - 3thane Zthylme Acetylene Propylens
.029
.019 197
.036
.006
44.
Results and Discussion
Since incident shock wave attenuation vas negligible in preliminary experiments,
Referring t o t h e table, one sees some appar- On the one hand, the conversion of propane i s only 50 per cent and
serious departures from ont4jmensional f lox were f i r s t suspected vihen at temes were made t o understand t h e product analyses. ent discrepancies. is virtually bdependent of incident shock speed and calculated reaction t a p e r a t w e i n t h e three experiments. increasing with increasing shock strength is f a i r l y obvious from the trend in product dis t r ibut ion, showing acetylene increasing a t the expense of other 2roducts as calculat- ed temperature goes up.
On the other hand, that t h e reaction temperature i s actually
It is d i f f i c u l t t o reconcile these observations and t o e q l a i n the s u r p r i s i n g l j r low extent of decomposition i f i d e a l shock tube behavior i s assumed.
Considering first t h e lcw conversion of propane t o products: one can e s t a t e a minimum r a t e of decozposition b3 assum2ng that propane disappears by first-order unimolecular dissociation 50 ethyl and methyl radicals, :r'_th an activation e E e r g of 85 kcal (rather a high estimate) and a frequency factor of 2 x lo1? sec-l. l i f e of propane w:th these assunptions, leaving out a l l consideration of chain reactions, rmuld be less than 10-4 sec a t 2000OK. action time a t the high temperature (one m sec o r greater) mounts t o a t l eas t ten :WL- l ives even using th i s unrea l i s t ica l ly low e s t i m t e of rate. inescapable tha t o n l y about half the propane i s heated t o the calculated reaction t a p e r a t u r e .
The 'A*-
In our experinents, the minimum available re-
The conclusion i s a h o s t
Lf t h i s i s so, the resu l t s obtained can be vi,ewed as follows: It is as i f t h s reactant gas were divided i n t o two parts, one of which i s restr ic ted t o sufficient* low temperatures that l i t t l e pyrolysis occurs, irhile the other i s decomosed t o h igh conversion. apparent pe r cent conversion i s detemined by vlalysis of t h e mixture. The measured extent of decoorposition v m d d t h u s be gnerned by t h e original division of the sanple.
The hiu portions are then nixed (by t h e s a ~ l i n g procedure) 2nd the
A mechn i sn t o explain q-tatively these resu l t s can be devised staA-ting f r o m hff's observations [l]. wave by t h e contact surface we inr'er that min strean-boundary layer interactions impose a severe l imitation on t h e quantity of gas tha t can exist i n t h e intervening hot flow region. encroachment of the Zorner on t h e l a t t e r ; i n addition there i s an actual flow tommrd the xal l of gas i n t h e main stream. 'ine reactant gas thus tends t o concentrate near the m l l where sone o f it i s bg-passed by t h e central core of cold dr iver gas before the ref lected shock wave arrives.
From E s report of the close pursuit of the incident shock
The influence of the boundary layer on the rain stream is not skiply
In o u r experiments, reaction occurs only behind the ref lected shock; hence only t h a t portion of reactant gas that remains i n the hot flow region u n t i l it i s traversed b3 the ref lected shock w i l l undergo decomposition a t a r a t e character is t ic of the cal- culated ref lected shock temperature. behLnd the incident shock may undergo L i t t l e o r no decomposition on passage of the re- f lected shock wave.
That trhich has been l o s t t o the bour~dary layer
In order t o estimate i n another way t h e impomance of such effects i n the present exqeriments, sone addi t ional runs were =de, with conditions a s in Fun 2 of the table , but with the th i rd detector (115 cm stat ion) mounted i n midstreaic GO pernir. measurement of the time between arrival of the incident shock and the contacr; surface at this station. never exceeded one-half the value riven by one-dimensional theory. a significant fraction of the reactant gas had been l o s t from the hot flow region.
The resu l t s varied from run to.=, but the observed time in te rva l It m s evident that
45
L.1 another q e r i m e n t gas was sampled from near t h e center of t h e end plate , A where by the above mechanism t h e apparent conversion of propane should be high.
small s q l e bulb with stopcock was attached t o the end plate; n i t h t h e stopcock open the diaphragm was burst, and then t h e stopcock vas closed. "he condensable part of the sanple recovered fmm the bulb contained 27 mole per cent propane; tha t from the res t of t h e shock tube contained 63 mole per cent unreacted propane. mrked loss of gas from t h e hot -flow region was indicated.
Conclusions
Again,
'Ihis investigation presents ra ther extreme examples of d i f f i c u l t i e s which a re introduced by boundary layer effects. idrich one must go, e i ther by employing a tube of la rger diameter or by working at higher pressure, in order t o reduce below a tolerable linit t h e loss of reactant gas from the hot flax region. The obvidus des i rab i l i ty of avoiding m c a l s imilar i ty with these eqeriments indicates t h a t an anmer cannot be obtained by simple dimen- sional analysis.
It is d i f f i c u l t t o estimate t h e extent t o
Hoxever, t h e very fac t t h a t extreme cases a r e presented should give some in- sight in to the direct ion i n which interpretat ion of e.xperiments can e r r when boundarg layer e f fec ts a re ignored. indication of l o x octivation energy for decomposition could r e s u l t i f an unsuspected fract ion (not too strongly dependent on shock strength) of t h e reactant gas were l o s t from the hot flow region.
For example, it i s not difficult t o see how an i l lusory
The observed var ia t ions f r o m run t o run of the duration of hot flow can intro- duce other experimental complications as well. i n part from the Yinite but i l l-defined ra te of diaphragm rupture.
These var ia t ions presumablg resu l t
In conclusion, it i s important t o emphasize tha t none of the e f fec ts reported here vmuld have been suspected on the bas i s of the shock wave Yelocity measurements, :.,.hich gave no c lear indication of incident shock attenuation or unusual disagreement betxeen calculated and observed incident shock velocit ies.
z i t e r i o n f o r appraising the importance of departures from unifom flo:r i n the hot gas -hen srall, 1o:i-pressure shock tubes a r e enployed. ss?scial ly i f act ivat ion energies are t o be derived from the data, independent measure- m n % s should probably be nade t o determine whether loss of reactant gas t o t h e boundary layer is si,mificarlt.
Xch.owled,gnent
From t h e available evidence - ..- '3 mst conclude that shock -wive velocity measurements do not prow-de a re l iab le
Even with la rger tubes,
':e are indebted t o R. Gilbert Ihufman f o r his help with analyses of products a d caFbra t ion of the gas chromatography system.
"eferences
[I] [2] [3]
[&I [5)
?. 3. Duff, Fhys. Fluids 2, 207 (1959). %. 2. ::cCulloh, Tev. Sci. Instruments 2, 780 (1960). h e r i c a ? Petroleum I n s t i t u t e Eesearch Project 44, Carnegie I n s t i t u t e of Technology,
K. S. Pitzer, J. Chem. phys. 2, 310 (1944). 'Le S. Pitzer and 'Y. D. Girinn, J. Chem. Phys. lo, 428 (1942).
Pittsbursh, Pa., December 31, 1952.
CHFHICAL BEACTION STUDIES WITH A HYDROMAGNETIC SHOCK TUBE
By James L. Lauer and Robert L. James Sun Oil Company, Marcus Hook, Pennsylvania
INTRODUCTION
46.
I
To gain quick aualitative information about high-temperature reactions, the hydromagnetic shock tube originally designed by Fowler and later modified by Kolb has been found useful?' In this tube a shock wave is produced by the rapid dis- charge of a high-voltage condenser through an arc formed between two electrodes perpendicular to the tube axis and located at one end of the tube. Compared to the mechanical or diaphragm shock tube, the hydromagnetic tube is but a small toy, generally less than 2 feet long and having only one chamber. Series of equivalent shock waves can be passed through a gaseous reaction mixture and significant yields of product obtained. Effective contact times are very short (shorter than normally obtainable with an electric arc) and exceedingly high temperatures can be reached. These advantages are partly offset, however, by non-uniform shock velocity, the influence of the electric arc on the reaction, the requirement of low gas pressure, all of these making quantitative analysis of the entire process exceedingly dif- ficult.
However, when the reaction products were stable and the reaction studied was one of high activation energy, much could be learned from a few experiments with the hydromagnetic shock tube. The only parameters determined were product composi- tion and shock velocity. Details ofthe procedure, applied mostly to the pyrolysis of methane, are explained in the following secKions.
APPARATUS
Figure 1 is a schematic drawing of ou hydromagnetic shock tube. It is a modification of the so-called *'Tee*' or Kolb 79) tube, the principal difference being that it is constructed of standard Pyrex pipe parts making for easy disassembling, cleaning, and exchanging. nected in parallel with a high-voltage, low-inductance condenser (1.6 or 15 microfarads, 25 kv). less steel electrodes is interposed between one of the tube electrodes and the high-voltage side of the condenser to function as a switch. The entire tee-tube is filled with the gas mixture to be etudied, which is usually at pressures of from 10 to 100 am of Hg. To effect a discharge, the condenser is charged from a d.c. power supply and the gap switch triggered by means of an auxiliary electrode (not shown) brought to high potential by an automotive ignition coil attached to a battery. through a strap located along the tee-tube between the two electrodes. current passes, it induces a magnetic field in the electrode section in a direc- tion such aa to produce an unbalanced force on the ions in the arc. This force propels the ions and the gas molecules coltiding with them down the stem of the tee-tube. energy in the shock wave. "pinch" effect of the discharge:
The electrodes along the bar of the tee-tube are con-
A high-pressure gap, containing nitrogen between two stain-
The discharge current returns to the ground side of the condenser As the
This "magnetic driving" accounts for about one-quarter to one-half the Mainly, however, the shock vave is generated by the
The arc, constituting a rapidly varying current,
47. cons t r i c t s about its axis ("pinch"), thereby heating the gas t he re t o a very high temperature and bringing it t o a pressure higher than t h a t prevai l ing i n the rest of the tube. t h e tube.
Later expansion of t h i s gaa r e s u l t s i n a shock wave propagating dovn
The dlmensioor of the apparatus were arr ived a t a f t e r considerable experimen- t a t i o n i n vhich ve t r i e d t o balance high shock veloci ty with convenience and s a f e t y of operation. The diameter of the tee-tube is 1 inch; the length of the stem por- t i o n can be varied by using different sections of pipe, but is uaually between 1 /2 and 2 f ee t ; t he gap between the electrodes is about 1/2 inch vide. A l l e l e c t r i c a l leads a r e brass s t r aps , l- inch vide and 1/16-inch thick, t o reduce inductance losses.
Shock a r r i v a l t i m e s were measured v i t h a TektronixModel 545A oscilloscope, using an inductive pickup (a fev turns of w i r e ) from the ground lead of the con- denser t o start the t r ace and a pressure o r photo pickup a t d i f f e ren t locations along the tube t o give an indication of the shock's posit ion. Generally a Kistler piezoelectr ic pickup vas used at the end of the tube where i t faced the shock wave d i r e c t l y .
Figure 2 is a photograph of the apparatus during the'passage of a very strong shock wave. The sharp, luminous front representing the f a r thes t t r ave l of excited ions and molecules is c lea r ly shown. Figure 3 is the oscillogram f o r t h i s pa r t i c - u l a r experiment. The f i r s t sharp d m w a r d excursion of the trace corresponds t o the a r r i v a l of the primary shock wave a t the end of the tube, the second and t h i r d (smaller) excursions correspond t o the a r r i v a l of the shock wave af ter t raversal of 3 and 5 tube lengths, o r - i n other words - a f t e r 2 and 4 r e f l ec t ions a t the tube ends.
c-, 3 ) Fowler and coworkers were the f i r s t t o invest igate the phenomenon of the so-
cal led "Rayleigh Afterglov," i . e . , the luminosity produced outside of the electrode region i n a short-l ived gas discharge and l a s t ing considerably beyond the duration of the discharge. They established t h a t the afterglow w a s due t o gas molecules excited by very intense shock waves or iginat ing i n the discharge. veloci ty and luminous front veloci ty measurements w e r e i n general agreement with the theory of shock and detonation vaves. t o produce very intense shock vaves and thereby very high temperatures in deuterium (hoping t o start a nuclear fusion reaction) modified the Fowler tube, chief ly by '
adding the return a t r a and other features t o get the e f f ec t of "magnetic driving."
solving the following problem: taneously in a very narrow s l a b of f l u i d in a tube of un i t cross section. t o f ind the subsequent motion of the fluid." Using the methods of s imi l a r i t y analysis and approximatioas reasonable f o r strong shock vaves (among others , that a i l the mass is concentrated at the shock front and t h a t it has t h e veloci ty and in t e rna l energy prevail ing there) , Earr is found that t h e shock radius E of a one- dimensional wave should vary with time according t o the expression
Their shock
Several years later, KO&' i n an e f f o r t
Simultaneously, Rarr i P developed a theoret ical analysis of t h e Fowler tube by "A given amount of energy W is deposited instan-
Ve wish
vhere$--is the heat capacity r a t i o (ansumed independent of temperature) and p. the gas dewit). ahead s ion derived by G. 1. vake of atomic banb
front. (Equation (1) is analogous t o an expres- he propagation of spherical b l a s t vaves in the
48. -hetried t o check Harris' equation with the Kolb tube and found that an
t- AR" empirical re la t ion between Rand t, viz., I
@I was a t r u e r representation of h i s data than Equation (l), which, however, vas i n good agreement with the general trends (e.g., changes i n W and 9 ). Agobian and L i f s c h i t & m e performed s imilar experiments and have cane t o agree v i t h Kash. They also made a br ie f analysis of the reason8 for the deviation of t h e i r r e s u l t s from H a r r i s ' formula.
Recently,
Our own resu l t s v i t h methane, nitrogen and other gases always showed agreement with Equation (2). charge energy, our r e s u l t s have come very close t o agree with Equation (1).
However, under some conditions of low pressure and high dis-
By combining the "blast wave" equation (Equation 1) with f i r s t order kinet ics , it was possible t o t e s t at l e a s t the reasonableness of k ine t ic constants e i ther assumed or found in the l i t e r a t u r e . approximate, it proved t o be consis tent i n i t s e l f and v i t h other data i n the case of methane pyrolysis. and the method of calculat ion i l l u s t r a t e d i n Paragraph ( f ) of the next section of t h i s paper.
While the procedure used vas admittedly qui te
The theory behind i t is, therefore, b r ie f ly sketched here
Different ia t ion of Equation (2) with respect t o t h e yields an equation f o r the shock velocity, viz.
which is re la ted t o the r a t i o of temperatures behind and i n front of the shock front by the "strong shock" formulauJ
1 - c Lx(r . -oka c+ I T, @+/)'a:
a. and To being t h e sound ve loc i ty and, temperature i n the medium ahead of the shock front . s a t i s f i e d i n our experiments w e r the region where reaction took place.
Pkpation (4) holds f o r (g-l)Ra/2u.x 57 /
A monomolecular decomposition is described by
, a condition f a i r l y well
- d A c = &dt e ,
A = Z C (6 I
where c is the concentration or p a r t i a l pressure of the decomposing material , t the time, and k the reaction ve loc i ty constant defined by t h e Arrhenius formula
- L/R' T
(z is the frequency fac tor , Ea the ac t iva t ion energy per mole, B' the universal gas constant, T the absolute temperature). considering a l l the mass concentrated at the shock front , it is permissible t o sub- s t i t u t e T fram Equation (4) i n t o Equation (6) and use the resul t ing k i n Equation (5). nus one gets after integration: a-af-.
By making t h e assumption of Harris and
C4-k ( 7 ) M ~ / ~ ) = BE,^ e
i I
,
49. The integral of Equation (7) can be vritten i n the form
I & = -
where the incomplete gama functiona can be expressed i n terms of confluent hyper- geometric functiona according t o t
c-2 --z r(Cl+) = + e :he formula -* , C - 2
c-I -+ - v e
I
Equation ( 9 ) was derived fram recurrence relat iona given in Sla t e r ' s "Con- fluent Hypergeometric Functions." the tables contained in the same treatis&!')
It is already i n a form s u i t a b l e f o r use with
The isentropic index/ used i n Equation (7) is an " e f f e c t i v e " r Over the portionof t h e shock tube f o r which the reagent concentration is changed from Co t o C by passage of the shock wave. contents, fo r varying tube lengths o r varying posi t ions of a b a r r i e r within the tube (cf., following section). Thus, extents of react ion in d i f f e ren t portions of the tube can be calculated (shock s t rength at tenuates with dis tance from the a rc region).
Concentrations are found by analysis of t he tube's
EXPERIMEWl'AL RESULTS
(a) Relative Amounts of Reaction i n Electrode and Shock Tube Portions
In order t o determine the r e l a t i v e extent of reaction in the electrode and shock tube sections of the tee-tube, we placed a loosely f i t t i n g b a r r i e r i n the shock tube a t various distances from the electrodes in such a way as t o r e f l ec t oncoming shock waves. found t o depend strongly M the posi t ion of the barrier. o r ig ina l ly f i l l e d with methane, it vaa possible t o double the proportion of acetylene in the final mixture by placing the b a r r i e r a c e r t a i n distance from the arc (around 5 inches under our conditioos). This e f fec t of t h e b a r r i e r (the b a r r i e r did not change tube volume) vas ,a maximran a t a c e r t a i n distance from the electrodes and decreased more sharply w i t h decrease than with increase of dis tance from the posit ion of maximum influence. The e f f ec t of the b a r r i e r dropped t o zero a t about f ive time8 the distance of the maximum from t h e electrodes. This e f f ec t an reaction r a t e we ascribed t o reactions taking place i n t h e wake of a shock wave derived from the primary ahock wave by r e f l ec t ion at t h e ba r r i e r . was far from t h e electrode region, t he shock wave vas too weak t o cause fu r the r reaction; when i t vas very close t o the electrode sect ion, a shock wave had uot yet formed and react ion was due t o the arc.
The composition af the gas mixture a f t e r discharge w a s When the tube had been
When the b a r r i e r
By t h i s procedure, we were ab le t o estimate f o r the conditions of discharge voltage, pressure, electrode distance, etc., what the relative influences of arc and shock w a v e on the (high-temperature) react ion were and mer what distance d m the tube reaction took place.
(b) Effect of Increased Electric Enerw Jhm endi ture on Extent of Reaction
As mentioned earlier, the hydromagnetic shock tube permits passage of successive shocks through the same gas mixture. t he energy input in two ways: capacitance, higher condenser vol tage) and (2) by increasing the number of d i s - charges per experiment, every discharge occurring at the same potent ia l . methods increased the concentration of acetylene in the f i n a l gas mixture (analyses were done on al iquot samples from the tube e i the r by mass spectrometry o r by gas chromatography). shows, the gradual subs t i tu t ion of ethylene for acetylene was demonstrated. Table I a l s o i l l u s t r a t e s the e f f ec t of increase i n shock s t rength by the in t ro- duction of "magnetic driving." When the return s t r a p had been removed from the electrode portion, the y ie lds of product were considerably laver .
Thus it is possible t o increase (1) by increasing the discharge energy (higher
Both
However, the l a t t e r method vas more ins t ruc t ive , for , as Table I
(c) , Effect of I n i t i a l Pressure on Extent of. Reaction
As expected from the theore t ica l analysis (Equation (l)), higher i n i t i a l pressures (higher 9.) should r e s u l t i n shorter shock r a d i i at a given time (laver shock ve loc i t i e s ) and hence lower temperatures and less reaction. This r e su l t is indeed obtained (Table 11). However, probably because the methane decomposition react ion proceeds v i th an increase i n volume, the decrease of acetylene concen- t r a t i o n is wen greater than one would otherwise predict .
(d) Shock Velocities
Figure,& contains p lo t s of a r r i v a l times i n nitrogen of shock waves against breakdown vol tage for various pressures. On the logarithmic scales , the curves are reasonably s t ra ight l ines of slopes in agreement with predictions from Equation (1).
The var ia t ion of a r r i v a l time in methane with distance is shown i n Figure 5 . The curves a re s t ra ight l i nes on a logarithmic plot . Thus the slope of these l ines Corresponds t o n and the in te rcept t o A of Equation (2). Over t h e distances shown, the exponent n is nearly independent of pressure and of breakdown voltage, as pre- d ic ted theoret ical ly . It is a l s o nearly equal t o 1.5, the theore t ica l value. A va r i e s v i th , pressure and discharge vol tage according t o Equation (1).
When a series of discharges and shock wave3 were passed through methane, a r r i v a l times a t a fixed loca t ion changed as composition and pressure of the gas mixture changed, the r e su l t being a gradual decrease of a r r iva l time o r increase i n shock veloci ty . f o r every shock passed through a given gas mixture, i t was of ten possible t o learn enough about the extent of react ion v i thout fur ther analysis ; e.g., i f one vanted t o know w h a t influence a change i n the concentration of a par t icu lar reagent would have 09 t he y ie ld of a pa r t i cu la r product.
By measuring both t o t a l pressure change and shock veloc i ty
An example of such a study is the e f fec t of hydrogen on the pyrolysis of methane, which is i l l u s t r a t e d in Table 111. Increases in tke hydrogen/methane r a t i o led t o higher conversion of methane, but more t o ethylene than t o acetylene. The proportions of the products could be deduced from pressure and veloci ty measure- ments only.
(e) Pmolvs is of Hydrocarbons
The pyrolysis of methane i n the hydromagnetic shock tube vas used in the preceding sect ions t o illustrate the method. carbon were the pr incipal products. of temperature behind t h e shock wave (lowering of pressure, increase of breakdoan
Ethylene, acetylene, hydrogen and Bpjr change of conditions leading t o an increase
potent ia l ) resulted i n an increase of acetylene and hydrogen production and a decrease of ethylene and carbon production. true. methane. lover, which in t u rn vould produce a lover temperature i n the wake of the shock wave (Equation (4)). more ethylene and carbon than would methane under othervise iden t i ca l conditions. This vas indeed the r e su l t obtained. Under the same conditions, harever, olef ins yielded more carbon than the corresponding paraffins. capacit ies but a l s o energies of formation and k ine t i c s of pyrolysis play an important role. When the differences of experimental conditions were taken i n t o BCcouUt, our work on hydrocarbon pyrolysis appeared t o be i n general agreement$ with that of Greene, Taylor, and Patterson, who used a conventional shock tube. Our pyrolysis work is sti l l continuing and vi11 form the subject of a later paper.
( f ) Kinetic Parameters i n the Pyrolysis of Methane
The converse vas a l s o found t o be The heat capacity r a t i o of t he higher paraff ins is smaller than that of
According t o Equation (1) t h e shock veloci ty should, therefore, be
Thus, higher paraffins vould be expected t o y i e ld r e l a t ive ly
Evidently not only heat
In a s e r i e s of experiments with pure methane a t a breakdown voltage of 16 kv and 60 mm of pressure, shock a r r i v a l times vere measured as a function of distance along the tube axis and from the slopes and intercepts of the curves (Figure 5) the parameters A = 0.512 x and n - 1.5 vere obtained (ef., Equation (2)). a distance of about 13 cm from the arc section (26 microseconde a r r i v a l time), an effect ive of 1.15 vas calculated. (Because the value of n obtained vas the t .heoreticaf one, i t vas possible t o calculate the energ,ies per un i t area of shock front by d i f f e ren t i a t ing Equation (1) and forming + R R a . For breakdown voltages of 10 t o 18 kv, the r a t i o of t h i s energy t o the condenser energy proved t o be very nearly constant (Table IY), thus lending fu r the r support t o the v a l i d i t y of the blast wave treatment). Using l i t e r a t u r e values f o r the other quant i t ies i n Equation (7a), B turned out t o be 0.322. KtPof Equation ( 8 ) came out 26.6. integral of Equation (8) could be approximated by:
For
Taking Ea - 93 kcal (a reasonable value), Taking a t i m e spread of 10 microseconds, the
Duringthisperiod about 1% of the methane was converted t o other products (ef., Figure 6*); hence, from Equation (7)
(5) ,o / Y , b - -
This r e su l t fo the frequency f ac to r is i n remarkably close agreement with Xeath and Revorkian'b1.32 x 1014, considering the d r a s t i c approximations made. The e r ro r i n .E is probably about 2 orders of magnitude.
many be t t e r methods a r e available@ W e have included t h i s example only t o i l l u s - t r a t e the consistency of the descr ipt ion of the phenomena observed.
We do not recormnend t h i s pro edure f o r the determination f o r reaction kinet ics ;
+The maximum i n t h i s f i gu re is probably caused by shock wave ref lect ions. Their e f f ec t s have been removed i n the above estimate.
As s a i d at the outset, the purpose of t h i s paper was t o i l lus t ra t ' e a technique r
€or the study of high temperature reactiona. Accordingly, we have refrained from presenting many data obtained on s p e c i f i c reactions, especial ly s ince ve have not
1 I
,i yet arr ived a t def ini te conclusions. For example, our obtaining more carbon i n the pyrolysis of methane than i n t h e pyrolysis of paraff ins of higher molecular weight under otherwise equal conditions cou favor of Por te r ' s theory of carbon formati&' For, i f acetylene is a necessary intermediate vhose rapid polymerization leads t o carbon, a s Porter asser ts . then molecules containing C2 linkages would have a better chance of forming carbon. Much more evidence is needed t o eupport o r r e j e c t t h i s speculation,
To obtain quant i ta t ive information, we recently inser ted a diaphragm i n t o
I a l s o be regarded as evidence in
,
1
I the shock tube. sect ion e l e c t r i c a l l y heated by the a rc didcharge. conventional shock tube by t h e higher Mach numbers and by the poss ib i l i ty of re f lec t ing primary shock f ronts a r r iv ing a t the tube 's end as rarefact ion ra ther than compression waves (becanse of the great temperature difference i n the two chambers a t the time of diaphragm rupture). A method of " ta i lored interface" by adjust ing tube length is thus made available. l a t e r carmmunication.
It thus became a "conventional" tube, with the high-pressure k However, it d i f f e r s from the
This work w i l l be the subject of a
53. BBPERENCES
Der LLgobian, B., and Lifschi tz , L.:
Fowler, R. G., e t 81.: Phvr. Bcv.88, 137 (1952)
Fowler, R. G., and Seay, G. E.:
Click, E. S., Squire, W., and Hertzberg, A.: p. 393, Reinhold, New York, 1955.
Greene, E. F., Taylor, R. L., and Patterson, W. L., Jr.: 238 (1958)
Harris, E. G.: NBL Report 4858, October 1956.
Heath, E., Kevorkian, V., and Boudart, M.: Presented before Division of Indus t r i a l and Engineering Chemistry, American Chemical Society, Boston, April 1959; J. Phys.Chem. 66, 964 (1960)
Kash, 5. ii., Magnetohydrodynamics, p.89, Stanford University Press, 1957
Kolb, A. C., Magnetohydrodynamics, p.76, Stanford University Press, 1957
Colnptes Rendus 248, No. 19, p. 2734 CHaY 1959)
Proc..Oklahoma Acad. of Sci. 35, 111, (1954)
5 t h Int . Spp. Combustion,
JShPic.Chem. 62,
Lauer, J. L.: No. 3., p. 138 (March 1959)
Liepmann, 11. W. and Boshko, A.: New York, 1957
Porter , G.: W i l l i a r n e & Wilkina, Baltimore 1952
Sedov, L. 1. : Press, N e v York 1960
S la t e r , L. J.: Press, 1960
Taylor, G. I.:
Bulletin of the American Physical Societx, Ser ies 11, VoL. 4,
Elements of G a s Dynamice, p.65, Wiley,
AGABD M e m o AG 1 3 h 9 (1954); 4th Symp. Combustion, p.248,
"Similari ty and Dimensional Methods i n Mechanics", Academic
"Confluent Hypergeometric Functions", Cambridge University
Proc. ROY . SOC. London A201, 159 (1950)
54.
TABLE I
Composition of Gas Uixture Besulting from Passage of Ser ies of Shock Waves through Methane
18 kv. Breakdam Potent ia l S t a r t i ng Pressure: 6 0 mm Hg
Composition i n Percent by Volume Original After 1 Shock After 5 Shocks After 20 Shocks
Magnetic Driving --- Constituents
E2 CHq c24i c284 C2H2 di-C2H2
(= 4%)
100 --- --- --- --- Final Pressure 6 0
Arrival T i m e a t 670 Tube's End (p sece.)
Pes
6.1 92.6 0.2 0.2 0.9 ---
63
665 '
TABLE 11
Pes
25.0 70.6 0.1 0.6 3.6 0.1
70
640
Yes NO
50.9 42.0 36.6 51.4 0.4 0.3 1.7 1.4
10.0 7.5 0.4 0.2
89 76
590 -
Effect of I n i t i a l Pressure on Product Distr ibut ion of Pvrolpzed Methane
Composition a f t e r 20 Shocks of 18 h. Breakdown Potent ia l
I n i t i a l Pressure. Percent by Volume Constituents - 20 - 60 120 nrm Efg
19.5 46.7 48.9 =2 2 61.2 43.6 26.6
5.7 10.5 16.6 (3 C2%
55
Bffeot of Bydrogen on Pyrolpaio of Methane at Constant Total Pressure
18 Inr. Breakdm Potential
iEU2 48.6 60.7 54.3
26.0 19.6 18.3 4.2 21.4 26.3
2.8
Constituents No Initial E2 u u 2 a 4 C2B2 c2B4 C 7.5 6.8
TABLE IV
Shock Arrival Times in.Methane at 25 cm Distance a8 Functions of Breakdawn Potentials
Dayton 7, Ohio Monsanto Chemical Co., Research and Engineering Division,
INTRODUCTION
Since i t s invention by Glick, Squire and Hertzberg ( l ) , the s ingle-pulse shock tube has been adopted by many inves t iga to r s f o r chemical k i n e t i c s tud ies , so that i t i s rap id ly developing i n t o a standard laboratory too l . I n t h i s type of shock tube a sample o f gas can be heated rap id ly , held under known temperature and pressure condi t ions f o r a known time i n the range of 0.1 t o 10 mil l iseconds, cooled rapidly, and then removed f o r ana lys i s . Optical and o ther measurements can be made on the gas during the hea t ing t i m e . I n e a r l i e r shock tubes gas samples of known h i s t o r y could not be recovered. It is undoubtedly the a b i l i t y t o recover samples of reac ted gas t h a t has made t h i s type o f tube so popular w i t h chemists, along w i t h the f a c t that the shock tube i s one of the few techniques f o r obtaining e n t i r e l y homogeneous reac t ion data.
This paper i s a review of recent shock-tube work as i t appl ies t o the pyro lys i s of these simple hydrocarbons.
EXPERIMENTAL
Our shock tube i s showri schematical ly i n Fig. 1. It was made of . 3-inch s t a i n l e s s s t e e l pipe, the reac t ion sec t ion being 12 f e e t long and the d r i v e r sec t ion ad jus tab le i n l ength between 6 and 28 f ee t , so dwell times up t o 15 mil l iseconds could be obtained with helium d r i v e r gas. Ths surge tank had a volume of about 50 cubic f e e t .
For measuring the incidenc shock speed, two SIN pressure t ransducers spaced 55 and 7 Inches from the downstream end were used (a and b, Figure 1). s t a r t and s top a microsecond timer, and a l s o t o s ta r t two osc i l loscopes . One of these measured the pressure by means of a t h i r d SIN gauge, c, 3 inches from the downstream end, (see Figure 2) while the o ther measured the output from a photocel l , d, mounted outs ide a window i n the silde o f t he shock tube, a l s o 3 inches from the end ( see Figure 3). Di rec t ly opposite the photoce l l window was a small tube leading t o a quick-opening valve, e, from which samples o f gas could be drawn f o r ana lys i s .
Gas samples were analyzed before and a f te r reac t ion by a vapor chromatograph. I n s p i t e of the f a c t t ha t the d r i v e r gas was i n d i r e c t contact w i t h the sample during the experiments, no more than 5% d r i v e r
The amplif ied s i g n a l s from these were used t o
60.
a b e SURGE n eact ion Section
- ,%Diaphragm
k z in
FIG. I. Schematic Drawing of Shock Tube
i 2 3 4 . 5 6 7 8 9 I I I I I l i m e --MillisecoAds I l l I
FIG. 2.
Time --Milliseconds
' FIG. 3.
TYPICAL PRESSURE RECORD TYPICAL PHOTOMULTIPLIER RECORD
61.
gas Was found i n the r eac t an t gas a f t e r the runs, and i n most cases the amount was l e s s than 1%. As would be expected, the longer time runs showed the g r e a t e s t contamination.
In a t y p i c a l run, a l l s ec t ions of the shock tube were f i rs t evacuated, and then the sample and d r i v e r gases were added. Since the " t a i lo red in t e r f ace" technique (1) was used t o give a pulse of uniform temperature, small amounts of ni t rogen were usua l ly added t o the helium d r i v e r gas, t o match i t with the sample and pressure r a t i o . by the plungers g and h operated by the a u x i l i a r y shock tube i, and a sample of gas taken f o r ana lys i s a few seconds later. The osc i l l o - scope t r aces were recorded w i t h Polaroid cameras.
r e f l ec t ed shock wave technique. They foun'd t ha t the most near ly i d e a l condi t ions f o r k i n e t i c s tud ie s occurred when the sample gas was near ly a l l monatomic, while diatomic gases could be s tud ied with some accuracy if measurements were taken near the end w a l l of the shock tube. With polyatomic gases, per turba t ions i n the r e f l ec t ed shock wave due t o boundary l aye r i n t e r a c t i o n s were so grea t t h a t temperatures could not be ca lcu la ted w i t h any accuracy. Polyatomic gases such a s hydrocarbons must be highly d i lu t ed wi th a monatomic gas such a s argon t o give reasonably i d e a l conditions, and a l s o t o reduce the average spec i f i c hea t of the sample gas t o permit hea t ing w i t h reasonable driver/sample pressure r a t i o s . It seems t o have been s a t i s f a c t o r i l y demonstrated (3 ,4) t h a t i f these condi t ions are f u l f i l l e d , gas temperature ca l - cu la ted by the standard methods (5,6) a r e accurate t o about 2$. However, we have found that i n many runs the pressure, while coming t o near ly the t h e o r e t i c a l value just, behind the shock wave, subsequent- l y f l u c t u a t e s f o r reasons w e do not qu l t e understand. t he ca lcu la ted temperature by assuming tha t these f luc tua t ions cause temperature changes according t o the standard i s e n t r o p i c equations, and f e e l t h a t these corrected temperatures a r e more accura te than uncorrected ones. Temperatures were a l s o corrected f o r heat of chemical reac t ion .
The two diaphragms f were then ruptured a t the proper times,
Strehlow and Cohen ( 2 ) have published a discussion of the
We have corrected
RESULTS AND DISCCSSION
Methane. The r a t e of methane decomposition has been s tudied i n th ree very s i m i l a r s lngle-puise shock tubes by d i f f e r e n t i nves t i - ga to r s (7,8,9). There is agreement t h a t the reac t ion is f i r s t - o r d e r i n methane concentration, and t h a t there is l i t t l e i n h i b i t i o n of the reac t ion by products i n the temperature range s tudied . The first- order r a t e cons tan ts a r e shown i n Figure 6. On t h e whole, agreement among the three s e t s of da ta is reasonabley and though the ac t iva t ion energies ca lcu la ted , 85 Kcal. ( 7 ) , 93 Kcal. (g), and 101 Kcal. (8 ) , d i f f e r , t h i s may w e l l be due t o experimental e r r o r . ac t iva t ion energ ies r equ i r e s an unreasonable value of the frequency f a c t o r t o give the observed r a t e s . While the lower ac t iva t ion energies seem t o f i t i n b e t t e r with da ta obtained by o the r methods a t lower temperatures ( l O , l l ) , the p o s s i b i l i t y remains tha t some heterogeneous reac t ion occurred I n t he lower-temperature experiments, desp i t e the inves t iga to r s ' bes t a t tempts t o avoid it.
Figure 5 shows the product d i s t r i b u t i o n i n the pyro lys i s o f methane fo r ;hea t ing times of 1.5 mil l iseconds a t d i f f e r e n t tempera- tures , i n terms of moles of each product formed p e r 100 moles CIQ decomposing. Experiments a t longer times show r e l a t i v e l y more C2H2
None of these
... ....
62.
h
I
,
, suggesting that C2H6 i s an unstable i n t e r - y s i s thus seems t o occur stepwise
CHl+ + C 2 H 6 -+ C2Hq + C2H2 -+ C (1)
has a very shor t l i f e t ime a t high temperatures. although the C 2 There i s a on between the product y i e l d s of Figure 5 and the thermodynamic equi l ibr ium da ta of Figure 4, which shows the r e l a t i v e s t a b i l i t y of each molecule as a funct ion of temperature, the species appearing h ighes t on the graph being most s t ab le . These da ta a re taken from the NBS t a b l e s (12) although a very s i m i l a r graph was made e a r l i e r by Kassel (13). reac t ion i s confirmed by comparison of these two Figures, and C H4 show up more prominently i n Figure 5 than would be expecte from fhe equLlibrium curves o f Figure 4 alone.
The mechanism of conversion of C H 4 t o C2% is s t i l l unse t t led . Largely on the b a s i s of our observed a c t i v a t i o n energy of 101 Kcal., we have prefer red the series of r eac t ions
The stepwise na ture of the pyro lys i s
since c27i
CH4 -* CH3 + H ( O H ~ 1 0 1 Kcal.) (2)
(3)
XH3 -* c2H6 (4)
CH4 + CH2 + H2 ( ~ ~ - 8 5 Kcal.) (5)
(6)
2 c ~ 3 -+ ~ 2 % (7)
H + CH,!+ + CH3 + H2
On t h e o ther hand, Kevorkian and eo-workers ( 9 ) have prefer red the reac t ion sequence
CH2 + C Q -* CH3 + H
because it agrees b e t t e r with t h e i r lower observed a c t i v a t i o n energy. These two reac t ion sequences both give first order k i n e t i c s w i t h "cha in length" of two, and i t w i l l r equi re e i t h e r some s o r t o f d i r e c t observation on the r eac t ing gas, or very accura te k i n e t i c measurements, t o decide between the two.
Ethane. Pyrolysis of ethane has f o r some t i m e (14) been t h o u g h m o c c u r by a f r ee - r ad ica l chain mechanism, as follows:
C2& -+ 2CH3 (8)
( 9 ) CH3 + C2Hg -+ C2H5 + CH4
C2H5 -* C2H4 + H H + C2H6 + C 2 3 + H;!
(10)
(11)
(12)
(13)
2C2H5 -+ C 4 H l o or C2H4 + C2H6
H + C2H5 -* C2H6 or 82 + C2H4
A number of shock tube experiments (15) have given f u r t h e r ve r i f i ca - t i o n of t h i s reac t ion scheme. Shane (16) f o r example found a t lower temperatures) t h a t one mole of
It has been found ( a s S teac ie and
64.
cH4 is produced f o r each 20-25 m o l e s of (22% i n the first s t ages of pyro lys i s . As pyrolysis proceeds, the r a t e constant f a l l s o f f t o less than a t en th of i ts o r i g i n a l value, and the f r a c t i o n of methane produced increases markedly. Ethane pyro lys i s is st rongly inh ib i t ed by methane, a s would be expected from the above f r e e r a d i c a l s t eps and reac t ion 3. Inhibi t ion by C €Q a l s o occurs. Quant i ta t ive ca lcu la t ions were made by using rate consEants f o r the f r e e r a d i c a l react ions der ived from various sources (and some es t imates) which showed , t h a t these experimental observations should be expected from the above mechanism. Finally, w i t h the assigned rate constants, the experimental results o f several i n v e s t i g a t o r s could be reproduced over a wide range of temperatures, as shown i n Figure 7.
From a s e r i e s of experiments i n a flow r e a c t o r i n which ethane has been pyrolyzed i n the presence o f a small amount of radioact ive methane, Brodskii and co-workers (17) have concluded t h a t the above chain react ion i s not the m a i n one i n the temperature range of n o - 8 9 0 ' ~ . We are n o t a l t o g e t h e r satisfied w i t h the i r i n t e r p r e t a t i o n of t h e i r experimental data, and a r e making ca lcu la t ions t o see if t h e i r observations can be interpreted i n teras of the chain mechanism.
900 a&; (18) show that t h e r e a r e two major react ions, one t h e formation o f acet lene, which is a f i r s t - o r d e r react ion w i t h a n a c t i - vat ion energy o f k Kcal. over t he upper p a r t o f the temperatui-e range, t h e o ther the formation of 1,3-butadiene, which is second- order w i t h an ac t iva t ion energy o f about 25 Kcal. Butadiene formation is, of course, favored a t low temperatures and high pressures, and acetylene a t high temperatures and low pressures . Acetylene formation has been most thoroughly s tudied.
a moiecular one i n the c l a s s i c a l sense, without t he formation of free radfcals . The most d i r e c t evidence f o r t h i s i s t h a t the Arrhenius rate equation holds all the way from 2 t o 95% ethylene decouposition, while f o r a chain reac t ion the r a t e should f a l l off a t high conver- s ions. Moreover, t h e product d i s t r i b u t i o n (almost a l l hydrogen and acetylene a t h igh temperatures and low pressures) remained the same up t o 95% decomposition. t i o n is j u s t s l i g h t l y more than the hea t of react ion (44 Kcal. a t 1500'K.) (i2), and w e have not been able t o t h i n k of a f r ee - r ad ica l mechanism which would give t h i s ac t iva t ion energy.
Experiments with an ethylene-acetylene mixture show tha t butadiene i s not formed by react ion o f e t h y l e n e wi th product acetylene, but comes more d i r e c t l y from ethylene, e i t h e r by a s t r a i g h t bimolecular reaction, or perhaps through dimerization t o butylene followed by loss of hydrogen. No butylenes were found, so they a r e unstable intermediates if they form a t a l l .
E t h lene Shock tube s t u d i e s on ethylene pyrolysis between
In con t r a s t t o ethane pyrolysis , th i s react ion does seem t o be
Eie a c t i v a t i o n energy f o r acetylene forma-
Acet lene. Pyrolysis o f acetylene has been studied i n shock
between 900 and 2000°C. There i s agreement t h a t the o v e r a l l react ion i s second-order, and the observed r a t e constants a r e about the same. Acetylene i s qui te stable a t high temperatures, compared t o ethane and ethylene. The only d i f fe rence i n the t w o s e t s of da t a i s t h a t we found vinylacetylene and hydrogen t o be . the major pyrolysis products, while Greene found diacetylene t o be a more important product than vinylacetylene. !The l a t t e r compound seems without doubt t o be the
tubes + y G r e e n e , Taylor and Pat terson (19) and by the author (20),
65
Y
0, -2 3
Q -Kemrkion et al (9) a -Skinner 8 Ruehrwein ( 8 ) x -Shantorovich 8 PaVlOV ( 1 1 ) 0 - Kassel (10)
X
X
X
0 X
0 -4
0 0
-E
4 I I I I I
7 8 9 10 5 6
IO~IT, OK
FIG. 6 . Rate Constants far Methane Pyrolysis
66.
,399 ')I 607 I-
!
L
P
3
, I
,
, I
\
1
a
f i rs t Pyrolysis product o f acetylene i n t h i s temperature range, s ince it appears a t low conversions before any hydrogen i s observed. subsequent s t eps have not been defined, but probably involve f u r t h e r polymerizations and condensations t o produce benzene and condensed aromatic compounds which eventual ly may be thought of as carbon, a s discussed by Smith, Gordon and McNesby (21). These pyro lys i s products intermediate between acetylene and carbon ca ta lyze the decomposition reaction, so t h e r a t e increases a s decomposition proceeds. When hydrogen was added t o the acetylene, butadiene rather than vinyl- acetylene was formed, and the o v e r a l l r a t e of acetylene decomposition was l e s s than i n the absence of hydrogen. That i-s, hydrogen i n h i b i t s acetylene decomposition by converting r e a c t i v e vinylacetylene t o r e l a t i v e l y unreactive butadiene.
In conclusion, shock tube s t u d i e s have added much t o our understanding o f t h e high temperature pyro lys i s r eac t ions of these simple hydrocarbons. On the o t h e r hand, many i n t e r e s t i n g problems remain t o be solved.
The
68.
R E m C E S \,
(1) H. S. Glick, W. Squire and A. Hertzberg, F i f t h Symposium ( In t e rna t iona l ) on Combustion, 1954, p. ,393
(2)
(3)
R. A. Strehlow and A. Cohen, J. Chem..Phys. 30, 257 (1959)
G. B. Skinner, J. Chem.. Phys. 2, 268 (1959) '
(4) T. A. Brabbs, S. A. Zla tar ich , and F. E. Belles, J. Chem. Phys. -' 33 307 (1960)
(5)
(6)
G. Rudinger, Wave Diagrams for Nonsteady Flow i n Ducts, Van Nostrand, New York (1955)
G. H. Markstein, ARS Journa l 9, 588 (1959)
(7) H. S. Glick, Seventh Symposium ( I n t e r n a t i o n a l ) on Combustion, 1958, P. 98
(8) (9) V. Kevorkian, C . E. Heath and M. Boudart, J. Phys. Chem. 64,
G. B. Skinner and R. A. Ruehrwein, J. Phys. Chem. 63, ,1736 (1959)
964 (1960)
L. S. Kassel, J. Am. Chem. SOC. 54, 3949 (1932)
- (10)
(11) P. S. Shantarovich and B. V. Pavlov, Zhur. Piz . Khim. 30, 811 (1956) - (12) National Bureau of Standards, Selected Values o f Chemical
Therhodynamic Proper t ies , S e r i e s I11 (1947)
(13) L. 5. Kassel, J. Am. Chem. SOC. 55, 1351 (1933) (14) E. W. R. Steacie, Atomic and Free Radical Reactions, 2nd ed.,
Reinhold, New York (1954)
(15) G. B. Skinner and W. E. Ball, J. Phys. Chem. 64, 1025 (1960)
(16) E. W. R. Steacie and G. Shane, Can. J. Res. s, 203 (1940)
(17) A. M. Brodskii, R. A. Kalinenko, K. P. Lavrovskii and V. B. Titov, Russian J. of Phys. Chem. Nov. 1959, p. 474 (Russian p. 2457)
(18) G. B. Skinner and E. M. Sokoloski, J. Phys. Chem. 64, 1028 (1960) - (19) E. F. Greene, R. L. Taylor and W. L. Patterson, J. Phys. Chem.
62, 238 (1958) (20) G. B. Skinner and E. M. Sokoloski, J. Phys. Chem. 65, (1961)
{21) A. S. Gordon, S. R. Smith and J. R. McNesbg, Seventh Symposium
(22)
(23)
- ( In t e rna t iona l ) on Combustion, 1958, p. 317
H. G. Davis and K. D. Williamsod, F i f t h World Petroleum Congress, Section m, Paper 4, 1959
L. Kuchler and H. Theile, Z. physik. Chem. B2, 359 (1939)
F
'.
' ,/
69
S= E. Bauer, R. E. IMP, M. Cowperthwaite, and W. Tsang Department of Chemistry, Cornell University, Ithaca, New York
and lilJniversitg of California, Los A l m s Scientific Iaboratory,
Los Alamos, New Mexico
During the past seventy-five years, numerous experiments have been performed on the mTolysis of hydrocarbons, of both low and high molecular weights. In reports describing these investigation$, there are listed a large variety of products so obtained. It was readily demonstrated that the pyrolytic processes are very complex, Involving numerous inter- conversions of the hydrocarbons. The rates of decomposition of the initial material and that of the production of the host of products depended on many factors. used for the kinetic studies. In the flxed-volume experiments, the material was subjeoted to modest temperatures for relatively long con- tact times. h?essure changes were noted, and after quenching the residues were analyzed. Somewhat later, flow techniques were intro- duced, and the operating temperatures were raised to the neighborhood of 1000°K. with a corresponding decrease in contact time. Along with the inherent analytical difficulties due to the complexity of the reac- tions, there appeared a disturbing problem. Both In the fixed-volume and the flow through a hot tube experiments, the heterogeneous reactions induced by the heated walls could not be readily separated from the homogeneous reactions w N c h were of primary interest. Also, the gas samples could not be uniformly heated due to limitations on the rate of heat transfer from the walls. It has been generally established that the decomposition is initiated by rupture of carbon-hydrogen and carbon-carbon bonds. The radicals thus produced initiate chains which produce the complex mixture of products. in numerous papers and b 0 0 k s ~ ~ ~ ~ ~ .
The chemioal properties of the radicals produced In the pgrolytic reactions are not only of direct interest to those concerned with the behavior of Organic compounds but also constitute essential information to those who would analyze the course of the hydrocarbon decomposition. During the past twenty years, much effort has been expended in the study of gaseous radicals. Generally, these have been producgd by photochemical dissociation of selected gases; their c,hemical properties have been deduced from the subsequent reaction of the radicals with the ambient gas. cable range In radical type, temperature, and m e d i ~ m . ~ , ~ r ~ r ~ via photochemical processes is often limited by the light intensity available, so that the concentration of radicals generated is q[uite small, Use of intense photoflashesars and electrical discharges10
Two general types of techniques have been
Further details may be found,
These techniques have been extended to cover an appre- Production
-
70- permits the production of appreciable concentrations, We thus-antici- pate extended current activity in the investigation of the chemical properties of radicals, Were this information available now, it would mitigate but not solve the pgrolysis problem, since it is abundantly clear that the pyrolytic processes in hydrocarbons exposed to tempera- tures of 1000OK. or below are complex because many competkng rates are involved.
I
During the past decade, a new technique has been developed, the utilization of shock tubes for chemical kinetic investigations. The upper temperature range i s easily extended to about 500OOK.' Shock tube heating has the added attractive features that the gas is homogeneously and rapidly heated to a uniform temperature (in less than a microsecond) and the reactions occur so rapidly that there i s no time for conRzsion by a heterogeneous process which may occur on the walls. temperature pulse, the time required to attain a temporary state of equilibrium mag be 100 microseconds to severalmllliseconds. Hence, these kinetic studies requlre the development of specific analytical methods, which have microsecond resolution. avoids the necessity for such rapid and specific analytical procedures. The shocked gases are rapidly quenched after a selected dwell tlme of (1-5) milliseconds and the residual gases analyzed by conventional techniques. The quench rates obtained, (14) x 1050K./sec., are barely adequate for terminating those steps in the complex mechanisms which have appreciable activation energies. Atom abstractions, free-radical
product' distributions which have been reported must be Fnterpreted with c a r e . f 2 ~ r 3 ~ 1 4 ~ ~ 5 ~ 1 a ~ L ~ ~ L ~ ~ ~ s As an example, one may cite the range of *first-ordert decomposition rate constants reported f o r the pyrolysis of methane. activation energy of 79 kcal.*O; then in succession, shock tube values L
(for the temperature range L200-2100°K.) were reported which ranged from 85 kcal.14 to 93 kcal.lT to 101 kcal.l6 in the magnitudes of the rate constants (factors of 3 to 5), such that were one to draw the best straight line through all the shock tube data the deduced activation energy would be about 104 k c n a preslimed that the primary step produces C& radicals, and the product distribution followlng the quench depends on the height and width of the temperature pulse to which the methane was subjected; the amount of acetylene increases with a rise in temperature, the yield of ethylene passes through a maximum, and ethane is found in small amounts only.
During a
The slngle-pl,tlse technlquell 1
4
rearrangements, and recombinations continue, Hence, the interesting 1
The early hot tube experiments at around 1000°K. gave an
There were differences I
1
The higher hydrocarbons, although studied in many laboratories, have not been as extensively investigated as methane. A shock tube pyrolysis of ethaneL8 (1059-1410°K.) indicated a decomposition rate which was first order in the reactant, with an activation energy of 60 kcal. The primary step is presumed to be the fission of the G-C bond to produce two C&ts, This is followed by a sequence of free- radical reactions. There are a number of serious loopholes in the proposed mechanism, not the least being that the proposed rate constant for the dissociation of ethane is inconsistent with the measured rate constant for the association of two methyl radicals."l found after the quench were ethylene, acetylene methane, hydrogen, and some 1,3-butadiene. The pyrolysis of ethyleneLe was similarly investi- gated; acetylene and 1,3-butadiene were the principal products, the acetylene being formed via a first-order step with an ~ activation
I
The products
I
I
7 1 energy of approximately 46 kcaL., while the butadiene was generated Via a net second-order reaction. The proposed mechanism i s that CZL - C2&* 4 c2H2 + H2.
The large variety of products and the often conflicting conclu- sions deduced from different experiments suggest that the reported differences are not due to poor technique; rather, they reflect the Sensitivity of these studies to different experimental conditions. Since the pyrolysis reactions follow very complex mechanisms, small differences in experimental parameters selectively favor different controlling steps, and the differences in rates and product distribu- tions are thereby considerably amplified. corroborated by our studies of the C/H system.
In the experiments performed in our objqctives has been the search for conditions under which the pyrolytic Process may prove relatively shple. It was presumed that the higher the temperature the simpler the species which must be considered. In our study of the pyrolysis of ethylene over the temperature range 3000- 400OoK., we followed spectrophotometrically the changes which occur in the gas. Timewise, the method has adequate resolution, but it is not sufficiently distinctive to permit identification of many of the species which nonetheless are present under these conditions. Principally, we used the characteristic absorption by C2 as a means of determining its population in the v = 0 vibrational state of the electronic state. Two postulates were made in setting up this experiment. (a) With regard to translation, rotation, and vibration of all the molecvlar species involved, equilibrium is rapidly attained in the shock front, in a time small compared to the changes in concentration of C2, and (b) carbon even at the end of our observation time (which i s of the order of 1 milliseo.). reported by Kistiakowsky and confirmed in other lab~ratories~~.
kinetics which may be operative by ascertaining the equi-librium com- positions of systems contalnlng ambon and hydrogen which are being approached through. the involved kinetic processes. of molecular fragments whioh are conceivable i s enormous, the equilib- rium compositionmay serve to point to those species which are present in appreciable goncentrations as the dominant ones in propagating chains. One might anticipate that in the long history of the etudy of hydro- carbons such computations would have been made. been described r e ~ e n t l p ~ r ~ ~ , and in neither did the authors consider the f h l l range of species required to provide an adequate analysis. Furthermore, in the more general computations described by Kroepelin and Wintee*, questionable values were used f o r the thermodynamic func- tions of those species which were included.
This point of view has been
one of the
equilibrium is not attained with regard to the precipitation of
The latter may be justified on the basis of data
The computations described below provide a gllmpse of the complex
Since the variety
Only two attempts have
KINETICS OF PRODUCTION OF C2 FROM ETHYLENE Shock tube studies reported below were made in a conventionally
The driver length was The driver gas (hydrogen)
The driven gas consisted of a he impurity level in the
instrumented shock tube, 1-1/21' in diameter. 35.51 1 , and the sample section was 129.311. ranged In pressures from 5 to 15 atm. mixture of 92% argon and 84 ethylene.
72.
ethylene as established by mass spectrometric analysis was less than 0.4%. It was par t icular ly deskab le i n these studies t o avoid con- tamination by oxygen; we estirriate that the oxygen impurity was less than 0.1%. Shock speeds of the forward-moving wave were measured by means of narrow platinum film gauges supported on pyrex rods mounted f lush w i t h the inside of the shock tube. These speeds ranged from 1.30 t o 1.55 mm. p e r microsecond.
A schematic of the experlmental arrangement is shown i n Fig. 1. To record the changes in the absorption spectrum of the sample which had,been subjected t o a shock, two types of configurations were used. In the f i r s t , a continuum of wave lengths was generated by discharghg a condenser (1.0 e, 10 KV) through a small quartz tube through which argon was flowing at a pressure of approximately 50 IIIIIL produced an intense emission wNch In i t ia l ly rose sharply and f e l l t o half of the peak in tens i ty i n about 10 microseconds. The l i g h t which passed through the shocked gas w a s picked up by a m o r and sent t o a grating spectrograph (Fig. 1, right corner) in which a camera was sub- s t i t u t e d f o r the photomultiplier tube. By delaying the source tr igger pulse, the argon gontimum was generated a t predetermined times a t e r passage of the re f lee ted shock past the observation ports. The trans- mission spectra were then photographed ( a t 16 A' per millimeter dispersia over the range A3900 t o A 6000, thus providing a record of the absorp- t i o n Intensi ty as a funct ion of wave length a t specified intervals a f t e r i n i t i a t i o n o f the reaction. The photographs show a general absorption which is f a i r l y uniform over the longer wave lengths but increases rapidly helow some c r i t i c a l wave length which depends on the time interval, Upon this background, there w a s c lear ly superposed a well developed Swan band system. As far as we can t e l l , no measurable
'absorption due t o C3 was discernable a t h 4050, although there are indi- cations f r o m preliminary experiments that a small amount of absorption due t o tNs species did appem during the higher temperature m.
To study the r a t e of appearance of C2, a character is t ic source was placed a t the posi t ion indicated i n Fig. 1. The l igh t was s p l i t w i t h a half-silvered mirror, s o that the JAco monochromator phototube monitored the intensi ty of a small wave length in te rva l near 15165, while the small grating spectrograph w i t h the phototube attachment monitored the intensi ty of the mercury line a t 15460. The character- i s t i c source was generated by a discharge of a 2 pf Condenser a t about 12 KV through a tube f i l l e d w i t h butane, helium, and mercury. The out- puts of the two 1P28 photocells were led to a 100 KC e lec t ronic switch, so that the re la t ive absorption by the shock sample of the- two charac- t e r i s t i c emission regions was displayed on one oscilloscope record. The op t ica l window w a s 0.5 A' wide and set a t the band head of the (0,O) band of the 37r ct 37ru t r ans i t i on f o r Ca. The percent absorption recorded in tds manner is thus a measure of the population of the C2 species present i n the zero vibrational leve l of the 37r Because a conthuwn absorption is superposed on the character is t ic absorption, a correction f o r the former should be made. It was convenient to moni- t o r the background absorption a t the A5460 mercury line. introduced by the displacement of 300 Ao is of secondary si@;nificance, since the essent ia l kinetic data were derived during the induction period, when the background absorption w a s negligible. Since the populations of the lower states f o r these lines change with the tempera- ture, a correction was made in reducing the percent absorption to r e l a t ive concentrat ion.
This
state.
The e r ror
A
I
f
In> ,
i7
i
I
73. Fig. 2 i s a sketch of a typ ica l reduced oscilloscope trace. The
s o l i d l h e is the in t ens i ty reqorded a t the C2 band head, and the dashed l ine i s that recorded a t the A5460 mercury line. features of these curves which w i l l be subjected t o analysis a r e ind i - cated in the figure. One may add that a f t e r the induction time T the W f e r e n c e between the dashed and s o l i d curve is very nearly constant f o r periods up t o one millisecond, indicating that a steady-state con- centration i n C2 was reached a t a time pr ior t o the-beginning of the C O n t ~ ~ absorption a t this wave length.
Although an absolute cal ibrat ion f o r the concentration of CZ is not available, since no rel iable f v'alue f o r this band i s known, one may nevertheless determine r e l a t i y e rates of production from the i n i t i a l slope of the oscilloscope trace. To deduce the order of the react ion f o r the production of Cz, d/dt (log IfI)' was plot ted vs. log p3 ( the density of the shocked gas i n the r e f ected shock r e g i o q . are consisten% w i t h a f i rs t -order rate of production of CZ ( w i t h respect t o p3) during the ea r ly stage of the pyrolysis.
The charac te r i s t ic
The data
It follows
The act ivat ion energy f o r the production rate constant kl may be obtained, as i n Fig. 3, from a p lo t of
vs. - 1/T.
The deduced value f o r the act ivat ion energy i s 68 f 10 kcal., obtained from the best visual ly estimated s t r a igh t l ine through a l l the points.
From t races such as Fig. 2, it was evident that a steactg-sbabe concent??atlon of CB was attained after a time varying f m - 0 microseconds. The approach t o a l imiting value (designated Dss) implies that some process removes Cn, eventually a t a rate equal t o that of pro- duction. It was demonstrated that the order of the scavenging reaction is close t o unity and thac the rate f o r removal of Ca proceeds w i t h e s s e n t b l l y zero ac t iva t ion energy.
oscilloscope traces. In Fig. 2, an induction time 7 ~ ) was defined as the first appearance of absorption, monitored a t t h e A5460 mercury line. This background absorption i s presumed t o be due t o large molecular-weight polyaromatic o r oonjugated high molecular fragments. W e infer from qua l i t a t ive observations that the length of the induction period decreases with decreasing wave length, and i n the u l t r av io l e t the background absorption can be detected even i n the incident shock region. With the passage of time, the edge of the intense absorption region shFfts toward the red, and the e n t i r e l eve l of absorption increases. We estimate from the t o t a l absorption curve recorded a t 300 microseconds af ter passage of the shock that the dominant species are polyaromatic nuclei which c o n t a h on the average four condensed aromatic rings o r t h e i r equivalent in the form of a highly conjugated polyene cha+ density appBars t o be constant f o r shock temperatures above 3000'K.
Attention is cal led t o another fea ture which a pears in the
The induction time multiplied by the ref lected shock
74.
POSSIBLE MECHANISM FOR THE FORMATION OF Cz Since the data have been gathered f o r the re f lec ted shock, the
question a r i ses as t o whether the incoming shock had processed the material with which the shock tube was f i l l ed . Between the passage of the incoming and re f lec ted shocks, no detectable quantity of C2 was generated, nor was there any absorption apparent in the visible. None- theless, the incoming shock had processed the ethylene and had produced some new products, since a small amount of absorption w a s detected in the limit of our working region i n the ul t raviolet . For the elapsed time (between the forward and ref lected shocks a t the posit ion of our observation port) of the order o f 300 microseconds, a major portion of the ethylene (perhaps as much as 80%) must have been converted t o acetylene plus hydrogen. T h i s estimate is based-on the f i r s t -o rde r rate constant fo r the molecular reaction c2& +C2&* --t C2& + &.lS
10 -150 l o g k2 = 8.87 - ,+
The resul t ing mixture i s then heated a second time by the ref lected shock t o symbol p3p i n the re f lec ted shock front.
roduce the following ' i n i t i a l ' composition (indicated by the A t t = 0,
wherein the mole f rac t ion of the argon (x,) by far dominates the magnitude Fn the bracket.
ance for C2 in the 3 ~ u s ta te , one might be tempted t o write Since our r e su l t s indicate a pseudo-unimolecular rate of appear-
C2& + X L- C2HzH + X Cp + HZ
However, this cannot be the process w e observe. In the f i r s t piace, the ac t iva t lcn energy expected f o r this s tep is 140 kcal., compared w i t h the experimental value of 70 kcal. conservation res t r ic t ions , the C2 which i s generated in such a step would of necessity be i n a lX s ta te , since both the reactant (acetylene) and the second product formed (H2) are i n s lng le t s ta tes . be that some acetylene decomposes in this manner t o produce C2 molecules i n the ground 'Xi state, but the collision-induced t rans i t ion t o the 3 ~ u s t a t e would be expected t o require many molecular encounters and take considerable time. s t a t e v i a a chain. reaction, that the over-all i n i t i a l produgtion r a t e was pseudo f i r s t order, and that during the subsequent pyrolysis a steady s t a t e was reached wherein the C2 was consumed as rapidly as it w a s produced. We shall propose a combination of reactions which form a chain for which one would ant ic ipate an act ivat ion energy of around 70 kcal.
Secondly, due t o the sp in
It may well
One must conclude that C2 w a s produced in the =IT
I \ I
'i
Qk
\
3
'1
, \.
n ! S
I
\
I
J \
I
Initiation:
H H H2+ -L 2 H ; t
Ebhamement of the carrier:
H +.Cz& CzH + H2
Propagationr
C2H + C& -4- C4H3 + C2
C& + C2H2 --F C4H2 f C2B3
75
AI$, Wal.
114.0
2..6
103. 3
1% 7
72.5
21.4
10.0
39.8 The controllLng activation energy in the propagation sequence should be of the order of 72 Wal., as estimated for AH& consistent with the observations made in o m laboratory and the data reported in the literature. However, it is evident that there are many ,other possible chains. Furthermore, there must be many steps involving the transfei- of H atoms which require small activation energiesj these reach a steady-state condition rapidly and in effect attain a local equilikrium. Bef'ore attempting to select between possible alternate mechanisns and an analysis of the details of the termination steps, we consider it worthwhile to answer the fundamental question: what is the composl.tion of the system toward which this kinetic condition is
This mechanism is
&Ut*?
ESTIMATION OF MOKLECULAR P.- OF C/E FRAGMENTS:
In our first attempt22 to compute the equilibrium composition of C/H systems at elevated temperatures, we considered 43 species. This and subsequent analysis showed that particularly for carbon-rich systqns the list was incomplete and that a second approximation was necessary. Therefore, it is our objective to estimate the heats o f formation and the molewlar parameters, such as the moments of inertia and vibrational frequencies, wfth dfiFient certainty to permit the computation of the thermodgnamie funptions in the ideal gas state as they depend on the temperature, for the large number of low-molecular weight species con- sisting of carbon and hydrogen. The temperature range we intend to oover is 500-5000°K. The species considered are listed in Table I. The molecular parameters and heats of formation were taken f r o m the literat& wherever available. A considerable amount of guessing was needed to eomplete the list. Estimates were made with the help of analogies, bond dissociation energies derived from kinetic data, and mass speatrometer appearance potentials, with due allowance f o r reso- MN: e s tabilizat Ion.
76 pl Table I, w e have also l i s t e d values for - the b a t s of fomtion.
Those shown in parentheses are based dfreatly on-experimental m e a m ments, w h e r e a s the ones e v e n , - square braqkets were estimated by means of an empirical theoa . Thus, experimental valrues which link two states (for example, CSHS -----c CJ + 3 H) were divided i n t o unit steps Cs& -+ CS& + H -b CSH + 2 H -+ CS + 3 H) on the basis of empiric & assignerl Parameters. deduction of structures and vibrational frequencies are given in detail elsewhere. 'how tenuous its basis 3.s by far a better approximation than the omission of that species from the computation, since the latter merely implies that an excessively large value has been a r b i t r a r i l y assigned t o its heat of formation. note t o Table I) w i l l become evident from the inspection of the compu%a- t ions and comparison of estimate& heats of formation for these species w i t h the corresponding isomers which were inauded. T y p i c a l results based on camputations of the equ3Xbrium compositiong f o r various C/k r a t i o s are presented In ,the followlag section, It can be shown that all the €somers of comparable stability must be included in the solutions of the simultaneous equations which g ive the composition a t equilibrium, Indeed, this is even so if the i s o m e r s have the same themnodgnamic funo- t ions i however, under this slmplFtying condition, a contraction can be made so that the sum of the qoncentrations of all the close- s3mihr isomers may be ohtalned by the nse of 811 effect ive equilibrium constant.
It is w e l l known that equlllbrium constants can be calaulated fw all possible reactions between any given s e t of species w h e n f o r ea& species the moments of inertia, symmetry number, eleptronic degeneracy, vibrat ional frequencies, the corresponding degeneracies, and heat of formation a t OOK. a re hown. constants are more sensi t ive t o qhanges in some of' the molecular parameters than others. Because of the i r welghtlng i n the pa r t i t i on function, the
.vibrat ional frequencies need be known o n l y roughly. It is also fortunate that for these C/H species one has t o consider a narrow range of inter- atomic distances, so that the ro ta t iona l contributions t o the par t i t ion f'unctions may be computed with acceptable accuracy. For many XQOleCUleS, the heats of formation may be estimated a t best t o w i t h i n several kilo- ca lor ies j consequently, this parameter exercises a maximum influence on the computations. However, fo r the high molecular-weight Species containing more than two hydrogen atoms, i t is not so sensi t ive a vari- able, because these fragments will be present i n very small amounts. Changes even inan order of magnitude in t h e i r concentrations w i l l have a negligible effect on the equilibrium amounts o f the prevalent spepies.
I n estimating the heats of formatLon, w e had t o postulate reason- able molecular structures and assign t o them electronic Configurations. Fu l l use was made of experimental values t o provide empirical bond dLs- sociat ion energies and correction fac tors ascribed t o o w e s in the basic configurations due t o hybridization, delocalization, and other nonbonded interactions. This procedure led to a Self-Comfstent set of values f o r the heats of formation, the interatomic distances, and the fundamental vibrational frequencies, number of cases, w e computed the enthalpy changes t o be expected fo r specified dissociations and compared them wlth experimentally available enthalpy increments for the -corresponding steps. For some W l e C U l a r fragmenfx, the heats of formation were estimated follow% independent paths and checked against each other.
The j u s t i f i ca f ion f o r this procedure and the consequent
It is essent ia l t o recognize that the best guessIno matter
The reasons for the omission of some speoies (foot-
It shauld be real ized that the equilibrium
To cheek this Procedure in a .
, - b
A n illustration of the procedures evolved for estimating heats of formation is the set of values deduced for crucial parameters in the C3 sequence. The changes in electron configurations associated with the successive removal of hydrogen atoms from propene to generate C3 are indicated in Fig. 4. Btperimental values are available for
D ( H C 5 C - M ) = 82.8 kcal.
Consider the first dissociation shown in Fig. 4. The observed value (78 kcal.) may be expressed as the sum (98 + a - y), where y = 23.1 kcal. denotes the energy gained by the nonbonded interactions present in the H2C-CH-C& radical. To remove the second hydrogen atom, one must expend 104 kcal. (ethylenic C-H) and y kcal. (stabiliza- tion energy) but regains a kcal. which leads to a BDE of 65.3 kcal. This compares favorably with 64.4 kcal. deduced by taking direct dif- ferences between experimental quantities. Similar arguments for the production of the C&-C:CH radical from methyl acetylene and allene lead to E = 20.5 kcal. and 8 = 22.8 kcal., respectively. These and other similarly deduced parameters were used to evaluate BDErs for analogous steps in the higher Cn sequences.
As a gauge of the reliability of this semi-empirical method, con- sider the reaction
The estimated value f o r its 4 is 143.8 kcal., compared with the experimental value of 143.0 kcal. For the reaction
the estimated @ is 135.6 kcal., while the experimental value is 136.5 kcal. The self-consistency of the method may be judged by comparing estimates cf the heats of formation of ragicals each en- erated via several independent paths. = 66.8,7.7, and 67.7 kcgl; for H22=C=CH2, (@f)est = 71.7, 70.8, 70.8, 71.7 kcal; for &C=C-C:H, (AEIof) e t = 103.9 and 101.1 kcal. Further examples are illustrated in Tabye II; the processes correspond to the steps illustrated in Fig. 5.
Thus, for H2C-CR=C=C&, ?@f) est
The compilation of bond lengths by Costain and Stoicheff27 for maw C/H cSmPounds shows that the C-C and C-H bond lengths for a given bond envFronment are remarkably constant in different molecules.
78.
Since we have postulated the electronic structures of the unknown species, jus t i f iab le estFmates of bond lengths-nd bond angles can be made by comparisons and interpolat ion with the known bond types l i s t e d by these authors.
Although it is well appreciated that in each normal mode a l l the atoms participate, the (311-6) unknown frequencies may be assigned t o a suf f ic ien t accuracy by subdividing the vibrations into classes associated primarily w i t h bond stretching, bond bending, and skeletal motions. Comparison of each vibration with a similar type i n molecules whose frequencies a r e knownled t o reasonable frequencies. We often assumed that many of t h e frequencies of a r ad ica l produced by the removal of a hydrogen atom w i l l be those of the parent molecule mlnus the frequencies associated w i t h the C-H bond broken, namely one C-H stretching and two C-H bending frequencies. The correlat ion of the frequencies of a rad ica l w i t h those o f i ts parent requires consideration of changes in some force constants and in the reduced masses. The hydrogen atom is so l ight that for most of the compounds i n Table I only changes in carbon a tom hybridization appreciably a f fec t the molecular frequencies due t o corresponding changes i n force constants. The dedused fre- quency change for C-C bonds follows from the assumed changes i n hybridization. Skeletal bending frequencies a re the most d i f f i cu l t t o predict, because they correspond t o motions involvbg the en t i r e molecule. However, these are usually o f the order of 300 cm'l, and errors in the pa r t i t i on funetions due to incorreqt estimates can be neglected because of the high temperatures involved i n the computation o f equilibrium compositions.
Less error is expected i n the estimation of C-H frequencies. The hydrogen atoms may be regarded as osc i l la t ing against an in f in i t e ly large mass; the vibrational frequency depends p r a c t k a l l y only on the force constant f o r the C-H bond and w i l l be approxlmately constant f o r species with t h e carbon atom i n a given s t a t e of hybridization.
from the l i t e r a t u r e wherever they were available, This was the case f o r the s tab le species in the low-temperature regime (up t o 150Q"K.). The numerical values a s given in the NBS tables were plotted on a large scale and twelve t o f i f t een values read between the temperature range 500-1500°K. nomial f o m
,
The f r e e energies, as dependent on the temperature, were taken
They were then f i t ted by l eas t squares t o the poly-
FG _- -HG RT = a (1 - an T) - bT - c/2 $ - d/3 $ - e/4 T4 - k
q .: .H; a + bT + cT2 + d$ + eT4 --€E---=
Since the same coeff ic ients appear in the expression f o r the enthalpy and f r ee energy, t h e magnitude of k may be computed f o r each teapera- me; the value used w a s the averaEe over the equally spaced temperature points. To obtain the corresponding f i t coefficients fo r the stable species over the upper temperature, the usual idea l gas, r i g id rotor, and simple harmonic o s c i l l a t o r approximations were made. The thermo- dynamic functions were computed following an IBM 704 code writ ten by
79.
L. R. Sitney26. The same procedure was followed for the unstable species; the computed functions were again least-square fitted to the indicated Polynonial form. suitable for the two ranges indicated. (the basis for decisions as to the nature of the ground electronic states, the presence and location of low-lying electronic states, cor- rections for internal rotation, etc.) will be presented in another publicat ion.
We thus have two sets of thermodynamic fit coefficients Details of the computations
EQUILIBRIUM C O M P O S ~ I O N S
In the computation of equilibrium compositions, we considered two cases. The first and most extensive set of graphs was obtained under the assumption that at the specified pressure and temperature equilibrium was attained for all the species listed, except with respect to the Presence of solid carbon. The second set of computations will be per- formed under the assumption of complete equilibrium including the Presence of solid carbon. Although the first case seems artificial, it is significant kinetically. Such a restriction correctly describes a situation in many shock tube and detonation experFmentsw (carbon- rich mixtures) during the intermediate stages of reaction. Since the precipitation of graphite (in highly irregular crystalline form) must await the prior formation of nuclei, the gaseous components attain a . pseudo-equilibrium which lasts sometimes for hundreds of microseconds before particles appear. The following ranges in parameters were covered: C/H = 1/10, 1/4, 1/2, 1/1, 1/l and 1/1; p = 10, 1, and 0.1 atm; T = 500-5000°K. in two intervals, !%0-16OO0k and 1500-5000°K.
A question remains as to where one may properly terminate the list of species to be included in the equilibrium computation. Evidently, the answer is based on the rate of convergence of the concentrations to a llnlting value in the sequence of successive approximations in which more and more species are added. We have found this convergence depends sensitively on the C/H ratio and on the temperature. A com- parison of the concentrations deduced in our first computation with the present values indicates that values for the major species for the low C/H compositions were converging rapidly, but that was not the case for the high C/H compositions at the low temperatures.
In performing the computations described below, it is essential that all the isomers be included. O n l y the isomers which have heats of formation considerably larger than those covered by the computations or such species the dissociations of which are greatly favored by a large entropy increase at the cost of a small enthalpy increment may be omit- ted.
For a sequence of temperatures and a specified total pressure, the equilibrium (no solid carbon allowed) partial pressures were computed by an IBM 704 program set up by W. Fickett and modified by one of the authors (R.E.D.). Typical graphs are shown in Figs. 6-13; o n l y the upper 8 decades of the. partial pressures have been plotted. The 58 species (for which the thermodynamic functions were inserted in the simultaneom equations) were divided into groups on the basis of their hydrogen content. A complete set of such graphs is shown for C/H = 1/2,
80.
but a few selected curves for other C/H ratios were included to demon- strate the effect of change in that parameter on the partiat pressures. Variation of the total pressure slightly modified the partial pressures, as expected from 'mass law' considerations.
A general Inspection of the curves plotted leads to two important
For temperatures above 1500°K., numerous molecular fragments
conclusions:
(a) attain significant concentrations. Insufficient attention has been given to the presence of the C& and Cn& fragments in the pyrolysis of hydrocarbons. The fact that these and others appear prominently in our plots underlines the importance of including as complete a set as is possible in the computations of the equilibrium partial pressures.
(b) For CnH similar tren8; as a function of temperature. equilibrium.
those species which have the same p's show on the whole Consider the general
- .(CnHp(-g).) = e - A F V T Keq(T) - (C,)" (Hg)'
mif this is known for all the FG - Hi Define Gi ( ' 7 ) i + (Tdii; species considered.
For any specified C/H ratio, pressure and temperature, the partial pressure at equilibrium of monatomic carbon gas and monatomic hydrogen is fixed. For any species, an (CnHp) is linearly dependent on "'and2 and on the magnitude of the G(CnHp) function which expresses the thermo- dynamic potential of that species at that particular temperature. The observation that the partial pressures of CnHp species for e ual have roughly parallel temperature dependences suggests that the GqCnHpf func- tion is sensitive to the magnitude of p but varies gradually and regularly with E. Trends of composition with C n ratio and temperature are given below.
(c) The Cn sequence: as T Increases above 2000°K., the concentrations of all Cn'S increase. At the highest temperatures, the relative pres- sures decrease with 2. Between 2000-2500°K., CJ dominates. Below 3500°K., (c,) > (c,) , (c7 ) > (c,) . Per mole of carbon, the sum of the concentrations of the Cn species increases as the C/H ratio increases, as expected.
'
I1
(d) The CnH system: the concentration of CH is unexpectedly small. P UP to 3000-4000°K. (depending on the C/H ratio), the dominant species / are C3H and C+H; at higher temperatures, C2H dominates. Note also that , CBH > CsH, C9H > CaH. to the C/H ratio.
The absolute concentrations are very sensitive
I'
81.
(e) The concentration of these species goes through a maximLull between 1500- 200OoK. As is well known from the experiments mentioned above, the Partial Pressure of acetylene rises rapidly as T approaches 1000°K. At higher temperatures, its partial pressure declines gently and is overtaken by C& only for T > 40OO0X. (f) The CnHs and CnH, systems: a temperature which depends on the C/H ratio, in the vicinity of 150O0K. As the proportion of hydrogen increases, the concentration of species with lower n increases. C9H5 is most prominent except for systems which have a smalIamount of hydrogen. his is a-consequence of the symmetry in electron distribution which the molecule possesses; resonance provides it with a N g h relative stability. Above 2500-3000°K., C& dominates in concentration; it is followed closely by C2& and C3&.
(g) and atomic hydrogen have also been included. for the equilibrium I& + 2 H. thought of as being stable rapidly decline In abundance for temperatures above 15OOOK. and attain partial pressures below 10" as T approaches 200OOK; their relative concentrations decrease in magnitude with increasing n. In general, for the stable species, the sum of their concentraticns increases as the C/H ratio increases.
The CnH2 system: the curves recorded for C/H = 1/2 are typical.
Next In prominence is diacetylene.
these species go through a maximum at
The %H, system: on this graph, the concentrations of molecular These behave as expected
The hydrocarbons which are Usually
(h) no obvious trend except that b'enzene is particularly prominent up to about 1500°K. As expected, its concentration is very high for high C/H. With regard to the relative concentrations of isomers, note that for the C4H4 species vinyl acetylene reaches higher concentrations than does
butatriene even though the heat of formation of the former i s approximately 4 kcal. Ngher than the latter. Evidently, the additional flexibility rJf the vinyl acetylene (internal rotation, etc.) favors this molecule entropywise. For the Cs& species, the same argument holds even though the chain isomers have heats of formation which are 8 kcal. higher than that of benzyne. The concentration of the latter is much smaller throughout the temperature range because of its stsf- ness and, therefore, lower entropy. In contrast, cyclopropane is always lower in concentration than the propene for two reasons; it has a higher heat of formation and a lower entropy.
(i) The temperature between 1500 and 25OOOK. provides an Interesting region for the use of slngle-pulse shock tubes for preparative purposes. The dominant species depends on the C/H ratio. If one starts with naturally occurring hydrocarbons which are rich In hydrogen, the first pass will lead to products which are carbon rich (C2H2, C8H8, etc.) and hydrogen. to a further carbon enrichment (C4&, Ce&, etc.). Of course, this hinges on the possibility of finding conditions which permit the attain- ment of this pseudo-equilibrium and quenching without excessive precipi- tation of carbon.
aside from the interesting new species which have to be considered in c h i n mechanisms, we have established a basis for selecting those species which are present in appreciable concentrations for the generation
The relative concentrations of CnHp with p = 6, 8, and 10 follow
A second pass of the resulting hydrocarbons will lead
These computations need extension and further analysis. However,
of chains. at equilibrium accounts for the product distributions observed for the quenched mixtures. One should not overlook the relative thermodynamic stabilities of the species and focus only on the kinetic routes by wNch conceivably they are generated. The emphasis should be on those elementary kinetic steps, which because of their low activation energies attain local equilibrium rapidly.
Also, it is evident that the presence o f many C/H fragments
ACIQIOWUDGMEWS:
This work was sup orted in part by the Air Force ( A R E ) under Contract AF33(616)-669f and by the IJ. S. Atomic Energy Commission.
REFERENCES
1.
2.
3. 4.
5. 6.
7.
8. 9. 10.
11.
13- 12.
14. 15 16. 17. 18. 19. 20. 21. 22. 23. 24.
Ed., €3. T. Brooks, et g, The Chemistry of- Petroleym Hydrocarbons, Vol. 11, Reinhold mm. Co., New York, N. Y. (19%) , refer to Chapter-22, E. W. R. Steacie and S. Bywater, h d Chapter 25, L. Kramer and J. Happel. A. G. Gaydon and H. G. Wolfhard, Flames, Their'Structures, Radia- tions, and Temperatures, Chapman - l m . , London ( 1 9 b F n o p x and G. Egloff , Ind. Ehg. Chem., 3, 1063 (1935). E. W. R. Steacie, Atomic and Free Radical Reactions, 2 vols., Reinhold Publ. Co.,NewYork,N.Y.). A. F. Trotman-Dickenson, e m e t i c s , Academic Press, Inc., New York, N. Y. (1955). K. 0; Kutschise-and E. W. R. Steacie VLstas in Free Radkcail: Chem- istry, Pergamon Press, London (19591. Selections from chapters on Kinetics of Homogeneous Reactions,
-- - Annual Reviews of Physical Chemisbry, Vols. z-X, Annual Reviews, m a l o AltoT- R. G. W. Norrish and B. A. Thrush, Quart. Rev., X, 149 (1956). S. Olaesson and L. Llndqulst, Arkiv Kemi, 11, 535, and 12, 1 (1957). N. H. Pdess and H. P. Broida, Seventh Symposium on Combustion, Butterworth Sci. Publ., London (1959), p. 207. H. S. Glick, W. Squire, and A. Hertzberg, Fifth Symposium on Com- bustion, Reinhold Publ. Go., New York, N. Y. (1955), p. 393.
-W. J. Hooker, Seventh Symposium on Combustion, loc cit, p. 949. E. F. Greene, R. L. Taylor, and W. L. PattersonTrrJ. Phys. Chem., 62, 238 (1958). R. S. Gnck, Seventh Symposium on Combustion, loc cit, p. 98. G. B. Kistiakowsky, private communication. 0. B. Skinner and R. A. Ruehrwein, J. Phys. Chem., 63, 1736 V. Kevorkian, C. E. Heath, and M. Boudart, ibid, 64, 695 (19 iOS. G. B. Skinner and W. E. Ball, ibid, 64, 1 0 2 m g W . G. B. Skinner and E. M. S o k o l o m ibis L. S. Kassel, J. Am. Chem. SOC., 54.n497932). A. Shepp, J. Chem. Phys., 24, 93971956). S. H. Bauer, et al, WADD TE%. Report 60-107 (April, 1960). G. B. K i s t i a k ~ s ~ and W. G. Zinman, J. Chem. Phys., 23, 1889 (1955). Ed., Y. S. TouloukLan, Thermodynamic an& Transport Properties of Gases, Li ids, and Sollds, McGraw-Hir'New York, N. Y. (193 977 m l e b y I t e l i n d E. Winter, p. 438.
1 59).
64, 1028 (1960).
25. M. N. Plooster and T. R. Reed, J. Chem. Phys., 31, 66 (1959). 26. D. A. Ramsay, A n n a l s N. Y. Acad. Sci., 67, 485 n957); J. H.
Collomon and D. A. Ramsay, Can. J. P h y s z 35, 129 (1957). 27. C. C. Costain and B. P. Stoicheff, J. Chem>hys., 30, 777 (1959). 28. L. R. Sitney, PUBCO-I f o r Computing the Idea l Thermijaynamic Func-
t ions of a Polyatomic Gas Molecule, LA-2278, issued May 8, 1959, by LASL.
FOOTNOTES TO TABLE I
a A f e w species were not considered i n de t a i l : C2Hs, C3H7, C4H7, C4H9, &C-CEC, HC=CH-CH2, H2C=CH-CEC, Ha -HC=CH Ha, and a var ie ty of cyclic
s t r a i n energy. Rough estimates indicated t h a t e i t h e r the heats of formation of these species were considerably l a rge r than those of t h e i r isomers which were included or that t h e i r entropies were con- siderably smaller than that of t h e products i n to which they could readi ly dissociate.
Two isomers are possible,
s t r u c t u r e s m c h there i s incorpora %A! e arge amounts of bond-angle
H
C’ H c\ / (H-C-C-C-H and 111 C, ) .
The estimate c i t e d w a s made f o r the l i nea r species, but a rough analysis shows that the heat of formation of the cyclic compound w i l l be r a the r close t o tha t of the chain.
Two isomers are possible, C
C*c (H-C-C-C-C-C-H and I ‘c:H).
H
The estimate c i t ed was made f o r the l i n e a r species, but a rough analysis shows tha t the heat of formation of the cyc l ic compound w i l l be r a the r close t o tha t of the chain.
X 88 ? x E o
v o o s R R R P
4
3 0 Y
CI
8 d * d Y
% 0
t
i
1
d
I' b
i
t
m m Q) 0 0
fk
a G
a u 8
H H .
3
+ M + cu + d
ab f
+ (d fi + cu + d
f
4- n + (u
+ 03
c d ' t + cd n + (u
+ co
f
+ \o
+ Ln + a3
4 + co + In + co
xv ,x
'rl 'rl
x' 'x
0 4 u
41- + cn + Ln
+ d
s: + n d
+ cu d
+ d d
Ln rl
+ f d
+ st + d d
E- + .M + cu + al
t- + o + ln
+ al
3 + f d
+ '(u d
+ d d
st ,": 'rl
3 P
u II x, YV
/ \ x' \x x' \x
d x\ 3": x\ /E % u
II
u 11 u
x x
a c a V
u II V 7 u
86.
Incident Shock *
Characteristic Source! 12mm He Circuit
.
Fig. 1. Schematic of the apparatus.
Small Grating Spectrograph
Reduced Data from Oscillascope Trace
A5165 C, band
I I I I I I I I I
100 200 300 400 500 600 TOO 800 900 1000 Time (rrec)
T I Induction period Os,,* Steady state Cr
cone.
ki = initial rote constant for formation of Cp
Fig. 2 .
<81.2>
H - 8 - 101( - 81.2 m t l <82.8>
t - g e + d - 8 2 . 8 H We
6 - 22.8 t - 20.5
88.
\
, ,
\
\
\
e j
DO
Fig. 7.
Fig. 6.
... . ..
\
Temperature. g<
Fig.
Fig. 9.
Temporoturn. O K
\ > '\
\ 4
I . l',
I.
' 0,
1 h
Tanpmhuo. K
q,, = I am.
Fig. 10.
Fig. 11.
\cd(.
Fig. 12.
Fig. 13.
B
\
93 -
THE HYDROGEN-BROHINE REACTION
D o y l e Britton and Roger M. Cole
School of Chemistry, University of Miuuesota Nianeapolis, Minnesota
IlrlTRODUCTION
The reaction between H and Br2 i s the c lass ic -le of a chain reaction, It has been studied here by s2ock a v e techniques both t o extend t h e temperature range over Prhich the rate constants have been detenuined experimentally and t o further test the shock tube method, T h i s eaction has been well. reviewed, for example by Peasel and by Campbell and pristmmSi and o n l y those pieces of e a r l i e r w r k wfiich a re of specific interest w i 3 l be mentioned belou,
The simple reactions which can occur in t h e hydrogen-bmndne system are
(The fouoving notation w i l l be used: Ki is t h e w i b r i u m constant f o r reaction (i) as written; k the r a t e cons& f o r t h e merse reaction. A l l concentrations will be -res&& mleu/ l l te r and all times in seconds unless othervise noted, The units of the equili- brium and r a t e constants will be the appropriate combinations of moles/l.iter and seconds.) If reactions (2) and (3) are regarded as t h e important propagation reactions and it is assumed t h a t t h e steady state approxhation can be applied t o the H atom concentration then
i s the rate constant f o r the forward reaction i n eqnation (i); is
I
2 d ( m r ) "2pk3JH2) (BQ) - 2%%r(HBr) - = - (Br) (7)
d t k3f(Br2) + %(mr) Reaction (1) is the source of the bmmine atoms. Reactions ( 4 ) , ( 5 ) , and (6) are not fast enough t o be important and a r e included in the l ist f o r t h e sake of completeness, A t low temperatures o r at la rge re la t ive H2 and Br2 concentrations t h e reverse reac- t i o n can be ignored and equation (7) can be rearranged t o
A t low temperatures the B r atoms maiatain oqdlibrium with t h e molecules and (Br) = Kl(Br2) 'I2. studied independently and t h a t a l l of t h e equilibrium constants for the var ious reactions are known, then twt, ldne t ic constants need t o be determined t o reaction. These tm constants have generally been k2f(or kaKl@) and t h e ra t io
If the correct assumptions are =de t h a t reaction (1) can be e i ther ignored or
rac te r ize the en t i re
k3fIk2,. In the earliest m r k on this reaction Bodenstein and Lind3 found kjf/k* to be 10
I
94. - f 3. Their d u e s of kZ along with those of Bach, Bonhoeffer, and HDlwyn-Hughes4 have been recalculated using modern e@librim constants5 and are included i n Table V in t h e discussion. Later Bodenstein and dung6 r e d e t e d e d k 3 f / b and found it to b e 8.4 2 0.6. In both cases i t was found to be temperature independent.
Davidson,7 in shock tube experiments around 1 5 W K found t h a t t h e d u e s of k2p extra- polated from the low temperature values seemed t o be low by a factor of a b u t tvm. They did only a few experiments of a p r d b b a r y nature. Plooster and Garvin8 compressed d x t u r e s of H2 and Br;! in a shock tube and m e a s u r e d t h e induction times for the onset of explosions. The dependence o f these times on temperature uas reasonably ap la ined on t h e basis of values of k2f -extrapolated from low temperature values, and the assump- tion that t h e Br a t o m concentration increased with time a t the high temperatures behind the shock waves, that is, that t h e steady state approdmation did not apply t o B r atoms. Levy9 studied this reaction in a f l o w system i n which the H2 and B r 2 were preheated before being mixed together. The steady s t a t e approximation was a reasonable one i n view of this preheating and t h e results could be explained i n terms of the low tanp erature mechanism. Values o f k were measured between 6000 and lSC?@K. The sca t te r in these values a t high tempera%e was quite large, but in general the agreement with the low temperature r e s u l t s uas good. In the experiments reported here it m s hoped t o improve the accuracy of the high temperature m e a s u r e m e n t s and t o extend the range t o higher temperatures.
There have been three studies of this reaction a t high temperatures. Britton and
ExPFamNTAL
The shock tube, t h e associf..ed vacunm l ine , and the observation arrangements have all been described previously. concentration was followed spectrophotometrically at 5000 A. .Under the experimental conditions d s s i o n a t this wave length was negligible. Duplicate observations were rout inely made at tno s ta t ions 40 cm. apart.
bulb and noting t h e t o t a l pressure a f t e r each adgt ion . The ndxturcs were allowed t o m i x In the bulbs a t least lC8 hours before being used, t o allow complete n g .
In all o f the experiments reported here the Br2
Reaction mixtures were prepared by adding B r H2, HBr and argon t o a storage
CALrCULATIONS
Cal&tf.o3 of: an Apparent Rate Constant in the Reaction between H:, and B r . A shock lQve was run in a mixture of A r , Br2, H2, and perhaps HBr, and a t race s&r t o Figure 1 obtained. The bromine disappearance a f t e r the shock front i s the sum of tw, effects , f i r s f the dfssociation of B r 2 according t o reaction (l), and second t h e formation o f HBr according t o reactions ( 2 ) and (3). in t h e following way. The Br2 concentration conld be read d i rec t ly from t h e oscilloscope trace. The com- pression r a t i o generally could be assumed t o be constant a f t e r t h e shock since t h e endothermic dissociation of Br2 which tends t o increase this r a t i o was more o r l e s s balanced by t h e exothermic formation of HBr which tends to decrease this ratio. T h i s also m e a n t that the temperature was much more nearly constant than i n a shock involving only the dissociation reaction. The B r atom concentration could be obtained by graphical integration of the Br2 concentration since
These tlra e f fec ts were separated A l l of t h e concentrations were determined as a function of time.
and in t h e reactions between H2 and B r the last term could be iguored, aluays be ranembered in o b s e m t i o n s on a moving shock wave t h a t t h e time on the oscilloscope t r a c e , r , and the time t h a t t h e gas has been heated, t, are related by d t = A d 7 where h is the compression ra t io in the shock. The HBr concentration follows from a mas8 balance of the bromine. The H atom concentration can almys be assumed t o be negligibly small so t h a t t h e hydrogen molecule concentration also follows f r o m mass balance. From the concentrations as a function of time d(HBr)/dt and therefore k*= &2f/L1 + k&IEr)/k3f(Br2)] could be calculated at any time. In
It must 2
i i
/'
95. t h e e l y stages of t h e reaction, when the Br atom concentration i s small, the rate of forrpatbn of ABr is small and t h e uncertainty i n k " i s qu i te large. In the later stages the back reaction i s be- t o be important and the errors in estimating t h e Changes in the temperature and density are becoming large. Therefore it was decided
use the value of k* at 25% disappearance of t h e Br2 in each shock as t h e best value for that shock,
Cfif-dJAtion of the Rate Constant in the Back Reaction, Br + HBr. - The calculations in this c88e are very s U a r t o those for the forward reaction described in the preceeding section. A shock uave was passed through a mixture of HBr and Brp, and a t r a c e S w t o figure 3 obtained. The change i n the B r 2 concentration i s again t h e reaction between HBr and Br. Since both of these reactions are -then& it is necessary here to correct for the teanperatnre decrease and the density increase t h a t take p h c e as the reaction proceeds. These changes were approximated as being l inear d t h time, which i s not correct, but which does not introduce a large error. The Br2 WW3ntration could be calculated a t a l l times di rec t ly f r u m t h e oscilloscope trace. The Br atom concentration could be calculated f r o m equation ( 9 ) , this time including t h e recombination reaction since the reaction between HBr and B r is slower than the dissociation and recombination of Br2. A numerical, point by point, integration was performed t o give (Br) as a h c t i o n of t h e . The H atom concentration and the HBr concentration could be calculated f r o m mass balance. The H2 concentration was plot ted 8s a function of time and d(H )/dt could be determined from t h e plot. The calcdLated concentrations as a function 8f the apparent time in the shock wave are show i n figure 4 for the shock shown i n the upper t race i n figure 3.
ing rearranged form of equation (7)
of two effects, the dissociation of Br2, and the formation of Br from the
The rate constant for the back reaction, k3rr could be calculated fromthe follow-
The f i r s t term in the numerator represents the reaction in question. represents the reverse of this reaction, t h a t is, t h e reaction which has previously been called the fonmrd reaction. Since at eqdl ibr ium o n l y a small f ract ion o f the HBr has ctj.sproportionated this second term must be included. The denominator can be estimated f r o m t h e known value of the r a t i o k f/k and is not much greater than 1. The rats constant k3r was generally calmlatea a t q point corresponding t o about 25% reaction f o r reasons similar t o those given for the forward reaction.
RESULTS
The second term
HBr as a Third %dy f o r the Recombination of Br Atoms. t o determine the efficiency of HBr as a t h i r d body f o r t h e recombination of Br atoms. From the initial rise in concentration in t h e shock waves in essent ia l ly pure HBr it w s possible to decide that the HBr was vibrationally relaxed at t h e shock front and t h a t t h e apparent dissociation rate constants were not complicated by t h e simdltaneous relaxation of the inert gas. Hydrogen bromide is not t r u l y M inert gas since it can and does disproportionate t o €I2 and B r but it does not do this u n t i l a reasonable number of Br atoms are present, so tha?the ini t ia l slope of the oscilloscope t race does give the desired dissociation rate constant for Br Figure 3 show the initial dissociation of Br2 as well as the subsequent decomposifion of HBr in a typical shock in an HBr-Br2 mixture. fully in the section Direct Observation of the Back Reaction. experiments are summrized in Table I. gene* Yere 10-5 - 1(r2 mles / l i t e r . The 150@ point more or less represents t h e center of the range.
Four series of shocks were run
The point of t h e inertness of t h e HEW w i l l . be covered more The resu l t s of these
ran from about U+O@ to about17@ K, and the find. t o t a l concentrations The temperature range in t h e experiments
96. TaKe I
Recombination Rate Cons tan t s for HBr ad ThFrd Body from Shocks WpHBr €Uxhres.
There a r e two v 8 p ~ of looking a t these data. The f i r s t is t o take t h e average k from all t h e mixtures as t h e best value. The other is to regard the trend with d e f ract ion of Br a s real and extrapolate t o the Ilmits, one limit for HBr as third body, and t h e other ?or Br as 1600% f o r HBr, and &so
In Table 11 this bas been &ne a t 1500 and
Table X I
Recombination Bate Constants from Br2 - BBr and Br2 - Ar Kixtpres.
Inert Temp. m e a n k extrapolated d u e s of % Gas
b r Or k i r
RBr 1500% 4.0 xl& 3.6 xl0' 24x108 1600 3 -1 298 P
Ar 1500 3 07 2.6 37 1600 3.2 2.3 30
Tm conclusions may be drawn f r o m Table II. First, HBr i s only slightly more ef f ic ien t thac br as a t h i r d body for the recombination of B r atoms, perhaps 10-3a mre. Second, there is fur ther support for the suggestion that a t these temperatares B r 2 is clo r t o 10 times more ef f ic ien t than A r ra ther than 3 times as has been suggested.' This support is not very strong, but it is consistent with t h e Ar results within experimental error.
The Forward Reaction, t12 + Br,. A b u t one hundred shocks were run in various mixtures of B r , H , IIBr, and Ar. The argon was the pr incipal constituent, and =s added in wery2m&ure t o serve as a heat capacity buffer, and also in order t o provide a t h i r d body with known eff ic iency f o r the dissociation of Br2. A n apparent rate constant k* = k.@ + %(HBr)/ (Br2)3 uas calculated a t t h e point of 25% reaction as describe previous y. Fo3& particular mixtnre the values o f k* mre compared as a function of temperature. For one sample mixture, 1% Br2 - 1% I? - 98% Ar, the experimental points are displayed in f igure 5 a s log k* vems I./?. A s t ra ight l i n e has been f i t t e d through these points by the method of least squares. The best s t ra ight lines, but not t h e axperimental points, for three other mixtures are also shown in the same figure. A l l of these s t ra ight l i n e s are of the fom log k*
A + BIT and the values of t h e parameters are l i s t e d in Table III.
The actual d u e s of k2f and the r a t io k -re calculated at several temp- atures f r o m points taken from t he smothed k d e p o f figure 5. Two independent estimations wem made, one by comparbg t he r e su l t s of t h e 1% Br2 - 1% H2 shocks with the r e su l t s of t he I.% B r - l% €I the 2% Br - 1$ El2 with the $ Bra - &-H2 - lC$ HBr. The values obtained are shown
Table IV
IC$ HBr shocks, and the other by comparing
in Table IV,
f r o m 1% Br2 2s avg. 1% 2g aw. . . 1300 1.l6 -98 1.07 9.5 12.7 Ll;L
Some experiments were also done using higher percentages of bromine and some using excess hydrogen. f l o w behind the shock (or at least the B r 2 concentration) was not smooth even at a distance of forty tube diameters from the membrane. The t race f o r an extreme case of this type of a shock is shown in figure 2.
As can be seen from the experimenkal points i n figure 5 the spread of the poiats from the U n e is about 2 0.1 i n log k . This nmst be a t t r ibu ted t o the limited 6 accuracy of the shock wave technique. There is further uncertainty introduced by the uncertainty i n the d u e t o use f o r the r a t e constant f o r Br2 reconbination. If the d u e of t he case if Br2 is five t b e s more s f f i c i en t than Ar as a th i rd body o r if HBr is 5C# more ef f ic ien t ) the calculated d u e s of k* and kX nvuld be decreased by about IC$ and the value of the r a t i o k /k would be decreased by about 15%. A conserva- t i v e estimate of the uncertainty3% &e constants reported in Table I V is that they a re all uncertain by at least 25% and t h a t they are more likely t o be too la rge than too small.
It mas found that when more than 5% of the mixtnre was reacting t h e
vhich was used in the calculations i s increased by 5% ( th i s muld be
Direct Obsemtion of t he Back Reaction. - In many of t he shocks in t he HBr - Br2 e r n e s it 78s apparent from the oscilloscope t races t h a t eqpillbrium had been reached at mch higher concentrations of Br than would be expected if t h e only reaction -re tfie dissociatloon of Br2. In:%ur 01 the shocks in the 0.488 Br2 - 99.5% HBr mFxtures the Br2 concentration c lear ly went through a mbhum. The mst s t r ik ing example of this is show,in figure 3. In these four shocks the r a t e constant, k3r, for the reaction betweep HBr and B r nas calculated as outlined in the section on calculations. The resu l t s f ro5 these four experiments are shown in figure 6 ( t w points from each
e points show an average scatter of about lC$ fmm k3r = 8, l x wbich was f i t t o them by the method of l e a s t squares. These values
.....
98. can be combined with t h e prrsvioPs values of to obtain an independent
%)I[ When'k a d d d u e s of k3r are combined with t h e s m o o k h l ~ e % t / + f&a Table VR t he result ing values of the r a t io show no variation with t e q a t u r e and have an average value of 8.3 2 0.7, which can be compared with the value 103. ,+ 1.7 obtained from t h e rneamrementa a i t h e foxward reaction u i th and without added IIBr.
D I S C U S S I O ~
The r d t s of the various s tudies of t he value of 5 are collected In Table V
form has some theoretical. h e r e they are given in tra forms, calculation, and second as jus t i f ica t ion f o r a b b l e
- B/T f o r convenience in
Table V
The Rate Constant, k z , fo r t he Reaction betwsen B r and
temp, range rei, l og % = A - B/T % = C W e - W m
"K
Br f €I2
500 - 575 5 ll.357 4235 2 46 5.92 109 rS.a+- 3 550 - 600 10 10.927 4053 + W 2d5 I s . 0 ~ 07
500 - 1700 dl ll.238 41905 2l 3 035 18.32 L l 1300 - 1700 this mrkll.254 4195 7 400 3.54 18.3 ,t 1.8
The probable errors wbdd ind ica te tha t neither of these tm forms is t o be preferred over t h e other on t h e basis of t h e experimental data. The agreement betwen the lor temperature results and the high temperature shock wave results is qulte good.
which was b o r n to be temperature invariant at l o w temperatures within e.?+erimenfd%mr has now bean shown to be temperature invariant over t h e temperature range 300 - 17OOOK within q e r i m e n t s l error. The best Low temperature value, 8.4 2 0.6 is almost exactly t he same a s the weighted average of t he tm independent measurements of t he r a t i o a t high temperature, 8.3 2 0.7 and 10.1 f: 1.7.
The activation energy associated with heat of the reaction a t CPK i s 16-2 kcal/&fe. T h i s means that k3f and k a mst have an ident ica l activation enerw of a b u t 2 kcal/mole. high temperature d i f fe rs from that at low temperatures by l@ t h e activation energies muld d i f f e r by about 0.1 kcal/mole. This pair of activation energies is an embar- rassing case for any d e which t r i e s t o predict . the activation mer= f m m the bond energy of the bond being broken since % (=45 kcal/mle) and Kmr ( = 87 kcd./mle)
The r a t io '(7 /k
is 18.3 kcal/mole (Table V I I I ) . The
If the value of the r a t io a t
d i f f e r by a fac tor of 2. r2
We muld l i k e to thank the Research Corporation, the Office of Ordnance R e s m h , U. S. A m y , and the Graduate School of t h e University of Minnesota fo r t h e i r support of t h i s wrk.
99 * RFFEBENCES
(1) R. N . Pease, "Equilibrium and Kinetics of Gas Reactions," Princeton University Press, 1942, pp. 112121.
(2) E. S. Campbell and R. M. Fristmm, Chem. Rev. 58, 173 (1958). (3) M. Bodenstein and S. C. Lind, 2. ph sik. Chem. 57, 168 (1906). (4) F. Bach, K. F. Bonhoeffer, and E. A: Molwgn-Hughes, 2. p m i k , Cham. 2 3 ,
(5) National Bureau of Standards, "Selected Values of Chemical Thermodynamic Properties,n Ser ies 111, Washington, 1948, 1954.
(6) M. Bodenstein and G. J a g , 2 . physik. Cham. l2l, 127 (1926). (7) D. Britton and N. Davidson, J. Chem. Ph (8) 14. N . Plooster and D. Garvin, J. Am. Chz. SOC. 78, 6003 (1956). (9) A. Levy, J. Ph . Chem. 62, 570 (19581.
n. (1935)
. 23, abl (1955).
(10) D. Britton, J.?h s. Chem. 64, 742 (1960). (n) H. B. Palmer and ;. F. Hornig, J. Chem. Phys. 26, 98 (1957).
Fig. l.-OscUl.ogram of typ ica l shock used fo r kinetic studies. This shock was run in a 1% H shock front. % i t e the acceleration in t h e r a t e of disappearance of Br as more B r atoms are produced. ( I n a l l o f t he oscillograms t h e lower t race recorzs t h e Br2 concentration at the first observation station as a function of time, and the upper t r ace records a t the second observation station, LO cm from the f i rs t . )
1% Br2 - 96% Ar mixture, and reached a temperature of W J K a t t he
Fig. 2.-Oscillogram of shock in highly exothermic reaction mixture. This shock
It is apparent that no useful kinetic data could be obtained in was run in a 5% Br2 - 2& H2 - 75% Ar mixture and reached a temperature of 1 U 0 K at the shock front. t h e shocks i n concentrated mixtures.
I
t
I I I I I I
F i q . 3.-Oscillo ram of shock showing t h e reverse reaction. T h i s shoc! in a 0.5% 3r9 - 99.52 HBr mixture and reached a temperature o f 1635OK a t tl
101.
as Illn shock
f ront , Note-the production of molecular BrZ when t h e Br atom concentration becomes su f f i c i en t ly large.
1.2 I
2 0 40 60 60 100 I2 0 T 0
Fig, L.--Concentrations as a function of time f o r t h e upper t r a c e of t he shock
The H2 concentrat ion is calculated wave shom in fig. 2. d i ssoc ia t ion and recombination r a t e constants. from mss balance considerations.
The Br atom concentration is ca lcu la ted from the known
6.8
8.4 lo* k”
8.0
7. 6 I I
0.8 0.3 a. 6 I O O O / T
Fig. 5.-ADparent r a t e constants for t h e reac t ion betveen Br and H2 a t 25% reaction. The points a r e t h e experimentdl points for line A .
0.8 0 . 3 0 . 6 1 0 0 Q l f
0.c
Fig. &-Rate constant f o r t h e reaction between B r and .Qr. The s t r a igh t l ine is t h e least squares l i n e through t h e points.
/
/
I
J’ ,’
103.
A Shock Tube Study of the Vibrational and Chemical Relaxation of Nitric Oxide a t High Temperatures"
Kurt L. Wray and' J. Derek Teare
Avco-Everett Research Laboratory . Everet t 49. Massachusetts
Introduction
Extensive studies of the relaxation region behind normal shocks in air have been carr ied out at this Laboratory. ( l) The experiments include studies on pure air, N2, 0 2 , NO, and various mixtures of these with each other and with argon. A s a part of this program, we have undertaken a study of the chemical kinetics of NO in the temperature range 3000 - 8000O K, and of the vibrational relaxation of NO in the range 1500 - 7000' K. investigation was the monitoring of the NO concentration as a function of time by its absorption of 1270 A radiation. Tlie present paper will be rest r ic ted to this por- tion of the overall program, and to a discussion of those reactions which involve the formation, removal o r vibrational relaxation of NO.
The experimental technique employed in this
As we shall see, such systems at high temperatures a r e fairly involved, and the analysis of the experimental data requires the aid of an electronic computer. To this end, computer programs using an IBM 704 have been written which permit the calculation of the density, temperature, and concentration time history for any given set of pertinent ra te constants. pling of vibrational and dissociative processes. (6 These pro rams include a postulated cou-
The following is a list of chemical reactions occurring in air which are pertinent to this paper:
O2 f M t 5.1 ev
N 2 + M + 9 . 8 e v t N t N t M NO t M + 6.5 ev = N f 0 t M
0 t 0 t M (19 2)
(3s 4)
(5*6) N O + O + 1 . 4 e v = 02+N N 2 + 0 + 3 . 3 e v = N O + N
N2 i 0 2 f 1.9 e v = NO f NO X2 + M -C X2V + M
It should be pointed out that the collision partner "M?' can be any molecule or atom, and part of the unravelling of the kinetics is to evaluate the relative effi- ciencies of the possible catalysts. C-ac and V a u g h ~ n ( ~ ) and others, and the rate constants a r e well determined. Reaction 3,4 plays but a minor role even at the highest temperatures encountered
Reaction 1 ,2 has been studied extensively by
'Supported jointly by AFBMD-ARDC-USAF, Contract AF 04(647)-278 and ARPA, I -, monitored by the ARCMA-AOMC-U. S. Army, Contract DA-19-020-ORD-4862.
I \
104.
in the experiments under discussion. Reactions 5-12 al l contribute to the forma- tion and subsequent removal of NO behind a shock front in air. Rate constant in- formation for these reactions has been obtained f rom observations of the decom- position of shock- heated NO.
Vibrational relaxation (reaction 13) plays an important role ear ly in the The vibrational relaxation of 0 2 and N2
Robben(6) has measured the vibra- time history following the shock front. has been measured by other workers. ( 4 j 5, tional relaxation rate of NO by NO over the temperature range 400 - 15000 K.
Theory of Vibrational Relaxation
It was assumed by Bethe and Teller, (7) and subsequently proven by Mont- rol l and Shuler(81, that if a gas initially has a Boltzmann distribution of vibrational energies, i t will relax to a f i n a l Boltzmann distribution of energies with all inter- mediate stages having a well defined vibrational temperature.
The relaxation equation given by the above authors is remarkably simple If the gas is initially at room tem- when written in terms of vibrational energy.
perature, we can write
and, for an harmonic oscillator, we obtain from statistical mechanics
- 1 e /Tf
e
T ( 1 5 ) Ev - - - Ef e I v - l
In these equations, Ev is the vibrational energy corresponding to the vibrational temperature Tv at time t, E is the vibrational energy corresponding to the final vibrational temperature Tf and T is the relaxation time. For NO, 8 = 26880 K.
The relaxation time, T, is related to a transition probability by the equation
f
(16)
where T is the translational temperature, Pi0 is the transition probability per oscillator per collision for transition between vibrational levels 1 and 0, and Z is the number of collisions suffered by a single oscillator molecule per second with a catalyst particle.
F o r an NO-Ar mixture, i n which two catalytic species a re present, the effective relaxation time is related to the relaxation time for each individual cata- lyst by the equation
t (17) - - 1 - f + I-f
NO- N O 'NO- Ar T T
in which f i s the fraction of oscillator molecules in the mixture.
and by Schwartz, Slawsky and I - Ie rg ld . (10) calculated using the Lennard- Jones parameters E and r
Theoretical formulae for P have been pro'posed by Landau and Teller(9) The SSH theory allows P10 to be
0'
105.
where. for most molecules A and B are weak functions of temperature.
Experimental Program
The ultraviolet light absorption technique em lo ed in these studies is similar to that used by Davidson and his co-workers?11Y who used visible light t o measure iodine relaxation rates. Camac(5) has developed the techni ue exten- sively using radiation at 1470 A in his O2 studies. measured the room temperature absorption coefficients for several gases in the vacuum ultraviolet and found a narrow window in the absorption spectra of 0 2 at 1270 A where NO showed strong absorption. wanted primarily to observe the NO molecule, we chose to work at a wavelength of 1270 A with a bandwidth of 5A.
Watanabe, e t al, have
Since, in this investigation, we
A schematic diagram of the apparatus is shown i n Fig. 1. The shock tube, constructed of stainless steel, was of a circular cross-section having an inside diameter of 3.81 cm. ruptured by increasing the dr iver pressure until the diaphragm failed. dr iver gas was hydrogen or a mixture of hydrogen and nitrogen. was determined by means of platinum s t r ip heat t ransfer gages. ments of the position of the shock front could be made to about 1/3 microsecond, which corresponded to 0.3% uncertainty in the shock velocity.
Scored stainless steel diaphragms were used, and they were The usual
The shock speed The measure-
The optical observation station at the shock tube consisted of the following components: (1) light source, shock tube, (3) monochromator, (4) phosphor-coated photomultiplier, and (5) recording oscilloscope.
(2) slits and CaF2 windows on both sides of the
Two types of light sources were used. When i t was desired to observe the
This lamp produced several strong molecular lines in the 5A wavelength shock-heated gas for relatively long t imes, a hydrogen discharge lamp was em- ployed. band centered on 1270 A, its intensity which decayed monotonically to zero in about 3 milliseconds allowed a resolution of about 1 fi sec.
When i t was desired to observe the leading edge of the shock front, a Lyman lamp was used. duces a continuum i n the wavelength region of interest. damped oscillating output whose second cycle (the one used) allowed a testing time of about 15 fi sec and was sufficiently intense to allow resolution of a few tenths of a microsecond.
The Lyman lamp is a helium discharge light source and it pro- This lamp produced a
An oscillogram obtained with the U. V. absorption apparatus is shown in This oscillogram is reproduced here to show the time history over the
it does not have a sufficiently fast sweep speed to show the Fig. 2. entire testing time; relaxation phenomenon to maximum advantage.
The ground state absorption coefficients for NO, 0 2 and N2 ( i . e . , room temperature absorption) were determined in this apparatus using the hydrogen lamp on a DC basis with the output of the photomultiplier being monitored by a m i c r o m e t e r , the NO and 0 2 gases being introduced into the shock tube. In the case of N2, however, the absorption by the room temperature gas was insufficient and the path length was increased by introducing the gas into the monochromator.
It was pecessary to experimentally determine the absorption coefficients for the various species as a function of vibrational temperature. Fo r this purpose, many shock tube runs were made with NO-A.r and 02-Ar mixtures and pure N2. The absorption by the shock-heated gas was measured at a point on the oscillogram corresponding to complete vibrational relaxation but before dissociation starts.
1%. The temperature (vibrational) and density corresponding to this condition were cal- culated for each run and were used in conjunction with the oscillograms to obtain the curves shown in Fig. 3. The two points at the extreme left of these curves a re the room temperature absorption coefficients. We see that vibrationally excited NO absorbs more strongly than does the ground state and that the absorption seems to increase roughly l inearly with increasing vibrational temperature. Notice that the absorption coefficient for vibrationally excited O2 is much larger than far the ground state. This i s somewhat unfortunate because i t means that under certain conditions (early times in air) the correction for the absorption due to the vibra- tionally excited 0 2 becomes significant.
Although the absorption coefficient of N2 is completely negligible at room temperature (k = .014 cm-I ) , our experiments showed it t o be a strong function of vibrational temperature (k = 1.1 at 60000 K, 3 . 6 at 80000 K). This absorption correlates with the population of the 11th vibrational state. Vibrationally excited nitrogen thus contributes significantly to the absorption in shock heated a i r above 6000° K.
By observing the magnitude of the initial jump in the signal due to the com- pression across the shock front, i t was proven that the absorption coefficient is independent of translational and rotational temperature. .
Data Reduction
For the purpose of the chemical relaxation studies, computed curves were fitted to a total of 42 experimental time histories in the following six mixtures: 1/2% NO, 1/2% NO t 1/4% 0 2 . 50% NO, 10% NO, 100% air and 2070 air, in all cases the diluent being argon. The temperature range covered was 3000 - 80000 K.
The general equation for the intensity of monochromatic radiation, I, trans- mitted through a gas sample is
where Io i.s the intensity of radiation with no absorber in the optical path of length L i s the density ratio across the shock, and k . is the absorption coefficient of species j having a concentration f j (rnoles/origin$ mole of mlxture).
relaxation period. integrates the chemical and vibrational rate equations subject to the constraints imposed by the conservation equations. f j and df./dt, a s well as 1/10 which is used f o r direct comparison wi th experi- mental ldtensity vs. t ime histories. speed, composition, initial p ressure , k. as a function of T, f o r the three absorbing species, together with the rate constan2information for reactions 1- 13. constants fo r equations 5- 12 were varied in a systematic t r ia l and e r r o r process which yielded a set of ra te constants which satisfactorily fit all the measurements. The high temperature vibrational relaxation rates for NO required in the above computer program were obtained independently as discussed below.
, P1 is the total initial p ressure of the gas , P, is standard pressure , p2/pl
In general, the density ratio and the quantities k. and f . vary throughout the Their values a re obtained from- a co!nputeJ program which
The computer output includes T , p2/p1,
The input to the computer includes shock
The rate
Three N O - A r mixtures (50% NO, 10% NO and 1% NO) were analyzed for vibrational rate information. quantity 1 - Ev/Ef, using the NO absorption coefficient of Fig. 3. For each run analyzed it was necessary to construct a plot of I/Io vs. (1 - Ev/Ef), and then to cross-plot the I/I vs. t ime data from the oscillogram. obtained for vibra?ional analysis a r e shown in Fig. 4, and the corresponding cross- plots a r e given in Fig. 5.
The experimental signal (I/Io) must be related to the
Two typical oscillograms
107 According to Eq. 14 such a plot should be a straight line. In general. all
Although the data yielded fair ly straight lines when plotted in the above manner. these lines seldom went through the value of unity at t = 0, the discrepancies were consistent with t ransi t time considerations. .The slopes of these straight lines give the vibrational relaxation (laboratory) time.
Following the usual practice, the data w i l l be presented with the relaxation times in the particle coordinate system and co r Fig. 6 we have plotted rS (1 - e-Q/T) vs. T- 73 for the three mixtures studied.
alized to standard density. In
Results and Conclusions
%he results of our vibrational relaxation experiments as well a s those of Robben( collision leading to vibrational relaxation a r e r o = 2.15 A and E/k = 20000 K. this exc tionally high value of E the usual statement that a plot of log T ~ ( I-e-e?T) VS. T- '7' should yield a straight line is not valid.
indicate that the Lennard-Jones parameters appropriate to an N O F r
The three solid lines in Fig. 6 a r e least square fits to the data based on Eq. 17. in P 0 that for most molecules a re insignificant compared to the T-1/3 dependence. The two dashed curves i n Fig. 6 labelled f = 1 and f = 0 are the computed relaxation times for the NO-NO and the NO-Ar collision, respectively, based on the least square fit to the experimental data.
The curvature in these lines is produced by temperature dependent t e rms
The above relaxation times can be converted into transition probabilities by means of Eq. 16. are plotted vs. T - l A in Fig. 7. They are the solid lines labelled PNO-NO and PNO-A~. one would get using the data f rom the NO-rich mixtures alone and assuming that the argon plays no role in exciting the NO. is obtained essentially f rom the 1% data only after subtracting out the large effect due to NO-NO collisions. than the PNO-NO curve. For comparison, Robben's data i s d s o shown in Fig. 7. It covers the temperature range from 400 - 15000 K.
T e calculated probabilities resulting from these experiments
It should be pointed out that the PNO-NO curve is very nearly the curve
The PNO-Ar curve, on the other hand,
Hence, the uncertainty in this curve is much greater
The other two curves shown in this figure a r e calculated from the SSH theory(lO) for the Lennard-Jones parameters indicated in the figure. these two curves should apply to both NO-NO and NO-Ai- transition probabilities.
The lower of
Robben pointed out in his paper that there is evidence of the formation of an NO dimer (of rectangular geometry) in the solid and liquid s ta te . ' (13~ 14) The Lennard Jones parameters appropriate to the dimer were the ones used to calculate the upper theoretical curve. drawn as a dotted line as some of the approximations i n the SSH theory a re not ap- plicable in this temperature range for E/k = 2000° K.
The low temperature portion of this curve has been
At high temperatures the slope of the theoretical curve based on the dimer potentid compares well with the experimental one. Since the dimer has rectangular geometry, an attractive collision could resul t only for specifically oriented collision pairs , and a s te r ic factor of about 1/30 implied by Fig. 7 i s not unreasonable.
The noise fluctuations in the oscilloscope t races , which were of statistical origin, could groduce e r r o r s in I/Io, of as much a s 2 4%. This probably repre- sents the greatest source of scat ter in the vibrational data, introducing somewhat less than a factor of 2 uncertainty in the relaxation times.
The various mixtures used in the chemical relaxation studies were chosen to emphasize the relative contribution of particular reactions. F o r example, the
103.
1/2% NO runs provided a determination of the argon contribution to reaction 5, while 1 the 1/2% NO + 1/4% O2 mixture w a s used (at Prof. Norman Davidson's suggestion) to emphasize the importance of reaction 7 by providing a n abundance of 0 atoms ear ly in the time history. the NO catalytic effect in reaction 5. Estimates based on measurements(l5) below 2000° K indicated that the bimolecular path (reaction 11- 12) should be unimportant
In achievin a satisfactory fit, we have made use of recent h igh te-mperature meas- urernents(l%) of the bimolecular ra te constant.
I
The NO-rich mixtures emphasize both reaction 12 and
above 3000° K, but this proved inconsistent with the present experimental results. I
\ A summary of the rate constants for reactions 1- 12 is given in Table 1.
Acknowledgements I
The authors wish to acknowledge the support given to this work by Dr. M. Camac during the ear ly stages of the experiment. Magro for his devoted help in the actual operation of the shock tube.
They a l s o wish to thank Mr . A.
- REFERENCES
1.
2.
3.
4.
5.
6.
7.
8.
9.
K. Wray, J. D. Teare , B. =vel and P. Hammerling, Avco-Everett Research Laboratory, Research Report 83, December 1959.
P. Hammerling, J.D.Teare, B. Kivel, Phys. Fluids - 2, 422 (1959).
M. Camac and A. Vaughan, J. Chem. Phys. 34, (1961).
V.H. Blackman, J. Fluid Me&. 1, 61 (1956).
I
1 - M.Camac, J. Chem. Phys. 2, (1961).
F. Robbtx, J. Chem. Phys. 31, 420 (1959).
H. A. Bethe and E . Teller, Ballistic Research Laboratory, Report X-117 (1941).
E. Montroll andK. Shder, J. Chem, Phys. 26, 454 (1957).
L. Landau and E. Tel ler , Physik. 2, Sowjetunion - 10, 34 (1936).
R. N. Schwartz and K. F. Herzfeld, J. Chem.Phys. 22, 767 m 5 4 ) . (1952).
11. D. Britton, N. Davidson, and Schott. Discussions Faraday SOC. 17, 58 (1954).
12. E. Watanabe, M. Zelikoff, and E. C. Y. Inn, Geophysical Research Papers , No. 21, AFCRC Technical Report No. 53-23.
I -
-
i 13. O.K. Rice, J. Chem.Phys. 4, 367 (1936).
14. Dulmage. Meyers, and Lipscomb, J. Chem.Phys. 19. 1432 (1951).
15. F. Kaufman, and J. Kelso, J. Chem. Phys. 23, 1702 (1955).
16. E. Freedman and J. Daiber, Unpublished, Cornell Aeronautical Laboratory, Buffalo, New York.
-
- / - I
> I' ,
c DIAPHRAGM TRIGGER i i 44rJ SMOCK SPEED SC-
Fig. 1 Schematic diagram of the apparatus used in the light absorption experiments.
?HOCK SELAXATION CONTACT
ultraviolet
I / Z To NO- 1/4%
PI = I O O m m
U s = 2 . 2 0 m m /
T,= 4460 O K
02
p sec
5 0 p s e c - I I+ i
T I M E 4
Fig. 2 Typical oscillogram from U. V. absorption experiments showing complete testing time.
i I
20 I /
I I
I 1 8
0 ,Et-. 0 2 4 6
T,x10-3(oK)
Fig. 3 Absorption coefficients of NO and-02 per cm. of path length a& a density corresponding to P = 1 atm and T = 300 K.
log.
Fig. 4
U O . 5 0 % NO P, = 1.033 mm
Us=2.11 mm/p
p,=4.87 - 2/ T, 53100 O K
.sec f 0
Typical oscillograms showing the vibrational relaxation of NO.
1.01 \ \ i
Fig. 5 Experimental plot of l-Ev/Ef against laboratory time. The two cases shown result from the oscillograms of Fig. 4.
,
i
/
3
Fig. 6 Experimental vibrational (particle) t imes standardized to normal deneity. data according to the theory of Schwartz, Slawsky and Herzfeld. of T for NO-NO ( f = l ) and NO-Ar ( f = O ) collisions.
The solid curves a r e fitted to the
The dashed curves show the deduced values
Fig. 7 Experimental and theoretical. transition probabilities for de-exciting the f i r s t vibrational level of NO.
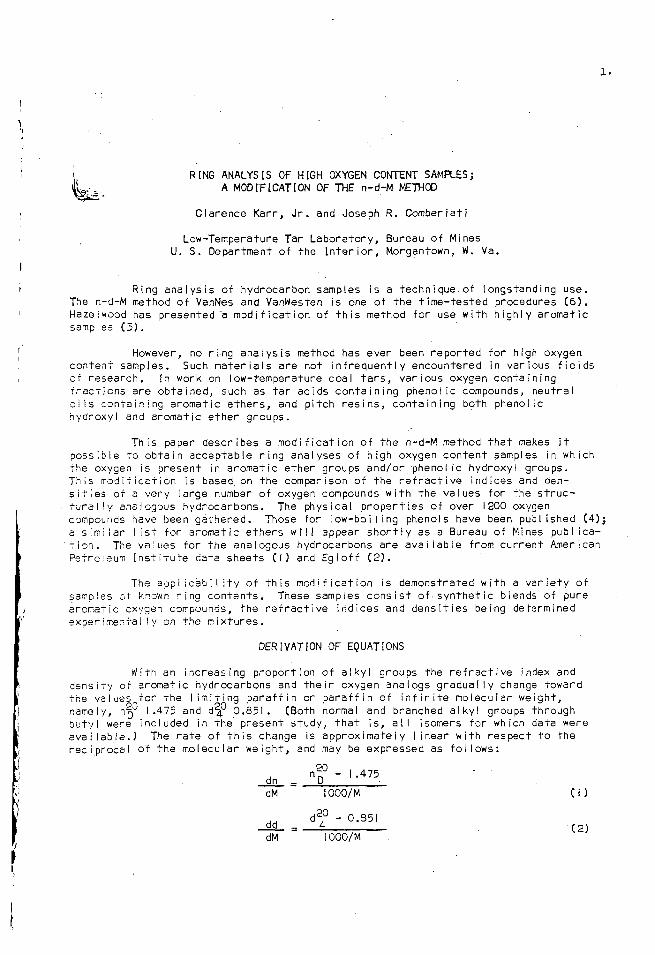


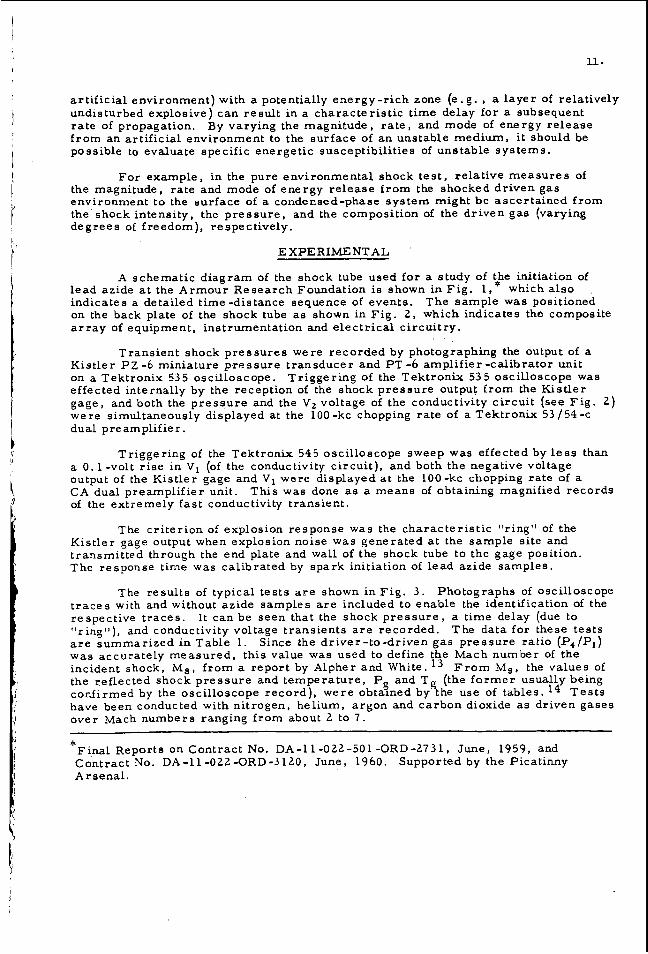


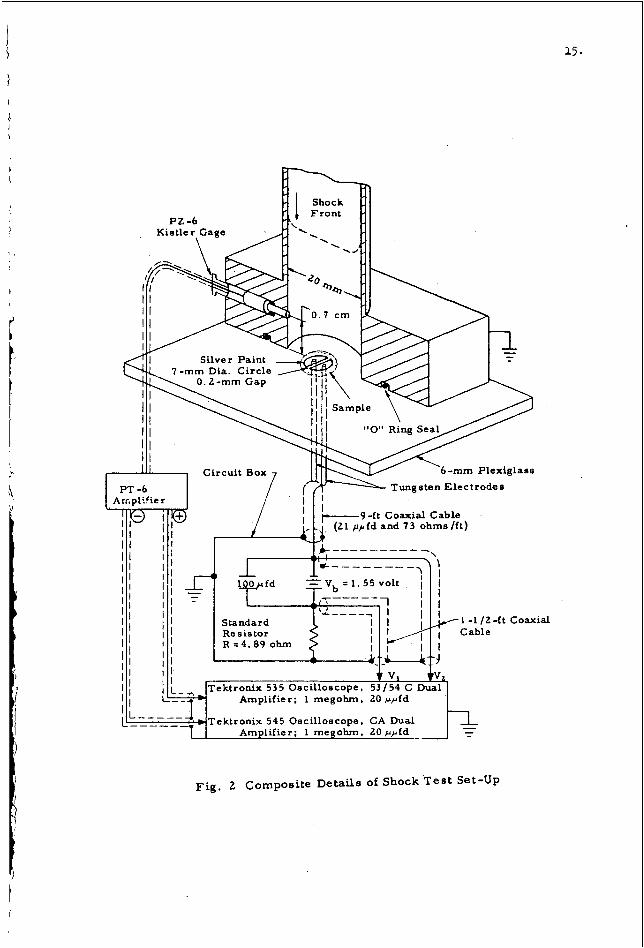


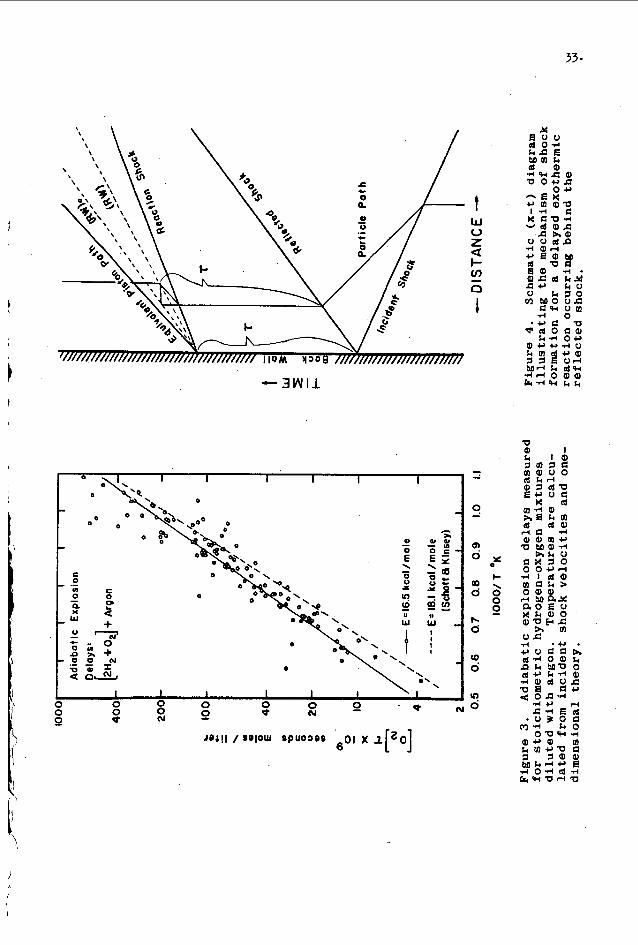


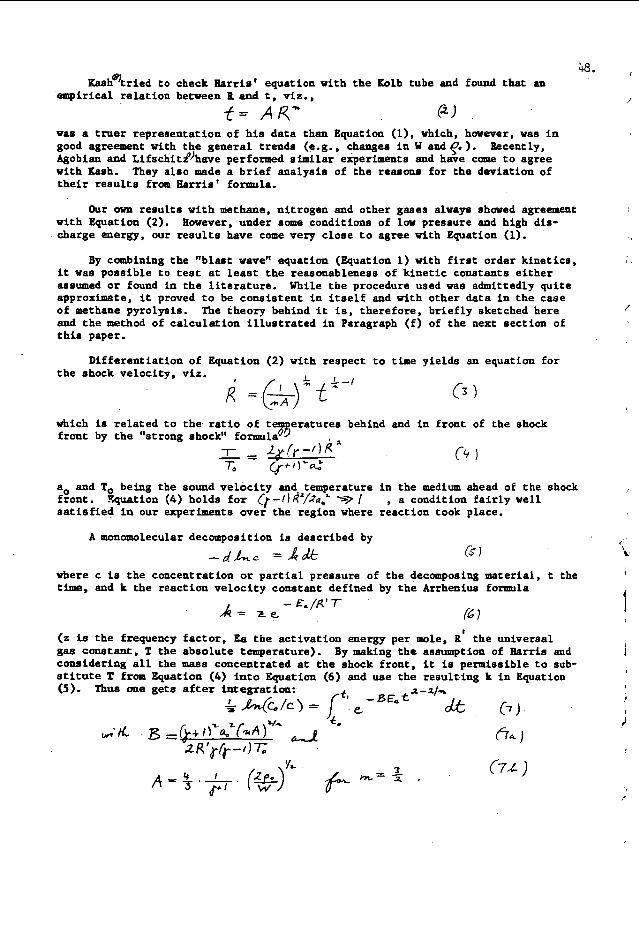
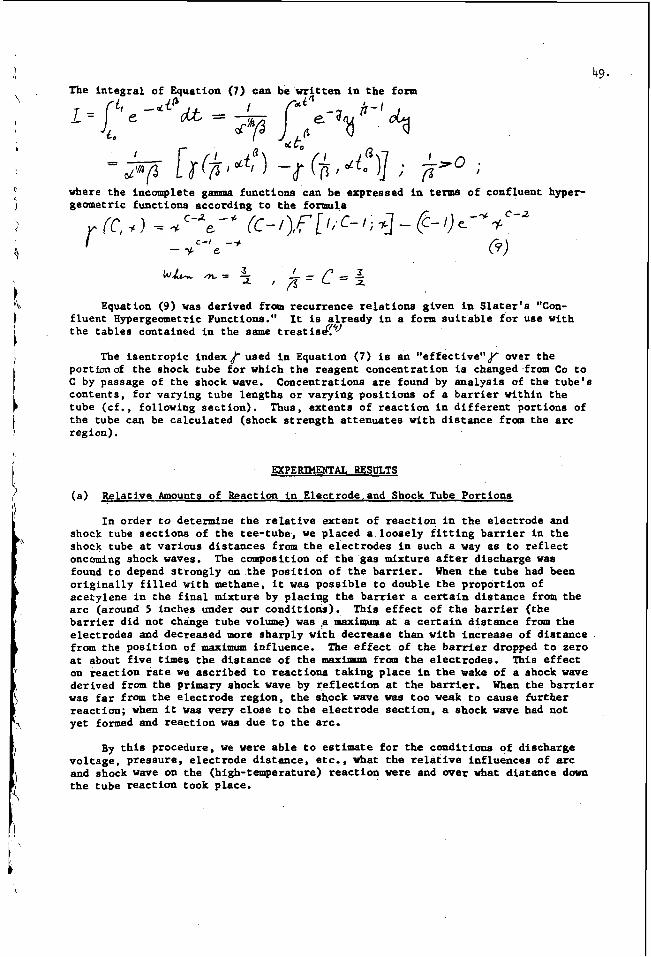
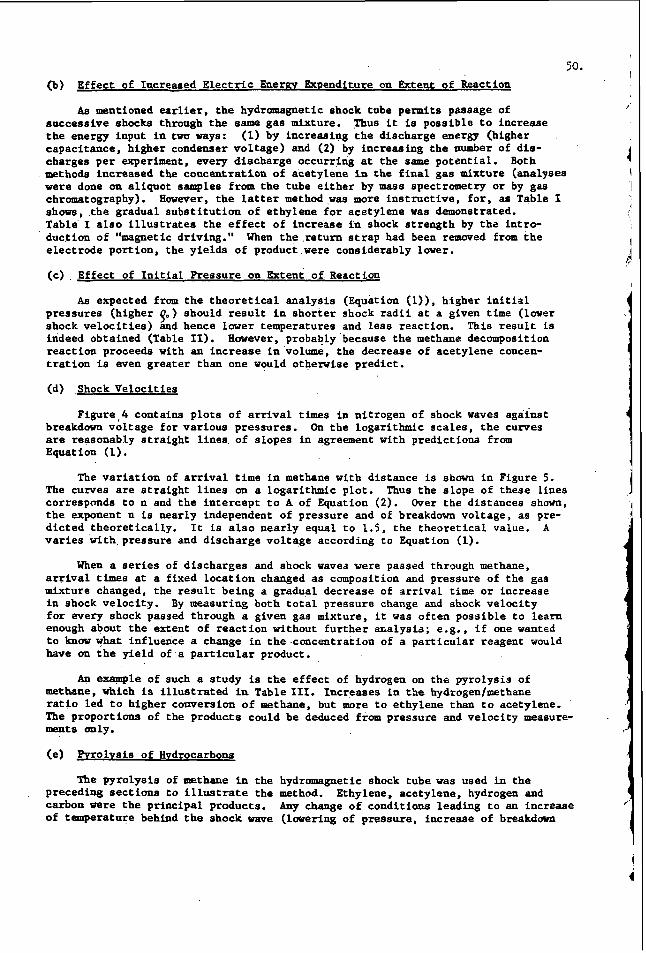


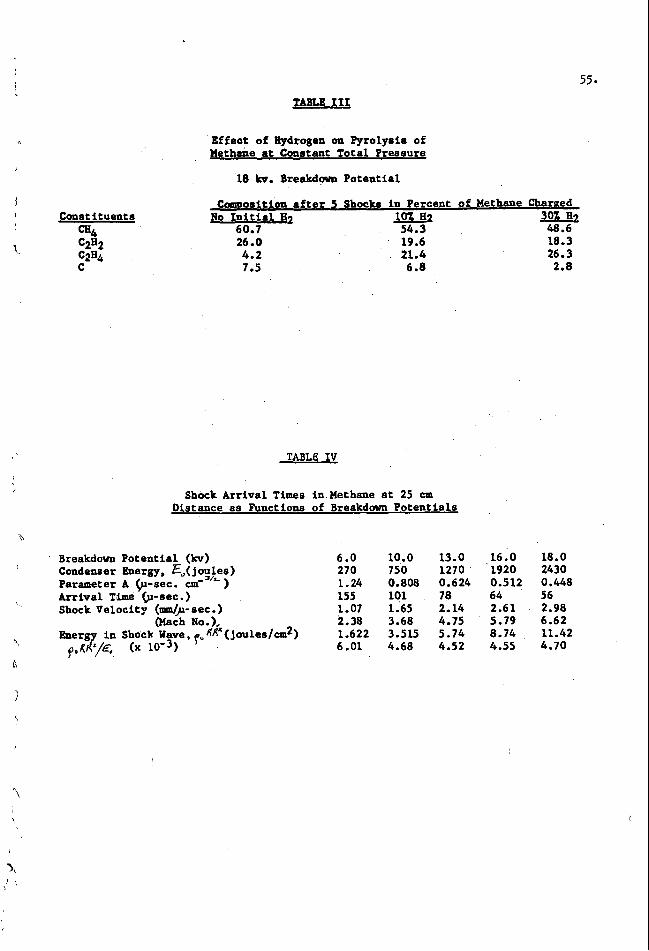
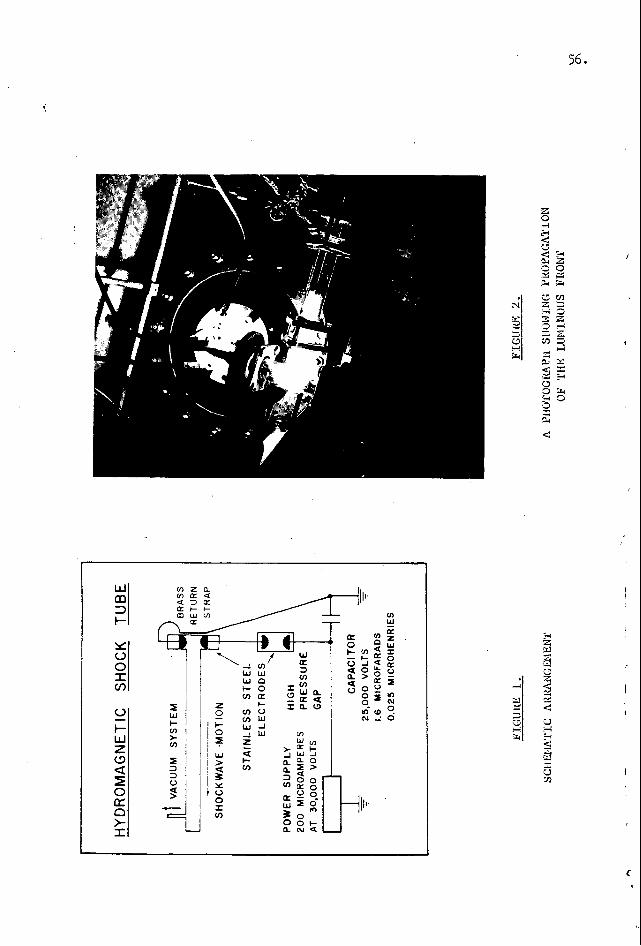
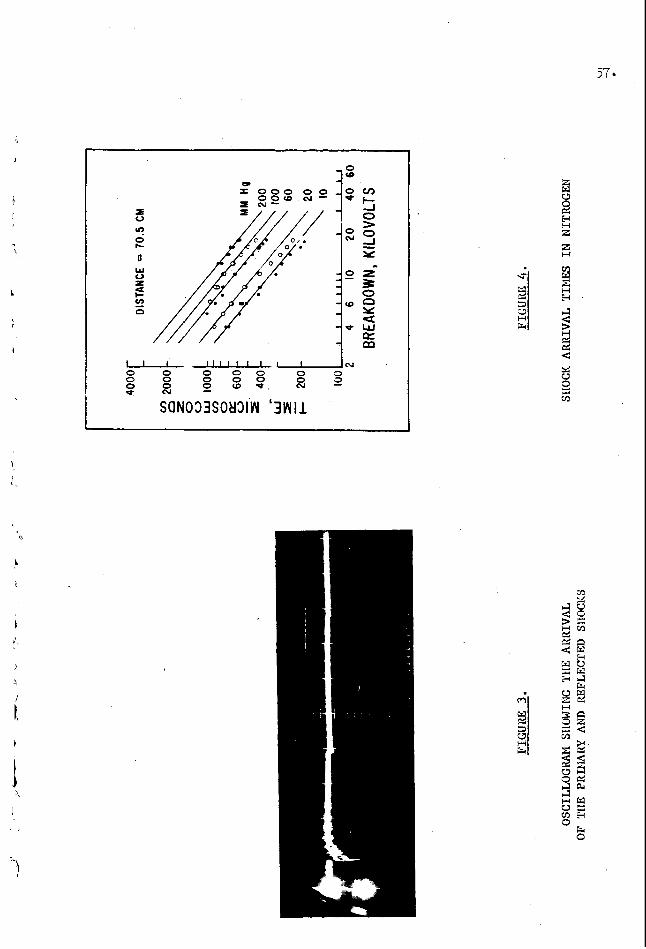

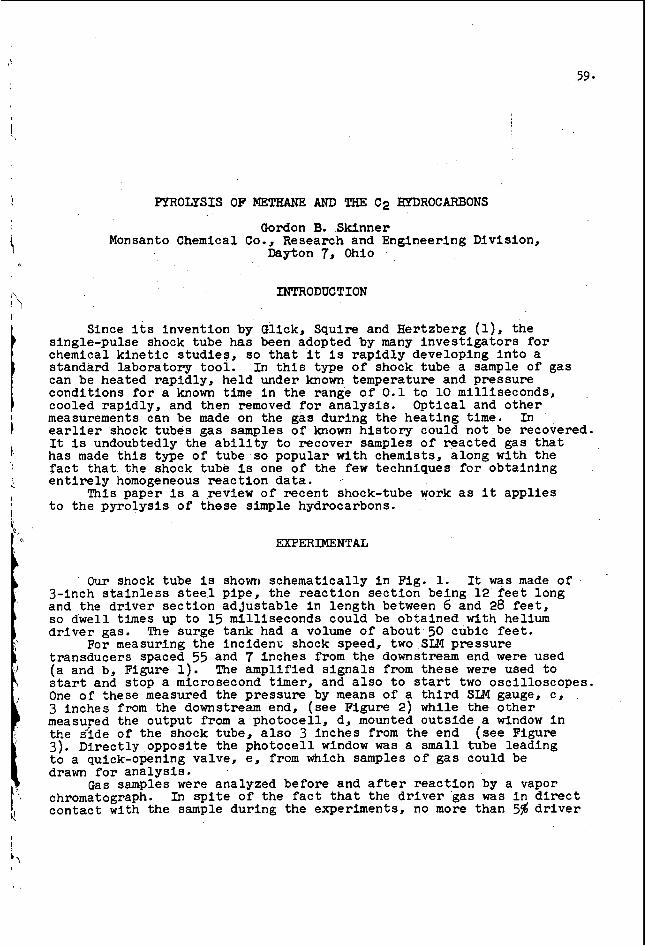
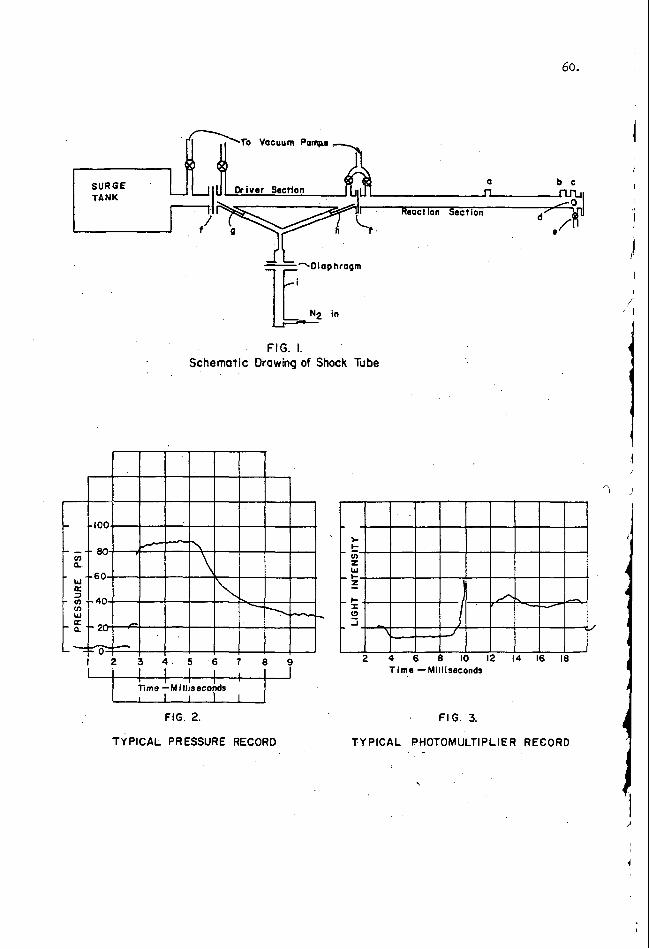


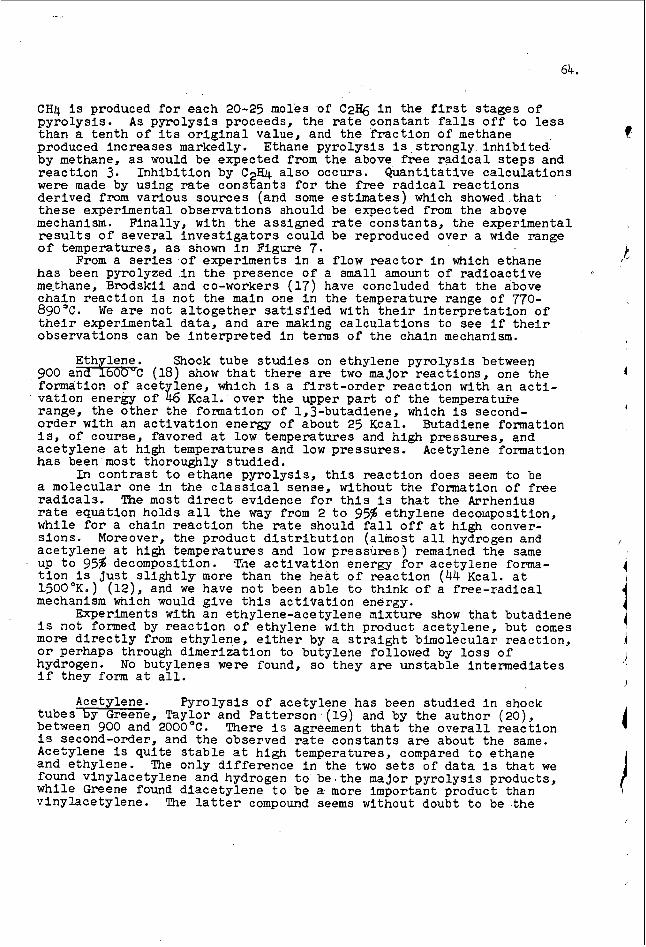


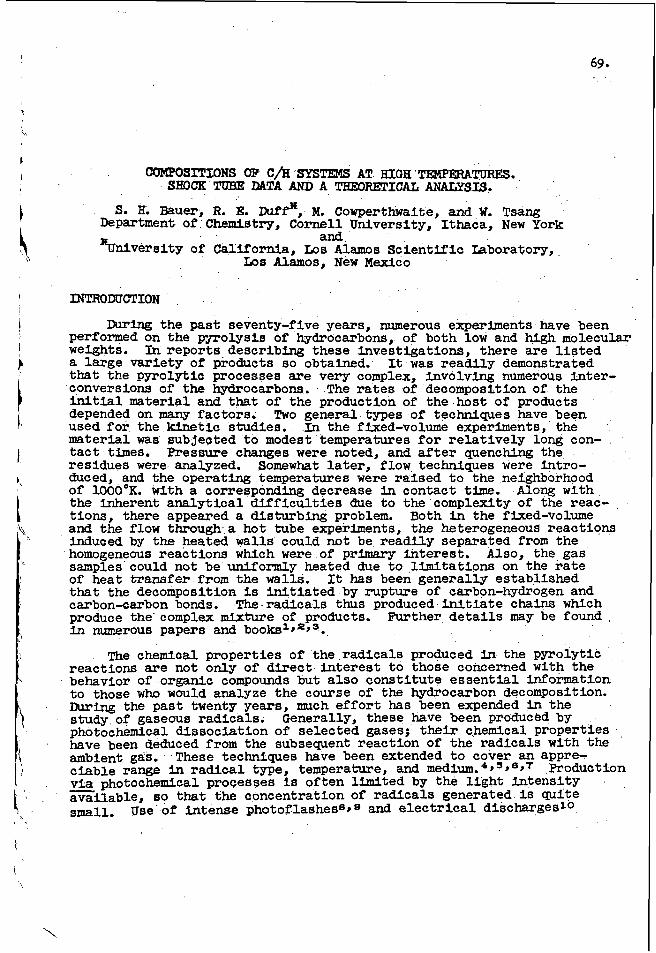


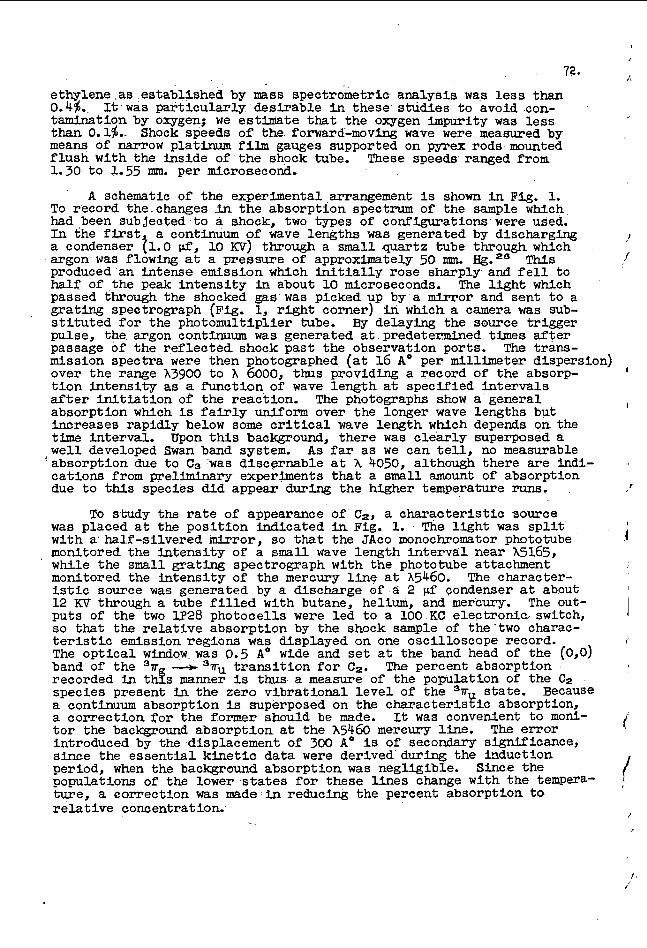
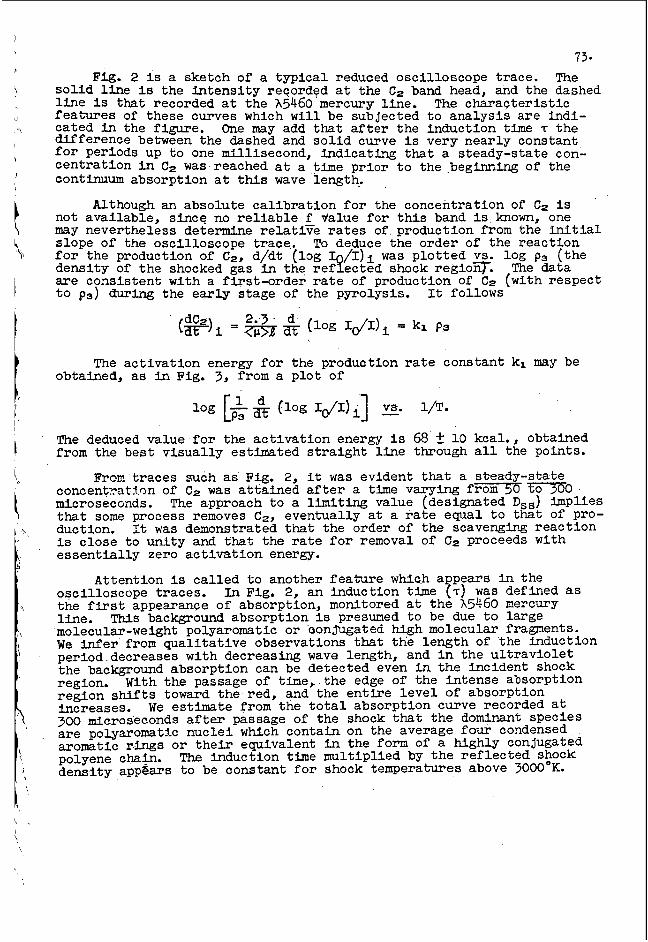
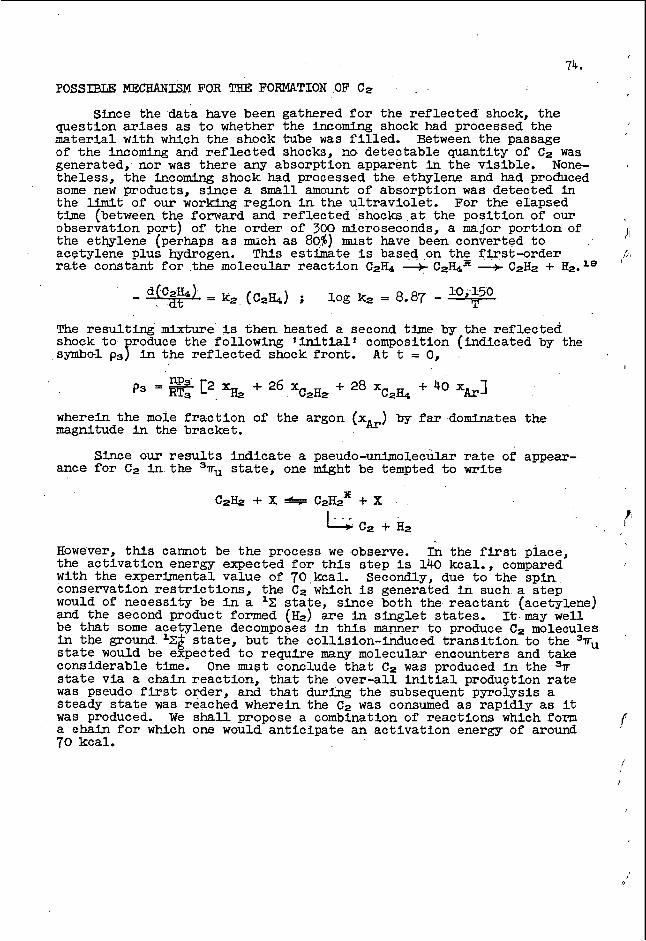

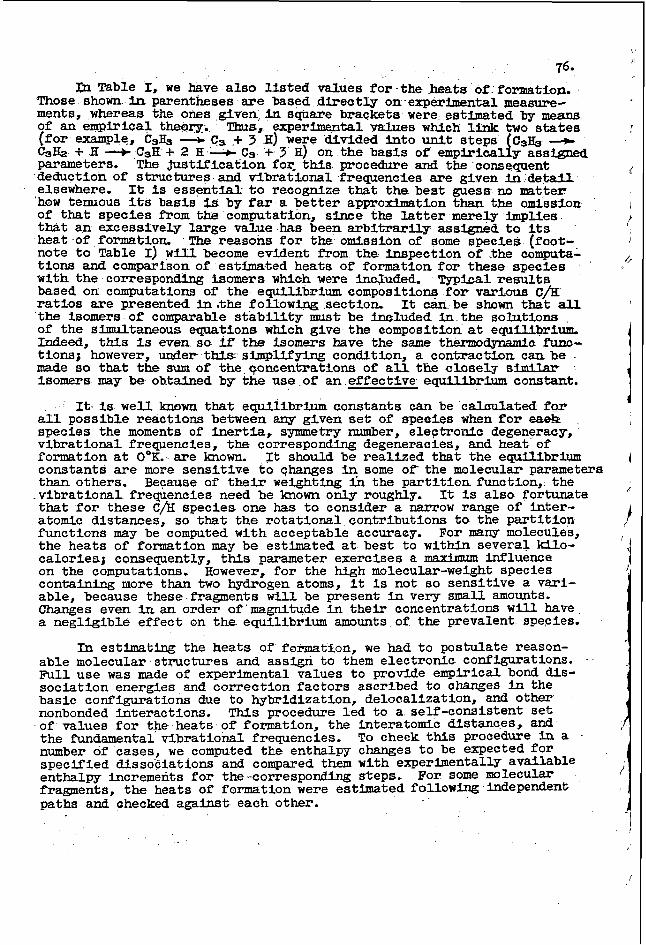
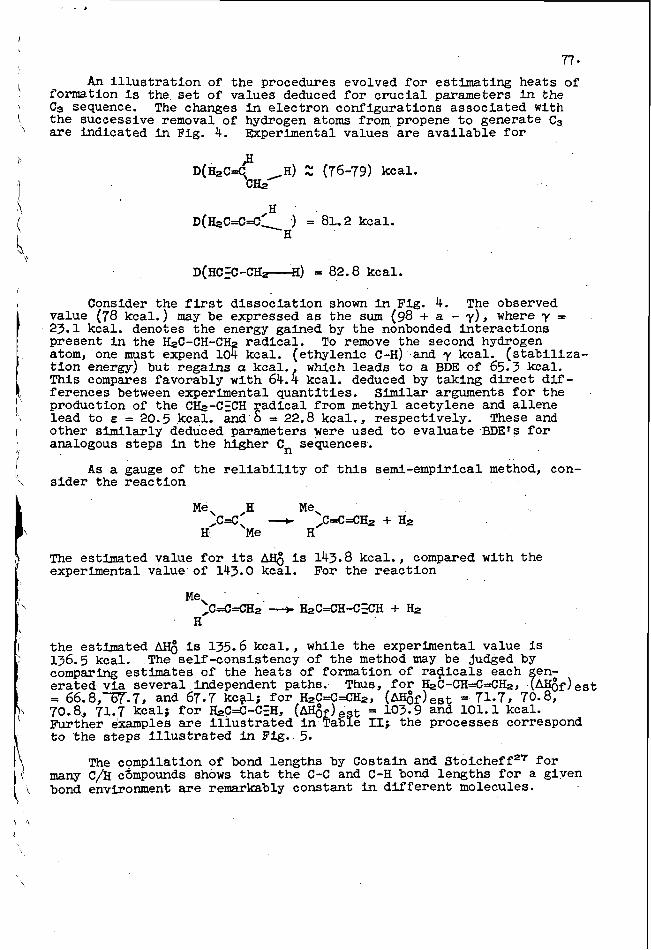


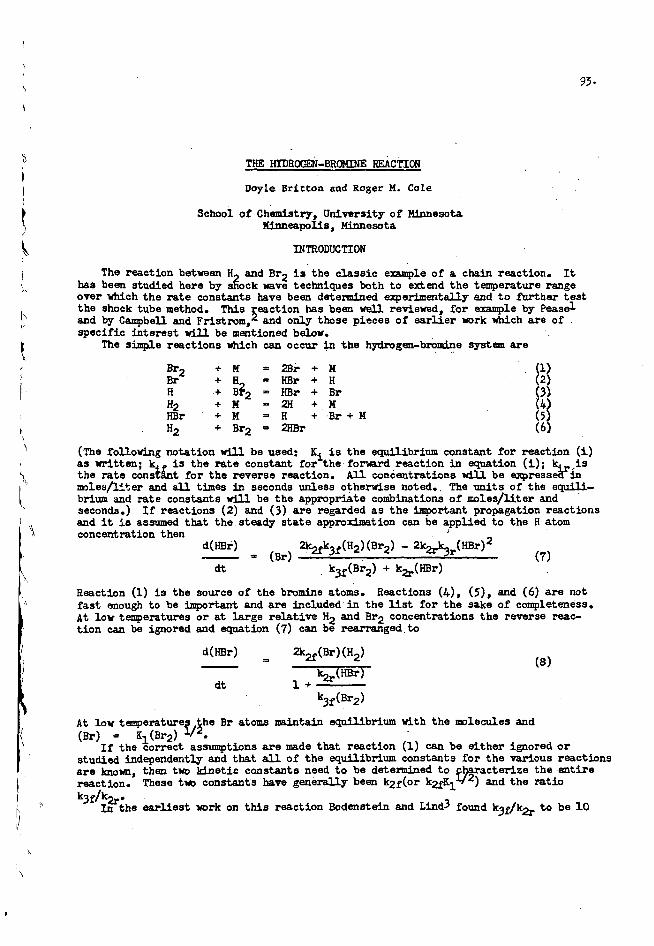

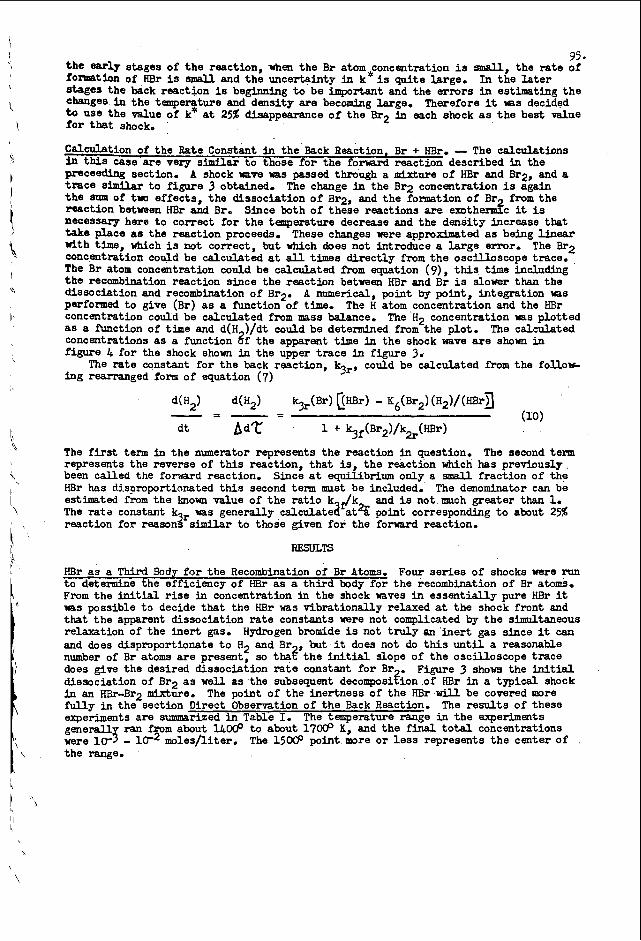

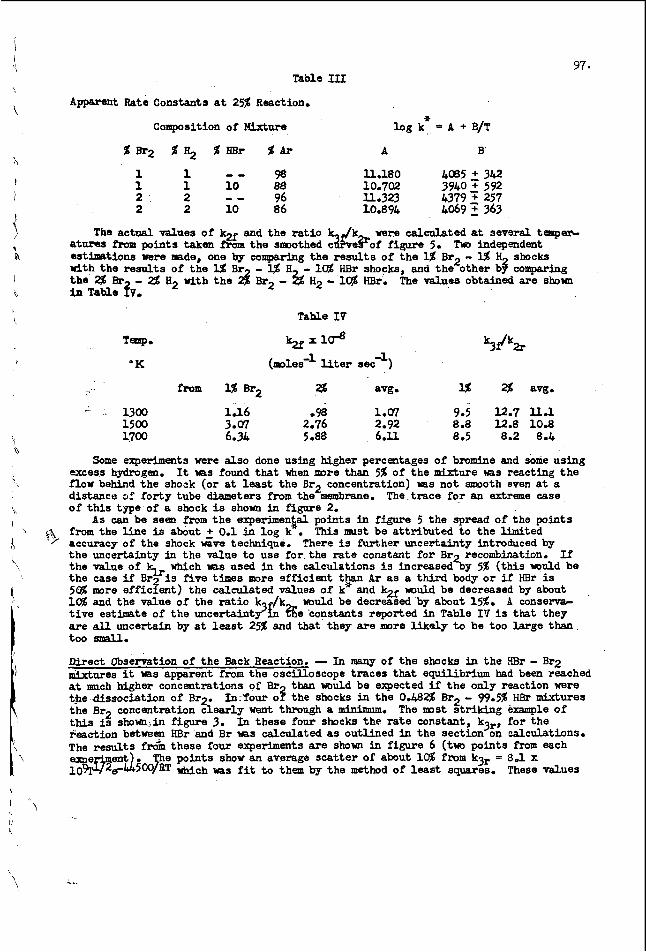


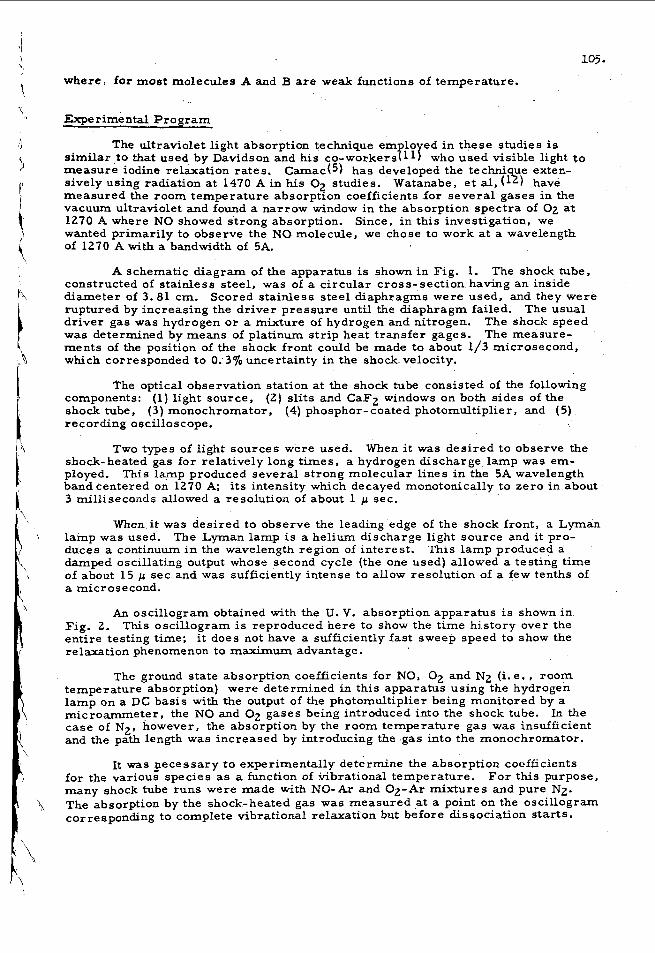


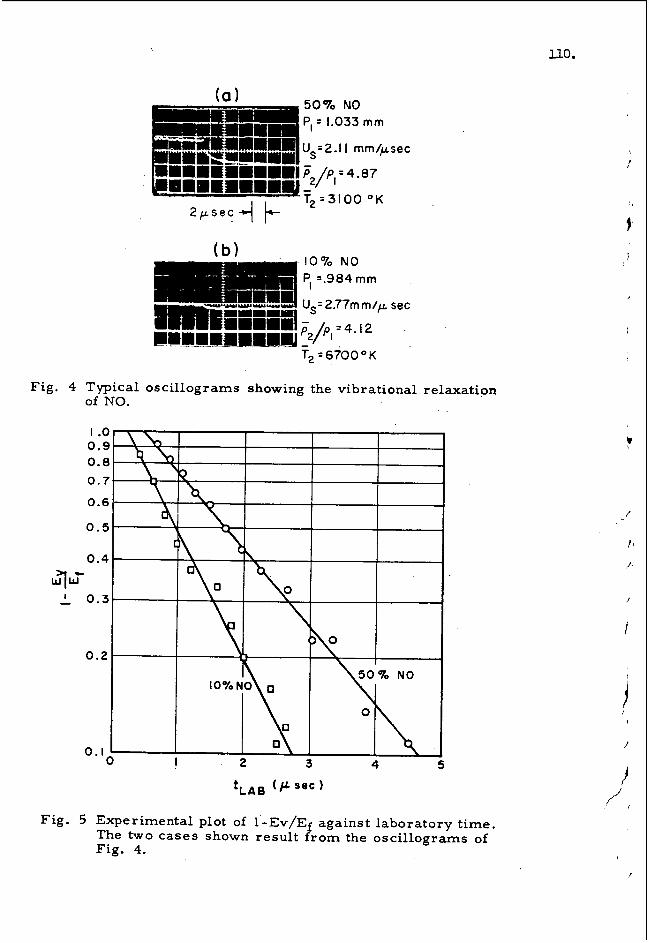


![To love ru vol05 [haru ka]](https://static.documents.pub/doc/80x56/568cada01a28ab186dac7488/to-love-ru-vol05-haru-ka.jpg)


