Subscriber access provided by Univ. of Texas Libraries Langmuir is published by the American Chemical Society. 1155 Sixteenth Street N.W., Washington, DC 20036 Observation and characterization by scanning tunneling microscopy of structures generated by cleaving highly oriented pyrolytic graphite Hsiangpin. Chang, and Allen J. Bard Langmuir, 1991, 7 (6), 1143-1153 • DOI: 10.1021/la00054a021 Downloaded from http://pubs.acs.org on January 23, 2009 More About This Article The permalink http://dx.doi.org/10.1021/la00054a021 provides access to: • Links to articles and content related to this article • Copyright permission to reproduce figures and/or text from this article
Transcript
Subscriber access provided by Univ. of Texas Libraries
Langmuir is published by the American Chemical Society. 1155 Sixteenth Street N.W.,Washington, DC 20036
Observation and characterization by scanning tunneling microscopyof structures generated by cleaving highly oriented pyrolytic graphite
Hsiangpin. Chang, and Allen J. BardLangmuir, 1991, 7 (6), 1143-1153 • DOI: 10.1021/la00054a021
Downloaded from http://pubs.acs.org on January 23, 2009
More About This Article
The permalink http://dx.doi.org/10.1021/la00054a021 provides access to:
• Links to articles and content related to this article• Copyright permission to reproduce figures and/or text from this article
Observation and Characterization by Scanning Tunneling Microscopy of Structures Generated by Cleaving Highly
Oriented Pyrolytic Graphite Hsiangpin Changf and Allen J. Bard'
Department of Chemistry, The University of Texas at Austin, Austin, Texas 78712
Received September 17, 1990. In Final Form: December 3, 1990
In addition to atomically smooth plateaus, many different structures can be observed on freshly cleaved highly oriented pyrolytic graphite (HOPG) by scanning tunneling microscopy (STM). These features vary greatly in morphology and structure. Images at cleavage steps, graphite strands, and ultrasmall particles were obtained with atomic resolution. Also seen on a larger scale were island-forming fiber clusters and folded-over and broken flakes. The cleavage of HOPG thus leaves broken graphite pieces and other features, which can cover as much as 1-10% of the surface. These structures are characterized by high conductivity, high stability, and a graphitic atomic structure, which help serve to distinguish these STM images from those produced by species placed on HOPG. These results were used to explain images of some features obtained on HOPG coated with the polymer Nafion. These are assigned to unusualgraphitic structures formed during sample preparation rather than to Ndion itself.
Introduction
Highly oriented pyrolytic graphite (HOPG) has been used as electrode material in several applications.' This is because of its easily renewable and atomically flat surface, well-defined structure, and similarities to other carbon materials including glassy carbon, carbon black, and pyrolytic graphite, which are widely used in elec- troanalysis, organic electrosynthesis, and fuel cells.1a*2 For example, HOPG serves as a simple model for studying the effects of surface treatment by laser irradiation: heat: and electrolysis5 on the electron-transfer rates of many electrode processes on carbon electrodes6 and the rela- tionship between surface microstructure and chemical activity. Activated HOPG was used as an electrochemical detector for liquid chr~matography.~a In addition, HOPG has been used in double-layer capacitance studies: elec- trochemical energy storage systems,8 and other applica- t i o n ~ . ~ Wide interest also exists in the chemical modifi-
* Author to whom correspondence should be directed. + Current address: Westhollow Research Center, Shell Develop-
ment Company, Houston, T X 77082. (1) (a) Kinoshita, K. Carbon: Electroehemicalandphysical Properties;
Wiley: New York, 1988. (b) Moore, A. W. In Chemistry and Physics of Carbon; Walker, P. L., Jr., Thrower, P. A., Eds.; Marcel Dekker: New York, 1973; Vol. 11, pp 69-187. (c) Moore, A. W. Chemistry and Physics of Carbon; Walker, P. L., Jr., Thrower, P. A., Eds.; Marcel Dekker: New York, 1981; Vol. 17, pp 233-286.
(2) (a) Sarangapani, S., Akridge, J. R., Schuman, B., Eds. Proceedings of the Workahop on theElectrochemistry of Carbon; The Electrochemical Society: Pennington, NJ, 1984. (b) Randin, J. P. In Encyclopedia of Electrochemistry of the Elements; Bard, A. J., Ed.; Dekker: New York, 1976; Vol. 7, pp 1-291.
(3) (a) Bowling, R.; Packard, R.; McCreery, R. L. J. Electrochem. SOC. 1988,135, 1605. (b) Rice, R. J.; McCreery, R. L. Anal. Chem. 1989,61, 1637. (c) Bowline. R. J.: Packard. R. T.: McCreerv. R. L. J. Am. Chem. _ . SOC. is;SS,iii, i5i7. '
(4) Hollax, E.; Cheng, D. S. Carbon 1985,23,655. (5) (a) Wightman, R. M.; Paik, E. C.; Borman, S.; Dayton, M. A. Anal.
Chem. 1978,50,1410. (b) Wightman, R. M.; Deakin, M. R.; Kovach, P. M.; Kuhr, W. G.; Stutls, K. J. J. Electrochem. SOC. 1984,131, 1578.
(6) (a) Nagaoka, T.; Yoshino, T. Anal. Chem. 1986,58,1037. (b) Eng- strom, R. C.; Strasser, V. A. Anal. Chem. 1984,56, 136. (c) Engstrom, R. C. Anal. Chem. 1982,54,2310.
(7) (a) Besenhard, J. 0.; Theodoridon, E.; Mohwald, H.; Nickl, J. J. Synth. Met. 1982, 4, 211. (8) (a) Randin, J. P.; Yeager, E. J. Electrochem. SOC. 1971, 118, 711.
(b) J. Electroanal. Chem. Interfacial Electrochem. 1972,36,257. (c) J. Electroanal. Chem. Interfacial Electrochem. 1976.58.313. (d) Marcos. I. J. Phys. Chem. 1972, 76,2750.
0743-7463 f 91 f 24O1-1143$02.50/0
cation of graphite surfaces, e.g., by irreversible adsorption.1° In all of these studies and applications, defects and surface structures on HOPG and other graphite-related materials presumably play an important role, especially in associ- ation with activation of the graphite surface. However, there has been a lack, of techniques to characterize, with high resolution, naturally occurring and artificially induced structures on graphite.
Microscopic study of the defects on graphite-related materials has been important in many different fields other than electrochemistry, such as materials science," gas- carbon reactions or gasification of graphite,12 nuclear reactors,13 and heterogeneous catalysis.14 Scanning and transmission electron microscopy (TEM) have been the main tools used in these investigations. The resolution, however, especially in the vertical direction, of TEM limits the further development of these fields. Besides, the operation of TEM requires a sample thickness of <800 A and removal of the specimen to a vacuum system, which diminishes its convenience. However, STM15 can be used to study carbons at or near atomic resolution.
(9) (a) Uchida, I.; Ishiho, A.; Mataue, T.; Itaya, K. J. Electroanal. Chem. Interfacial Electrochem. 1989,266,455. (b) Morcos, I. J. Electroanal. Chem. Interfacial Electrochem. 1975, 66, 250.
(10) (a) See review by Albery, W. J.; Hillman, A. R. Annu. Rep. Prog. Chem., Sect. C 1981,78,377. (b) Brown, A. P.; Anson, F. C. Anal. Chem. 1977,49,1589. (c) Collman, J. P.; Marrocco, M.; Denisevich, P.; Koval, C.; Anson, F. C. J. Electroanal. Chem. Interfacial Electrochem. 1979, 101, 117.
(11) (a) Amelinckx, S.; Delavignette, P.; Heerschap, M. In Chemistry and Physics of Carbon; Walker, P. L., Jr., Ed.; Marcel Dekker: New York, 1965; Vol. 1, pp 2-73. (b) Thrower, P. A. In ChemistryandPhysics of Carbon; Walker, P. L., Jr., Ed.; Marcel Dekker: New York, 1969; Vol.
(12) (a) Yang, R. T. In Chemistry and Physics of Carbon; Walker, P. L., Jr., Thrower, P. A., Eds.; Marcel Dekker: New York, 19&1; Vol. 19, pp 163-210. (b) Hennig, G. R. In Chemistry and Physics of Carbon; Walker, P. L., Jr., Ed.; Marcel Dekker: New York, 1966; Vol. 2, pp 1-50. (c ) Thomas, J. M. In Chemistry and Physics of Carbon; Walker, P. L., Jr., Ed.; Marcel Dekker: New York, 1965, Vol. 1, pp 122-203.
(13) (a) Brocklehurst, J. E.; Kelly, B. T.; Gilchrist, K. E. In Chemistry and Physics of Carbon; Walker, P. L., Jr., Thrower, P. A., Eds.; Marcel Dekker: New York, 1981; Vol. 17, pp 175-231. (b) Taylor, R. E.; Kline, D. E. Chemistry and Physics of Carbon; Walker, P. L., Jr., Ed.; Marcel Dekker: New York, 1970; Vol. 6, pp 283-336.
(14) (a) Coughlin, R. W. Ind. Eng. Chem. Prod. Res. Deu. 1969,8,12. (b) Tomita, A.; Mori, S.; Tamai, Y. Carbon 1971,9, 224. (15) (a) Binnig, G.; Rohrer, H. Helu. Phys. Acta 1982, 55, 726. (b)
Binnig, G.; Rohrer, H.; Gerber, Ch.; Weibel, E. Phys. Reu. Lett. 1982,49, 57. (c) Binnig, G.; Rohrer, H.IBM J. Res.Deu. 1986,30,355. (d) Hansma, P.; Tersoff, J. J. Appl. Phys. 1987, 61, R1.
5, pp 217-320.
0 1991 American Chemical Society
1144 Langmuir, Vol. 7, No. 6, 1991
HOPG has been the subject of numerous studies by STM. These include investigations of the STM images of the atomic structure of HOPG, e.g., regular basal plane structure,le giant corrugations,'7 and asymmetric atomic structures.18 There have been a few r e p ~ r t s ' ~ * ~ on the observation of different structures on graphite, e.g., grain b o u n d a r i e ~ , ~ ~ J ~ ~ dislocations,lsb cleavage steps,l% and point defects.20 There are also several reports on STM studies of oxidized21 and sputtered22 HOPG. Because a clean, atomically smooth surface can be produced by cleaving HOPG, HOPG is a widely used substrate for STM imaging of organic and biological materials. However, in our efforts to use STM to image Nafion, an ion-exchange polymer, or other species placed on an HOPG substrate, many structures of different morphologies were found. These do not correspond to the structure of Nafion or other species, but rather represent graphite structures on HOPG that have not been reported before.
This investigation was motivated by the fact that defects and other structures on HOPG have not been fully studied with STM or cataloged very well. This is probably because in most STM investigations HOPG is used as a simple substrate and the typical scan size is limited to 5 10 X 10 nm. Recognition of the different types of structures that can be present on freshly cleaved HOPG is important in distinguishing these from actual structures produced by species placed on an HOPG substrate and imaged by STM. Therefore, we decided to catalog and characterize, with STM at various magnifications, the different structures that can be found upon cleavage of HOPG and describe here several different types that we have frequently observed. We will use these results to explain some images obtained on Nafion-covered samples, which are otherwise difficult to understand.
Experimental Section The STM used in this study was a NanoScope I1 (Digital
Instruments, Santa Barbara, CA). Two scanning heads were used, with maximum scan ranges of 400 X 400 and 15 OOO X 15 OOO nm. The images reported here usually did not change with variation of the scanning parameters. Therefore, the values of bias voltage (typically, 100-700 mV), setpoint tunneling current, i (0.4 - 3 nA), and scan rate (1-8.7 Hz) are not given for individual images. All pictures shown were obtained in the height image (constant current) mode; however, for comparison, current images were taken occasionally. All images are presented as the
(16) (a) Park, S.; Quate, C. F. Appl. Phys. Lett . 1986, 48, 112. (b) Reihl, B.; Ginzewski, J. K.; Nicholls, J. M.; Toeatti, E. Phys. Rev. B Condens. Matter 1986,33,5770. (c) Schneir, J.; Sonnenfeld,R.; Hansma, P. K.; Tersoff, J. Phys. Rev. B: Condens. Matter 1986,34,4979.
(17) (a) Tersoff, J. Phys. Rev. Lett . 1986, 57, 440. (b) Soler, J. M.; Baro, A. M.; Garcia, N.; Rohrer, H. Phys. Rev. Lett . 1986, 57, 444. (c) Pethica, J. B. Phys. Rev. Lett . 1986, 37, 3235. (d) Batra, I. P.; Garcia, N.; Rohrer, H.; Salemink, H.; Stoll, E.; Ciraci, S. Surf. Sci. 1987,181,126.
(18) (a) Tomanek, D.; Louie, S. G.; Mamin, H. J.; Abraham, D. W.; Thomson, R. E.; Ganz, E.; Clarke, J. Phys. Rev. B: Condens. Matter 1987, 35, 7790. (b) Tomanek, D.; Louie, S. G. Phys. Reu. B: Condens. Matter. 1988, 37, 8327. (c) Mamin, H. J.; Ganz, E.; Abraham, D. W.; Thomson, R. E.; Clarke, J. Phys. Rev. B Condens. Matter. 1986, 34, 9015.
(19) (a) Albrecht, T. R.; Mizes, H. A.; Nogami, J.; Park, S.4 . ; Quate, C. F. Appl. Phys. Lett . 1988,52,362. (b) Salemink, H. W. M.; Batra, I. P.; Rohrer, H.; Stoll, E.; Weibel, E. Surf. Sci. 1987,181,139. (c) Rabe, J. P.; Sano, M.; Batchelder, D.; Kalatcher, A. A. J. Microsc. 1988, 152, 573. (d) Morita, S.; Trukada, S.; Mikoshiba, N. Jpn. J . Appl. Phys. 1987, 26, L1511. (e) Fuchs, H. Fresenius' Z . Anal. Chem. 1987,329, 113.
(20) (a) Mizes, H. A.; Foster, J. S. Science 1989,244, 559. (b) Mizes, H. A.; Harrison, W. A. J. Vac. Sci. Technol., A 1988,6,300. (c) Soto, M. R. Surf. Sci. 1990,225,190.
(21) (a) Gewirth, A. A.; Bard, A. J. J . Phys. Chem. 1988,92,5563. (b) Porter, L.; Richard, D.; Gallezot, P. J . Microsc. 1988,152, 515. (c) Hu- bagel, J. 5.; Brockenbrough, R. T.; Gammie, G.; Skala, S. L.; Lyding, J. W.; Latten, J. L.; Shapley, J. R. J . Microsc. 1988, 152, 221.
Figure 1. Schematic illustration of the morphologies of the different structures observed on HOPG following cleavage: (a) cleavage step; (b) ridge; (c) graphite strand; (d) folded-over flake and piece; (e) broken graphite pieces; (f) broken carbon particles.
raw data without smoothing or Fourier transformation, but some of the large-scale pictures have been flattened.
Pt-Ir microtips were obtained by electrochemical etching of the commercially available tips from Digital Instruments, fol- lowing described procedures.29 Slightly damaged tips, e.g., following a "tip crash", could be regenerated by the following procedure. The tip at 25 V was lowered into the etching solution" with 1-2 mm of the tip immersed in the solution. The tip waa raised with decreasing speed, so that the end of the tip was etched more. The tip was dipped into the solution a few times at 5 V. Good tips were obtained or regenerated with high reproducibility. This process took ca. 30 s (vs 3-5 min for the method to make a new tip).
The HOPG samples were obtained from Dr. Arthur W. Moore of Union Carbide Corp., Parma, OH. Several different samples of different grades were imaged in this work. Structures of the type described were seen on all of these, so that the coverage by "anomalous" structures is probably more related to the cleavage than to the grade of graphite. All HOPG samples were cleaved repeatedly so that large planar areas were exposed. In most cases, commercial adhesive tape was used and the cleavage was carried out by sticking the tape to the sample with finger pressure. In a few cases, as indicated, a razor blade was used as a wedge in the edge plane to expose fresh basal plane layers. Only those regions without obvious gross defects were imaged. For studies with Nafion, a 0.0052% (weight/volume) solution of protonated Nafion (EW = 1100, Aldrich, Milwaukee, WI) in acetonitrile was used to drop-coat the HOPG samples.
Results and Discussion Summary of the Types of Structures Observed.
The different structures can be classified into the following categories for the convenience of identification and discussion, and are illustrated schematically in Figure 1. This classification is based on the observation of a large number of similar structures over many different samples. The classification is, however, not a very strict one, since the different variations are often related to one another and can coexist in the same region. Moreover, structures are sometimes observed that cannot be placed into any of these categories. We classify the structures as follows: (1) Cleavage steps (Figure la), Le., line structures with height differences on two sides of the lines. They can appear as perfect steps as shown on the left in Figure l a or as distorted steps as shown on the right. Some of the steps
(23) Gewirth, A. A.; Craston, D. H.; Bard, A. J. J . Electroanal. Chem. Interfacial Electrochen. 1989,201,477.
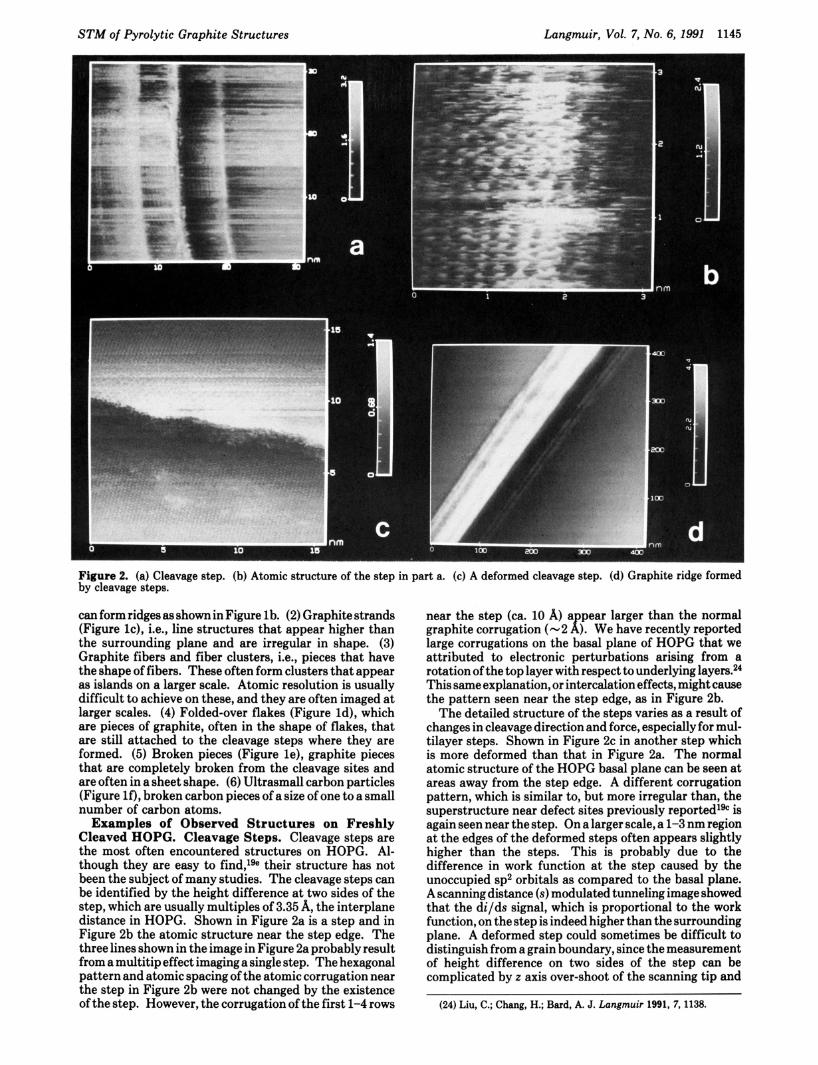
Figure 2. (a) Cleavage step. (b) Atomic structure of the step in part a. (c) A deformed cleavage step. (d) Graphite ridge formed by cleavage steps.
can form ridges as shown in Figure lb. (2) Graphite strands (Figure IC), i.e., line structures that appear higher than the surrounding plane and are irregular in shape. (3) Graphite fibers and fiber clusters, i.e., pieces that have the shape of fibers. These often form clusters that appear as islands on a larger scale. Atomic resolution is usually difficult to achieve on these, and they are often imaged at larger scales. (4) Folded-over flakes (Figure Id), which are pieces of graphite, often in the shape of flakes, that are still attached to the cleavage steps where they are formed. (5) Broken pieces (Figure le), graphite pieces that are completely broken from the cleavage sites and are often in a sheet shape. (6) Ultrasmall carbon particles (Figure If), broken carbon pieces of a size of one to a small number of carbon atoms.
Examples of Observed Structures on Freshly Cleaved HOPG. Cleavage Steps. Cleavage steps are the most often encountered structures on HOPG. Al- though they are easy to find,lge their structure has not been the subject of many studies. The cleavage steps can be identified by the height difference at two sides of the step, which are usually multiples of 3.35 8, the interplane distance in HOPG. Shown in Figure 2a is a step and in Figure 2b the atomic structure near the step edge. The three lines shown in the image in Figure 2a probably result from a multitip effect imaging a single step. The hexagonal pattern and atomic spacing of the atomic corrugation near the step in Figure 2b were not changed by the existence of the step. However, the corrugation of the first 1-4 rows
near the step (ca. 10 A) a pear larger than the normal
large corrugations on the basal plane of HOPG that we attributed to electronic perturbations arising from a rotation of the top layer with respect to underlying layers.24 This same explanation, or intercalation effects, might cause the pattern seen near the step edge, as in Figure 2b.
The detailed structure of the steps varies as a result of changes in cleavage direction and force, especially for mul- tilayer steps. Shown in Figure 2c in another step which is more deformed than that in Figure 2a. The normal atomic structure of the HOPG basal plane can be seen at areas away from the step edge. A different corrugation pattern, which is similar to, but more irregular than, the superstructure near defect sites previously reported1* is again seen near the step. On a larger scale, a 1-3 nm region at the edges of the deformed steps often appears slightly higher than the steps. This is probably due to the difference in work function at the step caused by the unoccupied sp2 orbitals as compared to the basal plane. A scanning distance (s) modulated tunneling image showed that the di/ds signal, which is proportional to the work function, on the step is indeed higher than the surrounding plane. A deformed step could sometimes be difficult to distinguish from a grain boundary, since the measurement of height difference on two sides of the step can be complicated by z axis over-shoot of the scanning tip and
graphite corrugation (-2 8) ). We have recently reported
~~
(24) Liu, C.; Chang, H.; Bard, A. J. Langmuir 1991, 7,1138.
1146 Langmuir, Vol. 7, No. 6, 1991 Chang and Bard
Figure 3. Graphite strand: (a) section of a graphite strand that stretched more than 6 pm in length; (b) section of the same strand, 1 pm above the section shown in part a; (c) section from the bottom of part a, a double-stranded structure that appears to lie across a cleavage step; (d) graphite strand merged with a cleavage step.
sample tilt. Most cleavage steps are perpendicular to the cleavage direction and are roughly parallel to one another. Folded-over flakes and small broken graphite particles/ pieces are often seen on or near cleavage steps, as discussed later.
Very closely spaced cleavage steps can form straight ridges or narrow plateaus, which appear higher than the surrounding plane and are physically attached to the HOPG surface. The width and height of these ridges varied as is shown in Figure 2d. This ridge, formed on a multilayer cleavage step, was ca. 100 nm in length and ca. 2 nm in height. Atomic resolution was often difficult to achieve on these features.
Graphite Strand. Strandlike structures were occa- sionally seen on the surface. Shown in Figure 3 are the images of several sections of a strand that stretched more than 6 pm in length. The width, height, and secondary structure of the strand vary along with the strand; width from 10 to 16 nm and height from 1 to 3 nm. Of particular interest are the ordered structures shown in parts b and c of Figure 3. Shown in Figure 3b is the section 1 pm above that in Figure 3a, which has a dotted pattern, with each dot having a diameter of about 4 nm. The spacing between the dots is ca. 6 nm along the strand and ca. 5 nm vertical to the strand. The section near the bottom of Figure 3a that appears to lie across a cleavage step (Figure 3c) has a double-stranded structure, with a twisted appearance. The spacing between the two smaller strands is ca. 8 nm.
The strand obviously merges with a cleavage step in Figure 3d. We found that similar strand structures were moved and broken by the scanning tip, so these are not strongly attached to the graphite underlayer. On the basis of our observations, we feel that these strand structures are graphite and not dust or other foreign substances. These graphite strands are probably thin lines of graphite that separate from the cleavage step during cleaving. This mechanism is also supported by the attachment of the strand to a small graphite piece as shown in Figure 3b. Different secondary structures observed can be explained by the graphite strands breaking into smaller pieces upon the impact of falling. There are many differences between the strand shown in Figure 3 and the boundary reported previously by Albrecht et al.19a For example, the strand in Figure 3 is ca. 10 times wider. We cannot compare the heights, because no height scale was given. Besides, no difference in atomic structure is seen on either side of the strand in Figure 3; some tilt was observed in the Albrecht et al. sample.lga
Fibers and Fiber Clusters. On a relatively large scale, irregular islands were occasionally seen. The height and width of the islands varied from a few to tens of nano- meters. Zooming onto these islands revealed different structures. Of particular interest is the fiberlike structures shown in Figure 4. These features are obviously not bonded to or part of the surface of graphite, because their shapes do not match with the substrate, and features like this can sometimes be moved around by the scanning tip.
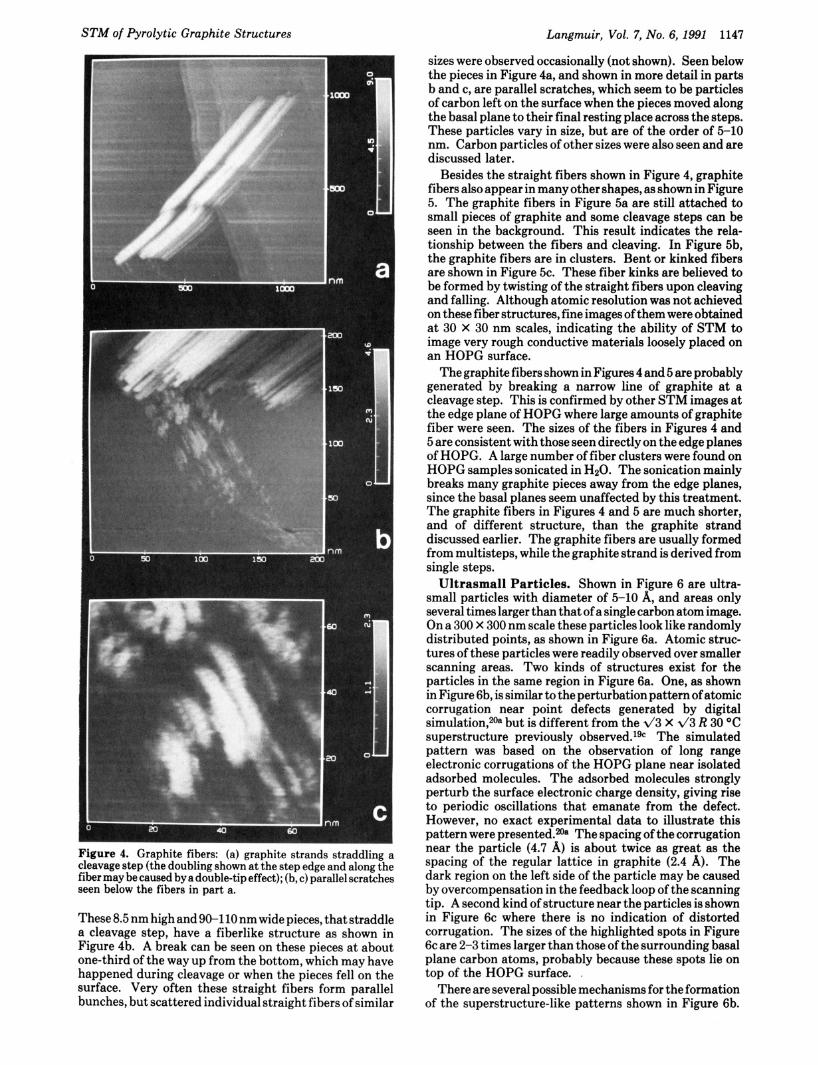
Figure 4. Graphite fibers: (a) graphite strands straddling a cleavage step (the doubling shown at the step edge and along the fiber may be caused by a double-tip effect); (b, c) parallel scratches seen below the fibers in part a.
These 8.5 nm high and 90-110 nm wide pieces, that straddle a cleavage step, have a fiberlike structure as shown in Figure 4b. A break can be seen on these pieces a t about one-third of the way up from the bottom, which may have happened during cleavage or when the pieces fell on the surface. Very often these straight fibers form parallel bunches, but scattered individual straight fibers of similar
sizes were observed occasionally (not shown). Seen below the pieces in Figure 4a, and shown in more detail in parts b and c, are parallel scratches, which seem to be particles of carbon left on the surface when the pieces moved along the basal plane to their final resting place across the steps. These particles vary in size, but are of the order of 5-10 nm. Carbon particles of other sizes were also seen and are discussed later.
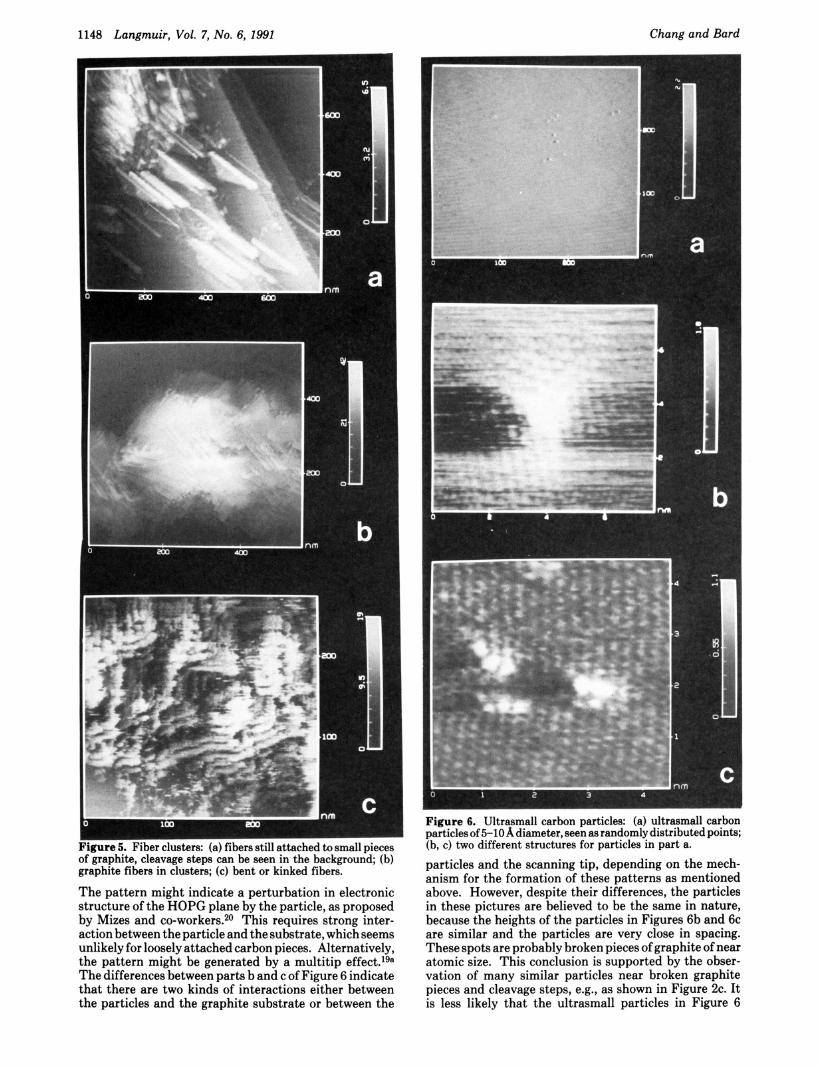
Besides the straight fibers shown in Figure 4, graphite fibers also appear in many other shapes, as shown in Figure 5. The graphite fibers in Figure 5a are still attached to small pieces of graphite and some cleavage steps can be seen in the background. This result indicates the rela- tionship between the fibers and cleaving. In Figure 5b, the graphite fibers are in clusters. Bent or kinked fibers are shown in Figure 5c. These fiber kinks are believed to be formed by twisting of the straight fibers upon cleaving and falling. Although atomic resolution was not achieved on these fiber structures, fine images of them were obtained a t 30 X 30 nm scales, indicating the ability of STM to image very rough conductive materials loosely placed on an HOPG surface.
The graphite fibers shown in Figures 4 and 5 are probably generated by breaking a narrow line of graphite a t a cleavage step. This is confirmed by other STM images at the edge plane of HOPG where large amounts of graphite fiber were seen. The sizes of the fibers in Figures 4 and 5 are consistent with those seen directly on the edge planes of HOPG. A large number of fiber clusters were found on HOPG samples sonicated in H2O. The sonication mainly breaks many graphite pieces away from the edge planes, since the basal planes seem unaffected by this treatment. The graphite fibers in Figures 4 and 5 are much shorter, and of different structure, than the graphite strand discussed earlier. The graphite fibers are usually formed from multisteps, while the graphite strand is derived from single steps.
Ultrasmall Particles. Shown in Figure 6 are ultra- small particles with diameter of 5-10 A, and areas only several times larger than that of a single carbon atom image. On a 300 X 300 nm scale these particles look like randomly distributed points, as shown in Figure 6a. Atomic struc- tures of these particles were readily observed over smaller scanning areas. Two kinds of structures exist for the particles in the same region in Figure 6a. One, as shown in Figure 6b, is similar to the perturbation pattern of atomic corrugation near point defects generated by digital simulation,2oa but is different from the d 3 X 4 3 R 30 "C superstructure previously observed.lgC The simulated pattern was based on the observation of long range electronic corrugations of the HOPG plane near isolated adsorbed molecules. The adsorbed molecules strongly perturb the surface electronic charge density, giving rise to periodic oscillations that emanate from the defect. However, no exact experimental data to illustrate this pattern were presented.ma The spacing of the corrugation near the particle (4.7 A) is about twice as great as the spacing of the regular lattice in graphite (2.4 A). The dark region on the left side of the particle may be caused by overcompensation in the feedback loop of the scanning tip. A second kind of structure near the particles is shown in Figure 6c where there is no indication of distorted corrugation. The sizes of the highlighted spots in Figure 6c are 2-3 times larger than those of the surrounding basal plane carbon atoms, probably because these spots lie on top of the HOPG surface. ,
There are several possible mechanisms for the formation of the superstructure-like patterns shown in Figure 6b.
1148 Langmuir, Vol. 7, No. 6, 1991 Chang and Bard
Figure 5. Fiber clusters: (a) fibers still attached to small pieces of graphite, cleavage steps can be seen in the background; (b) graphite fibers in clusters; (c) bent or kinked fibers. The pattern might indicate a perturbation in electronic structure of the HOPG plane by the particle, as proposed by Mizes and co-workers.20 This requires strong inter- action between the particle and the substrate, which seems unlikely for loosely attached carbon pieces. Alternatively, the pattern might be generated by a multitip effect.lga The differences between parts b and c of Figure 6 indicate that there are two kinds of interactions either between the particles and the graphite substrate or between the
Figure 6. Ultrasmall carbon particles: (a) ultrasmall carbon particles of 5-10 A diameter, seen as randomly distributed points; (b, c ) two different structures for particles in part a. particles and the scanning tip, depending on the mech- anism for the formation of these patterns as mentioned above. However, despite their differences, the particles in these pictures are believed to be the same in nature, because the heights of the particles in Figures 6b and 6c are similar and the particles are very close in spacing. These spots are probably broken pieces of graphite of near atomic size. This conclusion is supported by the obser- vation of many similar particles near broken graphite pieces and cleavage steps, e.g., as shown in Figure 2c. It is less likely that the ultrasmall particles in Figure 6
Figure 7. Folded-over flakes and broken graphite pieces: (a) folded-over flakes and two folded-over line structures seen near the bottom; (b) broken graphite pieces forming a starlike feature.
represent impurities trapped inside the HOPG layers and exposed by cleavage. The particles are probably not dust because of the uniform size, high conductivity, and reproducible appearance shown in their STM images.
Folded-Over Flakes and Broken Pieces. Small pieces of graphite can be peeled off from cleavage steps. These graphite pieces can be loosely attached to the step where they are formed or can be detached from the step and carried to another location. These are called folded- over flakes and broken pieces, respectively, as shown in parts a and b of Figure 7. The shape of the folded-over flakes in Figure 7a corresponds to the valley left where the folded-over flakes are formed. Occasionally atomic res- olution can be achieved on the folded-over flakes. Two folded-over line structures are seen on the bottom of Figure 7a. When these relatively straight pieces are broken from the original spot and carried somewhere else, they could form the graphite strands described above. The broken graphite pieces were observed in many different shapes, e.g., the starlike feature shown in Figure 7b. Many smaller graphite pieces can be seen near the branches of the “star”. The shape and size of the broken graphite pieces depend on the cleavage force and the impact of falling; a wide variety of structures have been observed.
Factors Affecting Structures and Their STM Images. Modification of Structures by Interaction with the Tip. Interaction between the tip and the structures on graphite was frequently observed, especially at high scan rates (>8.7 Hz). The scanning microtip can move graphite pieces around and peel off graphite pieces from cleavage steps, giving a surface modification effect. This tip-sample interaction can be used as a method to identify whether a feature is physically attached to or part of the surface. Vibrating the scanning tip by a sudden increase in integral gain can also produce tip-sample interaction and, thus, change the surface. Such induced tip-sample interactions can punch holes on the basal plane and generate graphite particles of ca. 10-30 nm diameter. In the absence of tip-sample interaction, most of the images of the structures on HOPG were fairly stable with time and did not change with large variation in bias voltage (50-1000 mV) or tunneling current (0.2-4 nA), indicating high conductivity of these structures. Neither did the images change appreciably with change of scan direction or imaging mode (constant current or constant height). The high stability of these structures even at high gap resistance (a bias voltage/tunneling current) is useful in
distinguishing them from nonconductive foreign materials on the graphite surface.
Coverage of the Structures in Relation to Cleavage and HOPG Grade. The surface coverage of the graphite structures observed on HOPG was estimated by measuring the area of such structures divided by the total area of the images (usually, 15 X 15 pm in the widest scans) for 20 scans over 10 samples. Generally, about 1-10% of different HOPG samples, whose surfaces appeared free from obvious defects when examined by optical microscopy, were covered by such structures. The coverage can also be estimated from the frequency with which these structures were observed, regardless of the type of structure. On a 15 X 15 pm scale, structures were seen on almost every scan. The appearance of these structures decreased to approximately one out of three on a 400 X 400 nm scale. The coverage of the structures changed with the mode of cleavage. The coverage increased, if the cleaved layer was peeled off slowly with curvature because of the increased chance of breaking the graphite layers. A HOPG surface cleaved by a razor blade as a wedge appeared smooth over a larger area than that cleaved by adhesive tape. These showed a smaller coverage of the structures, but the same kinds were found on them.
On the basis of the above results, we feel most of the structures observed in this study were generated during cleavage. Flat, featureless regions as large as 5 X 5 pm were occasionally seen, while a large number of graphite structures were found in a different region of the surface of the same specimen.
Relationship between Graphite Structures on HOPG and Imaging Materials. When polymeric and other organic materials were placed on the graphite for imaging by evaporation of a solution of the material in a volatile solvent, a greater number of graphite structures, especially graphite fibers and other broken graphite pieces, were usually found, probably because of the interaction between the material and the HOPG surface during sample preparation and, perhaps, due to the increased chance for interaction between the tip and samples during scanning. Due to the nonconductive nature of most organic materials, tip crashing occurs more frequently in attempts to image these materials than when imaging freshly cleaved graph- ite. Graphite structures may also be generated when the scanning tip drags the organic film, thus, peeling off graphite layers.
The effect of organic solvents used to cast foreign
1150 Langmuir, Vol. 7, No. 6, 1991 Chang and Bard
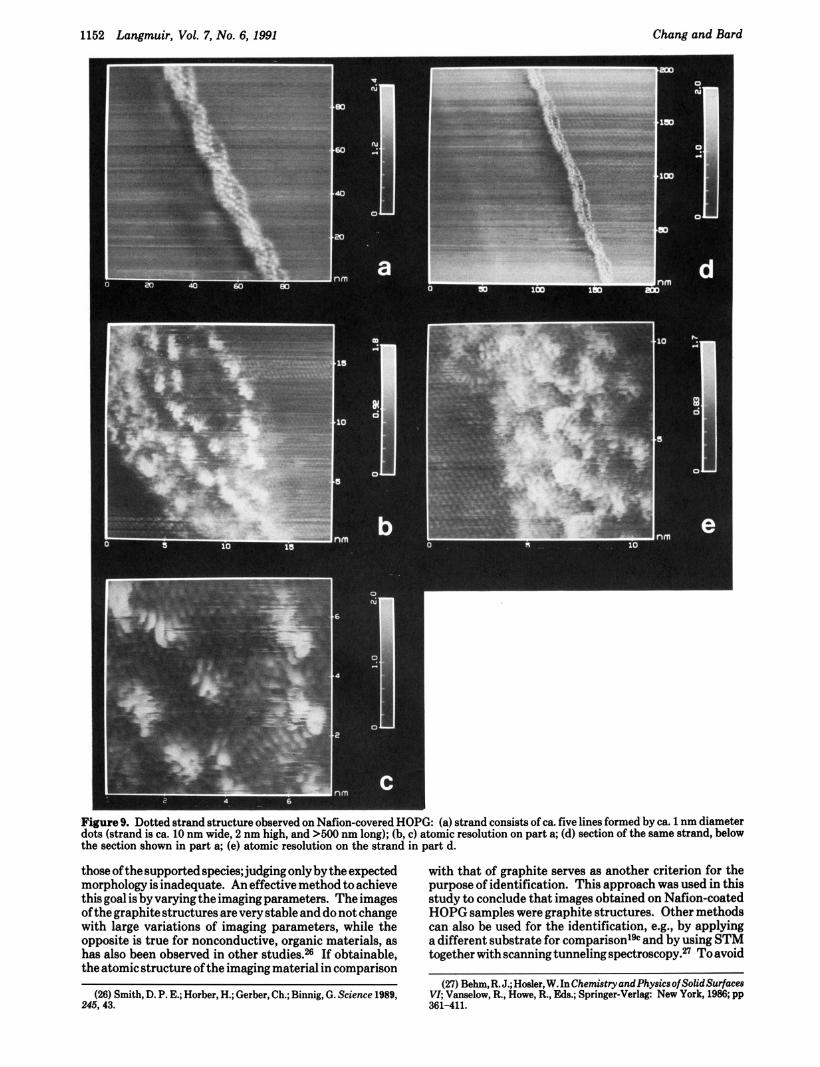
seen on Nafion-covered HOPG is shown in Figure 9. This strand consists of ca. five small lines formed by dots of ca. 4 nm in diameter. The strand is about 10 nm in width, 2 nm in height, and >500 nm in length. Atomic resolution was achieved on the strand as shown in parta b, c, and e in Figure 9. The atomic structure of the HOPG basal plane is clearly visible in the background. The height and shape of the atomic corrugation on the dots are quite different from the graphite structure, although the spacing is similar. The individual lines form different patterns at different sections of the strand. Shown in Figure 9a is a structure with an apparently twisted helix shape. The spacing between turns is ca. 24 nm. Below this section the structure of the strand is not as regular (Figure 9d). Again, the structure shown in Figure 9 cannot be correlated to that of Ndion. This structure is likely graphite for the following reasons. The images were quite stable and low in noise level, even after variation in scan rate and bias voltage, which cannot be true for nonconductive, organic materials. In addition, we know from the above that single graphite strands can be formed by cleaving HOPG. Although no exact same structure was seen on freshly cleaved HOPG, the structure of the graphite strands we observed showed large variations. However, it is not clear whether the strand shown in Figure 9 is formed during cleaving or during the evaporation of solvent. An alter- native, less likely, explanation is that the structure is some impurity in the Nafion solution.
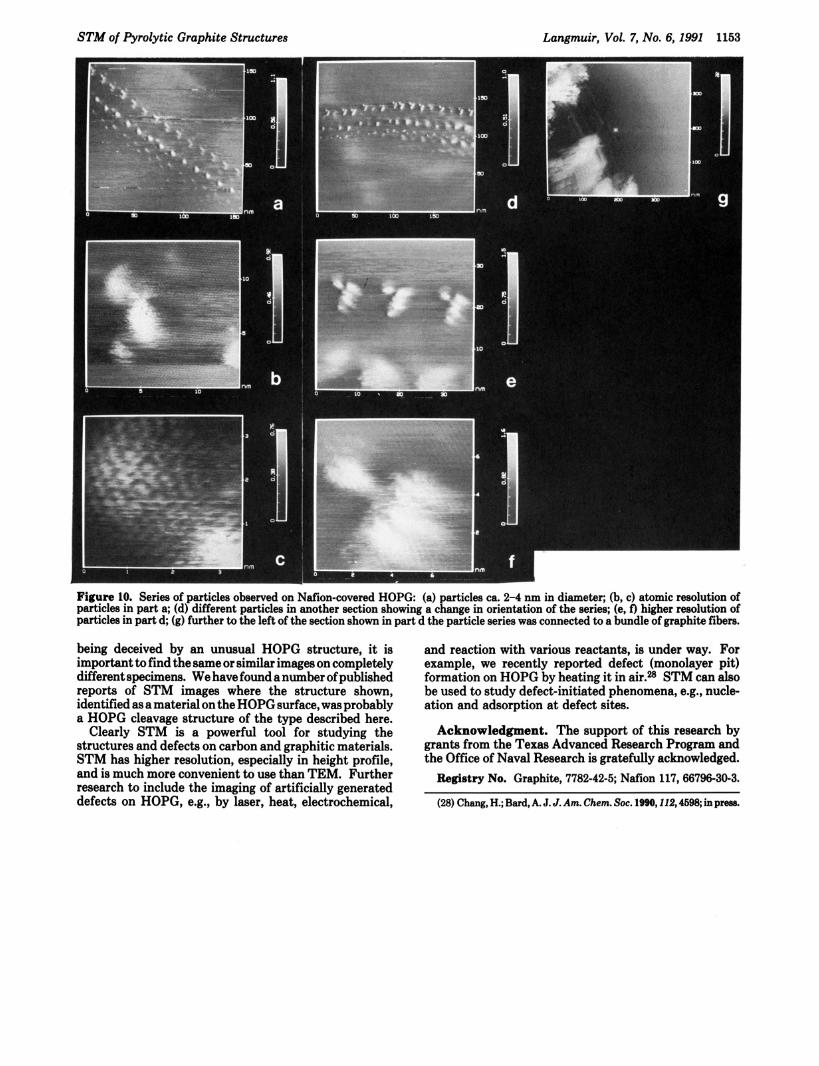
Series of Particles. A series of particles arranged in an almost regular pattern was observed, as shown in Figure 10. This particle series was more than 1 pm in length. The size, shape, and number of the particles were different at different sections of the series, suggesting the absence of multitip effect. The particles in Figure 10a are ca. 2-4 nm in diameter. Quite different particles were seen on another section in Figure 10d. The orientation of the series was also changed. Atomic resolution was achieved on these particles as shown in parts b, c, e, and f of Figure 10, with the atomic structure for HOPG basal plane clearly visible on the background. The atoms of the particles appear higher than the surrounding carbon atoms in the basal plane, but similar in spacing and structure, especially as shown in Figure 1Oc. Further to the left of Figure 10d, the particle series was connected to a bundle of graphite fibers, as shown in Figure log. Therefore, these particles very likely arise from broken pieces of graphite, the size of which is much smaller than that of the fiber clusters and larger than the ultrasmall particles discussed earlier.
Conclusions Graphite structures, other than the atomically smooth
planes, of various morphologies and sizes were frequently observed by STM on the basal plane of a newly cleaved HOPG. Most of these structures are formed by cleavage, which leaves broken graphite pieces on the surface. This is probably due to the weak bonding between the graphite layers and among carbon atoms in a layer, making a single graphite layer extremely fragile. These structures cover as much as 1-10% of the total HOPG surface area. These graphite structures, which can be regarded as defects on HOPG with increased surface roughness and edge plane exposure, contribute to the morphological features seen on Au films vapor-deposited on HOPG2S and to differences in the electrochemical behavior of species on cleaved HOPG.3b The chemical activities a t these features, e.g., electron transfer kinetics, nucleation, and adsorption, are
materials on HOPG on the appearance of graphite structures is not clear. Volatile solvents, such as methanol and acetonitrile, applied to the surface of graphite can probably move broken graphite pieces around during evaporation and intercalate into exposed edges and, thus, modify the surface. Movement of particles in the solution during the solvent evaporation can alsogenerate structures on the graphite surface, and particulate impurities in the solvent can deposit on the HOPG surface. As a conse- quence of these effects, the fact that treatment of a HOPG surface with a given solution produces unusual STM images does not necessarily imply that the images are those of the additive. A case history follows.
Structures Observed on Nafion-Covered Samples. In the effort to image the structure of Ndion, a perflu- orinated ion-exchange polymer manufactured by Du Pont, with STM, several series of interesting images were obtained, showing several different structures. These structures are not consistent, however, with the known structure, shape, and size of Nafion. The unique atomic structure revealed in some of these images encouraged us to try to understand them. We should note that they were not very reproducible from sample to sample and our discussion is largely based on the graphite structures on HOPG discussed above.
Continuous Double-Strand Structure. A double- line strand is shown in Figure 8a. This strand was 12 nm in total width, ca. 6 nm in height, and >500 nm in length. Each of the two split lines were similar in width and height. The heights of the HOPG planes on both sides of the line were about the same, so there is no cleavage step beneath the line. Atomic structure on the strand could be seen along with the atomic structure of the HOPG basal plane in the background (Figure 8b,c). The ordered and shell- like pattern at the left side of the strand shown in parts b and c of Figure 8 resembles a distorted atomic structure of HOPG. Asymmetric corrugation of a very large amplitude (ca. 28A) is shown in Figure 8c. The rectangular or oval shapes of the highlighted spots are very different from the regular circular shapes given by basal plane carbon atoms. The spacing between the nearest spots in a direction perpendicular to the strand in Figure 8c is similar to that of regular graphite structure (2.4 A), but the spacing in the other direction is about twice as great. The secondary structure varied along the strand; another section is shown in Figure 8d. Again, atomic structure can be seen in parts e and f of Figure 8.
Although the secondary structure on the strand in Figure 8 is quite different from that in Figure 3b,c, there is some similarity between the strands in Figure 8a and Figure 3c. Both strands were observed with high stability. The images shown in Figure 8 were stable during the period of imaging for over 2 h even at relatively high scan rate (8 Hz) and low gap resistance. In addition, the strand structure in Figure 8 does not match the known structure of Nafion, especially the atomic structure. On the basis of these results, we feel that the strand shown in Figure 8 does not represent Nafion, but is a graphite strand. This conclusion is also well justified by the frequent observation of other easily distinguishable graphite structures on Nafion-covered HOPG samples and the fact that the Nafion film is not uniformly distributed on the surface. Some quite different images showing large particles were also obtained on Nafion-covered samples, which changed sharply upon variation in scan rate and gap resistance. These might represent clustered Nafion molecules, but
(25) Vancea, J.; Rei-, G.; Schneider, F.; Bauer, K.; Hoffman, H. Surf. no atomic resolution was achieved on these. Dotted Strand Structure. Another strand structure sci. 1989,218,108.
Figure 8. (a) Continuous double-strand observed on Ndion-covered HOPG. (b, c) Atomic structure of strand and HOPG basal plane background in part a. (d) Different section of the same strand in part a, showing varied secondary structure. (e, f) Atomic structures of strand in part d.
probably different from that a t the basal plane. Because many of the structures seen after cleavage of HOPG can resemble expected images of materials placed on the surface (e.g., polymer strands, regular arrays), a good deal of caution is needed in using HOPG as a substrate for STM studies. Comparison with results obtained by using other substrates, such as gold or layered materials, is recommended.
Atomic resolution can sometimes be achieved on these structures, especially for relatively small features. In many cases the image of a small broken graphite piece merges
with that of the basal plane and gives superimposed images, suggesting electronic interaction between them. The atomic structure and spacing of these features are often similar to those of an HOPG basal plane, but the atomic corrugation on these features is frequently higher than the normal corrugation, perhaps because of the effect of the underlying basal plane on the electron distribution around the feature.24
When HOPG is used as a substrate for STM imaging of nonconductive organic materials, one must be cautious in distinguishing these graphite structures on HOPG from
1152 Langmuir, Vol. 7, No. 6, 1991 Chang and Bard
Figure 9. Dotted strand structure observed on Nafion-covered HOPG: (a) strand consists of ca. five lines formed by ca. 1 nm diameter dots (strand is ca. 10 nm wide, 2 nm high, and >500 nm long); (b, c) atomic resolution on part a; (d) section of the same strand, below the section shown in part a; (e) atomic resolution on the strand in part d.
those of the supported species; judging only by the expected morphology is inadequate. An effective method to achieve this goal is by varying the imaging parameters. The images of the graphite structures are very stable and do not change with large variations of imaging parameters, while the opposite is true for nonconductive, organic materials, as has also been observed in other studies.26 If obtainable, the atomic structure of the imaging material in comparison
(26) Smith, D. P. E.; Horber, H.; Gerber, Ch.; Binnig, G. Science 1989, 245,43.
with that of graphite serves as another criterion for the purpose of identification. This approach was used in this study to conclude that images obtained on Ndion-coated HOPG samples were graphite structures. Other methods can also be used for the identification, e.g., by applying a different substrate for comparison1gc and by using STM together with scanning tunneling spectroscopy.n To avoid
(27) Behm, R. J.; Hosler, W. In Chemistry and Physics of Solid Surfaces Vl; Vanselow, R., Howe, R., EMS.; Springer-Verlag: New York, 1986, pp 361-41 1.
SY'M of Yyrolyttc tiraphrte Structures Langmuir, Vol. 7, No. 6, 1 Y Y l 1153
Figure 10. Series of particles observed on Nafion-covered HOPG: (a) particles ca. 2-4 nm in diameter; (b, c) atomic resolution of particles in part a; (d) different particles in another section showing a change in orientation of the series; (e, f) higher resolution of particles in part d; (g) further to the left of the section shown in part d the particle series was connected to a bundle of graphite fibers.
being deceived by an unusual HOPG structure, it is important to find the same or similar images on completely different specimens. We have found a number of published reports of STM images where the structure shown, identified as a material on the HOPG surface, was probably a HOPG cleavage structure of the type described here.
Clearly STM is a powerful tool for studying the structures and defects on carbon and graphitic materials. STM has higher resolution, especially in height profile, and is much more convenient to use than TEM. Further research to include the imaging of artificially generated defects on HOPG, e.g., by laser, heat, electrochemical,
and reaction with various reactants, is under way. For example, we recently reported defect (monolayer pit) formation on HOPG by heating it in air.% STM can also be used to study defect-initiated phenomena, e.g., nucle- ation and adsorption at defect sites.
Acknowledgment. The support of this research by grants from the Texas Advanced Research Program and the Office of Naval Research is gratefully acknowledged. Registry No. Graphite, 7782-42-5; Ndion 117,66796-30-3.
(28) Chang, H.; Bard, A. J. J. Am. Chem. SOC. 1990,222,4698; in preae.


![[docx] Of Cleaving to God: De adhaerendo Deo](https://static.documents.pub/doc/80x56/58832e7b1a28abaf6f8b48dd/docx-of-cleaving-to-god-de-adhaerendo-deo.jpg)


