559
of the Conference at the 29 th Session of the CIE June 17 – June 19, 2019

of the Conference at the 29th Session of the CIE
June 17 – June 19, 2019
Contents
Session PA1-1 D1/D2/D3 - TLM Measurement and Effects ................................................... 19
Session PA1-2 D1 - Colour Appearance ................................................................................ 26
Session PA1-3 D4 - Road Lighting ......................................................................................... 35
Session PA2-1 D2 - LED-Based Standard Sources ............................................................... 43
Session PA2-2 D6 - Photobiology .......................................................................................... 55
Session PA3-1 D1 - Colour in Application .............................................................................. 67
Session PA3-2 D2 - Measurement of SSL Products .............................................................. 74
Session PA4-1 D3 - Daylight 1 ............................................................................................... 81
Session PA4-2 D1 - Colour Rendering ................................................................................... 88
Session PA5-1 D3 - Glare ....................................................................................................... 98
Session PA5-2 D2 - Goniophotometry .................................................................................. 111
Session PA6-1 D3 - Daylight 2 ............................................................................................. 118
Session PA6-2 D2 - LED Characterization ........................................................................... 125
Session PA7-1 D3 - Interior Lighting 1 ................................................................................. 132
Session PA7-2 D2 - Detector Characterization .................................................................... 137
Session PA7-3 D4 - Urban Lighting ...................................................................................... 142
Session PA8-1 D3 - Interior Lighting 2 ................................................................................. 149
Session PA8-2 D1 - Colour in Lighting ................................................................................. 160
Session PA8-3 D4 - Road Surface Characteristics .............................................................. 169
Session PA9-1 D2 - Spectroradiometry ................................................................................ 178
Session PA9-2 D4 - Visibility and Visual Performance in Road Lighting ............................. 189
Session PA10-1 D2 - Gloss and Camera Applications ........................................................... 201
Workshop WS3 In Search of a New Approach to the Maintenance Factor ........................... 213
Session PS1 Presented Posters (D1/D2) .......................................................................... 218
Session PS2 Presented Posters (D2/D3) .......................................................................... 238
Session PS3 Presented Posters (D4/D6) .......................................................................... 254
Poster session 1 ...................................................................................................................... 276
Poster session 2 ...................................................................................................................... 396
CIE Session 2019 – Abstract Booklet
2

PROGRAMME
CIE Session 2019 – Abstract Booklet
3
09:00 ‐ 09:10
09:10 ‐ 10:00
10:00 ‐ 10:15
10:15 ‐ 10:40
Thurgood Ballroom Lincoln 5 Lincoln 6
10:40 ‐ 12:00PA1-1
D1/D2/D3 - TLM Measurement and EffectsChair: Peter Blattner, CH
PA1-2D1 - Colour Appearance
Chair: TBD
PA1-3D4 - Road Lighting
Chair: Dionyz Gasparovsky, SK
OP01 OP05 OP09
10:40 ‐ 10:55
Adam Klej, NL
FLICKER (PSTLM) AND STROBOSCOPIC EFFECT
(SVM) – LIGHT MEASUREMENTS IN
PHOTOMETRICAL LABORATORIES
Chi‐Han Ma, TW
AN INITIAL STUDY OF COLOUR APPEARANCE IN
VIRTUAL REALITY
Ronald Gibbons, US
EVALUATING THE LIGHTING LEVELS, SURROUND
RATIO AND UNIFORMITY IN AN LED LIGHTED
ENVIRONMENT
OP02 OP06 OP10
10:55 ‐ 11:10Anders Thorseth, DK
MEASURING AND COMPARING WAVEFORMS OF
TEMPORAL LIGHT MODULATION
Yuechen Zhu, CN
MODELLING OF SIMULTANEOUS CONTRAST
EFFECTS USING MEMORY COLOUR MATCHING
METHOD TO REVISE THE CIECAM16 COLOUR
APPEARANCE MODEL
Stephan Voelker, DE
NEW WAYS TO ACHIEVE CLIMATE AIMS IN
ROADWAY LIGHTING
OP03 OP07 OP11
11:10 ‐ 11:25Lili Wang, CN
THE VISIBILITY OF THE PHANTOM ARRAY EFFECT
UNDER OFFICE LIGHTING CONDITION
Changjun Li, CN
MODELLING COLOUR APPEARANCE FOR
UNRELATED COLOURS BASED ON CAM16
Steve Fotios, GB
WHICH METRICS ARE NEEDED TO SPECIFY GOOD
LIGHTING FOR PEDESTRIANS?
OP04 OP08 OP12
11:25 ‐ 11:40
Jennifer Veitch, CA
COGNITIVE AND EYE MOVEMENT EFFECTS ON
VIEWERS OF TEMPORAL LIGHT MODULATION
FROM SOLID‐STATE LIGHTING
Thanh Hang Phung, BE
APPLYING AN IMAGE COLOUR APPEARANCE
MODEL FOR SIMPLE SELF‐LUMINOUS SCENES
Jim Uttley, GB
THE INFLUENCE OF ROAD LIGHTING ON CYCLIST
NUMBERS AND SAFETY
11:40 ‐ 12:00 Discussion Discussion Discussion
12:00 ‐ 13:10
Monday, June 17Morning
OPENING SESSIONRon Gibbons, US (Local Organizing Committee Chair)
Yoshi Ohno, US (CIE President)
IP01THE HISTORIC REVISION OF THE INTERNATIONAL SYSTEM OF UNITS
William D. Phillips, US
AWARD CEREMONY
COFFEE BREAK
LUNCH BREAK
Oral Presentations
Thurgood Ballroom
Keynote PresentationChair: Yoshi Ohno, US
CIE Session 2019 – Abstract Booklet
4
Thurgood Ballroom Lincoln 5 Lincoln 6Oral Presentations Workshop/Seminar Oral Presentations
13:10 ‐ 15:10PA2-1
D2 - LED-Based Standard SourcesChair: Dong Hoon Lee, KR (TBC)
WS 1 (D1)Convenors: Minchen Wei, HK; Michael
Royer, US, Kevin Houser, US
PA2-2D6 - Photobiology
Chair: John O'Hagan, GB
OP13 OP19
13:10 ‐ 13:25
Thorsten Gerloff, DE
LUMINOUS INTENSITY COMPARISON BASED ON
NEW STANDARD LAMPS WITH LED REFERENCE
SPECTRUM
Ljiljana Udovicic, DE
LIGHT AND BLUE‐LIGHT EXPOSURES OF DAY
WORKERS IN SUMMER AND WINTER
OP14 OP20
13:25 ‐ 13:40
Timo Dönsberg, FI
CONSTANT‐VOLTAGE DRIVEN TEMPERATURE
STABILIZED LUMINOUS FLUX LED STANDARD LAMP
WITH E27 BASE
Christoph Schierz, DE
IS LIGHT WITH LACK OF RED SPECTRAL
COMPONENTS A RISK FACTOR FOR AGE‐RELATED
MACULAR DEGENERATION (AMD)?
OP15 OP21
13:40 ‐ 13:55Alejandro Ferrero, ES
DEFINITION OF A SPECTRAL MISMATCH INDEX FOR
SPECTRAL POWER DISTRIBUTIONS
Ting‐Lan Tsai, TW
INFLUENCE ON HUMAN SLEEP OF DYNAMIC
LIGHTING
OP16 OP22
13:55 ‐ 14:10Xi Lv, CN
LED SIMULATORS FOR THE REPRODUCTION OF THE
NEW CIE STANDARD LED SOURCES
David Sliney, US
RETINAL EXPOSURE ‐ HORIZONTAL OR VERTICAL
ALPHA IRRADIANCE OR ILLUMINANCE?
OP17 OP23
14:10 ‐ 14:25Yuqin Zong, US
HIGH‐POWER STANDARD LEDS WITH SUPERIOR
LONG‐TERM STABILITY
Cameron Miller, US
INNOVATIVE APPROACHES TO COMBAT
HEALTHCARE‐ASSOCATED INFECTIONS USING
STANDARDS DEVELOPED THROUGH INDUSTRY AND
U.S. FEDERAL COLLABORATION
OP18 OP24
14:25 ‐ 14:40Tsung‐Hsun Yang, TW
SPECTRAL DISTRIBUTION OF TYPICAL WHITE LED AS
A FUNCTION OF CCT
Mariana Figueiro, US
NOCTURNAL MELATONIN SUPPRESSION BY
ADOLESCENTS AND ADULTS FOR DIFFERENT
LEVELS, SPECTRA, AND DURATIONS OF LIGHT
EXPOSURE
14:40 ‐ 15:10 Discussion Discussion
15:10 ‐ 15:35 COFFEE BREAK
Monday, June 17Afternoon
RESEARCH METHOD FOR INVESTIGATING LIGHT SOURCE
COLOUR RENDITION
CIE Session 2019 – Abstract Booklet
5

Thurgood Ballroom Lincoln 5 Lincoln 6
15:35 ‐ 16:30PS1
Presented Posters (D1/D2)Chair: TBD
PS2Presented Posters (D2/D3)
Chair: TBD
PS3Presented Posters (D4/D6)Chair: Maurice Donners, NL
PP01 PP11 PP21
15:35 ‐ 15:40Lorne Whitehead, CA
SPECTRAL CHARACTERISTICS INFLUENCING THE
METAMERIC UNCERTAINTY INDEX
Janne Askola, FI
NATURAL AND ACCELERATED AGEING OF ORGANIC
LED PANELS USING SPECTRALLY DISPERSED
ULTRAVIOLET EXPOSURE
Yukio Akashi, JP
LIGHTING REQUIREMENTS FOR ADAPTIVE DRIVING
BEAM (ADB) TO IMPROVE TARGET VISIBILITY WHEN
ONCOMING HEADLIGHT GLARE EXISTS
PP02 PP12 PP22
15:40 ‐ 15:45
Semin Oh, KR
HUE PERCEPTION AND NEUTRALNESS OF A
SMARTPHONE DISPLAY UNDER DIFFERENT
SURROUND CONDITIONS
Alejandro Ferrero, ES
TESTING SPARKLE MEASUREMENT CAPABILITIES OF
NATIONAL METROLOGY INSTITUTES
Roman Dubnicka, SK
MEASUREMENT OF OBTRUSIVE LIGHTING OF
OUTDOOR LIGHTING INSTALLATIONS
PP03 PP13 PP23
15:45 ‐ 15:50Chuen‐Yan Gu, TW
VISUAL IMPRESSIONS OF PAIRED PATTERNS –
TAKING WALLPAPER PATTERNS AS AN EXAMPLE
Tuomas Poikonen, FI
FUTURE PHOTOMETRY BASED ON SOLID‐STATE
LIGHTING PRODUCTS
Valérie Muzet, FR
TOWARDS AN OPTIMIZATION OF URBAN LIGHTING
THROUGH A COMBINED APPROACH OF LIGHTING
AND ROAD BUILDING ACTIVITIES
PP04 PP14 PP24
15:50 ‐ 15:55
Jennifer Veitch, CA
DETECTION OF THE STROBOSCOPIC EFFECT UNDER
LOW LEVELS OF THE STROBOSCOPIC VISIBILITY
METRIC
Joelene Elliott, AU
IMPACT OF LUMINANCE DISTRIBUTION ON
PERCEPTION OF THE SHAPE OF ARCHITECTURAL
SPACES
Dorian Talon, FR
IMPACT OF THE SPECTRUM OF LIGHT ON VISIBILITY
IN ROAD TUNNELS
PP05 PP15 PP25
15:55 ‐ 16:00
Yoko Mizokami, JP
CHANGE IN THE APPEARANCE OF OBJECTS
ACCORDING TO THE RATIO OF DIRECT AND
DIFFUSIVE LIGHT
Shuxiao Wang, CN
PRELIMINARY RESEARCH ON MATHEMATIC MODEL
OF EYE’S ADAPTATION LUMINANCE
Pimkamol Mattsson, SE
ENERGY EFFECTIVE OUTDOOR LIGHTING FOR
VISUALLY IMPAIRED PEDESTRIANS
PP06 PP16 PP26
16:00 ‐ 16:05Yuki Kawashima, US
QUANTIFYING PERCEIVED CHROMA CHANGES BY
HUNT EFFECT IN LIGHTING
Kai Ge, CN
EFFECT OF VISUAL DISTRACTION ON ANXIETY IN
WOMEN DURING THE FIRST STAGE OF LABOR
Eric Li, US
IMPACT OF ROADWAY LIGHTING ON DRIVER
BEHAVIOR AT FREEWAY RAMP LOCATIONS
PP07 PP17 PP27
16:05 ‐ 16:10Tzung‐Han Lin, TW
SHADE‐FREE TEXTURE ACQUISITION FOR 3D
SCANNING SYSTEM
Noriko Umemiya, JP
DIFFERENCES OF LIGHT ENVIRONMENT
EVALUATION BETWEEN ELDERLY AND YOUNG
PEOPLE
Anna Pellegrino, IT
ANALYSIS AND DESIGN APPROACH FOR A
NOCTURNAL IMAGE OF THE CULTURAL LANDSCAPE
PP08 PP18 PP28
16:10 ‐ 16:15
Tony Bergen, AU
FLASH OBSERVATION AT THRESHOLD OF VISION
USING A FOUR ALTERNATIVE FORCED CHOICE
EXPERIMENT
Jing Lin, GB
EFFECT OF INTENSITY OF SHORT‐WAVELENGTH
LIGHT ON SUBJECTIVE AND OBJECTIVE ALERTNESS
Giuseppe Rossi, IT
THE VEILING LUMINANCE IN TUNNEL LIGHTING
INSTALLATIONS
PP09 PP19 PP29
16:15 ‐ 16:20Kenji Godo, JP
Investigation of LED‐based compact transfer
standard source for luminance measurement
Hinako Kage, JP
EXPERIMENTAL STUDY ON ILLUMINANCE
DISTRIBUTION IN THE TASK AND BACKGROUND
AREA OF OPEN‐OFFICE LIGHTING
Aleix Llenas, ES
DYNAMIC MULTI‐LED LIGHTING SYSTEMS THAT
MIMIC DAYLIGHT IMPROVES MEASURED
ALERTNESS, COMFORT AND SLEEP QUALITY
PP10 PP20 PP30
16:20 ‐ 16:25
Roman Dubnicka, SK
GONIOSPECTRORADIOMETRY OF ROAD LIGHTING
LUMINAIRES IN RESPECT OF MESOPIC
PHOTOMETRY
Yandan Lin, CN
ASSESSING THE PROPORTIONS AND CCT OF DIRECT
AND INDIRECT LIGHTING IN A REAL LIT OFFICE
Luke Price, GB
CIRCADIAN LIGHT EXPOSURES OF SHIFT WORKING
NURSES
PP31
16:25 ‐ 16:30Satoshi Hirakawa, JP
ESTIMATION METHOD OF DISCOMFORT GLARE FOR
LED TUNNEL INTERIOR LIGHTING
16:30 ‐ 18:00
Lincoln Conference Area
Poster session 1
Presented Posters
CIE Session 2019 – Abstract Booklet
6
08:30 ‐ 09:15
09:15 ‐ 09:20
Thurgood Ballroom Lincoln 5 Lincoln 6Workshop/Seminar
09:20 ‐ 10:20WS 2 (D3)
Convenor: Jennifer Veitch, CA
PA3-1D1 - Colour in Application
Chair: TBD
PA3-2D2 - Measurement of SSL Products
Chair: Anders Thorseth, DK (TBC)
OP25 OP28
09:20 ‐ 09:35Qiang Xu, CN
EXTENSION OF COLOUR DIFFERENCE FORMULAE
FOR HDR APPLICATIONS
Benjamin Tsai, US
NOT ALL 60 Hz ELECTRICITY IS THE SAME –
COMPLICATIONS IN MEASURING SOLID‐STATE
LIGHTING PRODUCTS
OP26 OP29
09:35 ‐ 09:50Tingyun Lu, TW
INFLUENCE OF COLOUR ON VISUAL CONSPICUITY:
TAKING SUBWAY ROUTE MAPS AS AN EXAMPLE
Maria Nadal, US
SOLID‐STATE LIGHTING MEASUREMENT
ASSURANCE PROGRAM SUMMARY WITH ANALYSIS
OF METADATA
OP27 OP30
09:50 ‐ 10:05Sophie Jost, FR
A COLOUR GRAPHIC ICON FOR REAL COMPLEXE
SCENES: APPLICATION TO LED ILLUMINANTS
Denan Konjhodzic, DE
EVALUATION OF BLUE LIGHT HAZARD
10:05 ‐ 10:20 Discussion Discussion
10:20 ‐ 10:45
Thurgood Ballroom Lincoln 5 Lincoln 6Workshop/Seminar
10:45 ‐ 12:05PA4-1
D3 - Daylight 1Chair: TBD
PA4-2D1 - Colour Rendering
Chair: TBD
WS 3 (D4)Convenor: Dionyz Gasparovsky, SK
OP31 OP35
10:45 ‐ 11:00
Martine Knoop, DE
APPROACH TO ANALYZE SEASONAL AND
GEOGRAPHICAL VARIATIONS IN DAYLIGHT
ILLUMINANTS
Minchen Wei, HK
EFFECT OF LIGHT LEVEL ON COLOUR PREFERENCE
AND SPECIFICATION OF LIGHT SOURCE COLOUR
RENDITION
OP32 OP36 WP1
11:00 ‐ 11:15
Niko Gentile, SE
ENERGY SAVING POTENTIAL FOR INTEGRATED
DAYLIGHTING AND ELECTRIC LIGHTING DESIGN VIA
USER‐DRIVEN SOLUTIONS: A LITERATURE REVIEW
Sebastian Babilon, DE
A NEW METRIC FOR MEMORY COLOUR
PREFERENCE EVALUATION IN LIGHTING
APPLICATIONS – EXPERIMENTS, MATHEMATICAL
DEFINITION, AND COMPARISON WITH OTHER
COLOUR RENDERING INDICES
Janne Askola, FI
REDUCED LIFETIME OF LED STREET LUMINAIRES
DUE TO ADAPTIVE CONTROL
OP33 OP37 WP2
11:15 ‐ 11:30
Yingjun Dong, CN
STUDY ON THE EFFECTS OF AROUSAL DAYLIGHTING
OF DORMITORY ON COLLEGE STUDENTS' SLEEP
QUALITY, ALERTNESS AND MOOD IN SUMMER
Peter Bodrogi, DE
SEMANTIC INTERPRETATION OF THE CIE 2017
COLOUR FIDELITY INDEX
Peter Schwarcz, HU
REVIEW AND PROPOSALS FOR UPGRADE OF
METRICS OF USEFUL LIFIETIME OF PROFESSIONAL
LED LUMINAIRES
OP34 OP38
11:30 ‐ 11:45
Victoria Eugenia Soto Magan, CH
ASSESSING ALERTING EFFECTS OF DAYLIGHT AT
THE WORKPLACE: METHODOLOGY BASED ON A
SEMI‐CONTROLLED STUDY
Barbara Matusiak, NO
TOWARD NEW COLOUR RENDERING METHOD OF
WINDOW GLASS
11:45 ‐ 12:05 Discussion Discussion
12:05 ‐ 13:15
MEASURING TEMPORAL LIGHT MODULATION AND ASSESSING ITS
EFFECTS ON VIEWERS: MOVING TOWARDS SETTING LIMITS
IN SEARCH OF A NEW APPROACH TO THE MAINTENANCE FACTOR
COFFEE BREAK
LUNCH BREAK
Oral Presentations
Tuesday, June 18Morning
Thurgood Ballroom
Invited PresentationChair: TBD
IP02Non-image forming effects of light and lighting: new insights and metrics
Luc Schlangen, NL
Room configuration
Oral Presentations
CIE Session 2019 – Abstract Booklet
7

Thurgood Ballroom Lincoln 5 Lincoln 6Oral Presentations Workshop/Seminar Oral Presentations
13:15 ‐ 15:15PA5-1
D3 - GlareChair: TBD
WS4 (D1)(Convenors: Ronnier Luo, CN/GB; Tran
Quoc Khanh, DE)
PA5-2D2 - Goniophotometry
Chair: Tony Bergen, AU (TBC)
OP39 OP45
13:15 ‐ 13:30Malgorzata Perz, NL
EXPLORING THE PLEASANT SIDE OF GLARE IN THE
LED ERA
Johannes Ledig, DE
PRINCIPLE LIMITATIONS OF NEAR‐FIELD
GONIOPHOTOMETER MEASUREMENTS
OP40 OP46
13:30 ‐ 13:45
Raquel Viula, NL
TESTING THE PREDICTIVE POWER OF VISUAL
DISCOMFORT FROM GLARE METRICS IN NEAR‐
WINDOW AND NEAR WALL‐ZONES
Jiangen Pan, CN
SPATIAL LIGHT DISTRIBUTION CHARACTERIZATION
AND MEASUREMENT OF LED HORTICULTURAL
LIGHTS
OP41 OP47
13:45 ‐ 14:00Clotilde Pierson, BE
DIFFERENCE BETWEEN FIELD AND LABORATORY
STUDIES OF DISCOMFORT GLARE CUT‐OFF VALUES
Alexander Kokka, FI
COMPARISON OF THE FISHEYE CAMERA METHOD
WITH GONIOPHOTOMETERS FOR MEASURING
RELATIVE ANGULAR INTENSITY DISTRIBUTIONS OF
LIGHT SOURCES
OP42
Workshop/Seminar
OP43
14:15 ‐ 14:30Sophie Jost, FR
TESTING EXPERIMENTAL METHODS FOR
DISCOMFORT GLARE INVESTIGATIONS
OP44
14:30 ‐ 14:45
Toshie Iwata, JP
EFFECTS OF LUMINANCE DISTRIBUTION AND VIEW
ON EVALUATION OF DISCOMFORT GLARE FROM
WINDOWS
14:45 ‐ 15:15 Discussion
15:15 ‐ 15:40
Thurgood Ballroom Lincoln 5 Lincoln 6Workshop/Seminar
15:40 ‐ 16:40PA6-1
D3 - Daylight 2Chair: TBD
PA6-2D2 - LED CharacterizationChair: Adam Klej, NL (TBC)
WS6 (D6) Convenor: John O'Hagan
OP48 OP51
15:40 ‐ 15:55Dominique Dumortier, FR
ONE YEAR OF USE OF A LIGHT DOSIMETER
Hans Baumgartner, FI
FAILING MECHANISMS OF LED LAMPS
OP49 OP52
15:55 ‐ 16:10Aicha Diakite, DE
A DATA‐DRIVEN COLORIMETRIC ANALYSIS OF CIE
STANDARD GENERAL SKIES
Genevieve Martin, NL
FROM MEASUREMENTS TO STANDARDISED MULTI‐
DOMAIN COMPACT MODELS OF LEDS USING LED E‐
DATASHEETSOP50 OP53
16:10 ‐ 16:25
Doris Chi, MX
USING RADIANCE TO ESTIMATE TRANSMITTED
SOLAR RADIATION ENERGY FOR THIN AND THICK
PERFORATED SCREENS
András Poppe, HU
MULTI‐DOMAIN CHARACTERIZATION OF COB LEDS
16:25 ‐ 16:40
16:40 ‐ 18:10
14:00 14:15 ‐
Poster session 2
COFFEE BREAK
Lincoln Conference Area
Tuesday, June 18Afternoon
MODELLING COLOUR QUALITY OF LIGHT SOURCES
DiscussionDiscussion
Luigi Giovannini, IT
ANNUAL EVALUATION OF DAYLIGHT DISCOMFORT
GLARE: STATE OF THE ART AND DESCRIPTION OF A
NEW SIMPLIFIED APPROACH
HORTICULTURAL LIGHTING
WS5 (D6)Convenors: Luc Schlangen, NL; Luke
Price, GB
USE AND APPLICATION OF THE NEW CIE S 026:2018 METROLOGY FOR
IPRGC-INFLUENCED RESPONSES TO LIGHT
“SPECIFYING LIGHT FOR ITS EYE-MEDIATED NON-VISUAL EFFECTS IN
HUMANS”
Discussion
Oral Presentations
CIE Session 2019 – Abstract Booklet
8

08:30 ‐ 09:15
09:15 ‐ 09:20
Thurgood Ballroom Lincoln 5 Lincoln 6
09:20 ‐ 10:20PA7-1
D3 - Interior Lighting 1Chair: TBD
PA7-2D2 - Detector Characterization
Chair: Thiago Menegotto, BR (TBC)
PA7-3D4 - Urban LightingChair: Nigel Parry, GB
OP54 OP57 OP60
09:20 ‐ 09:35Hillevi Hemphälä, FI
A NEW METHOD FOR EVALUATING THE VISUAL
ENVIRONMENT
Zhifeng Wu, CN
NONLINEARITY OF THE PHOTODETECTOR USING
LASER FACILITY
John Bullough, US
INTEGRATING RESEARCH ON SAFETY PERCEPTIONS
UNDER PARKING LOT ILLUMINATION
OP55 OP58 OP61
09:35 ‐ 09:50Johanna Enger, SE
A COMMUNICATION TOOL FOR VISUAL
EXPERIENCE OF LIGHT
Geiland Porrovecchio, CZ
LONG‐TERM SPECTRAL RESPONSIVITY STABILITY OF
PREDICTABLE QUANTUM DETECTORS
Jialu Wu, CN
WHAT TYPES OF VISUAL ENVIRONMENT CAN
REDUCE THE PERCEPTION OF NOISE IN URBAN
RESIDENTIAL DISTRICT?
OP56 OP59 OP62
09:50 ‐ 10:05Peter Dehoff, AT
REVISION OF THE INTERNATIONAL STANDARDS OF
LIGHTING OF INTERIOR WORKPLACES
George Eppeldauer, US
PYROELECTRIC STANDARDS FOR SPECTRAL AND
BROADBAND IRRADIANCE MEASUREMENTS FOR
250 nm TO 3000 nm
Mike Chapman, AU
LED STREET LIGHTING AND LIGHT POLLUTION ‐ A
CASE STUDY IN SOUTH EAST AUSTRALIA
10:05 ‐ 10:20 Discussion Discussion Discussion
10:20 ‐ 10:45
Thurgood Ballroom Lincoln 5 Lincoln 6
10:45 ‐ 12:05
or12:25
PA8-1D3 - Interior Lighting 2
Chair: TBD
PA8-2D1 - Colour in Lighting
Chair: TBD
PA8-3D4 - Road Surface Characteristics
Chair: Sermin Onaygil, TR
OP63 OP68 OP72
10:45 ‐ 11:00
Shao Rongdi, CN
EXPERIMENT OF LIGHTING ENVIRONMENTS IN
WARD FOR BLOOD CANCER PATIENTS BASED ON
VIRTUAL REALITY TECHNOLOGY
Yuki Kawashima, US
VISION EXPERIMENT ON VERIFICATION OF HUNT
EFFECT IN LIGHTING
Valérie Muzet, FR
OPTIMIZATION OF ROAD SURFACE REFLECTIONS
PROPERTIES AND LIGHTING: LEARNING OF A THREE‐
YEAR EXPERIMENT
OP64 OP69 OP73
11:00 ‐ 11:15
Luoxi Hao, CN
EVIDENCE‐BASED RESEARCH AND APPLICATIONS
OF A THERAPEUTIC LIGHTING SYSTEM ON
CIRCADIAN RHYTHM AND MOOD REGULATION FOR
CHINESE PATIENTS
Yoshi Ohno, US
VISUAL EVALUATION OF CIE 2015 CONE
FUNDAMENTAL‐BASED 10° COLOUR MATCHING
FUNCTIONS FOR LIGHTING APPLICATIONS
Enoch Saint‐Jacques, FR
EVALUATION OF THE PERFORMANCE OF A ROAD
SURFACE GONIOREFLECTOMETER
OP65 OP70 OP74
11:15 ‐ 11:30Mariana Figueiro, US
LIGHT, ENTRAINMENT AND ALERTNESS: A CASE
STUDY IN OFFICES
Hsin‐Pou Huang, HK
UNIQUE HUE JUDGMENTS UNDER LIGHT SOURCES
WITH DIFFERENT CHROMATICITIES
Paola Iacomussi, IT
INFLUENCE OF MATERIAL CHARACTERIZATION IN
THE DESIGN OF TUNNEL LIGHTING INSTALLATIONS
OP66 OP71 OP75
11:30 ‐ 11:45
Miki Kozaki, JP
RESEARCH ON THE RANGE OF PLEASANT DARKNESS
AND BRIGHTNESS IN RESTAURANTS: DISCUSSION
ON AGE FACTOR
Ronnier Luo, CN
PROPOSAL OF A NEW WHITENESS FORMULA
BASED ON CAM16‐UCS
Florian Greffier, FR
USE OF AN IMAGING LUMINANCE MEASUREMENT
DEVICE TO EVALUATE ROAD LIGHTING
PERFORMANCE AT DIFFERENTS ANGLES OF
OBSERVATIONOP67
11:45 ‐ 12:00
Ferenc Szabó, HU
INVESTIGATION OF HUMAN CENTRIC LIGHTING IN
INDUSTRIAL ENVIRONMENT IN MULTIPLE ASPECTS
– BIOLOGICAL EFFECT AND USERS’ PREFERENCE
12:00 ‐ 12:25
12:05 ‐ 13:15
COFFEE BREAK
LUNCH BREAK
Oral Presentations
Wednesday, June 19Morning
Thurgood Ballroom
Invited PresentationChair: TBD
Oral Presentations
IP03Light the UNseen: research at the interface of architecture, energy engineering, microbiology and daylight and newfound gaps
Kevin van den Wymelenberg, US
Room configuration
Discussion
Discussion Discussion
CIE Session 2019 – Abstract Booklet
9

Thurgood Ballroom Lincoln 5 Lincoln 6Workshop/Seminar
13:15 ‐ 15:15
WS 7 - Part 1(Joint CIE(D1/D8)–OSA–IS&T Workshop)Convenors: Po-Chieh Hung, US; Manuel
Spitschan, GB; Francisco Imai, US
PA9-1D2 - Spectroradiometry
Chair: Tobias Schneider, DE (TBC)
PA9-2D4 - Visibility and Visual Performance in
Road LightingChair: Steve Fotios, GB
OP76 OP82
13:15 ‐ 13:30
Ralph Zuber, DE
COMBINED OUT OF RANGE AND IN BAND STRAY
LIGHT CORRECTION FOR ARRAY
SPECTRORADIOMETERS
Rajaram Bhagavathula, US
UNDERSTANDING DRIVER VISUAL PERFORMANCE
BY EXAMINING DISTRIBUTIONS OF DETECTION
DISTANCES
OP77 OP83
13:30 ‐ 13:45Yuqin Zong, US
CALIBRATION OF SPECTRORADIOMETERS USING
TUNABLE LASER SOURCES
Maurice Donners, NL
ILLUMINATION REQUIREMENTS FOR GAZE
PERCEPTION
OP78 OP84
13:45 ‐ 14:00
Marek Smid, CZ
THE DESIGN AND DEVELOPMENT OF A TUNABLE
AND PORTABLE RADIATION SOURCE FOR IN SITU
SPECTROMETER CHARACTERISATION
Cheng‐Hsie Chen, TW
THE VISIBILITY STUDIES OF DYNAMIC ROAD‐
LIGHTING ON A FOGGY ROAD
OP79 OP85
14:00 ‐ 14:15Weiqiang Zhao, CN
PHOTOMETER SPECTRAL RESPONSE
MEASUREMENT USING OPO TUNABLE LASER
Joanne Wood, AU
THE EFFECT OF DIFFERENT HEADLIGHT
TECHNOLOGIES ON VISUAL PERFORMANCE AT
NIGHT‐TIME
OP80 OP86
14:15 ‐ 14:30
Armin Sperling, DE
AN UNCERTAINTY ANALYSIS OF PHOTOMETRIC
RESPONSIVITY BASED ON SPECTRAL IRRADIANCE
RESPONSIVITY
Rajaram Bhagavathula, US
APPLICABILITY OF VISUAL PERFORMANCE MODELS
TO NIGHTTIME DRIVING
OP81 OP87
14:30 ‐ 14:45
Tomi Pulli, FI
GENERAL TOOL FOR ESTIMATING EFFECTS OF
UNKNOWN CORRELATIONS ON SPECTRAL
INTEGRALS
Jian Li, CN
VISUAL COMFORT EVALUATION METHOD AND
PREDICTION MODEL RELATING TO DISCOMFORT
GLARE: A MOCK‐UP STUDY OF LUMINOUS
ENVIRONMENT IN AIRPLANE COCKPIT
14:45 ‐ 15:15 Discussion Discussion
15:15 ‐ 15:40
COLOUR IMAGING, PERCEPTION, AND REPRODUCTION: NEW DIRECTIONS IN COLOUR SCIENCE AND TECHNOLOGY
COFFEE BREAK
Wednesday, June 19Afternoon
Oral Presentations
CIE Session 2019 – Abstract Booklet
10

Thurgood Ballroom Lincoln 5 Lincoln 6Workshop/Seminar Oral Presentations Workshop/Seminar
15:40 ‐ 17:40
WS 7 - Part 2(Joint CIE(D1/D8)–OSA–IS&T Workshop)Convenors: Po-Chieh Hung, US; Manuel
Spitschan, GB; Francisco Imai, US
PA10-1D2 - Gloss and Camera Applications
Chair: Udo Krüger, DE (TBC)
WS 8 (D3)Convenors: Gilles Vissenberg, NL;
Maurice Donners, NL
OP88
15:40 ‐ 15:55Gael Obein, FR
WHAT IS THE TRUE WIDTH AND HEIGHT OF THE
SPECULAR PEAK ACCORDING THE LEVEL OF GLOSS?
OP89
15:55 ‐ 16:10Coralie Cauwerts, BE
COLORIMETRIC ACCURACY OF HIGH DYNAMIC
RANGE IMAGES FOR LIGHTING RESEARCH
OP90
16:10 ‐ 16:25Changhui Ye, KR
TEST METHOD OF LUMINANCE DYNAMIC RANGE
FOR HDR CAMERA WITH CMOS IMAGE SENSOR
OP91
16:25 ‐ 16:40
Oskari Pekkala, FI
SETUP FOR CHARACTERISING THE SPECTRAL
RESPONSIVITY OF FABRY‐PÉROT‐INTERFEROMETER‐
BASED HYPERSPECTRAL CAMERAS
OP92
16:40 ‐ 16:55Aiman Raza, FR
SIMPLIFIED HYPERSPECTRAL CAMERA CALIBRATION
FOR ACCURATE RADIOMETRIC MEASUREMENTS
OP93
16:55 ‐ 17:10
Ling Li, CN
THE DEVELOPMENT OF PORTABLE CALIBRATION
LIGHT SOURCE AND TEMPERATURE CORRECTION
ALGORITHM FOR IN‐SITU RADIOMETERS
17:10 17:40 Discussion
17:45 ‐ 18:15
Thurgood Ballroom
CLOSING SESSION
TOWARDS AN INTEGRATED DISCOMFORT GLARE MEASURE BASED ON THE HUMAN VISUAL
SYSTEM
COLOUR IMAGING, PERCEPTION, AND REPRODUCTION: NEW DIRECTIONS IN COLOUR SCIENCE AND TECHNOLOGY
CIE Session 2019 – Abstract Booklet
11

PO001 Yuki Akizuki Japan IMPROVEMENT OF COLOUR RENDERING OF URETHANE SKIN SAMPLES BY USING COMPUTER
COLOUR MATCHING METHOD
PO002 Miyoshi Ayama Japan COLORIMETRIC VALUES OF IMAGE SKIN COLOUR IN THE WHOLE FACE AND CHEEK PART, AND THEIR
RELATION TO SUBJECTIVE EVALUATION
PO003 DeWei Cao China STUDY OF TARGET VISIBILITY ON THE ROAD WITH DRIVING AS WORKLOAD
PO004 Giorgia Chinazzo Switzerland COGNITIVE PERFORMANCE EVALUATION UNDER CONTROLLED DAYLIGHT LEVELS AT DIFFERENT
INDOOR TEMPERATURES
PO005 Dorukalp Durmus Australia EVALUATION OF HUE SHIFT FORMULAE IN CIELAB AND CIECAM02‐UCS
PO006 Tomoya Fujiwara Japan THRESHOLD METRIC CHROMA OF IMAGES FOR CHROMATIC PERCEPTION
PO007 PP03 Chuen‐Yan Gu Chinese Taipei VISUAL IMPRESSIONS OF PAIRED PATTERNS – TAKING WALLPAPER PATTERNS AS AN EXAMPLE
PO008 Peter Hanselaer Belgium EXPLORING THE MICHAELIS‐MENTON FORMULA FOR APPEARANCE MODELLING
PO009 Stijn Hermans Belgium EVALUATING BRIGHTNESS AND GLARE PERCEPTION OF SELF‐LUMINOUS STIMULI
PO010 Eiji Hidaka Japan DEVELOPMENT FOR THE OPTIMUM DISPLAY COLOURS ON ROAD INFORMATION BOARDS WITH
CONSIDERATION FOR COLOUR VISION BARRIER FREE
PO011 Yejin Hong South Korea COLOUR APPEARANCE MATCH UNDER TWO LIGHTINGS HAVING DIFFERENT LUMINANCE LEVELS
PO012 Jeff Hovis Canada TRICHROMATIC AND DICHROMATIC COLORIMETRIC ANALYSIS OF THE FARNSWORTH‐MUNSELL D‐15
COLOUR VISION TEST
PO013 Zheng Huang China THE IMPACT OF GENDER AND OBJECT COLOUR ON THE PREFERRED COMBINATION OF
ILLUMINANCE AND COLOUR TEMPERATURE
PO014 Min Huang China COLOUR DIFFERENCE DISCRIMINATIONS OF YOUNG AND OLD OBSERVERS BASED ON DIFFERENT
DISPLAYS
PO015 Michico Iwata Japan STUDY ON THE RELATIONSHIP BETWEEN PREFERRED ILLUMINANCE AND CORRELATED COLOUR
TEMPERATURE OF LED LIGHTING FOR VISUALLY CHALLENGED PEOPLE
PO016 Xin Jiang China PEDESTRIANS TEND TO LOOK AT SCENES WITH HIGHER LUMINANCE AND GREATER SALIENCY AT
NIGHT
PO017 Shogo Kageyama Japan KANSEI EVALUATION OF THE RED OBJECT IMAGES USING DIFFERENT RED PRIMARIES
PO018 Masafumi Kamei Japan EFFECT OF DIRECT GLARE OF LED FLOODLIGHT ON CATCHING A MOVING OBJECT
PO019 Kohei Kawame Japan REPRESENTATIVE COLOUR OF THE WHOLE‐FACE IMAGE AND ITS RELATION TO FINISH‐UP
IMPRESSION
PO020 Kitivut Kongbuntud Thailand HYBRID WHITE LED STREET LIGHT FOR MESOPIC VISION
PO021 Chan‐Su Lee South Korea CHROMATIC DEPENDENCE OF THE CONTRAST SENSITIVITY FUNCTION OF THE PHANTOM ARRAY
EFFECT
PO022 Yandan Lin China EFFECTS OF CRI AND GAI ON EMOTION AND WORK PERFORMANCE IN OFFICE LIGHTING
PO023 Yandan Lin China ASSESSING LIGHTING APPRAISAL, PERFORMANCE, PHYSIOLOGICAL COMPONENTS IN OFFICE WORK
PO024 PP20 Yandan Lin China ASSESSING THE PROPORTIONS AND CCT OF DIRECT AND INDIRECT LIGHTING IN A REAL LIT OFFICE
PO025 Qiang Liu China BEST LIGHTING FOR JEANS: OPTIMISING COLOUR PREFERENCE, COLOUR DISCRIMINATION AND
COLOUR CONSTANCY
PO026 PP05 Yoko Mizokami Japan CHANGE IN THE APPEARANCE OF OBJECTS ACCORDING TO THE RATIO OF DIRECT AND DIFFUSIVE
LIGHT
PO027 Kenji Mukai Japan RELATIONSHIP BETWEEN COLOUR RENDERING INDICES AND SUBJECTIVE COLOUR DIFFERENCES
PO028 Balazs Vince Nagy Hungary CHROMATIC ADAPTATION EFFECTS AND LIMITS OF AMBIENT ILLUMINATION SPECTRAL CONTENT
PO029 Balázs Vince Nagy Hungary OBSERVING THE EFFECT OF CHROMATIC ADAPTATION ON COLOUR DISCRIMINATION UNDER
DIFFERENT VIEWING CONDITIONS
PO030 Marina Nishikawa Japan A STUDY ON COMPREHENSIBILITY OF INFORMATION OF INDUCTION SIGNS: DEGREE OF
INFORMATION SEPARATION IN SIGNBOARDS
PO031 PP02 Semin Oh South Korea HUE PERCEPTION AND NEUTRALNESS OF A SMARTPHONE DISPLAY UNDER DIFFERENT SURROUND
CONDITIONS
Posters
NOTE: Presented Posters are shown with the respective presentation number (PPxx) beside the Poster number (POxxx).
Poster session 1: Monday, June 17, 16:30 - 18:00
CIE Session 2019 – Abstract Booklet
12

PO032 Kazim Hilmi Or Turkey ISN’T COLOUR VISION AN ILLUSION?
PO033 Michael Royer United States REVIEW OF EXPERIMENTS ON SUBJECTIVE QUALITIES OF COLOUR RENDITION
PO034 Takashi Sakamoto Japan VISIBILITY OF HANDRAILS UNDER 500 LUX AND 0.5 LUX FLUORESCENT LIGHT: SUITABLE RAILING‐
COLOURS FOR ELDERLY PEOPLE
PO035 Renzo Shamey United States ON DETERMINING UNIQUE HUES FOR OBJECT STIMULI
PO036 Kevin Smet Belgium LUXPY: A PYTHON PACKAGE FOR COLOUR AND LIGHTING SCIENCE
PO037 Kevin Smet Belgium PILOT STUDY ON COLOUR MATCHING ACCURACY USING DIFFERENT PRIMARIES
PO038 Kevin Smet Belgium PILOT STUDY ON A NEW APPROACH FOR ESTIMATING ROOM BRIGHTNESS
PO039 Kevin Smet Belgium IMPACT OF BACKGROUND FIELD SIZE AND CORNEAL ILLUMINANCE ON THE DEGREE OF CHROMATIC
ADAPTATION
PO040 Kevin Smet Belgium REAL VS RENDER: COLORIMETRIC AND PERCEPTUAL ACCURACY USING A REAL AND RENDERED
CORNELL BOX WITH HEAD‐MOUNTED DISPLAY VIRTUAL REALITY
PO041 Kevin Smet Belgium COLORIMETRIC ACCURACY OF A SIMULATION OF THE LIGHTING IN A REAL TUNNEL USING A
PHYSICAL BASED RENDERER AND USING DIALUX
PO042 Yuki Tachikawa Japan MEASUREMENTS OF INTRAOCULAR STRAYLIGHT, VISUAL SENSITIVITY, AND DISCOMFORT GLARE FOR
YOUNG AND ELDERLY OBSERVERS
PO043 Hiroshi Takahashi Japan EFFECTS OF LIGHT COLOUR ON WORK EFFICIENCY AND ALERTNESS
PO044 Kees Teunissen Netherlands APPLICATION OF CIE 13.3‐1995 WITH ASSOCIATED CRI‐BASED COLOUR RENDITION PROPERTIES
PO045 Toshihiro Toyota Japan A QUANTITATIVE VISUAL EVALUATION METHOD FOR IN‐VEHICLE OPTICAL DEVICES BY LIGHTING
SIMULATION
PO046 Quang Vinh Trinh Germany COLOUR PREFERENCE IS DEPENDENT OF CORRELATED COLOUR TEMPERATURE, CHROMA
ENHANCEMENT AND ILLUMINANCE LEVELS ‐ EXPERIMENTS AND ANALYSIS
PO047 Yulia Tyukhova United States DISCOMFORT GLARE FROM UNIFORM LIGHT SOURCES WITH IMMEDIATE SURROUNDS
PO048 Pintus Valentina Austria EXPERIMENTAL STUDY ON CHEMICAL AND COLORIMETRIC CHANGES OF ART MATERIALS BY LED
IRRADIATION
PO049 PP04 Jennifer Veitch Canada DETECTION OF THE STROBOSCOPIC EFFECT UNDER LOW LEVELS OF THE STROBOSCOPIC VISIBILITY
METRIC
PO050 Michal Vik Czech Republic WHITENESS FORMULA BASED ON CIECAM02 AND THEIR TEXTILE APPLICATION
PO051 Martina Vikova Czech Republic DESIGN OF ALTERNATIVE WARNING SIGN AND PEDESTRIAN CONSPICUITY
PO052 Minchen Wei Hong Kong INVESTIGATION OF EFFECT OF CCT AND LUMINANCE OF ADAPTING FIELD ON DEGREE OF
CHROMATIC ADAPTATION VIA MEMORY COLOUR MATCHING
PO053 PP01 Lorne Whitehead Canada SPECTRAL CHARACTERISTICS INFLUENCING THE METAMERIC UNCERTAINTY INDEX
PO054 Kaida Xiao United Kingdom DEVELOPMENT OF WHITENESS INDEX FOR FACIAL COLOUR
PO055 Nianyu Zou China THE IMPACT OF LIGHTING SOURCE AND CALLIGRAPHY FONTS ON THE DEGREE OF PREFERENCE OF
CHINESE CALLIGRAPHY WORKS
PO056 Fengyun Cui Japan QUANTIFICATION OF VISUAL ENVIRONMENT RECALL RADIO OF OMNIDIRECTIONAL VIRTUAL REALITY
(VR)
PO057 Andrea Kim United States COLOUR EFFECTS IN THE RENDERING OF MIXED‐REALITY SCENES
PO058 PP07 Tzung‐Han Lin Chinese Taipei SHADE‐FREE TEXTURE ACQUISITION FOR 3D SCANNING SYSTEM
PO059 Midori Tanaka Japan PHYSICAL INDICES FOR REPRESENTING MATERIAL PERCEPTION WITH REGARD TO GLOSSINESS,
TRANSPARENCY, AND ROUGHNESS
PO060 Alexandra Tran Australia DYNAMIC LIGHTING FACILITATED BY COMPUTER VISION
PO061 Raquel Viula Netherlands A METHOD FOR ESTIMATING FISH‐EYE LENS’ FIELD‐OF‐VIEW ANGLE AND PROJECTION FOR HDR
LUMINANCE CAPTURE
PO062 PP11 Janne Askola Finland NATURAL AND ACCELERATED AGEING OF ORGANIC LED PANELS USING SPECTRALLY DISPERSED
ULTRAVIOLET EXPOSURE
PO063 Nina Basic Switzerland SPATIALLY RESOLVED MEASUREMENTS OF DIFFUSE REFLECTANCE
PO064 PP08 Tony Bergen Australia FLASH OBSERVATION AT THRESHOLD OF VISION USING A FOUR ALTERNATIVE FORCED CHOICE
EXPERIMENT
PO065 Catherine Cooksey United States REFERENCE DATA SET AND VARIABILITY STUDY FOR HUMAN SKIN REFLECTANCE
PO066 Peter Csuti Hungary DETECTOR BASED PHOTOMETRIC CALIBRATION OF GONIOPHOTOMETERS
CIE Session 2019 – Abstract Booklet
13

PO067 Paul Dekker Netherlands MAINS OPERATED LED BASED TRANSFER SOURCE FOR LUMINOUS FLUX SCALE REALISATION AND
DISSEMINATION
PO068 Antonio Ferreira Junior Brazil OPTICAL PARAMETERS COMPARISON OF DENTISTRY OPERATION LIGHTS
PO069 Alejandro Ferrero Spain VISUAL SCALE DEFINITION FOR GRAININESS TEXTURE BY APPLYING MULTIDIMENSIONAL SCALING
PO070 Alejandro Ferrero Spain CHARACTERIZATION OF BYKO‐ SPECTRA EFFECT LIGHT BOOTH FOR DIGITAL SIMULATION IN A
RENDERING TOOL
PO071 PP12 Alejandro Ferrero Spain TESTING SPARKLE MEASUREMENT CAPABILITIES OF NATIONAL METROLOGY INSTITUTES
PO072 Cheng Gao China CACULATION OF CCT AND Duv BASED ON POLYNOMIAL UP TO THIRD ORDER
PO073 PP09 Kenji Godo Japan INVESTIGATION OF LED‐BASED COMPACT TRANSFER STANDARD SOURCE FOR LUMINANCE
MEASUREMENT
PO074 János Hegedüs Hungary A STEP FORWARD IN LIFETIME MULTI‐DOMAIN MODELLING OF POWER LEDS
PO075 Liu Hui China EXTENDED WAVELENGTH LED FOR RADIOMETRICAL AND PHOTOMERICAL CALIBRATION
PO076 PP06 Yuki Kawashima United States QUANTIFYING PERCEIVED CHROMA CHANGES BY HUNT EFFECT IN LIGHTING
PO077 Thijs Kruisselbrink Netherlands CEILING‐BASED LUMINANCE MEASUREMENTS: A FEASIBLE SOLUTION?
PO078 Johannes Ledig Germany AUXILIARY DETECTOR POSITIONING SYSTEM WITH SIX DEGREES OF FREEDOM FOR THE EXTENSION
OF A PHOTOMETRIC BENCH
PO079 Johannes Lindén Denmark BEAT FLICKER – A TEMPORAL LIGHT ARTEFACT DUE TO MULTIPLE SOURCES OF TIME MODULATED
LIGHT
PO080 Minoru Minoru Japan SPECTRAL SUPRALINER BEHAVIOR OF SILICON PHOTODIODES WITH OVER‐FILLED ILLUMINATION
PO081 Yuri Nakazawa Japan DEVELOPMENT OF A COMPACT‐SIZE STANDARD LED FOR SPHERE‐SPECTRORADIOMETER IN 2PI
GEOMETRY
PO082 PP13 Tuomas Poikonen Finland FUTURE PHOTOMETRY BASED ON SOLID‐STATE LIGHTING PRODUCTS
PO083 PP14 Joelene Elliott Australia IMPACT OF LUMINANCE DISTRIBUTION ON PERCEPTION OF THE SHAPE OF ARCHITECTURAL SPACES
PO084 PP16 Kai Ge China EFFECT OF VISUAL DISTRACTION ON ANXIETY IN WOMEN DURING THE FIRST STAGE OF LABOR
PO085 PP19 Hinako Kage Japan EXPERIMENTAL STUDY ON ILLUMINANCE DISTRIBUTION IN THE TASK AND BACKGROUND AREA OF
OPEN‐OFFICE LIGHTING
PO086 PP18 Jing Lin United Kingdom EFFECT OF INTENSITY OF SHORT‐WAVELENGTH LIGHT ON SUBJECTIVE AND OBJECTIVE ALERTNESS
PO087 PP17 Noriko Umemiya Japan DIFFERENCES OF LIGHT ENVIRONMENT EVALUATION BETWEEN ELDERLY AND YOUNG PEOPLE
PO088 PP15 Shuxiao Wang China PRELIMINARY RESEARCH ON MATHEMATIC MODEL OF EYE’S ADAPTATION LUMINANCE
PO089 PP21 Yukio Akashi Japan LIGHTING REQUIREMENTS FOR ADAPTIVE DRIVING BEAM (ADB) TO IMPROVE TARGET VISIBILITY
WHEN ONCOMING HEADLIGHT GLARE EXISTS
PO090 PP10 Roman Dubnicka Slovakia GONIOSPECTRORADIOMETRY OF ROAD LIGHTING LUMINAIRES IN RESPECT OF MESOPIC
PHOTOMETRY
PO091 PP22 Roman Dubnicka Slovakia MEASUREMENT OF OBTRUSIVE LIGHTING OF OUTDOOR LIGHTING INSTALLATIONS
PO092 PP26 Eric Li United States IMPACT OF ROADWAY LIGHTING ON DRIVER BEHAVIOR AT FREEWAY RAMP LOCATIONS
PO093 PP25 Pimkamol Mattsson Sweden ENERGY EFFECTIVE OUTDOOR LIGHTING FOR VISUALLY IMPAIRED PEDESTRIANS
PO094 PP23 Valérie Muzet France TOWARDS AN OPTIMIZATION OF URBAN LIGHTING THROUGH A COMBINED APPROACH OF
LIGHTING AND ROAD BUILDING ACTIVITIES
PO095 PP28 Giuseppe Rossi Italy THE VEILING LUMINANCE IN TUNNEL LIGHTING INSTALLATIONS
PO096 PP24 Dorian Talon France IMPACT OF THE SPECTRUM OF LIGHT ON VISIBILITY IN ROAD TUNNELS
PO097 PP27 Anna Pellegrino Italy ANALYSIS AND DESIGN APPROACH FOR A NOCTURNAL IMAGE OF THE CULTURAL LANDSCAPE
PO098 PP29 Aleix Llenas Spain DYNAMIC MULTI‐LED LIGHTING SYSTEMS THAT MIMIC DAYLIGHT IMPROVES MEASURED ALERTNESS,
COMFORT AND SLEEP QUALITY
PO099 PP30 Luke Price United Kingdom CIRCADIAN LIGHT EXPOSURES OF SHIFT WORKING NURSES
PO198 PP31 Satoshi Hirakawa Japan ESTIMATION METHOD OF DISCOMFORT GLARE FOR LED TUNNEL INTERIOR LIGHTING
CIE Session 2019 – Abstract Booklet
14
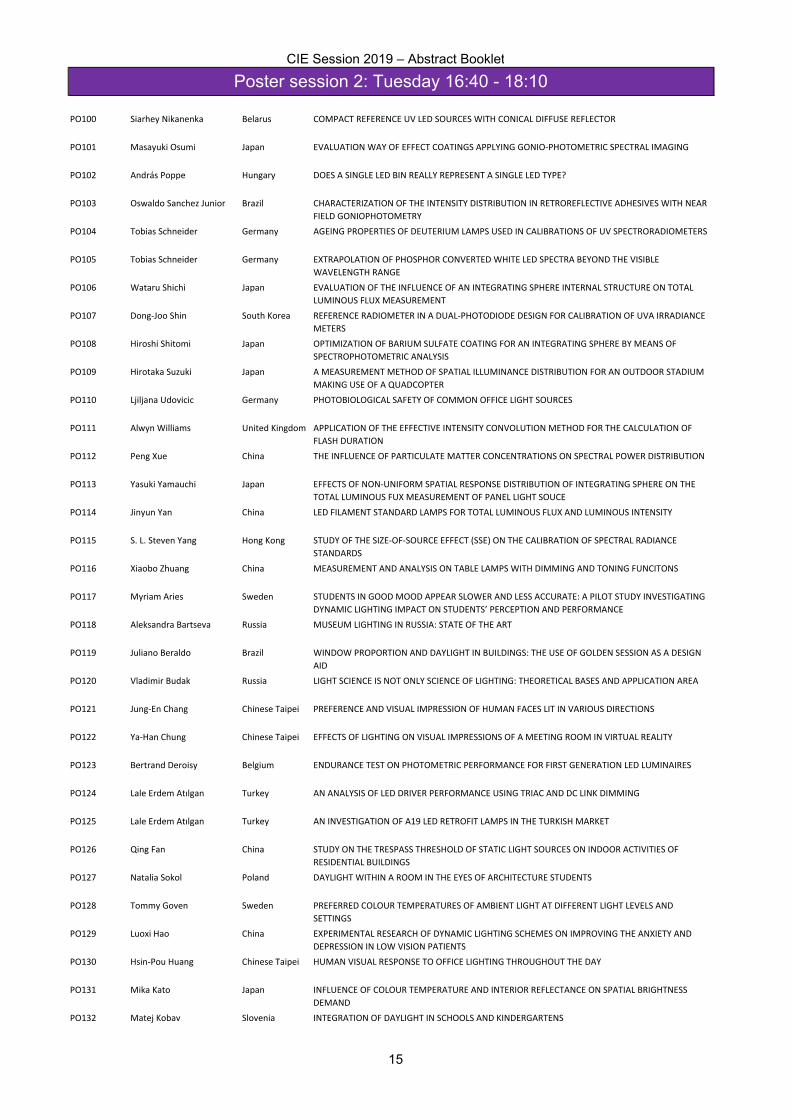
PO100 Siarhey Nikanenka Belarus COMPACT REFERENCE UV LED SOURCES WITH CONICAL DIFFUSE REFLECTOR
PO101 Masayuki Osumi Japan EVALUATION WAY OF EFFECT COATINGS APPLYING GONIO‐PHOTOMETRIC SPECTRAL IMAGING
PO102 András Poppe Hungary DOES A SINGLE LED BIN REALLY REPRESENT A SINGLE LED TYPE?
PO103 Oswaldo Sanchez Junior Brazil CHARACTERIZATION OF THE INTENSITY DISTRIBUTION IN RETROREFLECTIVE ADHESIVES WITH NEAR
FIELD GONIOPHOTOMETRY
PO104 Tobias Schneider Germany AGEING PROPERTIES OF DEUTERIUM LAMPS USED IN CALIBRATIONS OF UV SPECTRORADIOMETERS
PO105 Tobias Schneider Germany EXTRAPOLATION OF PHOSPHOR CONVERTED WHITE LED SPECTRA BEYOND THE VISIBLE
WAVELENGTH RANGE
PO106 Wataru Shichi Japan EVALUATION OF THE INFLUENCE OF AN INTEGRATING SPHERE INTERNAL STRUCTURE ON TOTAL
LUMINOUS FLUX MEASUREMENT
PO107 Dong‐Joo Shin South Korea REFERENCE RADIOMETER IN A DUAL‐PHOTODIODE DESIGN FOR CALIBRATION OF UVA IRRADIANCE
METERS
PO108 Hiroshi Shitomi Japan OPTIMIZATION OF BARIUM SULFATE COATING FOR AN INTEGRATING SPHERE BY MEANS OF
SPECTROPHOTOMETRIC ANALYSIS
PO109 Hirotaka Suzuki Japan A MEASUREMENT METHOD OF SPATIAL ILLUMINANCE DISTRIBUTION FOR AN OUTDOOR STADIUM
MAKING USE OF A QUADCOPTER
PO110 Ljiljana Udovicic Germany PHOTOBIOLOGICAL SAFETY OF COMMON OFFICE LIGHT SOURCES
PO111 Alwyn Williams United Kingdom APPLICATION OF THE EFFECTIVE INTENSITY CONVOLUTION METHOD FOR THE CALCULATION OF
FLASH DURATION
PO112 Peng Xue China THE INFLUENCE OF PARTICULATE MATTER CONCENTRATIONS ON SPECTRAL POWER DISTRIBUTION
PO113 Yasuki Yamauchi Japan EFFECTS OF NON‐UNIFORM SPATIAL RESPONSE DISTRIBUTION OF INTEGRATING SPHERE ON THE
TOTAL LUMINOUS FUX MEASUREMENT OF PANEL LIGHT SOUCE
PO114 Jinyun Yan China LED FILAMENT STANDARD LAMPS FOR TOTAL LUMINOUS FLUX AND LUMINOUS INTENSITY
PO115 S. L. Steven Yang Hong Kong STUDY OF THE SIZE‐OF‐SOURCE EFFECT (SSE) ON THE CALIBRATION OF SPECTRAL RADIANCE
STANDARDS
PO116 Xiaobo Zhuang China MEASUREMENT AND ANALYSIS ON TABLE LAMPS WITH DIMMING AND TONING FUNCITONS
PO117 Myriam Aries Sweden STUDENTS IN GOOD MOOD APPEAR SLOWER AND LESS ACCURATE: A PILOT STUDY INVESTIGATING
DYNAMIC LIGHTING IMPACT ON STUDENTS’ PERCEPTION AND PERFORMANCE
PO118 Aleksandra Bartseva Russia MUSEUM LIGHTING IN RUSSIA: STATE OF THE ART
PO119 Juliano Beraldo Brazil WINDOW PROPORTION AND DAYLIGHT IN BUILDINGS: THE USE OF GOLDEN SESSION AS A DESIGN
AID
PO120 Vladimir Budak Russia LIGHT SCIENCE IS NOT ONLY SCIENCE OF LIGHTING: THEORETICAL BASES AND APPLICATION AREA
PO121 Jung‐En Chang Chinese Taipei PREFERENCE AND VISUAL IMPRESSION OF HUMAN FACES LIT IN VARIOUS DIRECTIONS
PO122 Ya‐Han Chung Chinese Taipei EFFECTS OF LIGHTING ON VISUAL IMPRESSIONS OF A MEETING ROOM IN VIRTUAL REALITY
PO123 Bertrand Deroisy Belgium ENDURANCE TEST ON PHOTOMETRIC PERFORMANCE FOR FIRST GENERATION LED LUMINAIRES
PO124 Lale Erdem Atılgan Turkey AN ANALYSIS OF LED DRIVER PERFORMANCE USING TRIAC AND DC LINK DIMMING
PO125 Lale Erdem Atılgan Turkey AN INVESTIGATION OF A19 LED RETROFIT LAMPS IN THE TURKISH MARKET
PO126 Qing Fan China STUDY ON THE TRESPASS THRESHOLD OF STATIC LIGHT SOURCES ON INDOOR ACTIVITIES OF
RESIDENTIAL BUILDINGS
PO127 Natalia Sokol Poland DAYLIGHT WITHIN A ROOM IN THE EYES OF ARCHITECTURE STUDENTS
PO128 Tommy Goven Sweden PREFERRED COLOUR TEMPERATURES OF AMBIENT LIGHT AT DIFFERENT LIGHT LEVELS AND
SETTINGS
PO129 Luoxi Hao China EXPERIMENTAL RESEARCH OF DYNAMIC LIGHTING SCHEMES ON IMPROVING THE ANXIETY AND
DEPRESSION IN LOW VISION PATIENTS
PO130 Hsin‐Pou Huang Chinese Taipei HUMAN VISUAL RESPONSE TO OFFICE LIGHTING THROUGHOUT THE DAY
PO131 Mika Kato Japan INFLUENCE OF COLOUR TEMPERATURE AND INTERIOR REFLECTANCE ON SPATIAL BRIGHTNESS
DEMAND
PO132 Matej Kobav Slovenia INTEGRATION OF DAYLIGHT IN SCHOOLS AND KINDERGARTENS
Poster session 2: Tuesday 16:40 - 18:10CIE Session 2019 – Abstract Booklet
15

PO133 Yi Lin China AN EXPERIMENTAL STUDY OF THE LIGHTING FOR NONE NATURAL LIGHT OFFICE SPACE BASED ON
NON‐VISUAL BIOLOGICAL EFFECTS
PO134 Gang Liu China EXPLORATION AND RESEARCH ON VISUAL COMFORT MODEL OF NATURAL LIGHTING ENVIRONMENT
IN COLLEGE CLASSROOMS
PO135 Jennifer Long Australia VISUAL DISCOMFORT ASSOCIATED WITH CEILING LUMINAIRES: OBSERVATIONS, TRENDS AND
CHALLENGES 2009‐2018
PO136 Shunta Matsumoto Japan INVESTIGATION OF OPENING DESIGN INDEX FOR DAYLIGHTING IN HOUSES
PO137 Barbara Matusiak Norway TOWARDS NEW DESIGN OF LASER CUT ACRYLIC PANELS FOR WINDOWS
PO138 Naomi Miller United States PRACTICAL CONSIDERATIONS FOR AN EFFECTIVE FLICKER METRIC
PO139 Naomi Miller United States TOP EFFICACY PERFORMERS: THE QUALITY TRADEOFFS IN LED LUMINAIRES
PO140 Hiroyuki Miyake Japan EFFECTS OF LIGHTING ON PERCEPTION OF SPACIOUSNESS
PO141 Etsuko Mochizuki Japan GLARE FROM WINDOW CONSIDERING TIME FLUCTUATION AND TYPES OF TASK
PO142 Tongsheng Mou China A NOVEL METHOD TO EVALUATE DYNAMIC LIGHTING ENVIRONMENT THAT MEASURES VISUAL AND
NONVISUAL PERFORMANCE IN ARCHITECTURE SPACES
PO143 Xi Mou China CHINESE HIGH SCHOOL LIGHTING DESIGN TO IMPROVE STUDENT’S VISUAL AND NONVISUAL
PERFORMANCE
PO144 Bruce Nordman United States LIGHTING CONTROL USER INTERFACE STANDARDS
PO145 Chikako Ohki Japan FAÇADE DESIGN OPTIMIZATION BASED ON ENERGY USAGE, GLARE AND VIEW USING RADIANCE
AND NEWHASP
PO146 Toshihide Okamoto Japan CASE STUDIES OF A THREE‐DIMENSIONAL EXPRESSION OF COLOURED LIGHT FLOW USING VOLUME
PHOTON MAPPING
PO147 Shino Okuda Japan PREFERABLE LIGHTING FOR APPEARANCE OF WOMEN’S FACIAL SKIN
PO148 Yukino Shimizu Japan A STUDY ON THE CONTRAST OF LUMINANCE BETWEEN PAINTINGS AND WALL SURFACES WITH
WHITE LEDS IN MUSEUM
PO149 Juliëtte van Duijnhoven Netherlands OFFICE WORKER’S SATISFACTION WITH LIGHTING
PO150 Gilles Vissenberg Netherlands ROBUST UNIFIED GLARE RATING EVALUATION FOR REAL LIGHTING INSTALLATIONS
PO151 Aiying Wang China BUILDING INFORMATION MODELING BASED ARCHITECTURAL LIGHT EMITTING DIODE LIGHTING
DESIGN: A PROPOSAL
PO152 Lei Wang China THE STUDY OF LED LIGHTING DAMAGE TO PAPER RELICS
PO153 Tongyao Wu China COMFORT SUBJECTIVE EVALUATION OF DIFFERENT READING MEDIUM UNDER THE ILLUMINATION
ENVIRONMENT IN LIBRARY READING ROOM
PO154 Hideki Yamaguchi Japan DEVELOPMENT OF GENERIC COLORIMETRY SYSTEM FOR EVALUATION OF LIGHTING ENVIRONMENT
PO155 Yuan Yao China A PRELIMINARY EXPLORATION OF DYNAMIC DAYLIGHTING SIMULATION IN CHINESE TRADITIONAL
ARCHITECTURE WITH WINDOW PAPER
PO156 Yusuke Yonekura Japan VALIDATION OF THE SPATIAL BRIGHTNESS ESTIMATION FORMULA IN OFFICES WITH WINDOWS
PO157 Nozomu Yoshizawa Japan EXAMINATION OF THE APPLICATION RANGE OF THE AVERAGE LUMINANCE FOR ESTIMATING
SPATIAL BRIGHTNESS
PO158 Jianping Zhao China RESEARCH ON LIGHTING POWER DENSITY AND ENERGY‐SAVING TECHNIQUES OF SPORTS LIGHTING
PO159 Vincent Boucher France DYNAMIC GLARE EVALUATION ALONG A ROUTE
PO160 Constantinos Bouroussis Greece OPTIMIZATION OF TUNNEL LIGHTING CONTROL BY RE‐AIMING OF THE EXTERNAL L20 LUMINANCE
METER
PO161 John Bullough United States INVESTIGATION OF STROBOSCOPIC EFFECTS FROM CHROMATIC FLICKER
PO162 John Bullough United States INFLUENCE OF LIGHT LEVELS ON VISIBILITY FOR SAFETY AT AUTOMATED TELLER MACHINE
FACILITIES
PO163 Romain Chasseigne France LIGHT POLLUTION ANALYSIS USING HI‐RESOLUTION NIGHT AERIAL LIGHTING MAPS
PO164 Cheng‐Hsien Chen Chinese Taipei GLARE ASSESSMENT FOR LOW‐REFLECTION DISPLAY DEVICES
PO165 Cheng‐Hsien Chen Chinese Taipei ROAD LIGHTING MEASUREMENTS BY AN EQUIPPED VEHICLE
PO166 Dennis Dan Corell Denmark TOOL FOR ANALYSIS OF TUNNEL LIGHTING BASED ON VISUAL PERFORMANCE AND VISUAL
COMFORT
PO167 Roman Dubnicka Slovakia INTERPOLATION METHODS OF I‐TABLES OF ROAD LIGHTING LUMINAIRES
CIE Session 2019 – Abstract Booklet
16
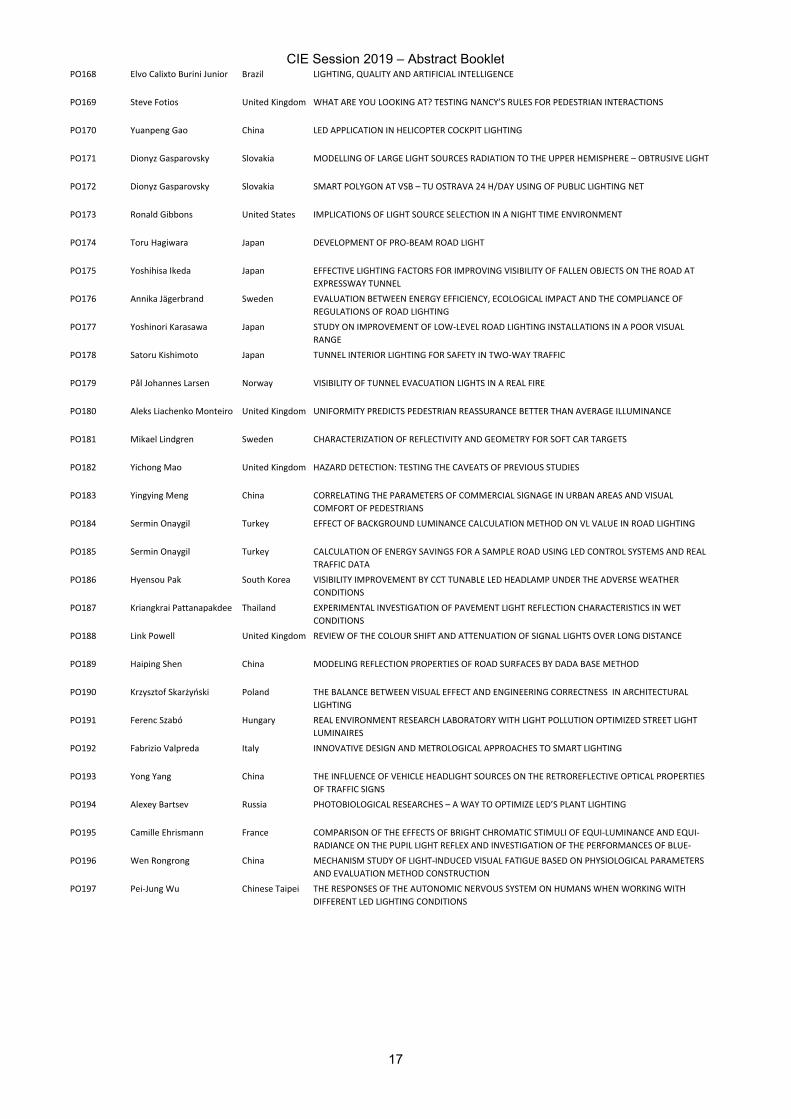
PO168 Elvo Calixto Burini Junior Brazil LIGHTING, QUALITY AND ARTIFICIAL INTELLIGENCE
PO169 Steve Fotios United Kingdom WHAT ARE YOU LOOKING AT? TESTING NANCY’S RULES FOR PEDESTRIAN INTERACTIONS
PO170 Yuanpeng Gao China LED APPLICATION IN HELICOPTER COCKPIT LIGHTING
PO171 Dionyz Gasparovsky Slovakia MODELLING OF LARGE LIGHT SOURCES RADIATION TO THE UPPER HEMISPHERE – OBTRUSIVE LIGHT
PO172 Dionyz Gasparovsky Slovakia SMART POLYGON AT VSB – TU OSTRAVA 24 H/DAY USING OF PUBLIC LIGHTING NET
PO173 Ronald Gibbons United States IMPLICATIONS OF LIGHT SOURCE SELECTION IN A NIGHT TIME ENVIRONMENT
PO174 Toru Hagiwara Japan DEVELOPMENT OF PRO‐BEAM ROAD LIGHT
PO175 Yoshihisa Ikeda Japan EFFECTIVE LIGHTING FACTORS FOR IMPROVING VISIBILITY OF FALLEN OBJECTS ON THE ROAD AT
EXPRESSWAY TUNNEL
PO176 Annika Jägerbrand Sweden EVALUATION BETWEEN ENERGY EFFICIENCY, ECOLOGICAL IMPACT AND THE COMPLIANCE OF
REGULATIONS OF ROAD LIGHTING
PO177 Yoshinori Karasawa Japan STUDY ON IMPROVEMENT OF LOW‐LEVEL ROAD LIGHTING INSTALLATIONS IN A POOR VISUAL
RANGE
PO178 Satoru Kishimoto Japan TUNNEL INTERIOR LIGHTING FOR SAFETY IN TWO‐WAY TRAFFIC
PO179 Pål Johannes Larsen Norway VISIBILITY OF TUNNEL EVACUATION LIGHTS IN A REAL FIRE
PO180 Aleks Liachenko Monteiro United Kingdom UNIFORMITY PREDICTS PEDESTRIAN REASSURANCE BETTER THAN AVERAGE ILLUMINANCE
PO181 Mikael Lindgren Sweden CHARACTERIZATION OF REFLECTIVITY AND GEOMETRY FOR SOFT CAR TARGETS
PO182 Yichong Mao United Kingdom HAZARD DETECTION: TESTING THE CAVEATS OF PREVIOUS STUDIES
PO183 Yingying Meng China CORRELATING THE PARAMETERS OF COMMERCIAL SIGNAGE IN URBAN AREAS AND VISUAL
COMFORT OF PEDESTRIANS
PO184 Sermin Onaygil Turkey EFFECT OF BACKGROUND LUMINANCE CALCULATION METHOD ON VL VALUE IN ROAD LIGHTING
PO185 Sermin Onaygil Turkey CALCULATION OF ENERGY SAVINGS FOR A SAMPLE ROAD USING LED CONTROL SYSTEMS AND REAL
TRAFFIC DATA
PO186 Hyensou Pak South Korea VISIBILITY IMPROVEMENT BY CCT TUNABLE LED HEADLAMP UNDER THE ADVERSE WEATHER
CONDITIONS
PO187 Kriangkrai Pattanapakdee Thailand EXPERIMENTAL INVESTIGATION OF PAVEMENT LIGHT REFLECTION CHARACTERISTICS IN WET
CONDITIONS
PO188 Link Powell United Kingdom REVIEW OF THE COLOUR SHIFT AND ATTENUATION OF SIGNAL LIGHTS OVER LONG DISTANCE
PO189 Haiping Shen China MODELING REFLECTION PROPERTIES OF ROAD SURFACES BY DADA BASE METHOD
PO190 Krzysztof Skarżyński Poland THE BALANCE BETWEEN VISUAL EFFECT AND ENGINEERING CORRECTNESS IN ARCHITECTURAL
LIGHTING
PO191 Ferenc Szabó Hungary REAL ENVIRONMENT RESEARCH LABORATORY WITH LIGHT POLLUTION OPTIMIZED STREET LIGHT
LUMINAIRES
PO192 Fabrizio Valpreda Italy INNOVATIVE DESIGN AND METROLOGICAL APPROACHES TO SMART LIGHTING
PO193 Yong Yang China THE INFLUENCE OF VEHICLE HEADLIGHT SOURCES ON THE RETROREFLECTIVE OPTICAL PROPERTIES
OF TRAFFIC SIGNS
PO194 Alexey Bartsev Russia PHOTOBIOLOGICAL RESEARCHES – A WAY TO OPTIMIZE LED’S PLANT LIGHTING
PO195 Camille Ehrismann France COMPARISON OF THE EFFECTS OF BRIGHT CHROMATIC STIMULI OF EQUI‐LUMINANCE AND EQUI‐
RADIANCE ON THE PUPIL LIGHT REFLEX AND INVESTIGATION OF THE PERFORMANCES OF BLUE‐
PO196 Wen Rongrong China MECHANISM STUDY OF LIGHT‐INDUCED VISUAL FATIGUE BASED ON PHYSIOLOGICAL PARAMETERS
AND EVALUATION METHOD CONSTRUCTION
PO197 Pei‐Jung Wu Chinese Taipei THE RESPONSES OF THE AUTONOMIC NERVOUS SYSTEM ON HUMANS WHEN WORKING WITH
DIFFERENT LED LIGHTING CONDITIONS
CIE Session 2019 – Abstract Booklet
17

ORAL PRESENTATIONS
CIE Session 2019 – Abstract Booklet
18

Session PA1-1 D1/D2/D3 - TLM Measurement and
Effects Monday, June 17, 10:40–12:00
CIE Session 2019 – Abstract Booklet
19

OP01
FLICKER (PSTLM) AND STROBOSCOPIC EFFECT (SVM) – LIGHT MEASUREMENTS IN
PHOTOMETRICAL LABORATORIES. SIGNIFY DEVELOPED SETUP AND VALIDATION METHOD
Adam Klej1, Andrew Jackson2, Pierre Beeckman1, Norbert Mila3, Konika Banerjee1, Marc Embrechts4, Henk-Jan van Aalderen1
1 Signify, Eindhoven, NETHERLANDS, 2 Signify, Salina, USA, 3 Signify, Shanghai, CHINA, 4 Signify, Turnhout, BELGIUM
Abstract
1. Motivation, specific objective
CIE TN 006:2016 - Visual Aspects of Time-Modulated Lighting Systems – Definitions and Measurement Models document contains the description of current measures to evaluate Temporal Light Artifacts (TLA), including flicker and stroboscopic effects. From an industry perspective, there are several methods available to record optical waveforms and to evaluate these waveforms for TLA effects. These TLA metrics can be utilized to ensure that lighting products possess high levels of light quality. The primary documents that are currently available for test and measurement of optical waveforms and TLA are: (1) National Electrical Manufacturers Association (NEMA) NEMA 77-2017 Temporal Light Artifacts: Test Methods and Guidance; (2) International Electrotechnical Commission (IEC) TR 61547-1:2017 ED2 Equipment for general lighting purposes - EMC immunity requirements - Part 1: An objective light flickermeter and voltage fluctuation immunity test method; and (3) (IEC) TR 63158:2018 Equipment for general lighting purposes - Objective test method for stroboscopic effects of lighting equipment. These three documents provide guidance for performing accurate measurements, but many laboratories struggle making consistent and accurate measurements of temporal light artefacts.
2. Methods
Signify developed measurement setup and verification methods for TLA utilizing a novel reference modulation radiator (aka Reference Radiator) to validate the TLA measurement systems. The Refrad generates periodic light waveforms with different shapes, modulation frequencies & modulation levels. Values of various TLA metrics are known for input waveforms (mathematical representations) and are able to generate very stable and reproducible optical signals. Additionally, the reference radiator was utilized to examine the performance of 3 laboratory setups, while operating with several preprogrammed optical waveforms known analytically that are helping to evaluate TLA measurement system capabilities and discover limitations on proper acquisition of light modulation and calculation of the measures.
3. Results
Results of the testing and alignment will be presented. The first two NVLAP accredited laboratories to the NEMA 77-2017 standard were Signify Laboratories – Salina/USA and Shanghai/China. This is proof that the Signify developed methods can help laboratories on verifying of the TLA quantities measured and calculated.
4. Conclusions
Proper verification of the TLA measurement systems is important. Knowledge of the limitations of equipment and methods are crucial to perform accurate assessment of Temporal Light Artefact
quantities: PSTLM and SVM. Signify developed verification method comes as solution to the laboratories.
CIE Session 2019 – Abstract Booklet
20

OP02
MEASURING AND COMPARING WAVEFORMS OF TEMPORAL LIGHT MODULATION
Thorseth, A.1, Lindén, J.1, Bergen, A.S.J.2
1 DTU Fotonik, Department of Photonics Engineering, Technical University of Denmark, DENMARK 2 Photometric Solutions International, Melbourne, AUSTRALIA
Abstract
1. Motivation, specific objective
Temporal light modulation (TLM) of lighting products is of interest due to its possible adverse effects on human health and wellbeing, combined with the resurgence of modulated lighting from common light sources such as LED lighting powered by current drivers based on pulse-width-modulation or simple AC rectification.
The effects of TLM on humans are called temporal light artefacts (TLA) and the basis of the calculation of these effects is the modulation waveform i.e. the variation of light as function of time over one or more modulation periods. In 2016, the International Commission on Illumination (CIE) published a Technical Note (CIE TN 006:2016) which outlined the main types of TLA and principles for their quantification. This work was an intermediate product of the work of CIE TC 1-83 "Visual Aspects of Time-Modulated Lighting Systems". The CIE has subsequently established an additional technical committee to recommend guidelines for the measurement of TLM (TC 2-89).
Given the large international market for lighting, measurements of quantities such as TLM metrics should be comparable between regions, manufactures etc., so there is a clear need for measurement methods that provide accurate and reproducible results. In order to verify reproducibility a method of comparison is needed.
This paper presents a comparison of measurement of TLMs from two different laboratories both under CIE S 025 standard conditions. From the measured waveforms the various metrics are calculated such as short-term flicker indicator (PstLM), Modulation Depth, Stroboscopic Visibility Measure (SVM), Flicker Percentage, Flicker Perception Metric and Flicker Index.
Since the various TLM related metrics are aggregate numbers reducing the measured waveforms to one or a few numbers, there is a need for objective methods for comparison of the waveforms themselves measured under various circumstances. This paper will propose mathematically rigorous methods needed for objective comparisons.
2. Methods
The laboratory comparison presented is between measurements from two laboratories; one in Europe and one in Australia. The artefacts used in the comparison are filament LEDs, which are prone to produce TLM due to the very limited space for AC power converter and current driver. The paper will describe the measurement setups used in the comparison.
The paper will present and discuss the differences in the measured metrics and their relation to the experimental uncertainty.
In order for the comparison to be possible the waveforms have to be transformed to a comparable state. This comparison of waveforms will consider the following concepts for a mathematical alignment of the waveforms:
Sampling interval matching; used for a common interpolation
Interpolation methods; relevant for large differences in sampling interval
Frequency matching; as even small difference in fundamental frequency leads to a beat effect between waveforms
Phase matching; side by side comparison of waveforms require synchronization
Normalization; as the waveforms have arbitrary units the choice of normalisation factor (average, RMS, median etc.) can influence the result of a comparison
CIE Session 2019 – Abstract Booklet
21

With the waveforms aligned, we can compare the signals value to value using methods such as:
Regression analysis of the waveforms
Comparison of frequency spectrum
Residual signal delay analysis (Measurement response time and signal delay)
3. Results
The results presented in the paper will consist of comparisons of the measured TLM metrics as well as comparisons of the measured waveforms using the waveform alignment methods. Preliminary results show that frequency matching can be an important point, as well as the choice of normalization factor. The results of the comparison will also take into account the uncertainties associated with measurements of TLM.
4. Conclusions
TLM is an important aspect of lighting quality, making measurement of this characteristic a priority in photometry. While measurement and comparison of single value quantities and the associated uncertainties, such as the various TLA metrics, can be done with conventional methods, such as the z-score and the calculation of En numbers, the comparison of the waveforms needs an algorithmic approach for comparison. Comparison of the rich data of the waveforms may provide insights into the quality of measurement, uncertainties and other important details.
CIE Session 2019 – Abstract Booklet
22

OP03
THE VISIBILITY OF THE PHANTOM ARRAY EFFECT UNDER OFFICE LIGHTING CONDITION
Wang, L.L.1*, Tu, Y.1, Cheng. S.L.1, Yu, X.L.1, Perz, M.2 Sekulovski, D.2 1 School of Electronic Science and Engineering, Southeast University, Nanjing, CHINA,
2 Signify Research, THE NETHERLANDS
Abstract
The phantom array effect, also known as ghosting, is one of the temporal light artefacts induced by temporally modulated light. The phantom array effect is defined as “change in perceived shape or spatial positions of objects, induced by a light stimulus the luminance or spectral distribution of which fluctuates with time, for a non-static observer in a static environment.” Until now, most studies focused on the visibility of this phenomenon under the direct view conditions, i.e. when observing the light source directly. In such viewing conditions, the phantom array effect is visible at frequencies above the critical flicker frequency, i.e. 80 Hz, and is more readily perceived for light source with high luminance and a sharp edge, creating a high contrast between the target and the background. Besides, the visibility is also influenced by the frequency and light waveform.
However, some research has suggested that the phantom array effect also might be perceived during reading, i.e. under indirect viewing conditions, when the light source generating temporally modulated light is not in the observer’s field of view. It has been argued that under such conditions making saccades across words can result in a visible phantom array effect which might interfere with reading. Thus, it’s important to also study the phantom array effect under indirect viewing office lighting condition, and to verify whether it can cause a problem during reading.
In this paper, we present two perception experiments conducted under office lighting conditions, in which we studied the influence of different parameters: contrast pattern, frequency, and illumination level on the visibility of the phantom array effect. The results provide information about the visibility of phantom array effect in applications with similar to office lighting conditions, such as home and hospitability.
A typical office luminaire equipped with LEDs was mounted in a room. The voltage of the LEDs was controlled by a programmable waveform generator via a computer. The relation between voltage and output light intensity was measured to transform the desired intensity into the required voltage. A regular table was placed right under the luminaire, with the height of 75 cm above the floor.
In the first experiment, the table was covered with a black surface, and a white paper strip that served as the target, was placed in the center of it. The strip had the width of 0.2 cm and the length of 2.5 cm. During the experiment, the averaged illumination on the table was about 250 lx, and the Michelson contrast was around 0.93. Participants were asked to stand in front of the table and make rapid eye movements over the white target and between the left and right edges of the table. The resulting saccades had amplitudes of about 50°. We tested the influence of frequency, i.e. 100 Hz, 600 Hz and 1200 Hz, on the visibility of the phantom array effect with simple sine waves. First, we performed a pilot experiment to select the modulation depths that were used for the different frequency conditions. For 100 Hz and 1200 Hz, we tested the visibility of waveforms with the modulation depth of 20%, 30%, 50%, 70% and 100%. For 600 Hz, much lower modulation depths were used, being 8%, 10%, 12%, 15% and 20%. A 2-Alternative-Forced-Choice (2AFC) method was adopted. Each trial consisted of two lighting conditions, being a constant light output and the modulated light. The table was first illuminated by one of the two light conditions for 5 seconds, then the light turned off for 3 seconds, followed by the other light condition. Participants were instructed to constantly make eye saccades and to point out in which light condition they perceived the effect. For each
CIE Session 2019 – Abstract Booklet
23
frequency and at each modulation depth, ten trails were executed. 20 subjects participated in this experiment, 10 males and 10 females, with age ranged between 22 and 26.
The number of times the phantom array effect was correctly detected was counted and averaged for each stimulus and participant. Results show that, for all the three tested frequencies, the phantom array effect is more visible, i.e. has higher detection rate, at larger modulation depth. The 75% threshold was calculated by fitting the psychometric curve to the probability of detection, for each frequency. The threshold was around 26%, 14% and 46% modulation depth for 100 Hz, 600 Hz and 1200 Hz, respectively. It is notable that, the visibility threshold measured for the sine wave at the frequency of 600 Hz was lower than the threshold at 100 Hz and 1200 Hz. This indicates that the phantom array effect is more readily visible at intermediate frequency of 600 Hz, compared to the lower (100 Hz) or higher frequencies (1200 Hz). This result corresponds to the U-shape sensitivity curve obtained in our previous study with direct viewing condition.
In the second experiment, an inversed contrast pattern was presented: the table was covered with a white surface and a black paper strip that served as the target was placed in the center of it, yielding a Michelson contrast of around -0.93. We performed a pilot study which revealed that the phantom array effect was almost imperceptible. Thus, only the most sensitive situation obtained in the first experiment, i.e. sine wave with the frequency of 600 Hz a t full modulation depth, was used as the stimulus in the second experiment. In addition, two illumination levels were tested in separate sessions. In session 1, the averaged illumination measured on the table was 250 lx, and in session 2 it was 500 lx. The procedure was the same as in experiment 1. All the same 20 participants joined the first session, and 14 of them joined the second session.
Results show that the averaged probability of detection is about 70.5% at 250 lx and 70% at 500 lx. A large variation among participants was found. An independent-sample t-test showed that there was no significant difference between these two illumination levels. As in a 2AFC method that was used, a 75% detection corresponds to a visibility threshold , the results indicate that most subjects cannot detect the phantom array effect under the condition with a black target on a white background. Besides, the illumination level within the range of 250 lx and 500 lx has no influence on the visibility.
The results obtained in this study generally show that the phantom array phenomenon could have some effect even though participants do not look at the light source directly, especially when they are looking at a white target on a black background. However, if participant is looking at a black target on white background, i.e. just like during normal reading, this effect is generally not visible. In the final paper we will provide a possible explanation for the results.
CIE Session 2019 – Abstract Booklet
24

OP04
COGNITIVE AND EYE MOVEMENT EFFECTS ON VIEWERS OF TEMPORAL LIGHT MODULATION FROM SOLID-STATE LIGHTING
Veitch, J.A.1 1 National Research Council of Canada, Ottawa, CANADA
Abstract
1. Motivation, specific objective
Some light sources exhibit cyclical variations in light output, known as temporal light modulation (TLM). When the TLM frequency is below ~60 Hz, viewers perceive it as flicker. Prior research has shown that TLM can be detected by humans at much higher frequencies, and that this detection may result in adverse consequences such as headache, eyestrain, and reduced visual performance. Conversely, one study found that TLM at 500 Hz with 100% modulation depth and a 50% duty cycle improved cognitive performance relative to constant light output, but this level also increased arousal. IEEE standard S1789-2015 has recommended limits on light source TLM, but these have been controversial because the recommendations could place familiar light sources such as 60 W incandescent lamps into the category of high-risk light sources.
2. Methods
This experiment tested viewers’ responses to nine TLM conditions, chosen in part to represent the no-risk, low-risk, and high-risk areas of the S1789-2015 recommendations, as well as to expand to a test of variables not included in the document, such as the light source duty cycle and individual differences in sensitivity to TLM. Dominant frequency varied from 0 Hz (DC) to 1000 Hz, modulation depth varied from 0 to 100%, and for the square-wave conditions there were duty cycles of 30% and 50%. When characterized by the stroboscopic visibility metric, which is among the metrics proposed to describe TLM, the conditions ranged from SVM = 0 to SVM = 2.3. In terms of the IES Flicker Index, values varied from 0 to 0.64 across the nine conditions.
Fifty adult participants, equal numbers of men and women from all age groups, participated in this repeated-measures experiment. Participants viewed the tasks in a custom-built light booth in which both the computer display and ambient illumination were provided by 3500 K LEDs powered by a programmable power supply through which the chosen TLM conditions were created while maintaining a constant illuminance of 400 lx. There were three tasks: detection of the phantom array (a visual perception phenomenon); reading; and the Stroop cognitive interference test. Throughout these tasks, eye movements and pupil size were tracked. At the end of each exposure to a TLM condition, participants were asked to report their experience of visual discomfort symptoms. Prior to the tasks, participants completed the Pattern Glare Sensitivity test to provide information concerning their susceptibility to visual stress.
3. Results
The data have been collected and data analysis is proceeding. The results will be the focus of the presentation, and will be available in time for the submission of the full proceedings paper.
4. Conclusions
Research such as this is one step towards establishing suitable thresholds for TLM of lighting systems. The presentation will consider the effects of the TLM conditions on the sample as a whole, considering the effects on performance, perception, and eye movements. The conclusions will consider the implications of the results for lighting practice as well as identifying gaps where further research is required.
CIE Session 2019 – Abstract Booklet
25

Session PA1-2 D1 - Colour Appearance Monday, June 17, 10:40–12:00
CIE Session 2019 – Abstract Booklet
26

OP05
AN INITIAL STUDY OF COLOUR APPEARANCE IN VIRTUAL REALITY
Ma, C., Ou, L. National Taiwan University of Science and Technology, Taipei, CHINESE TAIPEI
Abstract
1. Motivation, specific objective
Virtual reality (VR) has been prevalent in recent years, and you can imagine there will be more and more applications based on VR technology in the future. Due to the popularity of this technology, there is an increasing demand for understanding of colour appearance in a VR environment. By designing a VR space for visual assessment of colour appearance, we were able to investigate the appearance of colour in VR. We also looked into the difference in colour appearance between VR and real-world experience by comparing the experimental results with predictive values by CIECAM02. The findings of the study may help develop new models of colour appearance for VR applications.
2. Methods
To achieve this aim, a psychophysical experiment of colour appearance was conducted using a mobile VR headset, and a VR space was created using the 3DS MAX software in which the appearance of colour patches shown in the VR space were visually assessed.
The mobile VR headset used in this experiment was Miniso Simple 3D VR Glasses, with a viewing angle of up to 90 degrees and a spherical lens diameter of 40mm. An iPhone 6, with a 4.7-inch screen that had a resolution of 1334 by 750 pixels, i.e. 326 ppi, was used to present the VR images.
The VR space was 220 (width) by 255 (depth) by 200 (height) in size. All walls, ceiling and floor in this space were coloured medium grey. On the main wall, which the observer was naturally facing, were 3 colour patches presented side by side, all of which were lit uniformly by a virtual wall washer as the white light source. The left colour patch was the reference white, with an adopted lightness value of 100. The one on the right was the reference colourfulness, with an adopted colourfulness value of 23. The colour patch in the middle was the test colour, with a perceived size of 21.25 by 21.25cm, which was larger than the two reference colour patches, both having a perceived size of 37.50 by 37.50 cm. The reference white had a luminance of 200.16 cd/m2, with (x, y) = (0.308, 0.324). The viewing distance for the main wall was perceived to be 214.38 cm. This indicates that the test colour had a perceived viewing angle of 10 degrees. Note that all the perceived size and distance values in this VR space were determined by visual comparisons between the VR and a real-world space using magnitude estimation method.
The experiment used 35 test colours, selected from CIELAB space to cover a wide variety of hue, lightness and chroma. The colours consisted of 5 hue regions, red (with a hue angle of 20°), yellow (90°), green (164°), blue (245°) and purple (320°), each containing three levels of lightness, 25, 50 and 75, and two levels of chroma, 15 and 30. This resulted in 5 hue regions x 3 lightness x 2 chroma + 5 achromatic colours = 35 test colours in total. There were 10 test colours replicated, and thus each observer made 45 visual assessments in the VR space.
During the experiment, the observer was asked to assess each test colour in terms of lightness, colourfulness and hue quadrature using magnitude estimation method. The test colours were presented one at a time in random order. Note that for each observer the entire experiment lasted about 40 minutes, during which the observer needed to wear the VR headset to perform the visual assessments. Thus, there was a 10-minute break for each observer after completing 25 test colours, and during the break the observer was encouraged to take off the VR headset to get a rest.
A panel of 16 observers, all university students with normal colour vision, participated in the study. None of the observers reported visual discomfort after the experiment.
CIE Session 2019 – Abstract Booklet
27

3. Results
To see whether there was any difference in colour appearance between the VR space and the real-world environment, visual results obtained in this study were compared with the predicted values by CIECAM02 in terms of lightness, colourfulness and hue quadrature.
As a result, high correlation was found between perceived lightness and CIECAM02 J, with a correlation coefficient of 0.96. High correlation was also found between perceived hue quadrature and CIECAM02 H, with a correlation coefficient of 0.99. The results indicate high consistency in colour appearance between the VR space and the real-world environment in terms of lightness and hue.
Nevertheless, correlation between perceived colourfulness and CIECAM02 M was 0.88, a relatively lower value than those for the other two scales of colour appearance. The scatter graph of perceived colourfulness (at vertical axis) against CIECAM02 M (at horizontal axis) shows a somewhat logarithmic curve.
4. Conclusions
According to the experimental results, lightness and hue both show high consistency between the VR space and the real-world environment, the latter being represented by CIECAM02 J and H values. Colourfulness was the only scale that shows a non-linear relationship between the VR space and the real-world environment.
As an initial attempt to study colour appearance in VR, it is unclear whether the findings described above truly reflect colour appearance phenomena in VR, or there might be other factors that have affected the experimental results. First, all colours in this study were measured using a Topcon SR-UL1R spectroradiometer, without considering the fact that the lens design of the spectroradiometer may not provide the best solution for measuring near-eye displays. Second, this study used a reference colourfulness of 23. Some observers complained that this value was too low for them as a reference when estimating perceived colourfulness for greyish colours. How to select the right colour as the reference colourfulness may be the key here. All these issues will need to be investigated further in future studies.
CIE Session 2019 – Abstract Booklet
28
OP06
MODELLING OF SIMULTANEOUS CONTRAST EFFECTS USING MEMORY COLOUR MATCHING METHOD TO REVISE THE CIECAM16 COLOUR APPEARANCE MODEL
Zhu, Y.1, Luo, M.R.1,2 1 State Key Laboratory of Modern Optical Instrumentation, Zhejiang University, Hangzhou, CHINA,
2 School of Design, University of Leeds, Leeds LS2 9JT, UNITED KINGDOM
1. Motivation, specific objective
Colour appearance model is used to describe the perception of human colour vision, i.e., predicting the colour appearance under a very wide range of viewing conditions. Over the decades, models have been proposed by various works. The CIE recommended CIECAM02 in 2002 which is widely used as a universal colour model for scientific researches and industrial applications. Recently, CAM16 was proposed to overcome some mathematic problem in CIECAM02 and had a simpler structure. It is in the process to replace CIECAM02 in the CIE.
Simultaneous colour contrast effect and chromatic adaptation are two important visual phenomena for colour appearance model to predict. Chromatic adaptation refers to the human visual system to adapt to the overall colour and intensity of the illumination to maintain an approximately colour constancy appearance under different illuminants. Meanwhile, simultaneous colour contrast effect causes a shift of colour appearance related to the surrounding colour, and the effect is usually studied in a target-background paradigm. The latter effect has not been modelled by any colour appearance model.
In the previous study, a series psychophysical experiments were carried out to investigate the chromatic adaptation using memory colour matching method on a display. In this study, the same experimental method was used to study the simultaneous colour contrast effect, in order to separate chromatic adaptation and colour contrast. Since, the centre patches in target-background paradigm was replaced by images of 2-D objects in this study. The results were used to derive simultaneous contrast function based on CAM16 colour appearance model.
2. Methods
The experiment was conducted on a calibrated EIZO-CG243W display (size: 24.1”) in a darkened room. The adapting field on display was set to 6500K and 23 cd/m2 (L* =50). Observers sat 60 cm away from the display. The experiment was divided into two parts to investigate the hue contrast and lightness contrast respectively.
In the first part, 11 objects including six familiar objects (red apple, tomato, sky, green pepper, eggplant and yellow banana) and five cubes (pure red, pure yellow, pure green, pure blue and neutral
grey) were selected. Each object was against three backgrounds differed in size (7°, 15° and 25°)
together with no background (the whole screen is grey). Also, each size of background was set to eight colours (h ± 45, h ± 30, h ± 20 and h ± 10; where h is the CIELAB hue angle of the object). Sixty normal colour vision observers (26 males and 34 females) took part in the experiment. And the colour of each object was matched by 20 observers. After one minutes’ adaptation, observers viewed a grey image of one object with a particular size of coloured background and adjusted the chroma and hue of the object to match their memory colour using a keyboard in CIELAB space. In total, 5,940 matches were accumulated, i.e., 11 objects × 3 sizes of background × (8 coloured backgrounds + 1 no background) × 20 observers.
In the second part, five cubes from the first part were selected. Eleven luminance levels of background (L* = 0, 10, 20, 30, 40, 50, 60, 70, 80, 90 and 100) were selected taking L* =50 as the reference. Thirty-two normal colour vision observers (17 males and 15 females) took part in the experiment. The interface on display was divided into two parts, left and right. The order of left-right arrangements was randomised. One part always included a fixed cube presented on a background of L* =50, and the other part had a test cube on test background with a particular L* value. Observers adjusted the lightness of the test object via a keyboard in CIELAB L* scale to match that of the reference cube until they look visually the same. In total, 1,760 matches were accumulated, i.e., 5 cubes × 11 luminance levels × 32 observers.
CIE Session 2019 – Abstract Booklet
29
3. Results
Mean Colour Difference from the Mean (MCDM) were calculated to represent the observer variation of the result. The overall MCDM value of inter-observer variation was found to be 2.4 and 3.8 of ΔE00 units for the first and second parts respectively. The model was based on the data of cubes. By plotting the ΔJ1 vs ΔJ2, lightness difference between the target and background, and that between the test and reference background respectively, an s-shape relationship was clearly discerned for all colour centres. A hyperbolic equation was fitted and give accurate prediction to the data. As for hue contrast effect, ΔH1 vs ΔH2 data were plotted. A sine function was well fitted to consider both the size and hue of the background. Each equation modelled the contrast effect by showing a transition at the turning point of zero (representing the lightness or hue composition of the target). In its both sides, the sign of colour difference changes from negative to positive. The data were used to test CAM16 original and refined models, and the results showed that the lightness contrast function improved R from 0.12 to 0.98. Note that CAM16 already included function to consider the lightness contrast effect, but it does not work well. The results also showed that the hue contrast function improved from 0.00 to 0.84. Note that CAM16 does not consider hue contrast effect so that R was equal to zero. However, by hue contrast, the model shows a big improvement.
Both contrast functions were added to CAM16. In the computation, lightness contrast is performed first and then followed by the hue contrast. The model was verified using two data sets, i.e., one was collected in Experiment 1 including all the familiar objects and two was generated by Wang et al. using the magnitude estimation method on patches. In general, the model predicts well to the trend but the extend of the effect is very much depending on the experimental conditions, i.e., a much smaller and larger effect was found from those based on memory objects and from the Wang et al.’ s patches assessed using the magnitude estimation method, respectively. This implies that the hue contrast effect is very much dependent upon the experimental conditions.
4. Conclusions
Two functions based on CAM16 for predicting lightness and hue contrast effects were successfully developed in this study. It gave accurate prediction to the lightness visual results. For hue contrast, it was found a consistent trend. However, the function predicts too high and too low contrasts for the two independent data sets, familiar objects by memory matching and colour patches by magnitude estimation respectively. This implies that there is a clear colour contrast effect but the magnitude could be quite different due to the viewing conditions, experimental technique.
The current results are encouraging to show the contrast effect can be successfully integrated into a colour appearance model.
CIE Session 2019 – Abstract Booklet
30

OP07
MODELLING COLOUR APPEARANCE FOR UNRELATED COLOURS BASED ON CAM16
Li, C.J.1, Gao, C.1, Luo, M.R. 2* 1 University of Science and Technology Liaoning, Anshan, CHINA
2 Zhejiang University, Hangzhou, CHINA
Abstract
1. Motivation, specific objective
Unrelated colours are perceived to belong to areas seen in isolation from any other colours. A typical example of an unrelated colour is a self-luminous stimulus surrounded by a dark background, like a marine or traffic signal light viewed during a dark night.
A colour appearance model should be capable of predicting a wide range of viewing conditions including related and unrelated colours. The current CAM16 was designed for predicting related colours and is in the process to replace the current CIECAM02 to overcome some mathematical problems existed in CIECAM02. This paper describes an extension of CAM16 for predicting unrelated colour appearance. The model developed will form a strong base to develop a comprehensive colour appearance model.
Three data sets have been accumulated to study unrelated colours. Fu et al (Color Research and Application, 2011) conducted 10 experimental phases and each stimulus was reported in terms of brightness, colourfulness and hue composition. The dataset includes samples viewed with FOVs from 0.5o to 10o and luminance levels from 0.1 to 60 cd/m2. A CAM named as CAMFu was developed based on the data.
Withouck et al (Optics Express, 2015) also carried out the experiment to scale unrelated colours. About 160 samples were assessed at a 10° FOV against a black background in terms of brightness, whiteness, and hue composition. CAM15u was developed to fit the data.
Huang et al (Lighting Research Technology, 2017) also carried out experiment for assessing coloured lightings. It has 81 stimuli at 2 illuminance levels, 280 and 2400 cd/m2. Each colour was assessed using brightness, whiteness, and hue composition. Their results showed CAM15u can fit the data well except hue predictions. A correction of hue function was made.
It was found that the CAM15u and CAMFu models do not agree well. This indicates there are large discrepancy between data sets. The objective of this paper is to extend the CAM16 to predict the colour appearance attributes: brightness (Q), colourfulness (M), whiteness (W) and hue composition (H) by fitting the three data sets of unrelated colours.
2. Methods
Firstly, in the CAMFu model, CIECAM02 components were replaced by those of CAM16. Also, rod contribution was added for the prediction of colour appearance for the unrelated colours in the mesopic luminance level and below. The three data sets were used to extend the CAM16 by developing new functions to predict the visual data of brightness, colourfulness, whiteness and hue composition.
3. Results
Up to now, luminance level and visual angle were considered as input parameters to CAM16. It is encouraging that the resulting model predicts the brightness and hue compositions very well for all three data sets. Efforts have been made to improve the prediction to the colourfulness and whiteness. The model will be reported in the full paper. Its performance will also be compared with CAM15u and CAM16z models.
4. Conclusions
The paper describes the extension of CAM16 to predict the colour appearance for unrelated colours. The resulting model is derived based on available three sets of visual data for the unrelated colours,
CIE Session 2019 – Abstract Booklet
31

which include photopic and mesopioc luminance regions. Detail model and performance results will be reported in the final paper.
CIE Session 2019 – Abstract Booklet
32
OP08
APPLYING AN IMAGE COLOUR APPEARANCE MODEL FOR SIMPLE SELF-LUMINOUS SCENES
Phung, T.H.1, Leloup, F.1, Dutré, P.2, Hanselaer, P.1, 1 ESAT/Light&Lighting Laboratory, KU Leuven, Ghent, BELGIUM
2 Department of Computer Science, KU Leuven, Leuven, BELGIUM
Abstract
1. Motivation, specific objective
To predict the human perception of object colours, several colour appearance models (CAM) such as CIECAM97s and CIECAM02 have been developed. However, the application of such CAMs on self-luminous stimuli faces some challenges such as the ambiguity of the definition of the reference white and the underestimation of the Helmholtz-Kohlrausch effect. To overcome these challenges, a number of colour appearance models have been established to predict the perception of a self-luminous stimuli surrounded by a uniform and neutral background.
However, in real situations, self-luminous stimuli are perceived in a much more complex environment, hence, a model which considers complex spatial information to predict the colour appearance of self-luminous stimuli is needed. Image Colour Appearance Models have been developed to predict the colour appearances of complex images and they are applied mainly in the field of High Dynamic Range (HDR) image rendering and video reproduction. Among these models, iCAM is a model which can output, pixel by pixel, the same perceptual attributes as in traditional CAMs (brightness, hue, colourfulness, lightness, chroma and saturation). This study presents an evaluation of iCAM’s performance when applied to a simple self-luminous scene in predicting the influence of background luminance, background size, stimulus saturation and stimulus size on stimulus brightness.
2. Methods
A set of virtual relative XYZ images representing a scene of 5x3m is created as the input for the model evaluation, in which 1 pixel corresponds to 1cm in the real setup. The relative XYZ values of the real stimulus are associated to those pixels corresponding to the stimulus and the same is applied for the background.
To evaluate the background luminance impact, 6 neutral stimuli (diameter 35 cm or 10˚ in field of view (FOV)) with the luminance ranging from 50 to 900 cd/m2 and 15 neutral self-luminous backgrounds (5x3m, FOV =102˚x70˚) with the luminance ranging from 0 to 960 cd/m2 are used, resulting in 90 test scenes as input. In this experiment, two filter kernel sizes, which correspond to the coverage of the receptive field in the visual cortex V1(FOV=1˚) and the orientation half-width of neurons in the primary visual cortex (FOV =41˚), are tested.
For the evaluation of the Helmholtz-Kohlrausch effect prediction, the same image configuration is used but 30 coloured stimuli from 6 hues with a fixed luminance of 50 cd/m2 are selected as the test stimuli presented on a neutral background.
The investigation of background size effect prediction is performed on a set of fixed-size images (500x300 pixels) which has a fixed circle stimulus (diameter of 35 pixels) in the centre and a background with a size selected as 0%, 12.5%, 25%, 50%, 75% or 100% of the image size.
For the last experiment evaluating the influence of stimulus size, 40 stimuli (32 coloured, 8 neutral) with various sizes (1˚, 2˚, 3˚, 5˚, 10˚, 15˚, 20˚, 25˚ and 30˚) are presented on a neutral background of 102˚x70˚ (500x300 pixels).
3. Results
The brightness of iCAM is compared to the output of a classical CAM dedicated to simple self-luminous scenes. A good correlation has been found when the background luminance is used as variable. The large filter kernel seems to give the best performance. For unrelated stimuli, the brightness of the stimuli is, however, overestimated with the large filter kernel and underestimated with
CIE Session 2019 – Abstract Booklet
33

the small filter kernel. The prediction of the Helmholtz-Kohlrausch effect is only successful for blue and cyan stimuli, but the model fails for other coloured stimuli.
When a bright background is introduced to the scene, the brightness of the stimulus is predicted to decrease as the background size increases, but when the stimulus is seen against a dark background, the brightness increases when the background grows in size. When the stimulus increases in size, iCAM predicts the brightness to be the same.
4. Conclusions
iCAM predicts the background luminance effect and the background size effect well, with exception of unrelated stimuli (dark background). A quick investigation on the effect of filter kernel size has been performed and the choice of filter kernel size seems to be linked to the physiological mechanism of image processing of the visual system. Further study is needed to justify this argument. Furthermore, the impact of stimulus size and saturation on brightness is underestimated, the latter is because the Helmholtz-Kohlrausch is not included in the model. Hence, this calls for a new image colour appearance model dedicated to complex self-luminous scenes.
CIE Session 2019 – Abstract Booklet
34

Session PA1-3 D4 - Road Lighting
Monday, June 17, 10:40–12:00
CIE Session 2019 – Abstract Booklet
35

OP09
EVALUATING THE LIGHTING LEVELS, SURROUND RATIO AND UNIFORMITY IN AN LED LIGHTED ENVIRONMENT
Ronald B. Gibbons1, Rajaram Bhagavathula1, Matthew Palmer1, Paul Lutkevich2 1 Virginia Tech Transportation Institute, Blacksburg, Virginia, USA
2 WSP Inc, Boston, MA, USA
Abstract
1. Motivation, specific objective
With the advent of LED lighting, the optical control of the light intensity is far superior to that of traditional light sources. As such far greater specification of the lighting in the roadway is needed. As an example a maximum and a minimum uniformity in the roadway may be required to be specified for good visibility. As the new direction of the roadway lighting specification are to be science based, this project was undertaken to establish the needs of the driver as the basis of the specification.
2. Methods
This project used a controlled lighting environment to perform a visibility assessment for drivers in a variety of lighting conditions. The experimental design included the 4 different light source (3 LEDs with differing CCTs, HPS and a no lighting condition), 2 different detection objects (Pedestrians and small objects), 3 different lighting systems (Low (0.7 cd/m2), Medium (1.0 cd/m2) and High (1.5 cd/m2)), 2 driver speeds, 2 different surround ratios and 2 different uniformities. Forty-Eight participants in 2 age groups drove laps on the test road and performed a visual detection task. The detection distance under the variety of lighting conditions and were used as the metric for analysis.
3. Results
The results indicate that a surround ratio is required to maintain detection of the pedestrians along the roadway. The results also indicate that while there was no significant differences between the light sources, the 4000K light source showed the highest visibility of objects in the road. The results also indicate that uniformity does not play a significant role in the detection of the objects along the roadway. Significant interactions between the light sources, the vehicle speed and the surround requirements were also found.
The results also indicate that the current CIE requirements for Surround Ratio may require updating.
4. Conclusions
These results allow for the development of a science based requirements for lighting level, surround ratio and LED spectral selection.
CIE Session 2019 – Abstract Booklet
36

OP10
NEW WAYS TO ACHIEVE CLIMATE AIM IN ROADWAY LIGHTING
Stephan Voelker 1 Technische Universität Berlin, Berlin, GERMANY
Abstract
1. Motivation, specific objective
In many industrial country’s traditional luminaires with gas discharge technology are replaced with LED luminaires. Nearly 50 % of energy can be saved as shown by different studies. In parallel, as Gibbons and Fotios published in 2018, the illuminance level is increasing continuously during the last 50 years. If 30-years old luminaires are replaced today the luminance level according the standard for the new installation is much higher. Two questions are discussed currently: Is the energy saving based on new LED luminaires consumed by higher light levels? And are we - lighting engineers and designers - at the end of possibilities of energy savings?
2. Methods
Three possible solutions were investigated for answering these two questions.
First, the idea of adaptive zonal lighting is to define how much light is needed on which specific areas (road, parking zone, cycle and pedestrian path and facades) and at which time. Obviously, the demand of light (luminance, homogeneity, vertical illuminance) for the diverse areas is different. The analysis covers the question in which situation energy saving is possible or not. Additionally, the currently limit values for facades and windows of the CIE are discussed.
Second, using the Visibility concept promises to reduce the lighting class in Italy. The presentation will pick up this starting point and will firstly compare the results of different visibility concepts (STV, STV (adapted for Italy), VL, Revealing Power and modified RP (TUB)). The comparison is based on own field tests and simulations. In a second step, the expected potential will be discussed.
The last of the presented methods will demonstrate the demands and benefits of a marking light in street lighting. The analysis is based on an own realized demonstrator installed and working in a real street.
3. Results
Adaptive zonal light brings more safety. The benefit of energy saving is dependent on road users (number, type, frequency distribution over the time) and the road surrounding (luminance, homogeneity, glare sources, background luminance structure). The presentation will show, when it is worth to use adaptive zone light and when not.
The complexity of calculations increases dramatically if Visibility concepts should be used. Additionally, exact values of reflectance of the road are absolutely necessary. With estimated values from r-tables a Visibility concept is senseless. Also, the results show that Visibility concepts have their biggest effect on low lighting classes (M5 and M6 or P classes).
Marking light is a very interesting new lighting concept for wet roads. Normally, the light of street luminaires is reflected by the road and consequently the road looks black. More light brings more glare but does not increase visibility. Based on the light of the marking light aimed at the object the contrast can be increased very effectively. Pedestrians are visible within a range of 100 m and more compared with 10 to 20 m without marking light. Of cause, the technological effort is relatively high, but if road lighting will be a part of a smart city, marking light is a very powerful application. Because marking light works most effectively in dark surroundings, it is thinkable to use it for reducing the lighting class. In this case, marking light can contribute to achieve a very low energy consumption.
4. Conclusions
The presentation will demonstrate three different starting points for an additional reduction of energy after the replacement of gas discharge lamps through LED. The lighting design process will be much more complex, but the lighting quality can be increased while energy consumption is decreased. And
CIE Session 2019 – Abstract Booklet
37

the expected increasing of light levels in the future can be stopped when the presented methods are used in road lighting.
CIE Session 2019 – Abstract Booklet
38

OP11
WHICH METRICS ARE NEEDED TO SPECIFY GOOD LIGHTING FOR PEDESTRIANS?
Fotios, S. University of Sheffield, Sheffield, UNITED KINGDOM
Abstract
1. Background
CIE115:2010 recommends six classes of lighting for pedestrians, the P classes. The primary metric in these is horizontal illuminance, and for this there are two targets, the average and minimum horizontal illuminances. Uniformity of illuminance (minimum/average illuminance ratio) is not defined directly but is implied by the given minimum and average illuminances. The uniformity is 0.2 for every P-class which suggests a decision was made that a consistent uniformity across classes is necessary, but that may not be correct. Minimum illuminance and uniformity might require specific minima (possibly as determined by hazard detection and reassurance respectively) which could lead to variations in uniformity across the P classes. For example, recent studies have suggested a minimum horizontal illuminance of 1.0 lux for obstacle detection and (for the currently specified averages) this implies uniformities of 0.33 and 0.5 in classes P5 and P6. Both uniformity and minimum illuminance should be independently specified.
In addition to horizontal illuminance CIE115:2010 also gives minimum vertical and semi-cylindrical illuminances, suggesting that these are further requirements if facial recognition is necessary. This raises a number of questions. First, how does a designer determine whether or not facial recognition is necessary? The P classes are used where pedestrians are expected to be the dominant road user, and since that means we are likely to encounter others, then facial recognition must be a requirement in all situations where the P class is used. Second, facial recognition may not be the right focus. Faces are easily recognised even under conditions which lead to significant image distortion. What may be more appropriate is to evaluate the intentions of other people, whether they are likely to be friendly or threatening, and for this facial emotion recognition has been proposed, operationalised in experimental work as the ability to discriminate between facial expressions.
Given the need to see faces of other people, some illuminance on the vertical plane at face height would be beneficial. The broad spatial distribution typical of sodium and metal halide lamps meant it was safe to assume a satisfactory vertical plane illuminance would be available. The more recent desire to limit spatial distribution from a lantern (to reduce sky glow and light pollution) and the more precise optical control of LED lighting means that assumption is no longer reliable. It might now be necessary to target a level of illuminance on the vertical plane in additional to the horizontal. The simplest approach would be to use vertical illuminance. Why would semi-cylindrical illuminance be used instead? While a couple of articles have promoted the use of semi-cylindrical illuminance, they did not provide a fair comparison against alternative measures. Because semi-cylindrical illuminance measures illuminance on a cylindrical plane, and because faces are approximately cylindrical, there was an assumption that it would be better, but that has not been proven. Where semi-cylindrical illuminance is specified by a single value (as is done in CIE115:2010) then it offers no benefit over vertical illuminance because that single value says nothing about the relative amounts of light in different directions. Both measures are equally open to the problem that a viewing direction needs to be specified. Furthermore, while vertical illuminance can be measured with a standard photometer, measurement of semi-cylindrical illuminance would require a new instrument to be purchased.
CIE115:2010 also states that “high colour rendering contributes to a better facial recognition”. The majority of studies, and specifically those submitted to peer-review publication, have concluded that facial expression (or identity) recognition is not affected by changes in lamp spectrum. Three key visual needs of pedestrians are evaluating other people, detecting trip hazards, and the evaluation of reassurance. For the first, there does not appear to be an effect of lamp spectrum. This may not be surprising given that evaluation is a foveal task. The detection of trip hazards at mesopic levels is enhanced by using lighting of higher S/P ratio, although that varies with illuminance and may be of negligible benefit above 2.0 lux. Spatial brightness is assumed to be an acceptable proxy for reassurance. There is evidence that higher content in the short wavelength region enhances spatial
CIE Session 2019 – Abstract Booklet
39

brightness, although further work is needed to determine whether this should be characterised by S/P ratio or some combination of the s-cone and ipRGC responses.
2. Conclusions
This paper will discuss the metrics that should be used when specifying lighting for pedestrians, and hence to the work of TC4-52. To characterise the detection of trip hazards, minimum horizontal illuminance is needed. To characterise reassurance, a recent study found that uniformity better predicted the degree of reassurance than did average illuminance: taken with obstacle detection, this suggests that CIE115:2010 should specify minimum illuminance and uniformity, not average illuminance. To characterise the ability to evaluate other people vertical illuminance is recommended: it can be measured with a conventional meter and there is no evidence that semi-cylindrical illuminance is better. Regarding lamp spectrum, an increase in short wavelength radiation improves detection of peripheral hazards and reassurance. This can be characterised by S/P ratio but there are two caveats: (1) there may be better metrics than S/P ratio, and (2) there is a need to guard against targeting a high S/P ratio at the expense of radiation in the long wavelength region.
CIE Session 2019 – Abstract Booklet
40

OP12
THE INFLUENCE OF ROAD LIGHTING ON CYCLIST NUMBERS AND SAFETY
Fotios, S.1, Uttley, J.2, Bohm, A.3, Qasem, H.1 1 University of Sheffield, Sheffield, UNITED KINGDOM, 2 University of Leeds, Leeds, UNITED
KINGDOM, 3 University of Lincoln, Lincoln, UNITED KINGDOM
Abstract
1. Background
While lighting in minor roads is alleged to target cyclists as well as pedestrians, the current state of knowledge about cyclists suggest it is unlikely their needs were properly considered in the formulation of current guidelines. Cyclists have different road lighting needs to pedestrians. They carry (or should do so) vehicle-mounted lights. They tend to travel at faster speed than pedestrians, requiring earlier detection of hazards. They are co-located with motorists on the road which means they have greater need to be visible to drivers and have less opportunity to avoid road hazards. This paper describes ongoing research to establish a basis for design guidance when lighting for cyclists, giving consideration to detection ability, the confidence to cycle, and the responsibilities of road users to promote road safety. This work contributes to the CIE cyclists research working group.
2. Lighting promotes cycling after dark
To measure the influence of lighting on cyclists we counted the number of cyclists on roads of different illuminance. To capture a large sample the counting was achieved using automated counters, here including 48 counters over the years 2012 to 2015, located across a large city. An odds ratio was used to quantify the effect of darkness on cycling rates at each of the 48 counter locations. This odds ratio isolates the influence of light from other factors (weather, destination, time of year), by comparing counts in an hour of the day that changes light condition during the course of a year against counts in an hour that has the same light condition throughout the year. The odds ratio was compared against a measure of illuminance at each location, estimated from night-time aerial photography. This revealed that small increases in brightness were associated with large improvements in the number of people cycling after-dark.
3. Cyclists’ detection
The front light mounted on a cycle may serve two purposes: for the cyclist to see ahead and for the cyclist to be seen by others. While both of these purposes may be enhanced by brighter light, a selling point for cycle lamps, this brighter light can dazzle other road users and denigrate the safety benefit of lighting. Furthermore, the cycle lamp and road lighting work against each other in terms of using contrast to aid the detection of hazards. An experiment was conducted to determine how target detection was affected by variations in luminance from road lighting and/or cycle mounted lighting.
In this experiment the observer was seated on a static cycle to promote context validity. There was a single target located ahead of the observer. Road lighting was located directly over the target and was set to three illuminances (0.2, 2.0, 20 lux). Cycle mounted lighting was set to three target luminances (0.1, 0.3, 1.0 cd/m2) and was mounted at a vertical height equivalent to either the cyclist’s helmet, the handlebars, or the wheel hub.
The results revealed two interesting conclusions. (1) When cycling on a lit road, cycle lighting frequently offers no additional benefit for peripheral detection and may even make it worse. (2) The position of a cycle lamp matters. At road lighting of low illuminance, a hub-mounted lamp improved detection over a handlebar-mounted lamp. This benefit was sufficient to offset the reduction in detection found when decreasing road lighting from 2.0 lux to 0.2 lux.
4. Road user’s responsibilities
Cycle-mounted lamps increase the visibility of cyclists to other road users. While they are, therefore, recommended or obligated to use cycle lamps after dark, surveys show that this is not always done. While cyclists must take be responsible for using cycle lamps, promoting a responsibility amongst drivers to look out for cyclists may have a stronger effect on reducing collisions.
CIE Session 2019 – Abstract Booklet
41
Collisions between cyclists and motorists tend to result in greater injury for the cyclist than the motorist. Cyclists are aware of this and tend to look out for motorised vehicles. Motorists are less aware of cyclists. Experienced drivers tend to look towards the location of expected and significant hazards and for them this is collisions with other motorised vehicles: the high frequency of ‘looked but didn’t see’ collisions demonstrates this. Road lighting alone is unable to alleviate this as otherwise there would be far fewer collisions in daytime.
In many common law jurisdictions, the law regulating driver-cyclist collisions is fault-based. This means a cyclist victim of a collision will need to prove that the driver has been careless and that this carelessness caused the victim’s injuries. The amount of compensation awarded to victims is reduced if their own carelessness contributed to their injuries. Most cases of this sort that reach court (rather than being settled by insurance companies before litigation commences) involve very clear poor behaviour by drivers, such as ignoring give-way or stop signs at junctions, so it is not certain whether a ‘looked but didn’t see’ collision would be considered to be the result of driver carelessness, or whether reasonably competent, non-careless drivers would fail to see cyclists at certain points. A cyclist’s failure to make use of the legally required form of lighting would very likely result in a reduction of compensation based on the cyclist’s own carelessness.
5. Conclusions
These results suggest that higher light levels are associated with more cycling, a proxy for enhanced reassurance to cycle. They also suggest that the optimal design of road lighting is yet to be established, and that cycle-mounted lighting could be improved. Finally, the findings are a reminder that lighting is not the only answer to improving road safety: lighting must be considered alongside legal consideration which may in turn promote the responsibility of drivers to look for cyclists.
CIE Session 2019 – Abstract Booklet
42
Session PA2-1 D2 - LED-Based Standard Sources
Monday, June 17, 13:10–15:10
CIE Session 2019 – Abstract Booklet
43
OP13
LUMINOUS INTENSITY COMPARISON BASED ON NEW STANDARD LAMPS WITH LED REFERENCE SPECTRUM
Gerloff, T1., Schrader, C.1, Sperling, A.1, Pulli, T.2,9, Dönsberg, T.2, Šmid, M.3, Kliment, P.3, Pons, A.4, Ferrero, A.4, Gál, P. 5, Brida, G.6, Blattner, P.7, Stuker, F.7, and Schneider, M.8
1 PTB, Braunschweig, GERMANY, 2 Aalto University, Espoo, FINLAND, 3 ČMI, Prague, CZECH REPUBLIC, 4 CSIC, Madrid, SPAIN, 5 BFKH, Budapest, HUNGARY, 6 INRIM, Turin, ITALY, 7 METAS,
Bern-Wabern, SWITZERLAND, 8 OSRAM OS, Regensburg, GERMANY, 9 VTT, Espoo, FINLAND
Abstract
1. Motivation, specific objective
Photometric calibrations are mainly based on the use of incandescent lamps as standards for dissemination and maintenance of the SI units for luminous intensity (cd), luminous flux (lx) and the calibration of luminous responsivity of photometers. Most of the used measurement methods and reference spectra were developed long before modern solid-state lighting (SSL) products were introduced into the lighting market. In addition, phasing-out of incandescent lamps for lighting applications poses a metrological problem: all lamps measured in practice differ completely in their behavior with respect to spectral distribution, flicker and aging. The preferred substitution measurement method is therefore no longer given.
The European research project “Future photometry based on solid-state lighting products” (EMPIR PhotoLED) has investigated the fundamental requirements for photometry based on white light-emitting diode (LED) sources. The project partners have analysed many hundreds of LED spectra and derived suitable LED reference spectra for photometric calibrations. The use of photomers calibrated with the proposed reference spectrum significantly reduces the contributions of spectral errors.
In this article we would like to present the practical advantages and disadvantages of using light intensity standards based on real LEDs with very similar spectra to the hypothetical reference spectrum mentioned
2. Methods
The project partners developed new LED standard lamps that could replace the classical DC-operated tungsten filament standard lamps in photometry. The lamps have optimised optical, electrical, and thermal properties and are designed for high compatibility with existing calibration facilities. The main features are:
- Spectral distributions close to the proposed LED reference spectrum (appr 4000K)
- High reproducibility of photometric values
- Luminous intensity values similar to typical incandescent calibration lamps (appr 250 cd)
- Built in temperature controller to minimise the impact of ambient temperature on the emitted light
- Robustness
- Several functions for exact alignment of the lamp
These features enable on the one hand reliable and repeatable measurements of their photometric and colorimetric values for international comparisons between different National Metrology Institutes (NMI) on highest level. On the other hand, the easy handling and high compatibility to existing measurement equipment allows the distribution of the unit from NMIs to calibration and test laboratories with low uncertainties and ensures the traceability chain back to SI.
3. Results
Currently, the luminous intensity comparison between 7 NMIs is running. The pilot laboratory has built and characterised 8 LED standard lamps.
CIE Session 2019 – Abstract Booklet
44

In the first step, two lamps each were sent to three different NMIs. Pilot laboratory keeps two more lamps to ensure the stability of the measurement equipment. Each participant must calibrate both LED standards according to a technical protocol, including all relevant operating conditions. The results of the luminous intensity and illuminance calibrations - including the measuring uncertainty analysis - will be collected by the pilot laboratory and the artefacts will be sent to the next NMIs. At the end, the pilot laboratory re-calibrates the LEDs to ensure the integrity of the artefacts and determine the possible aging of the LEDs (round-robin-comparison).
The results of the comparison will be available end of spring 2019. Therefore, we can’t publish the results in this abstract, but by the deadline for full paper submission to conference proceedings.
However, the characterisation of the artefacts at the pilot laboratory give some preliminary results:
- The stability of the electrical operation is in the range of ±1x10⁻⁴ for lamp current and ±1x10⁻⁵ for the lamp voltage over 65 hours. The stability of the measured photocurrent is in the range of ±1x10⁻⁴ which implies the combined stability of the source’s luminous intensity, photometer, “photocurrent amplifier” (transimpedance converter) and digital voltmeter.
- After seasoning of the LEDs to reduce ageing effects we estimate changes in luminous intensity of less than 1 x 10⁻⁵ per operating hour (calculated by the relative change over 300 operating hours).
- Changes of the ambient temperature between 20°C and 30°C affect the luminous intensity level below 1.5 x 10⁻⁴.
- Changes of the relative air humidity between 25% and 80% changes the luminous intensity below 2.5 x 10⁻⁴.
4. Conclusions
The results of the luminous intensity comparison will be a reliable basis for the analysis of advantages and disadvantages of LED-based standard lamps compared to traditional incandescent standard lamps. There is no doubt that LED-based standards will greatly simplify photometric measurement in many applications in the future and still lead to smaller measurement errors. However, some features of traditional tungsten lamps are still better than LEDs since there are no ageing effects during storage and the spectral distribution is very continuous. But these benefits could only be useful for NMIs and a very limited number of calibration laboratories. Most test labs will probably have significant benefits through the use of LED reference standards.
CIE Session 2019 – Abstract Booklet
45

OP14
CONSTANT-VOLTAGE DRIVEN TEMPERATURE STABILIZED LUMINOUS FLUX LED STANDARD LAMP WITH E27 BASE
Dönsberg, T.1,2, Pulli, T.1, Klej, A.3, Poikonen, T.2, Ikonen, E.1,2 1 Metrology Research Institute, Aalto University, Espoo, FINLAND, 2 VTT Technical Research Centre
of Finland Ltd, Espoo, FINLAND, 3 Signify, Eindhoven, NETHERLANDS
Abstract
1. Motivation, specific objective
Luminous flux of lighting products coming to market, such as new LED lamps, is measured with an integrating sphere photometer or a goniophotometer. With both device types, the luminous flux responsivity of the measurement system is typically calibrated using an incandescent standard lamp. In recent years, however, the phasing out of consumer tungsten filament lamps has created a problematic situation where some luminous flux standard lamps used by laboratories are no longer available, or they have become difficult to obtain. This is challenging especially for new laboratories. There is an urgent need to develop new luminous flux standard lamp technology for photometry that can replace incandescent reference light sources in the future.
Project PhotoLED (Future photometry based on solid-state lighting products) studies alternative scientific methods for obtaining photometric scales at laboratories using new photometric standard lamps based on white LEDs. Standard lamps built using LEDs provide several advantages over incandescent lamp technology, such as robustness, longer lifetime and reduced spectral errors in measurements with V(λ)-filtered photometers. A recent study shows that calibrating photometric equipment with a white LED lamp having correlated colour temperature (CCT) close to 4100 K would reduce spectral errors in measurement of LED products and lighting to half on average, as compared to calibrating equipment with incandescent light sources.
Concerning the use as a photometric standard lamp, the otherwise promising LED-based technology has one significant drawback: the temperature dependence of luminous flux. In this study, we present the design and characterization results of a new DC-voltage-operated and temperature-stabilized luminous flux LED transfer standard lamp that overcomes the temperature dependence issues. The lamp is aimed at serving as a direct replacement of incandescent E27 base luminous flux standard lamps presently used at calibration laboratories.
2. Methods
The lamp electronics consist of a polarity protection circuit, supply voltage filters, a linear current source driver for the LEDs, a temperature controller, and a precision voltage source providing reference to the current source and the temperature controller. The electronics are fitted inside a normal retrofit LED lamp having the shape of a conventional light bulb with a bulb diameter of 61 mm and total length of 107 mm. Constant voltage is supplied to the lamp via standard E27 base. No additional wires are required.
The temperature of the LEDs in the lamp is adjusted with a heater circuitry attached to the lamp heat sink. The circuitry has been designed in such a way that the heating power is directly proportional to a control voltage provided by a PI controller. The forward voltage of the LEDs, which is known to be proportional to the junction temperature in constant current conditions, was used as the feedback signal to the PI controller. This approach guarantees that the junction temperatures of the LEDs are stabilized rather than the heatsink temperature. Both the LED drive current and the nominal operating temperature can be fine-adjusted to take into account the differences between LED specimens and other components. Key parameters, such as the time constant of the heating system, were determined, and a Simulink model of the system was utilized to optimize the PI parameters.
The performance of the temperature controller was determined by measuring the relative change of luminous flux as a function of ambient temperature. The measurements were performed with and without the temperature controller. In the measurements, the ambient temperature of the room was changed both slowly, utilizing the natural drift of ambient conditions, and rapidly with an air conditioning unit having an on/off cycle of 15 minutes.
CIE Session 2019 – Abstract Booklet
46

3. Results
In the prototype lamp, five LED chips with CCTs around 3900 K were used, based on the proposed LED reference spectrum which is under discussion in TC2-90. The total electrical power of the LEDs was around 6.5 W, while maximum heating power of the temperature controller was set to 750 mW. This configuration enables approximately 8 °C of heat sink temperature adjustment, i.e., the lamp can handle temperature changes within ±4 °C around the set nominal ambient temperature. The stabilization time of the lamp was around 30 minutes, and the LED temperature and optical output settled without significant overshoot or ringing. The lamp produces luminous flux of 840 lm.
Without temperature stabilization, the prototype lamp had on average a temperature coefficient of 0.25 %/°C in luminous flux. If the ambient temperature is changing slowly – as is the case of typical laboratory environments and especially inside integrating spheres – the use of temperature controller decreased the temperature coefficient of luminous flux to 0.01 %/°C. Even for a rapidly changing ambient temperature, the use of the temperature controller reduced the temperature dependence by a factor of five.
4. Conclusions
We have developed an LED luminous flux standard lamp with E27 base that can serve as a direct replacement of incandescent standard lamps used at calibration laboratories. The spectral power distribution of the lamp is optimized for use in LED lighting applications. The standard lamp is driven with constant voltage and it features an internal temperature controller, which keeps the LED junction temperatures constant. The design can easily be modified to drive LEDs with different electrical and optical parameters.
In typical laboratory environment, the controller reduces the temperature dependence of the lamp by more than an order of magnitude. The design effectively keeps electrical power and temperature of the LEDs constant, and, thus, guarantees stable luminous flux and spectral power distribution.
CIE Session 2019 – Abstract Booklet
47

OP15
DEFINITION OF A SPECTRAL MISMATCH INDEX FOR SPECTRAL POWER DISTRIBUTIONS
Ferrero, A.1, Kokka, A.2, Pulli, T.2, Poikonen, T.3, Schneider, T.4, Stuker, F.5, Blattner, P.5, Pons, A.1, Ikonen, E.2,3
1 CSIC, Instituto de Óptica ‘Daza de Valdés’, Madrid, SPAIN, 2 Metrology Research Institute, Aalto University, Espoo, FINLAND, 3 VTT Technical Research Centre of Finland Ltd, Espoo, FINLAND,
4 Instrument Systems GmbH, Munich, GERMANY, 5 METAS, Bern-Wabern, SWITZERLAND
Abstract
1. Motivation, specific objective
The technical committee TC 2-90 (“LED Reference spectrum for photometer calibration”) has been recently created by CIE to investigate, select and publish an LED Reference spectrum to complement the CIE Standard Illuminant A in photometric calibrations. This task additionally requires defining a spectral mismatch index to account for the match of spectral power distributions (SPDs) of real sources to the selected reference spectrum. The objective of this work is to propose such a spectral mismatch index, and to evaluate its performance using real and representative LED spectral power distributions and relative spectral responsivities of photometers.
2. Methods
The spectral mismatch index is defined to quantify how much a light source with a given SPD can be spectrally regarded as a source with the selected reference SPD. Since this SPD was selected for photometric calibrations, it is assumed that the spectral mismatch index of the SPD of a real source should be directly related with the spectral mismatch systematic error. This error is introduced when the photometric quantity is measured by a photometer calibrated with respect to a light source with the reference SPD. This error is usually accounted by the spectral mismatch correction factor (SMCF).
A quality index was proposed, derived from the expression for the SMCF, and expressed as the spectral integration of the absolute differences of the V(λ)-weighted values of the SPDs across the wavelengths in the visible range. The expression derived for the index does not require information on the spectral responsivity of the photometers to be calibrated with the test light source, unlike the SMCF. A detailed description of the derivation of this index is given in the extended work.
As ground truth, the absolute deviation of the SMCF with respect to one (|1-SMCF|) was calculated for a combination of the SPDs of 1298 LED sources and the relative spectral responsivities of 78 photometers, when calibrated with the reference SPD. The result allows the performance of the proposed index to be quantified.
3. Results
For each SPD, |1-SMCF| was averaged across all available spectral responsivities, providing 1298 average values of. The range of values was from 1.5×10⁻⁴ to 1.5×10⁻², thus covering two decades of correction factor values. These values were compared with the spectral mismatch indices calculated for each SPD, which does not consider the relative spectral responsivities. A linear correlation coefficient of 0.86 was obtained. However, when the average values of |1-SMCF| and the proposed spectral mismatch index are expressed as logarithms, this correlation coefficient increases up to 0.94.
Other indices based on non-V(λ)-weighted normalization of the SPDs were tested before selecting the proposed index above. It provided similar results than the proposed index as long as the tested SPD had no important spectral content outside the visible range, if it is the case its value was not well correlated with the required spectral correction.
The good linear correlation found between the proposed index and the average value of |1-SMCF| allows the expected spectral mismatch errors (due to using for calibrating photometers a light source with a SPD slightly different to the reference one) to be considered. This practical aspect will be discussed in more detail in the extended work.
CIE Session 2019 – Abstract Booklet
48

4. Conclusions
A spectral mismatch quality index for SPDs has been proposed and validated using 101244 values of experimental SMCFs. It allows the quality of the match of spectral power distributions (SPDs) of real sources to the selected reference spectrum to be quantified. Given the linear correlation found between this index and the average value of |1-SMCF|, it may be used to provide quality degrees to the real LED sources devoted to calibration purposes.
CIE Session 2019 – Abstract Booklet
49

OP16
LED SIMULATORS FOR THE REPRODUCTION OF THE NEW CIE STANDARD LED SOURCES
Lv, X.1, Luo, M.R.1,2 1 State Key Laboratory of Modern Optical Instrumentation, Zhejiang University, Hangzhou, CHINA
2 School of Design, University of Leeds, Leeds LS2 9JT, UNITED KINGDOM
Abstract
1. Motivation, specific objective
The LED technology is developing rapidly and has greatly changed the lightning industry. Conventional sources are gradually being replaced by LED sources. This could produce problems for the users. For example, shop owners could use LED lamps to illuminate their shops but the colour specification of their products, such as textile cloth, furniture, etc are still based on CIE D65, F11 and A illuminants. They have no idea how close their colour appearance agreeing with those of CIE illuminants. Also, the performance from different lamp manufacturers of the same specification may vary greatly. Thanks to the recent CIE publication 15.4. We now have the standard spectral power distributions (SPD) of LED sources for colour specification.
On the other hand, by following the CIE publication, many standard LED sources are required for visual inspection. Of course, one way to achieve this is to make single LED to closely match its SPD. Another way to achieve this is to produce SPD match based on spectrum tunable multi-LED systems. This work describes the performance of a CIE standard LED simulators.
2. Methods
Our earlier study (Gu and Luo, 2017) verified that a muti-channel LED illumination system, composed of 11 monochromatic LEDs, gave very similar visual colour differences as those predicted by CIE D65 and A illuminants. Similar strategy is used here. This study included four real LED light sources (3000, 4000, 5000, 6500K) which matched closely to the newly published CIE LED SPD. A JETI Specbos 1211uv tele-spectroradiometer (TSR) was used for measuring samples with an illumination: viewing geometry of 0°:45°.
The visual experiment used the same thirty metametric sample pairs which were produced by dyeing plain wool serge with acid dyes. The distribution of the 30 metametirc sample pairs in CIELAB colour space under different CIE illuminants showed a large coverage of the colour gamut. The metamers were designed to have a close visual match under D65 and a very large mismatch under CIE illuminant A.
All real LED light sources had a close match to the SPD of CIE LED. The root mean square values of SPD were 0.077, 0.060, 0.074 and 0.077 (0-100 scale), respectively, indicating a quite good match to those of CIE LED standards. The differences in colour rendering index (Ra), deviation in uv
chromaticity relative to the standard illuminant (Duv), Illuminance and CCT were within ±2, ±0.001, ±50Lux and ±50K, respectively. The CIEDE2000 colour differences of sample pairs were calculated between the real light sources and the CIE standard LED for these 30 metamers. The results showed very small STRESS values, indicating that the two sets of illuminants agreed very well. The STRESS is a statistical measure widely used in colour research field to indicate the disagreement between two sets of data. A value of zero means a perfect agreement between them and it is in a scale of 0-100.
Twenty observers aged between 21 and 26 with an average age of 23 participated the psychophysical experiment. They viewed samples against a gray-background in a lighting box and the viewing geometry was controlled at 0°:45°. The visual experiment was done to assess colour difference using the widely used gray scale method which is based on ISO 105 used a 9-grade scale from 1 to 5 within an interval of 0.5, in which Grade 5 and Grade 1 exhibits zero and very large visual colour differences, respectively. During the experiment, observers were encouraged to give intermediate ratings. Totally, the experiment took about 1 h for each observer and 2,400 assessments were achieved, that is, 30
pairs 4 simulators 20 observers.
CIE Session 2019 – Abstract Booklet
50

3. Results
The raw experimental data reported was recorded as a rating of 1 to 5. The colour difference of each grade against Grade 5 was calculated in terms of CIELAB unit. A polynomial equation was fitted to predict CIELAB colour difference from Grade. The equation was used to transform each observer’s
raw data to visual difference (V), in CIELAB unit.
The results were then used to evaluate the quality of simulators. The STRESS values were calculated
between the visual colour differences ( V ) and the predicted CIEDE2000 colour differences ( E ) of
the real and CIE LED illuminants. The results are 22, 27, 30, 37and 23, 30, 32, 45 for the 3000, 4000, 5000, 6500K of real and CIE LED illuminants, respectively. It can be seen that the real LED light sources had smaller STRESS value than those of the newly published CIE LEDs. Thus, the real illuminants performed slightly better than the corresponding CIE standard illuminants. The differences were very small, indicating the multiple LED simulator can achieve satisfactory simulation to the standard LED illuminant and can be confidently used for commercial evaluation.
However, by replacing the CIE LED to the conventional CIE illuminants, the latter all poorly predicted the visual results. This indicates that the new CIE LED sources have quite different property as the conventional CIE standard sources. This strongly suggests that to present objects under LED sources, colour specification must use those new CIE LED illuminants.
Finally, the performance of three colour difference formulae, CIEDE2000, CIELAB and CAM02-UCS were compared to predict colour differences of different light sources in terms of STRESS values. The results clearly showed that CIEDE2000 performed the best, followed by CAM02-UCS slightly worse and CIELAB performs the worst. This confirms the results from many other studies.
4. Conclusions
An experiment was conducted to test the performance of a spectrum tunable LED system to simulate the newly published CIE LED standard sources. It matches all the colour quality criteria such as CCT, Duv, Ra, Lux. The visual experiments were also conducted under those real simulated sources. The results were used to verify the good agreement between the real and new CIE LED standard illuminants. However, using the new data to test the conventional standard CIE illuminants, they predicted badly to the visual results. This implies for applying LED sources, the newly published CIE LED illuminants should be used for colour specification.
CIE Session 2019 – Abstract Booklet
51

OP17
HIGH-POWER STANDARD LEDS WITH SUPERIOR LONG-TERM STABILITY
Zong, Y.1, Zhao, W.2, Miller, C.C.1 1 National Institute of Standards and Technology, Gaithersburg, Maryland, USA
2 National Institute of Metrology, Beijing, CHINA
Abstract
Conventional incandescent standard light sources for detector and instrument calibrations (e.g., CIE Standard Illuminant A lamps used for photometer calibrations) are mostly discontinued by the manufacturers due to the revolution of the lighting technology. To address this issue and also to take advantages of the new solid-state lighting technology (e.g., extremely low aging rate), CIE established a new technique committee TC 2-90 for developing new LED reference spectrum for photometer calibrations. In addition, standard LEDs are being developed by LED manufacturers, national metrology labs, and instrument manufacturers. Most of these standard LEDs use a typical LED package design. They are temperature-controlled and have outstanding short stabilities (days). However, on-shelf long-term stability of the existing standard LEDs is not well known and is typically not specified by the manufacturers, which limits their uses only as short-term working standards.
We are developing a new type of standard LEDs for improving long-term stability. A group of total 30 white and colour standard LEDs were designed and built. The standard LED uses a single-chip, 50 W high power LED. The light-emitting surface is flat and is covered simply by a glass window; the same form factor as that of a photodiode. The LED chip is mounted on a temperature-controlled mount (TCM) through a metal core printed circuit board. The LED’s thermal resistance from the junction to the TCM cold plate is very low and the standard LED is set to operated at the room temperature (25
C), which minimizes the influence from ambient air temperature and air movement. The 50 W standard LEDs is operated only at 3 W level, which virtually eliminates the aging effect.
The standard LEDs were seasoned for more than one year and then tested for long-term stability over a period of time of more than three years. The results show that on-shelf long-term stability is on the level of 0.1 % over the three-year period, which is superior for a standard LED. The details of design and the test results of the standard LEDs will be presented.
CIE Session 2019 – Abstract Booklet
52

OP18
SPECTRAL DISTRIBUTION OF TYPICAL WHITE LED AS A FUNCTION OF CCT
Yang, T.H.1, Hu, T.G.1, Yu, Y.W.2, Sun, C.C.1 1 Department of Optics and Photonics, National Central University, Chungli 32001, CHINESE TAIPEI
2 Department of Photonics, Feng Chia University, Taichung 40724, CHINESE TAIPEI
Abstract
1. Motivation, specific objective
Light-emitting diodes (LEDs) have already become the most important light source among all the existing ones. More and more applications of LEDs are including indoor lighting, outdoor lighting, transportation lighting, etc. Besides, the standard light sources for the measurement and the calibration of the radiometry and the photometry are also of great necessity to apply with the LED light sources. Therefore, the optic properties of the LEDs are very essential subject for the applications. Especially, how to standardize the spectrum of the LEDs must be the most urgent subject for the time being.
Generally, the pc-WLED contains a yellow (or green with red) phosphor layer covering a blue die to emit white light in wide CCT (correlated colour temperature) range with acceptable CRI (colour rendering index). However, the composition of the LED spectra is complicated and not well clarified yet so far. For the most common LED light sources, it consists of a blue GaN LED die and the yellow YAG phosphor. In principle, there are at least two different essential mechanisms for forming the white light emission spectra. One mechanism is the generation-recombination of the electron-hole pairs in the blue GaN LED die. The emission spectrum of the blue GaN LED can be completely determined based on the fundamental semiconductor theory. However, the theoretical emission spectrum based on the semiconductor theory is still seriously deviated away from the practical measured spectrum. Fortunately, the real LED spectra have been successfully modelled by a simple mathematic function with four parameters empirically. The other mechanism is the excitation-emission effect in the phosphors for wavelength conversion. Indeed, the quantum single configurational coordinate model (QSCCM) proposes the Gaussian spectral function for the emission spectrum from any two possible transition bands. Meanwhile, it still happens the re-absorption and the re-emission phenomena. Till nowadays, the complete emission spectrum of a phosphor is found to be the combination of several Gaussian spectral functions according to QSCCM. Under such a circumstance, we actually already have enough information about LED illuminants for standardization. A calculating procedure similar to the one for the standard CIE Daylight Illuminants, therefore, is able to settle down with aid of obtaining the optimal LED spectra under various CCTs.
2. Methods
To find the optimal LED spectra, we take two steps of analysis to approach the goal. The first step is to find an empirical function to lineate the LED emission spectrum with few characteristic parameters. As compared with a large amount of real LED spectra, the empirical spectra function is then confirmed. According to the previous reports, the candidates of the spectral functions for the blue LED dies are the sum of two Gaussian functions with 6 characteristic parameters and the asymmetric Gaussian function with 4 characteristic parameters. For the sake of the convenience and the accuracy both, we prefer to the latter one with lesser parameters but still providing with enough accuracy.
Besides, the phosphor emission spectrum follows the QSCCM suggestion. Furthermore, the suggested Gaussian spectral function for the phosphors is in term of the frequency rather than the wavelength of the light. We convert the QSCCM Gaussian spectral function into the alternative function in term of the wavelength instead. Fortunately, it is found that the re-absorption and the re-emission phenomena obey the behaviour of the alternative spectral function predicting.
In such a way, we now have a general spectral function with 10 characteristic parameters to precisely describe the full emission spectrum of a LED light source with very high accuracy. Among them, there are 3 characteristic parameters for the centre wavelengths, 4 characteristic parameters for the spectral bandwidths, and 3 characteristic parameters for the relative radiometric strengths. By appropriate
CIE Session 2019 – Abstract Booklet
53
tuning the 10 characteristic parameters, any one practically measured LED spectrum can be approached with high accuracy.
The second step is the optimization process. With the pre-determined CCT and the normalization to the light power, the 3 characteristic parameters for the relative radiometric strengths are thus determined, too. The rest 7 characteristic parameters are further approached by an optimization algorithm calculation such that the merit function reach its extremes. Then, the optimal LED spectrum can be obtained. The details of the merit function can depend on the applications. For example, the maximal CRI, the highest optic efficiency and so on. Here, we take the maximal CRI as the goal of all throughout optimization.
3. Results
After the comparison with more than 1,200 various LED spectra collected from different manufacturers, our spectral model for the white LED light sources works very well. Furthermore, it does not only work very well for the blue LED with yellow phosphor, but also even for the RGB LED combo, the UV LED with RGB phosphors, the B/R LEDs with green phosphor, etc.
For simplicity, we optimize the case of the blue LED die with yellow phosphors only. By the optimization evaluation, the corresponding characteristic parameters are found and the optimal LED spectra for the highest CRI of CCT from 2,500K to 25,000K are thus obtained.
Furthermore, the relations among all the characteristic parameters for the optimal LED spectra and the corresponding CCT are also presented. Finally, a standard process is successfully constructed for calculating the white LED spectrum with maximal CRI under any specific CCT, which is very similar to the CIE Daylight Illuminant calculation.
4. Conclusions
In this work, we have successfully obtained the optimal LED spectra for the highest CRI of various CCT. By developing an empirical spectral function to describe the LED spectra with high accuracy and optimizing the empirical spectral function with a specified merit function, the optimal LED spectrum can be easily evaluated. Actually, a series of the optimal LED spectra for the highest CRI of various CCTs have also been presented. Similar to the calculation of CIE Daylight Illuminants, we then conclude a calculation procedure for the spectral distribution of typical white LED as a function of any given CCT. It can easily apply for the standard LED sources for the measurement and the calibration of the radiometry and of the photometry.
CIE Session 2019 – Abstract Booklet
54

Session PA2-2 D6 - Photobiology
Monday, June 17, 13:10–15:10
CIE Session 2019 – Abstract Booklet
55
OP19
LIGHT AND BLUE-LIGHT EXPOSURES OF DAY WORKERS IN SUMMER AND WINTER
Udovicic, L.1, Price, L.L.A.2, Khazova, M.2 1 Federal Institute for Occupational Safety and Health (BAuA), Dortmund, GERMANY,
2 Public Health England (PHE), Centre for Radiation Chemical and Environmental Hazards, Harwell, Didcot, Oxfordshire, UNITED KINGDOM
Abstract
1. Motivation, specific objective
Incandescent light bulbs for domestic, office and industrial general lighting do not meet new energy efficiency requirements and are gradually being phased out. Newer artificial light sources such as compact fluorescent lights (CFLs) or light emitting diodes (LEDs) provide more energy efficient alternatives. A question that is often raised is whether exposure to light from modern artificial sources could lead to adverse health outcomes. There is, for instance, a concern that LEDs with high spectral levels of blue light may cause long-term damage to the retina of the human eye. Lending support to this concern are mechanistic studies reporting retinal damage in animal models exposed to high illuminances (e.g. 6000 lx up to 30 klx).
In any given 24-hour period, day workers are exposed to both natural light and light from a range of artificial sources. The objective of this paper is to examine the level of light exposure in everyday working lives: average indoor and outdoor illuminance and blue-light irradiance of day working hospital employees will be presented.
2. Methods
Light exposures were measured by day working nurses in Klinikum Dortmund and Kings College Hospital in London (each 10 subjects) for a week in winter (January 2015) and summer (June 2015). 24-hour light exposure data were collected with a commercial actimetry research device (Actiwatch Spectrum, “AWS”, Philips Respironics) worn as a badge on the upper chest on the outer layer of clothing. When in bed to sleep, the AWS devices were placed on the bed-side table in order to measure bedroom light levels.
The AWS device includes three sensors (silicon photodiodes with distinct optical filters). The sensors detect irradiance in the red, green and blue regions of the visible spectrum, between 400 nm and 700 nm, and the AWS calculates illuminance using these measurements. The AWS devices were characterized and calibrated in optical laboratories of the Federal Institute for Occupational Safety and Health and Public Health England.
As an actimetry device, an AWS also contains accelerometers to detect activity. The activity data were used to identify periods when the device was not being worn and these periods were excluded on the presumption that the personal exposure to light was not being measured.
Subjects provided written consent, and the data were stored and processed anonymously. Participants completed a lighting questionnaire giving information on the light sources in the workplace and at home. Sleep and activity timing diaries were completed including data on time spent indoors (at the workplace, at home) and outdoors (walking, doing sports).
3. Results
Exposure data on 24-hour illuminance and blue-light irradiance were collected simultaneously in Dortmund and London. The two population centres have the same latitude (51.5°) and the longitude difference is 7.5°; on average sunrises and sunsets take place half-an-hour earlier in Dortmund in Coordinated Universal Time, but half-an-hour later using local clocks.
The average levels of illuminance and blue-light irradiance will be presented, to show the effects of
selected times of day (morning, midday, afternoon, evening, night),
season (winter, summer),
CIE Session 2019 – Abstract Booklet
56

being indoors / outdoors, and
being at workplace / at home.
In general, the indoor levels of illuminance and blue-light irradiance measured close to the eyes, including light due to artificial sources, are significantly lower compared with the light levels applied in the animal experiments mentioned earlier. The same indoor levels of light exposure are also significantly lower compared with the natural daylight outdoors. In addition, luminous exposures in lx∙h and J/m2 will be presented.
4. Conclusions
Average levels of indoor illuminance and blue-light irradiance from artificial light sources are much lower than the light levels used in some recently published in vivo and in vitro animal studies. 24-hour exposures (excluding sleep) to indoor illuminance and blue-light irradiance from artificial light sources are also much lower than relatively short exposures to natural daylight outdoor levels. Therefore, we conclude that these animal studies do not support the hypothesis that blue light from modern artificial light sources, such as LEDs, used in in everyday life can cause ocular damage.
Indeed, modern general purpose lighting cannot be considered more blue than many established lighting sources, or else the colour of the light emitted would not be visually acceptable. In future, the emissions from sources using ultra-violet or violet LEDs below 440 nm where visual effects on colour become weaker may warrant further studies, but this study adds further weight against concerns of retinal damage from everyday lighting incorporating blue LEDs.
It is worth noting that the AWS does not measure radiance, although modern LED lighting radiance can often be much lower than direct sunlight and incandescent light bulbs. The methodology applied is not intended to be a substitute for the optical radiation hazard assessments required by EU legislation concerning the protection of workers from adverse health effects.
CIE Session 2019 – Abstract Booklet
57
OP20
IS LIGHT WITH LACK OF RED SPECTRAL COMPONENTS A RISK FACTOR FOR AGE-RELATED MACULAR DEGENERATION (AMD)?
Schierz, C.1 1 Technische Universität Ilmenau - Lighting Engineering Group, Ilmenau, GERMANY
Abstract
1. Motivation, specific objective
It is well-known that intense blue spectral components of light pose a short-term risk to the retina. For this photochemically-induced retinal injury, called Blue Light Hazard (BLH), spectral weighting functions and applicable limit values are established. However, scientific evidence about blue light as a long-term risk factor promoting Age-related Macular Degeneration (AMD) is less descriptive. AMD is a disease caused by damage in the macula, in particular in the pigment epithelium, the receptors, and Bruch’s membrane. The main risk factors for AMD are smoking and age. Some scientific papers indicate that a spectral weighting function seems to be similar to the function used for BLH. However, there are scientific papers from highly rated journals reporting good therapeutic results in patients with AMD by the use of a therapy called photobiomodulation. This indicates that red and near infrared (NIR) spectral components could be beneficial by counteracting blue light induced AMD. This is not a thermal effect, but can be explained by molecular mechanisms in the pigment epithelium cells.
For the practice of lighting this could mean that the use of e.g. LEDs with a peak in the blue spectral part and a lack of red components due to the use of luminous intensity based energy measures like the efficacy in lm/W could be detrimental to health. Also IR and partly red absorbing windows have to be questioned.
2. Methods
From a literature review the current status of knowledge about blue spectral components as risk factor and about red spectral components as protective factor has been assembled. Preliminary calculations of the relative impact on AMD for different light source spectra (e.g. LEDs, fluorescent lamps, daylight, daylight from windows) are performed by means of an “AMD-risk index”, which balances the blue-risk and red-protective factors against each other.
3. Results
In the presentation the following topics will be addressed:
- Overview of the state of knowledge about the mechanisms connecting light to AMD - First reports showing good therapeutic results by using red and NIR radiation - Preliminary proposal of possible spectral weighting functions for risk and protective light effects - Discussion of the implications by using light spectra lacking red and NIR parts
4. Conclusions
If the presented effects of light on AMD will gain more scientific evidence in the future, it has to be discussed if the use of energy optimising measures based on the luminous efficiency function (e.g. lm/W) should be superseded by measures with more comprehensive efficiency functions.
CIE Session 2019 – Abstract Booklet
58

OP21
INFLUENCE ON HUMAN SLEEP OF DYNAMIC LIGHTING
Chen, C.Y.1, Hsieh, B.H.2, Huang, B.R.2, Tsai, T.L.1, Chen, H.W.1 1 Graduate Institute of Colour & Illumination Technology, National Taiwan University of Science and Technology, Taipei, CHINESE TAIPEI, 2 Graduate Institute of Electro-Optical Engineering, National
Taiwan University of Science and Technology, Taipei, CHINESE TAIPEI
Abstract
The effects of light on circadian rhythms and sleep are influenced by phototransduction of rod cells, cone cells, and photosensitive retinal ganglion cells that contain melanopsin. In this study, we investigated the sleep quality of subjects in dynamic colour temperature lighting environments and dark environments. Eighteen men and 12 women (24 ± 2 years old) participated in the study. It was shown that in the dynamic colour temperature lighting environment the subjects had significantly improved β/α and θ/TP brainwaves and subjective-assessment questionnaire reveals that the use of the dynamic colour temperature lighting could have the subjects perceive better quality of sleep. Thus, quality of sleep was improved in a dynamic colour temperature environment than in a dark environment.
1. Motivation, specific objective
Among the research Strategies of CIE 2016, dynamic light was an important focus of research. In recent years, research has not been limited to static light sources. Numerous studies have reported the effects of dynamic light on physiology. Studies have investigated the use of dynamic light to enhance learning and attention in primary school students. In the office setting, employees were more satisfied with the dynamic lighting than general lighting but there was no significant difference in subjective indicators such as alertness and visual fatigue. Currently, dynamic lighting sources are most commonly used in classrooms and offices but less frequently used for night sleep. Since dynamic light has an impact on physiology, could it be equally effective in improving sleep?.
2. Methods
Lighting Equipment
The experimental light source used in this study was a LED Cube illumination system dynamic colour temperature light source. The fixed illumination was 5 lux (illumination on the eyelid), and the colour temperature was 1900 K and 3800 K. In the dynamic colour temperature lighting group, the colour temperatures were alternated every 30 seconds. In the other group, subjects slept in a dark room. Each subject received the two treatments on separate days.
Thirty healthy subjects (18 men (23.5 ± 2 years old) and 12 women (24 ± 2 years old) participated in this study. The subjects adapted to the lighting conditions for 5 minutes before sleeping for an hour. Their sleep was monitored by EEG monitoring for the entire duration.
This study was approved by the National Taiwan University Research Ethics Center (case number: 201807EM029). All subjects consented to participate in the experiment.
Experimental Environment and Condition
The experiment was carried out in a dark room at a room temperature of 26 ± 1°C. The experiment period was from 6 pm to 11 pm. The light source was positioned 1 meter from the subject’s head. The subjects were required to have normal sleep schedules and were prohibited from consuming any substances that contained caffeine or alcohol 8 hours before the experiment. The subjects were required to have slept for 8 hours the night before the experiment and no visual dysfunction or cardiovascular diseases.
Analysis Method
Six points were selected to measure brain waves. Measurement electrodes were attached at O1, O2, C3, C4, T7, and T8. Sleep can be divided into two major phases: non-rapid eye movement (NREM) and rapid eye movement (REM). NREM can be divided into four stages of sleep. Stage one is somnolence, stage 2 is when light sleep occurs, and stages three and four are considered stages of
CIE Session 2019 – Abstract Booklet
59

deep sleep. The different stages of sleep can be distinguished through the different EEG readings. During light sleep, the number of θ (4–8 HZ) waves will increase. During analysis, different fractions such as β/α and θ/TP are used instead of simply analyzing the changes in waves to account for individual differences. The values present a clearer picture of the subjects’ physiological state, and therefore it is possible to determine whether the subject enters sleep more quickly or feels more relaxed.
A self-evaluation questionnaire was used to evaluate the psychological feelings of the subjects after participating in the experiment. The questions mainly evaluated the subject’s opinion on comfort, light brightness, sleep quality, and energy levels after waking up. The possible score for each question was between 1 and 6 points. The higher the given score, the higher the subject rated each parameter.
Statistical Method
In this study, statistical analysis of brain wave data was performed using SigmaStat 3.5 (Systat Software, Inc, San Jose, CA). Statistical significance was evaluated using a paired-t test (p < 0.05). Data from the two groups were compared to determine if there were statistical differences after the subjects slept in the two lighting conditions for 1 hour.
3. Results
In the dynamic colour temperature light source environment, there were significant differences in β/α brain waves in O1 and O2 of the occipital lobe and C3 of the central sulcus. There were also significant differences in the normalized θ wave in O1 and O2 and C3 and C4. It is evident from the increase in value that the brain could relax to a greater degree in the dynamic colour temperature lighting environment than in the dark environment.
The results of the questionnaire shows that the subjects generally experienced more comfortable, higher quality sleep and increased energy levels after sleeping in a dynamic colour temperature environment compared to sleeping in a dark environment.
4. Conclusions
Dynamic lighting is a main focus of future lighting development. Compared with static light sources, dynamic lighting has more significant effects in stimulating the body. Silent environments are not necessarily optimal for sleep. Since music at certain frequencies can promote sleep; we believe that dynamic lighting could act similarly. Compared to a dark environment, dynamic colour temperature lighting could induce and stimulate the secretion of melatonin and thus regulate the circadian rhythm and improve sleep quality.
CIE Session 2019 – Abstract Booklet
60
OP22
RETINAL EXPOSURE ASSESSMENT - HORIZONTAL OR VERTICAL ALPHA IRRADIANCE OR ILLUMINANCE?
David H. Sliney 1 Johns Hopkins University School of Public Health, Baltimore, USA
Abstract
1. Motivation, specific objective
There have been a number of methods to measure ambient illumination for the purpose of evaluating both visual and non-visual effects in a given environment. With the discovery of the photosensitive ganglion cells, much of the motivation has been with regard to the most relevant spectral functions, and this was also the focus of the recently published CIE Standard, S-026:2018, “System for Metrology of Optical Radiation for ipRGC-Influenced Responses to Light.” However, S-026 also notes that the field-of-view of the subject observer significantly affects the actual retinal exposure. It is therefore important to review the spatial aspects of retinal exposure.
2. Methods
It is first useful to review the traditional photometric quantities that most relate to retinal light exposure. Vision scientists most generally use the key externally measureable quantity – the luminance (cd·m-2), because retinal illumination is directly related to luminance. However, luminance alone is not the only variable that influences retinal illumination. Past measures of actual retinal exposure in vision science have generally employed the unit of the Troland (Td), which adds the critical factor of pupil size to the information available as luminance, so the retinal illumination in Td is the product of the pupillary area Ap in mm2 and the Luminance Lv. To some purists the Td is too much a strange mixture of units and not SI; nonetheless, it cannot be confused when properly applied, and basic research of afterimages and other retinal effects has used this quantity in practice (even though dimensionally it could be reduced to candelas). In optical radiation safety, radiometric quantities are almost always used, and radiance Le in W·m-2·sr-1 holds sway in photobiological standards of lamp safety (e.g., S-009:2002). In ophthalmic-instrument safety standards the limits are expressed directly as irradiance at the retina and were calculated for a standard pupil size to correspond to applicable, equivalent, lamp-safety radiance limits (with some added considerations). Thus, there are a number of methods to quantify both instantaneous retinal irradiance and time-averaged retinal exposure. If a spectral weighting function is applied, much more information is included. The α-weighted functions in S-026, denoted as “α-opic irradiance,” “α-opic radiance,” “α-opic radiant flux” are examples. The α-opic is generic to relate to one of the five photoreceptors (such as a cone or melanopic). But in illuminating engineering, in the absence of spectral and luminance measurements, the quantities, vertical or horizontal illuminance have been used, engendering a debate of which is more relevant to describe effects for health and well being. Measurements of pupil size, vertical field-of-view (FOV) and spectral content were made in several indoor and outdoor settings to demonstrate the appropriateness of vertical or horizontal illuminance/irradiance as surrogates for estimating relative retinal exposures. Measurements with a hooded detector to simulate the eye’s FOV were also made.
3. Results
Although both horizontal and vertical illuminance/irradiance have been proposed and employed as metrics for circadian and health studies, they can be misleading if either spectral content is ignored or if FOV is ignored. For an individual retinal exposure the pupil size is ignored in these measures and this varied significantly in the same luminance setting. However, the importance of spatial variation in one’s environmental light field was clearly shown to affect the retinal level. Good lighting practice to reduce glare prescribes lower luminance below ~45o; thus, a vertical illuminance/irradiance collected much of the overhead luminaire contribution that did not directly reach the retina. On the other hand a horizontal measure did not adequately measure the light reflected from vertical surfaces. Does this mean that neither measure should be used?
CIE Session 2019 – Abstract Booklet
61

4. Conclusions
The field-of-view (FOV) cannot be neglected in quantifying the spectral variations and retinal irradiance of light stimuli during laboratory and field studies. Irradiance/illuminance meters with a hood to simulate the FOV in that environment and directed at standard directions of gaze provided superior spatial information to asses health and circadian benefits.
CIE Session 2019 – Abstract Booklet
62

OP23
INNOVATIVE APPROACHES TO COMBAT HEALTHCARE-ASSOCATED INFECTIONS USING STANDARDS DEVELOPED THROUGH INDUSTRY AND U.S. FEDERAL
COLLABORATION
Miller, C.C.1, Larason, T.C.1, Obeng, Y. 1, Postek, M.T.1, Poster, D.L.1, Cowen, T.E.2 1 National Institute of Standards and Technology, Gaithersburg, MD, USA
2 Vision Based Consulting, Bethesda, Maryland, USA
Abstract
Motivation, specific objective
Nation-wide, healthcare-associated infections (HAIs) infect one in every 25 hospital patients, account for more than 99,000 deaths and increase medical costs by more than $35B, each year. Ultraviolet-C (UV-C) antimicrobial devices are shown to reduce the incidence of many of these HAIs by 35% or more, through the deactivation of the pathogen’s DNA chain by irradiating it with a wavelength of ~254 nm. The irradiation effectively prevents the cells from multiplying. Clinical case reductions of 30-70% in Clostridium difficile (C. diff.) have been reported with similar results for methicillin-resistant Staphylococcus aureus (MRSA), and others. The methodology works, but, the adoption of UV-C technology by the healthcare industry has been sporadic. This is largely due to the lack of definitive knowledge and uniform performance standards or measures for efficacy to help healthcare managers make informed, credible investment decisions. The levelling of the playing field with scientifically certifiable data of the efficacy of antimicrobial devices will enhance acceptance by the healthcare industry and public, at large, as well as facilitate science-based decision making.
The National Institute of Standards and Technology has engaged with the International Ultra Violet Association (IUVA) and its member companies to explore ways to reduce these inharmonious market conditions. Collaborative efforts are underway to develop science-based answers to the healthcare industry’s questions surrounding standards and measures of device disinfection efficacy, as well as reliability, operations and durability. These issues were recently discussed at the IUVA 2018 America’s Conference in Redondo Beach, CA in several panel sessions. An output of the sessions was the formation of a formal IUVA Working Group for the Development of Antimicrobial Standards and Initiatives for the Healthcare Industry. The goal is to provide global guidance, with specific programs and deliverables, on the use of UV technologies and standards to combat HAIs and to further the stated aims of the IUVA on its outreach to the healthcare industry. This presentation will review the strong collaboration between NIST and its industry partners pursuing standards, guidelines and guidance documents related to healthcare applications that include standard methods for validating performance of UV devices and test guidelines for efficacy measurements. In addition, an overview of the issues, problems, and a summary of the needs confronting future growth and success of the UV industry in the Nation’s healthcare application space will be provided.
Several documentary standards were proposed including a test method for the measurement of radiant flux of low pressure (LP) mercury tubes. This document has a scope describing the procedures to determine the total radiant flux (W) and/or the distribution of radiant intensity (W/sr) at a specific wavelength of 254 nm under standard electrical and operating conditions. Most of this work would leverage the process written by Lawal, et al - ‘Method for the Measurement of the Output of Monochromatic (254 nm) Low-Pressure UV Lamps’ published in the IUVA News. Standard electrical and operating conditions include the tolerances on voltage waveforms, voltage regulation, ballast conditions, ambient temperature, and allowable air flow. Additional conditions are controlled including lamp orientation, seasoning, preburning, and stabilization time to increase the reproducibility among laboratories. The calibration and measurement procedures are described for using an integrating sphere system, a goniometer system, or using the Keitz formula. The difference between using a broadband measurement versus a spectroradiometer system are presented.
The second proposed standard to develop is a test method for the measurement of radiant flux of medium pressure mercury tubes and xenon tubes. The document scope describes procedures to determine the total spectral radiant flux (W/nm) and/or the distribution of radiant intensity (W/sr) over a wavelength range of 200 to 400 nm under standard electrical and operating conditions. Many of the
CIE Session 2019 – Abstract Booklet
63
conditions and the guidance presented in the LP mercury tubes document would be similar. More emphasis would be placed on calibrating the spectroradiometer within the measurement system.
The third document is a test method for the measurement of radiant flux of LED packages. The document scope describes procedures to determine the total spectral radiant flux (W/nm) and/or the distribution of radiant intensity (W/sr) over a wavelength range of 200 to 400 nm under standard electrical and operating conditions. The electrical and thermal management of the LED in a standard condition is significantly different than mercury tubes.
The first three proposed standards have dealt with the measurements of components that are installed into fixtures. The next two documents would cover a test method for the measurement of radiant intensity distribution (W/sr) of a UVC luminaire and a test method for the measurement of irradiance (W/m2) of a UVC luminaire at a specific distance. The data collected using these two methods would allow an application to be modelled.
While this is not a complete list of documentary standards for UV antimicrobial devices used to attack HAI and MDRO pathogens in healthcare facilities, which is mission of the Healthcare/UV Working Group formed by the IUVA, an additional proposed standard is the recommended practice for implementing surface UVC disinfection. The recommended practice would provide guidelines on the required amount of UVC light to accomplish inactivation of different pathogens. The practice may also describe modelling techniques such as establishing a scenario and then by using ray tracing software, the data collected for the UVC luminaire, and data UVC reflectance data to determine if the dose is large enough to accomplish the required task.
Additional information on NIST laboratory activities will be presented on the infrastructural support development to support the proposed documentary standards.
CIE Session 2019 – Abstract Booklet
64

OP24
NOCTURNAL MELATONIN SUPPRESSION BY ADOLESCENTS AND ADULTS FOR DIFFERENT LEVELS, SPECTRA, AND DURATIONS OF LIGHT EXPOSURE
Figueiro, M.G.1, Nagare, R.1, Rea, M.S.1 1 Lighting Research Center, Rensselaer Polytechnic Institute, Troy, NY, USA
Abstract
1. Motivation, specific objective
The human circadian system is primarily regulated by the 24-h light–dark cycle incident on the retina, and nocturnal melatonin suppression is a primary outcome measure for characterizing the biological clock’s response to those light exposures. A limited amount of data related to the combined effects of light level, spectrum, and exposure duration on nocturnal melatonin suppression has impeded the development of circadian-effective lighting recommendations and light-treatment methods.
Based in part upon the published light-induced nocturnal melatonin suppression data, a model of human circadian phototransduction was proposed. Importantly, the model was constrained by fundamental knowledge of retinal neurophysiology and neuroanatomy. Operationally, the model provides a framework for depicting how the classical photoreceptors (i.e., rods and cones) provide input to the intrinsically photosensitive retinal ganglion cells (ipRGCs), which are the main conduit of electrical signals from the retinae to the master clock in the suprachiasmatic nuclei of the anterior hypothalamus, where the biological clock is located. Mathematically, for any light source, the model converts the spectral irradiance at the cornea into units of circadian light (CLA), reflecting the spectral sensitivity of the circadian system, and then transforms those values into circadian stimulus (CS) values reflecting the absolute sensitivity of the circadian system. Thus, CS is a measure of the effectiveness of the retinal light stimulus for the human circadian system from threshold (CS < 0.10) to saturation (CS of approximately 0.70).
The study’s primary goal was to measure nocturnal melatonin suppression for wide ranges of light levels, white light spectra, and light exposure durations. The study’s second purpose was to examine whether differences existed between adolescents’ and adults’ sensitivity to these same lighting characteristics. The third purpose was to provide an estimate of the absolute threshold for light’s impact on acute melatonin suppression.
2. Methods
Eighteen adolescents (age range of 13–18 years) and 22 adult participants (age range of 24–55 years) participated in the study’s 10-week protocol. Over the course of the study, all participants were exposed to two white light sources with correlated colour temperatures (CCTs) of 2627 K (2700 K rated) and 5936 K (6500 K rated). Both spectra were delivered across a range of illuminance levels (40–1000 photopic lux) at the cornea to provide 4 target CS levels of 0.07, 0.14, 0.30, and 0.50. To monitor the retinal light exposures experienced under the experimental conditions, each participant was provided with lensless eyeglasses frames fitted with a Daysimeter, a calibrated light meter. Over the course of each study night, 7 saliva samples were collected from each participant; the first sample was taken immediately before commencement of the lighting condition after a 30-min dim light exposure, and 6 additional samples were taken thereafter at 30-min intervals Melatonin suppression for each condition was determined by comparing the normalized melatonin levels collected during the dim light condition (the baseline control) to the normalized levels collected at the corresponding time on each lighting intervention night.
3. Results
Analysis revealed a significant main effect of target CS levels on melatonin suppression (F3,159 = 91.8, p < 0.001), wherein a higher target CS level was associated with greater suppression. Post hoc 1-sample t-tests showed that the mean melatonin suppression across all participants following a 1-h exposure was not significantly different from the predicted CS using the original phototransduction model at all CS levels. There was a significant main effect of white light spectra CCT (F1,39 = 8.3, p < 0.01); at the same CS level, mean melatonin suppression was greater for the 6500 K source (mean ± SEM = 24.7 ± 1.0%) compared to the 2700 K source (mean ± SEM = 18.4 ± 1.0%), suggesting that
CIE Session 2019 – Abstract Booklet
65

the phototransduction model is either over-predicting the response to the 2700 K source or under-predicting the response to the 6500 K source. The analysis also revealed a significant main effect of exposure duration (F5,1185 = 92.5, p < 0.001), indicating that longer exposure durations suppressed melatonin to a greater degree during participants’ biological night. The analysis did not reveal a significant interaction between spectrum and exposure duration on melatonin suppression (F5,1185 = 1.99, p = 0.08), suggesting that the spectral sensitivity of acute melatonin suppression does not change with exposure duration. There was, however, a statistically significant interaction between the effects of CS level and exposure duration on melatonin suppression (F15,1185 = 13.1, p < 0.001). At lower CS levels, longer exposure durations are required for significant melatonin suppression, whereas significant suppression is observed within 30 min at higher CS levels.
In terms of absolute threshold for melatonin suppression, depending upon the age group, the 6500 K white light source required light levels of approximately 71–85 lux for a 1-h exposure and 36–49 lux for 3-h exposure to reach the threshold criterion of 10% melatonin suppression.
4. Conclusions
The present data can be used to expand the circadian phototransduction model to include light exposure durations longer than 1 h. The proposed melatonin suppression threshold of 30 lux for 30 min for white light appears to be an acceptable, if conservative, recommendation for threshold value. The dose-response curves and deduced threshold light levels data can be used as guidelines for making lighting recommendations when considering non-visual responses in applications such as offices, schools, residences, and healthcare facilities.
5. Sponsor
The study was funded by the Jim H. McClung Lighting Research Foundation
CIE Session 2019 – Abstract Booklet
66
Session PA3-1 D1 - Colour in Application
Tuesday, June 18, 09:20–10:20
CIE Session 2019 – Abstract Booklet
67

OP25
EXTENSION OF COLOUR DIFFERENCE FORMULAE FOR HDR APPLICATIONS
Xu, Q.1, Luo, M.R.1,2 1 State Key Laboratory of Modern Optical Instrumentation, Zhejiang University, Hangzhou, CHINA,
2 School of Design, University of Leeds, Leeds LS2 9JT, UNITED KINGDOM
Abstract
1. Motivation, specific objective
The trend of future imaging devices such as displays, camera will be for the applications of High Dynamic Range (HDR) and Wide Colour Gamut (WCG). Colour difference equation is essential to quantify the image quality. Most of the uniform colour spaces and colour difference formulae are not designed for such applications. The research was carried out to study the change of colour difference from very bright to very dark luminance level for judging the colour difference of paint sample pairs. The results were used to extend colour difference equations for HDR application, including CIELAB, CIEDE2000, CAM02-UCS, ICtCp and Jzazbz. The performance of their original formula and optimised kL formula is reported here.
2. Methods
The experiment was conducted in a viewing cabinet placed in a dark room. The light in the cabinet was set to 6500K. The experiment was divided into nine sessions to investigate the colour difference thresholds at different luminance levels from very bright to very dark (1128, 407, 111, 32, 2.8, 1.6, 0.90, 0.51 and 0.25 cd/m2). Neutral density filters were employed to obtain dark luminance levels lower than 2.8 cd/m2. One hundred and forty pairs of samples were selected, distributed around seven colour centres. Colour pairs in each colour centre included two colour difference magnitudes (2 and 4 CIELAB units). For each centre, there were 2, 3 and 5 pairs in L*b*, L*a* and a*b* planes respectively. The sample pairs had a field of view of 3.8o. These were printed in the colour of seven centres and corresponding samples with no hair-line or gap between them. A Konica Minolta CS2000A spectroradiometer was employed to measure the tri-stimulus coordinates XYZ of sample pairs at different luminance levels.
Six categories including ‘1’ for ‘no difference’, ‘2’ for ‘just noticeable difference’, ‘3’ for ‘small difference’, ‘4’ for ‘acceptable difference’, ‘5’ for ‘large difference’ and ‘6’ for ‘extremely large difference’ were employed for visual assessment of colour difference. Twenty normal colour vision observers (ten males and ten females) took part in the experiment. Observers sat in front of the viewing cabinet and adapted to the viewing conditions for one minute in each session. Subsequently, observers viewed the sample pairs following a random order. The mean category for each pair was calculated to represent
the visual data (V).
Observers sit about 60 centimetres away from the sample pair. The illumination: observation geometry was 0°: 45°. In total, 25,200 observations were accumulated, i.e., 140 pairs × 9 luminance levels × 20 observers.
3. Results
The STRESS value was used to indicate the variation between two sets of data in this study. Inter-observer variability was first investigated. The STRESS value was calculated between mean category and each individual observer’s results. The average STRESS value from all observers represent inter-observer variability. It was found the values to be ranged from 15 (at the brightest level) to 25 (at the darkest level) with a mean of 19.
For each sample pair, the category located between ‘1’ (no difference) and ‘2’ (just noticeable difference) was judged as not perceptible pair. The number of these pairs divided by the total number of pairs is called not perceivable percentage (NP%). The NP% of 50% was regarded as perception threshold, which means half of the observers can perceive the colour difference of the sample pair but the other half cannot. The NP% values were plotted against colour differences calculated from one of the five colour models (CIELAB, CIEDE2000, CAM02-UCS, Jzazbz and ICtCp). Probability distribution
curves were fitted to fit the NP% data. The colour difference threshold (Et) was defined to correspond
CIE Session 2019 – Abstract Booklet
68
to 50 NP% at each luminance level. The data having NP% below 5% or above 95% were removed
from the calculation due to redundant information for very large and small colour differences. The Et at all luminance levels were then used to fit a polynomial function of logarithmic luminance values. This was obtained as HDR colour difference equations in quadratic form for each colour model. It was
found that the curves from CIELAB, CIEDE2000 and CAM02-UCS had similar trend, a decrease of Et
with luminance levels. The curves of ICtCp and Jzazbz increase of Et as luminance increases. This could be due to the Picture Quality (PQ) function imbedded in both models for luminance adaptation.
The STRSS was again calculated between the predicted E values and V values to indicate the five models’ performance. It was found that CIELAB and CIEDE2000 performed the worst (STRESS of 41), followed by Jzazbz (39), CAM02-UCS (34) and ICtCp (32).
Furthermore, the lightness parametric factor, kL, was introduced to improve the model’s performance. It was found a marked improvement for all models. All models’ STRESS values become similar, ranged from 30-35, especially a large improvement from 41 (the worst amongst all) to 30 (the best amongst all) for CIELAB. The kL factors of all the five colour models were smaller than 1.0, ranged from 0.4 to 0.8, indicating that lightness difference plays a more important role than chroma and hue differences in colour difference perception.
4. Conclusions
A psychophysical experiment was carried out to investigate the change of colour difference from very bright to very dark luminance level for viewing 140 paint sample pairs. High dynamic range colour difference equations were built for five colour models i.e., CIELAB, CIEDE2000, CAM02UCS, Jzazbz and ICtCp. The performance of colour models was tested and the results showed that CIELAB and CIEDE2000 performed the worst, followed by Jzazbz, and CAM02-UCS and ICtCp. By introducing the optimised kL factor, all models’ performance greatly improved and they all gave similar performance.
CIE Session 2019 – Abstract Booklet
69
OP26
INFLUENCE OF COLOUR ON VISUAL CONSPICUITY: TAKING SUBWAY ROUTE MAPS AS AN EXAMPLE
Lu, T.1, Ou, L.1. 1 BenQ Corporation, Taipei, CHINESE TAIPEI
1 National Taiwan University of Science and Technology, Taipei, CHINESE TAIPEI
Abstract
1. Motivation, specific objective
In a world of overloaded information, how to get the right one and make a right decision in a timely manner is an important issue in information tasks. If we can make the target stand out of the distractors, we can enhance the efficiency during such a task. Making the target information or a sign appear conspicuous can also help promote the information by attracting attention. But how do we make an object stand out? What are the underlying factors affecting visual conspicuity? To answer these questions, this study took subway route maps as an example to investigate the influence of colour on visual conspicuity.
2. Methods
Two experiments were conducted in this study. Experiment 1 was the main experiment, based on which a visual conspicuity model was developed as a function of colour difference. Experiment 2 was a verification test of this model.
Both experiments used coloured subway route maps as the stimuli, generated from a 15-route map designed by the research team, with the route colours varied for each test. During the experiment, each observer was asked to identify as fast as possible whether a target coloured route was present on that map, and the observer’s reaction time was recorded for each test. The reciprocal of the reaction time was used in this study as a measure of visual conspicuity.
Experiment 1 was divided into three parts. The first part used only achromatic colours, consisting of 5
levels of CIELAB lightness (including 10, 25, 40, 55 and 70), for the target route and the other 14
routes. This resulted in 100 test maps for the first part. The second part used 6 levels of chroma
(including 15, 30, 45, 60, 75 and 85) for the 15 route colours, all having the same lightness value 50
and the same hue angle 20 degrees. All test maps had a white background. This resulted in 100 test maps for the second part of the experiment. The third part used 6 hue regions (including 165, 175, 185, 195, 205 and 215 degrees) for the 15 route colours, all having the same lightness value 50 and the same chroma value 60. This resulted in 100 test maps for the third part. In total, there were 300 test maps for Experiment 1. Note that half of the test maps contained the target coloured route, located randomly on each map, with the other 14 routes in various colours. The test maps were presented individually on a calibrated EIZO ColorEdge CX270 liquid-crystal display, 27 inches in size, situated in a darkened room. A total of 30 observers, including 15 males and 15 females, participated in this experiment.
From results of Experiment 1, a visual conspicuity model was developed. To test this model, Experiment 2 was conducted using a different set of colours for routes on the same subway map. Unlike Experiment 1, the 3 colour appearance attributes, lightness, chroma and hue angle, all varied for the routes of each map. The colour samples included 11 levels of lightness (including 10, 15, 20, 30, 40, 50, 60, 70, 75, 80 and 85 ), 9 levels of chroma (including 10, 15, 20, 40, 60, 70, 75, 80 and 85) and 17 hue regions (including 0, 40, 80, 85, 105, 125, 130, 140, 145, 165, 180, 195, 225, 230, 255, 280, and 285 degrees). A total of 157 test maps were used for each observer in Experiment 2. The visual conditions of Experiment 2 were the same as those in Experiment 1. A panel of 30 observers, including 15 males and 15 females, participated in Experiment 2.
CIE Session 2019 – Abstract Booklet
70
3. Results
Results of Experiment 1 show that the visual conspicuity was a function of colour difference between the colour of the target route and the colours of the other routes, i.e. the larger colour difference between the target route and the other routes, the more visually conspicuous it is for the target route.
It is interesting to find that the length of each route has little influence on visual conspicuity, but the position of each route has strong impact. When the target route was located near the centre of the screen, the observers tended to identify its presence for a shorter reaction time than when the target route was located closer to an edge of the screen. This indicates that the visual conspicuity tended to be higher for target presented at the centre of the visual field than for target located far from the centre.
Experiment 2 aimed to verify the visual conspicuity model developed from Experiment 1, and the results show high predictive performance of the model, with a correlation coefficient of 0.78. Note that in Experiment 1, the route colours varying only in one colour appearance attribute for each test map, i.e. either lightness, chroma or hue angle was varied for each test. In Experiment 2, however, the route colours varied in all of the three colour appearance attributes for each test. Thus, the good test result of Experiment 2 shows real robustness of the model.
4. Conclusions
Two psychophysical experiments were conducted to investigate the influence of colour on visual conspicuity on subway route maps. The experimental results show that the larger colour difference between the target route and the other routes, the better visual conspicuity for the target. Findings of this study can help develop design guidelines for colour usage to improve visual conspicuity.
CIE Session 2019 – Abstract Booklet
71

OP27
A COLOUR GRAPHIC ICON FOR REAL COMPLEXE SCENES: APPLICATION TO LED ILLUMINANTS
Jost, S.1, Cauwerts, C.2, Poikonen, T.3 1 University of Lyon, ENTPE, LGCB, Vaulx-en-Velin, FRANCE,
2 Architecture & Climat, Université catholique de Louvain, Louvain-la-Neuve, BELGIUM 3 VTT, Espoo, FINLAND,
Abstract
1. Motivation, specific objective
During the past decades, limitations of the General Colour Rendering Index Ra have been well-documented with particular emphasis on being a one number output and not being able to represent all dimensions of colour quality. To deal with this issue, different indices of colour quality have been proposed and graphical representation have been developed (colour-rendering vectors, CIELAB or CAM02-UCS plots, colour icon, colour vector graphic, colour distortion graphic or plots of colour shifts). Although all these graphics are very useful to visualize and understand the colour rendering properties of light sources, they are not calculated for specific colour contents. As a consequence, they might not provide a reliable prediction of the effects of light sources over real scenes. Indeed, it is possible that a source with high theoretical rendition does not render well specific objects or vice versa. Moreover, some very recent studies have demonstrated that people’s judgement for colour rendition vary according to the types of objects in the scene and according to the lighting applications.
This paper presents the development of a new graphic icon informing on the colour rendering properties of light sources or glazing in context: instead of making predictions based on a predefined set of colour samples, the colour content of real scenes is analysed. The icon was developed to be easily understandable by end users and to provide intuitive information about which colours are impacted and what kind of distortion should be expected.
After the description of the development of the colour icon, this paper illustrates its interest to study the colour rendering properties of the new LED illuminants. These LED illuminants were determined in the European research project “Future photometry based on solid-state lighting products” (EMPIR PhotoLED) from a collection of approximately 1500 commercial LED products of different types. The spectral data were shared with CIE TC1-85 and nine of them, including blue and violet phosphor converted LEDs, red-green-blue LEDs and hybrid LED, are recommended in the revision of CIE15 technical report on colorimetry.
2. Development of the colour icon
As input, XYZ tristimulus values of the original and the shifted scenes are required. First the iCAM06 colour appearance model for images is applied to each pixel and IPT coordinates are calculated.
To facilitate the interpretation of scenes’ colour content, the colour space is divided in colour categories corresponding to six principal colours (orange, yellow, green, blue, purple and red). Unlike other graphical representation, the division of the space is not equal but determined according to perceived colours. Mean chroma and mean hue are then calculated by colour bins and projected in the PT plane. For each colour bin, the colour shift is represented by a vector that begins with the mean hue and mean chroma of the original scene and ends at the mean hue and mean chroma of the distorted scene.
Two circular histograms complement the graphic and aims at describing the colour distribution of the scenes (original and distorted). The histograms represent the proportion of pixels assigned to each colour bin. They give the user the opportunity to evaluate whether the colour shifts impact a lot of pixels or not, and to determine which colours appear in or disappear from the scene.
3. Application to LED illuminants
XYZ tristimulus values for real scenes can be obtained with an imaging colorimeter, a calibrating HDR camera, a hyperspectral camera or by computer generated images. In the paper we study the impact of LED illuminants on scenes captured by a hyperspectral camera or simulated with OCEAN light
CIE Session 2019 – Abstract Booklet
72

simulator software. With these methods, only the original scene needs to be simulated/captured. The distorted scenes can be virtually generated by modifying the spectral power distributions (there is no need to physically change the light sources of the room).
One advantage of our graphic is to give the user the opportunity to choose the reference scene and to enable the comparison of scenes with different correlated colour temperatures. We use this opportunity to compare the rendering of the five blue phosphor converted LEDs. The resuts show that the gamut of the colour vary with the CCT and although their CRI Ra or Rf are close their visual rendering are different.
In a more classical way, our graphic is applied to compare the rendering of LED-B1 and LED-V1 (CCT=2730K); LED-B2, LED-BH1 and LED RGB1 (CCT=2900K); and LED-B3 and LED-V2 (CCT=4100K). The results highlight the interest of using real scenes instead of test colour samples to characterise the colour rendition of light sources.
4. Conclusions
The present study investigates colour appearance in built environments and contextualises the analysis of colour shifts due to light sources. Rather than assessing colour differences on a predefined set of colour samples, as traditionally done to characterise colour rendition of light sources, we propose to analyse real scenes (computer-generated images or pictures of built environments).
The application to the newly recommended LED illuminants point out the interest of being able to visually compare the colour rendering of sources with different CCTs and the importance of the scene colours to characterise colour rendering.
The ultimate goal of this work is to develop a graphical indicator that could predict people colour shifts preferences. Hence, the contextualisation is essential as the application and the colours of the scene influence people preferences regarding colour rendering.
CIE Session 2019 – Abstract Booklet
73
Session PA3-2 D2 - Measurement of SSL Products
Tuesday, June 18, 09:20–10:20
CIE Session 2019 – Abstract Booklet
74

OP28
NOT ALL 60 Hz ELECTRICITY IS THE SAME – COMPLICATIONS IN MEASURING SOLID-STATE LIGHTING PRODUCTS
Tsai, B.K.1, Zong, Y.1, Miller, C.C.1 1 National Institute of Standards and Technology, Gaithersburg, MD, USA
Abstract
1. Motivation, specific objective
In January 2010, the National Institute of Standards and Technology (NIST) began to offer a Measurement Assurance Program (MAP) for solid-state lighting (SSL) products to customers of the National Voluntary Laboratory Accreditation Program (NVLAP) under the support of the United States Department of Energy (DOE). The MAP program provided proficiency testing complimenting laboratory accreditation to ensure that as SSL products became more prevalent, capable testing laboratories would be available to handle the volume of measurement work. At the request of the Energy Star program, in January 2011 the MAP was opened to any testing laboratories that wanted to participate, independent of accrediting body. In December 2014, the first version of the MAP was closed with 118 participant laboratories representing 13 countries.
A conclusion of the analysis of the MAP data was that the type of AC power supply may have an influence on the electrical and optical measurement results. While the measurement of Active AC power appears to have a variance consistent with a normal distribution (assumption of randomness implied), the measurement of RMS AC current and power factor is somewhat bimodal. This lead to a research project engaging several participants to determine the differences. A few potential reasons were identified and will be presented.
2. Results
Many of the discrepancies occur when the waveform of the current is significantly different from a sinusoidal wave. For example, if the current waveform is a sharp square wave and the line filtering and frequency filters within an AC power analyser are used, the differences may be range from 3 % to 5 % depending on the AC power analyser. Solid-state lighting products in the market have state of the art drivers which create unusual current waveforms, typically to increase energy efficiency.
Another type of measurement error occurs because the drivers for solid-state lighting products often have a very fast reaction time. The very fast reaction time may induce a high frequency component in the current waveform, which may result in large measurement errors. Traditional lamps and linear fluorescent tubes using magnetic ballast are operated on 60 Hz or relatively low frequency AC electricity. Most laboratories do not have difficulties in measuring these traditional lamps and low frequency fluorescent tubes. With the development of rapid start and instant start ballasts the 60 Hz electricity is up converted to 20 KHz electricity (even as high as 85 KHz). Measurement of such high frequency lamps is much more difficult; however, in the past only a few laboratories were required to measure such high frequency linear fluorescent tubes or luminaires. The laboratory was aware of this situation and accounted for the higher frequency electricity in their measurement systems. Some solid-state lighting products produce today, while operating on 60 Hz AC electricity, have a high frequency component because the driver is reacting to the type of AC power supply. An AC power supply that uses a digital waveform generator to create the 60 Hz AC electricity have a small high-frequency component that is on the order of 30 – 60 KHz, depending on the individual digital steps. Some solid-state lighting products can react to this small component creating a high frequency current wave. This high frequency current wave is susceptible to capacitance and inductance in the electrical wires or cables of the measurement system. When the solid-state lighting device is powered from the wall outlet the high frequency component is very minimal.
A study was conducted comparing the results of various laboratory AC power supplies to the wall outlet where inductors and resistors were added to the measurement circuit. Other devices such as isolating transformers and low pass filters were added to the measurement circuit. The effects were minimized significantly potentially leading to more reproducible results between testing laboratories.
CIE Session 2019 – Abstract Booklet
75

The results will be presented showing the magnitude of the measurement errors and the potential improvements.
3. Conclusions
To achieve better agreement between testing laboratories and provide measurement results that are more representative of the electricity used when the solid-state lighting device is plugged into the wall outlet, a circuit is required between the laboratory AC power supply and the solid-state lighting device to remove or dampen the higher frequency voltage component.
CIE Session 2019 – Abstract Booklet
76
OP29
SOLID-STATE LIGHTING MEASUREMENT ASSURANCE PROGRAM SUMMARY WITH ANALYSIS OF METADATA
Nadal, M.E.1, Tsai, B.K.1, Miller, C.C.1 1 National Institute of Standards and Technology, Gaithersburg, MD, USA
Abstract
1. Motivation, specific objective
In January 2010, the National Institute of Standards and Technology (NIST) began to offer a Measurement Assurance Program (MAP) for solid-state lighting (SSL) products to customers of the National Voluntary Laboratory Accreditation Program (NVLAP) under the support of the United States Department of Energy (DOE). The MAP program provided proficiency testing complimenting laboratory accreditation to ensure that as SSL products became more prevalent, capable testing laboratories would be available to handle the volume of measurement work. At the request of the Energy Star program, in January 2011 the MAP was opened to any testing laboratories that wanted to participate, independent of accrediting body. In December 2014, the first version of the MAP was closed with 118 participant laboratories representing 13 countries.
In January 2015, NIST started to offer a second version of the MAP (MAP2) with different SSL artefacts meant to evaluate the laboratory’s capabilities. The new version has a set of proficiency artefacts for a laboratory to measure, and the laboratory will be graded for passing or failing for each artefact. The MAP2 artefacts were selected to allow the laboratory to diagnose potential deficiencies in its measurement system or to provide diagnostics to improve the lighting measurement standards. MAP2 is expected to run for three years and is available to any testing laboratory for a service fee.
MAP2 has three options: A – SSL products, B – SSL products with 2 different 4-foot LED tubes, and C – SSL products along with 4 compact fluorescent lamps (CFLs) (with or without 4-foot LED tubes). Not every laboratory has the capability to measure lighting products 4-foot long, so the 4-foot tubes are not part of the proficiency test grading
2. Methods
The MAP1 and MAP2 are conducted as a star-type comparison. Along with the measurement results, each laboratory provided information on how they conducted the measurements and what equipment was used. The difference between the results of the laboratories’ measurements and NIST’s measurements for each of the eight properties/quantities was calculated and categorized by lamp type. This analysis provides a snapshot of the lighting measurement community’s capability to measure solid state lighting products and is presented in such a way that an individual laboratory’s results cannot be identified. Individual laboratories have received formal reports describing their results. With those reports, individual laboratories can determine where their results fit into the overall capabilities of the lighting measurement community.
To determine whether the differences between measurements were normally distributed and therefore potentially coming from a random process, the values were ordered from smallest to largest and then plotted on a normal probability plot. This method uses theoretical normally distributed values (called “normal order statistic medians”) as a horizontal axis to plot against the observed measurement differences. If the observed differences are normally distributed, then the resulting graph will be linear to a certain significance determined by the correlation coefficient and the number of data points.
3. Results
The results of the MAP1 and preliminary results of MAP2 offered by NIST are a snapshot of lighting testing laboratories’ capabilities to measure total luminous flux (lm), RMS voltage (V) and current (A), electrical active power (W), luminous efficacy (lm/W), chromaticity coordinates (x, y), CCT (K), and CRI (Ra). The results are for the measurements of 118 laboratories located worldwide between the years of 2010 and 2014. In general, independent of the lamp type, laboratories were able to measure the total luminous flux and the luminous efficacy within ±4% (k = 2, representing a 95% confidence interval). The laboratories were able to measure the active power within ±1% (k = 2) for most of the
CIE Session 2019 – Abstract Booklet
77
lamps. The one type of lamp, which has an active feedback, and another type of lamp, which is a 12 V DC lamp (uncommon for many laboratories), have a larger spread.
The somewhat surprising result was the large spread for the measurement of RMS current, ±5% (k = 2) for another type of lamp. This large spread has motivated research in this area. One conclusion is that many laboratories may have issues with four-pole sockets. A specific lamp has been included in the second version of the MAP to investigate four-pole socket problems. Additionally, some of the early results reveal that a select set of solid state lamps is sensitive to the impedance and slew rate of the AC power supplies.
Additional research is presented comparing the results of total luminous flux measurements using integrating sphere systems and Type-C goniometric systems. Using the F-statistic to compare the variances of the distributions, a conclusion is drawn that both systems statistically provide equivalent results. A further study was conducted comparing Type-C goniometer systems and Type-D goniometer systems (a Type-C rotated 90 degrees). The difference with the Type-D is that it is no longer aligned with gravity. The main conclusion is that the temperature of the solid-state devices changes the operating conditions such that the luminous efficacy changes with position making correction factors quite difficult.
CIE Session 2019 – Abstract Booklet
78
OP30
EVALUATION OF BLUE LIGHT HAZARD
Konjhodzic, Dr. Denan Instrument Systems GmbH, Munich, GERMANY
Abstract
1. Motivation, specific objective
The rapidly growing significance of modern solid state lighting (SSL) technology in our daily working and living environment raises important safety issues, such as the photobiological safety and the blue light hazard (BLH) in particular. The original International Standard IEC 62471 was prepared as a Standard CIE S 009 and gives guidance for evaluating the photobiological safety of lamps and lamp systems including luminaires. It assigns high demands to measurement equipment and procedures to ensure a reliable evaluation of photobiological hazards and in particular the assessment of the BLH risk classes of light sources. This Standard actually identifies two health hazards which can be caused by visible light. Intense light may lead to retinal burns, a hazard which is easily avoided by normal aversive behaviour. However, blue light between 400 nm and 500 nm causes photochemical damages of the retina, a hazard which is much more difficult to assess by normal users. This so-called blue light hazard possibly leads to a degeneration of the macula. The corresponding weighting function covers the wavelength region between 300 nm and 700 nm and has its maximum around 435-440 nm. Considering the distinctive blue peak of white LEDs, the question of the hazardousness of SSL sources arises. Depending on the radiance levels, the BLH sensitivity, and the exposure times the IEC 62471 assigns light sources to four risk groups from 0 (exempt) to 3 (high risk).
Additionally, the IEC Technical Report 62778 explains how to apply the IEC 62741 for simple assessment of the BLH of lamps and luminaires with visible radiation. However, this has not yet become a standard. Currently, worldwide efforts are underway to elevate this report to a new standard and add more detailed measurement procedures for BLH assessment that are accessible to a broader community.
We will evaluate and compare these methods using some practical measurements, and emphasize the advantages and disadvantages of each method. As every manufacturer should perform BLH assessment for the permission of new SLL products, one or few simpler methods should be available and understandable for more users.
2. Methods
A correct risk assessment is a challenging task for the experimenter as one has to decide on the suitable test equipment. Today, the measurement instrument of choice is often an array spectrometer instead of the hard-to-handle double monochromator suggested by the standard IEC 62471. But even high-end array spectrometers must have advanced stray light correction methods to achieve the required high dynamic measuring range especially in the less sensitive blue region. Carefully designed test adapters are necessary to ensure a correct and reproducible test geometry. With such equipment testing labs, which should be accredited according to ISO17025, can reliably assess the risk class of lighting products.
Two main measurement procedures for BLH assessment were proposed in the IEC 62471, the direct spectral radiance measurement with an optical system and an alternative method as an irradiance measurement performed with a well-defined field of view. Here, the measured irradiance value is divided by the measurement field of view to obtain the final radiance value. The direct spectral radiance measurement is realized with a telescopic optic in combination with an array spectrometer calibrated on spectral radiance. Our alternative method consists of a stray light corrected array spectrometer with an integrating sphere calibrated on irradiance and a tube which contains apertures necessary for the calculation of radiance.
3. Results
Both procedures have been realised, the measurements on several samples have been (and will be) performed, and the risk groups assigned and discussed. Additionally, some considerations about the
CIE Session 2019 – Abstract Booklet
79

risk group classification based on CCT (correlated colour temperature) and luminance of the source, as proposed in TR 62778 and further developed in the emerging Standard, will be discussed. The measurement of luminance and CCT, for example, can be performed with a filter based imaging colorimeter, or in the simplest way the data sheet specifications can be used for the rough risk group assessment.
The results from different methods will be presented and the expected deviations from different methods will be discussed.
4. Conclusions
Measurement of blue light hazard is a difficult task, as the radiance measurement itself is demanding and highly dependent on the geometry of the setup. The major challenge is to reproducibly and precisely position a small aperture of 2.2 mm defining a solid angle of 11 mrad in 200 mm distance for most measurements.
Therefore, results can vary more or less depending on the measured source and the method used. However, the result of BLH assessment is not the exact absolute value but the correct risk group, each covering few orders of magnitude. Only in the case that the measurement result is on the border between the two risk classes, it is important to perform the most exact and reproducible measurement. If possible, the results from the direct spectral radiance measurements should be taken for assessment, rather than some simplified measurements and approximations.
Several studies have evaluated the risk classes for various kinds of SSL sources, lamps and luminaires. In general, SSL sources were not found to impose any larger risks to the user than conventional sources. Most luminaires with non-directly visible LEDs were assigned to risk class 0. Only luminaires with directly visible LEDs ended up in risk class 1 or in some cases in class 2, which are still safe under normal use and aversion behaviour - just like conventional sources. The high risk class 3, which is dangerous even for short exposure times below 0.25 s, is extremely unlikely for sources in general lighting and consumer displays.
CIE Session 2019 – Abstract Booklet
80

Session PA4-1 D3 - Daylight 1
Tuesday, June 18, 10:45–12:05
CIE Session 2019 – Abstract Booklet
81
OP31
APPROACH TO ANALYZE SEASONAL AND GEOGRAPHICAL VARIATIONS IN DAYLIGHT ILLUMINANTS
Knoop, M.1, Weber, N.1, Diakite, A.K.1 1 Technische Universität Berlin, Chair of Lighting Technology, Berlin, GERMANY
Abstract
1. Motivation, specific objective
Spectral power distributions of daylight have a typical profile, and chromaticities of the CIE daylight illuminants lay on a curve that runs close to the Planckian locus. Each colour point on this daylight locus is assigned a unique correlated colour temperature (CCT) and a specific spectral power distribution (SPD). SPDs of daylight illuminants can be reconstructed from its colour point or CCT with a calculation approach described in CIE publication 15 Colorimetry, using characteristic vectors derived from 622 spectral sky measurements.
Reconstitution of a SPD from a CCT or colour point allows, for example, the use of inexpensive colour sensors to obtain an approximate SPD without having to resort to spectroradiometers. The then acquired spectrally resolved daylight data can be weighted with any weighting function. This provides, for instance, opportunities for light dose measurements in daylight studies in the determination of non-visual, ipRGC-influenced light (IIL) responses, but also for lighting control systems that support these effects. It also offers possibilities on the representation side. The daylight’s SPD can be reflected in only one value, its CCT. This is useful in the presentation of daylight conditions, as for example used in spectral sky models. Again, spectrally resolved daylight data can be derived from this information, and be evaluated depending on the need or application.
However, it is known that the reconstituted SPDs for daylight illuminants are not just average SPDs, but they are also subject to seasonal and geographical variations. Measurements collected during a two year time period at a daylight measuring site were used to define a local daylight locus, showing a deviation from the CIE daylight illuminants especially in the range of higher colour temperatures. Analysis of the measurements showed that a more accurate prediction of SPDs, reflected in a higher Goodness of Fit Coefficient, is achieved with a local daylight locus and local eigen vectors. This confirms findings of another daylight measuring site in Europe. Practically this means, for example, that it is not clear if an appropriate assessment of IIL effects can be derived from measurements with colour sensors or CCT values from spectral sky models, using the current CIE approach to reconstitute SPDs.
2. Methods
To investigate both geographical and seasonal variations, a large worldwide measurement campaign is planned. To collect measurement data from project partners, it is important to document relevant parameters and define the measurement procedure. For this, a documentation and measurement template will be drawn up. The relevant parameters to document are partly obtained from a literature review, looking into papers on spectral daylight measurements which were conducted in the past 60 years. The measurement procedure is based on an analysis of measurements performed at the daylight measuring site, considering integral and directional measurements, as well as orientation, duration and season of measurement.
3. Results
This paper describes an approach to perform measurements to define seasonal and geographical variations in daylight illuminants. It will include a summary of the literature review and an outline of the measurement analysis, both used to draw up the documentation and measurement template. The paper will include a proposal for this template, which will be used in measurement campaign, planned to modify or complement the existing CIE approach for reconstitution of daylight’s spectral power distribution.
CIE Session 2019 – Abstract Booklet
82
OP32
ENERGY SAVING POTENTIAL FOR INTEGRATED DAYLIGHTING AND ELECTRIC LIGHTING DESIGN VIA USER-DRIVEN SOLUTIONS: A LITERATURE REVIEW
Gentile, N.1, Osterhaus, W. 2, Alvarez García, M.2, Naves David Amorim, C.3, Altomonte, S.4, Garcia-Hansen, V.5, Obradovic, B.6
1 Lund University, Lund, SWEDEN, 2 Aarhus University, Aarhus, DENMARK, 3 University of Brasília, Brasília, BRAZIL, 4 Université Catholique de Louvain, Louvain-la-Neuve, BELGIUM, 5 Queensland
University of Technology, Brisbane, AUSTRALIA, 6 Norconsult AS, Oslo, NORWAY
Abstract
1. Motivation, specific objective
Measures for the reduction of electric energy loads for lighting have predominantly focussed on increasing the efficiency of lighting systems. This efficiency has now reached levels that were unthinkable just a couple of decades ago. Just shifting from incandescent to LED lighting sources, for example, can improve efficiency by about 500%. However, a focus on mere efficiency is physically limiting, and does not necessarily ensure that the anticipated energy savings actually materialise. Indeed, behavioural aspects – including, for example, that of designers, equipment manufacturers and installers, as well as lighting users – can significantly contribute to the energy loads actually realised, although the precise magnitude of their effects remains difficult to quantify. While individual research projects and building case studies have focused on the identification of these behavioural impacts, there is yet little consolidated evidence of the combined influences of behaviours in the literature.
This paper presents a literature survey aimed at identifying control strategies and behaviours leading to a reduction in lighting energy use. Whenever possible, the strategies and behaviours discussed are supported by quantitative data. This survey is part of a more extensive review of the potential for reducing energy use through the integrated design of daylight and electric lighting and their control systems. This review is part of the activities of IEA SHC Task 61 / EBC Annex 77 “Integrated Solutions for Daylighting and Electric Lighting: From component to user-centered system efficiency”.
2. Methods
In this literature survey, peer-reviewed research, mainly published during the last decade, was reviewed and evaluated. The search keywords were gathered from an appraisal based on contribution from 30 lighting experts with different competence and areas of expertise. These keywords were entered into relevant databases – such as Scopus, Web of Science and IEEE Xplore – in order to retrieve a first set of fundamental papers. Other papers were retrieved via cross-referencing from the first set of papers. The papers were grouped by topics according to the strategies described therein. Based on their findings, a reasoned estimate of potential energy savings was established for each group of topics/strategies. Topics and strategies were considered from both electric lighting and daylighting, with emphasis on integrated systems and solutions. The following main topics/strategies were identified: user-interface design; feedback systems; information strategies; anchor points for default or starting lighting settings; rebound effects (such as installing luminaires in situations for which previously lighting was considered unnecessary or too wasteful just because we now have “energy-efficient” LED luminaires); and circular economy.
3. Results
The literature survey highlighted, first of all, that strategies focusing on behaviours to influence energy conservation are lacking a sufficiently evolved classification system. For example, the term ‘feedback system’ is often used to indicate anything from consumer-awareness displays (e.g., monitor screens showing current energy use patterns) to informative meetings with users who are asked to provide their opinions on various aspects of energy demands and the performance of the system using the energy. The literature survey also established that ‘feedback systems’ have not really been explored adequately in lighting research, but that more material is available regarding the entirety of building energy services. Some topics, like ‘rebound effects’, represent risks rather than opportunities, but reinforce the need for a deeper understanding of energy-related behavioural patterns and decision-making processes of building owners, designers, lighting suppliers, installers and end-users.
CIE Session 2019 – Abstract Booklet
83

4. Conclusions
Overall, with the current technology, energy savings in the order of 5-30% may be achieved by encouraging users to be more conscious of their behaviour with respect to energy use for lighting. However, this saving potential is purely hypothetical and greatly affected by other aspects that are situation-specific. For example, improved user consciousness and behaviours with respect to lighting energy use do not contribute much towards energy savings in spaces with highly efficient lighting systems that are only occupied for short periods of time. Likewise, feedback systems tend to work better in buildings with (lighting) systems that are perceived as generally meeting the needs of the occupants. If occupants get the impression that operating the controls diminishes comfort or work performance, prompts by a feedback system to conserve energy might not lead to the desired behavioural changes.
CIE Session 2019 – Abstract Booklet
84
OP33
STUDY ON THE EFFECTS OF AROUSAL DAYLIGHTING OF DORMITORY ON COLLEGE STUDENTS' SLEEP QUALITY, ALERTNESS AND MOOD IN SUMMER
Dong, Y.J.1, Zhang, X.1 1 Tsinghua University, Beijing, CHINA
Abstract
1. Motivation, specific objective
In recent years, the effects of dawn simulation on sleep quality at night, alertness and mood after waking, and other physiological and psychological indicators have become an important part of research. Studies have shown that artificial dawn can reduce the complaints of sleep inertia. However, no research has been found about Chinese and arousal daylighting. Study of natural arousal lighting is important for building layout, interior design, and the artificial dawn intensity, setting, location, etc., and may have an impact on human behaviours, curtain settings, and head orientation.
Dormitory is one of the most important places for college students in university. Daylighting in dormitory has an important effect on students' health. Choosing the daily living space of dormitory to measure the illuminance at the eye of awakening daylighting. The subjects were classmates or students of the same major with basically the same time of whole day's class, completely the same time of night's light-out and most of the three meals were eaten in the dining hall with relatively uniform time. The daytime light exposure was almost similar, which greatly reduced the experimental error of subjects due to age, diet and work and rest.
2. Methods
Based on the simulation of daylighting exposure in summer before waking up in each bed in 6-storey dormitories of ZiJing No.11 Apartment, Tsinghua University, Beijing. Two adjacent apartments of 6-storey north-south dormitories were selected, according to students’ head position when they are sleeping, the wireless probe which can record the illuminance in real time was fixed on the wall of eye- level height. Before waking up, illuminance at the eye of 16 university students (8 males and 8 females,
age=19.44±0.2, Pittsburgh sleep quality index, PSQI=5.8±0.43) in 4 dormitories was recorded every
10 minutes. Subjective evaluation scale was used to obtain physiological data of subjects such as alertness and mood. Jawbone UP3 and sleep diary were used to record the sleep quality of the subjects at night. According to the tested wake up time recorded by Jawbone UP3, and the illuminance data recorded by the probe, the cumulative light exposure at the eye before waking up is calculated by the relevant formula. Subjective questionnaires were filled out after waking up in the morning and before going to bed at night. This study was conducted from May 21st, 2017 to June 19th.
3. Results
Cumulative light exposure at eye was significantly positively correlated with the subjective evaluation
of alertness after waking up: p=0.045<0.05,Pearson=-0.562 , and the correlation between alertness
and other subjective evaluations such as emotion(p=0.821>0.05) and overall health(p=0.538>0.05)
evaluation was not significant, which indicated that cumulative light exposure at eye may be the main factor affecting alertness after waking up. Cumulative light exposure at eye was significantly positively
correlated with the subjective evaluation of night fatigue:p=0.005<0.05,Pearson=-0.72. However,
there was no significant correlation between cumulative light exposure at eye and mood after waking up in this study: p=0.128, Pearson=-0.445, which was different with result of previous studies.
In addition, there was no significant correlation between cumulative light exposure at eye before waking up and sleep quality indicators such as deep sleep duration: p=0.059, rapid eye movement (REM) sleep duration: p=0.824 and wake-up times at night: p=0.819 at night.
4. Conclusions
In summer, the more cumulative lighting exposure at eye before waking up, the higher alertness after waking up, and the lower fatigue at night. Research on the effect of morning arousal lighting on sleep quality at night requires stricter control condition of daytime behaviour and light exposure.
CIE Session 2019 – Abstract Booklet
85

OP34
ASSESSING ALERTING EFFECTS OF DAYLIGHT AT THE WORKPLACE: METHODOLOGY BASED ON A SEMI-CONTROLLED STUDY
Soto Magán, V.E.1, Andersen, M.2 1,2 Laboratory of Integrated Performance in Design (LIPID), Ecole Polytechnique Federale de
Lausanne (EPFL), Lausanne, SWITZERLAND
Abstract
1. Motivation, specific objective
Light, and especially daylight, is important for many biological functions, but understanding its effects encompasses multiple dimensions. On the one hand, scientific evidence put forward the existence of various neurobehavioral and physiological processes, also known as non-visual responses, which are reactive to light stimuli. It highlighted, for instance, that the blue part of the visible spectrum may affect alertness both indirectly, by modifying circadian rhythms, and directly, giving rise to acute effects. On the other hand, we know that impairment of alertness may impact quality of life in the form of daytime sleepiness, circadian misalignment or sleep disorders, which is likely to affect productivity. Current lifestyles are driving us to spend more time indoors (around 90%), where lighting conditions are often designed based on visual and thermal criteria – notably glare avoidance and minimizing overheating risks - which may result in insufficient (day)light exposure for properly entraining our circadian clock.
Since daylight, in which we evolved, is naturally rich in the blue component of the spectrum, it has the “right” properties when it comes to impacts on body functioning but it is still unclear whether it can have a significant beneficial effect compared to artificial light from a psychophysiology standpoint. Most of the studies on acute alerting effects have been conducted in well-controlled laboratory settings, where somewhat extreme and narrowly defined lighting conditions have been tested. This paper proposes assessment and monitoring techniques that would apply to semi-controlled studies instead, and focuses on the impact of daylighting in work settings by exploring ways to investigate alertness circadian rhythmicity, physiology and neurobehaviour in realistic indoor conditions.
2. Methods
Intensity and spectral distribution are among the main qualities of light that drive non-visual responses, together with duration, timing of exposure, and prior light history, but only the first two have been widely explored. However, as daylight has a very dynamic nature compared to artificial light, it becomes essential to include multiple levels of independent variables in a daylight-focused evaluation that accounts not only for intensity and spectrum, but also duration and timing.
2.1. Setting
Two adjacent classrooms with the same layout and characteristics were selected to conduct semi-controlled studies. Three manipulations of daylight conditions were applied. In a first phase, blue spectrum was compared to neutral with the same visual illuminance, whereas in the second, spectrum was kept constant and it was the effect of illuminance that was tested, by comparing neutral bright conditions to neutral dim. In the last trial, changes to both illuminance and spectrum together (blue and dim versus blue and bright) were applied. To achieve this, existing available glazing technology and filters were used in different combinations.
2.2. Design
Each study was designed in batches of 3-consecutive-days, 7-continuous hours each day (from 9am to 4pm). This differs from previous controlled studies on artificial light, were the average duration of exposure was between 10 min and 24-hours. Due to the changing nature of daylight and the duration of the evaluation period, it was indeed essential to follow a between-subject design, with half of the participants from each trial randomly assigned to either a control or an intervention group (classroom A or B). For the whole duration of the experiment, the same group stayed in the same classroom and was exposed to one condition only. Different groups of participants were included for the different pairs of interventions to avoid bias from personal differences.
CIE Session 2019 – Abstract Booklet
86
2.3. Participants
It was important to have an a priori power analysis calculation to determine an adequate sample size. This resulted in groups of minimum thirty-four students for the different trials of these semi-controlled studies. They were selected based on certain background information, obtained from an extensive questionnaire distributed during the selection process.
2.4. Procedure
Participants were individually equipped three days before the experiment with smartphones, several wearable light sensors (to measure spectrum and illuminance at the eye level) and devices for heart rate and skin temperature monitoring. The study consisted of 3-days with six measurement blocks each, three in the morning and three in the afternoon, each one containing a short questionnaire and one performance test. The first block (9am) was used as baseline reference, and the next five as experimental phase. Participants were also requested to fill in an activity diary and a sleep diary on a daily basis
2.5. Measurements
Subjective and objective measures were used for the assessment of alerting effects of the various manipulations of daylight. Subjective alertness was self-reported by participants with a survey including different scales. One test was employed to assess objective sustained attention, which is highly correlated with alertness levels. Physiological arousal was measured continuously with heart rate variability recording devices, as well as the state of circadian phase with measurements of skin conductance. Environmental conditions were also monitored in the classrooms.
3. Results
The proposed methodology led to several interesting outcomes. First, we understood that duration and timing of exposure play a key role in studies pertaining to non-visual effects. Indeed, only in days two and three of the trials (i.e. not during day one) could we see any significant effect of changing the spectrum or intensity of the exposure; a similar finding emerged from the hourly analysis, with inconsistent performance throughout the day pointing to the importance of timing. Second, we found out that building redundancy in what is measured during these types of experiments was essential if one wants to generate a useful dataset, given the number of influencing factors with this rather low level of control. Third, regarding subjective assessments, we realized that not all the existing scales are sensitive enough for a protocol of this kind, which means that complementing self-evaluations with objective assessments through physiological or environmental measurements is crucial to provide a critical perspective on questionnaires.
3. Conclusions
In order to anticipate how effective lighting interventions that would be driven by non-visual effects (e.g. increasing alertness) might be at the workplace, it is necessary to first observe and report how daylight availability and occupants behaviour influence one another in real spaces and over time. The field needs more tailored studies, but more importantly, explicit methodologies. The protocol developed for this study allows to monitor and assess, for the first time and with limited intrusion, the effects of different daylighting conditions on alerting circadian rhythmicity, physiology and behaviour.
CIE Session 2019 – Abstract Booklet
87
Session PA4-2 D1 - Colour Rendering
Tuesday, June 18, 10:45–12:05
CIE Session 2019 – Abstract Booklet
88
OP35
EFFECT OF LIGHT LEVEL ON COLOUR PREFERENCE AND SPECIFICATION OF LIGHT SOURCE COLOUR RENDITION
Bao, W., Wei, M.* The Hong Kong Polytechnic University, Kowloon, HONG KONG
Abstract
1. Motivation, specific objective
Investigation of the effect of light source spectrum on human evaluations of colour quality, including naturalness, preference, or vividness, has a long and on-going history. Many psychophysical experiments have been carried out to correlate the colour rendition measures with human perceptual responses and to develop specification criteria for light sources. Many studies found that sources with high scores in colour fidelity measures (e.g., CRI Ra) may not always be preferred. Sources that can enhance the chroma level of object colours within a certain limit, which cannot be characterized by colour fidelity measures, were generally more preferred. These studies, however, seldom employed light level as an independent variable. Moreover, the light levels included in these studies were generally between 200 and 1000 lx to ensure photopic vision and being applicable to typical interior applications, though there are applications where colour appearance is critically important at dimmed light levels.
This study aimed investigate how light level affects colour preference and specification of light source colour rendition by varying the illuminance level from 20 to 15,000 lx and the light source colour rendition using spectrally tuneable LED fixtures. The a priori hypotheses included: (1) as light level decreased, light sources with a larger gamut area would be needed to compensate the reduced colour vision under low light levels and to produce preferred object colour appearance; (2) at very high light levels (e.g., under daylight), no chroma enhancement is needed to produce preferred colour appearance.
2. Methods
An artwork that included familiar objects (i.e., fruits) was illuminated by spectrally tuneable LED fixtures. In Experiment 1, two seven-channel spectrally tuneable LED devices were used to produce nine SPDs at five illuminance levels (i.e., 20, 50, 100, 200, and 480 lx), with the nine SPDs being nearly metameric (CCT ≈ 3000 K and Duv ≈ -0.005) and having an Rg value from 100 to 124. In Experiment 2, a four-channel spectrally tuneable LED device was used to produce nine SPDs at five illuminance levels (i.e., 200, 2000, 5000, 10000, and 15000 lx), with the nine SPDs being nearly metameric (CCT ≈ 3000 K and Duv ≈ -0.005) and having an Rg value from 100 to 117. The SPDs in both experiments were carefully designed, so that the increase of Rg was caused by the increase of chroma enhancement for red colours, since red was the dominant hue in the artwork and was found important to colour preference evaluations.
Under each illuminance level, the observer was asked to use a keypad to switch between different SPDs, compare the colour appearance of the artwork under different SPDs, and select the one under which he or she preferred the colour appearance of the artwork. The possible order bias was considered by presenting the SPDs in two orders (i.e., from the lowest to the highest Rg and from the highest to the lowest Rg) to each observer in Experiment 1 and by counterbalancing the two presentation orders between observers in Experiment 2.
Forty observers (33 males and 7 females) between 20 and 28 years of age (mean = 21.15) participated in Experiment 1; 30 observers (15 males and 15 females) between 20 and 24 years of age (mean = 21.93) participated in Experiment 2. As tested using the 24 Plate Ishihara Color Vision Test, two observers in Experiment 1 and one observer in Experiment 2 had colour deficiency and their data were discarded in the analyses.
3. Results
As tested using a Chi-Square Test of Independence, no significant difference was found between the two presentation orders in either experiments. The selection of the SPD for producing the most
CIE Session 2019 – Abstract Booklet
89

preferred colour appearance was associated with the light level, as tested using a Chi-Square Test of Independence.
In Experiment 1, as the illuminance decreased from 480 to 20 lx, the Rg of the SPD that was most frequently selected to produce the most preferred colour appearance of the artwork increased from 109 to 118. In Experiment 2, as the illuminance decreased from 15000 to 200 lx, the Rg of the SPD that was most frequently selected to produce the most preferred colour appearance of the artwork increased from 100 to 113. The average Rg, Rcs,h1, and Rcs,h16 of the selected SPDs at each light level increased from 109.8, 7.05%, 6.02% to 116.4, 15.75%, 15.36% respectively with the illuminance decreased from 480 to 20 lx, and from 103.1, -3.57%, 0.47% to 112.5, 11.56%, 11.79% respectively with the illuminance decreased from 15000 to 200 lx. In addition, when the illuminance was 15000 lx, the SPD with an Rg of 100 was most frequently selected, suggesting that little chroma enhancement was needed at an extremely high light level.
Moreover, though the effect of light level on colour appearance is modelled in CIECAM02 and CAM02-UCS, the chromaticities of the artwork under the selected SPDs at different light levels did not remain similar in CAM02-UCS. This suggested that the model may overestimate the effect of light level on colour appearance, especially when light level was very high, and merits further investigations.
4. Conclusions
A psychophysical study was carried out to investigate how colour preference and specification of light source colour rendition would change under different light levels (i.e., from 20 to 15000 lx), which has never been studied before. The observers compared the colour appearance of an artwork under nine nearly-metameric SPDs with different Rg values at each illuminance level and selected the one producing the most preferred colour appearance.
The results clearly suggested that light level significantly affected the colour preference judgments. A light source with a larger gamut is more frequently selected to produce preferred colour appearance of the artwork at a lower light level for compensating the reduced human colour vision. When the light level was extremely high (i.e., 15000 lx), the light source with an Rg of 100 was most frequently selected, which suggested that little chroma enhancement is needed at such a high light level. Therefore, the finding in many past studies that human beings prefer object colour appearance with enhanced chroma levels was likely due to the relatively low light levels.
Moreover, though CIECAM02 and CAM02-UCS consider the effect of light level on colour appearance, the characterization of the colour appearance of the artwork under the selected light sources at different light levels suggested that CAM02-UCS may overestimate the effect of light level, especially when the light level was very high, which merits further investigations.
CIE Session 2019 – Abstract Booklet
90
OP36
A NEW METRIC FOR MEMORY COLOUR PREFERENCE EVALUATION IN LIGHTING APPLICATIONS – EXPERIMENTS, MATHEMATICAL DEFINITION, AND COMPARISON
WITH OTHER COLOUR RENDERING INDICES
Babilon, S.1, Khanh, T.Q.1 1 Technical University of Darmstadt, Laboratory of Lighting Technology, Darmstadt, GERMANY
Abstract
1. Motivation, specific objective
Due to their potential use as an internal reference, memory colours have proven to provide an excellent conceptional approach for the colour rendition evaluation of white light sources in terms of predicting visual appreciation. However, there are still some major drawbacks that can be identified in the principal design of existing memory-based or memory-related colour quality metrics. For this reason, a new experiment was devised by the authors trying to overcome the shortcomings of these previous approaches. Based on the experimental output, the main goal of the current study consequently was to derive an improved version of a memory-based colour quality metric, which provides a superior tool for developers and manufacturers that can be used for the optimization of state-of-the-art lighting solutions in cases where visual appreciation and high user acceptability are more important than colour fidelity.
2. Methods
In order to investigate the impact of long-term memory on visual appreciation, a set of twelve different familiar real test objects was used to perform a series of colour preference rating experiments whose conceptual design was intended to incorporate realistic viewing and adaptation conditions that go beyond the simple viewing cabinet approach that can usually be found in the literature.
The experiments were conducted in a real-sized, white-painted, furnished room at two different adaptation conditions with correlated colour temperatures (CCTs) of 3200 K and 5600 K, respectively, where each test object was individually presented first to a group of 15 German observers and eventually, in a follow-up experiment, to a group of 15 Chinese observers. In each case, the ambient illumination settings of the experimental room were realized by driving a four-channel LED illuminant of Lambertian light emission (consisting of R, G, B, and warm-white LEDs) to match the desired white point of adaptation at a given CCT as good as possible. In addition, an LCD projector was used for shifting the chromatic appearance of the respective test object, while keeping its lightness component constant, resulting in a total number of approximately 65 colour variations per test object.
For each colour variation, the observers were asked to rate the perceived colour appearance of the currently presented test object according to their preference of how they thought the respective object should look like in reality on a semi-semantic five-level scale. The mean colour appearance ratings and, therefore, the prototypical memory colour representations of the twelve familiar test objects were subsequently modeled in CIECAM02-UCS chromaticity space by fitting bivariate Gaussian distribution functions to the mean observer ratings obtained for the different colour variations of each individual test object assessed by either German or Chinese observers which were adapted to either 3200 K or 5600 K ambient illumination. Hence, in total, four different sets of memory colour representations were derived.
With these memory colour representations for each of the twelve familiar test objects being known, the assessment of the colour quality of a certain test light source can eventually be based on the evaluation of the degree of similarity between the colour appearance of these objects rendered by the test light source and their respective memory colour representations in CIECAM02-UCS chromaticity
space given by the corresponding Gaussians. This similarity evaluation gives for each test object a
so-called specific memory colour preference index (MCPI) . Bearing in mind that for the visual
appreciation of a perceived lighting scene, as shown in the literature, certain colours are more important than others, additional weighting factors for the specific indices had to be included, so that
CIE Session 2019 – Abstract Booklet
91
the final general MCPI is obtained by calculating the weighted geometric mean of the twelve
individual values.
In addition, both the impact of the adapted white point and of the observers’ cultural background were considered in the definition of the final MCPI calculation scheme, which, in particular, differs from previous work on this topic.
3. Results
In order to confirm the excellent predictive performance of the new metric proposal, the experimental data of several different psychophysical studies on colour preference in illumination were collected and a comprehensive meta correlation-analysis was eventually performed on these data to evaluate and compare the predictive power of the MCPI in terms of visual appreciation with those of other
colour quality metrics, which included Sanders' preferred colour index , Judd's flattery index ,
Thornton's colour preference index (CPI), Smet et al.'s memory colour rendition index (MCRI), the
general colour rendition index , the general colour fidelity index , the gamut area index (GAI), the
arithmetic mean of GAI and , the colour quality scale by Davis and Ohno ( , , , ), the
CRI2012, the feeling of contrast index (FCI), and the IES TM-30 measure. The experimental data
contained the spectral power distributions of the investigated light sources together with the corresponding observer preference ratings. Based on their principle study design, two different kinds of experiments were considered: The first group made use of metameric lighting scenarios, i.e., all tested light sources to be assessed and compared within a single experimental trial showed the same CCT but different spectral characteristics. The second group, on the other hand, applied multi-CCT scenarios, which means that not only the emitted spectra but also the corresponding CCTs of the light sources were varied for the comparison performed by the observers.
As could be found from the meta-correlation analysis for both kinds of lighting scenarios, the newly proposed MCPI significantly outperformed all alternative approaches considered in this study – in particular even those that, like the MCPI, were based on memory- or preference-related evaluation. In addition, it was investigated whether the reported impact of the observed inter-cultural variations on the colour appearance ratings of familiar objects also had a significant effect on the predictive performance of the MCPI metric. For this purpose, a global average observer serving as a reference was defined by pooling and averaging for each test object and adaptation condition the rating data of both cultural observer groups. The obtained mean observer ratings were subsequently modeled by applying again a bivariate Gaussian fitting.
From performing the meta-correlation analysis, no significant differences in the predictive power of the optimized cultural-specific MCPIs and the global reference could be observed. Therefore, indication is given that it would be sufficient to propose a single, universally valid MCPI that is capable of well predicting the rank order of various light sources with respect to their visual appreciation representing an average global observer. With the predictive performance of both cultural-specific MCPIs being comparable to the performance of the global MCPI, the latter can be considered as a good approximation to a globally valid colour quality metric inducing only minor errors in the absolute level of the predicted results compared to those obtained for the cultural-specific MCPIs, which however are considered to be negligible in practice.
4. Conclusions
In this study, an improved version of an updated memory-based colour quality metric for the evaluation of the colour rendering properties of white light sources in terms of visual appreciation denoted as memory colour preference index (MCPI) has been proposed. It is based on the evaluation of the degree of similarity between the colour appearance of certain familiar test objects rendered by an arbitrary test light source and their respective memory colour representation. The degree of similarity is assessed by using a set of Gaussian similarity distribution functions fitted to the results of colour appearance rating experiments of Chinese and German observers. The key features of this newly proposed MCPI are the adoption of the perceptionally uniform CIECAM02-UCS as the working colour space, the implementation of a CCT-based decision algorithm to choose a suitable set of similarity functions better approximating the impact of the adapted white point on the memory colour assessments, and the introduction of additional weighting factors allowing i) to model the varying importance of certain test colours in the evaluation of light sources with respect to colour preference
CIE Session 2019 – Abstract Booklet
92

and ii) to counterbalance the metric errors in the memory colour assessments introduced by chromatic adaptation.
By perfoming a comprehensive meta-correlation analysis on colour preference rating data of several different psychophysical studies collected from the literature, it could be shown that the MCPI, in its global and cultural specific versions, outperformed all alternative colour-quality metrics in predicting visual appreciation. Offering such an excellent predictive performance, the MCPI algorithm is supposed to also provide a reliable and easy-to-implement tool for the spectral optimization of modern
state-of-the-art LED light sources which is capable of finally replacing the CIE metric in a broad
variety of different lighting applications where achieving high visual appreciation and observer preference are more important than achieving colour fidelity. Nevertheless, further validation is still necessary.
CIE Session 2019 – Abstract Booklet
93
OP37
SEMANTIC INTERPRETATION OF THE CIE 2017 COLOUR FIDELITY INDEX
Bodrogi, P., Guo, X., Khanh, T.Q. Technische Universität Darmstadt, Darmstadt, GERMANY
Abstract
The CIE 2017 Colour Fidelity Index (Rf) was defined as a scientifically accurate measure of colour fidelity with respect to a reference illuminant. The present paper deals with the interpretation of the different Rf values on its numeric scale in terms of categories based on a psychophysical experiment. Which specific Rf value corresponds to “very good” or “good” visual colour fidelity impressions? The “good” Rf level represents a psychophysically relevant user acceptance criterion to design a spectrum for e.g. a working environment in which colour fidelity is still an important colour rendition aspect.
1. Motivation, specific objective
The CIE 2017 Colour Fidelity Index (Rf) was defined as a scientifically accurate measure of colour fidelity with respect to a reference illuminant. After reading the Technical Report CIE 224:2017, the present authors identified the following important technical issue that required further research:
-How can we define specific values on the numeric scale of Rf corresponding to “very good”, “good”, “moderate”, “poor” and “bad” colour fidelity?
The criterion value of Rf corresponding (in average) to the “good” visual colour fidelity impression of the observers (Rf,crit) in a psychophysical experiment can then be used by lighting engineers as an acceptance criterion value by optimizing or evaluating a spectrum.
To obtain these specific Rf values, we carried out a visual psychophysical colour fidelity experiment. Observers scaled their subjective impression of the similarity of the colour appearance of a set of real coloured objects under a test light source and a reference light source under four different correlated colour temperatures (CCTs). Spectra were provided by a high-power, high-end RGBW LED engine. The reference light source was the one with the maximum possible Rf value at each CCT optimising the RGBW LED channels.
An interval scale between 0 and 100 (called visual colour fidelity scale or VCF scale) was used. This interval scale was labelled at certain specific values by the following rating categories: excellent, very good, good, moderate, poor, bad, very bad. Mean VCF values of the observers (under test light sources with a wide range of different Rf values and the reference light source with the maximum Rf value at each CCT) were depicted as a function of Rf at each CCT. The reference light source was also compared with itself and it obtained “excellent” similarity ratings in case of every CCT. An S-type curve was fitted to the resulting mean VCF(Rf) data points at every CCT and the criterion value of Rf for “good” colour fidelity, Rf,crit (CCT) was determined. Changing the driving values of e.g. the red, green, blue and warm white LEDs of a multi-LED light engine, the lighting engineer should achieve at least Rf=Rf,crit(CCT) for general user acceptance i.e. “good” colour fidelity.
Colour fidelity is still an important aspect of colour quality (besides other colour rendition aspects e.g. colour preference) for lighting applications that require a neutral environment e.g. official working situations with high colour naturalness. With Rf>Rf,crit one also obtains good colour discrimination and good visual clarity (provided that illuminance level is high enough).
2. Methods
34 observers rated visual colour fidelity on the above mentioned scale. The question was how similar the colour appearance of eight real (i.e. not artificial) coloured objects (orange, lemon, banana, purple onion, lettuce, blue-lilac rose, red rose, own hand) arranged on a table with a white cloth under the test source is to their colour appearance under the reference light source by considering all objects at the same time. The LED light engine (red, green, blue, warm white) provided 36 spectra altogether at different Rf levels between 58 and 93 at four CCTs, 3100 K, 4100 K, 5000 K, 5600 K at 242 cd/m2 (fixed). One spectrum (with the maximum Rf value at each CCT) was considered as reference at each CCT. One of the eight test light sources was switched on for 15 seconds and then the reference light source was shown for another 15 s. This procedure was carried out twice. Then, observers had to rate
CIE Session 2019 – Abstract Booklet
94
their similarity impression. After changing CCT, a 2 minute re-adaptation period was included. Both the four CCTs and the nine spectra within a CCT were shown in a randomised order.
The categories on the interval scale of visual colour appearance similarity had the following values: ‘excellent’ 97.9; ‘very good’ 91.6; ‘good’ 79.6; ‘moderate’ 52.9; ‘poor’ 41.2; ‘bad’ 26.5; and ‘very bad’ 12.8. These specific values of the interval rating scale at the categories resulted from a previous study. A “S” function was fitted to the resulting mean VCF(Rf) data points at every CCT and specific Rf values corresponding to the categories were calculated. This included the above mentioned Rf,crit (“good”). The comparison of the reference with itself resulted in VCF>98.1 in average at every CCT.
3. Results
The following Rf values (in parentheses) were obtained at the above mentioned specific values of the interval rating scale at the categories:
-at 3100 K: excellent (93); very good (91); good: (89);
-at 4100 K: excellent (90); very good (89.5); good: (88);
-at 5000 K: excellent (89); very good (88.5); good: (88);
-at 5600 K: excellent (88); very good (87); good: (86);
Observers were also asked to prioritise the eight objects according to their relevance in terms of making a judgement about the similarity of colour appearance. They had to assign the numbers 1 (highest), 2, 3, 4 and 5 (lowest) only to five objects (to those considered most relevant) out of the entire set of eight objects. The following median values (in parentheses) were obtained: orange (1), red rose (2), own hand (3); lemon, banana, lettuce, blue-lilac rose (4), purple onion (5). This finding emphasizes the role of orange-red objects in making visual colour fidelity assessments.
These results are valid for this specific RGBW LED light engine. Although its four LED channels are able to produce spectra with outstanding colour fidelity (as a reference light source) in order to provide the category “excellent” for every CCT, further experiments are necessary with multi-LED light engines that are able to generate even higher maximum Rf values.
CIE Session 2019 – Abstract Booklet
95

OP38
TOWARD NEW COLOUR RENDERING METHOD OF WINDOW GLASS
Matusiak, B.S.1, Arbab, S.1 1 Norwegian University of Science and Technology, Trondheim, NORWAY
Abstract
1. Motivation, specific objective
The CIE Colour Rendering Index (CRI), defined in CIE 13.3-1995, especially the general colour rendering index Ra, is widely used by the lighting industry both, in standards and in lighting design practice. However, limitations of the CRI, especially for solid-state light sources, generated the need for developing of measure that is more precise, namely colour fidelity index Rf (Yaguchi et al., 2017). Still, the Rf, as well as Ra does not address perception related colour quality measures beyond overall fidelity in a clear and simple way. The main difference between the Ra and Rf is precision, while calculation of Ra is based on 8 samples, Rf is based on 99.
For architects and interior architects working with coloration of surfaces the question addressing the way light influence colour appearance is wider. In addition to the general information about the change, it is important to know if the surface colour appears as lighter or darker Value, more or less coloured Chroma, and if it is possible to observe changes in Hue. Just, the usage of those three colour dimensions is necessary to describe the colour change in a way useful for (interior) architects.
The academic discussion about the colour rendering is mostly limited to electric light sources, but the present development in glass technology results in new types of glass having significant colour tint. The application of them in buildings has serious consequences, as the live spam of windows is much longer than the one for lamps and the replacement of windows is very expensive. Still, to the knowledge of the author, the only scientist who proposed colour rendering of tinted glazing using the three colour dimensions (Value, Chroma and Hue) has been Joe Lynes (2015).
The present study was motivated by the following question:
Is the colour rendering method of glass proposed by Joe Lynes reliable also for present-day high-tech glazing types?
2. Methods
To find an answer, an experiment has been carried out in the artificial sky at Norwegian University of Science and Technology’s (NTNU). This artificial sky simulator enables mimicking of skylight of the following correlated colour temperatures: 2700K, 6500K and 8000K.
The experiment has been carried out using two similar boxes positioned on the table at the artificial sky and having openings that has been consecutively covered by the glass samples in the task box; the opening in the reference box was not covered. Three high-tech glazing types (electrochromic, photochromic and thermotropic, all having a tint of colour) were used in five different transmittance scenarios. The Colorimetric measurements were taken with the SpectraScan PR655 spectroradiometer for 9 colour samples; the first eight are the original test colour samples (TCS) taken from the early edition of Munsell for CIE 1995, the last one was added by researchers as the one frequently used in Trondheim. 21 subjects participated in the experiment; they were asked to notice their observations regarding colour difference between two identical samples positioned on the floor of the two boxes in a questionnaire on the 5-steps scale where 1 refers to no difference (perfect match) and 5 to the largest difference experienced in the study.
The second experiment is underway with the same setting and the questionnaire asking about changes in Value, Chroma and Hue specifically. During this experiment, a page from the Munsell atlas is positioned at the floor of the reference box, something that helps subjects to give more precise answers addressing the three colour dimensions.
3. Results
The findings from the first experiment indicated that the Lynes method is reliable to predict which glazing has the biggest impact on all aspects of colour, but only in 6500K. A new method is needed.
CIE Session 2019 – Abstract Booklet
96

A new set of measures that together can be applied as Colour Rendering Method for Window Glass have been proposed. The method is based on the colorimetric measurements of eight CIE colour samples and the opinion that one single number, e.g. Ra index for electric light, will never describe well enough HOW the various colours change. It is therefore reasonable to develop a method that refer to the three principal dimensions of colour: Hue, Chroma and Value.
The proposed method addresses the three colour dimensions in the following way.
1. For the Chroma the gamut area on the v’ u’ graph (behind glass).
2. For the Hue, the average colour shift distance of the eight CIE colour samples (reference conditions vs. behind glass) on the v’ u’ graph.
3. For the Value the median spectral transmittance of the glass under examination, which is to be used in the calculation according to the Value formula proposed by Valberg in the book Light vision colour, page 198, John Wiley & Sons 2007.
The preliminary results from the second experiment confirm the overall correctness and accuracy of the proposed method.
4. Conclusions
The method has been developed for architects and interior designers who are not familiar with the CIE colour system, nor with the Ra either. The simple reason is that they are not skilled in mathematical apparatus. Most of them are using perception based colour systems i.e. the Munsell or the NCS colour system. Additionally, the colour rendering indexes, be it Ra or Rf do not give enough information needed in their practice. On the other side, they are responsible for choosing window glass in buildings and a colour rendering method that describes colour shift in a language that they are well acquainted with (Value, Chroma and Hue) is very much needed.
As the proposed method is based only on the usage of the technical specification of glass, i.e. the total and the spectral transmittances, and a small number of colour samples (eight samples from Munsell system which is commonly used by CIE), it should be considerably easy to use, both by the industry developing new glazing types and by practitioners considering to apply them in buildings.
CIE Session 2019 – Abstract Booklet
97
Session PA5-1 D3 - Glare
Tuesday, June 18, 13:15–15:15
CIE Session 2019 – Abstract Booklet
98

OP39
EXPLORING THE PLEASANT SIDE OF GLARE IN THE LED ERA
Sekulovski, D.1, Perz, M.1, Vissenberg, G.1 1 Signify Research, Eindhoven, THE NETHERLANDS
1. Motivation, specific objective
Surfaces with a high luminance, i.e. luminance much higher than the one the observer is adapted to, generally produce unwanted visual effects, grouped under the term glare. From the loss of task performance due to disability glare, the irritation from discomfort glare, to the mysterious effects of overhead glare, we seldom speak of glare as pleasant. Our view on the matter was dramatically changed in a series of papers by Akashi starting around the year 2000. In 2005 he introduced "Sparkle, the good glare" as a concept that naive observers seem to understand without training. Still, a definition was used in the experiments. The definition given was "Sparkle is defined as a smaller luminous elements often found to be aesthetically pleasing". Examples used included chandelier glass elements, Christmas lights, and reflections from water.
In the experiments reported by Akashi, an array of circular openings with a varying area in an opaque material was positioned in front of a light source with a tunable intensity. Observers could then classify the resulting brightness impression in one of four different classes labelled by the terms "dull", "bright", "sparkling", and "glaring". A very useful way of fitting and using the results of the experiments is as a probability of observing sparkle or glare for different points in the log(solid angle) / log(luminance) parameter space.
As revolutionary as those experiments are, there is one problem limiting their applicability to LED based light sources and that is the range of luminances used in the experiment. The highest luminance used was less the 10000 cd/m2, far from the levels that we regularly see in LED based light sources. To enrich the data on the perception of both pleasant and unpleasant glare we carried out an experiment looking at luminances up to 3*106 cd/m2.
2. Methods
The experimental procedure was similar to the one of Akashi, with the most notable difference being the hardware used. Furthermore, in contrast with the prior studies, instead of classification of the impression of the stimulus, we asked the participants to directly judge if the stimulus was perceived as glary and sparkly in two different sessions.
Setup and stimuli
An array of 32 so called "chip on board (CoB)" modules was connected to a computer controllable power supply. The modules had a colour temperature of 3000K and each produced up to 2000 lumen, giving a possible maximum output above 60000 lumen and luminance of the chips of up to 3*106 cd/m2. The power supply was controlled using custom software that changed the driving current of the light source modules. The modules were mounted on an over-dimensioned cooling plate and good thermal contact was insured.
To limit the luminous area, a set of differently sized circular openings were drilled in metal plates, aligned to the centers of the modules. The openings had diameters of 1.3, 1.6, 2.4, 3.2, 4.8, and 6.4 mm with a pitch of 70mm between the centers of the openings. The metal plates were manually positioned in front of the light modules in a slot that assured good alignment.
Ten different luminances were used in the experiment, ranging from 1445 cd/m2 to 3*106 cd/m2.
Participants
20 participants took part in the experiment, 10 males and 10 females with an age range of 25 to 65. All participants were recruited using an external agency and had no prior professional experience with lighting and lighting design and were west Europeans.
Procedure
The participants were seated on a fixed position 3.05 m from the stimulus using a chin rest in in a room with additional office lighting with the same colour temperature as the stimulus. The illuminance
CIE Session 2019 – Abstract Booklet
99
at the eye of the participants with the fixed adaptation stimulus was 16 lux. After the introduction of the experiment and signing of the informed consent, the participant had a training session which included a clearly glary and a clearly sparkly stimulus. All participants saw all stimuli twice. Due to the manual change of the plates, all luminances for a fixed area were presented twice in a random order. Then the plate was changed, changing the area. The areas were presented in a random order over the participants.
To control for the effect of adaptation, the stimuli were shown for a limited time and a fixed stimulus was shown in between. The light of the stimulus was switched on for two seconds after which the participant was asked to rate the stimulus as sparkly or not by pressing the corresponding keys on a numeric keyboard connected to a laptop computer. In a separate session, balanced in the order with the sparkle session, the participant was asked to rate the stimulus as glary or not glary using the same procedure. After the answer of the participant, the stimulus was switched to a fixed luminance of 5000 cd/m2 for 10 seconds, after which the procedure was continued with the next stimulus.
3. Results and Conclusions
The data was aggregated into a probability of rating each stimulus given with the (luminance, area) pair as glary or sparkly. These probabilities were further used to fit two generalized linear models. Both models used a binomial distribution and a probit link. In both models, the dependent factors used were the logarithm of the luminance and the logarithm of the solid angle of a single opening as well as their powers and combination of powers up to the fourth degree.
The results show an unsurprising tendency that glare probability grows with the increase of luminance and size. The probability of glare was in general lower for the range of luminances that overlap with the earlier studies, probably caused by the adaptation state and range effects. The dependence of the optimal sparkle luminance on the area of the stimulus is more complex. It is again very similar to the earlier results, just at higher luminance levels, stressing the need for control of adaptation in such experiments.
CIE Session 2019 – Abstract Booklet
100
OP40
TESTING THE PREDICTIVE POWER OF VISUAL DISCOMFORT FROM GLARE METRICS IN NEAR-WINDOW AND NEAR WALL-ZONES
Viula, R.1, Hordjik, T.1 1 Delft University of Technology, Delft, THE NETHERLANDS
Abstract
1. Motivation, specific objective
Current research on the visual discomfort from daylight glare shows contradictory opinions regarding the predictive power of existing metrics and in some cases new metrics have been proposed.
The objective of the study was to find how well a group of selected metrics predict reported visual discomfort from daylight glare in spatial conditions that differ from the conditions where metrics tend to developed and validated for. The study also differs from existing field studies in that the sitting position of the subjects is clearly defined and in the fact that subjects are asked to perform a board-on wall type of task instead of a desk-based task.
The studied metrics include Daylight Glare Probability (DGP) and other relevant glare indexes, the luminance contrast ratios proposed in the IES Lighting Handbook, and luminance-based metrics that have shown high correlation with reported visual discomfort from glare in recent field studies.
The problem under investigation is: how well do metrics predict reported discomfort in different positions in a room and in particular in the positions away from the window?
2. Methods
An empirical study involving the appraisal of visual discomfort from glare by 50 subjects in a daylit-only classroom space was carried out to investigate this problem. The subjects were asked to sit in 4 positions of the space, and report their visual discomfort in each of these positions after performing a small visual search test task. 200 visual discomfort glare assessments and simultaneous field-of-view HDR luminance measurements were collected.
The performance of the metrics was evaluated based on two zones of the studied space: a near-wall zone and near-window zone. The statistical analysis approach follows a methodology that has been recently proposed for the evaluation of the robustness of these type of metrics, and is done in two ways. One is by the evaluation of the ability of the metric to describe the full glare scale, which is based on the results of a Spearman correlation. The other consists in the evaluation of the accuracy of the prediction by the metric, which is based on the Area Under the Curve (AUC) and the True and the False Positive Rates of a Receiver Operating Characteristic (ROC) statistic.
3. Results
The results show that in the near-window zone, some of the metrics show a better ability to describe the full glare scale. However, the differences in the correlation coefficients and statistical significance between these metrics are very small to say that one metric has a better performance than other. In the near-wall position, all metrics showed very low or no correlation with the reported degree of discomfort from glare by the subjects.
Regarding the accuracy of the metrics, some of the glare indexes passed all the statistical tests in the near-window zone while in the near-wall zone, although some metrics showed some correlation with the reported degree of glare, none of the metrics passed all the statistical significance tests.
4. Conclusions
The study shows that none of the metrics was able to perform equally well in the near-window and near-wall zones of the studied space and that there is a poor performance of the metrics in the near-wall zone, in general.
It is verified that discomfort from glare is reported in conditions of low illuminance and in particular for low vertical eye illuminances, a result that is in line with the findings from other studies in non-cellular office spaces and field studies.
CIE Session 2019 – Abstract Booklet
101

The findings of the study are explained in regards to the discomfort glare caused by the brightness of the window in the visual field. However, there are distinct problems caused by glare in different parts of a room that can affect the perception of glare from the window.
It seems therefore important to get a better understanding of not only the predictive power of the metrics across space but also of the nature of the discomfort glare problem across space.
CIE Session 2019 – Abstract Booklet
102

OP41
DIFFERENCE BETWEEN FIELD AND LABORATORY STUDIES OF DISCOMFORT GLARE CUT-OFF VALUES
Pierson, C.1, Sarey Khanie, M.2, Wienold, J.3, Bodart, M.1 1 Université catholique de Louvain, Louvain-la-Neuve, BELGIUM, 2 Technical University of Denmark,
Kongens Lyngby, DENMARK, 3 École Polytechnique Fédérale de Lausanne, Lausanne, SWITZERLAND
Abstract
1. Motivation, specific objective
Developing reliable and accurate methods to evaluate visual discomfort remains a crucial step to move towards optimal daylighting design in buildings. To date, over twenty daylight discomfort glare models have been developed, mainly from laboratory studies using office-like settings with daylight.
By inputting the lighting quantities of a specific visual scene into the model, each glare index produces an estimation on a numeric scale of the magnitude of discomfort glare perceptible in that visual scene. For each discomfort glare index, cut-off values corresponding to the borderlines between different magnitudes of discomfort glare are provided. For instance, the cut-off values for the Daylight Glare Probability (DGP) index, which ranges from 0 to 1, are defined as:
- 0.35 = borderline between imperceptible and noticeable glare
- 0.40 = borderline between noticeable and disturbing glare
- 0.45 = borderline between disturbing and intolerable glare
Through field studies, researchers have attempted to validate these discomfort glare indices and their corresponding cut-off values. Their results indicate that discomfort glare indices generally underestimate discomfort glare compared to occupants in real office environments. For example, the DGP value representative of 50% of participants being disturbed by discomfort glare in two field studies was respectively of 0.2 and 0.24, whereas that same DGP value in a meta-analysis combining results from 7 laboratory studies averaged at 0.47. In 2 other field studies, the CIE Glare Index (CGI) index value representative of 50% of participants being disturbed by discomfort glare was either 32 or 35, whereas this CGI value rose to 37 in the meta-analysis. Therefore, it was suggested that the cut-off values of a discomfort glare index are calibrated according to the specific daylight situations where it is evaluated.
The aim of this study is to compare the cut-off values of 9 common daylight discomfort glare indices evaluated from similar studies, although one is a field study, and the 2 other ones are laboratory studies. The results provide the quantification of the gap that should be expected between the cut-off values from laboratory and field studies. At last, the conclusion draws assumptions on the reasons for this gap.
2. Methods
The cut-off values of 9 discomfort glare indices for 3 borderlines of discomfort glare magnitude (Imperceptible >< Noticeable, Noticeable >< Disturbing, Disturbing >< Intolerable) are compared between field and laboratory studies.
The field study was conducted in Switzerland in 2018. In total, 92 participants made a point-in-time evaluation of discomfort glare in their own office on a 4-point scale. The shading devices were open when possible, and the sky was clear during the entire study. Lighting measures were taken just after the subjective rating.
Data from 2 laboratory studies, conducted in the same office-like cell in Germany, were also used. The first laboratory study was conducted between 2008 and 2011 with 49 participants assessing 196 visual scenes on the same 4-point scale. The study was performed under clear sky conditions, but various shading devices were used. Lighting measures were taken simultaneously to the subjective assessment, with the equipment located besides the subject’s head. The second laboratory study was
CIE Session 2019 – Abstract Booklet
103

conducted in 2013 in the same facility, but with no shading devices. 96 participants evaluated discomfort glare on the same 4-point scale, while lighting measures were taken simultaneously.
For each tested visual scene, 9 discomfort glare indices are evaluated using evalglare from Radiance. The 4-point scale data is converted into 3 binary variables representing the 3 borderlines. The cut-off values for these 3 borderlines are then derived for each discomfort glare index from the binary variables using diagnostic statistics. More specifically, the receiver operating characteristic curve (ROC curve) is established for each binary variable. The optimal cut-off value for each borderline and each index is determined as the mean value of 3 cut-offs derived from the ROC curve using different optimization methods. At last, the optimal cut-off values are compared between the laboratory and the field studies.
3. Results
As described in the literature, a difference in the cut-off values corresponding to 3 borderlines of discomfort glare magnitude is observed between field and laboratory studies. More specifically, the cut-off values of 9 common daylight discomfort glare indices are systematically lower in the case of the field study (FS) than in the case of the laboratory studies (LS). Furthermore, the gap between these cut-off values is so large that for some discomfort glare indices, the cut-off value of the disturbing/intolerable borderline in the field study is smaller than that of the imperceptible/noticeable borderline in the laboratory study. As an example, the DGP cut-off values are:
- for the imperceptible/noticeable borderline: 0.24 (FS) against 0.30 (LS)
- for the noticeable/disturbing borderline: 0.26 (FS) against 0.37 (LS)
- for the disturbing/intolerable borderline: 0.29 (FS) against 0.62 (LS)
4. Conclusions
Following a comparative study of the cut-off values corresponding to 3 borderlines of discomfort glare magnitude between laboratory and field studies, it was observed that the cut-off values from field studies are systematically lower. This observation could mean that subjects are more sensitive to discomfort glare when they evaluate it in their own office.
However, other reasons could explain the gap between these cut-off values. For instance, there could be stimulus range bias. The range of illuminance values experienced in real office buildings is generally lower than the illuminance values experienced in laboratory settings. Lower illuminance values can be due to shadings that cannot be open in the tested offices, to neighboring buildings or vegetation blocking daylight, to space arrangement made by the occupants, etc. Therefore, subjects might report discomfort glare at lower index values in field studies, since they tend to make relative evaluations according to the available range of situations.
Moreover, lighting conditions history and psychological bias might also play a role in the evaluation of discomfort glare in field studies. Most probably, participants will make point-in-time evaluations of discomfort glare in their office by taking into account past conditions. They might also be more critical regarding the office environment that they experience every day in contrast to a random office environment.
CIE Session 2019 – Abstract Booklet
104

OP42
ANNUAL EVALUATION OF DAYLIGHT DISCOMFORT GLARE: STATE OF THE ART AND DESCRIPTION OF A NEW SIMPLIFIED APPROACH
Giovannini, L.1, Favoino, F.1, Lo Verso, V.R.M.1, Pellegrino, A.1, Serra, V.1
1 Politecnico di Torino, Department of Energy “Galileo Ferraris”, Technology Energy Building Environment (TEBE) Research Group, Torino, ITALY
Abstract
1. Motivation, specific objective
The topic of daylighting has always been crucial in the design process of a building, both as far as the related energy demand for lighting is concerned and for its key role in determining the indoor environmental quality perceived by the occupants of a space. Focusing on visual comfort and human well-being, these are complex phenomena influenced by several lighting aspects, which include the glare related to daylight sources. In spite of its importance, daylight discomfort glare is not so commonly addressed in the design process of related a space. This is due to the complexity concerned with the glare phenomenon and, consequently, to the complexity of the evaluation approaches. Actually, daylight glare is a function of the user’s position and direction of view and it is influenced by the dynamically changing luminance of the sky dome as well as by the window optical properties. Furthermore, the presence of moveable shading devices makes the evaluation of daylight glare even more complex. Several approaches and indexes have been proposed to assess the daylight glare from windows. At present, the Daylight Glare Probability (DGP), which expresses the percent of occupants disturbed by a daylighting glare condition, is considered one of the most reliable indicators.
The complexity in evaluating the daylight discomfort glare is even greater considering that the assessment of daylighting in buildings has moved towards a climate-based dynamic modeling approach, which aims at verifying the annual lighting conditions inside a building. The annual DGP analysis is time consuming, as it requires an HDR image to be generated for each time-step considered during the course of a year (typically an hour). Furthermore, the DGP is position and view dependent, which means that to assess the glare condition of a space the calculation should be repeated for all relevant points in the space. The main goal of this paper is to present a simplified approach which was developed for daylight glare analyses in buildings and to critically discuss its potentials and drawbacks, also with respect to other simplified approaches defined by other authors in the past. Furthermore, the paper also presents an application of the method, to show the results which can be obtained.
2. Methods
The simplified approach presented in this paper enables to classify a whole space in terms of annual daylight glare comfort classes (imperceptible glare, perceptible glare, disturbing glare and intolerable glare) by means of the eye vertical luminance Ev alone, rather than of the DGP value. This results in a significant reduction of the computation time required, although it could introduce some errors in the assessment of the daylight glare comfort classes, as the contribution to glare sensation of the luminance contrast is neglected. The simplified approach consists of the following steps:
Step 1: calculation of Ev thresholds (to separate imperceptible-perceptible, perceptible-disturbing, disturbing-intolerable glare), so as to classify each viewpoint/direction of observation of a custom-defined grid in a certain daylight glare comfort class. This is done through the correlation of the Ev to the DGP calculated for the same grid points and by applying a fault-detection analysis;
Step 2: for each point of the custom-sized grid, quantification of the error generated from adopting Ev thresholds to classify a certain point in a daylight glare comfort class, compared to the exact DGP values,. The errors are expressed as sum of underestimation and overestimation occurrences of each glare condition over the whole year;
Step 3: Identification of the most suitable point in the space for the calculation of the Ev thresholds adopted to classify the whole space according to the daylight glare comfort classes.
CIE Session 2019 – Abstract Booklet
105

This is done by identifying the point that minimizes the errors quantified in Step 2.
3. Results
The simplified approach proposed in this study allows a space to be classified according to daylight glare comfort classes by means of vertical illuminances at eye level, rather than calculating the exact DGP for a certain point/direction of observation. The Ev thresholds corresponding to each glare class were defined by applying the method to different case studies (parametric studies for different rooms with different types of glazing and shading). The identification of the most suitable point in the space to classify the whole space in terms of annual daylight glare class was obtained considering different distance from the daylight source and different direction of view. The application of the simplified approach to the case studies proved to be sufficiently accurate (the error in the estimation of the daylight glare comfort class through Ev is below 5%) .
4. Conclusions
The main advantages of the approach are that (i) a spatial evaluation of glare perceived in a room in terms of daylight glare comfort classes is possible and that (ii) the computation time required for this analysis is significantly lower than that necessary for calculating DGP for the whole space. The main disadvantage instead is the inability of the simplified method to estimate the exact DGP value, as only the daylight glare comfort classes can be estimated for each point. However, this information could be useful enough to support decision making at an early design stage and building operation in a perspective of improving the control of glare conditions for the occupants.
CIE Session 2019 – Abstract Booklet
106
OP43
TESTING EXPERIMENTAL METHODS FOR DISCOMFORT GLARE INVESTIGATIONS
Iodice, M.1,2, Jost, S.2, Dumortier, D.2 1 CEREMA, Department of territories planning, Aix-en-Provence, FRANCE
2 University of Lyon, ENTPE, LGCB, Vaulx-en-Velin, FRANCE
Abstract
1. Motivation, specific objective
Discomfort glare, defined by the CIE as glare producing discomfort without impairing vision, has been investigated for more than a century. However, the physiological mechanisms behind its perception are not understood. Hence, empirical formulae are used to prevent lighting installations from producing it. The Unified Glare Rating is the official discomfort glare formula from the CIE. The JTC7 (Discomfort caused by glare from luminaires with a non-uniform source luminance) is currently working on adapting this formula to non-uniform luminance sources. Numerous studies investigated discomfort glare using various experimental methods. Most of them were based on psychophysical procedures in which subjects evaluate their own discomfort glare perception (subjective data). Few others relied on physiological measurements, as indicators of discomfort glare (objective data).
The aim of this study was to compare some of these methods and to select the most relevant ones for investigations of discomfort glare in indoor environments. For this purpose, we focused on psychophysical procedures in a first experiment, and on physiological measurements in a second one.
2. Methods
Experimental protocols were defined for each experiment based on two different approaches. The comparison of the psychophysical procedures was based on the repeatability of the results and the presence of experimental biases. Seven psychophysical procedures were selected: rating on a continuous discomfort scale, method of constant stimuli, method of limits, adjustment (absolute evaluation); paired comparison, matching, magnitude estimation (relative evaluation). The investigations about physiological measurements were focused on the link between the presence of discomfort glare and the variation of physiological signals (based on the observation of their variation during exposure to glaring and non-glaring stimuli). Four physiological measurement devices were selected: electrocardiography (heart rate, ECG), electromyography (intensity of the electrical activity measured on facial muscles near the eye, EMG), electroencephalography (brain signals, EEG), and pupillometry (variation of pupil size).
The experimental set-up was identical for both experiments. The subjects sat at the center of a white room. They were instructed to look at a target located on the wall in front of them. The background luminance levels of the room walls were set to 20 cd/m² (photopic conditions). The spectral power distribution (SPD) of the background was a white LED SPD (CCT=5870 K; Ra=70; x=0,32; y=0,34). The circular uniform glare source was located on the front wall, off-centered at 20° above the subject’s line of sight. It was composed of a 7-channel spectrally tuneable projector and a diffuser.
Two glaring stimuli were presented in both experiments (“LowMel”, CCT=4810 K, Ra=70, x=0.35, y=0.37; “HighMel”, CCT=4220 K, Ra=40, x=0.36, y=0.34). They were designed to be metameric according to the CIE 10° fundamental observer and to excite differently intrinsically photosensitive Retinal Ganglion Cells (ipRGCs): “HighMel” stimulus excited twice as much ipRGCs than “LowMel” stimulus.
For the psychophysical experiment, the luminance range of the glare stimuli measured at eye position was 0-1.7×10⁵ cd/m² for the method of limits and the matching procedure. Two ranges of luminance were proposed for the adjustment procedure (0 to 1.0×10⁵ cd/m² and 0 to 1.4×10⁵ cd/m²). Three luminance levels were proposed for the rating procedure, the paired comparison and the magnitude estimation procedure (1.0×10⁴ cd/m², 5.8×10⁴ cd/m² and 1.4×10⁵ cd/m²). Five luminance levels were proposed for the method of limits (5.0×10³ cd/m², 1.0×10⁴ cd/m², 2.4×10⁴ cd/m², 5.8×10⁴ cd/m² and 1.4×10⁵ cd/m²). For relative procedures, each stimuli were compared as a pair of successive 5-seconds stimuli.
CIE Session 2019 – Abstract Booklet
107
For the physiological experiment, the luminance of glare stimuli measured at eye position was set to 1.5×10⁵ cd/m². To investigate the range of influence of the lighting stimuli on EEG data in comparison with other environmental stimuli, two sound sequences (one peaceful, one annoying) were added to the discomfort glare sequences. A dark ambiance and a fully lit ambiance were also added to measure the range of pupil diameter. In this experiment, each stimulus (presented during three minutes) was separated from the previous one by a reference period (three minutes) where only the background walls were illuminated (reference stimulus).
3. Results
Thirty-seven subjects participated to the first experiment, and eight subjects participated to the second one.
Psychophysical data were analysed with mixed models, leading to conclusions about the discomfort provided by the stimuli (spectral effect) and the effect of other factors (luminance level, range, etc.). Experimental biases were highlighted for some psychophysical procedures (range bias, anchor bias, etc.). Besides, some procedures did not provide the same glare evaluations for repeated stimuli. Based on these results, we advise to use the method of constant stimuli, the paired comparison and the magnitude estimation procedures to study discomfort glare in indoor lighting.
Different analyses were produced from the physiological data: variations in pupil size, variations in heart rate, wavelet analysis for the EEG and EMG data to calculate time-frequency data. The wavelet data were integrated on frequency domains (alpha-band, etc.) or time domains (LowMel stimulus sequence, etc.). Large differences appeared between subjects’ physiological data. While the subjects reported experiencing discomfort glare, none of the physiological measurement devices provided an indicator of its perception. Hence, it seems difficult to obtain discriminant physiological responses when background luminance levels are representative of typical indoor lighting conditions (20 cd/m² in our experiment). Such measurement tools are probably more relevant to study higher discomfort glare perception (lower light ambiance or higher glare light levels).
4. Conclusions
Based on the results, we recommend three psychophysical methods to evaluate discomfort glare at photopic levels: an absolute judgement method and two relative judgment ones. None of the tested physiological measurements produced relevant information about the potential discomfort glare perceived in an indoor lighting environment.
CIE Session 2019 – Abstract Booklet
108
OP44
EFFECTS OF LUMINANCE DISTRIBUTION AND VIEW ON EVALUATION OF DISCOMFORT GLARE FROM WINDOWS
Iwata, T. 1, Ishimura, M.1, Tamura, D.1, Zhai, Y.1, Ishino, R.1 1 Tokai University, Kanagawa, JAPAN
Abstract
1. Motivation, specific objective
Research into the effects and underlying processes of discomfort glare has been on the agenda of lighting and vision researchers for many years. The main variables that affect the experience of discomfort glare have been established. They are the luminance of the glare source, the luminance of the background, the angular size of the glare source, and the relative position of the glare source in relation to an observer’s focal point. However, recent studies suggest that window glare is affected by more parameters than the four main variables. Actually it cannot be denied that indices predicting subjective response to light environment sometimes ignore the psychological and physiological state of occupants. This is because conventional stimuli-response researches have avoided dealing with the other parameters which cannot be measured and expressed in physical quantities. The draft of the CIE TC 3-56 “Assessment of discomfort glare from daylight in buildings” report pointed out that there are not only environmental parameters but also human-related parameters. A view through the windows is one of the parameters which includes both environmental and humanistic factors. The former can be expressed in physical quantities (luminance distribution and power spectral density of glare source) while the latter is more qualitative and includes the subjective meaning or aesthetic value. The objective of this study is to analyse the effects of the view through the window on discomfort glare evaluation.
2. Methods
Two series of subjective experiments were carried out using a 1:3 scale-model with an artificial window illuminated by LED light. In the first experiment, the effect of non-uniformity of luminance distribution on glare evaluation was tested, while in the second experiment, the effect of subjective experience of what the observers see in the windows on glare evaluation was investigated. The solid angle of the window from the subject’s eyes was set to keep 0.44 sr and the average luminance of the artificial window was set to 4000 cd/m2.
In the first experiment, the window was horizontally divided into light and dark bands, the luminance ratios of which were 6000:2000 and 8000:1 respectively. The frequency of light and dark bands was set at four states, 0.03, 0.06, 0.12 and 0.24 cpd. In addition, the windows with uniform luminance and with vertical bands were evaluated, so that eleven different windows were evaluated in total. In the second experiment, the windows with views (buildings, trees and the sky) as well as the window with light and dark bands (no view) were prepared. To make the views, photos of the sky, a building and trees with different proportions were printed on transparent film and attached to the artificial window. The ratio of the luminance was kept consistent at 7000:1000. In total, eight different windows were evaluated in the second experiment.
Twenty students participated as subjects in each series of experiments with the same procedure. The subjects saw the floor of the scale model for thirty seconds. Then they looked at the window and assessed the glare using the Glare Sensation Vote (GSV) scale. Luminance distribution was measured by using a HDR camera system (circular fisheye) and the glare indices, Daylight Glare Probability (DGP), Modified Daylight Glare Index (DGImod), Predicted Glare Sensation Vote (PGSV) etc. were calculated with Evalglare.
3. Results
In the first experiment, DGP ranged from 0.34 to 0.37 and DGImod ranged from 22.8 to 25.8, although the average luminance of the window was kept at the same value. The correlation coefficient between DGP and DGImod was 0.82. The normality test (Kolmozov-Smilnov test) showed that the GSV judged by the subjects for each condition had normal distribution. When the luminance ratio was 8000:1, the window with 0.06 cpd (DGP=0.37) and the window with 0.12 cpd (DGP=0.37) resulted in significantly
CIE Session 2019 – Abstract Booklet
109
higher GSV than the window with uniform luminance (DGP=0.36). The window with 8000:1 of luminance ratio showed 0.37 of DGP and 1.6 of GSV, while the window with 6000:2 of luminance ratio showed 0.34 of DGP and 1.0 of GSV, when the light/dark frequency was 0.06 cpd and 0.12 cpd. Comparing the vertical division and the horizontal division, the vertical division showed higher GSV when the luminance ratio was 6000:2000, while no difference in GSV was found when the luminance ratio was 8000:1.
In the second experiment, DGP ranged from 0.34 to 0.38 and DGImod ranged from 22.1 to 25.4. The correlation coefficient between DGP and DGImod was 0.80. The normality test showed that the GSV judged by the subjects for each condition had normal distribution. There are no significant difference in GSV between the vertical division and the horizontal division and between the non-image window and the windows having views. The window having the view of the sky and a building (DGP=0.34) resulted in significantly higher GSV than the window having the view of the sky and trees (DGP=0.35). The window having the view of the sky, trees and a building (DGP=0.34) resulted in significantly higher GSV than the window having the view of the sky and trees (DGP=0.35).
4. Conclusions
Two series of subjective experiments were conducted using a scale-model with an artificial window.
The first experiment showed that higher contrast within the window resulted in higher discomfort glare evaluation, when the average luminance of the window was the same. When the luminance ratio was 8000:1, the window with moderate frequency of dark-light bands resulted in higher discomfort glare evaluation than the window with uniform luminance. When the contrast is moderate, there is a significant difference in discomfort glare evaluation between vertical division and horizontal division.
The second experiment investigating the effect of view on discomfort glare showed that the window having the view of the sky and a building showed significantly higher discomfort glare evaluation than the window having the view of the sky and trees.
CIE Session 2019 – Abstract Booklet
110
Session PA5-2 D2 - Goniophotometry
Tuesday, June 18, 13:15–15:15
CIE Session 2019 – Abstract Booklet
111

OP45
PRINCIPLE LIMITATIONS OF NEAR-FIELD GONIOPHOTOMETER MEASUREMENTS
Ledig, J., Schrader, C., Sperling, A. Physikalisch-Technische Bundesanstalt (PTB), Bundesallee 100, 38116 Braunschweig, GERMANY
Abstract
1. Motivation, specific objective
The traceable calibration of a goniophotometer requires knowledge about numerous contributions to measurement errors and uncertainties. Near-field goniophotometry also enables an evaluation of the far-field characteristic, e.g. the luminous intensity distribution, with an economic setup which requires less space than a conventional goniophotometer and can be installed in a smaller room.
The optical properties of light sources, e.g. the spatial and angular resolution of its emission generally cannot be comprehensively sampled by a near-field goniophotometer with a single configuration of its Imaging Luminance Measurement Device (ILMD). Therefore, the configuration of a near-field goniophotometer need to be adopted according to the light source to be measured as well as for the intended use of the measurement result. This need to be reported by clear examples.
The description of a light source by ray data is a powerful input for simulations based on ray-tracing. Ray data itself, e.g. as specified in IES TM-25-13, lack information about limitations from the measurement. With respect to the near-field goniophotometer configuration, most of those limitations are known to the operator. The extraction of ray data from the measurement corresponds to a compression of the sampled data and aims a certain ratio of the angular and spatial resolution. However, the optimal ratio also depends on the subsequent application – e.g. the simulation of a projection (headlamp) or illumination of a scene, which requires a higher emphasis on the spatial or angular resolution of the ray data, respectively.
Interpolation in ray data is not possible and sometimes solved by binning ray data into a luminance distribution histogram. However, the resolution of such a histogram is lower than of the ray data. The extraction of ray data by the software typically includes a huge compression. This conversion might not follow the superposition principle, e.g. in case that it yields a fixed number of rays of same luminous flux. Subsequently, a Monte-Carlo based analysis of the algorithms can only give limited information about the uncertainty of ray data.
2. Methods
The original luminance image sequence obtained inside a near-field goniophotometer represents a sampling of the luminance distribution and directly gives the possibility for an interpolation in all dimensions. In addition, integral measures of the light source (e.g. illuminance distribution, luminous intensity distribution or luminous flux) and its uncertainties can be estimated more accurately than from ray data.
If needed, ray data with an arbitrary ratio of the angular and spatial resolution and from a partial region (area and solid angle of emission) can be generated from such a luminance distribution, e.g. efficiently serving a specific simulation task. By tracking the underlaying limitations of the measurement due to sampling or focus position also the reliability of the information carried by the ray data can be judged.
3. Results
The limited optical resolution at off-centred features of the light source due to the depth of focus will be presented by luminance image tilt-series obtained in a commercial type-C near field goniophotometer. Beside the pattern of a multi-chip-on-board (COB) LED also small luminous exitance features with the size of a few pixels are investigated - giving insight to the mechanical adjustment and the focus plane.
Even if compressed to the same number of data points than ray data, e.g. to reduce memory consumption and computation effort for successive algorithms, a luminance distribution presents a higher resolution than a luminance histogram of the corresponding ray data. This will be demonstrated by experimental luminance images and its exemplary compression in comparison to a typical conversion into ray data.
CIE Session 2019 – Abstract Booklet
112

4. Conclusions
The claimed limitations in terms of spatial and angular resolution of a near-field goniophotometer depending on its ILMD configuration are clearly revealed. Both, the limitations of the luminance sampling and its compression, affects the reliability of ray data extracted from the measurement and can affect a subsequent ray-tracing simulation.
The uncertainties of integral measures extracted from sampling the luminance distribution are needed to determine the uncertainty of a scaling factor - which is typically used for normalizing the distribution to an integral measure. If the luminance measurement itself is already traceable calibrated, such a scaling of the luminance distribution sampling by an integral measure may even increase, rather than reduce, the uncertainty of the distribution.
CIE Session 2019 – Abstract Booklet
113
OP46
SPATIAL LIGHT DISTRIBUTION CHARACTERIZATION AND MEASUREMENT OF LED HORTICULTURAL LIGHTS
Qin, X., Wu, D., Pan, W., Pan, J. EVERFINE Corporation, Hangzhou, CHINA
Abstract
1. Motivation, specific objective
LED horticultural lighting develops very rapidly in recent years. It is estimated that the global market of LED horticultural lighting will reach $1.424 billion by 2020, with an average annual growth rate of more than 30%. With the rapid development of LED horticultural lighting technology, the scientific characterization and measurement of spatial light distribution of LED horticultural lights have attracted much attention in recent years.
The measurement under the photon quantum system is more suitable to explain the photosynthesis of plant. Spectroradiometer is usually used for the accurate measurement of photon quantum parameters. In the published Testing and Reporting Requirements for LED-based Horticultural Lighting V1.0 by DesignLights Consortium (DLC) in 2018, photosynthetic photon intensity distribution (PPID) is proposed to characterize the spatial light distribution of horticultural lights and the measurement method refers to IES LM-79. The measurement of PPID makes the comparison among different lamps possible, however, a large difference exists between the measured light distribution and the one in near-field condition in actual application, which has been verified by a series of experiments. Since the measurement of PPID is not applicable to the horticultural lighting condition, how to realize the accurate measurement of photosynthetic photon flux density (PPFD) is more interesting and important.
2. Methods
The near-field goniophotometer based on the imaging luminance measuring device (ILMD) is sometimes adopted for PPFD measurement. With the near-field goniophotometer, the light distribution at specified distance can be derived through the established light ray model. Some tests were carried out by near-field goniophotometer in this paper and some drawbacks of this method appeared. Especially in the measurement of LED horticulture lights with non-uniform spectral radiance distribution, the measurement error measured by the near-field goniophotometer is very large. As the hyperspectroradiometer is unavailable currently, how to measure the LED luminaires with mixing blue and red LEDs is a problem.
To fulfill the measurement requirements above, the goniospectroradiometer can be used based on the near-field measurement method of IES LM-70. The key problem of this method is how to balance the measurement speed and measuring point density as far as possible.
To comprehensively analyze the optical performance of horticultural light, a robotic arm was developed based on traditional far-field goniospectroradiometer. Through the robotic arm, PPFD distribution of the measured horticultural light at arbitrarily specified illuminating distance were obtained and analyzed. Several tests were carried out with different horticultural lights, including HID horticultural lights, white LED horticultural light and the LED luminaire with a mixing design of blue LEDs and red LEDs in this paper. According to the test results, the light distribution differences under far-field and near-field conditions were compared and the PPFD uniformity and spectral uniformity of different types of horticultural lamps under different test distances are also analyzed. The detailed test results will be provided in the full paper.
3. Results
From the test results, the spatial light distributions between far-field measurement condition and near-field measurement condition were very different, especially for the horticultural lights with large dimension or non-uniform spectral distribution. So the measurement of PPFD and the analysis of PPFD uniformity are essential in application. When we measured the horticultural light with a mixing design of red LEDs and blue LEDs, the measurement result in our experiment was much different
CIE Session 2019 – Abstract Booklet
114
from the results in near-goniophotometer case. Because the existing near-goniophotometer does not have the capability of hyperspectral image measurement, it cannot analyze the effect of the non-uniform spectral distribution. The uniformity of spectral distribution in specified application distance should be noticed in the optical design to achieve a better horticultural lighting result..
4. Conclusions
The differences between horticultural lighting and traditional lighting bring many changes in the characterization and measurement technology of LED horticultural lights. For horticultural lighting, the traditional measurement based on far-field goniophotometer and near-field photometer is no longer applied to LED horticultural lights due to many function limits. To comprehensively analyze the optical performance of horticultural lights, a goniospectroradiometer with robotic arm was developed, by which the PPFD at different distance and the PPID can be obtained conveniently and accurately. It is helpful to provide basic data and support for optical design, application and the verification of relevant standards or criteria for horticultural lights.
CIE Session 2019 – Abstract Booklet
115

OP47
COMPARISON OF THE FISHEYE CAMERA METHOD WITH GONIOPHOTOMETERS FOR MEASURING RELATIVE ANGULAR INTENSITY DISTRIBUTIONS OF LIGHT SOURCES
Kokka, A.1, Pulli, T.1, Ferrero, A.2, Dekker, P.3, Thorseth, A.4, Kliment, P.5, Klej, A.6, Gerloff, T.7, Ludwig, K.8, Poikonen, T.9, Ikonen, E.1,9
1 Metrology Research Institute Aalto University, Espoo, FINLAND, 2 CSIC, Instituto de Óptica “Daza de Valdés", Madrid, SPAIN, 3 VSL, Delft, NETHERLANDS, 4 DTU Fotonik, Technical University of
Denmark, Roskilde, DENMARK, 5 Czech Metrology Institute, Prague, CZECH REPUBLIC, 6 Philips Lighting, Eindhoven, NETHERLANDS, 7 Physikalisch-Technische Bundesanstalt, Braunschweig, GERMANY, 8 OSRAM, Augsburg, GERMANY, 9 VTT Technical Research Centre of Finland Ltd,
Espoo, FINLAND
Abstract
1. Motivation, specific objective
Angular intensity distributions of light sources are traditionally measured using goniophotometers. Usually, goniophotometers are expensive to obtain and resource intensive to operate, due to requirements of a dedicated laboratory and the time consuming nature of the measurements.
In addition to other applications, such as lighting design, angular intensity distribution data are used for spatial corrections to increase accuracy of luminous flux measurements with integrating spheres. Because goniometric measurements are so laborious, many laboratories omit the spatial correction altogether, increasing their measurement uncertainty by up to a few percent, depending on the integrating sphere and the light source under test.
Previously, the fisheye camera method was developed to enable faster and more cost-effective measurements of angular intensity distributions of light sources. Using the fisheye camera method, such angular distribution is obtained in a matter of seconds from a fisheye camera image captured through a port of an integrating sphere, while the sphere is illuminated by the lamp under test. The method was reported in CIE 2017 Midterm Meeting in Jeju, where doubts were presented about the wide applicability of the method and its comparability with traditional goniophotometers.
In this study, the performance of the method is confirmed. The fisheye camera method is validated by measuring six LED lamps in eight integrating spheres of various configurations, and by comparing the obtained angular data with that measured using five goniophotometers of different types.
2. Methods
In the fisheye camera method, after capturing an image of the lamp under test, the image is processed to diminish the impact of the imaging hardware and integrating sphere imperfections, including the structural elements of the sphere, such as port baffles and non-uniform coating. This processed image and the intrinsic parameters of the camera are then used to map the intensity values of the processed image to the three-dimensional coordinates on the sphere surface. After subtracting the diffuse light level signal, the remaining intensity value of each point in the sphere reconstruction is proportional to the luminous intensity of the lamp in the direction of that point.
The integrating spheres used in the study ranged in diameter from 1.5 m to 4.0 m. The coating reflectance of the spheres ranged from 80% to 98%. The angular data obtained using the fisheye camera method was compared with the data measured using five goniophotometers. For the study, two near-field, two far-field, and a robot goniophotometer were employed. The closeness scores, which range from 0 to 100 and describe the similarity of any two distributions (0 total mismatch, 100 perfect match), were calculated for all the camera-obtained data and the respective data of each goniophotometer. To see the deviations between the goniophotometers, the closeness scores were also calculated for each goniophotometer dataset in comparison with the datasets of the other four goniophotometers.
The effect of the deviations in the angular distributions obtained using the two methods on the spatial correction factors was tested by using the spatial responsivity map, or spatial responsivity distribution function (SRDF), of one of the spheres.
CIE Session 2019 – Abstract Booklet
116
3. Results
On average, the closeness scores for angular intensity distributions measured using the fisheye camera method were 94.6 when compared with the goniometric data. The average closeness score when comparing each goniophotometer dataset with the results of the other four goniophotometers was 96.6. The range of the average closeness scores for the fisheye camera method in the eight integrating spheres was from 92.1 to 96.2. The mean closeness scores for the goniophotometrically obtained data ranged from 96.0 to 97.0 when compared with the other four goniophotometers.
The main discrepancies between the results stemmed from two integrating spheres, which had large, view-obstructing elements in front of the camera. The mean closeness scores for those spheres were 92.1 and 93.2. The two spheres were particularly problematic when measuring lamps which were not rotationally uniform about their optical axis, as the data missing from the view of the camera could not be replaced using values from the unobstructed azimuth angles of the sphere.
When calculating spatial correction factors using the distributions obtained with the fisheye camera method and the five goniophotometers, the average difference between the methods was 0.05%.
4. Conclusions
The fisheye camera method for quick and cost-effective angular intensity distribution measurements was validated by measuring the angular distributions of six LED lamps in eight integrating spheres. The results were then compared with those obtained using five goniophotometers. The average closeness score calculated for the fisheye camera method when comparing with the respective goniophotometric data was 94.6. The mean closeness score cross-calculated for the five goniophotometers was 96.6. The most significant sources of uncertainty for the fisheye camera method are large sphere elements close to the camera port.
When combined with the spatial responsivity map of the integrating sphere, the method is an easy and a convenient way to decrease measurement uncertainty caused by the spatial non-uniformity of the integrating sphere.
CIE Session 2019 – Abstract Booklet
117

Session PA6-1 D3 - Daylight 2
Tuesday, June 18, 15:40–16:40
CIE Session 2019 – Abstract Booklet
118
OP48
ONE YEAR OF USE OF A LIGHT DOSIMETER
Dumortier, D. 1, Gronfier, C.2 1 University of Lyon, ENTPE, LGCB, Vaulx-en-Velin, FRANCE
2 Inserm U1028, CRNL, Lyon, FRANCE
Abstract
1. Motivation, specific objective
There is now strong scientific evidence that light influences our health and well-being. This evidence is based mostly on laboratory studies exposing subjects to specific light and measuring their physiological reaction. Aside from laboratory studies, other studies have looked at our real life exposure to light and its influence on circadian rhythms, noticeably the sleep/wake rhythm. For practical reasons, their investigation had to be limited to one or two weeks. So their characterization of subjects’ activity patterns and exposure to light was only representative of a specific time in the year. Human circadian rhythms are not only diurnal but also seasonal. Our exposure to daylight indoor or outdoor depends on the season. Our outdoor activities vary with the time of the year. This results in seasonal sleep/wake patterns. In order to fully understand the influence of light on our health, our exposure to light and activity should be characterized over an entire year to take into account seasonal variations.
With this in mind, the objectives of our study were to (1) test the practical use a light dosimeter during an entire year; (2) collect one year of exposure to light and day/night activity; (3) characterize the diurnal and seasonal patterns in the data collected.
2. Methods
For collecting the data, we used the dosimeter developed in the framework of the EUClock European project. The dosimeter measures light with 5 photodiodes: UV (from 280 to 370 nm; peak at 350 nm), Blue (from 380 to 540 nm, peak at 470 nm), Green (from 460 to 620 nm, peak at 540 nm), Red (from 580 to 760 nm, peak at 610 nm), and IR (700 nm to 1200 nm, peak at 860 nm). All photodiodes are located behind a Teflon diffuser. We calibrated light measurements from the dosimeter against a reference spectrometer under spectra from an incandescent lamp and various outdoor daylight conditions. The signals from the 5 photodiodes were used in a linear combination to approximate photopic and melanopic illuminances. The EUClock dosimeter also measures temperature with a thermistor, and activity with a 3 axis accelerometer. The time variations of the 3 accelerometer values were used to compute an activity index (root mean square of the variations on the 3 axis).
The dosimeter has the size of a USB key. We wore it day and night for an entire year (January to January). During the day, it was worn on an eyeglass frame in the plane of the right eye. At bedtime, once ready to sleep, it was inserted in a band and worn on the wrist until leaving the bed.
The dosimeter was not worn during showers and when charging and collecting data. Its battery lasting a bit more than 5 days, we chose to measure and store light, activity and temperature every 10 s, in order to reach the maximum storage capacity at about the same time. So every 5 days, in the evening, at a time of little activity and exposure to light (watching TV), it was set to full charge and its data transferred to a computer. Charging time lasted an hour and a half, the dosimeter was then ready for a 5 day acquisition right before bedtime.
To help in understanding the measurements, we recorded our daily activities in a diary. We used activity keywords such as: Wake up and breakfast, Shower, Drive to work, Work in office, Adjust shades, Turn on light, Go to gymnasium, Dinner at home, Watch TV, Go to bed… indicating a start time and an end time for each activity. On average, every day was documented with 10 to 20 activities.
3. Results
Regarding its practical use, the dosimeter was light (~15 g) so at the end of the day, we were not tired of wearing it on the eyeglass frame. During the first weeks, we were wondering whether it would attract the attention of people at work, in the street, in shops… Not much in fact, since people are used to Bluetooth headsets which have about the same size and are also worn close to the ear. We
CIE Session 2019 – Abstract Booklet
119

had to collect measurements at least every 5 days, it would have been simpler if the dosimeter had automatically transferred them on a server through a Bluetooth connection to a smartphone. However, we only lost two days of data in the whole year and this was due to an insufficiently charged battery.
Regarding the analysis of the data, we computed one minute averages from the 10 s measurements. To visualize in one shot, the annual variations of each measurement, we designed a plot where pixels are coloured according to the value of the minute data and positioned according to the day of the year (x) and the minute of the day (y). We used our diary to produce statistics on the activity index and on photopic and melanopic illuminances for all major activities. For “Work in office”, the photopic illuminance (in the plane of the eye) never exceeded 200 lux and was below 100 lux 80% of the time. From “Go to bed” to “Wake up and breakfast”, the activity index was used to compute sleep efficiency which varied from 85% in the winter to 80% in the summer. The analysis is still going on, looking for rhythmicity in the measurements.
4. Conclusions
This study has helped us in designing a new dosimeter better suited for long term use. It will come with communication capabilities for a regular transfer of the measurements in the cloud. It will come with a set of replaceable batteries to avoid energy shortage. Its spectral resolution (on the visible) will
be improved to compute any -opic irradiances and identify light sources. The combination of UV, visible spectrum, IR, temperature and activity measurements should provide enough information to avoid the need of a diary.
CIE Session 2019 – Abstract Booklet
120

OP49
A DATA-DRIVEN COLORIMETRIC ANALYSIS OF CIE STANDARD GENERAL SKIES
Diakite, A.K. 1, Knoop, M.1 1 Technische Universität Berlin, Chair of Lighting Technology, Berlin, GERMANY
Abstract
1. Motivation, specific objective
Daylight plays a crucial role in many applications. The spatio-temporal variability of its intensity and colour is critical for smart, healthy and energy efficient daylighting strategies to enhance the visual, energetic and non-image forming aspects. While there is a substantial amount of papers published in recent years on the non-uniformity of the photometric attributes of the sky, relatively little appears to be written on its colorimetric distribution. In the light of the increasing significance of the non-image forming effects, it has become all the more important to characterize the spatial colorimetric variance of daylight appropriately.
This study addresses the colorimetric behaviour of daylight. It aims to contextualize the colorimetric characteristics within the framework of the CIE Standard Skies classified by CIE S 011/E:2003. The goal thereby is threefold: (i) to understand the temporal and spatial variance of the correlated colour temperature (CCT); (ii) to estimate the colorimetric behaviour of the CIE Standard Skies; (iii) to indicate what possible implication the colorimetric variance might have on the spectral daylight characteristics on façades.
2. Methods
The study draws upon spatially and temporally resolved spectral power distribution measurements, collected over a period of two years. A set of over 30 million CCTs derived from these measurements is used to analyse the colorimetric behaviour of daylight.
Experimental set-up
The spatially and temporally resolved spectral daylight measurements have been carried out with a spectral sky scanner. The adopted maximum time frame for each measurement was set to one minute. The subdivision of the sky hemisphere resulted in 145 sky patches. The spectral irradiance was measured within an aperture angle of 10°, for a bandwidth of 280 – 980 nm. For the analysis the bandwidth of 380 – 780 nm was used. The measurements were carried out every second minute. The CCTs and luminance were subsequently derived from the SPD measurements. The CIE sky types were established based on the use of gradation and indicatrix groups.
Colorimetric analysis
The colorimetric analysis employed in this study comprises: (i) CCT frequency distribution of occurence; (ii) CCT ranges; (iii) CCT variance depending on the sun almucantar; all corresponding to the fifteen CIE Standard Skies. The analysis uses the inverse CCT (in reciprocal megaKelvins) in 5 MK-1 intervals, ranging from 0 – 250 MK-1. The last part of the analysis illustrates the practical application of the results in the urban structure. The statistical analysis encompasses two exemplary spectral potential daylight diagrams (SDPDs) to highlight the colorimetric range on vertical planes in the urban structure depending on prevailing sky conditions and building orientation in 1° resolution.
3. Results
The key findings of the study are represented in a graphical summary of the CCT occurrence and CCT variance as well as a tabular summary of the CCT ranges corresponding to the fifteen CIE Standard Skies. The results for the SDPDs confirm a uniform CCT potential for an overcast sky but show an orientation dependent potential for clear and intermediate skies.
4. Conclusions
This paper offers a data-driven analysis of colorimetric characteristics of daylight in correspondence with standardized luminance sky types. The characteristic CCTs were studied based on long-term measurements and the practical application of the analysis in the urban context was addressed. The
CIE Session 2019 – Abstract Booklet
121

findings show the colorimetric discrepancy both between and within sky types and support the key arguments against a fixed correlated colour temperature for all sky types. This study encompasses a CCT analysis from spectral sky measurement to colorimetric façade assessment.
CIE Session 2019 – Abstract Booklet
122
OP50
USING RADIANCE TO ESTIMATE TRANSMITTED SOLAR RADIATION ENERGY FOR THIN AND THICK PERFORATED SCREENS
Chi, D.A.1, Brembilla, E.2 1 Department of Architecture, Universidad de las Américas Puebla, MEXICO, 2 School of Civil and
Building Engineering, Loughborough University, UNITED KINGDOM
Abstract
1. Motivation, specific objective
Solar design can take many different forms with different goals, ranging from acquiring aesthetic criteria to assessing daylighting and solar protection for buildings. Recent developments in computer-aided design programs have enabled architects to explore complex geometries for building envelopes. Design methodologies and tools to accurately and time efficiently simulate the daylight and energy performance of complex shading systems are needed, since they can greatly influence design decisions. Climate-based daylight simulations should be run in synergy with energy calculations to find a balance between achieving well-daylit spaces and limiting solar gains.
Yet, the current simulation tools are not capable of providing accurate results for both daylighting and energy performance simultaneously, especially when complex geometries are present. Radiance is a validated backward ray-tracer capable of simulating complex geometries. It has been shown that rtrace-based methods can accurately represent the geometrical feature/pattern of light through the perforated screen (PS). Conversely, Radiance climate-based methods that use a BSDF material can lose the definition of the fenestration system’s shape completely. EnergyPlus has been validated thoroughly for assessing the energy performance of conventional building systems and is one of the most accessible professional energy simulation engines available. However, at this moment there is no way to represent complex geometries within its energy calculation engine. Moreover, EnergyPlus uses a simplified method to account for light redirection, once again not appropriate for complex spaces and facades.
To overcome the simulation tools’ limitations, few methods to integrate various software packages were proposed. For thick shading systems, one method consisted of sharing annual shading schedules between Radiance and EnergyPlus. Here, shading coefficients (SC) were generated with Radiance to analyze the dual performance of three-dimensional complex shading systems that have the capability to both shade and redirect daylight into interior space.
Flat screens characterized by different perforation ratios remain a challenging simulation task for EnergyPlus. This work aims to investigate if SC could be applied to evaluate the performance of thin screens, and it compares the results to those obtained through other methods, such as the use of Bidirectional Scattering Distribution Functions (BSDF). This paper also analyzes if annual shading schedules can represent the variability of transmitted solar radiation for different complex shading screens when calculating solar loads and lighting energy consumption in EnergyPlus.
2. Methods
The case study is an office space with a PS placed in front of a fully glazed façade oriented towards South. The effects of varying the screen thickness, the perforation percentage (ratio of the total surface of the openings to the total surface screen) and the spacing between sensor points were investigated. SC were generated from the ratio of the solar irradiation with solar protection in place to that without solar protection. Radiance was used to calculate the solar irradiation falling on a vertical plane placed between the glazed façade and the PS, for each daylit hour in a year. The climate file for Seville, Spain, was considered. Then, histograms of the frequency distribution of all the sensors where the global irradiance (direct+indirect) was recorded, were constructed. All data were grouped in bins to estimate the proportion of cases that fall into specific ranges of global irradiances that primarily represent shadowed or lighted areas. To further illustrate the difference in the distribution of global irradiances during summer and winter, specific instances were chosen: June 22nd and December 22nd, both at 9, 13 and 17h.
CIE Session 2019 – Abstract Booklet
123
3. Results
One of the configurations examined was a PS with a 37.5% perforation percentage and 5mm thickness. Such system was characterised by SC of 39% for the winter day and 43% for the summer day. Distribution of hourly irradiance data showed that indirect reflections happen more frequently during mornings and afternoons, particularly during summer. This is due to sunlight rays passing in between the glazing and the PS plane, and rays being reflected between the two surfaces for lower sun angles. A similar effect was also noticeable in the simulation using BSDF to represent the PS.
The resulting SC schedule was inserted in an EnergyPlus simulation. The comparison between the SC method and the EnergyPlus standard method showed that the inter-reflections that were considered via the SC played a significant role in the energy annual results, both in terms of solar loads and in terms of energy consumption for lighting systems.
4. Conclusions
The study analysed the daylight and energy performance of a space with a PS shading device in place, making use of SC schedules to couple accurate simulation tools. The analysis presented in this work is becoming increasingly relevant, as building facade design evolves towards complex and adaptive systems. Accurate simulation methods that account for both daylight and energy performance are necessary for a holistic assessment of indoor comfort.
More specifically, this work showed the importance of accounting for inter-reflections when simulating PS shading devices, for both thin and thick systems. The SC method was instrumental to combine lighting and energy simulations, coupling Radiance and EnergyPlus results. Alternative methods to account for such inter-reflections were also explored and found to lead to similar conclusions.
CIE Session 2019 – Abstract Booklet
124
Session PA6-2 D2 - LED Characterization
Tuesday, June 18, 15:40–16:40
CIE Session 2019 – Abstract Booklet
125

OP51
FAILING MECHANISMS OF LED LAMPS
Baumgartner, H.1, Vaskuri, A.1, Kärhä, P. 1, Ikonen, E.1,2 1 Aalto University, Espoo, FINLAND,
2 VTT Technical Research Centre of Finland Ltd., Espoo, FINLAND
Abstract
1. Motivation, specific objective
Solid state lighting based on light-emitting diodes (LEDs) has substituted incandescent light sources in most applications in recent years. The expected lifetime of LED lamps is typically more than 25 000 hours, corresponding to 2.85 years of continuous operation. Natural aging of LED lamps over such a long period is time consuming and thus little objective scientific research has been published on the real lifetimes of LED lamps. We show the aging results and the corresponding derived lifetimes of five different types of LED lamps aged continuously at typical room conditions since 2011. To obtain statistical data, the aging study included four specimens of each lamp type. The results of this aging study are significant and unique since to the authors’ knowledge, studies of LED lamps with over 7 years of aging in normal operating conditions have not been published before.
2. Methods
Four samples of five different types of commercial LED lamps from two manufacturers have been aged at room temperature for over 62 000 hours. The lamps have been measured periodically using a 1.65 m integrating sphere system for luminous flux, spectral radiant flux, and electrical quantities every few months. Illuminating Engineering Society of North America (IES) has defined the lifetime of LED lamps by lumen maintenance, and the lamp is at the end of its lifetime when the luminous flux has decreased to 70% of its initial value. The decrease of the luminous flux is expected to follow an exponential curve, which can be used to project the lifetime of the lamp. Due to our long aging period exceeding the expected lifetimes of the lamps, we can now analyse the reliability of the lifetime projection methods. Some of our sample lamps have already broken down during the aging. We have analysed the failing mechanisms of the broken lamps by disassembling them and examining the LEDs and their driving electronics.
3. Results
The lifetimes for the studied lamps specified by the manufacturers are between 25 000 hours and 35 000 hours. By June 2019 our aging period has exceeded 70 000 hours, which is more than double the expected lifetime of the lamps. According to the aging results, all lamps exceeded the lifetime predictions specified by the manufacturer. The luminous flux level of the lamp specimens aging fastest went below the 70% lifetime limit after 32 000 hours of continuous operation. After 40 000 hours of operation, the first lamps started to break and after 62 000 hours, a total of 12 lamps out of the initial 20 had broken or the luminous flux has decreased below 70 %.
The decrease of the luminous flux followed the exponential decay from the beginning of their operation with three lamp types out of five. The lifetime of these lamps was projected using an exponential lifetime projection method defined by the IES. With the other two lamps types, the luminous flux increased at the beginning and stayed above the initial value for the first 10 000 hours. According to aging results, the exponential curve fit can give only a rough estimate for the lifetime. When the operating times of the lamps approached the expected lifetimes, damages in the LEDs and the electronics started dominating the lifetimes.
The failing mechanisms of the broken lamps were studied by disassembling the housings and examining the LEDs and their driving electronics. In cases when the lamp broke, the reason for the failures was the failing of the driving electronics. Typically, the electronics failed due to damage of an electrolytic capacitor leading to overheating of power transistors and other components on the circuit board.
Two of the lamps where the electronics had not failed, but only the luminous flux had decreased, were opened and examined as well. Severe physical damages were noticed in the white LEDs. The
CIE Session 2019 – Abstract Booklet
126
luminophore coatings of the LEDs had become translucent with brownish shade. The physical damages are most probably caused by the high junction temperatures that heat the surrounding luminophore coating and the LED package. In addition to the visible physical damage in the luminophore coating and the LED package, the electrical properties of some white LEDs had changed as well. Severe leakage currents were measured in some broken white LEDs.
4. Conclusions
We have aged 20 specimens of different types of LED lamps at normal operating conditions and analysed their aging and breaking mechanisms. The determined lifetimes of the 20 lamp specimens studied exceed the expected lifetimes specified by the manufacturers. At the beginning of the aging, the luminous flux of the lamps decreased systematically or stayed constant. When the aging times exceeded 40 000 hours, lamps started to fail due to failures in the driving electronics. Some physical damage was also caused to the LEDs by the high junction temperatures of the LED chips.
CIE Session 2019 – Abstract Booklet
127
OP52
FROM MEASUREMENTS TO STANDARDISED MULTI-DOMAIN COMPACT MODELS OF LEDS USING LED E-DATASHEETS
Martin, G.1, Kleij, A.1, Onushkin, G.1, Poppe, A.2, 3, Farkas, G.3, Rencz, M.3, Bornoff, R4., Marty, C.5, Vaumorin, E.6
1 Signify (ex-Philips Lighting), THE NETHERLANDS, 2 Budapest University of Technology and Economics, HUNGARY, 3 Mentor, a Siemens business (ex Mentor Graphics), HUNGARY, 4 Mentor, a
Siemens business (ex Mentor Graphics), UNITED KINGDOM, 5 Ingelux, FRANCE, 6 Magillem, FRANCE
Abstract
1. Motivation, specific objective
In a recent H2020 European wide research project extensive study for generating multi-domain (optical, thermal, electrical) compact LED models based on measurement data was concluded. The study covers the most common range of LED families and takes into account the needs from a luminaire design perspective. The project outcome contains: 1) proposing a generic measurement protocol and set of measurements considering the range of LED types available on the market, 2) proposing a method for creation of compact models of LEDs [both on die and package levels], 3) variability analysis, 4) a proposal of an LED e-datasheet.
This abstract describes shortly the design flow, the measurement protocol (thermal, optical, electrical) and selected key parameters, the technical background of the compact model creation.
2. Methods
Luminaire maker around the world need proper LED data for designing reliable and robust luminaires in its all functioning range. Currently, designs are made either using the data provided from the datasheet or using internal company reverse engineering measured data. LEDs are now commodity and having a uniform set of data is not anymore sufficient for design purposes. The paper will present the key parameters required for a robust and reliable luminaire design, the standard test to carry out to obtain LED characteristics that provide the sufficient amount of information needed to set up appropriate models, the ultimate multi-domain compact model (MDcM) of LED packages, and a proposal for standardising data reporting in the form of e-datasheet that can link measurements and modelling.
3. Results: Design Flow, characterisation standards, test data reporting
The primary step in creating LED compact models is the measurement data collection on a physical device. In principle thermal transient measurements are needed to capture all possible thermal
properties of the junction-to-pad heat-flow paths of the LED packages and isothermal* electrical and light outputs characteristics (IVL characteristics). Our recommendation is that absolute spectral power distributions should be measured at such a combination of IF applied steady forward currents and TJ junction temperatures that cover the critical regions of the LED’s quantum efficiency surface spanning over the IF-TJ plane, including the peak efficiency, and sufficiently wide regions of the high current and low current regimes. For an automated model parameter extraction procedure the collected data should be organized and provided in a machine readable format, that we call e-datasheet which is the foundation of an accurate LED compact model destined to product design. In the context of an Industry 4.0 approach this e-datasheet is the starting point of creating the digital twins of the physical devices.
Physical characterisation LED packages are performed according to JEDEC JESD 51-51, 51-52, JEDEC51-14 standards, considering junction temperature setting and total flux measurement recommendations of the CIE 225:2017 document. In addition to these measurement standards and
* Isothermal in terms of the TJ junction temperature.
CIE Session 2019 – Abstract Booklet
128

recommendations, sets of measurements are defined representing the relevant operating domains of the LED, as mentioned above. A fast measurement protocol is proposed to obtain accurate enough measurement data in a semi-automated way: the best approach is to have a combined thermal transient and radiometric/photometric measurement simultaneously.
The compact model creation is a dual approach at die level and package level. The resulting multi-domain LED compact model can either be used in a Spice-type circuit simulator, with commercially available CFD simulation tools and the multi-domain chip level LED model has also been implemented in spread-sheet based application as quick “luminaire design calculator” tool supporting initial sizing and design option selection. The modelling approach was tested with the design of a new luminaire. The savings in terms of time of development, costs of measurements, and improvement of efficiency of the final product were assessed, compared with a traditional way of designing the same product. Different final users were involved in this demonstration: SMEs as well as big companies.
In our studies different LED families were characterised at targeted TJ-s between 25 C up to 110 C and in wide a range of forward currents, from the mA range up to maximum (e.g. to 1 A). On the contrary to most LED datasheet, a large amount of data is required to represent the full operating space of the LEDs. A minimal number of characterization points is determined by the requirements from model extraction procedure to which measurements will serve as input. Besides, it is important to keep a reasonable balance between accuracy, flexibility and complexity for LED MDcM, then a limited set of characterization results will be sufficient for a successful model extraction.
To link test and measurements, e-data sheets are proposed. Following the already established standards of the electronics industry for data exchange among electronic design automation tools (see the recent JEDEC JESP 30 standard), an XML schema based approach is suggested. Such a format allows communicating scalar-like quantities such as total flux values, function-like properties such as
spectral power distributions or package Zth curves, and matrix like properties like e(IF, TJ) or VF(IF, TJ) surfaces in properly structured (tabulated) way, both in a machine and human readable format, close to the present file formats of test equipment manufacturers.
In modelling, variability of model parameters and selection of the nominal device characteristics of a given LED population is an important question, which was also covered in our project. This topic extends the limits of this paper therefore it is discussed in a separate publication.
4. Conclusions
In the context of Industry 4.0, a new design flow is proposed. The LED MDcM is key to a robust luminaire design. It is extracted from a defined set of measurement data and simulation, reported in an E-datasheet.
CIE Session 2019 – Abstract Booklet
129

OP53
MULTI-DOMAIN CHARACTERIZATION OF COB LEDS
Hegedüs, J.1, Hantos, G.1, Németh, M1, Pohl, L.1, Kohári, Zs.1, Poppe, A.1 1 Budapest University of Technology and Economics, Department of Electron Devices, Budapest,
HUNGARY
Abstract
In a recent European H2020 project on LED characterisation and modelling the major target was to represent physical LED package types by their digital twins in form of multi-domain compact models. In this project a specific task was devoted to CoB LEDs. Phosphor converted white CoB LEDs are large area devices on high thermal conductivity ceramic substrate, with a few dozens of LED chips mounted, covered by a phosphor layer. Such devices represent real technical challenges both in terms of their physical measurement and modelling. In this paper we report on our work regarding measurement and modelling of such devices performed in the context of the aforementioned project.
1. Motivation, specific objective
Besides the characterisation and multi-domain modelling of single chip LED packages, our H2020 European R&D project also addresses CoB (chip on board) LEDs. CoB LEDs are large area devices, containing an LED array with series only or with combined series/parallel electrical configuration, covered by phosphor. The electrical operation of the assembled blue LED chips can be represented by so called Spice-like multi-domain compact models, but the thermal effects of the phosphor and the ceramics substrate need to be represented by a 3D detailed model (so called distributed parameter model). Currently we are working on a combined compact/distributed modelling approach that allows correct simulation of CoB LEDs. Key to this work are different properties of the substrate and phosphor layers.
There are several issues to cover. First, when the properties of a CoB LED are measured in compliance with the latest available measurement standards and recommendations (such as JEDEC’s JESD51-5x series of LED thermal testing standards and CIE’s 225:2017 technical report), we obtain the so called ensemble characteristics’ of the array of LED chips within the CoB package†. A major question is how such ensemble characteristics (total radiant/luminous flux of the CoB device, overall forward voltage, overall thermal resistance) are related to the characteristics of the individual LED chips.
Another important question is how exactly the conversion efficiency of the phosphor depends on its temperature; what is the thermal conductivity and the volumetric thermal capacitance of the materials used in a CoB device. Some of the thermal properties can be inferred from thermal transient measurements, but measurement of the temperature dependence of the conversion efficiency of the phosphor layer (a composite of the phosphor itself and an organic matrix) is not straightforward.
2. Methods
In our laboratory we have an integrating sphere with to DUT ports opposite to each other on the equator, both equipped with a temperature controlled mounting stage. This allows us measuring the secondary light emission of different phosphor layer samples under well controlled thermal conditions, while on the temperature controlled mounting stage of the second DUT port of the sphere we can operate blue LEDs, also under well-defined operating conditions. To improve the signal level for the measurement for the secondary emission by the phosphor sample, the light of the blue LED sources is focused to the DUT port area where the phosphor sample is mounted. Multiple measurements are made to account for the self-absorption spectra of the devices inserted into the integrating sphere. The final outcome of these measurements is the temperature dependence of conversion efficiency of the phosphor samples. Such efficiency measurements were performed with large area, circular phosphor
† Regarding the definition of ‘ensamble characteristics’ of arrays of LED junctions refer to the JEDEC JESD 51 -51 standard.
CIE Session 2019 – Abstract Booklet
130

patches that we prepared at our Department. Actual un-powered CoB LEDs were also measured in this test setup. In the planned final paper we intend to focus on these measurement results.
Comparison of individual LED characteristics and ensemble characteristics LED arrays (such as a CoB device) were done by building an artificial LED array from single, previously characterised LED packages such that the individual forward voltage-temperature characteristics could also be measured in the array. This information combined with the statistical analysis of the variation of the different LEDs from the same binning class (published in another paper) leads to building a fairly accurate multi-domain compact model of the array of blue chips within a CoB device. Parameters of this model are extracted from the measured ensemble characteristics and from the typical distribution of the parameters of the multi-domain LED models. Such results will also be included in the planned paper.
The phosphor’s absorption and conversion of the blue light of the LED chips into heat and secondary light emission is described by a detailed model and is built into our in-house thermal simulation program available for us in source code (that has already been successfully adapted to the multi-domain simulation of large area OLED panels). The detailed thermal model of the substrate, the LED dies and their die attach layer are also represented in the simulation model of the CoB device aimed for our in-house solver, combined with the compact (lumped) multi-domain model of the blue LED chips.
3. Results and conclusions
On one hand, we obtained information on the nature of the temperature dependence of phosphors applied for wavelength conversion in blue pumped LEDs. On the other hand, we established the relationship between the measurable ensemble characteristics of LED devices containing arrays of individual LED junctions or LED chips. Considering also the typical variances of the parameters of multi-domain models of blue LED chips one can set up a combined compact and distributed multi-domain model for CoB LEDs. This methodology is applicable to any CoB device, provided that thermal properties of the materials (LED chip, die attach layer, ceramics substrate, phosphor layer) are known. Such a combined model
CIE Session 2019 – Abstract Booklet
131
Session PA7-1 D3 - Interior Lighting 1
Wednesday, June 19, 09:20–10:20
CIE Session 2019 – Abstract Booklet
132
OP54
A NEW METHOD FOR EVALUATING THE VISUAL ENVIRONMENT
Hillevi Hemphälä1, Camilla Zetterberg1,2, Per Lindberg2, Marina Heiden2, Per Nylén3 1 Division for Ergonomics and Aerosol Technologies, Design Sciences, Lund University, Lund,
SWEDEN 2 Centre for Musculoskeletal Research, University of Gävle, SWEDEN
3 Swedish Work Environment Authority, Stockholm, SWEDEN
VERAM, Visual Ergonomics Risk Analysis Method, is a valid, reliable, practical and easy to use risk assessment method for evaluating the visual environment. With this method, the risk factors in the visual environment is detected and interventions implemented to reduce the occurrence of symptoms related to poor ergonomics among workers can be evaluated.
The visual environment can affect our wellbeing in many ways. Glare from luminaries or windows within the visual field can cause disability glare and/or discomfort glare. Glare while performing tasks on the computer causes visual fatigue and leads to strabismus measured by fixation disparity (more difficult for the eyes to focus). Strabismus leads to eyestrain and eyestrain can lead to musculoskeletal disorders. Non-visual effects, such as flickering lights can cause eyestrain or headaches/migraines. Insufficient visual ability can lead to increased workload and contribute to eyestrain and musculoskeletal disorders, which in turn can lead to sick leave. As humans, we need daylight to get a normal circadian rhythm. The visual environment must be designed to allow natural light coming in, but have the ability to prevent disturbing light.
The risk assessment method was developed in collaboration with researchers and practitioners in ergonomics, and tested by practitioners before being finalized. Forty-six trained evaluators, employees from occupational health departments, used the method to perform 224 workplace evaluations. VERAM version contains a questionnaire for the worker, an objective evaluation form for the evaluator, a section of follow-up questions based on the worker’s responses, and a section for recommended changes, including an overall risk assessment with respect to daylight, lighting, illuminance, glare, flicker, workspace, work object and work postures, respectively. Each factor was divided into no risk (green), risk (yellow) and high risk (red).
The results showed several strong connections between the assessment made by the trained evaluators and the individual workers perception of lighting conditions, such as the general lighting and glare. The main finding was regarding the risk for glare. The evaluators noticed more risks than the individual worker did. According to the objective evaluation form glare was present at about 60 % of the workplaces (40 % yellow and 20 % red). While the individual rating of the glare (too strong luminaires) was at about 30 % (20 % yellow and 10 % red). The objective risk for glare also corresponded with the subjective rating of eyestrain and neck pain, if there was an objective risk for glare present the eyestrain and neck pain increased. No correlation between the subjective risk for glare and eyestrain/neck pain was found. The higher risk for neck pain and eyestrain when exposed to glare can cause sick leave, and an increased cost for the individual both for lower income but also the increase of the suffering the strain and pain from the eyes and neck gives.
The general knowledge concerning the visual environment and how a good lighting situation should be designed is rather low. The risk for glare is higher when a trained evaluator is rating it. To increase occupational health and reducing sick leave, a good visual environment is required. This includes sufficient illuminance, a good luminance ratio, no glare from luminaires or windows, no flicker, and a good visibility of the task. Education in risk analysis of the visual environment is essential for many different occupations such as lighting designers, ergonomists, working life inspectors, optometrists, to ensure a better understanding of the impact on wellbeing that the visual environment have.
CIE Session 2019 – Abstract Booklet
133
OP55
A COMMUNICATION TOOL FOR VISUAL EXPERIENCE OF LIGHT
Enger, J.1, Boork, M.2 , Wendin, K.3,4 Laike, T.1 Fridell Anter, K.1 1 Lund University, Environmental Psychology, Lund, SWEDEN, 2 RISE Research Institutes of Sweden,
Uppsala, SWEDEN, 3 Kristianstad University, Faculty of Natural Sciences, Kristianstad, SWEDEN, 4 University of Copenhagen, Faculty of Science, Copenhagen, DENMARK
Abstract
1. Motivation, specific objective
Knowledge of how light affects humans at different levels is constantly increasing, and not least the interest in the biological effects of light. At the same time, the development of technology will soon create infinite possibilities for artificial light. Existing quality measurements and lighting planning standards are continuously updated, but are limited in that they are designed primarily to provide visual comfort expressed in photometric values. These two factors, visual comfort and the effect of light on biological functions are not sufficient to describe light quality. A more holistic definition of light quality also needs to include perceived qualities including sensory and emotional values.
Both in the building process and among users, the knowledge of light is generally quite low. And there are no established definitions or common concepts for the perceived qualities of the light. It makes it difficult to communicate about different options for lighting solutions and agree on specifications for perceived values, both for light environments, luminaires and light sources. In too many cases, the result becomes an oversized standard solution, which means unnecessarily high energy consumption and unnecessarily low well-being.
In order to facilitate communication about the perceived values of the light, the research project has developed a prototype for a web-based communication tool that can assist in lighting design, procurement and evaluation of light environments and lighting products.
2. Methods
The project is carried out by a multidisciplinary research team from three different research institutions representing scientific disciplines such as sensory analysis, environmental psychology, light research and colour research. Repeated studies with various test designs including subject assessments has been carried out. The project is run in close cooperation with companies in the light industry that have contributed with practical knowledge and experience.
The studies are conducted on the basis of two different aspects of the light experience. One is the visual qualities of light sources and the other is the experience of the entire light environment. Photometric values, energy use and the subjects’ preferences for different light qualities have been measured and used as references.
In order to evaluate visual properties of light sources, sensory descriptive analysis has been performed. During the sensory training sessions the panellists have defined the visual properties and learnt how to assess them on a scale.The assessments were conducted in a sensory laboratory equipped in accordance with ISO standards for sensory assessments. Examples of properties that were first defined and then assessed are the character of the light (diffuse, distinct) and the nature of the shadows (darkness, sharpness). As physical references, light flow (lumen), beam angle (degrees), colour temperature (Kelvin) and colour rendering (Ra) have been measured. Light sources in the sensory study were selected according to the variables: light temperature, luminous flux, diffusion angle and colour rendering.
The parallel studies of light environments have been carried out with both scale models and in full scale rooms. In the spaces, basic factors for light experience have been varied in the environments, such as light intensity and light distribution, as well as reflectance and contrast range of the painted surfaces of the rooms. The light environments have been assessed in several rounds using a selection of descriptive concepts, collected from repeated workshops with lighting professionals. The concepts were assessed by semantic differential scales and divided into three categories: the experience of space, the character of the light and the character of the shadows. Each scale model
CIE Session 2019 – Abstract Booklet
134
has been drawn up in computer-generated 3D models, scaled up to full scale, which then was used for simulations for photometric measurements and estimated energy usage.
3. Results
The results of the studies indicate that it is possible to identify and objectively measure visual sensory properties of light sources.
The studies of light environments have shown that it is possible to correlate descriptive concepts for light experience to specific spatial light qualities.
In addition to the results from the studies, the tool contains complementary parts, the purpose of which is to clarify and illustrate the various parameters that guides design of light environments, thus creating different experiences depending on how they are arranged.
The various parts of the tool consist of:
- Quantitatively measured properties of different types of light sources evaluated by sensory analysis and definitions of these characteristics
- A luminaire typology (showing different principles of light direction)
- A typology of light environments (based on basic principles of light distribution, reflection and contrast)
- A concept model for perceived light quality
- An exemplary collection for light environments that are assessed with concepts for perceived light quality
- An image collection illustrating different light characters (which complements the concept model)
- Examples of full-scale environments that are designed according to the lighting principles presented in the tool, and assessed with concepts for perceived light quality.
- References to photometric measurements and energy use for the light sources and light environments that has been evaluated in the studies.
4. Conclusions
Using the tool, principles for designing light environments and typical light sources can be compared. It may for instance be used to exemplify and discuss different design options on a principal level during design and planning of light installations in the building process. In addition it also illustrates how different options may affect both experience and energy use. The tool may also be used as a pedagogical guide that explains how the combination of different lighting features – from light sources,
fixures, contrast in colour schemes to various principles for light distribution – compose light environments with different character. The tool can also provide a basis for common definitions for perceived light quality, which may be used in research.
CIE Session 2019 – Abstract Booklet
135
OP56
REVISION OF THE INTERNATIONAL STANDARDS OF LIGHTING OF INTERIOR WORKPLACES
Peter Dehoff Zumtobel Lighting GmbH, Schweizer Straße 30, 6850 Dornbirn, AUSTRIA
Abstract
Two important international standards have started the process of revision: one is the ISO 8995/ CIE S 008 “Lighting of indoor workplaces” (2001/2002) and the other is EN 12464-1 “Lighting of indoor workplaces” (2011). Requirements in lighting and lighting technology have changed a lot since the first preparation on these standards. The focus is very much on the comfort and well-being of people at work while respecting energy efficiency of the lighting installation. Visual quality is the most important impact. But all effects of lighting have to be taking into account, as well as the increasing application of lighting management.
The revision of EN 12464 has been completed. It should be out in public inquiry during the CIE session.
The draft will be presented and explained.
CIE and ISO will start their revision directly at and after the CIE session.
This contribution is a report of the convenor of the two working groups. It should activate people attending the CIE session to contribute to the revision.
CIE Session 2019 – Abstract Booklet
136

Session PA7-2 D2 - Detector Characterization
Wednesday, June 19, 09:20–10:20
CIE Session 2019 – Abstract Booklet
137
OP57
NONLINEARITY OF THE PHOTODETECTOR USING LASER FACILITY
Wu, Z.F., Dai, C.H., Li, L., Wang, Y.F. National Institute of Metrology, Beijing, CHINA
Abstract
1. Motivation, specific objective
In order to investigate the nonlinearity of the silicon photodetector in large dynamic range, experiment is investigated using laser facility. And different wavelength lasers are used to investigate whether the nonlinearity is dependent on the wavelength or not.
2. Methods
In order to achieve a large dynamic range over nine orders of magnitude, laser power mode and laser irradiance modes are combined together to measure the nonlinearity. Beam addition method is adopted. The laser is first separated into two optical paths and then combined. The current of the photodetector is recorded. When the separated laser and combined laser are measured independently, the nonlinear factor is calculated using the CIE recommended formulae.
The laser is stabilized by a power stabilizer. Then two glan-taylor prisms are placed on the light path. After the second glan-taylor prism, a beam splitter is used to separate the light into “A” path and “B” path. The first glan-taylor prism is used to change the whole power of the laser. The direction of the second one is fixed to make the power of the “A” path and “B” path nearly equal. When the system is in power mode, the laser is lead directed onto the surface of the detector. The laser power is changed over six orders of magnitude using glan-taylor prism and the laser power stabilizer. When the system is in irradiance mode, the combined laser is directed into an integrating sphere. Then the laser fulfills the sensitive area of the photodetector. The nonlinearity is also measured over six orders of magnitude. The detector’s signals of both modes are overlapped in three orders of magnitude. So the nonlinearity is measured in nine orders of magnitude with the help of the two different modes.
The measurement is carried out in a symmetrical operation. First, the signal of “A” path is recorded as SA1. Second, the signal of “B” path is recorded as SB1. Third, the signal of both “A” and “B” paths is recorded as SAB. Fourth, the signal of “B” path is recorded as SB2. Finally, the signal of “A” path is recorded as SB2. The average of both paths are used to eliminate the drift of the laser power. When the current of the detector is less than 1 nA, 10 times average is used.
Several lasers are used to test the nonlinearity of the photodetector, including the 405nm, 633nm, 780nm and 940nm.
3. Results
For the 633nm, the current of the photodetector is varied from 0.2 mA to 0.2 nA. Results show that the nonlinear factor of the detector is less than 0.02%. For the irradiance mode, the nonlinear factor is measured with the current of the detector varying from 200 nA to 0.2 pA. Results show the nonlinear factor is less than 0.02% when the current is over 0.2nA. With the decrease of the current, the nonlinear factor increases due to the signal-to-noise.
4. Conclusions
By combining the power and irradiance mode, the laser nonlinearity facility can test the nonlinearity over nine orders of magnitude. By varying the distance between the photodetector and the integrating sphere, the nonlinearity can be test to a much lower laser power level.
CIE Session 2019 – Abstract Booklet
138

OP58
LONG-TERM SPECTRAL RESPONSIVITY STABILITY OF PREDICTABLE QUANTUM DETECTORS
Werner, L.1, Johannsen, U.1, Müller, I.1, Porrovecchio, G.2, Smid, M.2 1 Physikalisch-Technische Bundesanstalt, Berlin, GERMANY, 2 Czech Metrology Institute, Brno,
CZECH REPUBLIC
Abstract
1. Motivation, specific objective
In recent years a Predictable Quantum Efficient Detector (PQED) has been developed by a joint European effort in the framework of the EUROMET iMERA+/EMRP programs. The PQED consists of two custom-made induced junction Silicon photodiodes in a wedge trap configuration. The most notable property of this type of detector is that its external quantum efficiency (EQE) value in the spectral range from 400nm to 850nm is dependent only on fundamental constants. The PQED is therefore potentially an ideal candidate for a new primary standard for optical radiometry in the visible range. A considerable effort has been spent to validate the absolute value of the PQED spectral responsivity against the current standard for optical radiometry, the cryogenic radiometer, with uncertainty below 100 ppm. The aim of this work is to investigate the PQED long term temporal stability.
2. Methods
The spectral responsivity values of several PQEDs, used to estimate their EQE, are being measured by the Czech Metrology Institute (CMI) and the Physikalisch-Technische Bundesanstalt (PTB) against cryogenic radiometers over a period of more than six years: starting from about one year after the photodiode manufacturing in 2011 to the current date. The measurements are being performed with the highest level of accuracy on a set of laser lines covering the visible spectral range: 476nm, 532 nm, 647 nm, 760nm, 800 nm and 850 nm. To reduce dust contamination on its photodiodes the PQEDs are kept in dust free environment when stored and with a dry Nitrogen gas flow when the PQEDs are illuminated.
3. Results
The results show that the drift rate of the EQE of PQEDs is quite different from that of the typical three-element transfer standard reflection trap detectors equipped with Hamamatsu Si S6337 photodiodes, especially at short wavelengths of the visible spectral range. At the wavelength 476 nm, the annual drift of the PQEDs is -7.3 ppm with an expanded uncertainty (k = 2) of 49 ppm whereas the annual drift of the three-element reflection trap detectors lies between -170 ppm and -510 ppm. The estimated drift rates in the investigated wavelength range are between -4 ppm/year and -38 ppm/year and thus very small in their absolute values.
4. Conclusions
The temporal stability of the spectral responsivity and thus the EQE is a necessary condition for every primary detector standard. By measurements against the existing radiometric standard, the cryogenic radiometer, an estimate of the wavelength dependent drift rates of the EQE of PQEDs could be given. We could show that this estimation is in agreement with the assumption that PQEDs are stable over time when moderately used and not irradiated with ultraviolet radiation.
CIE Session 2019 – Abstract Booklet
139

OP59
PYROELECTRIC STANDARDS FOR SPECTRAL AND BROADBAND IRRADIANCE MEASUREMENTS FOR 250 nm TO 3000 nm
Eppeldauer, G.P., Podobedov, V.B., Cooksey, C.C., and Hanssen, L.M. National Institute of Standards and Technology, Gaithersburg, MD, USA
Abstract
1. Motivation, specific objective
Previously, for laboratory (reference) calibrations, tunable laser applied spectral responsivity measurements were applied to obtain low responsivity-uncertainty in the UV and IR. The tunable laser applied method is time consuming and expensive. In field-level broadband UV and IR applications, use of a lux-meter type instrument is needed to perform measurements fast accurate and inexpensive. In the UV, the filter corrected detectors produce large errors because the realization of the CIE standardized rectangular-shape responsivity functions (such as UV-A and UV-B) can be made only with large spectral mismatch. In practice, all function realizations in the UV are poor and different. The UV measurement errors were decreased when the spectral distribution of the source was measured and spectral mismatch corrections were applied. These traditional methods are either slow and expensive or complicated. In the IR, broadband measurement method that gives uniform results with low uncertainty is not available.
2. Methods
The recently developed low noise-equivalent-power (NEP) pyroelectric detectors with organic-black paint coating have been calibrated for irradiance responsivity, based on spectral reflectance measurements of the coating. From the spectral reflectance, the spectral absorptance was determined. When the transmittance of the coating is negligibly small, the absorptance is equal to 1 minus reflectance. The absorptance for the discussed coatings is about twenty times higher than the reflectance. Accordingly, a relatively large reflectance measurement uncertainty can produce a much smaller absorptance uncertainty. The absorptance is proportional to the relative response of the pyroelectric detector. The low uncertainty of the relative response can be utilized by producing an irradiance responsivity (absolute) tie point with a low uncertainty, similar to that of the relative response. The tie point will convert the relative response into spectral irradiance responsivity. The absolute tie point is traceable to the primary standard cryogenic radiometer. Using this pyroelectric responsivity calibration method, fast and accurate spectral and broadband irradiance measurements can be performed. Radiant-power or radiance responsivity tie points can also be used to obtain spectral power or spectral radiance responsivity functions.
For broadband irradiance measurements the flat-response versions of the pyroelectric detectors are selected. They can be similarly used to widely used lux meters that measure illuminance, the photometric equivalent of the here performed and discussed integrated irradiance measurements.
3. Results
The reflectance measurements were performed at the NIST-STARR monochromator-based facility between 250 nm and 2500 nm and also using the Infrared Reference Integrating Sphere (IRIS) at the
Fourier Transform Infrared Spectrophotometry (FTIS) facility from 800 nm to 3m. The deviation in the short-wave infrared (SW-IR) range (where the measurement results overlap) between the two absorptances, derived from the reflectance measurements, was ~0.25 %. This small deviation was obtained because the absorptance was about twenty times higher than the measured reflectance values resulting in low absorptance uncertainties. For the ~20 times larger absorptance, the 3 % (k=2) reflectance measurement uncertainty produced a 0.2 % (k=2) absorptance uncertainty. This is also the uncertainty of the relative spectral response function of the pyroelectric detector.
While the response function of the pyroelectric detector does not need to be flat for spectral irradiance responsivity calibrations, a flat response could be utilized for broadband measurements. Since the spectral product of the measured source distribution and the spectral responsivity of the meter produces the output signal in a broadband measurement, the signal measurement procedure was standardized in our previous work to obtain uniform broadband measurement results with low
CIE Session 2019 – Abstract Booklet
140
uncertainty. This procedure was simplified here using the low-NEP pyroelectric detectors with close to constant spectral response. Using the constant irradiance responsivity, standards source was not needed to obtain the integrated irradiance from the measured source.
Using the above mentioned spectral reflectance measurements of the coatings, pyroelectric detectors with close to constant spectral response were selected for the UV-VIS range. As an example, a +/- 0.22% maximum-to minimum responsivity change was obtained for the UV-A range which was utilized for integrated irradiance measurements of LED-365 collimators. This flat response is more than 10 times better than that of filtered Si photodiodes resulting in significantly improved broadband measurement uncertainties. Since the tie point was derived from a Si trap detector (equipped with an aperture), the flat response included the wavelength of the tie point. The responsivity transfer of the tie point was performed in a collimated LED beam using detector substitution. Flat response meters can be selected for the IR as well using a pyroelectric detector with the same coating. Again, additional source standard is not needed to perform accurate integrated irradiance measurements in the IR. The tie point again should come from the Si range to keep the measurement uncertainty low.
4. Conclusions
Pyroelectric detector calibration methods have been developed and applied for low-uncertainty spectral responsivity calibrations and integrated irradiance measurements. This is the first time use of low-NEP pyroelectric detectors for irradiance measurements. The responsivity determinations are based on spectral reflectance measurements of the pyroelectric coatings. The applied low-NEP pyroelectric detectors can be used as radiometric standards that may be used at the output of regular monochromators. Using these pyroelectric standards, responsivity uncertainties similar to that of silicon photodiode calibrations, can be achieved in the UV and IR. Using spectrally calibrated pyroelectric detectors of flat response, broadband measurements can be performed from UV to IR without using any source standard. The described pyroelectric meters can perform fast and accurate spectral responsivity and broadband irradiance measurements simply from 250 nm to 3000 nm.
CIE Session 2019 – Abstract Booklet
141
Session PA7-3 D4 - Urban Lighting
Wednesday, June 19, 09:20–10:20
CIE Session 2019 – Abstract Booklet
142

OP60
INTEGRATING RESEARCH ON SAFETY PERCEPTIONS UNDER PARKING LOT ILLUMINATION
Bullough, J.D., Rea, M.S., Narendran, N., Freyssinier, J.P., Snyder, J.S., Brons, J.A., Boyce, P.R. Lighting Research Center, Rensselaer Polytechnic Institute, Troy, NY, USA
Abstract
1. Objectives
Parking lot lighting should meet multiple objectives. While lighting in parking facilities should provide figure-ground information for users to see and respond to hazards, the plateau nature of visual performance is such that horizontal illuminances of 2 lx on the pavement is sufficient for detecting objects such as tripping hazards. Yet some people might judge a parking lot illuminated to a horizontal illuminance of 2 lx to be under-lighted. Thus, it is also an important design objective that parking lot lighting should provide a sense of personal safety and security. This objective has been the focus of studies from the Lighting Research Center since the 1990s.
2. Methods
Boyce and colleagues published a paper on peoples' perceptions of safety under different parking lot lighting installations in a broad range of demographic locations ranging from suburbs to major urban centers. They found that while lighting could not make a location that appears dangerous during the daytime appear safe, perceptions of personal security at night were largely correlated with horizontal illuminances on the pavement surface.
Building on empirical findings showing that observers rated outdoor locations illuminated by white light sources such as metal halide lamps as brighter than those lighted by yellowish high pressure sodium lamps, Rea and colleagues noted that perceptions of personal safety were strongly related to the perceived brightness of the overall outdoor scene. Through laboratory and field research they developed a model of spectral sensitivity for outdoor lighting scene brightness that included responses from short-wavelength cones, and found that ratings of personal safety under different light sources ranging from sodium to metal halide to light emitting diode (LED) and under different light levels could be rectified by brightness quantities based on this spectral sensitivity model.
Narendran and colleagues investigated the role of the uniformity of illumination in contributing to a sense of personal security in parking lot illumination. In a field study they asked observers to evaluate a parking lot illuminated to a range of light levels and with different maximum-to-minimum illuminance uniformity ratios. Consistent with previous studies, higher light levels led to greater perceptions of security, but a uniform lighting pattern with a relatively low light level could be judged as equally safe or safer than a non-uniform one with a high light level.
More recently, a laboratory study was carried out to integrate these research findings demonstrating the roles of light level, light source spectrum, and illuminance uniformity on perceptions of safety in parking lot scenes. A scale model apparatus was developed to produce illumination patterns on a simulated parking lot surface with a range of average illuminances (2.5 to 20 lx), light source spectra (correlated colour temperatures of 2850 to 5800 K) and maximum-to-minimum uniformity (ratios from 2:1 to greater than 15:1), and to obtain observers' ratings of perceived security.
3. Results
The laboratory results replicated the findings from previous research and led to, for the first time, a comprehensive model of personal safety related to light level, spectral distribution, and illuminance uniformity. Notably, the results from the scale model laboratory study were consistent with those from field studies in actual parking lots.
4. Conclusions
The research efforts described here demonstrate how light level, spectrum and uniformity interact to affect perceptions of safety in parking lot users. Importantly, specifications of lighting based on these
CIE Session 2019 – Abstract Booklet
143

criteria would permit substantial reductions in energy use and light pollution in outdoor lighting while meeting users' needs.
CIE Session 2019 – Abstract Booklet
144

OP61
WHAT TYPES OF VISUAL ENVIRONMENT CAN REDUCE THE PERCEPTION OF NOISE IN URBAN RESIDENTIAL DISTRICT?
Jialu WU, Biao YANG School of Architecture, Harbin Institute of Technology, Shenzhen, Guangdong, CHINA
Abstract
1. Introduction
In the design of urban environment, noise control is a very important consideration for it prevents the interference on people's daily life and potential hazard on people's health. Vision is the central sense of human beings, about 87% of external information is obtained through vision. Some studies indicate that people's perception of sound is affected by visual environment factors to a great extent, such as botanical landscape, water landscape, colour of landscape and so on. The control of urban noise should consider the influence of visual environment factors. The past studies have found some visual factors in urban environments that have influence on noise perception, but the degree of influence have not been measured quantitatively. The aims of this study were to find out the visual environment factors influenced on the perception of noise, to ascertain the direction of its influence and to measure the degree of its influence. The results are expected to be used in guidance and standard of visual environment design.
2. Methods
In this study, visual scenes and auditory stimuli were created in laboratory. Each visual scene was taken from an actual site. These sites was selected randomly from three different residential districts according to the economic class they belong to. Then panoramic photos in those sites as the visual stimuli were taken by KanDao® obsidian go 3D virtual reality camera and played by HTC® vive pro virtual reality helmet. The auditory stimuli were typical urban noises, which consist traffic noise and industrial noise, vary in 5 degree of sound pressure level (SPL) (A1=55dB, A2=60dB, A3=65dB, A4=70dB, A5=75dB). The auditory stimuli were present through Sennheiser® HD800S headphone. In total, 150 audio-visual combinations were created. The visual and auditory stimuli were controlled independently.
The 150 audio-visual combinations were presented to 19 subjects (12 females & 7 males; Age range = 19-28 years) randomly. Four pink noises of different SPL (50dB, 60dB, 70dB and 80dB) were played before the experiment as reference SPL level. During the experiment process, the subjects were allowed to replay the reference SPL level at anytime. In the experiment, for each audio-visual combination, subjects were required to answer two questions orally : 1. What do you see in this scene? Use three key words to describe it. 2. What is the sound level of this noise? The purpose of asking the first question is to help the subjects immerse themselves into the virtual environment of the residential district.
3. Results
Data was extracted from a total number of 3300 responses. All panorama images were unfolded into six plane images, which were equivalent to the six directions. Analyses of visual environment factors were performed on these plane images. Two main categories of visual factors were considered in this experiment: colour information and composition of landscape elements. HSL (Hue, Saturation and Lightness) was used as colour factor of visual environment. Average hue, saturation and lightness of each image were calculated by MATLAB®. Composition of landscape elements involved greening rate, sky rate and artificial landscape rate. These were measured by the percentage of area of the specific composition in the whole image. The difference of loudness (LdB>0: overestimation; LdB<0: underestimation) was recorded as dependent variable.
The results show that difference loudness significantly correlated to hue, artificial landscape rate and greening rate. The p-value of difference loudness and hue was 0.009, the correlation coefficient was 0.804. The p-value of difference loudness and artificial landscape rate was 0.038, the correlation coefficient was 0.693. The p-value of difference loudness and greening rate was 0.006, the correlation coefficient was -0.829. No significant relationships were observed between difference loudness and
CIE Session 2019 – Abstract Booklet
145
saturation, lightness or sky rate. However, these result are only applicable for high level residential district. In addition, results of linear fitting indicate that 40% increase of green rate might be linked with 1 dB underestimation of SPL, and 0.8 dB underestimation of SPL might be linked with 30% decrease of artificial landscape rate.
4. Conclusions
In this study, the relationship between visual environment factors and the perception of noise was investigated. It was found that three visual environment factors have relationship with perceived loudness of noise: hue, greening rate and artificial landscape rate. In addition, difference of loudness positively correlated with hue and artificial landscape rate, and negatively correlated with greening rate.
It should be noted that these results are only applicable for high upper-class residential district. One possible reason is that the visual environments in the middle- and lower-class residential districts consist more confounding variables than upper-class residential district does. For further study, more visual scenes and more visual factors will be included.
CIE Session 2019 – Abstract Booklet
146

OP62
LED STREET LIGHTING AND LIGHT POLLUTION – A CASE STUDY IN SOUTH EAST AUSTRALIA
Chapman, M.B.1 1 Sydney Outdoor Lighting Improvement Society, Sydney, New South Wales, AUSTRALIA
Abstract
1. Motivation, specific objective
The introduction of LED technology to the commercial lighting market has seen a rapid change to roadway lighting. This change, driven primarily by government led programs intended to reduce greenhouse gas emissions by reducing electricity consumption. A result of this consequence has seen increased concern around the quality of light from LED street lighting, based on issues such as sky glow and glare. In some locations these complaints have seen a change to lighting using a much lower correlated colour temperature (CCT).
Presented here is the result of a time series analysis of data from the Suomi/VIIRS satellite using as an example a regional area of South-East Australia where LED street lights replaced mercury vapour and compact fluorescent luminaires. A town in Victoria, Australia, Bendigo is selected as a case study of radiance into the night sky. Using a simplified inventory of the prior street lighting the total luminous flux of the lighting inventory is compared to the radiance images from the Suomi Day/Night Band (DNB) and compared to the expected results of the sky-glow modelling software Illumina.
2. Methods
The method used a combination of approaches. The ground data was a lighting inventory based on a geo-located pole and luminaire type; this was used to determine the required spectrums of the luminaires. The spectral data of the luminaires came from industry based sources in the format of various graphical sources such as specification data sheets and laboratory results, with a resolution of 5 nm these were digitized to be used as input to the modeling software Illumina and in the data analysis. A number of software packages were used to analyze the data; QGIS: an open source geographic information system, AGI32: a commercial package for lighting design, Illumina: a modeling package for light pollution analysis, RStudio: an open source statistical analysis package. The satellite data used came from the Suomi satellite series and Landsat series of satellites. By analysing the power and spectral components of the lighting database prior to the LED retrofit and after the LED retrofit, and then comparing to the Suomi satellite data and the modeling results of Illumina of both before and after retrofit. One further location, a remote prison farm, was selected as a reference site with an expectation of constant levels of illumination/radiosity, this site is well isolated form other sources of light. An alternative method using land use factors as the primary indicator of correlated variable was briefly investigated.
3. Results
Lighting inventory
The analysis of the lighting inventory concentrated on the aspects of total power, the total power of the blue component and total luminous flux of these components. The total luminous flux showed a 25.8% decrease from 20,709,878 lumens to 15,368,605 lumens. The total watts in the blue spectrum of 300 nm to 500 nm showed a reduction of 85% from 147,608 Watts to 22,182 Watts. The wavelength band defined by the American Medical Association (AMA) as the spectral region causing suppression of melatonin production (450 nm to 500 nm). The reduction in power is 13,681 Watts to 11,847 Watts, a decrease of 13.4%. The total luminous intensity in the wavelength range in the AMA defined range increased from 14,504 lumens to 104,184 lumens, an increase of 618%.
Illumina / Suomi
The results of the modeling in Illumina showed distinct expected decreases in radiosity as the effect of the retrofit, this was also evident in the raw data from the Suomi DNB data. This may be partially due t to the insensitivity of the sensors on board the Suomi satellite to the blue portion of the spectrum. The
CIE Session 2019 – Abstract Booklet
147

lack of radiosity response in the raw data from the Suomi satellite may also be due to scattering effects of the atmosphere
4. Conclusions
The analysis shows that in the case of Bendigo the street light program to replace the original technology with all LED luminaires has resulted in an overall reduction in the total radiance and a consequent reduction in sky-glow appears to be supported by the comparison images for Bendigo. Some interesting aspects that can be seen is the significant reductions in blue spectrum and the significant proportion of blue spectrum that existed in the original lighting inventory.
The significant finding of this study is comparison of the component of blue wavelength within the wavelength range 450 nm – 500 nm, including the AMA specified range of 446 nm to 477 nm. The LED retrofitted inventory has a far greater component of power and luminous flux in this range than the original lighting inventory. When considered with the comparison images this would suggest the blue component is scattered earlier in the atmosphere and is not detected in the ground based photographic techniques, possibly preferentially absorbed in the atmosphere and due to the lack of blue sensitivity in the detector based on-board the Suomi satellite.
CIE Session 2019 – Abstract Booklet
148
Session PA8-1 D3 - Interior Lighting 2
Wednesday, June 19, 10:45–12:25
CIE Session 2019 – Abstract Booklet
149

OP63
EXPERIMENT OF LIGHTING ENVIRONMENTS IN WARD FOR BLOOD CANCER PATIENTS BASED ON VIRTUAL REALITY TECHNOLOGY
Shao, R.D. 1,2, Feng, K. 1,2, Hao, L.X.1,2 1 College of Architecture and Urban Planning, Tongji University, Shanghai, CHINA;
2 Key Laboratory of Ecology and Energy Saving Study of Dense Habitat (Tongji University), Ministry of Education, CHINA
Abstract
1. Motivation, specific objective
The interior design of a hospital building should follow a scientific and rigorous evidence-based design research process; particularly, the feasibility should be continuously evaluated and modified during the interior design of the light environment in blood cancer patient wards, so as to avoid irreversible damage to patient during application. Evidence-based experiments on patients from hematology department using the virtual reality (VR) technology are associated with the advantages of high simulation and strong immersion, which allow tests on the critically-ill patients in the long-term adaptation environment, eliminate the impact of new environment on the patient's uncertainty, improve the experimental efficiency and save the project costs. This study took the light and colour environment reform in the hematology department ward of the First Affiliated Hospital of Henan Science and Technology University of China as an example, and employed the VR technology to conduct the evidence-based experimental research.
2. Methods
This research takes a triple-human blood cancer patients’ ward as an example, and the indoor simulation model of the existing ward is established by VR technology. The colour of soft hue and a high brightness and short levels tune collocation of colour is used as the ambient environment, and three possible lighting scene models are established in the pre-experiment. Through the built-in IES light parameters and RGB chromaticity parameters, VR enables precise simulation of brightness and chroma. The selection of 6 patients with hematological diseases and 6 medical staff for formal experiments are required to evaluate the preset scene models through the semantic difference scale
3. Results
By analysis, morning lighting scene (CCT=6500K, bed illuminance level 1500LX), treatment scene (CCT=5000K, bed illuminance level 700LX), reading scene (CCT=4000K, bed illuminance level 400LX), daily scene (CCT=4000K, bed illuminance level 300LX), pre-bedtime lighting scene (CCT=2700K, bed illuminance level 50LX), late night treatment scene (CCT=4000K, bed illuminance level 300LX) are combined to form a 24-hour dynamic lighting scene model in hematology wards, which meets the requirements of the doctor's work of visual delicate operation, brings the most suitable rehabilitation environment for patients, and relieves the patient's bad mood.
4. Conclusions
The treatment for blood cancer needs both visual precision and mood relieving. The blood cancer is treated on regular infusion, frequent daily examination, and with high requirements for fine visual operations such as drug sorting and injection; as blood cancer is hard to cure, lots of medical staff have high pressures in their work; patients can’t move easily, who always should stay in bed for days, with long-time transfusion, and their movement should be careful and avoid knock and fall down and finally the depression ratio of patients stays high.
Using the VR technology, scene adjustment of parameters such as colour temperature, brightness, light colour and interior decoration colour of the hematology ward could be achieved, and the scene evaluation factors of patients in the simulated real environment could be explored using the relevant factors, which would finally contribute to the formation of a set of favorable control scene parameters conducive to patient recovery.
1 Room lighting environment tuning over time can improve patients' emotions and satisfaction.
CIE Session 2019 – Abstract Booklet
150

2 Treatment scenes should be divided into day and night modes, especially treatment mode is required in the late night, to minimize the impact on patients’ rest at night
3 Soft hue and a high brightness and short levels collocation of colour is suitable for hospital ward surfaces.
CIE Session 2019 – Abstract Booklet
151

OP64
EVIDENCE-BASED RESEARCH AND APPLICATIONS OF A THERAPEUTIC LIGHTING SYSTEM ON CIRCADIAN RHYTHM AND MOOD REGULATION FOR CHINESE
PATIENTS
Hao, L.X.1,2, Cao, Y.X.1,2 1 College of Architecture and Urban Planning, Tongji University; Shanghai, CHINA
2 Key Laboratory of Ecology and Energy Saving Study of Dense Habitat (Tongji University), Ministry of Education, CHINA
Abstract
1. Objective
The subjective feeling and experience towards external environment are different when one is ill compared with the healthy status. Changes in the sick body symptom, invasive medical intervention, social role, daily acts and lifestyle will induce abnormal changes in the biological rhythm and neuropsychological status (including cognitive function and emotional status), which would adversely affect the surgical progression, therapeutic rehabilitation, and prognosis outcome of disease. The purpose of this research is to explore the appropriate indoor lighting strategy and technical parameter combinations for the patient population, comprehensively utilize the visual and non-visual biological effects of light to promote the circadian rhythm recovery and emotional regulation in the patients, thus improving the disease therapeutic outcome and promoting the patient quality of life.
2. Methods
This study had carried out a series of evidence-based research of therapeutic lighting design on various Chinese patients since 2010, including those receiving cardiologic catheter surgery, critical patients, those receiving orthopedic and brain surgery, elderly with dementia, ophthalmic patients and puerpera. The responses of human body physiological rhythm and emotional status to lighting stimulation were quantified through objective physiological data measurement and subjective scale evaluation. The evidence-based research was comprised of the basic research on the effect of light environment on the circadian rhythm and emotion of patients, as well as the evidence-based research targeting specific medical space, which had involved 8 experimental studies. Of them, ‘Experimental research on the role of light colours at different wavelengths on the human melatonin’, ‘Experimental research on continuous spectrum (white light LED) on melatonin’, ‘Influence of blue-enriched white light in non-natural light environment on the rhythm and cognition of subjects’, evaluated effects of light intensity and spectrum distribution on the circadian rhythm of patients using the Pittsburgh Sleep Quality Index (PSQI) and saliva melatonin content detection. “Subjective and objective evaluation regarding white light on emotion”, and “Subjective and objective experimental research of chroma visual interface-mediated effect of light colour on emotion” had quantified the response of emotional status to light and colour stimulation, which had obtained the light and colour parameter combinations with intervention effect on negative emotions. Besides, the evidence-based research had treated the patients in Cardiology Intensive Care Unit as well as those with Alzheimer’s disease as the objects of study (circadian rhythm abnormality, as well as negative emotions such as depression and anxiety were common in these two populations). The evidence-based research contents included the light environment design elements, such as light level, direct/indirect light distribution, light source colour temperature and media interface light colour, and variation cycle.
3. Results
Based on these experimental results, the lighting technical parameter combinations applicable for improving the negative emotion and repairing the rhythm in various patient populations were proposed (which were used as the technical parameters of each dynamic lighting scene of the therapeutic lighting system), the emotion and rhythm improving therapeutic lighting system was designed. In addition, the dynamic light environment control strategy for the therapeutic lighting system was formulated based on the physiological and psychological features, behavioral features, clinical therapeutic mode and daily routines of various patients. Moreover, the demonstration application and
CIE Session 2019 – Abstract Booklet
152
post-occupation evaluation of the therapeutic lighting system were accomplished in hospitals and nursing institutions
The independently developed therapeutic lighting system was constituted by the rhythm lighting module, emotion lighting module, and control system. The rhythm lighting module could also provide the indoor lighting function to satisfy the requirements of both clinical treatment and personnel. The emotion lighting module was the light media interface with a special dielectric layer structure, and the interface display pattern was customized according to the target application population and space. The control system had the built-in programmable controller, which could precisely control the lighting parameters of the rhythm lighting module, such as lighting intensity, lighting time, lighting duration, light source colour temperature and spatial light distribution, as well as the lighting parameters of the emotion lighting module, such as the brightness, colour and variation cycle of the media interface, thus realizing the targeted dynamic control of therapeutic lighting.
4. Conclusions
At present, this set of therapeutic lighting system has been applied in 6 hospitals and 2 nursing institutions in China, which has served in over 20000 cardiologic catheter surgeries, postoperative rehabilitation of over 200 critical patients, 14000 emergency orthopedic and brain surgeries, delivery of 18000 puerperae, and daily life of 370 elderly with dementia. The following feedback results in the clinical application of the therapeutic lighting system indicate that specific light environment can remarkably improve the patient emotion and rhythm, and that light environment design is the effective method to assist in patient rehabilitation and promote health benefits.
CIE Session 2019 – Abstract Booklet
153

OP65
LIGHT, ENTRAINMENT AND ALERTNESS: A CASE STUDY IN OFFICES
Figueiro, M.G.1, Steverson, B.2, Heerwagen, J. 2, Kampschroer, K. 2, Rea, M.S.1 1 Lighting Research Center, Rensselaer Polytechnic Institute, Troy, NY USA, 2 Office of Federal High-
Performance Buildings, General Services Administration, Washington DC, USA
Abstract
1. Motivation, specific objective
Light can have at least two non-visual effects. First, light synchronizes or entrains the biological clock to the local time on Earth. Second, light elicits an acute alerting effect from people that, similar to the effect of a cup of coffee, can help a person feel less sleepy, improve reaction times, and reduce attention lapses on certain tasks. Short-wavelength, blue light is maximally effective at promoting entrainment. The Lighting Research Center at Rensselaer Polytechnic Institute (LRC) developed a metric, circadian stimulus (CS), which is related to the spectrum and the amount of light needed to affect the human circadian system, as measured by acute melatonin suppression. CS is a measure of the effectiveness of the retinal light stimulus for the human circadian system from threshold (CS < 0.1) to saturation (CS of approximately 0.7). Studies have linked this metric to better circadian entrainment as well as greater subjective and objective alertness in people.
In terms of the acute alerting effects of light, although blue light can elicit alertness, especially during the nighttime, long-wavelength (red) light has been shown to increase objective and subjective measures of alertness without affecting circadian phase. The effect of red light on alertness was shown to be strongest during the afternoon, close to the post-lunch dip hours.
The goal of the present study was to evaluate whether a lighting intervention designed to deliver morning CS to promote entrainment and afternoon red light to promote alertness would advance sleep times and increase daytime alertness in participants recruited from three U.S. Department of State (DOS) facilities.
2. Methods
The DOS staff recruited 20 workers from three of their facilities who agreed to participate in a 3-week study. Baseline photometric data were collected during Week 1, prior to administration of the lighting intervention during Weeks 2 and 3. Upon arrival at the office on the first day of Week 1, participants were provided with Daysimeters, a calibrated personal light meter, to wear as a pendant from their arrival at work until bedtime, and actiwatches to be worn 24 hours/day during each day of the protocol on Weeks 1 and 3. During the baseline week (week 1), participants were asked to, 4 times per day (arrival, noon, 3 pm and departure) fill out questionnaires probing their subjective sleepiness (Karolinska Sleepiness Scale, KSS) and their vitality score (Subjective Vitality Score, SVS). Upon arrival at work on the first day of Week 2, participants were instructed to energize the desktop luminaires, which cycled throughout the workday according to the lighting intervention, which provided blue light in the morning and cycled to a red light in the afternoon. No data were collected in week 2. During week 3, lights were still energized and post-intervention data were collected, using the same baseline data collection protocol.
3. Results
Data for 17 participants who complied with the protocol were included in the analyses. The average of all 5 days of data collected in each baseline and intervention weeks were used in the statistical analyses. As expected, morning CS was significantly greater during intervention days than baseline, while afternoon CS was not. Paired, two-tailed t-tests showed that KSS scores were significantly reduced (p = 0.04) during the intervention week at 3:00 pm, suggesting that participants were feeling less sleepy with the red light intervention in the afternoon. Although not statistically significant, sleepiness scores during the intervention were lower than during baseline at 12:00 p.m. and at departure. There were no statistically significant differences between SVS scores at any time point. As for the actigraphy data, as hypothesized, morning blue light exposures significantly advanced (p=0.016) the timing of participants’ sleep. On average, articipants woke up 38 minutes earlier and fell asleep 8 minutes earlier. Both the intradaily stability (IS) and interdaily variability (IV), both measures
CIE Session 2019 – Abstract Booklet
154

of rest-activity consolidation, improved with the intervention and the activity acrophase (i.e., peak activity during the 24-h day) was earlier, as expected, but the differences in values did not reach statistical significance.
4. Conclusions
As predicted, morning blue light led to earlier bedtimes and earlier wake times, promoting the participants’ circadian entrainment. Although sleep offset was significantly earlier, sleep onset was not, most likely due to evening social obligations. Consistent with previous laboratory studies, exposure to red light in the afternoon led to decreased subjective sleepiness, as measured by lower KSS scores. This is the first time that the alerting effects of red light is demonstrated outside laboratory conditions. The lack of statistical significance on the other measures (e.g., SVS score) may have been due to small sample size and future studies should add more subjects and investigate the impact of longer light exposure duration on daytime alertness and nighttime sleep.
CIE Session 2019 – Abstract Booklet
155

OP66
RESEARCH ON THE RANGE OF PLEASANT DARKNESS AND BRIGHTNESS IN RESTAURANTS: DISCUSSION ON AGE FACTOR
Kozaki, M.1, Honjo, N.2, Hirate, K.3, Suzuki, N.4 1 Ochanomizu University, Tokyo, JAPAN, 2 Ochanomizu University, Tokyo, JAPAN, 3 The University of
Tokyo, Tokyo, JAPAN, 4 ENDO Lighting corp., Tokyo, JAPAN.
Abstract
1. Motivation, specific objective
Many fundamental research targeting elderly have been done aiming to clarify the visual performances and its change over years. However, those change usually occur gradually, hence people adapt as it changes. Therefore research question arose that decrease of visual performance may affect delicate tasks, but how severe does it affect non-delicate tasks such as eating and drinking? This research aims to verify the subjective range of darkness, brightness and pleasantness, and compared it with the result of related research done targeting young adults to discuss the age factor.
2. Methods
The method used in this research followed the method being used by related research. Restaurant was chosen as the experimental setting, since brightness of the room ranges from bar to family-friendly casual restaurants. Expected behaviour and lighting methods were selected as variables. Four behaviours, namely “eating”, “drinking”, “relaxing” and “chatting” were chosen to differ visual direction. In order to differ the brightness distribution within the room, three lighting methods were selected; local lighting method using a spot light to lighten table, general lighting method using four down lights with wide lighting distribution, and indirect lighting method using cornice lighting around the three walls in visual field.
Two experiments were being conducted. As a basic experimental setting, a white interior room with no
windows was used, yet size of the room slightly differed (experiment 1:W4100mm× L3000mm ×
H2600mm, experiment 2:W2900mm× L3000mm×H2600mm). Mannequin and food replicas were
placed according to the expected behaviour. Adjustment method, asking the subjects to adjust lighting power until the designated subjective equivalent value, was used to derive the threshold values. For the first experiment, the subjective equivalent value instructed to the subject were 2 points; threshold between “dark” and “not dark”, and between “unpleasant” and “pleasant.” Adjusting in upward and downward directions, which leads to 48 adjustments in total. For the second experiment, subjective equivalent values were 4 points; threshold between “not bright” and “bright”, between “bright” and “too bright”, between “unpleasant” and “pleasant” (lower threshold value), and “pleasant” and “not pleasant” (upper threshold value). Adjusting in upward and downward directions, which leads to 96 adjustments in total. The related research was done targeting to the young adults in their 20s and 30s. For this research, the subjects were in their 60s ~ 80s, 22 subjects for experiment 1 and 20 subjects for experiment 2. In order to test the effect of cataract surgery, half of the subjects was chosen from the people who had history of cataract surgery, yet all of the subjects didn’t have significant eye disease at present.
Lighting environment was measured to compare with previous related research results. The lighting equipment used was able to adjust the lighting power from 5% to 100% by 1%, following measurements were taken in 5% range, and regression analysis was done to derive the intermediate values. Illuminance values of vertical plane of subject’s face, vertical plane of mannequin’s face, average of table top, and average of wall were measured. Luminance distribution measured by CCD camera attaching fisheye lens with equisolid angle at subject’s eye level. Using distribution value, average luminance of whole visual field, of the table surface, of the wall and of the mannequin’s face were calculated.
CIE Session 2019 – Abstract Booklet
156
3. Results
Experiment was conducted without any problem, yet compared to young adults, elderly took more time in adjusting. In order to examine individual affect, ANOVA was done using subject’s gender, age group and history of cataract surgery as factors. As a result, for experiment 1, one condition (out of 12) had statistical difference by history of cataract surgery (p-value: 0.0284). There were no effect under other conditions and/or gender and age group. For experiment 2, there were two conditions (out of 24) with statistically significant differences; upper brightness threshold value of local lighting “eating” condition by age group (p-value: 0.0146), and lower brightness threshold value of general lighting “chatting” condition by gender (p-value: 0.0360).
To test the validity of experimental factors, two-way ANOVA was done, testing main effects of lighting method and behaviour, and its interaction. As a result, for experiment 1, only main effect of lighting method was seen for both darkness and pleasantness threshold value. For experiment 2, main effect and interaction were statistically significant for brightness threshold values, but no interaction was seen for pleasantness threshold values.
Following the analytical method used in related study, threshold values were derived using logistic analysis. Logistic analysis is a method of plotting positive response rate (y-axis) by physical quantities (x-axis) such as average luminance and illuminance. Threshold value was set to 50% positive response rate. The result of threshold values calculated using average luminance value were within the following range; darkness 6-13 cd/m2 and pleasantness 7-16 cd/m2 for exp. 1, lower brightness 17-66 cd/m2, upper brightness 30-120 cd/m2, lower pleasantness 17-61 cd/m2, upper pleasantness 35-128 cd/m2 for exp. 2.
To discuss the generation differences, experimental results were compared with the related research. Compared with young adults, elderly had narrower range of pleasantness and brightness. This corresponds with known fact that elderly suffers with decrease of visual performance (not good at seeing under dark conditions) and opacification of the lens (suffers from glare under bright conditions). In general, distribution curve of elderly were wider, showing that individual differences of elderly was bigger.
4. Conclusions
This research aimed to verify the subjective range of darkness, brightness and pleasantness, and compared it with the result of related research done targeting young adults to discuss the age factor. Corresponding with the hypothesis, pleasantness range of elderly was narrower than the young adults. In addition, threshold values of “not dark” did not equal to “bright”, showing that word nuance may had an influence over subjective range.
CIE Session 2019 – Abstract Booklet
157

OP67
INVESTIGATION OF HUMAN CENTRIC LIGHTING IN INDUSTRIAL ENVIRONMENT IN MULTIPLE ASPECTS – BIOLOGICAL EFFECT AND USERS’ PREFERENCE
Tóth, D.N.1, Szabó F.1
1 Light and Colour Science Research Laboratory University of Pannonia, Veszprém, HUNGARY
Abstract
1. Motivation, specific objective
The goal of the study was to investigate the effects of human centric lighting on the users via both objective measurements and subjective questionnaires in a real working environment with the participation of industrial employees. During the measurements, heartrate of the participants had been monitored and the questionnaires periodically had to be filled, assessing the participants’ experiences about the experimental lighting. In this study custom human centric LED luminaires had been used, which are capable to provide timed continuous transitions between different pre-set spectra mixed from the four LED channels (red, green, blue, phosphor warm white). The pre-set light settings had different intensity, correlated colour temperature and circadian effect. Two, four-person teams of a workstation participated in the experiments for two weeks, in both morning and afternoon shifts.
2. Methods
Both objective and subjective methods had been used during the experiments in two stages; one using the custom human centric luminaires and one using a common, neutral white (4400 K) LED tube lighting system which is widespread in modern industrial lighting. The experimental luminaires had three pre-set SPDs: “relaxing”, “neutral” and “stimulating” named after the calculated circadian effect (CLA) of the given setting, which ranged from half to 2.5 times the effect in case of the LED tube system. During the working shifts the continuous fading between these cornerstone spectra had been timed to be able to investigate the effects of each setting while the fading in-between is not disturbing for the participants.
Objective measurement of the effects of lighting was based on the heartrate changes of the participants. Heartrate had been recorded during working time using heartrate-monitoring smartwatches. Circadian effect of the lighting had been calculated from the different spectral power distributions.
The subjective experiences of the participants had been assessed using questionnaires which had to be filled every day by every participant in the two short breaks during the working shifts. The morning shift’s questionnaire had been divided into two time intervals in the morning and the afternoon shift’s into three because these intervals had different light settings. The answers of the questionnaires had been coded for evaluation in statistical software for the analysis.
3. Results
The objective measurements had been evaluated via comparing the heartrate data and the calculated circadian effect of the light under which the data had been recorded. To achieve more accurate results, the measurement noise of the utilized instruments had been removed using a low-pass filter and results affected by excessive caffeine consumption had been excluded. Since the objective measurements and calculated descriptive data are high measurement level variables in statistics, the evaluation of the heartrate data and circadian effects had been done via Pearson’s correlation. The result of the analysis had shown a significant, moderate correlation between the light’s circadian effect and heartrate (coefficient: 0.437, p<0.01). This result can be interpreted in a way that in case of the LED tubes, the circadian effect was constant, and heartrate was nearly constant, but in case of the human centric luminaires, heartrate increased under the stimulating, and decreased under the less stimulating settings. The moderate strength of the correlation could be acknowledged to the fact that heartrate is affected by other factors – for example movement during measurement – besides lighting.
The questionnaires assessing subjective experiences about human centric lighting had questions which assessed the preference of lighting, the users’ feeling of tiredness at the end of the shift and
CIE Session 2019 – Abstract Booklet
158

ability to concentrate, glare, amount of disturbing shadows, subjective relaxing effect of the light, hours of sleep and caffeine consumption. Since these variables are considered low measurement level variables in statistics, Spearman correlation had been used to search for connections between the different variables. In the results there was no direct correlation between the lighting system and the preference, but indirectly the parameters were connected through the correlations with the subjective feeling about the ability to concentrate. In the results preference had shown significant connection with four other parameters: participants preferred light which enhanced ability to concentrate (0.374, p<0.01), induced less tiredness (0.254, 0<0.01), had less glare (0.269, p<0.01), eliminated the disturbing shadows (0.195, p<0.05). The ability to concentrate had shown stronger correlation with the perceived relaxing effect of light (-0.602, p<0.01) and had been also influenced by the sleep quality of the previous night (0.411, p<0.01). The ability to concentrate had correlations with the presence of less shadows (0.398, p<0.01), and less glare (0.448, p<0.01). Tiredness also had shown connection with the perceived relaxing effects of light (-0.349, p<0.01). However there was no direct connection between preference and lighting system, the results suggest that the participants preferred the more stimulating light settings. Both their perceived ability to concentrate and tiredness at the end of the shift was in correlation with the light’s perceived relaxing effect, and both of these parameters were in connection with preference.
4. Conclusions
The results of the analyses of the questionnaire clearly show a connection between circadian effects of the human centric lighting’s continuously changing light settings and the participants’ subjective feeling of alertness and their preferences. The participants perceived their own ability to concentrate to be significantly better and felt less tired when the light had more stimulating effect on the circadian system. The effects of other parameters (glare, shadows) had been shown from the answers as well.
The effect of lighting had been proven using objective measurements besides the questionnaires. A significant moderate correlation between the circadian effect and the heartrate changes had been shown. The moderate strength can be acknowledged to other factors which influence the heartrate.
As a final result it can be concluded that the continuously changing light of the human centric luminaires indeed had an effect on the users’ circadian system. This hypothesis was confirmed by both the objective and subjective evaluation methods.
CIE Session 2019 – Abstract Booklet
159

Session PA8-2 D1 - Colour in Lighting
Wednesday, June 19, 10:45–12:05
CIE Session 2019 – Abstract Booklet
160
OP68
VISION EXPERIMENT ON VERIFICATION OF HUNT EFFECT IN LIGHTING
Kawashima, Y., Ohno, Y. National Institute of Standards and Technology, Gaithersburg, MD USA
Abstract
1. Objective
Color quality of a lighting has largely two aspects, colour fidelity and colour perception. To make an overall colour quality metric, both of these should be considered, and these two aspects can be affected by the Hunt Effect. The Hunt Effect is a perception effect, by which perceived chroma of object colours appear less saturated at low light levels than at high light levels. If the Hunt Effect is effective at normal indoor lighting levels, it is considered that objects in indoor lighting (relatively low illuminance levels) would appear less saturated than those at outside daylight (much higher illuminance levels) and, therefore, increasing the chroma saturation level at indoor lighting to some extent would make colour appearance of objects closer to that under outside daylight, thus bring higher fidelity of colours. Increase of chroma by lighting, however, is penalized by the current colour fidelity metrics such as CRI or CIE 2017 Color Fidelity Index. Many studies show that lighting that enhance chroma slightly is preferred, but this could be due to the Hunt Effect or combined effects, then increase of chroma would no longer be an issue of simply preference. Thus, Hunt Effect may be playing an important role in perception of chroma increase, however, the Hunt Effect has not been investigated for the light levels for normal indoor lighting. To obtain such data, a vision experiment was conducted evaluating the naturalness of common objects illuminated under various chroma saturation levels under low (100 lx) and high (1000 lx) illuminance conditions. If the Hunt Effect is effective, the chroma saturation level that presents most natural colour appearance should be different under the 100 lx and 1000 lx conditions.
2. Methods
A real-size room cubicle illuminated by spectral tunable light sources was used for the experiment. The unit has 25 channels of LED spectra and can independently control spectral distribution, CCT, Duv (distance from blackbody locus) and illuminance. 24 subjects having normal colour vision were recruited for the experiment. The age of subjects ranged from 19 years to 64 years old, 12 males and 12 females. The experiment was conducted in the cubicle at 100 lx and 1000 lx with CCT of 3000 K and 5000 K. Four sets of the targets were used: mixed fruits and vegetables (Mix), red fruits and vegetables (Red-only), green fruits and vegetables (Green-only), and the subject’s skin tone (Skin). In the cubicle, a pair of lights, a reference and a test light, was sequentially and repeatedly presented. Subjects observed the target under each light and chose under which light the target appeared more natural. While the pair of lights were at same illuminance and CCT with Duv=0, the two lights had different chroma saturation levels. The chroma saturation level for each light was specified by the chroma shift of the red Munsell sample from under the reference illumination to under that light in the CIELAB colour space. The reference light had the chroma shift of 0 and that of the test light ranged
from -16 to +16 in C*ab with intervals of 4, but excluding 0. In addition to the chroma saturation levels based on the red Munsell sample, those based on the green Munsell sample were used when Green-only was used as target. For each CCT/illuminance condition, after the subject were adapted to the reference light, 8 pairs of the reference and test lights were presented randomly. Each light in a pair was presented for a few seconds and repeated as necessary.
3. Results
For each chroma shift level (-16,..,0,..,16), at each CCT and illuminance level, the percentage of subjects’ choosing the test light as more natural (than reference) was calculated and plotted as a function of chroma shift level. The percentage for shift level 0 (reference) was set to 50%. Then, the peak of the curve indicates the chroma shift level under which the objects appeared most natural. It was found that the peak of the percentage curve clearly shifted from 100 lx condition to 1000 lx
condition in most cases. For example, for Mix at 3000 K, the peak occurred at C*ab= 4 (slightly
oversaturated) at 100 lx, and C*ab= -4 (slightly undersaturated) at 1000 lx. In this case, increasing
chroma by 8 inC*ab at 100 lx makes the same colour appearance of objects as at 1000 lx. For Skin,
CIE Session 2019 – Abstract Booklet
161

the curve is broader than Mix, but similar peak shift (10 in C*ab ) was observed. For the cases where the curve is not smooth and difficult to determine the peak, a mathematical model was developed and a curve was fit to the data to determine the peak. The peak shift evaluated in this method ranged from
2 to 12 in C*ab and in the same directions for all cases. The peak shift for Green-only target was much smaller (≈2) than Red-only or Mix target (8 to 10). There were large differences in peak shift for Mix and Skin between 3000 K and 5000 K.
4. Conclusions
It was clearly shown that the chroma shift level where targets appear most natural changes from the 100 lx condition to 1000 lx condition for various targets, and the amount of shift of the peak ranged
from 2 to 10 in C*ab depending on target and CCT. This result verified that the Hunt Effect is effective in typical illuminance levels for general indoor lighting. The increased chroma in the indoor lighting can bring the perceived object colours closer to those under outside daylight. Further studies are needed to determine the degree of change of perceived chroma for different colours (hue) of object at different illuminance levels.
CIE Session 2019 – Abstract Booklet
162
OP69
VISUAL EVALUATION OF CIE 2015 CONE FUNDAMENTAL-BASED 10° COLOUR MATCHING FUNCTIONS FOR LIGHTING APPLICATIONS
Ohno, Y. 1, Kawashima, Y1, Oh, S.2, Kwak, Y. 2 1 National Institute of Standards and Technology, Gaithersburg, Maryland, USA
2 Ulsan National Institute of Science and Technology, Ulsan, SOUTH KOREA
Abstract
1. Objective
The 1931 colour matching functions (CMFs) (2° observer) are currently used for colour specifications of all lighting products. The CIE 2015 cone-fundamental-based CMFs (CIE 170-2:2015) are expected to correlate better with perception, and in particular, the 10° observer CMFs are considered to better represent visual experience in daily lighting environment. Thus, there is a strong interest in introducing the CIE 2015 10° CMFs (abbreviated "CIE F,10" in this paper) to replace the CIE 1931 CMFs (abbreviated "CIE 1931" in this paper) for colour specifications in lighting. The chromaticity of lighting products is specified or designed by correlated colour temperature (CCT) and Duv (distance from Planckian locus), which are currently based on CIE 1931. A question was: what happens to the values of CCT and Duv of light sources if the new CMFs are introduced? By definition the CCT and Duv values of Planckian radiation do not change, but these values of LED lighting sources can change significantly depending on their spectral power distributions (SPDs), then the use of CIE F,10 may make significant impact on lighting design and specifications. A computational analysis was first made to answer this question. Then, to verify whether CIE F,10 performs better visually, a vision experiment was conducted to compare perceived colours of light sources having different SPDs matched under CIE 1931 and CIE F,10.
2. Methods
Computational analyses were made to determine the amount and direction of changes in CCT and Duv values when CIE F,10 CMFs were used for the calculation, for various existing light sources (fluorescent lamps, phosphor and RGB white LED spectra) as well as some simulated spectra in a database of ~100 SPDs.
A vision experiment was conducted using 22 subjects to evaluate which of CIE F,10 or CIE 1931 CMFs perform better in terms of visual colour matching of light sources. The age of subjects ranged from 18 years to 63 years old, 9 males and 13 females. A double-booth equipped with 16-channel spectrally-tuneable LED sources was used to prepare a set of white light spectra for 3000 K and 5000 K CCT at 250 lx illuminance. The left side of the booth was set for a broadband light at one of CCTs at Duv=0 (called “Reference”), illuminating a large white sheet (30 cm x 30 cm, made of Teflon material) placed at the bottom of the booth. In the right side of the booth, six pairs of different test light spectra were set, which illuminated the identical white sheet at the bottom of the booth. Each pair of light was set so that one light (called “A”) had the same chromaticity (CCT and Duv) as the Reference under CIE 1931, and the other light (called “B”) had the same chromaticity as the Reference under CIE F,10. For each light, the CCT and Duv values were calculated using both CMFs. The differences of the CCT and Duv values of these six pairs of light, between CIE F,10 and CIE 1931 CMFs, ranged from about 50 K to 300 K in CCT and from 0.002 to 0.01 in Duv. The Reference light at each CCT had nearly the same CCT and Duv values calculated under CIE 1931 or CIE F,10.
Each subject sat in front of the booth and adapted for 5 minutes for each CCT under Reference light condition. Then, the pair of light “A” and “B” were presented alternately, at about 2 seconds intervals on the right side. The subject compared the colour of the large white sheet under light “A” and “B” with that on the left side (Reference light), and answered which light “A” or “B” appeared closer colour to the left side. The comparisons of six pairs were repeated, and the same set of comparisons were done for 3000 K and 5000 K.
3. Results
The computational analysis showed that, if CIE F,10 replaces CIE 1931, the CCTs for typical phosphor-converted white LEDs will change by -100 K to -250 K, and Duv by -0.003 to -0.008,
CIE Session 2019 – Abstract Booklet
163
depending on CCT (3000 K to 6000 K). The changes of Duv values of RGB white lights can be even larger, up to ±0.01 in Duv. These changes are significant. Since the current chromaticity specifications (e.g., ANSI C78.377) are widely accepted, these results emphasize the need to visually evaluate such Duv changes by CIE F,10, and a need to create new specifications for CIE F,10.
In the vision experiment, the subject’s choice for “A” (CIE 1931 is closer) is given a score of 1.0 and “B” (CIE F,10 is closer) is given -1.0 for each comparison. There were 6 light pairs x 2 (repetitions) x 2 (CCTs) x 22 subjects, thus total 528 comparisons. The average scores were -0.50 (3000 K), -0.56 (5000 K), so CIE F,10 performed better overall. However, if results are sorted by age groups, the average scores for age ≥ 40 (8 subjects) were -0.08 (3000 K) and 0.02 (5000 K), in which case it is uncertain which is better, and those for age < 40 (14 subjects) were - 0.74 (3000 K) and -0.89 (5000 K). Therefore, CIE F,10 definitely performs better visually for younger subjects but not necessarily for aged subjects. The results also depended on SPD. CIE F,10 works better for phosphor-converted LEDs and some RGB spectra, while CIE 1931 works better for other RGB spectra.
4. Conclusions
The vision experiment showed that the CIE 2015 cone-fundamental-based 10° CMFs performed better visually overall for colour matching of lighting sources. However, there is a strong dependence on the age of subjects and also on SPD of light sources. Further study is needed on these effects, and the existing chromaticity specifications need to be re-evaluated for the new CMFs, before they can be recommended for lighting applications.
CIE Session 2019 – Abstract Booklet
164

OP70
UNIQUE HUE JUDGMENTS UNDER LIGHT SOURCES WITH DIFFERENT CHROMATICITIES
Huang, H.P.1,2, Wei, M.1,*, Xiao, K.3, Ou, L.C.2, Xue, P.3 1 The Hong Kong Polytechnic University, Kowloon, HONG KONG; 2 National Taiwan University of
Science and Technology, Taipei, CHINESE TAIPEI; 3 University of Leeds, Leeds, UNITED KINGDOM; 3 Beijing University of Technology, Beijing, CHINA
Abstract
1. Motivation, specific objective
Unique hue, an important concept in colour science, plays an important role in developing colour appearance models and uniform colour spaces, which significantly affects various colour-related applications, such as light source colour rendition characterization, cross media colour reproduction, and gamut mapping. Great efforts have been made to determine the unique hues through psychophysical experiments by asking observers to select samples with the four unique hues from a series of colour samples. These experiments, however, were generally carried out under the light sources simulating standard illuminants (e.g., D65, A, F2, and F11) with chromaticities on or around the Planckian locus. In addition, these experiments derived the hue angles using the samples with a relatively high chroma level, which cannot verify the hue linearity of the colour spaces.
This study aimed to investigate how light source chromaticities and the appearance of white stimuli affected unique hue judgements using Munsell samples with two chroma levels. The a priori hypotheses included: (1) the existing uniform colour spaces lack hue linearity and the hue angles of the unique hues would not be applicable to samples with low chroma levels; (2) light source chromaticities, in terms of CCT and Duv, would significantly affect unique hue judgments.
2. Methods
The experiment was carried out in a viewing booth, which was illuminated using a 14-channel spectrally tunable LED device with a horizontal illuminance of 1000 lx. The intensities of the 14 channels of the LED device were carefully adjusted to produce six light sources, comprising two levels of CCT (i.e., 2700 and 3500 K) and three levels of Duv (i.e., 0, -0.02, and -0.04), with high CRI Ra. Two circular disks, with a dimeter of 20 cm, were made, with one containing 40 V6C8 (Value 6 Chroma 8) Munsell samples and the other containing 40 V8C4 (Value 8 Chroma 4) Munsell samples. Each sample was 1 cm × 1 cm and subtended around 2° field of view; the 40 samples were pasted along the perimeter of the disk according to hue. One top of the disk, a Munsell N7 paper containing 40 holes (1 cm × 1 cm) was used, with the holes being randomly numbered from 1 to 40. During the experiment, a diffuse white tile (6 cm × 8 cm) was placed on top of the Munsell N7 paper for chromatic adaptation.
Under each light source, the observer was asked to look at the white tile for 2 minute for chromatic adaptation. Then, a colour disk, together with the Munsell N7 paper, was placed below the white tile, with the colour disk being randomly rotated. The observer was asked to look at the 40 samples and tell the experimenter which four samples had the four unique hues. Ten Asian observers between 20 and 23 years of age (mean = 21.0) participated in the experiment, with their chins being fixed on a rest during the experiment to ensure a similar viewing geometry. Each observer repeated the judgements under one light source (i.e., 2700 K with Duv = 0).
3. Results
The intra-observer variation was evaluated by comparing the two repeated judgements that were made by each observer under the same light source; the inter-observer variation was evaluated by comparing the judgements made by each observer and the average observer under different light sources. The judgements made by the observers were characterized using the CIECAM02 hue angle. It was found that the inter-observer variations were generally twice of the intra-observer variations irrespective of the unique hues. The largest inter-observer variation happened to the unique green judgements. In addition, the inter-observer variations of the unique red and blue were larger under the sources with a larger Duv.
CIE Session 2019 – Abstract Booklet
165
Though the Duv levels were found to have little impact on the selection of the Munsell samples, CIECAM02 did not always produce good predictions of the hue angles for the unique hues. The hue angles defined in CIECAM02 were similar to the unique red and green judgments made by the observers, but not to the unique blue and yellow judgements. For unique blue, the observers’ judgements generally shifted toward green. The observers’ judgements on unique yellow varied with the chroma level of the samples and Duv levels of the light sources. The unique yellow defined in CIECAM02 agreed with the observers’ judgments using the saturated samples under the sources with a Duv of 0 or those using the desaturated samples under the sources with a Duv of -0.02 and -0.04.
Moreover, CAM02-UCS was found to have a poor hue linearity. For CAM02-UCS, the iso-hue lines of unique red generally passed through the origin, while those of unique yellow and blue did not pass through the origin. For unique green, the lines passed through the origin under the 3500 K sources, but not the 2700 K sources.
4. Conclusions
Ten observers made unique hue judgements under six light sources, with different CCT and Duv levels, using V8C4 and V6C8 Munsell samples. The unique blue and yellow judgments using the saturated and desaturated samples were significantly different, which revealed serious problems in CIECAM02, CIELAB, and CAM02-UCS. In addition, the iso-lines of the unique yellow, blue, and green judgments did not always go through the origins of the a*-b* or a’-b’ planes in CIELAB and CAM02-UCS, suggesting the poor linearity of the uniform colour spaces. In short, future work is needed to further investigate the unique hues at different lightness and chroma levels under different light sources to revise the colour appearance models and uniform colour spaces.
CIE Session 2019 – Abstract Booklet
166

OP71
PROPOSAL OF A NEW WHITENESS FORMULA BASED ON CAM16-UCS
Y. Wang1, M. Wei2, X. Lv1 and M. R. Luo1,3 1 State Key Laboratory of Modern Optical Instrumentation, Zhejiang University, Hangzhou, CHINA
2 The Hong Kong Polytechnic University, Kowloon, HONG KONG 3 School of Design, University of Leeds, Leeds LS2 9JT, UNITED KINGDOM
Abstract
1. Motivation, specific objective
CIE whiteness formula includes two parts: a limit to define white colour boundary and a formula to calculate the whiteness value for the surface colours containing fluorescent whitening agent (FWAs). The formula has been used for 32 years. It has been realized to have a too constrained boundary and can only be used under CIE D65 illuminant. A CIE TC (1-95 The validity of the CIE whiteness and tint equations) was established to overcome the above problems. This paper describes a new whiteness evaluation system including a white boundary and a whiteness formula based on CAM16-UCS. It is promising that both white boundary and formula gave accurate prediction to the available datasets. Most importantly, they are based on a model of colour vision, which can accurately transform stimulus’ chromaticity from all illuminants to that of SE illuminant, and has a visually uniform colour space to define the white boundary and to calculate colour difference.
2. Methods
Different datasets were used in the present study. They are divided into two types for establishing the white boundary and for developing the whiteness formula. A brief description of each is given below.
Dataset for defining white boundary
The dataset was based on a previous experiment at the Zhejiang University. 12 observers participated in the experiment. This experiment was done under a tunable LED system, which was placed on a viewing booth. There were 3 different illuminants for CCTs at 3000K, 4000K, and 6500K. Each was adjusted to a UV level, to agree with a calibrated Datacolor SF600 spectrophotometer. 55 testing samples were measured by a JETI Specbos 1211 tele-spectroradiometer under the 6500K lighting condition in the viewing booth. Their whiteness measurement results were very close to those measured by the spectrophotometer. The same UV level was applied to the other two CCT lightings. In the formal experiment, each sample was placed in the centre of the mid-grey floor in the viewing booth. After 3 minute’s adaptation under each lighting, the observer was asked to report a judgement based on a visual scale from -3 to 3, where -3 and 3 mean a totally not white and a pure white, respectively. In total, there were 3 CCTs x 55 samples x 12 observers = 1,980 observations.
Dataset for scaling whiteness
The first dataset for scaling whiteness was collected from at the Zhejiang university (ZJU). The lighting system was the same as the described above. 4 different CCTs (3000K, 4000K, 5000K, and 6500K) were studied. The UV content was set the same as described above. Twenty-one nominally white samples with different amounts of FWAs were used in this experiment. 20 observers were asked to look at a reference sample under 6500K, which was assigned to have a whiteness value of 100, and remember its whiteness appearance. Then without looking at the reference sample, the observer evaluated the whiteness of the test samples one by one under a test illuminant and gave a whiteness value of the test sample by comparing its appearance to the memorized white appearance of the reference sample. A higher score means a whiter appearance. In total, there were 4 CCTs x 21 samples x 20 observers = 1680 observations.. This dataset is used as a training set to develop the new model (see later).
The last dataset for scaling whiteness was collected at the Hong Kong Polytechnic university, called HK dataset. There were 3 illuminants having 3 CCT, same as the ZJU dataset. 12 samples were used for the experiment. The experiment procedure was similar as the ZJU dataset, except that the observer looked at the target sample and the reference sample at the same time, i.e. haploscopic
CIE Session 2019 – Abstract Booklet
167

viewing condition. In total 4 CCT x 12 samples x 15 = 720 observations. This dataset is used as an independent set to test the models’ performance.
Development of the new whiteness formula
The new white ellipsoid is divided into two parts:
Part 1 defines the white boundary in terms of an ellipsoid (Wlimit = g11J2 + g22a2 + g33b2 + g12Ja + g13Jb + g23a*b + g1J + g2a + g3b + g0). If Wlimit is larger than one, the stimulus is located outside the boundary of the ellipsoid. Otherwise, it is considered as a white colour. The advantage of this equation is clearly defined an encapsulated ellipsoid, unlike the current CIE whiteness boundary to have drawbacks of a) an inclusion of two limits in Y, and tint (red-green), without considering yellow-blue direction in visually non-uniform xy chromaticity diagram, and b) can only work under D65 condition.
Part 2 is the whiteness formula (WJab=k1J’ + k2a’ + k3b’, where a’=a’Sample- a’Centre, and b’=b’Sample- b’Centre. All stimuli will be transformed to SE illuminant with D factor set to one.
3. Results
The ZJU and HK datasets were used to test the newly developed whiteness formula, WJab, together with the other existing formulae, WCIE, WCIE,(xn,yn), WCAT02, WCIE-Optimised, WCAT02,Optimised-D. For the HK dataset (used as testing set), the performance of different formulae in correlation coefficient (r) were 0.949, 0.909, 0.814, 0.696, 0.844, 0.937, respectively. For the ZJU dataset (used as the training set), these were 0.7712, 0.4883, 0.1774, -0.0686, 0.3413, 0.7226 respectively. It is encouraging to see that the newly developed formulae outperformed the other formulae in the training set. It also gave slightly better performance than WCAT02,Optimised-D, which is an empirical formula requiring the input of D factor.
4. Conclusions
A new whiteness evaluation system including a whiteness formula (WJab) and a white limit (Wlimit) was developed. Their special features are given below.
The whole system was developed based on the state of the art human colour vision model,
CAM16-UCS, including a robust chromatic adaptation transform and a visually uniform colour
space.
The new white limit (Wlimit) is clearly defined by a 3D ellipsoid. The current white limit has
shortages to use two limits on Y and red-green tint directions, without considering yellow-blue
direction.
The new whiteness formula performs an automatic chromatic adaptation transform to SE
illuminant and CAM16-UCS is much more visually uniform than x-y chromaticity diagram.
CIE Session 2019 – Abstract Booklet
168

Session PA8-3 D4 - Road Surface Characteristics
Wednesday, June 19, 10:45–12:05
CIE Session 2019 – Abstract Booklet
169
OP72
OPTIMIZATION OF ROAD SURFACE REFLECTIONS PROPERTIES AND LIGHTING: LEARNING OF A THREE-YEAR EXPERIMENT
Muzet, V.1, Greffier F.2, Verny P.3 1 Cerema, Equipe projet ENDSUM, Strasbourg, FRANCE
2 Cerema, Angers, FRANCE 3 Cerema, Aix, FRANCE
Abstract
1. Motivation, specific objective
Road lighting installations are designed by calculating the performance in terms of luminance distribution as defined in the EN 13201 standard. But taking into account the actual photometric characteristics of a road surface to design and then adjust a lighting installation is seldom done.
To save energy and reduce lighting pollution, the conventional technique to optimize lighting design by focusing only on the choice of optical and electrical control is no more sufficient. Until recently, the real nature of road surfaces was not known by lighting designers, and the changes of the photometry over time were completely ignored, essentially by lack of solution to overcome them. However, the road surface is a key element in lighting calculations. Adapting optical part and light distributions of luminaires to different types of road surfaces when new and along their lifetime is a challenge.
An innovative concept, called Lumiroute® was proposed by a civil engineering company and a lighting designer. The rational is to integrate the photometry of a light pavement in an adaptive LED lighting solution. The renovation of a suburban road in Limoges, France, made it possible to implement the concept in real conditions. The Cerema has been commissioned by the French Innovative Comity of Roads and Streets (CIRR) for the experimentation framework and its evaluation. The objective was to assess the innovative solution, in comparison with a conventional renovation, during the first 3 years of its lifetime, not only on photometric requirements of lighting level and uniformity, but also on energy consumption, lighting pollution and financial feasibility of the project.
2. Methods
The objective of our study is to assess the innovative solution, in comparison with a conventional renovation, during the first 3 years of its lifetime. More specifically:
• The “conventional” projects use two ordinary pavements (a raw VTAC and a water jet scrubbed VTAC) and a metal halide lamp and classic lighting design (use of standard table R3).
• The innovative Lumiroute® project uses two light pavements (a raw VTAC with light coloured aggregates, synthetic binder and adding of Ti02 and a water jet scrubbed VTAC with light coloured aggregates), adjustable LED lamps and optimised lighting design using the measured photometry of the pavements.
The study was conducted between December 2013 and September 2017. The monitoring included regular evaluations every six months:
• conventional evaluation of the road pavements (skid resistance, noise level, degradation with aging,…),
• photometric on-site evaluation of pavement with a portable measurement device named COLUROUTE (french acronym “COefficient de LUminance des ROUTEs”),
• assessment of lighting quality and compliance with normative requirements with an automatic mobile ILMD (Imaging Luminance Measuring Device) called CYCLOPE, which enables tuning of the lighting installations of the innovative sections,
• evaluations of the contribution of non-useful or potentially harmful light from lighting
installations carried out using the measured overall reflection coefficient of the carriageway ,
CIE Session 2019 – Abstract Booklet
170
on the basis of the CIE 150:2017 “Guide on the limitation of the effects of obtrusive light from outdoor lighting installations, Second Edition”
At the end of the project, an energy analysis according to EN 13201-5 and an economic analysis were also conducted.
3. Results
The on-site measurements of pavement photometry have confirmed the important initial heterogeneity of raw pavements. The water jet scrubbed sections offer interesting opportunities from the beginning because they have a low specularity and an initial homogeneity. Moreover, their increase of Q0 with time is interesting because it could compensate for lamp ageing traditionally taken into account by the maintenance factor.
The use of ILMD to characterise the photometric characteristics of the pavement was a success. It was possible to apply two reductions of the electrical power supplies of the LED luminaires, leading to more energy savings.
Generally speaking, the two Lumiroute® sections offer optimized performance and increased efficiency in comparison with the control sections, particularly with regard to light and energy performance and to the objective of controlling luminous flux. Compared to initial lighting installations before renovation (SHP 400W lamps), the savings in energy consumption are almost 90% for Lumiroute® coatings and 60% for control sections.
The additional cost generated by the innovative sections was important, especially for the synthetic one. The section using a pavement with light aggregates and water jet scrubbing and adaptable LED luminaire represents a good compromise between a moderate additional cost, the operating cost savings and the expected overall performance.
The reflection coefficient 1 of the 4 road surfaces was measured during the experiment. The two innovative pavements are systematically more reflective than conventional pavements. However, due to the use of more efficient LED luminaires, assessments of potentially lost fluxes show that Lumiroute® sections have significantly lower levels of nuisance than conventional sections (+130%).
4. Conclusions
The major outcomes of this project are:
the very good results that can be obtained when considering both the road surface and the lighting fixture when designing a road with a lighting project,
the importance of considering the real brightness and the specularity in the lighting project,
the development of a diagnostic/adjustment process in this project, showing advantages for dynamic lighting fixtures, both in global flux and in spatial distribution.
The collaboration between the world of light and the manufacturers of road surfaces showed benefits, including in sharing the knowledge and developing the links between separate professional networks.
The collection of on-site photometric measurements will also be an input for the European EMPIR SURFACE project which collects the r-tables of current and innovative road pavements across Europe in the context of a pre-normative study.
CIE Session 2019 – Abstract Booklet
171
OP73
EVALUATION OF THE PERFORMANCE OF A ROAD SURFACE GONIOREFLECTOMETER
Saint-Jacques, E.1, Prevost, C.1, Dumont, E.1 1 Université Paris-Est, COSYS, LEPSIS, IFSTTAR, F-77447 Marne-la-Vallée, FRANCE
Abstract
1. Motivation, specific objective
The reflection properties of the road pavement must be taken into account when designing road lighting installations. These properties depend on the material and the texture of the road surface and can be specified by means of a set of luminance coefficients. The luminance coefficient is defined as the ratio between the luminance of a point on a surface, and the horizontal illuminance on this surface, at the same point, produced by a lighting installation. This coefficient varies both with the lighting and viewing directions, and is thus also referred as Bidirectional Reflectance Distribution Function (BRDF). It can be determined by means of our in-house built gonioreflectometer for in-lab measurements, which was extensively presented in a previous paper. The present paper will give a summarized description of the instrument, emphasizing its suitability for road lighting applications thanks to its capabilities of measuring r-tables. Indeed, in order to design lighting installations considering road surface reflection properties, the Commission Internationale de l’Eclairage recommends measuring r-tables of the surface, which are a set of 396 values of luminance coefficients obtained at a viewing angle of 1° (motorist’s view of the surface). From the r-tables are deduced two indexes: the average luminance coefficient Q0, a metric of the diffuse reflection or the degree of lightness, and the specular coefficient S1, a metric of the degree of specularity. This paper will evaluate the performance of our gonioreflectometer in the context of road lighting, with the aim of qualifying it from a metrological point of view.
2. Methods and results
Validation of measurements with a quasi-lambertian surface
A simple means to validate measurements (at least for some lighting/viewing geometries) of the luminance coefficient carried out on our gonioreflectometer is to measure a quasi-lambertian surface whose calibrated reflectance ρ is known for a certain geometry (in our case, normal lighting direction, and viewing angle of 45°). Then its theoretical luminance coefficient is ρ/π. The measured mean luminance coefficient nears the expected one by 2%, which is acceptable.
Uncertainty calculations
Evaluation of the performance of the instrument comprises calculations of uncertainties on the measurement of the luminance coefficient. The luminance coefficient is computed after a prior calibration phase involving a quasi-lambertian surface with a known calibrated reflectance. The expression of the luminance coefficient depends on this reflectance, the viewing angle and the illuminance values measured by the sensor during respectively the calibration and the measurement phases. The standard uncertainty of the luminance coefficient can be deduced from the combined standard uncertainties of these parameters. The combined standard uncertainties on the metrics (Q0 and S1) will also be computed.
Evaluation of the influence of uncertainties on the quality of a lighting design
This paper will also present results of reproducibility of the measurements and their influence on the design of a lighting installation. Indeed, the quality of service of a lighting installation is estimated through parameters like the average luminance on the pavement, the general uniformity of the luminance, and its longitudinal uniformity. These parameters are determined from a model which takes into account the geometry of the installation (road type and luminaires placement), the photometry of the luminaires, and the r-table of the pavement. In order to evaluate the influence of uncertainty on the quality of the lighting design, a series of r-table measurements will be undertaken on two different types of road surfaces and their uncertainties will be computed. A particular lighting installation design (geometry and luminaires) will then be selected and the parameters of this lighting installation will be
CIE Session 2019 – Abstract Booklet
172

computed with respect to the two types of road surfaces measured. Variations of these parameters due to uncertainties on the luminance coefficients will be compared to the recommandations given for public lighting installations.
r-table comparisons
r-tables measured by means of our gonioreflectometer will be compared to the ones measured by the gonioreflectometer of another laboratory, although for informative purpose only, because of the lack of measurement data from a significant number of instruments. Intercomparisons of r-tables across several European countries will be done later as part of an ongoing European project (SURFACE). Our comparisons will be carried out on four different types of pavement.
3. Conclusions
As our gonioreflectometer has been specifically designed for public lighting applications, we tackle its qualification from two different perspectives, the first one being calculations of uncertainties, as done for any measurement, the second one being the assessment of the influence of this uncertainty on the quality of the road lighting design. Currently, road lighting design utilizes only the r-table for the pavement reflection properties. However, viewing angles other than the standard motorist’s 1° could be taken into account, as other road users (truck drivers, cyclists, pedestrians, visually impaired people, etc.) view the pavement at other angles. Our gonioreflectometer can be useful in that regard as it measures at any viewing angle, and we will discuss new indexes arguably more suitable than the traditional Q0 and S1.
CIE Session 2019 – Abstract Booklet
173

OP74
INFLUENCE OF MATERIAL CHARACTERIZATION IN THE DESIGN OF TUNNEL LIGHTING INSTALLATIONS
Iacomussi, P.1, Rossi, G.1 1 INRIM, Torino, ITALY
Abstract
1. Motivation, specific objective
The luminance coefficient is an essential parameter for the design of efficient road lighting installations according to luminance criteria: the road must have an average luminance value to assure safety for road users.
Usually, road luminance values required in worldwide standards (CIE, CEN, IESNA) are obtained through calculations, considering the luminous intensity distributions of luminaires and the pavement reflective properties as tabulated, only for a few selected geometrical conditions, in reference tables published inside standards or in the CIE 144 technical report, a de facto standard. These reference tables provide values based on measurements performed more than 40 years ago and not for all the geometrical conditions necessary, like in the European standard. European union recognize this lack of data and funded through the EURAMET (the association of European Metrological Institutes) the EMPIR programme, a project with the task of providing new optimized geometries and traceable data of road reflection properties to design smart and efficient road lighting.
It is well known that the current available reference data for road lighting design can lead to errors on average luminance often over 30% and sometimes over 50%, because reflectance data are no more representative of actual road surface.
Tunnel lighting is a specific application of road lighting, with its own peculiarities because tunnel environment is very far from open road situation. In particular, additional aspects like: driver visual adaptation, internal inter-reflections (walls and ceilings), different lighting geometries, reduced height of installation of luminaires and a variability on the visual requirements along the tunnel length should be considered in tunnel lighting design.
2. Methods
CIE publication 189 suggests several additional quality parameters to consider in design stage but also for on site verification, all specifics for tunnel lighting like: wall luminance, revealing coefficient, threshold increment, transverse mean luminance (walls and road).
The CIE document also recognizes that, unfortunately, no bi-directional reflection (BRDF) data for tunnel surfaces are commonly available nor recommended calculation procedure and suggests to consider all tunnel surfaces (road excluded) as lambertian surfaces for inter-reflection calculations. The lambertian behaviour is also considered for the calculation (at design stage) of walls luminance from the vertical illuminance values.
The lambertian generalisation brings to low reliability of the calculated values of tunnel lighting as highlighted when the calculated values are compared with measured ones. The use CIE144 r-tables of road surface brings to the aforesaid discrepancies because their low representativeness of current road surfaces but considering the geometrical constrains a subset of incidence – observation angle could be adopted to simplify the onsite measurement of the road surface optical characteristics.
3. Results
Several samples of tunnel walls have been characterized for their BRDF properties using a goniophtometer for material characterisation realised in an European National Metrology Institute (NMI). Then different calculation procedures for the same tunnel lighting have been performed considering CIE tabulated r-tables and measured r-tables, for the case of tunnel walls lambertian behaviour or measured bi-directional measured data. The results show significant discrepancies between the different procedures, especially for quality parameters related to transverse properties (transversal illuminance and luminance uniformity and average values). A significative contribution
CIE Session 2019 – Abstract Booklet
174
relays in the evaluation of the measurement uncertainty both in BRDF and r-tables. Simulations show that if the measurement uncertainty in the r-tables or in the BRDF of surfaces is lower than 6% no great advantages are clearly evident, because the results are mainly affected by tolerances in the luminous intensity distribution of luminaires. A reasonable compromise in term of cost benefit ratio consist in measuring BRDF with uncertainty greater than 5% but lower than 10%.
CIE Session 2019 – Abstract Booklet
175

OP75
USE OF AN IMAGING LUMINANCE MEASUREMENT DEVICE TO EVALUATE ROAD LIGHTING PERFORMANCE AT DIFFERENTS ANGLES OF OBSERVATION
Greffier, F.1, Muzet, V.2, Boucher, V.1, Fournela, F.1, Dronneau, R.1 1 Cerema, Laboratory Department of Angers, FRANCE
2 Cerema, Laboratory of Strasbourg, FRANCE
Abstract
1. Motivation, specific objective
A large part of the information used by a driver is supplied to him by his visual system. Therefore, most specifications of road equipment standards are directly derived from human visual abilities. We can mention standards referring to road markings or road signs, and especially to road and tunnel lighting installations.
Performance requirements of road and tunnel lighting are defined in CIE (International Commission on Illumination) or CEN (European Committee for Standardization) documents. For drivers of motorized vehicles, the main lighting criteria are based on the road surface luminance and include the average luminance, the overall uniformity and the longitudinal uniformity. Conventionally, in these documents, the driver’s eye is assumed at 1,5 m above the road surface and the angle of observation is fixed to 1° below the horizontal, corresponding to a distance of 86 m ahead of the observer. This geometry does not correspond to night driving in urban areas or in urban tunnels, where speeds are generally in the range of 30 to 50 km/h.
Therefore, we propose to evaluate the values of lighting criteria for other angles of observation and thus distances closer to the vehicle, which better corresponding to urban driving.
2. Methods
Cerema has developed an automatic system for measuring road and tunnel lighting performance. This system is based on an Imaging Luminance Measurement Device (ILMD) fitted aboard a vehicle. It provides luminance maps of road scenes computed from each image recorded in motion. In traditional use, the normative measurement grid for performance calculation is projected onto the images by using pinhole camera model, road marking detection and robust fitting. Once the measurement grid has been positioned, the conventional calculations of average luminance, overall and longitudinal uniformities can be performed.
In our new approach, the measurement area projected onto the images is fixed at a distance that always offers the same angle of observation. The area still extends in the transversal direction over the entire width of the roadway. In the longitudinal direction, it extends over a distance that allows a continuous measurement without overlap between two areas issues of two successive images. The measurement grid between two luminaires is then reconstructed from successive areas (images are captured approximately every meter). Calculations of average luminance and uniformities are then still possible.
This new method allows the angle of observation to be changed while maintaining the ability to evaluate the lighting criteria.
3. Results
In a first step, to validate our proposal, we used the standard angle of observation of 1°. We compared our results with the standardized method. We obtained similar values of average luminance and uniformities with both calculations.
In a second step, we changed the angle of observation to take into consideration the urban driving in night-time and the different types of users. We applied our methodology for angles of 2.29°, 3° and 5°. We tested these set of angles for road lighting and in tunnel. Significant differences exist in the results of the average luminance. We also proposed a discussion for uniformities calculations with these new angles.
CIE Session 2019 – Abstract Booklet
176

4. Conclusions
This exploratory study is based on real luminance measurements and a new method of measurement and calculation from images captured by an ILMD.
The first calculations show an important influence of the angle of observation on the lighting criteria.
The results obtained will be consolidated with new series of measurements and cross-referenced analyse with measurements of pavement photometric caracteristics on same sites and at the same angles of observation.
All these results are of interest to the Empir SURFACE project (16NRM02 Surface pavement surface characterization for smart and efficient road lighting).
CIE Session 2019 – Abstract Booklet
177

Session PA9-1 D2 - Spectroradiometry
Wednesday, June 19, 13:15–15:15
CIE Session 2019 – Abstract Booklet
178

OP76
COMBINED OUT OF RANGE AND IN BAND STRAY LIGHT CORRECTION FOR ARRAY SPECTRORADIOMETERS
Zuber, R.1, Ribnitzky, M.1 1 Gigahertz-Optik GmbH, Türkenfeld, GERMANY
Abstract
1. Motivation, specific objective
Typically insufficient stray light rejection of array spectroradiometers in the blue and especially in the UV spectral range limits the application of these devices. One such important example would be UV hazard measurements. The measurements required to determine the American Conference of Governmental Industrial Hygienists (ACGIH) corneal hazard of broadband UV sources make particularly high demands on the suppression of stray light. The same applies to the photobiological safety of IEC/DIN EN 62471 or ICNIRP (International Commission on Non-Ionizing Radiation Protection) UV measurements. Hence, the accepted technology/devices are double monochromator based systems.
This study shows that a combination of stray light suppression by different correction methods can improve the stray light reduction performance for UV array spectroradiometers significantly to meet these requirements.
2. Methods
In an array spectroradiometer two different types of stray light can be distinguished by its origin. The so called out of range (OoR) stray light is generated by a signal outside the spectral range of the spectroradiometer; Stray light originating from within the spectral range of the spectroradiometer is referred as in band (IB) stray light. The OoR stray light can be measured and corrected by using edge filters for instance. However, these methods are not able to correct for IB stray light. The IB stray light can be corrected by using established stray light matrix correction (SLMC) methods. The presented study uses a combination of both methods in order to achieve significantly improved performance; especially for dedicated UV array spectroradiometers which are silicon detector based and therefore, depending on the light source, may have significant OoR and IB stray light.
An intercomparison of a corrected and an uncorrected array spectroradiometer and a double monochromator has been performed by measuring different light sources (tungsten, xenon, sunbed tanning lamp, LED).
3. Results
The ACGIH Eeff (Eeff = effective irradiance; weighted; identical ICNIRP weighted) values measured with the uncorrected array spectroradiometer showed expected large deviations of 73% for the sunbed tanning lamp and 105% for the halogen lamp relative to the double monochromator.
With the use of SLMC, the deviations for the sunbed tanning lamp where within 4%. However, the deviations for the halogen lamp did not improve significantly. With the use of OoR correction, the deviation of the halogen measurement was within 3%, but the OoR correction could not improve the sunbed tanning lamp measurement.
With both correction methods combined, all Eeff values measured with the array spectroradiometer (independent of the light source measured) were within 4% of the double monochromator measurements.
The measurements of the sunbed tanning lamp showed that the double monochromator had a detection limit of 2E-5 W/m²/nm. The stray light corrected array spectroradiometer reached a detection limit of 3E-5 W/m²/nm. Without the stray light correction, the detection limit of the array spectroradiometer was limited to 5E-4 W/m²/nm.
CIE Session 2019 – Abstract Booklet
179
4. Conclusions
This study shows that a combination of different stray light correction methods can significantly improve the stray light suppression performance in an array spectroradiometer that enables new applications for these devices such as UV hazard evaluations according to ACGIH/ICNIRP or IEC/DIN EN 62471. Due to the combination of the correction methods the quality of the stray light correction for UV array spectroradiometers does not depend on the light source measured and a detection limit of 3E-5 W/m²/nm comparable to a typical double monochromator (2E-5 W/m²/nm) can be achieved.
CIE Session 2019 – Abstract Booklet
180
OP77
CALIBRATION OF SPECTRORADIOMETERS USING TUNABLE LASER SOURCES
Zong, Y., Shaw, P.S., Rice, J.P., Miller, C.C. National Institute of Standards and Technology, Gaithersburg, Maryland, USA
Abstract
Spectroradiometers are typically calibrated against broadband transfer-standard sources (e.g., deuterium lamps for the deep ultraviolet (UV) region and quartz tungsten halogen lamps for the UV, visible, and infrared (IR) regions). Using this conventional source-based calibration approach, however, the uncertainty in measured spectral irradiance or radiance responsivity of a spectroradiometer is dominated by the transfer-standard sources which is typically about 1 % in the visible and IR regions and much larger in the UV region. Such a high uncertainty arises because of a long chain of calibration in calibrating the transfer-standard sources. For example, when a FEL lamp is used for calibrating a spectroradiometer, the scale of the FEL lamp is derived and transferred in sequence from (1) primary cryogenic radiometer, (2) transfer trap detector, (3) reference field radiometer, (4) gold point blackbody, and (5) high temperature blackbody.
To shorten the long calibration chain and therefore to reduce spectroradiometer’s calibration uncertainty, we calibrated a spectroradiometer directly against a transfer trap detector (i.e., bypassing most of the scale transfers mentioned above) using tunable lasers and achieved a calibration uncertainty of 0.2 % (k=2). Note that the responsivity obtained using the monochromatic laser source is the spectroradiometer’s power responsivity at a fixed wavelength, which often needs to be converted to the spectral irradiance or radiance responsivity for measurement of broadband sources that have continuous spectra. To obtain spectral irradiance or radiance responsivity from the measured power responsivity, the pixel-to-pixel wavelength intervals of the spectroradiometer are required to have an uncertainty smaller than 0.01 nm to avoid a large conversion uncertainty such as 1 %.
We recently developed a method for determining the pixel-to-pixel wavelength intervals with an uncertainty on the order of 1 pm by calibrating the spectroradiometer for its wavelength scale with 5 nm interval across its entire spectral region using a tunable laser and a high accuracy laser spectrum analyser, which reduces the conversion uncertainty from 1 % level to 0.1 % level and makes the overall uncertainty for spectral irradiance or radiance responsivity as small as that for the measured spectral power responsivity (0.2 %). This is a significant reduction compared to those using broadband transfer-standard sources. The detector-based calibration method also eliminates the stray-light error that is often the dominant source of calibration error in the UV region when a broadband transfer-standard source is used.
With this low-uncertainty detector-based calibration method, new spectroradiometer-based transfer standards can be developed to disseminate spectral irradiance or radiance scale with a smaller uncertainty.
CIE Session 2019 – Abstract Booklet
181

OP78
THE DESIGN AND DEVELOPMENT OF A TUNABLE AND PORTABLE RADIATION SOURCE FOR IN SITU SPECTROMETER CHARACTERISATION
Porrovecchio, G1, Burnitt, T.2, Linduska, P., Staněk, M.3, Smid, M.1 1 Czech Metrology Institute, Brno, Czech Republic, 2 Principal Optics, Reading, UNITED KINGDOM,
3 Czech Hydrometeorological Institute, Hradec Kralove, CZECH REPUBLIC
Abstract
1. Motivation, specific objective
Dobson and Brewer spectrophotometers are the main instruments used to monitor the ozone layer, even though Dobson spectrophotometers are no longer being manufactured. Even though each network-type is in itself consistent, total column ozone retrieved from the two instrument types differ by up to 3 %, which is significantly larger than the consistency of better than±0.5 % which can be achieved within Brewer or Dobson spectrometers instruments network. Therefore this large discrepancy currently precludes a merging of both datasets and an eventual replacement of one instrument with another type. There is therefore a need for an improved characterization and calibration of the Dobson and Brewer instruments, particularly by involving the reference instruments of each network. The bandwidths and wavelength scale accuracy of the Dobson spectrophotometer are not known for each instrument, but assumed to be equal to the world reference Dobson. Currently tuneable monochromatic sources which could be used for characterisation of Dobsons and Brewers are complex and cumbersome systems that are only found in a few laboratories world-wide and cannot be used for in field calibrations as requested by this global spectrometers network. This work describes the design and development of a field tuneable and portable radiation source ( TuPS ) for the wavelength range 300 nm to 350 nm for in-field characterization of Dobson spectrometers wavelength scale accuracy and slit-function measurements uncertainties of better than 0.05 nm and 0,02 nm in bandwidth and reports on its long-term temporal stability. The TuPS is moreover designed such that only minor modification of its optical system extends/shifts its spectral range towards visible and near-infrared spectral region and thus expend its application for spectral characterisation of any spectrometers in relevant spectral region of interest.
2. Methods
The TuPS system is optically similar to a spectrometer but modified to act as a narrow-band tuneable filter for a broadband source, thus producing a narrow-band tuneable source. It consists of a 100 µm input pinhole, a 100µm output slit, two identical off axis-parabolic mirrors 3600 l/mm grating. Radiation from the input pinhole is collimated by a parabolic mirror and illuminates the grating. The resulting diffracted radiation is focussed by the second parabolic mirror forming a spectrum across the exit slit. The central output wavelength is controlled by the angle of the grating, and the bandwidth by the width of the exit slit. A very small vertical shift in the image at the exit port is associated with the rotation of the grating. This shift is of no consequence to the subsequent use of the instrument other than that an exit pinhole may block some of the radiation as the image moves. Therefore an exit slit is used instead. An optical fibre coupled high intensity broadband Laser Driven Light Source (LDLS) was used as input radiation source. All system was designed such that the FWHM of emitted radiation didn’t exceed the value of 0.05 nm for whole spectral range of interest.
3. Results
The TuPS wavelength scale calibration, i.e. the determination of the relation between the TuPS grating angle and the selected central wavelength of the optical radiation emitted from the TuPS output slit, was performed using the fibre coupled CMI tuneable Optical Parameter Oscillator laser facility (OPO). The OPO laser radiation wavelength is measured by the CMI reference laser wavemeter and determined with the accuracy better than 0.02 nm. The same facility was used to determine the bandwidth of the TuPs emitted quasi-monochromatic radiation. In terms of the bandwidth the values smaller then 0,02 nm FWHM were measured over all intended spectral range of interest, the uncertainty of set central wavelength of TuPS emitted radiation exceed 0.05 nm over all intended spectral range of interest. Regular TuPS calibration was performed before and after two camping of in-field calibration measurements in Spain and Germany over the period of approximately
CIE Session 2019 – Abstract Booklet
182
one year in 2017 have shown the temporal stability of both key parameters better than 0.02 nm (which includes the transportation of the system to and from the measurement sites)
4. Conclusions
The Tuneable Portable Source (TuPS) was developed as an instrument to be used for determining the slit function and centre wavelength of a Dobson Spectrophotometer. TuPS was characterized at CMI for both bandwidth and the central wavelength accuracy all over the spectral range of interest. Wavelength scale calibration and the investigation of FWHM bandwidth of emitted radiation was performed using the fibre coupled CMI tuneable laser facility – 1kHz ns pulsed OPO in combination with the CMI reference wavemeter and they were proved to be better than 0.5 nm and 0.02 nm in respect. Moreover the long term (one year) temporal stability of both key parameters is better than 0.02 nm.
The TuPS is moreover designed such that only minor modification of its optical system extends/shifts its spectral range towards visible and near-infrared spectral region and thus expend its application for spectral characterisation of any spectrometers in relevant spectral region of interest.
This work has been supported by the European Metrology Research Programme (EMRP) within the joint research project EMRP ENV59 ATMOZ “Traceability for atmospheric total column ozone”. The EMRP is jointly funded by the EMRP participating countries within EURAMET and the European Union
CIE Session 2019 – Abstract Booklet
183

OP79
PHOTOMETER SPECTRAL RESPONSE MEASUREMENT USING OPO TUNABLE LASER
Zhao, W.Q., Liu, H., Yan, J.Y., Su, Y., Jiang, L. ,Wu, Z.F. National Institute of Metrology, CHINA
Abstract
1. Motivation,
For colour LED photometry measurement, one of the significant measurement uncertainties comes from colour correction factor (CCF), when the relative spectral response of the photometer S*(λ) is different from the photopic luminous efficiency function V(λ). The CCF is determined by S*(λ),V(λ), spectra of measurand and spectra of CIE A illuminant. Therefore, an accuracy S*(λ) measurement result of the photometer helps to get a low uncertainty CCF. That means lower measurement uncertainty of LED photometry measurement, especially for blue LEDs.
2. Methods
The pulse OPO tunable laser of a1 kHz repetition frequency system, which covers the range of 210 nm ~ 2400 nm spectrum, was used to calibrate silicon photodiode with a low measurement uncertainty in previous reports. Great potential in field of photometry and radiometry is shown. In this report, we have recently setup a photodetector spectral response measurement system using an OPO tunable laser. The OPO tunable laser system has a pulse laser of 1k Hz repetition frequency and each pulse has a ~5ns pulse width. In the visible range of 405 nm ~ 780 nm, the width at half maximum of the pulse spectra is smaller than 0.2 nm. The facility is fully automated, easy to maintain and friendly to use.
After coming out of OPO, the laser light beam is coupled into a fibre and passes through the ultrasound bath, and then inject into an integrating sphere. The aperture of the integrating sphere is the light source for the measure system.
To measure S*(λ) of the photometer, the detector under test (DUT) is made of a silicon photodiode with a V(λ)-correction filter. The standard detector (STD) is a three-silicon S1337 trap detector. The substitution method is used when DUT and STD are mounted on motorized stage. Because the OPO tunable laser is not stable as the continue-work laser does, monitor detector (MD) is need, and be fixed with the same distance to the output integrating sphere as the DUT/STD does, but with a different angle. Baffles and light traps are used to contain the stray light.
3. Results
The relative standard deviation (RSD) of the measurement is less the 0.01% in the range of 460 nm ~ 580 nm, and is ~0.01% in the range of 440 nm ~ 460nm and 580 nm ~ 660 nm. RSD increases in the violet zone the deep red zone, due to the weak output signal of the photometer.
For most of blue LED, the wavelength of spectra peak is of ~ 450 nm. The measurement results shows a good signal to noise ratio (> 5000:1) and good repeatability at 450 nm. Uncertainty evaluation is still on-going, however we believed it will give a lower number compared to traditional method for measuring S*(λ) of the photometer.
4. Conclusions
We setup an S*(λ) of the photometer measurement facility using a 1 KHz pulse OPO tunable laser. The system is fully automated and friendly use. The DUT is made of a silicon photodiode with a V(λ)-correction filter and STD is a three-silicon S1337 trap detector. The substitution method is used. The relative standard deviation is less the 0.01% in the range of 460 nm ~ 580 nm, and is ~0.01% in the range of 440 nm ~ 460nm and 580 nm ~ 660 nm. We believe this facility helps to improve the accuracy for LED measurement in our institute.
CIE Session 2019 – Abstract Booklet
184

OP80
AN UNCERTAINTY ANALYSIS OF PHOTOMETRIC RESPONSIVITY BASED ON SPECTRAL IRRADIANCE RESPONSIVITY
Schneider, P.1, Sperling, A.1 1 Physikalisch-Technische Bundesanstalt, Braunschweig, GERMANY
Abstract
1. Motivation, specific objective
For a new and more direct radiometric traceability chain for luminous intensity at Physikalisch-Technische Bundesanstalt (PTB) a novel detector was developed. Its modular design is based on a trap detector modified by filters and apertures to embody the different steps of the new traceability chain starting at the primary standard for optical power and ending with the calibration of standards for luminous intensity. The final key property of the detector is the photometric responsivity and its uncertainty. The calculation of the uncertainty of integral quantities and especially of the photometric responsivity is indubitably of importance and has been part of research and of written standards for a long time. A Monte Carlo approach to calculate of the photometric responsivity and its uncertainty for the new detector was employed and expended for the use with other detectors and for luminous intensity and illuminance of LED standard lamps. Calculations and considerations dealing with spectral correlations and bandwidth effects will be presented.
2. Methods
When determining integral photometric quantities with the aid of a spectrally calibrated detector, the quality and correlation of the data of the detector regarding its irradiance responsivity is crucial. To show the influence of correlations the uncertainty propagation was investigated for two different types of detectors, the first being the calibration of the new modular photometric trap detector. Secondly a radiometric reflection trap detector used to determine the illuminance of LEDs by measuring their
integral irradiance in combination with mathematical weighting according to V() was investigated. The setup used to characterise the irradiance responsivities comprises a stabilised pulsed laser setup tuneable from the UV to NIR spectral range and a monochromator to modify the bandwidth of the radiation. Regarding the measurement uncertainty the major components influencing the irradiance responsivities uncertainty were investigated including uniformity effects, wavelength uncertainty and bandwidth correction.
To handle the several contributions the Monte Carlo approach was established on all contributing quantities and correction factors. To analyse the combined uncertainty and the impact of the single contributions, all factors were fixed to their mean value despite the factor being evaluated. This offers a practical way for identifying limiting uncertainty contributions. Additionally, the effect of changing covariance matrices for the reference detector and different approaches for calculating bandwidth correction are implemented.
Detailed considerations about the calibration procedures of the reference detectors affecting the spectral correlations are provided. Subsequently, several covariance matrices and their influence on the uncertainty, in particular the integral magnitude of the photometric sensitivity, were calculated to get an overview of how the spectral correlation affects the uncertainty and how they can be treated by roughly estimated or detailed covariance matrices.
3. Results
A limitation of the uncertainty by two major components, the reference detectors responsivity and the aperture area (for the transmission from flux to irradiance), was confirmed as could be expected based on previous photometer calibrations. Regarding the new modular photometric trap detector design this limitations originating from the detector properties itself are reduced significantly.
Two separate approaches to bandwidth correction were compared. On the one hand, an deconvolution approach was used in which the measured bandpass of the monochromator used was used directly to correct the bandwidth effects. On the other hand, an approach which uses the second derivative of the sensitivity and an approximation of the band-pass function has been found to be
CIE Session 2019 – Abstract Booklet
185

suitable. Both approaches lead to similar corrections and uncertainty contributions. The second approach proved to be more stable in the calculation on the assumption that the reference detector and the detector to be calibrated have similar properties. The inclusion of spectral correlations of the integral quantities in the data of the reference detector in the determination of the measurement uncertainty proves necessary. Interpolation models used for the reference detector can easily introduce correlations as well as the use of monochromator based broadband calibration setups. Depending on the origin of the correlation and the affected spectral range, a conservative estimate of the correlation effect was obtained assuming a complete correlation of the entire spectral range.
4. Conclusions
The implemented Monte Carlo approach proved to be versatile and easy to adopt for different measurement conditions. In particular, the effects of the correlations are taken into account when using the interpolation between the measured wavelengths and when considering integral quantities such as the photometric sensitivity. The usability of the approach for different detectors was demonstrated by the calibration of an reflection trap detector used to measure LED illuminances. The uncertainty calculation will be used for the calibration of photometric detectors and the upcoming new radiometric traceability at PTB.
CIE Session 2019 – Abstract Booklet
186

OP81
GENERAL TOOL FOR ESTIMATING EFFECTS OF UNKNOWN CORRELATIONS ON SPECTRAL INTEGRALS
Pulli, T.1, Vaskuri, A.1, Kärhä, P.1, Mäntynen H.1, Ikonen, E.1,2 1 Metrology Research Institute Aalto University, Espoo, FINLAND, 2 VTT Technical Research Centre
of Finland Ltd, Espoo, FINLAND
Abstract
1. Motivation, specific objective
Spectral data are often used for calculating photometric and colorimetric quantities, such as illuminance, colour coordinates, and correlated colour temperature (CCT). Spectral measurements are also required for calculating spectral mismatch correction factors that reduce uncertainties in photometric measurements caused by the non-idealities in the spectral responsivities of photometers. Furthermore, spectral information is vital, e.g., in solar ultraviolet (UV) and consequently in atmospheric ozone measurements.
Estimating the effect of the measured spectral data on the overall uncertainty of spectral integrals can be challenging, because in addition to the uncertainty at each measured wavelength, one should take into account the potential correlations between the values at adjacent wavelengths. In some cases, the correlation coefficients can be determined easily, e.g. deviations in spectral irradiance caused by an error in the measurement distance are fully correlated, while measurement noise leads to uncorrelated uncertainties between the values at different wavelengths. In many cases, the correlations between the wavelength components take a more intricate form, and can thus be difficult and sometimes practically impossible to assess given the information available. These kinds of correlations can be caused, e.g., by interpolation functions and models fitted to the spectral data, as well as the temporal and temperature-dependent instabilities of the source and the measurement instrument. The objective of this study is to describe a general method for assessing the effect of unknown correlations in spectral data on the uncertainties of derived quantities consisting of spectral integrals.
2. Methods
The method for studying the effect of unknown correlations in spectral data is based on Monte Carlo analysis where the measured spectrum is deviated by a continuous function and the derived quantity under study is calculated with the altered spectrum. This process is repeated multiple times with varied deviation functions to obtain a value distribution for the derived quantity. This distribution can then be used to estimate the uncertainty of the quantity arising from the spectral uncertainties with unknown correlations.
The deviation functions are constructed as a sum of orthogonal functions, such as trigonometric functions or Chebyshev polynomials. In practice, sinusoidal base functions are optimal for creating arbitrary spectral deviations since they have a clearly defined Nyquist criterion with respect to a fixed step size of the measurement. The weighting factor, or amplitude, of each component function is selected at random in such a way that the standard deviation of the resulting deviation function corresponds to the combined standard uncertainty of components in the measured spectral quantity with unknown correlations. The number of orthogonal component functions to be included in the generated deviation function is case-dependent. For example, if gradual temperature changes are expected to be the main source of uncertainties, slowly varying functions, such as low frequency trigonometric functions, may yield the most realistic uncertainty values. On the other hand, if the main uncertainty contribution comes from polynomial fitting, the number of orthogonal functions to be included is proportional to the order of the polynomial. The effect of spectral uncertainty components with known correlation coefficients should be considered separately in the uncertainty analysis.
3. Results
Compared with simplified analysis methods where the uncertainties of the spectral data are assumed to be either fully correlated or fully uncorrelated, the described method can lead to notably higher uncertainty contributions for derived quantities which consist of ratios of spectral integrals. This is the
CIE Session 2019 – Abstract Booklet
187
case with, e.g., colour coordinates and spectral mismatch correction factors. In such calculations, the propagation of fully correlated uncertainties is eliminated by the division, and the effect of random noise is diminished by the integration over the wavelength range of interest. Correlation scenarios between these two extremes yield significantly higher deviations in the derived quantities. In addition to calculating the uncertainties, the method can be used to find out which forms of correlations produce the highest deviations in a given application, making it easier to identify which aspects of spectral measurements should be improved in the future.
The method is validated by analysing the results of a key comparison for spectral irradiance (CCPR-K1.a) as a comparison of correlated colour temperature. The described method gives expanded uncertainties for CCT that cover the observed deviations from the reference value, whereas the simplified analysis methods would not.
4. Conclusions
Correlations between the measured spectral values at different wavelengths can significantly affect spectral integrals and consequently the uncertainty of a quantity that is derived from the spectrum. In many cases, a complete analysis of the correlations is not possible given the available information. For example, external laboratories do not necessarily provide correlation data with the calibration results of sources and detectors. The described method allows one to estimate the effect of unknown correlations on the overall uncertainty of the derived quantity, based on a rough estimate of the shape and complexity of the correlations. In many cases, the method leads to significantly higher uncertainties for the derived quantities compared with a simplified uncertainty analysis where correlations are neglected, or assumed to be unity. In principle, the use of the method is not limited to spectral data and could also be utilized for analysing the uncertainties of quantities derived from other continuous data, such as bidirectional reflectance and transmittance distribution functions (BRDF and BTDF), angular distributions, or spatial profiles.
CIE Session 2019 – Abstract Booklet
188

Session PA9-2 D4 - Visibility and Visual Performance
in Road Lighting Wednesday, June 19, 13:15–15:15
CIE Session 2019 – Abstract Booklet
189

OP82
UNDERSTANDING DRIVER VISUAL PERFORMANCE BY EXAMINING DISTRIBUTIONS OF DETECTION DISTANCES
Bhagavathula, R.1, Gibbons, R.B.2 1 Virginia Tech Transportation Institute, Blacksburg, Virginia, USA
Abstract
1. Motivation, specific objective
Modelling visual performance of drivers at night is complex. In addition to factors like luminance, contrast, observer age, and object size, research has shown that motion of the object and the expectancy (anticipation of the presence of an object) of the observer play an important role in the observer’s ability to detect an object on the roadway at night. Thus, it is important for a visual performance model to account for these factors. Accounting for these factors could result in highly complex models as accurately measuring driver expectancy and attention is difficult. Therefore, we argue that deterministic models such as VL, and RVP which work well in static environments, their use is limited in realistic nighttime driving situations. We believe that a probabilistic approach to model nighttime driver visual performance could offer a better approach.
In a probabilistic modelling approach, the variable of interest is treated as a random variable and the probability distribution of this variable is studied as a response to different conditions. In the case of night driving, we propose the use of detection distance of an object (such as a pedestrian, or standard visibility target). Detection distance is a measure of the reaction time of the driver. By studying the distribution of detection distances of objects under different lighting conditions we can accurately understand the change in the detection probability of an object as a driver approaches an object. For instance, in a night driving situation, for driver approaching an object on roadway, the probability of the driver detecting the object increases as he/she gets closer to the object. By measuring the detection distance of object, a distribution of the detection distances for that object can be developed, which will help understand the probability of detecting the object at difference distances on a vehicle’s approach.
Researchers in the field of cognitive psychology have started studying reaction time (RT) distributions to better understand human response and perception. Like RT, detection distance is bounded by zero at one end and extends to almost infinity (theoretically) at the other end. This distribution behaviour is accurately described by the Weibull function. RTs in different kinds of cognitive tasks have been successfully modelled using the Weibull distribution.
The current paper has two goals. The first goal is to test if the detection distance distributions are accurately defined by the Weibull distribution. The second goal is to understand how different lighting configurations and light levels affect the detection distance distributions of a small target (18 cm by 18 cm). This will be accomplished by performing a distribution analysis involving fitting a Weibull distribution to the detection-distance data. The distribution fit will indicate how parameters like shape and scale vary across different conditions and their practical impacts on driver visual performance.
2. Methods
Twenty-four participants completed the study, and were categorized into two age groups (younger and older), each of which was gender balanced. The younger group comprised participants aged 18–35 years (M = 30.8 years, SD = 2.7), while members of the older group were all 65 years or older (M = 68.2 years, SD = 1.6). These age ranges were intended to capture a wide range of driving experiences as well as a broad range of visual capabilities.
Visual performance was measured using a target detection distance, while participants drove at night through a realistic roadway intersection under several conditions involving different lighting configurations (three) and illuminances (five). This study was conducted at the intersection on the Virginia Smart Road at VTTI. The Smart Road is a 2.2-mile-long, controlled access roadway research facility built to United States highway standards. In a given experimental session, participants encountered one lighting configuration, all five illuminances, and all target locations within each illuminance. The remaining lighting configurations were encountered in subsequent sessions. Presentation orders of both lighting configuration and illuminances were counterbalanced across
CIE Session 2019 – Abstract Booklet
190

participants to reduce potential order-related confounding effects. Target presentation had blanks (no target presentation or null condition) included as catch trials to keep the participants from guessing.
Cramér–von Mises Goodness of Fit was used to assess if the detection distance data followed a Weibull Distribution. If the detection distance data fit the Weibull distribution, the shape and scale parameters of the fitted Weibull distribution were calculated to assess the effects of changing lighting configurations and illuminances.
3. Results
The results from the Cramér–von Mises Goodness of Fit test indicated that the Weibull distribution fit the detection distance data. Differences in the scale and shape parameters of the fitted distributions were dependent on the lighting configuration and illuminance. The scale parameter closely followed the mean detection distance of the target.
4. Conclusions
Based on the results of the study two major findings were evident. First, it was determined that Weibull distribution could be used to fit the detection distance data. Second, the results showed that the lighting configuration and illuminance influence the parameters of the distribution. The distribution of detection distances can be used to evaluate the performance of a new intervention (for example, a new lighting system, lighting level, etc.) by determining the tails of the distribution. Determination of the tails (especially the lower tail or the fifth/tenth percentile) of the distribution is of great importance as it shows where the worst performers detected the objects. This will also help not only in determining the effectiveness of interventions, but also in designing safer interventions that will account for the worst performers.
CIE Session 2019 – Abstract Booklet
191
OP83
ILLUMINATION REQUIREMENTS FOR GAZE PERCEPTION
Donners, M.A.H.1, Elders, B.T.1, Vogels, I.M.L.C.2, Cuijpers, R.H.2 1 Signify, THE NETHERLANDS, 2 Eindhoven University of Technology, THE NETHERLANDS
Abstract
1. Motivation, specific objective
The primary aim of road lighting is to provide safety for road users. Peoples’ decisions, both on strategic and on tactical level, depend on their feeling of safety. Many decisions, like the choice of transport mode, the route to take, or whether to go out at all, depend on how safe people feel. The level of reassurance felt by a road user depends, among others on how well they can see their environment, including the other road users. Among road users, this is particularly important for pedestrians and cyclists, as they lack the protection of a vehicle. Pedestrians are even more vulnerable as they are generally slower. For them, a major source of potential danger are other pedestrians. Therefore, being able to perceive the identity, emotion and, or, intention of other pedestrians is very important. This depends on the perception of facial features. The direction of gaze of others is, often unconsciously, used as a clue to determine where the others’ attention is directed. Gaze perception has been identified as one of the most difficult visual tasks, requiring highest light levels among pedestrian visual tasks.
To enable face perception, current lighting recommendations, such as CIE 150:2010 or the derived EN 13201:2014, provide additional requirements for minimal vertical illuminance levels in pedestrian and low speed traffic areas “if facial recognition is necessary”, with the required minimal vertical illuminance in a range of 0.6 lux to 5 lux, increasing with the average horizontal illuminance level. Although it sounds logical that the required illumination on the face would depend on the background light level, determining the adaptation state of the observer, there is no known experimental evidence for the chosen level of vertical, in relation to the horizontal illuminance. Previous research suggests that pedestrians typically evaluate oncoming pedestrians at 10 to 15 meters and in about 0.5 second. Looking at the above, several questions come up. Which level of vertical illuminance is needed for confident gaze perception at distances between 10 and 15 meter? And how does this level depend on the background illumination level?
2. Methods
Here, we describe an experiment which collected perceived gaze directions, using a methodology known from studying gaze perception in the context of social interaction with other people or with robots. Thirty participants were tested, half of them between 25 and 35 years old and the others between 55 and 65 years old. They had to point out on a ruler the position where they believed an actor was looking. The test was performed under 5 levels of vertical illuminance and 3 levels of horizontal illuminance chosen to span the respective ranges given by the current recommendations. The dependent variable was the error between the observed and actual gaze direction, which gives much more information than a simple correct/false score, but can still be translated to the latter, using a suitable criterium.
3. Results
A highly significant effect of vertical illuminance level on the accuracy of gaze perception was found. However, the effect was found to be independent of the level of horizontal (background) illuminance. Furthermore, accuracy of gaze perception was not found to be affected within the age range used. With increasing vertical illuminance, gaze direction was found to develop from being underestimated at lower levels, towards being overestimated at the higher levels. For vertical illuminance levels above 10 lux, overestimation of gaze direction saturates at a value of 22%. The smallest errors in the estimations were made around 3 to 4 lux. From previous research it is known that ‘normal’ observers in ideal conditions, at high, daytime, light levels, will make systematic errors in estimating gaze directions. Practical question now is whether normal observers feel most reassured when performing optimally or when making their usual error in gaze estimation.
CIE Session 2019 – Abstract Booklet
192

4. Conclusions
This experiment provides a basis for further testing in a more realistic setting, preferably in a real outdoor lighting installation. Based on the current findings, the test conditions should centre around a vertical illuminance level of 3 to 4 lux, with a maximum of 10 lux, where it can be assumed that background (il)luminance is not an important factor. Pending this experiment, the linear relationship between the horizontal and vertical illumination requirements in the current recommendations seems questionable.
CIE Session 2019 – Abstract Booklet
193

OP84
THE VISIBILITY STUDIES OF DYNAMIC ROAD-LIGHTING ON A FOGGY ROAD
Cheng-Hsien Chen1, 2, Shau-Wei Hsu 2, Ching-Cherng Sun 1
1 Department of Optics and Photonics, National Central University, Taoyuan, CHINESE TAIPEI, 2 Center for Measurement Standards, Industrial Technology Research Institute, Hsinchu, CHINESE
TAIPEI
Abstract
1. Objective
Recently, there are many projects that have been proposed and be planned to build “Smart Lighting and City” for governments around the world. Dynamic road-lighting is developed for Smart City for energy saving and intelligent purposes. The most important thing is how to realize and the dimming control of dynamic lighting and to benefit the power-consumption and safety for users. There are many issues about dynamic road-lighting that have to be studied, such as visibility and dimming level, the environmental conditions for setting the dimming level and frequency of dimming control. To systematically study the issues, we used an Image Luminance Measuring Device (ILMD) to capture the luminance images of a commercial traffic sign, humanoid dummy waring a raincoat under various controllable conditions on an experimental road. We analysed the luminance images with contrast ratio on the regions of interest (ROIs) of different objects. Therefore, the dimming control algorithms can be applied for adjusting light intensity according to traffic flow and weather information.
2. Methods
A traffic sign with flashing LED function, humanoid dummy wearing a yellow raincoat, humanoid dummy wearing a blue raincoat and yellow helmet were placed at roadside of an experimental 2-lane road, which was lighted with LED with dimmable controller or high pressure sodium (HPS) luminaires. The road lighting experiment field was established in the southern campus of ITRI in Tainan city. There are 11 dimming levels of LED street lighting which is using Bluetooth communication. The man-made fog was generated by the high pressure spread head. The flow of the spread head is 0.26 l/min. The total amount of spread heads are 650 units. Various levels of fog were generated by several water mist machines along the road. We can generate the fog between the two street lights. The distance between these two street lights is 43.8 m. Therefore we can change the lamp of street lights, dimming levels of LED and set traffic sign and objects in the foggy area. The ILMD can be used to measure the luminance distribution of the traffic sign and objects in foggy conditions or not. Under these experimental conditions, many of luminance images of the road were captured for the analyzations of visibility. We use Michelson contrast (C) ratio to analyse the visibility of traffic signs in different conditions. The visibility of traffic signs is defined between the sign area, paint area, and surrounding background. The visibility of objects are defined between ROIs of objects and surround background. These luminance images were measured with a calibrated ILMD with a 10-22 mm focal length. The ILMD was placed at distance of 30 m from the nearest pole, and the height of the ILMD is 1.5 m.
3. Results
The contrast ratio of ROIs of the objects and traffic signs to the surround background (Cab) was defined as an index of influence of fog. The contrast ratio Cab can be regarded as an index of ordinary visibility in a foggy environment. The smaller Cab means a more concentrated foggy environment. The luminance of ROIs are relative to the absorbance of fog and the distance between observer and targets. Therefore, the visibility as the function of the sky luminance, the scattering of the lighting, extinction coefficient.
For the case of dimmable LED street lighting, we can compare traffic signs and objects in different dimming conditions and in the different foggy conditions. By analysing ROIs of the luminance images in foggy conditions, the contrast ratios dependent on the concentrations of fog and the lighting levels that can be obtained. Also, comparing these objects and traffic signs, we can characterize the physical properties for lighting levels and concentrations of fog. Therefore, we can set the visibility threshold for the lighting level in particular foggy environments. Comparing the yellow helmet and
CIE Session 2019 – Abstract Booklet
194

traffic sign, in the same foggy condition, the visibility of the yellow helmet is 2.5 times greater than the traffic sign. On the other hand, in the foggy environment, the Cab and dimming level have poor correlation. The luminance of ROIs are increased in the higher level of lighting. Therefore, the higher lighting level is needed in higher concentration of fog. As the result shows that the threshold of contrast ratio and luminance of ROIs are setting as 0.1 and 1 cd/m2, respectively. The fog index is 1, the lighting level set as 51 %, then the visibility is satisfied. Otherwise, the fog index is 1.5, the higher lighting level can’t improve the visibility when the contrast ratio is below 0.1.
For the case of HPS street lighting, the threshold of fog index for yellow helmet, yellow raincoat and traffic sign are 1.71, 1.56 and 1.20, respectively. Compared to the LED street lighting at 100 % level, the yellow helmet and yellow raincoat in the LED street lighting have better visibility than HPS in a foggy environment. For the traffic sign, the HPS have better visibility than LED in foggy environment.
4. Conclusions
We can use ILMD to study the visibility of an experimental dimmable LED or HPS lit road in man-made foggy environment. We defined contrast ratios to analyse the visibility for various dimming conditions in a foggy environment. The experimental results show that the comparison of visibility between LED and HPS. These analysis processes as well as experimental data are expected to provide a contribution for the improvement of dynamic road-lighting.
CIE Session 2019 – Abstract Booklet
195

OP85
THE EFFECT OF DIFFERENT HEADLIGHT TECHNOLOGIES ON VISUAL PERFORMANCE AT NIGHT-TIME
Wood, J.M.1, Isoardi, G.2, Choo, J.S.1, Dinh, S.1, Galvez, R.1, Kweon, S.1, Murray, P.1, Pitts, R.1, Black, A.1
1School of Optometry and Vision Science, Queensland University of Technology, AUSTRALIA, 2Light Naturally, Brisbane, AUSTRALIA
Abstract
1. Motivation, specific objective
Older drivers commonly complain of driving difficulties at night-time, and age-related ocular conditions, such as cataracts, exacerbate these problems. In particular, older drivers complain that the glare from oncoming headlights at night reduces their visual performance, particularly for newer headlight technologies. While brighter headlights will improve visibility for the driver, it is important to consider their impact on oncoming road users. In this study, the effect of different headlight technologies on visual performance and associated perceptions of task difficulty and glare disability were measured under field conditions at night-time, both for a normal vision condition, as well as when viewing with filters simulating the effects of early cataracts.
2. Methods
Participants included twelve young licensed drivers (22.0 ± 2.1 years) with habitual binocular visual acuity of 20/20 or better, no significant ocular pathology and who reported night-time driving. Participants wore wide-field trial frames containing their optimum distance refractive correction, with or without filters to simulate the effects of early cataracts. Testing was conducted on a closed road circuit at night-time for four different oncoming headlight conditions positioned at 25 m from the participants, seated in a stationary vehicle with low-beam headlights. The oncoming headlight conditions included Tungsten Halogen (TH), Xenon HID (brightness-matched to the TH using neutral density filters), Xenon HID (full output) and a no headlight condition. Visual performance and self-reported perceptions of task difficulty and discomfort glare were measured for each of the headlight conditions with and without the cataract simulation, in a randomised order. Visual performance was measured for both high and low contrast visual acuity (VA) using large scale charts placed ahead of vehicle, adjacent to the oncoming headlights. For self-reported visual perceptions, task difficulty was determined using a subjective rating scale and discomfort glare measured using the de Boer scale.
3. Results
Both high and low contrast VA were significantly affected by the headlight (p<0.001) and vision conditions (p<0.001), and there was a significant interaction effect (p<0.013). High and low contrast VA were significantly impaired when viewing with simulated cataracts compared to normal vision (p< 0.001), and the greatest level of degradation in VA was observed for the Xenon headlight condition at full output (p< 0.05). Importantly, there were no significant differences between the TH and Xenon (brightness-matched) conditions (p>0.05). Similarly, the cataract condition significantly increased self-reported task difficulty and discomfort glare (de Boer scale) (p<0.001), compared to normal vision. Headlight condition was also significant for subjective perceptions of task difficulty and discomfort glare (p<0.001), but there was no significant interaction effect. In particular, less discomfort glare was reported for the TH compared to both the Xenon brightness-matched and full brightness conditions.
4. Conclusions
The relative brightness, rather than the spectral power distributions, of the different headlights determined the extent of VA degradation and perceptions of task difficulty and glare under normal and cataract simulated conditions. Nevertheless, discomfort glare was significantly greater for the Xenon brightness-matched condition compared to TH. Overall, increased brightness led to an increase in both task difficulty and discomfort glare. These results provide emerging evidence that variations in headlight brightness can influence the extent of VA degradation, task difficulty and discomfort glare, independent of the spectral power distribution. As such, the brightness levels of headlights must be
CIE Session 2019 – Abstract Booklet
196

considered for other road users, particularly for older drivers with common ocular conditions, for driving at night.
CIE Session 2019 – Abstract Booklet
197
OP86
APPLICABILITY OF VISUAL PERFORMANCE MODELS TO NIGHTTIME DRIVING
Bhagavathula, R.1, Gibbons, R.B.1 1 Virginia Tech Transportation Institute, Blacksburg, Virginia, USA
Abstract
1. Motivation, specific objective
Existing visual performance models like visibility level (VL), relative visual performance (RVP) etc. account for luminance of the target and the background, observation time and size of the object. These models might be useful when the distance between the object and the observer are constant and there is no change in the luminance of the object or the background as the distance between the observer and object changes continuously. In night driving situations, the following three things are bound to happen. First, the distance between the object and the observer changes constantly. Second, as the result of change in the distance, the solid angle subtended by the object in the observer’s eye changes. Third, the luminances of the object and the background change because of the influence of the headlamps on the vehicle. Furthermore, in addition to factors like luminance, contrast, age of the observers, research has shown that motion of the object and the expectancy (anticipation of the presence of an object) of the observer might also play an important role in their ability to detect an object in a roadway at night. Because of change in the size of the objects, changes in the luminance of objects and its background, existing visual performance models might not be readily applicable for assessing visual performance of drivers at night. The goal of this study is to assess the applicability of existing visual performance models to night driving situations.
2. Methods
Twenty-four participants’ detection distance data of standard nighttime visibility targets under realistic conditions was compared to visual performance metrics for the same targets. Visual performance metrics of the targets were calculated at several distances to the target using a calibrated photometer from the driver’s point of view inside a vehicle. Visual performance metrics were calculated for each of the participants’ detection distances. Pearson correlation coefficient was used to measure if there existed any association between visual performance metrics and detection distances.
3. Results
Results showed that only VL showed significant correlation but it was negative implying that higher VL were associated to lower detection distances, which is counterintuitive as it is expected that increasing the VL would result in the object being detected easily i.e. from further or longer detection distances. RVP was not significantly correlated with detection distance.
4. Conclusions
The results indicate that existing visual performance models cannot accurately model nighttime visual performance of drivers. This could be because, existing visual performance models do not account for all the factors that affect a drivers’ ability to detect an object on the roadway at night, most notably changing distances and headlamps of the vehicle. These results also necessitate the move from deterministic to probabilistic models to predict and understand visual performance of drivers. Cognitive psychologists have been studying the distributions of reaction times to better understand human response and perception, thus, such an approach could yield better results for modelling and predicting nighttime driver visual performance.
CIE Session 2019 – Abstract Booklet
198
OP87
VISUAL COMFORT EVALUATION METHOD AND PREDICTION MODEL RELATING TO DISCOMFORT GLARE: A MOCK-UP STUDY OF LUMINOUS ENVIRONMENT IN
AIRPLANE COCKPIT
Chunze WU1, Xiaofeng YUAN1, Jian LI2, Biao YANG2 1 Shanghai Aircraft Design and Research Institute, Shanghai, CHINA
2 School of Architecture, Harbin Institute of Technology (Shenzhen), Shenzhen, Guangdong, CHINA
[email protected], [email protected]
Abstract
1. Motivation
Glare is a temporary visual sensation produced by luminance within the visual field that is significantly greater than that to which the eyes are adapted. It is a key factor that influencing the visual performance in light conditions of airplane cockpit, and intensity and layout of glare sources in cockpit are extraordinarily complex. Current glare indices often become invalid while being applied in the evaluation the level of discomfort glare in the cockpit environment with non-uniform glare sources and irregular shape glare sources. This study investigates the relationship between complex glare sources and discomfort glare evaluations of luminous environment in airplane cockpit.
2. Methods
In the study, three variables are manipulated to simulate different lighting conditions for the daylight/night flight mode separately. Using the luminance adjustment of three different lighting parts of the cockpit, primary flight display, light plate, flood light for the daylight flight mode, and strong lamp simulated as sunlight, primary flight display, and thunderstorm light for the night flight mode, 87 different light conditions (42 of them for the night flight mode, the rest for the daylight flight mode) are presented in a real-size demo mock-up experimental set-up and a strictly controlled laboratory set-up separately. In the laboratory setup, all confounding variables are well-controlled, and all associated variables are expanded and vigorous defined for the best result of model fitting according to the mock-up experiment data.
Participants are requested to judge the perceived discomfort glare of three main parts of cockpit which include primary flight display, overhead panel and control pedestal in these light conditions using the “de Boer” nine-level comfort rating scale. In the daylight flight mode, during the pre-training session participants are shown the two extreme conditions of discomfort which are classed as follows: a grade ‘1’ indicating no glare sensation and the opposite extreme – grade 9 in which the participant could not avoid closing his/her eyes.
For each condition, luminance measurement based on CCD (Charge-Coupled Device) camera’s High Dynamic Range (HDR) luminance mapping technology is processed. Four parameters of the glare sources, include source luminance, background luminance, position index and solid angle of source, are computed to find the relationship between the glare sources and the subjective ratings.
3. Results
A repeated-measures AVONA on the data demonstrated that the comfort ratings for all view directions increase with decreasing flood light luminance (F=36.563, df=6, p<0.001) and light plate luminance (F=22.883, df=6, p<0.001) in the night flight mode. As for the primary flight display, with the increase of luminance, the comfort rating first decreases and then increases like a ‘U’-shape curve (F=2.135, df=12, p=0.012). In the daylight flight mode, increase of the luminance of strong lamp, increase the comfort rating for each view directions (F=27.535, df=18, p<0.001). The comfort rating of overhead panel increases with the decreasing luminance of primary flight display (F=5.730, df=2, p=0.003). The thunderstorm light decreases the comfort rating of control pedestal (F=10.448, df=3, p<0.001). It is apparent that current glare indices based on UGR or DGI is failed to reflect these trends and variations. Based on these findings, one method, using source luminance, background luminance, position index and solid angle of source as four endogenous variables in the framework of the general expression for glare put forward by Boyce, supplemented by a tuning function depends on the solid angle of each source, is developed for predicting the discomfort glare in laboratory conditions as well as real scenario conditions. More and detailed analysis will be presented in full paper.
CIE Session 2019 – Abstract Booklet
199

4. Conclusions
The study fills the gap in estimating discomfort glare of complex lighting and clarified similarities of and differences in discomfort glare between airplane cockpit lighting and traditional light sources. A new glare evaluation system is needed as the present systems have been developed for circumstances different from luminous environment like airplane cockpit.
CIE Session 2019 – Abstract Booklet
200
Session PA10-1 D2 - Gloss and Camera Applications
Wednesday, June 19, 15:40–17:40
CIE Session 2019 – Abstract Booklet
201
OP88
WHAT IS THE TRUE WIDTH AND HEIGHT OF THE SPECULAR PEAK ACCORDING THE LEVEL OF GLOSS?
Rabal, A. M., Ged, G., Obein, G. LNE-CNAM, La Plaine St Denis, FRANCE
1. Motivation, specific objective
Gloss is a second order visual attribute that is constructed by the visual system, based on information extracted in priority from the amount of light that is reflected by the surface in and around the specular direction. Previous studies have shown that, for a glossy surface, the BRDF shows a sharp and high peak in the specular, where for matt surfaces, the peak, if it exists, is large and small. For mid-gloss surfaces, the peak has an intermediate size and width. Therefore, one assumption can be that, in order to progress in the comprehension of gloss and to propose new ways for its measurement, it is necessary to measure the specular peak to draw strong conclusion.
But what are measurement settings requested to do this? Well, in practice, when doing BRDF measurements of a glossy surface, 2 parameters can put limitations. The first is the angular resolution, the second is dynamic of the equipment. Just to clarify the ideas, for a satin black surface, the specular peak will have a maximum of 11 sr-1 and a full width at half maximum (FWHM) of 4.5°, while for a high gloss surface like a black car painting, the max of the peak is 3480 sr-1 and the FWHM is below 0,05°
So, while classical spectrophotometers can provide a trustable measurement of the BRDF for a satin surface, they will be incapable to resolve the specular peak of high gloss surfaces.
It is to avoid misinterpretations of results carried on with non-adapted spectrophotometer on glossy surface that this study has been carried out. Our objective is to access the specular peak of a collection samples, ranging from very matt to very gloss, with a metrological goniospectrophotometer optimized to perform this type of measurements, and then to extract from the measurements the heights and widths of the specular peaks.
2. Methods
We used ConDOR, a metrological goniospectrophotometer that has an angular resolution of 0.014°, the highest resolution available today. The dynamic of the equipment is 7 decades. This equipment uses a high collimated broadband light beam for illumination, a sample holder that is rotated by a robot arm, and a detection that combines a Fourier optic and a High Dynamic Imaging Light Measurement Device. The system has been carefully calibrated to guaranty the traceability to the reflectance national standard. A gloss scale of 10 steps, ranging from 2 gu to 98 gu (measurements performed with a glossmeter at 60°) has been used.
3. Results
We obtain, for each sample, the size and width of the specular peak. This is the first time that one can guarantee that this result are really trustable, because they have been performed with a facility that has a resolution below the width of the specular peak, even for high gloss samples.
The full results are plotted according to the specular gloss of the samples, measured with a commercial glossmeter. The results give clear indications to manufacturers and users of gonio, multiangle, or specular spectrophotometers, to avoid huge errors in the measurement and interpretation. This point is discussed in the paper in order to inform and alert the community working in the field of BRDF measurement and gloss. The output of this study will be proposed to TC2-85 and JTC16.
4. Conclusions
When evaluating the gloss of a surface, observers always look in and around the specular direction. Thus, there is good chances that gloss takes its origin in the specular peak of the BRDF of the surface. But up to now, this peak, when dealing with glossy and high glossy surfaces, has never been measured properly. Often, users don’t know they do measurements errors that can go up to 1000% (!) when performing BRDF measurements in the specular direction. By providing traceable and trustable
CIE Session 2019 – Abstract Booklet
202

high angularly resolved BRDF measurements of specular peaks, we have clarified the settings requested to access a reliable BRDF of the surface in the specular direction, according to its gloss level measurement measured with a classical glossmeter.
CIE Session 2019 – Abstract Booklet
203
OP89
COLORIMETRIC ACCURACY OF HIGH DYNAMIC RANGE IMAGES FOR LIGHTING RESEARCH
Cauwerts, C.1, Deroisy, B.2, Jost, S.3 1 Université catholique de Louvain, Louvain-la-Neuve, BELGIUM,
2 Belgian Building Research Institute, Brussels, BELGIUM, 3 University of Lyon, ENTPE, LGCB, Vaulx-en-Velin, FRANCE
Abstract
1. Motivation, specific objective
High Dynamic Range (HDR) imaging techniques are frequently used in lighting research for measuring luminance. Part of their success lies in the opportunity to capture quickly a large field of view. HDR images are created by combining multiple images with different exposures. Various merging algorithms and tools exist. In the lighting community, the most widely used tools take jpeg or raw files as input and produce HDR images stored in the Radiance RGBE format (.hdr) as output. The luminance of any pixel of these HDR camera-based images can be computed using the standardized sRGB to CIE-XYZ colour transformation matrix (Y channel is the luminance). To ensure photometric accuracy, a luminance calibration factor is generally calculated for each scene as the ratio of the HDR luminance of a grey target to the luminance measured with a spot luminance meter. Previous works report average relative differences of luminance values about 10% for coloured targets and 5% for grey surfaces under various types of lighting. While this procedure ensures photometric calibration, it does not necessarily lead to colorimetric accuracy.
Because human visual system is very sensitive to colours and knowing new advances about circadian response to light, traditional calibration procedures for HDR photography have to be adapted to tackle the colour calibration problem.
The main objectives of this work are:
- Testing different calibration methods to ensure colorimetric accuracy;
- Determining the colorimetric accuracy of three digital cameras fitted with fisheye lenses;
- Checking if a calibration model determined for a particular device (a specific camera fitted with a specific fisheye lens) can be used for calibrating other devices of the same model.
2. Methods
A Macbeth colour chart and 33 additional colour samples from the Munsell Book of Colour were placed in a booth lit either by an incandescent source (source_1) or by an equal-energy LED source (source_2). The correlated colour temperatures (CCT) of both sources were approximately 5000K.The luminance range of the scene was 1250:1 under source_1 and 520:1 under source_2.
The scene was shooted with three cameras fitted with three fisheye lenses:
- Canon EOS 5D Mark II fitted with a Sigma 8mm F3.5 EX DG fisheye lens (device_5Dfe8);
- Canon EOS 40D fitted with a Sigma 4.5mm F2.8 EX DC fisheye lens (device_40Dfe45);
- Canon EOS 50D fitted with a Sigma 4.5mm F2.8 EX DC fisheye lens (device_50Dfe45).
A second Canon EOS 50D fitted with another Sigma 4.5mm F2.8 EX DC fisheye lens (device_50Dfe45bis) was also used to investigate our third objective (same calibration model for devices of the same model).
The cameras were mounted on a tripod. For minimizing vignetting effect, aperture was set to f/16 for device_5Dfe8 and to f/10 for the three other devices. The sensitivity setting was set to ISO 100. Shutter speed bracketing was performed for 1-stop increments. Pictures were taken in raw format and the multiple exposure images were combined using raw2hdr software. RGB values were extracted from the HDR file using the Radiance pvalue command. The reference CIE XYZ coordinates were measured with a Jeti Specbos 1211UV Spectro-radiometer.
CIE Session 2019 – Abstract Booklet
204
Two calibration models were investigated for computing CIE XYZ coordinates from camera-based images:
- the standardized sRGB to CIE-XYZ colour transform matrix followed by a photometric calibration (method_1, as used for traditional photometric calibration);
- a colour transform matrix determined by minimizing the least square error in the XYZ colour space (method_2).
In a two-step approach, the 24 samples of the Macbeth chart lit by source_1 were used for determining the colour transformation matrix. The complete set of samples (57 patches) lit by source_2 was used for validation.
For assessing colorimetric accuracy, we fixed the following thresholds: mean Delta_Eab (57 samples, source_2) < 3.5 and max Delta_Eab (57 samples, source_2) < 5. These colour difference values were chosen because above 3.5, observers (even unexperienced) notice a colour difference, and above 5, observers notice two different colours.
3. Results
The first calibration model (method_1) leads to the expected photometric accuracy for the three tested devices. We observed an average relative difference of luminance (57 samples, source_2) of about 3.7% for device_5Dfe8, 5.6% for device_40Dfe45 and 4.4% for device_50Dfe45.
Concerning the colorimetric calibration, none of the tested devices fulfils the requirements with the standardized sRGB to CIE-XYZ colour transform matrix. The acceptability threshold was obtained for device_5Dfe8 with the second calibration model (method_2): mean Delta_Eab = 1.4+/-1.0; max Delta_Eab = 3.7. Though the thresholds are not achieved with the other cameras, method_2 reduces by half the average colour difference observed with method_1. Results also show that devices fitted with similar fisheye lens have a similar colour response profile. However, due to the poor colorimetric accuracy obtained for those devices (mean Delta_Eab > 4.5), we cannot conclude on the possibility to reuse the colour transform matrix determined for one device for other devices of the same model.
4. Conclusions
Accuracy of colour measurements with a digital camera and HDR techniques differs widely from device to device. Among the tested devices, the desired accuracy is only achieved with the Canon EOS 5D Mark II fitted with a Sigma 8mm F3.5 EX DG fisheye lens. To reach our target accuracy, a colour transform matrix was determined by minimizing the least square error in the XYZ colour space. We used the 24 samples of a Macbeth chart lit by an incandescent source, in a controlled environment. The model was further validated using 57 colour samples lit by another light source, in the same controlled environment. Validation should be pursued in real environments with various light levels and spectra. In order to improve colorimetric accuracy of other cameras, we intent to test alternative calibration methods such as, the determination of a colour transform matrix by minimizing colour differences.
CIE Session 2019 – Abstract Booklet
205

OP90
TEST METHOD OF LUMINANCE DYNAMIC RANGE FOR HDR CAMERA WITH CMOS IMAGE SENSOR
Chang Hui Ye1, Jeong Ah Hwang1, Dong-Hoon Lee2, Seongchong Park2 1 Pixelplus Co.LTD., Suwon, KOREA, 2 Korea Research Institute of Standards and Science (KRISS),
Daejeon, KOREA
Abstract
1. Motivation, specific objective
Now a days, most high dynamic range (HDR) cameras are realized based on the CMOS image sensor architecture, because CMOS image sensors provide enough photon capacity to realize the world luminance environment in many ways. To determine the numerical value of the dynamic range, many parameters affecting the dynamic range such as ADC bit depth, ratio of conversion gain, and multiple exposures should be carefully considered or controlled.
To test the dynamic range of a HDR camera in the unit of luminance, one needs a uniform source, typically an integrating sphere-based broadband source, whose luminance can be varied in a wide range from 10-3 cd/m2 to 105 cd/m2 without changing its spectrum. Such a HDR luminance standard source might be available in a national metrology institute or in a testing laboratory. However, the industry requires a more practical test method without a sophisticated instrumentation. In this work, we propose an alternative test method for luminance dynamic range of a HDR camera, which can be realized in a simple and compact experimental setup.
2. Methods
The key concept of the proposed method is to predict the luminance response of a camera from the illuminance response of its image sensor without the imaging optics. When the illuminance response is measured against a nearly collimated, spatially uniform beam, one can determine the conversion factor from illuminance to luminance response by considering the transmittance and the f-number of the imaging optics. The advantage of this method is that the saturation level of illuminance for an HDR image sensor can be easily reached at only a moderate radiant power with a collimated beam.
The feasibility of our method is tested by using a 250-W tungsten-halogen lamp-based light source, which provides a nearly collimated beam. The radiant power of the beam can be continuously varied by using a neutral-density filter wheel, and monitored by using a calibrated photodiode. The setup is calibrated in such a way that we can record the output signal of a CMOS image sensor under test as a function of illuminance at the image plane.
3. Results
By using the test equipment, we could measure the world dynamic range of a CMOS HDR image sensor up to 105 orders of magnitude in luminance. The validity of the test results is tested by comparing with the measurement for the camera configuration, i.e. for the image sensor under test attached with the imaging optics, by using the HDR luminance standard source at Korea Research Institute of Standards and Science.
4. Conclusions
We introduce a test method of luminance dynamic range of a HDR camera by measuring the illuminance range of its image sensor and by calculating the conversion factor for illuminance-luminance considering the geometric condition with the imaging optics. This method provides a practical solution with a cost-effective instrumentation.
CIE Session 2019 – Abstract Booklet
206
OP91
SETUP FOR CHARACTERISING THE SPECTRAL RESPONSIVITY OF FABRY-PÉROT-INTERFEROMETER-BASED HYPERSPECTRAL CAMERAS
Pekkala, O.1, Pulli, T.1, Kokka, A.1, Ikonen, E.1,2 1 Metrology Research Institute, Aalto University, Espoo, FINLAND
2 VTT Technical Research Centre of Finland Ltd, Espoo, FINLAND
Abstract
1. Motivation, specific objective
In recent years, there have been significant technological advancements in the field of hyperspectral imaging. New kinds of camera architectures, such as Fabry-Pérot-interferometer cameras, have been realised. To fully understand the capabilities of a hyperspectral camera, the spectral responsivities of its channels need to be accurately characterised. However, the methods developed for characterising the spectral responsivities of the widely used diffraction-based hyperspectral cameras make assumptions of the inner architecture of the camera under study and therefore cannot be used as such when studying cameras of differing architectures.
2. Methods
This study presents a measurement setup for characterising the spectral responsivity of hyperspectral cameras. The setup is independent of the architecture of the camera under test. The main part of the setup was a tuneable, monochromatic radiance source. The camera under study was mounted on a motorised turntable, imaging the illuminated surface of a transmitting diffuser at different wavelengths and from different viewing angles. The spectral responsivities of the channels of the camera were extracted from the pixel values of the images, yielding results both as a function of wavelength and as a function of image plane coordinates. The measured spectral responsivities were deconvoluted to remove the distortion caused by the spectral bandwidth of the radiance source. The measurement procedure as well as the analysis were automated. The results were validated by imaging an incandescent lamp-based radiance source with a known spectrum.
When using the described measurement setup it is important to choose proper source bandwidth and wavelength sampling interval. Too scarce sampling intervals and too wide source bandwidths lead to increased uncertainties in the measured channel characteristics, too dense sampling intervals and too narrow source bandwidths to increased measurement times. The effects of these two parameters on the measured responsivities were studied with simulations, yielding guidelines for choosing proper parameter values depending on the characteristics of the device under study and on the desired uncertainties. The simulation results were also validated with measurements.
3. Results
The setup was used in characterising the spectral responsivity of a Fabry-Pérot-interferometer-based hyperspectral camera. The results show that the bandwidth and the centroid wavelengths of the studied camera channels change across the image plane, and that some of the channels have regions of sensitivity outside the main channel. Channel centroid wavelengths shift up to 1.5 nm when moving from the image centre to image corner. The bandwidth of the channels change by up to 5% in the image area and with different patterns for each channel. The validation of the results yielded a root mean square error of 3.5% between the reference and the measured spectral power distributions relative to the reference distribution. An estimate of expanded uncertainty (k = 2) for the measured camera channel characteristics, namely bandwidths, areas and centroid wavelengths, was 8%.
The results of the sampling and bandwidth simulations show that the uncertainty of the results starts to increase rapidly if the wavelength sampling interval is set too scarce. To keep the standard uncertainty (k = 1) component caused by sampling for the aforementioned channel characteristics below 3%, one should set the wavelength sampling interval to a maximum of 40% of the bandwidth (full width at half maximum) of the measured channel. A wide source bandwidth induces a systematic error to the measurement results, but if the spectral power distribution of the source channel is well known, the error can be corrected with deconvolution. However, deconvolution methods are susceptible to noise, and the distortion caused by a wide source channel is very difficult to correct. With the presented
CIE Session 2019 – Abstract Booklet
207

setup and utilised deconvolution algorithm, the practical upper limit for source bandwidth was 25% of the bandwidth of the narrowest studied channel.
4. Conclusions
A system for characterising the spectral responsivity of hyperspectral cameras was developed. The system was used to characterise the spectral responsivities of the channels of a Fabry-Perót-interferometer-based hyperspectral camera across the image plane. The results showed that the bandwidths and the centroid wavelengths of the channels depended on the image location and that some channels had regions of sensitivity outside the main channels. The results were validated against an incandescent lamp-based radiance source with a known spectrum.
The characterisation measurements are time-consuming, but the required time can be reduced by adjusting the wavelength sampling interval and source bandwidth parameters. To find the optimal parameter values that minimise the measurement time without compromising the uncertainties, the effect of the sampling interval and the bandwidth on the uncertainty of the measurements was studied with simulations. The results of the simulations were further validated with measurements. The systematic distortion caused by source bandwidth can be corrected with deconvolution, but the amount of measurement noise and the capabilities of the utilised deconvolution method set practical limits for the bandwidth of the source.
CIE Session 2019 – Abstract Booklet
208

OP92
SIMPLIFIED HYPERSPECTRAL CAMERA CALIBRATION FOR ACCURATE RADIOMETRIC MEASUREMENTS
Raza, A.1,2, Dubail, M.1,Jost, S.2, Dumortier, D.2 1 Essilor International, Paris, FRANCE; 2 University of Lyon, ENTPE, LGCB, Vaulx-en-Velin, FRANCE
Abstract
1. Motivation and objective
Radiometric characterization with the help of a spectroradiometer is a sound solution for singular target objects. For a complex scene with different objects of varying reflectances, spectroradiometer measurements can be very time-consuming depending on the complexity of the scenes. There is an increasing need to be able to measure colorimetric rendering and radiometric properties of a complex scene for which traditional spectroradiometers are unsuitable. Imaging offers an intuitive methodology to qualitatively and quantitatively characterize the lighting, and its rendering on various objects spread across the scene.
The drawback of imaging is the absence of detailed spectral information as obtained from a spectroradiometer. Images provide colorimetric data for three RGB bands, thus they are less useful for spectral analysis.
Recently, video-photometers and video-luminance meters were developed to cater the needs of lighting researchers working with complex scenes, with the output generally being limited to luminance, chromaticity, correlated colour temperature and dominant wavelength. This solution is not ideal for lighting applications where the data across the entire visible spectrum, or sometimes UV/NIR is required.
A hyperspectral camera can capture spectral information for a resolution as small as 1.3nm step while combining the spectral and spatial aspects of spectroscopy and imaging. The ability of hyperspectral imaging to identify materials with a non-invasive technique made it ideal for mining and geology for which they were originally developed. But now their usage has spread into fields as diverse as ecology, surveillance and most notably in lighting and colour industry. The detailed information obtained from a hyperspectral capture offers the possibility to combine visual analysis of the entire scene for studying the spatial distribution with knowledge of the spectral content including radiometric/colorimetric properties of the lighting and the complex objects in the scene.
Unlike a digital still camera, hyperspectral cameras usually do not come with an automatic exposure time setting to take into account the large variations of lighting conditions (for example, 300-500 lux for an indoor office to 100000 lux on a sunny day in a Mediterranean city). Since the appropriate exposure time is not apparent for non-experts of hyperspectral imaging, it is quite frequent that captures are sometimes saturated or dark because of an unsuitable exposure time.
Moreover, hyperspectral cameras are not usually factory calibrated. The raw radiance/reflectance values do not correspond to SI units. They are in an arbitrary value which has some relation with the SI value but not necessarily linear.
To tackle these issues, we propose a simple methodology to calibrate and characterize a commercial hyperspectral camera to obtain reliable and accurate measurements.
2. Methods
The target scene is composed of a standard Macbeth colour chart of 24 patches and a perfectly diffused white block of lambertian reflectance. A recently calibrated spectroradiometer was used to measure the radiance to serve as the reference data.
I. Determination of the appropriate exposure time Hyperspectral captures were taken under an Equi-energy LED source with a CRI (Ra) of 92.
a. To identify the minimum measurable luminance level, captures were taken at low luminance levels (4cd/m²-16cd/m²) with constantly increasing exposure times in multiples of two (starting from 5ms). At the exposure time for which the measured
CIE Session 2019 – Abstract Booklet
209

signal was stable, the scene was captured and validated to see if the signal-to-noise ratio is sufficient to visually render the capture.
b. To automatically deduce the optimum exposure time, multiple captures were done with increasing luminance levels (546cd/m²-2791cd/m²) and increasing exposure times (1ms-80ms). A capture was considered valid if the radiance values fell within a predefined and validated upper and lower limit. The lower limit was set just above the dark noise threshold while the upper limit was identified by a flat signal indicating the saturation of the sensor.
II. Radiance calibration To calibrate the raw radiance values, hyperspectral captures were taken with 40ms of exposure time (identified in the step above) for a scene illuminated by an incandescent source of CRI (Ra) of 92 and luminance of 532 cd/m². The raw spectral radiances were compared with the spectral radiances measured with the spectroradiometer and different possibilities of calibration were considered, a global average factor, a moving average depending on the wavelength range and a step-by-step calibration matrix corresponding to the spectral measurement resolution.
3. Results
As a first result, we created a radiance simulator which could simulate the output of the hyperspectral camera for any exposure time (within 1ms-80ms, step of 5ms). It could be used to rapidly check if the chosen exposure time is appropriate for the capture The simulator was validated on measurements under a white LED source, a fluorescent lighting and under natural daylight.
For the radiance calibration, the step by step calibration matrix was found to be the most accurate method (best superposition with the reference spectra). These results were validated on a capture under white LED, fluorescent source and daylight.
4. Conclusions
Hyperspectral cameras capture the contiguous spectral content of a target scene and store the data in the pixel array, thus also enabling image rendering and spectral content of the capture. Even though the spectral information is present, an accurate calibration is required to match the radiance values in SI units. For different luminance settings, the exposure time of the camera shutter requires optimisation to avoid undesirable saturation or loss of details. With this calibration, the data capture mechanism is simplified even for non-experts, thus providing a tool for vision/light scientists to automatically deduce the appropriate input parameters and calibrate the output radiometric data.
CIE Session 2019 – Abstract Booklet
210
OP93
THE DEVELOPMENT OF PORTABLE CALIBRATION LIGHT SOURCE AND TEMPERATURE CORRECTION ALGORITHM FOR IN-SITU RADIOMETERS
Ling, L., Caihong, D., Zhifeng, W., Yanfei, W.
Division of Optics, National Institute of Metrology, Beijing, CHINA
Abstract
1. Motivation, specific objective
Ocean colour is one of the Global Climate Observing System's essential climate variables. It is significant for analyzing the impacts of climate change and the health of ocean. With the requirements for SI-traceable origin for Ocean colour radiometers on board satellites, it is crucial for reducing the absolute radiometric uncertainties of radiometers used for in-situ measurements on ground-based validation sites and sea-based validation sites. According to the in-depth analysis of radiometers used for in-situ measurements, the main uncertainties are originated from lab-calibrated instruments transferring to the ground-based verification sites. The reasons of uncertainty include the environmental condition change, temperature change, the difference of the spectral distribution of the target light source, the dynamic change of the light source.
In this work, two ways are provided to decrease the impact of environmental changes on calibrated spectroradiometers, and therefore reducing the uncertainty of radiometers used for in-situ measurements. 1) Developing a portable light source for calibrating in-situ radiometers; 2) Investigating on mathematical correction algorithm of laboratory calibration coefficient for in-situ radiometers.
2. Methods
(1) The designed integrating sphere light source is used to develop a portable calibration light source, since integrating sphere is an ideal diffuse extension source. The portable integrating sphere light source is technical designed, and contains six aadjustable 35W lamps in different directions. The lamps illuminate the inner surface of the integrating sphere and are diffused to illuminate through the opening. The light source is portable and is collected automatically by computer remote control.
(2) Ambient temperature change is a main uncertainty issue, since laboratory calibrations of in-situ radiometers are performed at room temperature. The calibration coefficients determined under room temperature are not applicable to instruments used in the ground-based (sea-based) validation sites. An experimental system for investigating the effects of ambient temperature on radiometric responsibility was established. It consists of radiance light source, thermal chamber, thermometer, apertures and baffles. The instrument is placed in thermal chamber, which simulates ambient
temperature and humidity. The variation range of thermal chamber are -50°C~+100°C, (20%~98%)
RH.
3. Results
The stability, uniformity and repeatability of the portable light source are characterized by Si detector and InGaAs detector. The stability is about 0.2%~0.4% between 380nm and 1000nm. The non-uniformity of light source is less than 0.3%. The portable light source also provides the large dynamic range. The higher irradiance reduced the impacts of intensity inconsistent of laboratory calibration light source and solar irradiance.
According to the results of ambient temperature change experiments. The sensitivity of in-situ radiometers was affected by ambient temperature, which is dependent on wavelengths. A single-wavelength point-by-point temperature correction matrix algorithm was proposed, which directly establishes the functional relationship between the spectral response of each pixel and the temperature, and the full response band of the detector would be obtained by matrix calculation. The deviation of the near-infrared band after correction of the ground observation in-situ radiometer is
reduced from ±12% to ±1%.
CIE Session 2019 – Abstract Booklet
211

4. Conclusions
The development of portable calibration light source not only reduces the calibration uncertainties that originated from lab-calibrated instruments transferring to verification sites, but also provides fully automatically data acquisition and monitoring for in-situ radiometers, which is beneficial for sea-based sites observations, since the manual measurements cost a lot of financial resources and time consuming.
The temperature correction method is very effective for spectroradiometer. It can be widely applied to ground-based validation sites and sea-based validation sites, which can greatly improve the accuracy of ocean colour in-situ measurements.
CIE Session 2019 – Abstract Booklet
212

Workshop WS3 In Search of a New Approach to the
Maintenance Factor Tuesday, June 18, 10:45–12:05
CIE Session 2019 – Abstract Booklet
213

WP01
REDUCED LIFETIME OF LED STREET LUMINAIRES DUE TO ADAPTIVE CONTROL
Askola, J.1, Baumgartner, H.1, Pulli, T.1, Kärhä, P.1, and Ikonen, E.1,2 1 Metrology Research Institute, Aalto University, Espoo, FINLAND,
2 MIKES Metrology, VTT Technical Research Centre of Finland Ltd, Espoo, FINLAND
Abstract
1. Motivation
The use of LEDs in street luminaires enables energy savings in street lighting. LEDs also create new opportunities in street lighting such as adaptive control of the luminaires where the lights are dimmed when there are no cars or pedestrians present. This type of control has significant potential for energy savings, and it helps to reduce the ever-growing problem of light pollution.
The repeated dimming of LEDs causes thermal stress to the luminaires. Effectively this is similar to hammer testing, where thermal cycling is used to accelerate degradation of electronics. For street light luminaires, the effect of dimming on the lifetime has not been studied yet and therefore, it is typically neglected. We have studied the effect of active control on the lifetime of two types of LED street luminaires. Results are presented and compared to those obtained for reference lamps that are not actively controlled.
2. Methods
Twenty LED street luminaires from two manufacturers (types A and B) were aged in room conditions. The lamps were rated for 7 500 lm and 13 700 lm of luminous flux for types A and B, respectively, and 100 000 h of lifetime (L80B10). The thermal management is different for the two luminaire types. For type A, passive cooling is integrated into the outer shell of the luminaire. For type B, the heat sink is located inside the casing of the luminaire, resulting in higher temperatures of the LEDs and the associated electronics. The temperatures of the heat sinks in the luminaires at normal operation were
41 C and 56 C at the ambient temperature of 25 C for types A and B, respectively.
The luminaires of both manufacturers were divided into two groups of five samples. One group of each type was operated with a sequence emulating adaptive lighting. The lamps were cycled with full power for 30 s and with reduced power of 20 % for 30 s. The other groups were used as a reference. They were operated at full power with no adaptive controlling. For all the groups, a daily cycle of nine hours of operation and 3 hours with 0% power was used to simulate daily use of the street luminaires. The
ambient temperature during the ageing was 25 ± 3 C.
The electrical and photometrical properties of the luminaires were measured every three to six months. Luminous flux, spectral radiant flux, electrical power, and luminous efficacy of the aged samples were measured operating the luminaires in an integrating sphere with a 1.65-m diameter. To be able to detect changes in the luminous fluxes and luminous efficacies over multiple years, a measurement uncertainty of 1% (k = 2) is needed.
3. Results
In our experiment, the luminous flux and the luminous efficacy of the luminaires increased up to 5% over the first 1350 daily cycles for all lamp groups, and adaptive control had no noticeable effect. After this, there was a clear difference between the adaptive-controlled and the reference luminaires.
For type A luminaires, the luminous flux level of adaptive-controlled luminaires was approximately 3% lower than for the reference group after 3000 daily cycles. For the reference group, the luminous flux was 99% of the initial luminous flux level.
For type B luminaires, three of the five adaptive-controlled luminaires had failed after 3000 daily cycles and their luminous flux levels were below 50% of the initial levels. For the two working luminaires with adaptive control, the luminous flux was still 1% above the initial luminous flux levels after 3000 daily cycles. The reference group was 3% above the initial luminous flux after 3000 daily cycles.
CIE Session 2019 – Abstract Booklet
214

For both luminaire types the specified lifetime at condition of L80B10 (80% initial luminous flux, 10% failing rate) is 100 000 hours. The first two luminaires broke after 2500 daily cycles that corresponds to lifetime of 25 000 hours only.
Based on our experience, the approaching failure of a luminaire can be first noticed as an increase of the electrical power. After an increase of power consumption by approximately 10% the luminous output of the luminaire collapses drastically. The power increase does not increase the luminous flux.
4. Conclusions
According to our studies, the adaptive control of the street luminaires reduces their lifetime. The luminaire lifetime can decrease to ¼ of the specified lifetime for luminaires with higher internal temperatures that may damage the LED modules. With more efficient cooling, the differences between continuously lit and adaptive-controlled street luminaires are smaller, but still the adaptive controlling increases the degradation noticeably.
Based on our experiment with somewhat limited statistics, the specified lifetime expectancies are not valid in all situations for luminaires used in adaptive controlled systems. This should be taken into account when designing new street luminaire installations utilizing adaptive control.
CIE Session 2019 – Abstract Booklet
215
WP02
REVIEW AND PROPOSALS FOR UPGRADE OF METRICS OF USEFUL LIFIETIME OF PROFESSIONAL LED LUMINAIRES
Schwarcz, P. TUNGSRAM Group, Budapest, HUNGARY
Abstract
1. Motivation, specific objective
The expected lifetime of professional LED luminaires has been extended tremendously due to LED technology arriving in a mature stage. On the other hand, there is a market pressure to claim longer and longer lifetime, sometimes without knowing the limitations of predictions or having real benefit for the end-users. The paper will review the limitations of predictions and gives proposals how to improve the confidence level. The author also will evaluate whether extreme long useful life-time claims by manufacturers have a real benefit for the end-users. There are proposals, how better luminous flux maintenance can be turned to real benefit by modification of metrics.
2. Methods
The luminous flux degradation of professional LED luminiares could be extremely long, if the luminaire is well designed for the purpose and environment and built from quality components. Today, the best of them easily reach L90 beyond 100.000 hrs. There are different methods of defining the luminous flux degradation for such a long period. The common point of them is the physical measurement of the luminous flux of the device at the initial period of their life. Even if the initial measurements extended till 10.000, the drop of luminous flux to be measured is below or around 1% (i.e L99 @ 10 khrs). The uncertainty of the currently available testing devices and methods are well beyond this 1% range. Due to the long burning time (10 khrs is over one year), in practical life, sometimes even difficult to use the same physical device (gonio) for the repeated measurements due to upgrade or recalibration. The current methods are good for measuring the uncertainty of gonio instead of definition of the luminous flux drop. This definitely undermines the confidence in long-term luminous flux prediction.
Currently, the useful lifetime is defined by fixing the luminous flux maintenance values in steps, like L70, L80, L90 and then the lifetime is calculated. It has two consequences:
1. The calculated useful lifetime of LED products claimed by manufacturers quite frequently far beyond the lifetime of the application where they are going to be installed. So, the user does not have the chance to use the whole useful period of the LED product. A typical example is a sport stadium. The lighting is not used more than 4 hrs a day as an average and not more than 250 days per year. It gives1,000 burning hours per year, 25 khrs burning hours per a 25-year period. Is there any practical difference between products offering L80 @ either 50 khrs or 100 khrs or 200 khrs when they are used for 25 khrs as a maximum? None of them will reach their useful life in the given application.
2. If lighting designer reads L80 in the datasheet of the LED luminaire, (s)he will use an 0.8 maintenance factor for any of the products above. None of the products above will reach their end of useful life, so they are going to stop working (ie. removed from the application) before L80 will have been reached. The lighting is overdesigned and the installation will produce significant waste of energy.
3. Results
The paper will set limitations of current practice of definition of luminous flux properties of long-lasting LED luminaires and gives directions how current guides (like IES LM-84:2015) should be upgraded.
In addition, the paper will propose a redefinition of useful life of an LED luminaire. The expected lifetime of the installation should be defined first, like 25,000; 50,000; 75,000; 100,000 hrs. Then the corresponding luminous flux values calculated: L95; L90; L85; L80 as an example. The lighting designer can pick-up the value corresponding the lifetime of the installation. The benefits are straightforward: The products are compared on a period fits to the application (not far beyond!). The maintenance factor will represent the performance of the product in-situ, the lighting won’t be
CIE Session 2019 – Abstract Booklet
216

unnecessarily overdesigned and will save further energy. The paper will include examples of other typical lighting applications.
4. Conclusions
The current practice of definition of luminous flux degradation has serious limitations and far from real life due to the uncertainties of testing devices. Spending huge resources on tests currently defined will not give more benefit. The methods need to be changed. Stake-holders should be aware of it, as series business decision are made based on that figures. Better understanding and refining those rules can lead to better decision making and real savings. The paper will give significant contribution to the JTC on Maintenance of Lighting Systems.
CIE Session 2019 – Abstract Booklet
217

Session PS1 Presented Posters (D1/D2)
Monday, June 17, 15:35–16:30
CIE Session 2019 – Abstract Booklet
218
PP01 / PO053
SPECTRAL CHARACTERISTICS INFLUENCING THE METAMERIC UNCERTAINTY INDEX
Whitehead, L.A.1, Royer, M.P.2 1 University of British Columbia, Vancouver, BC, CANADA
2 Pacific Northwest National Laboratory, Portland, OR, USA
Abstract
1. Motivation, specific objective
A new measure of colour rendition, the Metameric Uncertainty Index (Rt) has recently been proposed as an adjunct to CIE 224:2017 Rf, with which it shares a common computational framework. Like Rf, Rt
ranges from 0 to 100, with the maximum corresponding to zero metameric mismatch. Rt correlates with the likelihood of noticeable metameric mismatches being induced by a given light source, which is an important consideration in many lighting applications.
Conceptually, Rt is determined by dividing any light-source-induced colour shift into two components: (1) a base colour shift that depends only on the colour of a surface and the spectral power distribution (SPD) of the illumination, and (2) a metameric colour shift component that depends also on the details of the surface’s spectral radiance factor. Base colour shift varies smoothly in colour space, and this variation can therefore be modelled with a vector field defined by a second order polynomial function, the parameters of which are adjusted to optimize the fit. Metameric colour shift is then calculated as the difference between the modelled base colour shift and the actual colour shifts of a set of colour samples—in this case, the 99 colour evaluation samples of CIE 224:2017.
For sources with relatively low Rt values, colour rendition measures determined from the standardized colour samples (e.g., Rf) have less reliability in predicting performance for alternative objects, such as those in an architectural environment. This is because such sources have increased variability in the magnitude and direction of colour shifts for metameric or near-metameric colours.
We show that Rt and Rf, are somewhat correlated, but they can have substantially different values for the same light source. This work explores how SPD affects the relationship between Rt and Rf. We examine whether the use of multiple very narrow band primaries has a predictable impact on this relationship. This work is intended to introduce the utility of the Rt measure and help guide future design of light sources for illumination.
2. Methods
The relationship between specific spectral characteristics and Rt values was examined using multiple approaches. One included generating a large set of 100,000 SPDs based on a full factorial design. The factors were the number of primaries (three, four, five, six, or seven) and range of FWHM (2-11 nm [narrow], 20-51 nm [medium], 50-101 nm [wide], 2-101 nm [mixed]). Each primary was generated as a Gaussian distribution, with a random number generator used to vary the peak wavelength \, FWHM, and maximum intensity. CCT was limited to nominally 2700 to 6500 K, with Duv limited to the range of 0.006 to -0.018.
The second approach involved using the Nonlinear Generalized Reduced Gradient function of Microsoft Excel Solver, including multiple starting points to increase the likelihood of determining global optima. Optimized SPDs were generated under a variety of constraints on both colour rendition characteristics (e.g., Rf, Rt, Ra, etc.) and spectral characteristics (number of primaries, peak wavelengths, and FWHM).
Finally, a set of 485 commercially-available LEDs was compiled from a variety of sources to serve as a baseline of current capabilities.
3. Results
For theoretical light sources with a given Rf value, there is a wide range of possible Rt values. Typically, the Rt value ranges from a minimum of approximately Rf to a maximum of approximately 100 – (100-Rf)/4. Within the set of commercially-available LEDs, 405 products had an Rf ≥ 80, which is
CIE Session 2019 – Abstract Booklet
219

typical of architectural interior environments. Of these products, the lowest Rt value was 92, with a mean of 95 and a maximum of 98.
Within the large set of theoretical SPDs, the FWHM of primaries had a modest effect on the maximum achievable Rt value. For the narrow, medium, and wide sets, the maximum Rt values were 94, 97, and 99, respectively. This indicates that it is possible to have a source with relatively narrow primaries that has an Rt value comparable to current products. More apparent is that the range of Rt values expands greatly as FWHM is reduced. The decrease in Rt value with narrow primaries is mitigated by including more primaries. The optimized Rt values with three, four, five, six, and seven narrow primaries were 83, 89, 91, 93, and 94, respectively.
Nonetheless, it is important to note that very narrow primaries generally result in low Rt values relative to Rf values. The lower limit of Rt for a given Rf value is found for SPDs with laser-like primaries. To achieve Rt values comparable to current light sources, at least five lasers are needed, with six providing a more appropriate solution.
SPDs along the Pareto boundary for luminous efficacy of radiation and Rf have the narrowest possible primaries that can achieve a given average colour fidelity criterion. As a result, they also have relatively low Rt values. Only the optimized SPDs with Rf ≥ 90 can achieve Rt ≥ 92. Even SPDs with k maximized at Ra ≥ 95 had Rt ≤ 89.
4. Conclusions
Rt characterizes a unique aspect of colour rendition. It is preferable for Rt to be high, all other things being equal, but Rt is one of many factors that may have varying degree of desirability in varying settings. This analysis shows that when luminous efficacy of radiation is maximized at a given value of Rf, Rt will be relatively low. If laser-like narrowband light sources are to be considered for use in general illumination, there may be a negative consequence for metameric colours. Fortunately, the size of that problem can be reduced by ensuring that a sufficiently large number of narrow primaries are included in the design, which can simultaneously provide high colour fidelity. Ultimately, light sources with different characteristics will be need to match varying needs.
CIE Session 2019 – Abstract Booklet
220

PP02 / PO031
HUE PERCEPTION AND NEUTRALNESS OF A SMARTPHONE DISPLAY UNDER DIFFERENT SURROUND CONDITIONS
Oh, S.1, Kwak, Y.1*, Kim, H.2, Seo, Y.2
1 Human Factors Engineering Department, Ulsan National Institute of Science and Technology, Ulsan, SOUTH KOREA
2 Samsung Display Co., Ltd., Yongin-City, SOUTH KOREA
Abstract
1. Motivation, specific objective
White appearance has been found to be critically different for different media and viewing environments. Previous studies on display whiteness examined the chromaticities to produce white appearance and the white appearance boundary over various ambient light conditions. This study attempted to investigate display whiteness with Hue perception and Neutralness estimation under four different surround conditions, Average and Bright states of 6500K and 3600K Correlated Color Temperature (CCT).
2. Methods
The psychophysical experiment was carried out using the 5.1-inch Samsung S7 smartphone display and 5-Channels LED lighting booth in a dark room. The display was placed horizontally as 60-degrees on the support inside the booth. Participants assessed both Hue perception and Neutralness of the display, presenting an empty white screen under 4 different surround conditions – 2 CCTs (6500K and 3600K) and 2 Surround Ratio (SR) conditions. To simulate two different SR conditions – Average and Bright – the luminance of the display was controlled while the lighting booth had the same illuminance as 5000lux at the center of the bottom. The display is quite bright in the Average condition (SR=2.6) and the Bright condition (SR=19.5) makes luminance of the display much lower to be perceived darker.
In the experiment, 15 test colours were made per each surround condition to be distributed around the lighting setting on CIE xy chromaticity. The test colours at 6500K roughly cover CCT from 5400 to 8900 and Duv from -0.03 to 0.00, 3600K colours cover CCT from 3300 to 4500 and Duv from -0.01 to 0.01. Each test colour was evaluated after participants were adapted to the lighting setting for 2 minutes. The Hue perception was assessed using magnitude estimation method, and Neutralness was estimated with Likert 5-point scale from 1 (very un-neutral) to 5 (very neutral). In the experiment, ten participants were recruited in Hue experiment and eight for Neutralness evaluation, the experiments shared the participants. Hue and Neutralness experiments were also performed as separated sessions in two days, since the experiment itself could affect the results. For data analysis, all the participants’ responses were measured on average.
3. Results
The Neutralness evaluation results at 6500K showed that the test colour most similar to the lighting setting was perceived as the most neutral in both Average and Bright conditions. On the other hand, the most bluish colour (or highest CCT) got the highest score at 3600K conditions. As a difference between the Average and the Bright mode of 3600K, when the display was seen more like surface colour (Bright), the test colours around the lighting setting were perceived as neutral, which was not observed in Average condition.
In case of the Hue perception experiment, the responses having more than 25% of neutral responses were considered as neutral. This experiment also showed very similar results with the Neutralness evaluation experiment. The colours having higher similarity with the lighting setting were perceived more neutral and the surround condition affected the results between Average and Bright modes especially at 3600K. In the Average mode of 3600K, the test colours were mostly perceived as either yellowish or reddish, so relatively bluish colour was perceived as neutral.
It was also shown that unique hue perception supports the earlier studies. The yellowness-blueness perception roughly follows in parallel to the Planckian locus; higher CCT evokes more bluish
CIE Session 2019 – Abstract Booklet
221
perception, and the lower perceives more yellowish. Redness-greenness perception goes after Duv levels; the higher Duv is perceived as greenish and lower Duv induces redness perception.
4. Conclusions
The display with the similar chromaticity to the lighting setting is perceived as netural, but it is influenced by surround conditions based on the experiment on both Hue perception and Neutralness evaluation. Since this study was conducted with limited experimental sets, further research should address more various surround conditions, test colours, and different viewing angles to support the results of this study.
CIE Session 2019 – Abstract Booklet
222
PP03 / PO007
VISUAL IMPRESSIONS OF PAIRED PATTERNS – TAKING WALLPAPER PATTERNS AS AN EXAMPLE
Gu, C., Ou, L.
National Taiwan University of Science and Technology, Taipei, CHINESE TAIPEI
Abstract
1. Motivation, specific objective
Pattern plays an important role in image recognition and preference, as it can affect the user’s perception and impression of the image, and can help create desired feeling for the image content and thus enhance image quality. It is unclear, however, as to whether there is a predictable relationship between pattern and its visual impression, and how to select a pattern to create a specified visual impression when paired with an existing pattern. As an initial attempt in this area, the present study used wallpaper patterns as an example with a context of house decoration, to investigate the relationship between pattern and the corresponding visual impressions.
2. Methods
To achieve this aim, two psychophysical experiments were carried out. Experiment 1 used single wallpaper patterns as the stimuli for visual assessment, whereas Experiment 2 used wallpaper pattern pairs as the stimuli. A total of 11 wallpaper patterns were used in Experiment 1. These patterns were selected from the most commonly used wallpapers existing in a local region: (1) a pattern consisting of Chinese calligraphy and a Chinese painting of plants, (2) a pattern imitating wood texture, (3) a pattern imitating fabric texture, (4) a pattern imitating rock texture, (5) a pattern consisting of drawings of Western architecture and stamps, (6) a pattern imitating metal texture, (7) a one-side-continual pattern of straight lines, (8) a two-side-continual pattern of circles, (9) a two-side-continual Baroque pattern, (10) a drawing of a flower and (11) a pattern imitating brick texture. All wallpaper patterns were achromatic. Each pattern had two lightness versions, light and dark, resulting in a total of 22 wallpaper patterns, serving as test images in the present study.
Ten 6-point forced choice scales were used in Experiment 1 for visual assessment of each wallpaper pattern: simple/complex, warm/cool, relaxing/heavy, comfortable/uncomfortable, lively/dull, unique/common, fashionable/unfashionable, splendid/plain, beautiful/ugly and like/dislike.
A panel of 34 observers, including 18 males and 16 females, all university students with normal colour vision, participated in Experiment 1. During the experiment, each observer was asked to view the 22 wallpaper patterns presented individually in random order on an EIZO ColorEdge CX270 liquid-crystal display, situated in a darkened room. The 22 wallpaper patterns were all replicated for each observer.
Experiment 2 used wallpaper pattern pairs, instead of single wallpaper patterns, as the stimuli. Out of the 231 pairs, which consisted of all possible combinations of the 22 wallpaper patterns used in Experiment 1, only 20 pairs were selected as the stimuli for Experiment 2. These 20 pairs were selected to cover a wide variety of responses for each scale according to results of Experiment 1.
A total of 11 semantic scales were used in Experiment 2 for the visual assessment. These 11 scales consisted of the 10 scales used in Experiment 1 and an additional scale, harmonious/disharmonious. A panel of 32 observers, including 15 males and 17 females, all university students with normal colour vision, participated in Experiment 2. The 20 wallpaper pattern pairs were all replicated for each observer. Experimental procedures and viewing conditions for Experiment 2 were all the same as those for Experiment 1 except for the stimuli, as described above. The categorical judgement scaling method was used for data collection and analysis for both experiments.
3. Results
According to results of Experiment 1, like/dislike is correlated closely with beautiful/ugly (R=0.98), comfortable/uncomfortable (0.94), relaxing/heavy (0.92) and lively/dull (0.92). This suggests that the observers tended to prefer wallpaper patterns that appear beautiful, comfortable, relaxing or lively. The 22 wallpaper patterns were ranked in order of like/dislike, and the result shows that the observers tended to prefer light patterns rather than dark patterns.
CIE Session 2019 – Abstract Booklet
223
Principal component analysis identifies two underlying factors of the visual responses for Experiment 1, "liveliness" and "simplicity", standing for 86.75% of the total variance. "Liveliness", is correlated closely with all but the simple/complex scale, the lively/dull having the highest correlation coefficient (R=0.95), followed by like/dislike (0.92), splendid/plain (0.91) and beautiful/ugly (0.91). "Simplicity", is correlated with only simple/complex (R=0.95). The two underlying factors, "liveliness" and "simplicity", are recommended to study further in the texture research area.
Visual responses obtained from Experiment 2 were compared with those obtained from Experiment 1. The former were visual responses for each of the 20 pattern pairs. The latter were a set of predicted values for each scale, determined by the mean value of visual responses for the two patterns in the given pair. According to the comparison results, most of the scales show high correlation coefficients, such as splendid/plain (R=0.88), relaxing/heavy (0.87), lively/dull (0.86) and fashionable/unfashionable (0.84). Only three scales show low correlation coefficients, including unique/common (R=0.34), like/dislike (0.35) and beautiful/ugly (0.39). The results seem to suggest that the "mean value" method does not apply to aesthetics-related scales.
The additional scale in Experiment 2, harmonious/disharmonious, was found to correlate closely only with like/dislike (R=0.90) and beautiful/ugly (0.84), two of the aesthetics-related scales. This implies that the harmonious/disharmonious scale may not be predicted well using the "mean value" method described above.
4. Conclusions
Two psychophysical experiments were carried out to investigate visual impressions of single patterns and pattern pairs. Results of Experiment 1 show the observers tended to prefer wallpaper patterns that appear beautiful, comfortable, relaxing and lively. The observers also tended to prefer light patterns rather than dark patterns. Experiment 2 reveals that the "mean value" method does not apply to aesthetics-related scales. These include unique/common, like/dislike and beautiful/ugly, and may also include the harmonious/disharmonious scale. Findings of this study may help develop new guidelines for wallpaper pattern design.
CIE Session 2019 – Abstract Booklet
224

PP04 / PO049
DETECTION OF THE STROBOSCOPIC EFFECT UNDER LOW LEVELS OF THE STROBOSCOPIC VISIBILITY METRIC
Veitch, J.A.1, Martinsons, C.2 1 National Research Council of Canada, Ottawa, CANADA
2 Centre Scientifique et Technique du Bâtiment, Saint Martin d'Hères, FRANCE
Abstract
1. Motivation, specific objective
The introduction of solid-state lighting to the marketplace has brought renewed concern about possible adverse consequences of exposure to cyclic variations in lighting system luminous flux, known as temporal light modulation (TLM). TLM may have visual, neurobiological, and performance and cognition effects on viewers. The visual perception effects are collectively known as temporal light artefacts (TLA), comprising flicker, the stroboscopic effect, and the phantom array effect. When the TLM frequency is below ~60 Hz, viewers perceive it as flicker. Above this frequency, people may perceive the stroboscopic effect, in which a moving object appears still, or moves in an interrupted manner. Researchers have derived a Stroboscopic Visibility Metric (SVM) to characterize the TLM signal in a manner that is thought to predict the visibility of the stroboscopic effect.
SVM is a visibility measure for which by definition, a value of 1 means that the average person would detect the phenomenon 50% of the time; thus, a light source having an SVM value of 1 would mean that the average person can detect the stroboscopic effect 50% of the time when that light source is the sole source of illumination. As noted by the CIE, the visibility threshold (i.e., SVM=1) is not a guarantee of acceptability of the visible phenomenon. There is an absence of published data concerning the relationship of SVM to stroboscopic visibility among the general population. This paper reports what is, to the best of our knowledge, the first such publicly available data.
2. Methods
This experiment was conducted in parallel at laboratories in Canada and France using the same protocol. Participants performed two stroboscopic visibility tasks under five levels of SVM: 0; 0.4-0.6; 1.0; 1.6; and >2.0, delivered using commercially available LED lamps. One of these tasks used an experimental method designed to be as similar as possible to the published work from which SVM was developed. In this experiment, people viewed a rotating horizontal black disc on which there was a white spot, and reported whether or not they saw white spots or a white blur. In the second task, participants viewed a mechanical metronome (a vertical task) on which there was a black dot. Participants performed 10 trials of each of these tasks under each of the five lamps (i.e., at each of the five SVM levels). On the 10th trial they also rated the acceptability of the test conditions. Data were also collected concerning the participants’ Pattern Glare Sensitivity, which is a marker for the susceptibility to visual stress.
3. Results
Data collected from 18 people each in Canada and France will be reported here. The results are summarized as follows:
An SVM>2.0 caused virtually all of the participants to perceive stroboscopic effects of the horizontal rotating disk all of the time.
• The most sensitive 25% of the people detected stroboscopic effects with the disk 90% or more of the time at SVM=1.4 (75th percentile overall).
• The 75th percentile detection rate dropped to 63% when the SVM was ~0.9, meaning that only one-quarter of the sample could detect the stroboscopic effect more than 63% of the time for these lamps.
• At SVM levels of 0.4 and below, the stroboscopic detection rate for the most sensitive quartile of participants dropped to 10%.
CIE Session 2019 – Abstract Booklet
225
4. Conclusions
The results provide an indication of how often people might see the stroboscopic effect while looking at moving objects, depending on the SVM characteristic of the light source. The developers of standards and regulations for lighting products and systems can use this information to inform their decision-making about possible limit values. Larger data sets will be required to determine the effects of light source SVM on the most sensitive individuals. The work is a first step towards understanding the visual perception, cognition, and health effects of TLM on the population.
CIE Session 2019 – Abstract Booklet
226
PP05 / PO026
CHANGE IN THE APPEARANCE OF OBJECTS ACCORDING TO THE RATIO OF DIRECT AND DIFFUSIVE LIGHT
Mizokami, Y.1, Kiyasu, Y.1, Yaguchi, H.1 1 Chiba University, Chiba, JAPAN
Abstract
1. Motivation, specific objective
Lighting environment has become diverse due to the improvement of solid-state lighting technology, and it is critical to consider the appearance of objects under various lighting conditions. Shape, texture, and light are crucial factors to determine the appearance of an object. We previously showed that the diffuseness of lighting influenced the perceived glossiness and roughness of an object (ICVS 2017). We controlled the diffuseness of by changing the position of a diffuser board under a lamp in the previous study. However, it was not investigated systematically how the combination of direct light and diffusive light influences the appearance of an object. In our daily life, we often see lighting environments consists of the combination of direct light and diffusive light. In this study, we investigate how the appearance of object surface changes according to the ratio of diffusive and direct light components.
2. Methods
A miniature room was illuminated by mixed lighting with directional light and diffusive light. We used two LED lamps and a diffuser board. One was far from the diffuser board, giving a diffusive lighting condition. The other was close to the diffuser boards, giving a direct lighting condition. We tested the five diffuseness levels of lighting by changing the intensity ratio of each lamp. The test samples were made with a 3D printer. We used glossy and matte 3 cm-square samples with a sine-wave surface which depth was 1 and 0.5 mm, and three types of frequencies (3, 6, and 9 waves per sample). Observers adapted to the illumination of the miniature room for one minute, and then responded the roughness and glossiness of the test samples placed at the center of the room using a magnitude estimation method.
3. Results
Samples tended to appear less glossy and smoother as the lighting became more diffusive. Especially, surfaces in high frequency and 1 mm conditions were strongly influenced by the diffuseness levels of lighting. Perceived glossiness for glossy and high-frequency-surface samples showed larger influence of the diffuseness levels. Perceived roughness for matte surface samples showed clearer influence of the diffuseness levels.
We further analyzed the relationship between the appearance of objects and the luminance histogram of samples. Glossiness evaluation showed high correlations with the standard deviation, contrast, and skewness of the luminance distribution. Roughness evaluation showed high correlations with the contrast and a moderate correlation with the standard deviation and the skewness. These results suggest that the appearance of objects is changed with the characteristics of the luminance histogram of samples.
4. Conclusions
Our results show that samples with high frequency and rough surface tend to appear less glossy and smoother as the diffuseness of light increase. Glossy samples appear less glossy and matte samples appear smoother under diffusive light condition. It was suggested that the change in luminance histogram (standard deviation, contrast and skewness) would contribute to the appearance of object. It would be necessary to consider the shape and characteristics of an object surface when predicting the appearance under the variations of lighting diffuseness.
CIE Session 2019 – Abstract Booklet
227

PP06 / PO076
QUANTIFYING PERCEIVED CHROMA CHANGES BY HUNT EFFECT IN LIGHTING
Kawashima, Y., Ohno, Y. National Institute of Standards and Technology, Gaithersburg, MD USA
Abstract
1. Objective
According to the Hunt Effect, perceived chroma of object colours appear less saturated at low light levels than at high light levels. This means that in order to make the appearance of the objects at the low light levels close to that at high light levels, the chroma saturation level of the lighting needs to be increased. Therefore, increasing the object chroma by a light source in indoor lighting can bring higher colour fidelity if outside daylight is considered the reference. Thus the Hunt Effect may relate to not only preference but also colour fidelity of lighting. For example, CRI or CIE 2017 Color Fidelity Index (CIE 224) calculates colour differences for test colour samples under a reference illuminant (a blackbody or daylight illuminant) and under a test light source. Since colour shifts in any directions are equally penalized, an increase of chroma to compensate the Hunt Effect would also be penalized. Thus, it is important to verify and quantify the degree in which the Hunt Effect affects the perception of colour saturation and evaluate impact on colour fidelity. Our previous experiment showed that the Hunt Effect is effective at normal indoor lighting levels, tested at 100 lx and 1000 lx. However, it is still not clear how much perceived chroma shifts occur for each colour of objects by Hunt Effect. The purpose of this study, therefore, is to quantify the perceived chroma shifts by the Hunt Effect. A vision experiment was conducted using a spectrally-tunable lighting double-booth, for saturation-matching of coloured objects under different illuminance levels.
2. Methods
A vision experiment was conducted using a double-booth equipped with 16-ch spectrally tunable light sources. The left side of the booth was set to 1000 lx, and the right side was set to 100 lx or 300 lx. 22 subjects having normal colour vision participated in the experiment. The age of subjects ranged from 18 years to 63 years old, 9 males and 13 females. The subject sat with his/her forehead against a view divider in front of the center of the booth so that the left eye viewed only the left side of the booth (1000 lx), and the right eye viewed only the right side of the both (haploscopic view). After the eyes were fully adapted to each side of booth, the subject compared the colour of identical red or green patches (5 cm x 5 cm) placed on both sides of booth. The light at the left side (1000 lx) is broadband and has no effect of chroma increase. The light spectra at right side were controlled so that
they increased object chroma at seven different levels (called matching lights) by up to C*ab≈28 for
the red and C*ab ≈26 for the green patch in CIELAB colour space. The lowest chroma level had no increase in chroma, thus, the same colour as the reference light on the left side. The reference and the matching lights were set at the same CCT, 3000 K or 5000 K, with Duv (distance from Planckian locus)=0. Subjects were adapted to each side of illumination in haploscopic view for three minutes before experiment started. After adaptation, the seven matching lights were presented sequentially and the subject were asked to select under which light the colour patch on the right side appeared closest to the one on the left side booth. As the colour under lower illuminance appear less saturated, subjects would select one of matching lights that increase the object chroma. The effect of Hunt Effect can be estimated from the amount of chroma increase by the selected matching light.
Since each eye will not be perfectly adapted to very different light levels at haploscopic condition, gray patches of several different lightness (reflectance 50 % to 68 %) were prepared for the right booth. The darkest gray patch (50% reflectance) was placed at left side (1000 lx) also, and after full adaptation, the subject was asked to select one of gray patches on the right side that matched the brightness of the one on the left side. The results of this gray matching were used to correct the experimental results for imperfect adaptation in haploscopic condition. Typically 53 % to 56 % reflectance patches were selected by the subjects, indicating significant individual variations.
CIE Session 2019 – Abstract Booklet
228
3. Results
Chroma differences between the colour patch with the selected matching light on the right side at 100 lx or 300 lx and the colour patch with the reference light on the left side at 1000 lx was calculated for each CCT/illuminance/target condition. For the red patch, the mean matching chroma at 100 lx were 25.8% and 29.7% higher than the chroma for the left side target at 3000 K and 5000 K respectively. For the green patch, the mean matching chroma saturations 100 lx were 55.0% and 41.1% higher than the left side target at 3000 K and 5000 K respectively. Moreover, there were statistically significant differences for the mean matching chroma between the red patch and the green patch. The green patch needed more chroma saturation to match that of the left side. The mean matching chroma saturations at 300 lx were smaller than those at 100 lx.
4. Conclusions
The changes in perceived chroma due to the Hunt Effect have been quantified for the red and green patches between 100 lx and 1000 lx. At 100 lx, the perceived chroma of the red patch was shown to decrease by around 30% and that of the green patch was shown to decrease by around 50% compared to those at 1000 lx. The large changes of perceived chroma for the green colour compared to red colour indicates that colour vision is more sensitive to red. This experiment was limited to evaluation of only red and green samples due the capability of light sources. Experiments using other methods are planned to evaluate the Hunt Effect for other colours.
CIE Session 2019 – Abstract Booklet
229

PP07 / PO058
SHADE-FREE TEXTURE ACQUISITION FOR 3D SCANNING SYSTEM
Lin, T.H., Chan, K.L., Chen, H.S. National Taiwan University of Science and Technology, Taipei, CHINESE TAIPEI
Abstract
1. Motivation, specific objective
Nowadays, 3D scanning technology is mature to obtain quality 3D shape of a real object. However, to obtain a uniform and shade-free texture is still a challenging task, particularly for commercial products. We propose a practical solution in our 3D scanner to capture 3D object with highly uniform shade. This scanner utilizes a swinging laser in front of the cameras to scan 3D shape, and then captures additional colour images for texture. Those images are again adjusted according to 3D shape. Based on this design, the colour uniformity of scanned 3D object is significantly improved.
2. Methods
Our objective is to obtain uniform shades of the 3D object during the scanning process. The proposed 3D scanner, which is a self-developed device, consists of two colour cameras, whose resolution are both 720 x 1280 pixels, one slit laser, and a LED as external active illumination. For a commercial 3D scanner, it is unlikely to acquire the scattering or reflection distribution of object’s surface, such as BRDF or BSDF models. The acquired surface texture is therefore not uniform. To obtain the native colour of a real object in a single shot, a practical solution based on shade compensation is proposed. This method simply removes the shade effect in every taken image under a known illumination condition.
In our scanning pipeline, we have two independent processes. One is collecting 3D point clouds in every scanning direction. The other is taking colour images corresponding to all scanning directions. After 3D model is reconstructed, we render the model with monochromic shade under the same parameter corresponding to real camera. The extrinsic parameter of the virtual camera is readily to be the same as the real camera. However, the intrinsic parameter including lens distortion can not be directly applied in openGL. We initially deal with the projection matrix by a shifted axis and focal lengths from camera intrinsic parameter. Then, the lens distortion effect is again applied to the rendered image by bicubic interpolation. As a result, the consistence between simulated and captured images is controlled as accurate as sub-pixel level.
To form 3D range data, the swinging laser will cast definite line features on 3D object’s surface during scan process. And two synchronized cameras of the scanner will observe the line features to determine 3D points in each frame. An additional colour image is then taken from one of the cameras, and it has exactly the same coordinate with range data. Therefore, a disparity-free texture image is collected. The turntable in the scanner will rotate the object to specific positions for obtaining the rest range data. There are totally eight range images are acquired to be integrated into a complete model by Poisson surface reconstruction.
However, those acquired images suffer from non-uniform illumination. To correct the non-uniform shade, we propose a compensation method based on openGL shading language to realistically simulate the light distribution. There are two calibration steps: the first is to measure brightness distribution on a white board under one LED illumination. Then, we make a mathematic regression between the captured brightness and Lambertian reflectance to have reasonable shading parameters as that in real illumination. The second step is to render an image whose camera position is the same with corresponding captured image, and the lens distortion is considered. Therefore, the shading brightness comparing to the real image is simulated. Finally, the shade effect in the real image will be removed by being simply divided by the simulated brightness.
3. Results
In result, we directly use vertex colour render instead of a texture map from warping images in rending process. This is because the spatial resolution on the reconstructed object’s surface, whose 3D positions are estimated by subpixel interpolation, is better than acquired images. To synthesize the
CIE Session 2019 – Abstract Booklet
230

surface colours and to suppress the illumination discrepancy among several scanning directions, a multiple-view blending method which follows a weighting function of surface normals is also carried out. Finally, the shade caused by the reflection of light to the surface of the test object is successfully supressed. And the uniformity of colour of synthesized 3D model is significantly improved. With regard of the limitation, our method is so far not able to deal with self-occluded shadows and glossy surfaces. Nevertheless, it is very likely to be overcame in the future by ray-tracing and high dynamic range image.
4. Conclusions
Based on the known 3D information, our simulated shade-effect images are consistent with those input images. Therefore, a compensated operation efficiently removes the shade in every image. As a result, the colour 3D model with share-free texture is obtained.
CIE Session 2019 – Abstract Booklet
231
PP08 / PO064
FLASH OBSERVATION AT THRESHOLD OF VISION USING A FOUR ALTERNATIVE FORCED CHOICE EXPERIMENT
Bergen, A.S.J.1, Schier, M.A.2, Jenkins, S.E.3 1 Photometric Solutions International, Melbourne, AUSTRALIA, 2 Swinburne University, Melbourne,
AUSTRALIA, 3 Steve Jenkins and Associates, Melbourne, AUSTRALIA
Abstract
1. Motivation, specific objective
In May 2018, the International Commission on Illumination (CIE) published a technical report CIE 229:2018 Groundwork for Measurement of Effective Intensity of Flashing Lights. While the original intention of the Technical Committee’s document was to make a recommendation on the method to measure flashes and calculate the effective intensity, the committee was not able to reach a clear consensus on the full details of the method to recommend. There was a scarcity of data available; the experimental conditions of some of the papers studied were not fully disclosed; some of the papers studied were not published in peer-reviewed journals; and finally, there was not a clear outstanding optimal calculation method without performing significant analysis preferably with more data. The intention of this experiment is to supplement the existing data with additional data, collected under tightly controlled conditions.
2. Methods
In the experiment the observer is dark adapted in front of an apparatus that permits flashes to be shown from one of four apertures positioned above, below, left and right of a red fixation point. Each flash varies in terms of temporal onset and offset (flash shape), duration and illuminance at the observer’s eye. The size and positions of the pinholes and the distance of the observer were chosen so that:
the diameter of the pinholes is 1 minute of arc subtended at the eye, therefore it is effectively a point source; and
the pinholes are separated from the fixation point by 0.5° and are therefore well within the foveal vision area but far enough away that the observer can identify the spatial location of the flash stimulus (i.e. up, down, left or right).
The experimental paradigm is a four alternative forced choice experiment (4AFC). The observer presses a foot pedal to initiate the sequence, is shown a flash, then uses a hand-held console to choose which of the four apertures they thought the flash came from. They need to respond, even if they did not see the flash. For the shorter duration and lower illuminance flashes where the observer is not likely to see the flash, they will have a 25 % chance of selecting the correct aperture. For the longer duration and higher illuminance flashes they will have close to 100 % chance of selecting the correct pinhole. The observer is shown a total of 200 flashes in random order. For a specific flash shape and duration, the illuminance corresponding to threshold detection is determined using a statistical analysis.
3. Results
As of the time of abstract submission the development of the experimental apparatus and software is complete and preliminary results have been obtained. A set of nine flash durations were used ranging from 25 ms up to 1 second, plus a steady-state setting (continuously on) which is used to normalise the data and calculate the effective intensity. These settings were chosen as they are compatible with the most recent report studied, by Research & Radionavigation UK. The ten flash settings were each presented using 20 different intensity settings corresponding to illuminance levels at the eye ranging
from 0.01 lx to 2 lx. The preliminary results can be summarised as follows:
Four subjects have each completed the set of 200 flashes twice;
The threshold illuminance values obtained are comparable with the threshold illuminance values obtained by Research & Radionavigation;
CIE Session 2019 – Abstract Booklet
232
The graph of effective intensity vs flash duration shows a similar trend as that obtained by Research & Radionavigation, although the small amount of data obtained so far means that the data obtained in this study are noisy.
Future work is planned over the next 3-4 months as follows:
An additional two calibration methods are planned to validate the calibration of the light source.
In addition to the rectangular flash shapes presented to the observers so far, additional flash shapes are planned which include symmetrical triangles; rising triangles; falling triangles; “spiky” rectangular flashes and pulse-width modulated rectangular flashes.
The equipment will be moved to a local university where it is expected that up to 50 observers will participate in the study (ethics committee approval has already been granted).
The results from the university study are expected to be available by mid-March 2019.
4. Conclusions
An experiment has been set up to study the visual perception of flashes at the threshold of vision. Preliminary results are favourable in comparison with another study that was undertaken in recent years. Further work is underway to validate the calibration of the system and to supplement the data with a significant additional number of observers at a local university.
The results obtained by this study will feed into the existing body of data and assist the CIE reportership DR 2-81 on “Flash effective intensity calibration”, which will make a recommendation regarding a new CIE TC to follow on from the work undertaken by TC 2-49 that produced the publication CIE 229:2018. A recommendation on a definitive method of determining the effective intensity of flashing lights is highly sought-after by industries including aeronautical and maritime.
CIE Session 2019 – Abstract Booklet
233
PP09 / PO073
INVESTIGATION OF LED-BASED COMPACT TRANSFER STANDARD SOURCE FOR LUMINANCE MEASUREMENT
Godo, K. National Metrology Institute of Japan (NMIJ), JAPAN
National Institute of Advanced Industrial Science and Technology (AIST), JAPAN
Abstract
1. Motivation, specific objective
For determining luminous flux value of lighting products, manufactures generally calibrate their instruments with a standard lamp of which reference value is traceable to National Metrology Institute. However, large discrepancy of measurement results of LEDs happened using the traditional standard lamp as a reference standard source. Therefore, NMIJ developed several transfer standard source based on LED (standard LED) for measurement of luminous intensity and luminous flux of LED. The standard LED has suitable properties for LED measurement in manufacturers, and is used as a transfer standard source for transferring the reference value from a calibration laboratory to manufacturer in Japan.
On the other hand, as well as luminous flux measurement in lighting product, luminance measurement in display product is also indispensable. The necessity of transfer standard source for luminance measurement of LED is the same situation as luminous flux measurement.
Suitable properties of both uniform luminance surface and angular distribution similar to Lambertian surface are necessary for a candidate of the luminance transfer standard source. In another studies, an integrating sphere source was investigated as the candidate of a transfer standard source. However, an integrating sphere source has some weakness at a point of portability and robustness, thus it is unsuitable for the transfer standard. As other methods, by technological progress over the past few years, beam homogeneous technique based light source, e.g. using microlens array or light pipe, is becoming an attractive method for making uniform luminance surface.
In this study, a transfer standard source for LED luminance measurement, which based on a high-power LED (HP-LED) and a homogeneous optic, has been constructed in order to achieve compact and robust performance.
2. Methods: construction of transfer standard source for luminance
The necessary properties of a transfer standard are a suitable light source, stability of optical intensity, a uniform luminance surface and uniform diffused property.
Four different colour HP-LED (Blue, Green, Red and White) were selected as a light source. The selected HP-LED was mounted to the temperature-stabilized heatsink in which a thermo-module and a platinum temperature sensor were built to achieve sufficient optical stability.
For creating a uniform luminance surface, two methods using microlens arrays (MLA) or light pipe (LP) was considered (MLA model and LP model), and those two methods were analysed with ray tracing simulation before construction of trial models.
The MLA model was constructed in a HP-LED, a heatshink, a pair of MLA, a condenser lens, a microlens diffuser, three baffles, and a precise aperture. The size of MLA model was designed at 60 mm in length and at 50 mm in diameter except the heatsink part. MLA generally is constructed multiple lenses formed in a one-dimensional or two-dimensional array on a supporting substrate. To generate a uniform luminance surface with MLA, a pair of MLA and a condenser lens is generally used. By some trials with the ray tracing simulation, the pair of MLA and the condenser lens were reconsidered and their setting positions were optimized. In the process, the number of baffle and the opening size of the baffles were decided as well as the MLA and the condenser lens too.
The LP model was constructed in a HP-LED, a heatshink, a LP, a microlens diffuser, two baffles, and a precise aperture. LP is usually hexagonal structure, LP is much like optical fiber, that is, a homogenized method using LP utilize total internal reflection (Snell’s law) to transmit light from
CIE Session 2019 – Abstract Booklet
234

entrance to exit of the light pipe. As a consequence, a uniform luminance surface is generated on the exit plane of the LP. In the LP models, the LP is used that, the length is 50 mm, the length of between opposite side is 8 mm, and the material of it is silica.
In addition, in above two models, to make uniform diffused property which is similar to Lambertian distribution, a microlens diffuser was used. A microlens diffuser is constructed with generally microlens, where each individual microlens element is designed and fabricated to produce controlled diffused property. The microlens diffuser is better efficiency than common diffusers, e.g. a ground glass or an opal glass.
3. Results
The luminance difference of each constructed models was evaluated with an image-luminance meter. The luminance difference of MA model was evaluated as ± 5 % within 9 mm in diameter, while, the luminance difference of LP model was evaluated as ± 5 % within 6 mm in diameter. Luminance value of the MA model with white HP-LED was about 4000 cd/m2, and the luminance value of the LP model was 44000 cd/m2. It found that the uniformity area of luminance of the LP model was smaller than the MLA model, but the optical efficiency of the LP model was superior to the transfer standard with MLA by 10 times or more.
The angular distribution of the luminous intensity was evaluated by a gonio-photometer system. Those evaluation results show that the angular distributions of the two-type model considerably match with Lambertian distribution by using the microlens diffuser. As a remarkable point using microlens diffuser, luminance was more than two times stronger than when using an opal glass.
4. Conclusions
In conclusion, in this study, in order to achieve compact and robust performance, two types of transfer standards source for LED luminance measurement were proposed and constructed a trial model. Two types model were inferior of an integrating sphere source at a point of uniformity of luminance, but compact, robust and the optical efficiency was superior to the integrating sphere source.
CIE Session 2019 – Abstract Booklet
235

PP10 / PO090
GONIOSPECTRORADIOMETRY OF ROAD LIGHTING LUMINAIRES IN RESPECT OF MESOPIC PHOTOMETRY
Dubnicka, R.1, Lipnicky, L.1, Mokran, M. 1, Gasparovsky, D.1 1 Department of Electrical Power Engineering, Faculty of Electrical Engineering and Information
Technology, Slovak University of Technology, Bratislava, SLOVAKIA
Abstract
1. Motivation, specific objective
A goniophotometer is needed to measure the luminous intensity distribution of luminaires. The results from goniophotometric measurements are very important for lighting engineers who are using these results in lighting calculation of photometric parameters of the various lighting systems. At the present is discussion among scientific community to calculate performance of road lighting system with regard to mesopic vision conditions. Spatial characteristics of the luminaire are expressed by luminous intensity distribution curves (LIDC) which represent particular distribution of the luminous flux in particular direction from light sources installed in the luminaire. These curves are also used in lighting design calculations of photometric parameters of the road lighting system. Photometric parameters, including the spatial luminous intensity characteristics of the luminaires are defined in the interchangeable photometric data files for the C plane where the luminous intensity in particular direction is defined by means of the angles C, γ. Simplified method how to provide mesopic photometric data file is to multiply each luminous intensity value of LIDC in respect to S/P ratio of the luminaire. However, this approach does not consider possible dependence of spectral power distribution on changing angle what was shown in some scientific papers treating goniospectroradiometry of luminaires. Therefore, it is needed to use gonio-spectroradiometers for proper spatial radiant characteristics of the luminaire which can be transformed into photometric data files for lighting calculation purposes by lighting tools used usually in practice.
2. Methods
This paper deals with spectral measurements of road lighting luminaires under laboratory conditions with far-field gonio-spectroradiometer for determination of spatial characteristics represented by LIDCs. Calculation of photometric parameters in mesopic photometry was used in respect to document CIE 191:2010 and related CIE supplements prescribing recommendation of calculations of mesopic quantities. Comparison between using simplified method by means of goniophotometry with V(λ) filtered photometer head and goniospectroradiometric method is described.
3. Results
Based on the results of the used goniophotometric measurement methods of road lighting lumianires in the frame of research work paper describes impact of using different approach regarding to mesopic photometry assumption at lighting design of road lighting. The presentation will show
goniospectroradiometry of road lighting luminaires in connection with transformation of results into photometric data files provided for calculation of mesopic photometric quantities with respect to uncertainty of measurement,
comparison between two approaches which can be assumed in the practice with recommendation what is more appropriate with respect to mesopic photometry regarding to precision of used methods
examples of lighting calculations of particular road lighting system referring goniospectroradiometry of spatial radiant characteristics of luminaires
4. Conclusions
Goniospectroradiometry is method where spatial photometric, radiometric and colorimetric quantities can be measured in particular direction from luminous part of luminaires. In the paper is described goniospectroradiometry of road lighting luminaires in respect to mesopic photometry lighting
CIE Session 2019 – Abstract Booklet
236
calculation purposes with transformation of results measured by gonio-spectroradiometer were transformed into photometric data files used in lighting calculation tools with respect to uncertainty of measurement. Simplified method for mesopic photometry usually used in practice was investigated in the frame of research work as well for particular cases. Also it was compared to goniospectroradiometric method. Examples of model lighting calculations using lighting calculation tools are provided in the paper.
CIE Session 2019 – Abstract Booklet
237

Session PS2 Presented Posters (D2/D3)
Monday, June 17, 15:35–16:30
CIE Session 2019 – Abstract Booklet
238

PP11 / PO062
NATURAL AND ACCELERATED AGEING OF ORGANIC LED PANELS USING SPECTRALLY DISPERSED ULTRAVIOLET EXPOSURE
Askola, J.1, Vaskuri, A.1, Poikonen, T.2, Ikonen, E.1,2 1 Metrology Research Institute, Aalto University, Espoo, FINLAND,
2 MIKES Metrology, VTT Technical Research Centre of Finland Ltd, Espoo, FINLAND
Abstract
1. Motivation
Use of organic light emitting diodes (OLEDs) in consumer products has increased in recent years. Although OLEDs are mostly known from the displays used in consumer electronic devices, e.g. televisions and mobile phones, they are also making their way into general lighting applications. The naturally diffuse luminous output of OLEDs permits the design of luminaires with no diffusers and thus a thinner luminaire profile is achieved compared to similar luminaires built using the more common inorganic LEDs.
When estimating the lifetime of luminaires using OLEDs, the ageing properties are of high importance. The different degradation mechanisms of OLEDs can be roughly divided into formation of dark spots, sudden catastrophic failure, and intrinsic degradation of the luminous efficacy of the device. The effects of the third mechanism can be seen as a gradual decrease in the luminance and can be a result of either natural operation of the panel or caused by exposure to external radiation, especially to ultraviolet (UV) radiation.
Usually natural ageing tests of lighting products are resource and time intensive, and in the case of LEDs and OLEDs, conclusive results will be obtained years after starting the experiment. Thus, methods for accelerated ageing are of high importance. In the case of OLEDs, it is also important to know how the devices can withstand UV exposure.
2. Methods
The wavelength dependence of photodegradation was studied for five OLED panels in an under-filled geometry where a limited area of the OLED surface was exposed to spectrally dispersed UV radiation using a spectrograph. During the ageing test, the panels were operated with a direct current of 368 mA. The voltage over the panels was monitored to be 20 V – 21 V. The panels were stabilised to a
temperature of 40 C in all stages of the measurements.
The panels were spatially measured for luminance and spectral radiance using an XY linear translation stage and a calibrated spectroradiometer after each UV ageing period. The total UV ageing time for each panel was 256 hours and the operating times for the panels varied between 335 h and 430 h. A reference luminance of the same panel, on the panel surface unexposed to UV radiation was used to normalize the accelerated ageing results as the different OLED specimens had different natural ageing times. The unexposed reference area was located on the lower part of the panel, having the same surface area as the UV exposed strip on the upper part of the panel.
For each measured position within the UV exposed area, the normalized luminance value was plotted against the total cumulated spectral radiant exposure at the time of measurement. The measured luminance values were fitted to stretched exponential decay function on a logarithmic exposure scale using a non-linear least squares method. After this, the fitted measurement results were normalized to unity at the time before the ageing and the fitting was performed again for the whole group. This procedure helps to improve the range for reliable extrapolation of lifetime.
3. Results
The unexposed reference areas of the panels were found to degrade in luminance by less than 1% during the total switched-on time of approximately 400 hours. The effect of the accelerated ageing on the luminance calculated using the data measured for all the panels after 256 hours of exposure was approximately 8% at the exposure wavelengths between 330 nm and 340 nm. The extrapolated luminance half-life time (L50) in the method is over 6000 hours with the used average spectral irradiance of 3900 mW m-2 nm-1 at the exposure wavelength of 340 nm.
CIE Session 2019 – Abstract Booklet
239

The largest changes of the spectral power distribution in the UV exposed area are seen approximately at the wavelength of 450 nm, where one of the electroluminescent peaks of the panels is located, and close to 600 nm, at the maximum of the photoluminescent peaks. The spectral power distribution of the naturally aged reference areas of the panels has luminance decay mostly at the electroluminescent peaks.
At the exposure wavelengths above 340 nm, the spectral radiance at the electroluminescent peak decreased approximately by 7% compared to the 16% at 330 nm – 340 nm exposure wavelengths, even though the used exposure irradiance reaches a maximum at 355 nm. The exposure irradiance is two thirds of the peak value at 340 nm and only half of the peak value at 330 nm. The luminance decay as a function of exposure wavelength is fastest and saturated below 300 nm, but as the exposure levels are relatively low with the used radiation source over that wavelength range, the observed absolute decay is up to 10% smaller than between the exposure wavelengths of 320 nm – 340 nm. No noticeable decrease in luminance was observed at exposure wavelengths longer than 350 nm.
4. Conclusions
We have studied the ageing properties of commercial OLED panels to determine their degradation rate of the luminous output and the wavelength dependency of the degradation. The OLED panels were exposed to UV radiation to study potential new test methods for accelerated ageing of the panels.
The spectrally dispersed UV exposure increased the luminance decay at most by a factor of eight when compared to the natural ageing observed from the same panel. Based on the results, the method used in this ageing test is highly versatile, as it provides information on the spectrally resolved UV degradation, as well as on the natural ageing of the panels, since only a limited area of the panel is exposed to UV.
CIE Session 2019 – Abstract Booklet
240

PP12 / PO071
TESTING SPARKLE MEASUREMENT CAPABILITIES OF NATIONAL METROLOGY INSTITUTES
Ferrero, A.1, Basic, N.2, Campos1, Pastuschek, M.A.3, Perales, E.4, Porrovecchio, G.5, Quast, T.3, Šmid, M.5, Schirmacher A.3, Velázquez, J.L. 1, Martínez-Verdú, F.M.4
1 CSIC, Madrid, SPAIN, 2 METAS, Bern, SWITZERLAND, 3 PTB, Braunschweig, GERMANY, 4
Universidad de Alicante, Alicante, SPAIN, 5 CMI, Prague, CZECH REPUBLIC
Abstract
1. Motivation, specific objective
Sparkle, as defined by ASTM E284 -17 Standard Terminology of Appearance is “the aspect of the appearance of a material that seems to emit or reveal tiny bright points of light that are strikingly brighter than their immediate surround and are made more apparent when a minimum of one of the contributors (observer, specimen, light source) is moved”. Since the measurement of this visual texture is important for automotive, cosmetic and displays industries, a measurement scale has to be developed, so that traceability can be provided by national metrology institutes (NMI) or designated institutes. Some of them (PTB, METAS, CMI and CSIC) have defined the measurands for sparkle and have developed a photometric and image-based methodology to measure them. The specific objective of this research work is to test the existing capabilities of these NMIs to measure sparkle.
2. Methods
Sparkle quantities were calculated from luminance factor images of specific specimens, for which the value of each pixel corresponds with the luminance factor of the elementary area imaged on that pixel. The definition of these quantities is based on the contrast between sparkles and background in the luminance factor image, and on the accepted contrast threshold for luminous sources on darker background, which allows us to determine when a given sparkle point is visible. Therefore the defined sparkle quantities describe the density of the sparkle points and the distribution of their contrasts in the image.
Nine achromatic sparkle specimens, produced with different sizes and concentrations of effect pigments, were selected and their sparkle quantities measured by the goniospectrophotometers of PTB, METAS, CMI and CSIC, which were separately developed and have different designs. Each specimen was assessed at three different geometries (15º:0º, 45º:0º and 75º:0º).
3. Results
The NMIs’ measurements of the defined sparkle quantities performed within the EMPIR project BiRD (“Bidirectional reflectance definitions”) will be compared. The analysis of these measurements is still in process, but they will be fully presented and commented during the conference. As a preliminary result, it was found that the proposal for background luminance determination from the images might need to be redefined in order to improve its accuracy, whose relevance in the final result was underestimated. In the same way, the multiple and independent realizations of the measurement procedure will be very valuable for identifying recommendations and possible improvements in the methodology.
4. Conclusions
The measurement of previously defined sparkle quantities has been independently accomplished by three different national metrology institutes (PTB, METAS, CMI), and one designated laboratory (CSIC). The comparison of these measurements will allow improvement of the methodology to measure sparkle. This is only the first stage toward the definition of a measurement scale for sparkle. Once the sparkle quantities and their measurement methodology are well-established, they must be correlated with visual data.
CIE Session 2019 – Abstract Booklet
241

PP13 / PO082
FUTURE PHOTOMETRY BASED ON SOLID-STATE LIGHTING PRODUCTS
Poikonen, T.1, Pulli, T.2, Kokka, A.2, Dönsberg, T. 1,2, Šmíd, M.3, Kliment, P.3, Pons, A.4, Ferrero, A.4, Kübarsepp, T.5, Gál, P.6, Gerloff, T.7, Källberg, S.8, Dekker, P.9, Thorseth, A.10, Jost, S.11, Klej, A.12,
Brida, G.13, Reiners, T.14, Blattner, P.15, Stuker, F.15, Ludwig, K.16, and Schneider, M.17
1 VTT, Espoo, FINLAND, 2 Aalto University, Espoo, FINLAND, 3 ČMI, Prague, CZECH REPUBLIC, 4 CSIC, Madrid, SPAIN, 5 Metrosert, Tallinn, ESTONIA, 6 BFKH, Budapest, HUNGARY, 7 PTB, Braunschweig, GERMANY, 8 RISE, Borås, SWEDEN, 9 VSL, Delft, NETHERLANDS, 10 DTU, Rosskilde, DENMARK, 11 ENTPE, Lyon, FRANCE, 12 Signify, Eindhoven, NETHERLANDS,
13 INRIM, Turin, ITALY, 14 LMT, Berlin, GERMANY, 15 METAS, Bern-Wabern, SWITZERLAND, 16 OSRAM, Augsburg, GERMANY, 17 OSRAM OS, Regensburg, GERMANY
Abstract
1. Motivation, specific objective
For a century, incandescent standard lamps have been used by national metrology institutes (NMIs) and other laboratories as reference light sources in calibrations of illuminance and luminance meters, integrating sphere photometers and goniophotometers. Some laboratories rely on source-based photometric scales that have been established using a large number of standard lamps with well-known ageing characteristics. Many of these scientific grade light sources were developed and manufactured by companies who manufactured tungsten filament lamps and other products for the consumer market. Phasing out of tungsten filament lamps from the market may have a great influence in the availability of scientific grade incandescent lamps in the future. Therefore, it is important to investigate alternative technologies as well as requirements for manufacturing scientific grade standard lamps in the future.
European research project “Future photometry based on solid-state lighting products” (EMPIR PhotoLED) has investigated the fundamental requirements for photometry based on white light-emitting diode (LED) sources. The project has developed new LED illuminants, LED standard lamps for luminous intensity and luminous flux, and new measurement methods, directly addressing many technical challenges listed in the CIE research strategy of 2016. In this paper, we present the outcome of the 3-year scientific project, whose work has been carried out by European NMIs, universities, test laboratories and industrial partners working in the field of photometry and solid-state lighting.
2. Methods and results
LED illuminants and reference spectra
The new photometric system requires a new LED reference spectrum, similar to the CIE Standard Illuminant A that can be used as the target spectrum for manufacturing of physical LED calibration sources. As in the case of Standard Illuminant A, there are benefits to link the spectrum to colorimetry. The project started to investigate new LED illuminants by measuring and collecting spectral power distributions (SPDs) of approximately 1500 commercial LED products of different types, including lamps, luminaires and LED components. A total of 10 new potential LED illuminants were identified, including phosphor converted blue and ultraviolet LEDs, red-green-blue LEDs and other special types. The spectral data were shared with CIE TC1-85 to give input on the revision of CIE15: Colorimetry.
Extensive spectral analysis was carried out to identify a suitable LED reference spectrum for photometer calibration. The analysis was carried out using Monte Carlo simulation, analysing spectral errors for measurement of 1500 LED products with data of over 100 photometers and the LED illuminants as potential reference spectra. The results showed that an LED reference spectrum with correlated colour temperature (CCT) close to 4100 K would lead to the smallest spectral errors on average, when measuring LED products, daylight, fluorescent light and high pressure discharge lamps. Using this LED illuminant as the reference spectrum reduced spectral errors by a factor of two on average, as compared to using an incandescent source with Standard Illuminant A spectrum for calibration of the photometers. Use of two reference spectra was studied, but was discarded, as it did not considerably reduce the spectral errors and would have increased the complexity of calibrations.
LED standard lamps
CIE Session 2019 – Abstract Booklet
242

The project has developed new LED standard lamps for luminous intensity and luminous flux, using the analysed LED reference spectrum with CCT close to 4100 K as the basis for selecting the LEDs. The LED standard lamps for luminous intensity consist of a built-in thermoelectric controller (TEC) and can be driven with any high quality DC current source. The luminous intensity level obtained is approximately 250 cd, similar to OSRAM Wi41/G. Two types of luminous flux transfer standard lamps with E27 base have been developed. One of these lamps operates with 15-18 V DC voltage and includes a built-in precision current source and a TEC. The second lamp is aimed at test laboratories who focus on measurement of AC-operated lighting products, and consists of a stable constant power AC/DC-converter operating at 230 V AC-voltage. Both standard lamps produce over 800 lm of luminous flux. The developed LED standard lamps are used in photometric comparisons of luminous intensity and luminous flux with the project partners.
Unfiltered measurement of white LED illuminance
The luminous intensity comparison of the project is using, for the first time, a new measurement method, in which the illuminance of the LED standard lamp is measured using unfiltered photometers built using Hamamatsu silicon photodiodes and Predictable Quantum Efficient Detectors (PQEDs). The detectors are operated with precision apertures and nitrogen flow to prevent detector contamination. The photometric weighing is obtained numerically by precise spectral measurement of the LED standard lamp. This unfiltered measurement method is made possible by the naturally bandwidth-limited spectral emission of white LEDs. In the case of the PQED, the method enables measurement of the LED source directly with a primary standard of optical power. The method is aimed at NMIs for calibration of luminous intensity of LED standard lamps, and illuminance responsivity of V(λ)-filtered photometers, integrating sphere photometers and goniophotometers.
Fisheye camera method for integrating spheres
The project has developed a fast and reliable method for measuring the angular intensity distribution of light sources with a fisheye camera attached to a port of an integrating sphere. The method can also be used for determining spatial corrections in integrating sphere-based measurements of lighting products. The method has been validated in a large comparison with several different types of integrating sphere photometers and goniophotometers.
3. Conclusions
This project has been a unique opportunity, with its experienced partners and cooperation with CIE, to carry out scientific research on the new LED photometry, including new LED illuminants, LED standard lamps and novel measurement methods. Current results of the project show that, in the future, photometric calibrations can be carried out using LED standard lamps. The new calibration methods and reference lamp technology solve the potential issue of disappearing standard lamp types used in photometry, and at the same time provide several other advantages, such as improved stability, longer lifetime, robustness for transport and comparisons, as well as reduced spectral errors in measurements of not only LEDs, but other light types as well. The preliminary results of the two photometric comparisons, and experience gained with the new LED standard lamps and measurement methods will be presented in the conference.
CIE Session 2019 – Abstract Booklet
243

PP14 / PO083
IMPACT OF LUMINANCE DISTRIBUTION ON PERCEPTION OF THE SHAPE OF ARCHITECTURAL SPACES
Joelene Elliott1, Wendy Davis1 1 School of Architecture, Design and Planning, The University of Sydney, Sydney, AUSTRALIA
joelene.elliott@[email protected]
Abstract
1. Motivation
Visual perception can be significantly influenced by stimulus context and observers’ knowledge of the environment. In artistic fields, such as the theatre, light is commonly used to induce illusions. Theatrical lighting designers manipulate visual perception to transport audiences into vast landscapes, confined cities, isolated forests, etc. The contrast of light and dark enables items on a stage to be viewed accurately or misinterpreted; profiles and textures omitted or exposed. For example, brighter light and bluer colours are used to enhance the perception of depth on stage. These techniques are often consistent with naturally occurring depth cues, such as the effect of Rayleigh scattering when viewing distant objects. The designers that implement these techniques learn their craft through a process of observation.
Architectural lighting designers have similar practices. Lighting design handbooks expound illusory techniques, such as projecting light directly onto a ceiling to ensure that it is perceived to be as high as possible and illuminating walls to ensure that the space does not feel cave-like or enclosed.
Advances in lighting technologies provide the opportunity to re-think architectural lighting design practices and allow techniques currently based on folklore to be empirically investigated. Since observers are not immersed in the illuminated environments that they view in theatrical settings, it’s unclear whether these lighting design practices would similarly impact perception if applied to architectural spaces. This research investigates the applicability of theatrical lighting techniques that manipulate the perceived shape of a performance space to architectural spaces.
2. Methods
It was hypothesized that, when the ceiling and/or floor are the brightest surfaces within an architectural space, the space appears taller than it does with uniform illumination. It was further hypothesized that, when the walls are the brightest surfaces within an architectural space, the space appears wider than it does with uniform illumination.
Observers compared the appearance of a space when uniformly illuminated (reference condition), in which the mean luminance of each surface was 35 cd/m2, to five test conditions. In the most extreme test condition, each wall (vertical surface) had a luminance (45 cd/m2) 1.8 times higher than the floor and ceiling (25 cd/m2). At the opposite extreme, the ratio and luminances were reversed. Two intermediate conditions had luminance contrast ratios of the vertical and horizontal surfaces of 1.4:1 and 1:1.4. The fifth test condition was the same as the reference condition, with identical luminance on all surfaces.
In this experiment, participants viewed a cubic (3.2 m x 3.2 m x 3.2 m) space. One wall was omitted, to enable the participant and light to access the space. The interior walls were matte white and each surface was illuminated by one theatrical profile luminaire. Each lights was positioned and focused to enable the entirety of an individual surface to be illuminated. The luminaires were outside the observers’ field of view and did not cast shadows. This arrangement minimized visual cues about the shape and size of the space.
Each subject was seated at the middle of the opening of the room and initially exposed to three minutes of darkness. During each trial, one lighting condition was held constant for three seconds, immediately followed by a second lighting condition for three seconds. The lights were then turned off. Subjects reported their judgment for the trial and the sequence was repeated for subsequent trials. Each trial consisted of the reference lighting condition and one test lighting condition, in a random sequence.
A temporal two-alternative forced choice was used, in which participants were asked to indicate, “which appeared wider, the first condition or the second condition?” Each of the 10 subjects completed
CIE Session 2019 – Abstract Booklet
244

10 repeated trials for each test lighting condition. The test lighting conditions (including all repetitions) were presented in a random sequence.
Using the identical methods and conditions, an additional 10 participants completed a subsequent experiment, responding to a new question, “which appeared taller, the first condition or the second condition?”
3. Results
The subjects’ responses were consistent, but did not support the experimental hypotheses. Instead, the data show that luminance non-uniformities made spaces appear narrower and shorter, regardless of whether horizontal or vertical surfaces were brighter.
In the first experiment (on perceived room width), the reference condition (uniform luminance) appeared wider on 76%, 70%, and 50% of trials when the luminance ratios were 1.8:1 (and 1:1.8), 1.4:1 (and 1:1.4) and 1:1, respectively.
To better understand the meaning of the results, the second experiment (on perceived room height) was conducted with an additional 10 participants. Although these results are not as strong or consistent as the data from the first experiment, they lead to similar conclusions. When the floor and ceiling were 1.8 and 1.4 times brighter than the walls, the reference condition appeared taller on 76% and 78% trials, respectively. For the opposite conditions, when the walls were 1.8 and 1.4 times brighter than the floor and ceiling, the reference condition appeared taller on 59% and 67% of trials, respectively.
4. Conclusions
The experimental data suggests that luminance non-uniformities make spaces appear both narrower and shorter. These findings are not only inconsistent with illusory theatrical lighting design techniques, but raise a number of additional questions about how and why the spatial distribution of light impacts the appearance of the shape and size of architectural spaces. If these issues can be adequately understood, architectural lighting design practices could be developed to enable designers to more reliably shape occupants’ impressions of spaces, which could improve their experiences and potentially yield environmental benefits.
One limitation of the current study is that there were three vertical surfaces and only two horizontal surfaces. Therefore, the total room brightness was higher when the walls had higher luminance than when the floor and ceiling had higher luminance. To eliminate this confound, further experiments are underway with the wall directly in front of the observer blacked out and not illuminated.
CIE Session 2019 – Abstract Booklet
245

PP15 / PO088
PRELIMINARY RESEARCH ON MATHEMATIC MODEL OF EYE’S ADAPTATION LUMINANCE
Wang, Shuxiao1 1 China Academy of Building Research, Beijing, CHINA
Abstract
1. Motivation, specific objective
As a very important parameter for visual environment evaluation, glare is a hotspot and difficulty of this field. CIE recognizes the need for a comprehensive research program to develop a fundamental model of discomfort glare as its Top Priority Topics of research strategy. One drawback for current glare evaluation models is their faults that average environment (road surface) luminance is used as an indicator for visual adaptation, which means that luminance distribution and glare sources are not taken into account.
According to <Code for lighting> of CIBSE, visual adaptation is governed by the luminance of the various elements within the field of view, the sizes of the areas involved, and their location with respect to the lines of sight of observers. The adaptation luminance of the eye will play important role on glare evaluation. So it is really an urging task to carry out research on visual adaptation mechanism, which make us better understand the formation mechanism, and provide us technical supporting measures to glare evaluation.
2. Methods
According to related research, IpRGCs act as a photon counter in the same way than a light meter in a camera. This unique capability, not shared by other photoreceptors, could serve as a reference for the visual system to optimize light adaptation. And IpRGCs project to brain areas such as the suprachiasmatic nucleus (SCN) to mediate circadian photoentrainment or the olivary pretectal nucleus (OPN) to control pupil light responses. So in this research we will establish a facilities to simulate different luminance distribution with a diameter 2.4m LED semi-sphere screen, and monitor the pupil diameter with eye tracker.
3. Conclusions
A preliminary model will be developed on the basis of collected data.
CIE Session 2019 – Abstract Booklet
246

PP16 / PO084
EFFECT OF VISUAL DISTRACTION ON ANXIETY IN WOMEN DURING THE FIRST STAGE OF LABOR
Ge, K.1,2, Hao, L.X.1,2, Wang, T.Y.1,2 1 College of Architecture and Urban Planning, Tongji University, Shanghai, CHINA,
2 Key Laboratory of Ecology and Energy Saving Study of Dense Habitat (Tongji University), Ministry of Education, CHINA
Abstract
1. Motivation, specific objective
Labor pain may lead to emotional disorders, among which, anxiety is the most remarkable negative emotion that may possibly lengthen the stage of labor. In addition, anxiety may also contribute to a higher risk of emergency cesarean section. It is suggested in research that visual distraction can reduce the anxiety among children during dental treatment, and mitigate the anxiety of PET/CT patients during the uptake phase before imaging. However, the effect of visual distraction on the anxiety among women during labor has not been evaluated and remains largely unknown, which has aroused an interest in the use of integrating visual distraction into a maternity ward.
This study aimed to explore whether visual distraction could induce any measurable effect on alleviating the anxiety of women during the first stage of labor, which might have clinical significance. Besides, this study also focused on determining the most effective visual distraction (ambient lighting/ visual imagery / ambient lighting and visual imagery) on anxiety in women during the first stage of labor.
2. Methods
To achieve these aims, three experiments (interventions) were carried out. Experiment 1: Ambient lighting was used: Colored lighting (green/blue/red/yellow) was installed around the ceiling of the delivery room; Experiment 2: Visual imagery installation was used. It comprised a (55-in) television screen in front of the obstetric table and a (33-in) television screen above the obstetric table. The pictures (static/dynamic) presented on the television screens contained several nature scenes; Experiment 3: Ambient lighting and visual imagery installation were both used at the same time. A total of 27 women aged 25-38 years had participated into the current study. In this study, anxiety was measured by means of STAI and skin conductance. Meanwhile, light intensity, colors and the duration of dynamic images were also measured.
3. Results
The results indicated three things: (1) There was a significant reduction of anxiety after the use of visual distraction; (2) The decrease in anxiety was significantly larger in the cohort with ambient lighting and visual imagery intervention (experiment3). (3) There was not a significant reduction in skin conductance. (experiment 1,2,3).
4. Conclusions
Results of this study would provide evidence for the value of integrating visual distraction into a maternity ward, reducing the anxiety among women, creating a positive delivery experience and potentially reducing the costs of the hospitals.
CIE Session 2019 – Abstract Booklet
247
PP17 / PO087
DIFFERENCES OF LIGHT ENVIRONMENT EVALUATION BETWEEN ELDERLY AND YOUNG PEOPLE
Umemiya, N.1 and Quiao, W.1 1 Osaka City University, Osaka City, JAPAN
Abstract
1. Motivation, specific objective
This study compared light evaluation of brightness, glare, comfort, and preference of elderly and young people in Light and Dark conditions, using both Light-to-Dark and Dark-to-Light experimental sequences. Earlier studies revealed that elderly people are less sensitive to glare in some conditions, but some researchers have clarified that the sense of glare becomes stronger with age.
2. Methods
These experiments assessed 21 elderly people and 106 high school students. Of the elderly people (66–88 years old), 43% were men. Of the high school students, 61% were male and 44% was second-year of high school. Four fluorescent lamp instruments and four LED lamp instruments were set on the ceiling of the experimental room. Electric power for the lighting was set to 25% and 100%. The horizontal illuminance on the desk was 580 lux in the Dark condition and 2238 lux in the Light condition. Six persons (maximum) sat around the desk in the experimental room. They evaluated the light environment 10 min after entrance and evaluated it again 5 min after the illumination condition changed. Two sequences of experiments were used: Light-to-Dark and Dark-to-Light.
3. Results
3.1 Differences in light and dark condition evaluations
Differences of brightness evaluations between Light and Dark conditions were similar for elderly and young people (p<0.01%). Differences of glare evaluation between Light and Dark conditions were greater for young people (p<0.01%) than for elderly people (p=0.1%) for both Light-to-Dark and Dark-to-Light sequences. In Light-to-Dark sequence experiments, no difference was found in comfort or preference for young people. However, results show that the Light condition was more comfortable (p=2.4%) and preferable (p=2.4%) than the Dark condition for elderly people. In Dark-to-Light sequence experiments, evaluations by elderly people and young people of comfort and preference differ.
3.2 Differences in evaluation between Dark-to Light and Light-to Dark sequences
The Light condition of Dark-to-Light sequence experiments was brighter than the Light condition of Light-to-Dark sequence experiments for young people (p<0.01%). No difference was found between brightness evaluation of the Light condition of Dark-to-Light and Light-to-Dark sequence experiments for elderly people.
The Light condition of Dark-to-Light sequence experiments had stronger glare than the Light condition of Light-to-Dark sequence experiments for young people (p=4%). No difference was found between glare evaluation of Light condition of Dark-to-Light and Light-to-Dark sequence experiments for elderly people.
The Light condition in Light-to-Dark sequence experiments was more comfortable than the Light condition in Dark-to-Light sequence experiments for young people (p=16%). No difference was found between comfort evaluation of Light condition of Dark-to-Light and Light-to-Dark sequence experiments for elderly people.
3.3 Differences in evaluations made by elderly and young people
The Light condition of Light-to-Dark sequence experiments was brighter for elderly people than young people (p=7.9%). The Dark condition of Light-to-Dark sequence experiments was brighter for elderly people than for young people (p=4.4%).
CIE Session 2019 – Abstract Booklet
248
The Light condition of Dark-to-Light sequence experiments was darker for elderly people than for young people (p=2.9%).
No difference was found between elderly and young people in comfort evaluation of the Light condition in Light-to-Dark sequence experiments.
No difference was found between elderly and young people in comfort evaluation of the Light condition in Dark-to-Light sequence experiments.
The Dark condition in Light-to-Dark sequence experiments was more uncomfortable for elderly people than for young people (p=4.1%).
4. Conclusions
Light and Dark conditions were evaluated by 21 elderly people and 106 young people in terms of brightness, glare, comfort and preference using experiments with Dark-to-Light and Light-to-Dark sequences. Results were the following: 1) Differences in brightness evaluation between Light and Dark conditions were the same for elderly and young people. Young people evaluated the Light condition as brighter in the Dark-to-Light sequence experiment than the Light condition in the Light-to-Dark sequence experiment, although no difference in brightness was found between the two sequences by elderly people. 2) The difference in glare evaluation between Light and Dark conditions was smaller for elderly people than for young people, irrespective of the sequence of Dark-to-Light or Light-to-Dark. 3) The Light condition in Dark-to-Light experiments was evaluated as less comfortable and less preferable for young people, but as more comfortable and more preferable for elderly people. 4) The Light condition in Dark-to-Light experiments was evaluated as darker by young people than by elderly people. The Dark condition in Light-to-Dark experiments was evaluated as brighter by elderly people than by young people.
CIE Session 2019 – Abstract Booklet
249
PP18 / PO086
EFFECT OF INTENSITY OF SHORT-WAVELENGTH LIGHT ON SUBJECTIVE AND OBJECTIVE ALERTNESS
Lin, J., Westland, S. University of Leeds, Leeds, UNITED KINGDOM
Abstract
1. Motivation, specific objective
There is growing evidence that exposure to light in the evening and night-time, especially of short-wavelength (but not necessarily limited to short wavelengths), leads to an increase in alertness in humans. Previous studies have questionnaires to demonstrate an increase in subjective alertness and have also used more quantitative measures such as EEG. Some studies have also shown that exposure to light in the evening can inhibit the production of melatonin which otherwise would naturally build-up in the body during the late-evening hours. However, there is no consensus yet about the threshold of light intensity required to produce these effects. It is likely that the threshold will depend on the wavelength distribution of the light, how long the exposure is for, and the time of day that the exposure takes place; this may explain in part why it has so far proven difficult to measure the threshold. This work is concerned with measuring the threshold intensity of light needed to increase alertness and uses both subjective and objective methods. Specifically, the objective is to investigate the effect of intensity (40lx, 80lx and 160lx) of a blue light on human alertness during the evening.
2. Methods
Nine participants took part in a within-subject three-night study. For each of three non-consecutive nights, each subject was exposed to one of three intensities (40lx, 80lx and 160lx) of a blue light for 50 minutes, after being first conditioned in a dim white light for 20 minutes. The blue light had a maximum intensity of about 470nm and was approximately Gaussian with a half-width half-height of 35nm and was delivered through a set of luminaires mounted in the ceiling of a room with grey walls and carpets. The order of the intensities (40lx, 80lx and 160lx) was selected randomly for each of the participants. During each evening study EEG was continuously recorded over the 70 minutes (20 minutes for conditioning and 50 minutes for the blue light) and subjective sleepiness (which was assessed using the KSS questionnaire) was rated every 20 minutes. For the duration of the 50 minutes the participants were free to read a book that they brought with them.
3. Results
Power densities of EEG were recorded and averaged over time (using 10-minute integration periods). The results showed that an increase in average EEG beta (13-30Hz) power compared to the average measurement for the dim-white light condition and this increase was also dependent upon the time of the measurement with the increase getting larger for longer exposure times. Subjective alertness also increased under the blue-light condition and this increase also was time dependent for at least 40 minutes after first exposure to blue light. We also found an increase in average EEG beta (13-30Hz) and average high alpha (10-13Hz) power with the intensity of the light (160lx gave the largest readings).
4. Conclusions
These results provide some evidence that short-wavelength light exposure in the evening can increase human alertness and that this can occur relatively quickly (even though some other studies have suggestion that melatonin inhibition, for example, may have a longer time course). There was some evidence that the maximum effect was reached after approximately 40 minutes. The results also suggest that for the lighting conditions tested in the present study, light of higher intensity has a stronger alerting effect than light of lower intensity. These results, in themselves, do not enable a threshold effect to be identified. However, the methodology described in this study may provide a basis for future on-going work to address this question explicitly.
CIE Session 2019 – Abstract Booklet
250

PP19 / PO085
EXPERIMENTAL STUDY ON ILLUMINANCE DISTRIBUTION IN THE TASK AND BACKGROUND AREA OF OPEN-OFFICE LIGHTING
Kage, H.1, Yoshizawa, N.2, Tamura, H.2, Yonekura, Y.2, Harimoto, K.1, Yamaguchi, A.1, 1 Taisei Corporation, Tokyo, JAPAN, 2 Tokyo University of science, Tokyo, JAPAN
Abstract
1. Backgrounds and Purposes
Lighting control systems using human detection sensors are basically effective for saving energy consumption in open offices, however, illuminance level in ambient areas around task spaces is not strictly recommended in Japanese lighting standard, and their design methods are still far from established. Sometimes, when the illuminance level of ambient areas is kept low for energy-saving, occupants feel unsatisfied about the spatial brightness in the office, although the illuminance on their desks is kept at optimum level for work. On the other hand, if the illuminance in the ambient area is set to be too high, it could happen that energy use reduction would not be achieved at all.
The current European lighting standard (EN 12464-1:2011) represents the recommended levels of illumination on task, immediate surrounding and background areas. It would be necessary to take into account whether its recommended illuminances are also suitable for people from different cultural and historical backgrounds, before referring this standard to lighting design in the countries outside of Europe and making new international guideline for lighting control systems. In this paper, we will report the occupants’ evaluation on lighting environment where horizontal illuminances were closely set to the recommended values prescribed in EN 12464-1: 2011 at an open-office in Japan.
2. Experiment Methods
A subjective experiment was carried out at the office whose LED lightings on the ceiling are dimmable individually. The office space is about 18 meters in wide, 14 meters in depth and 2.8 meters in height, and equipped with small windows on the north-west side. Its interior layout is a general type for open offices with desks, chairs and cabinets, and there are low partitions and a PC monitor on each desk.
The LED lighting of 600mm square size were installed at intervals of 1.8 meters in the longitudinal direction and of 2.4 meters in the lateral direction. We divided the office space into three areas according to the European standards, task area (W: 1.8 × D: 2.4 [m]), immediate surrounding area (W: 5.4 × D: 7.2 [m]) and background area (W: 18 × D: 14 [m]).
The illuminance level of the task area was set to three levels of 300, 500, 700 lx. Several experimental conditions were set by setting the difference in illuminance among task area, the immediate surrounding area and the background area.
By the European standard, the recommended illumination value of each area at each horizontal illuminance are 750 / 500 / 167 lx, 500 / 300 / 100 lx, and 300 / 200 / 67 lx (task/immediate -surrounding/background). We tuned the LED lighting dimming ratio so that the illuminance conditions are close to the European standard. The average value of the representative desk top illuminance of the area were 680 / 550 / 140 lx, 490 / 340 / 100 lx, and 310 / 250 / 100 lx. The experiment was carried out at night time with blinds closed to eliminate the influence of the outside.
Twenty subjects, aged from 20 to 60, participated in the experiment. All subjects are usually doing their business operation in offices. The subjects evaluated the lighting environment by using magnitude estimation (ME) method and answering questionnaires. Spatial brightness of the experiment space was evaluated by ME method compared to the brightness level of the reference box, which was a 1/8 scale model of a general small room and illuminated at 300 lx on the desktop surface. A questionnaire consists of three parts of questions: 1) whether the brightness is appropriate for office working, 2) whether ununiformity and glare can be acceptable, 3) whether you are satisfied with the lighting environment. The subjects evaluated the lighting environment on seven-point scales.
CIE Session 2019 – Abstract Booklet
251

3. Results
We report the results of the case of illuminance value 490 / 340 / 100 lx (task/immediate-surrounding/background), one of the conditions close to the European standard.
For the question about whether the brightness is appropriate for office working, 65 percent subjects evaluated that the brightness is appropriate. For the question about visual comfort for reading business documents on paper and on PC monitor, 80 percent subjects evaluated that the brightness is appropriate. On the other hand, only 10 percent subjects evaluated that the whole spatial brightness is appropriate.
For the question about whether ununiformity and glare, 65 percent subjects evaluated that the ununiformity is unacceptable on the whole spatial brightness, and 70 percent subjects evaluated that the glare is acceptable on artificial lighting.
For the question about satisfaction with the lighting environment of whole space, 25 percent of the subjects evaluated as “satisfied” or “neutral”, and 75 percent of the subjects evaluated as “slightly dissatisfied” or “dissatisfied”.
4. Conclusions
The subjective evaluation of lighting environment was carried out which horizontal illuminances were closely set to the recommended values of EN 12464-1:2011 at an open-office in Japan.
In the case of illuminance value 490 / 340 / 100 lx (task/immediate-surrounding/background), the results of evaluation about the satisfaction and appropriateness for the whole space was low. On the other hand, the evaluation about visual comfort and brightness around the desktop surface were high. It was suggested that ununiformity is one of the factors for lowering the evaluation of whole space, as over half of subjects answered that the ununiformity was unacceptable.
CIE Session 2019 – Abstract Booklet
252

PP20 / PO024
ASSESSING THE PROPORTIONS AND CCT OF DIRECT AND INDIRECT LIGHTING IN A REAL LIT OFFICE
Lu, Y.1,2, Hou, D.1,2, Lin, Y.1,2 1 lnstitute for Electric Light Sources, Fudan University, Shanghai, CHINA
2 Engineering Research Center of Advanced Lighting Technology, Ministry of Education, Shanghai, CHINA
Abstract
1. Motivation, specific objective
There is ample evidence to support the hypothesis that indoor lighting environment affects human affective and cognitive processes. Researches have also shown that people tend to prefer lighting systems with indirect lighting components to systems providing just direct lighting and the ratio of direct/indirect lighting can modulate spacious perception. However, there is no study comprehensively investigating the impact of light distribution on both subjective perceptions and cognitive performance of humans and including the discussion of the distribution of correlated colour temperature (CCT) in an indoor lighting environment. This paper aims to explore how the proportions and CCT of direct/indirect lighting in office affect the subjective perception and work performance of people.
2. Methods
Two psychophysical experiments were conducted in a 3.2 x 3 m real lit office where six pendant fixtures were installed and the brightness and CCT of uplight/downlight could be controlled respectively. The first study changed the proportions of direct/indirect lighting (from 0% to 100%) and the second changed the CCT distribution of direct/indirect lighting (from 4000K to 6000K). In both studies, lighting parameters at the work plane were held constant for evaluation of work performance under the same condition. Observers were asked to assess the lighting environment from various perspectives using the categorical judgment method first, then to finish several visual cognitive tasks and evaluate the eye fatigue using Critical Fusion Frequency (CFF) and questionnaires.
3. Results
The results of this study showed that both the proportions and CCT of direct and indirect lighting have influence on the subjective evaluation and work performance. People’s perception of brightness, spaciousness, glare, uniformity, mood, preference etc. varies when light distribution changed especially the CCT distribution. As for the work performance, substantial improvements were observed in the indirect/direct condition in the areas of fatigue, alertness, and work performance while change the CCT distribution didn’t seem to help. Overall, direct lighting supplemented by indirect lighting with consistent CCT is superior to direct lighting in the office.
4. Conclusions
The present study demonstrated ambient light in an indoor environment can significantly influence perception and cognitive performance. A main effect of the uplight/downlight colorimetric and photometric distributions was revealed and several recommendations for the office lighting design were provided with the purpose of improving workers’ satisfaction and work efficiency based on our results.
CIE Session 2019 – Abstract Booklet
253
Session PS3 Presented Posters (D4/D6)
Monday, June 17, 15:35–16:30
CIE Session 2019 – Abstract Booklet
254

PP21 / PO089
LIGHTING REQUIREMENTS FOR ADAPTIVE DRIVING BEAN (ADB) TO IMPROVE TARGET VISIBILITY WHEN ONCOMING HEADLIGHT GLARE EXISTS
Akashi, Y.1, Miyazaki, T.1, Maeda, H.1, Shibata, Y.2, Ishida H.2 1 University of Fukui, Fukui, JAPAN, 2 Koito Manufacturing Co., LTD., Shizuoka, JAPAN
Abstract
1. Motivation, specific objective
Driving is a demanding multitasking activity. A driver has to maintain a vehicle within a traffic lane while keeping its speed below the regulation speed and following other vehicles. Additionally, the driver must quickly detect oncoming traffic and obstacles on the roadways to avoid collisions with potential hazards. Oncoming vehicles’ headlamps often cause disability glare in nighttime drives. Such disability glare reduces luminance contrasts of targets against the background, resulting in reduced target visibility. Unfortunately, many traffic accidents under such conditions have occured in the world.
Adaptive driving beam (ADB) headlamps have recently been developed to prevent drivers from meeting with the above described traffic accidents. An ADB system consists of an array of LEDs so as to change its luminous intensity distribution by turning on/off and dimming each of the arrayed LEDs. When a car-mounted camera detects a potential hazard on a roadway, a few of the arrayed LEDs, assigned for where the potential hazard is located, are turned on and aim at the target locally while minimizing glare to preceding and oncoming traffic. By illuminating a local area with the ADB system it is possible to not only increase illuminance on the target but also increase the luminance contrast of the target against the background. However, it is unclear how much light is needed for drivers to detect the target with the aid of ADBs.
The objective of this study was to identify lighting requirements for ADB systems to improve off-axis target visibility when oncoming headlight glare exists in nighttime roadways. This study conducted target detection tests with a simulated ADB system in a laboratory by measuring subjects’ target detection rates and reaction times.
2. Methods
This study used an experimental setup to simulate a nighttime driving context in which a driver conducts a tracking task in the foveal vision and a target detection task in the peripheral vision simultaneously. The experimental setup consisted of a black partition (reflectance: 7%), a tracking task apparatus, a peripheral target, two pairs of oncoming headlamps, a manual switch for subjects to signal target detection, a lighting fixture and a personal computer to present peripheral targets and record subjects’ responses. The tracking task apparatus was an LED numerical signboard consisting of seven LED segments. The LED signboard was used to present one of one-digit numbers from zero to nine and changed the number every two-five seconds in random order. The lighting fixture was used to illuminate the black partition so that the background luminance can be 0.2 cd/m2. The foveal tracking task was for an observer to read aloud the number when the number changed.
In the nighttime driving context employed in this experiment, a driver is supposed to manitain a car within a lane while two cars in the opponent lane approach to the driver’s car. The headlamps of the two cars cause disability glare, produing a light veil in the driver’s visual field. The first car is located at a distance of 14.4 m from the driver’s car, so the headlamps of the car can be seen by the observer at eccentricity angles of 9.1 deg and 14.4 deg. The second car is located at a distance of 109.4 m away, so the headlamps of the car can be seen at eccentricity angles of 1.2 deg and 1.9 deg. In the experiment, an LED spot light, mimicking one of the above described arrayed LEDs in an ADB system, provides a one-degree light beam which projected a bright spot on the black partition as a peripheral target. The target simulated a pedestrian, who stood beside oncoming vehicle’s headlamps.
The independent variables of the experiment were target position, target luminance contrast and oncoming headlight operation pattern. The levels of the target position were 2.4, 3.9 and 5.0 degrees from the center of the visual field. For each of the target locations, seven levels of luminance contrasts were selected so that the threshold (50-percentile) luminance contrasts can be determined based on the experimental data. There were four operation patterns for the two sets of oncoming headlamps,
CIE Session 2019 – Abstract Booklet
255
i.e., both-on, both-off, only-first-on and only-second-on. There were 84 experimental conditions in total. Each experimental condition was presented seven times. It took a subject about six hours to complete evaluating all the experimental conditions. The experiment was conducted for each subject in three days to minimize the subject’s fatigue. In the experiment, twelve subjects (22-24 years old) participated.
3. Results
From the experimental data, a threhold (50-percentile) luminance contrast needed for the subjects to detect targets was determined for each of the eccentricity angles for each of the four oncoming headlight operation patterns. For instance, when both the headlamps are turned on, the threshold luminance contrasts were 1.1, 0.14 and 0.15 for the target eccentricity angles of 2.4, 3.9 and 5.0 degrees respectively. The result suggested that as the target becomes closer to one of the oncoming headlamps, luminance contrast needed for the target to be detected becomes higher. Based on those data, lighting (i.e., luminous intensity) requirements for ADB systems were calculated. The calculation result suggested that it was not difficult for automobile lighting manufacturers to develop ADB systems, meeting the lighting requiremnts, by using the current LED technology. Statistical analyses applied for the experimental data showed that ADB meeting the lighting requirements could significantly improve peripheral target visibility even when oncoming headligh glare exists.
The experimental results were compared to existing findings on the relationship between target visibility and visual components (i.e., target size, target luminance contrast, and background luminance). The comparison suggested that the experimental results were consistent to these existing findings.
4. Conclusions
The above described experimental results proved that ADB systems, which can illuminate only targets locally and therefore increase the luminance contrasts of the targets, are more efficient lighting methods than conventional forward lighting systems which illuminate the entire visual field to increase drivers’ adaptation luminance levels. Based on the experimental data, we proposed lighting requirements for ADB to improve target visibility when oncoming headlight glare.
CIE Session 2019 – Abstract Booklet
256

PP22 / PO091
MEASUREMENT OF OBTRUSIVE LIGHTING OF OUTDOOR LIGHTING INSTALLATIONS
Dubnicka, R.1, Lipnicky, L.1, Gasparovsky, D.1 1 Department of Electrical Power Engineering, Faculty of Electrical Engineering and Information
Technology, Slovak University of Technology, Bratislava, SLOVAKIA
Abstract
1. Motivation, specific objective
Outdoor lighting systems excluding road lighting and public lighting e.g. LED screens, sports lighting systems, lighting systems of parking zones and industrial zones, illumination of buildings, decorative lighting of buildings etc. are a potential sources of obtrusive lighting. Light emerging from luminous areas of these installations have sometimes significant impact to the surrounding environment. The maximum permissible limits of photometric parameters from the outdoor lighting systems depend on the environmental zones defined by standards and CIE recommendation where lighting systems are installed. The values of limits luminances, illuminances levels or TI values are defined in the national standards and CIE documents treating obtrusive lighting. In some countries are these limits implemented in the law to minimize obtrusive lighting in outdoor environment. Practically operation of outdoor lighting installations often does not meet the standards or recommendation requirements. Too high luminance from these sources can cause visual discomfort mainly to the car drivers, to pedestrians or even more habitants in ambient residential buildings by intrusive lighting. Therefore, in practice it is needed to control of measure obtrusive lighting by means of on-site or laboratory photometric measurements in respect of particular outdoor lighting installation and environment where lighting installation is situated.
2. Methods
This paper deals with recommendation of on-site or laboratory photometric measurement methods to control measure of obtrusive lighting from real installed outdoor lighting systems by means of photometric devices i.e. luminance meters, illuminance meters and image luminance meters according to limits prescribed by standards and CIE document.
3. Results
Based on the measurement methods in the paper is described recommended procedure of measurement of various outdoor lighting installations as a potential source of obtrusive lighting for particular situations. Calculation of photometric quantities based on laboratory photometric measurement of selected LED screens was compared with measured values to validate method of on-site measurement. The presentation will show
measurement of photometric quantities of particular outdoor lighting installations in respect of limits prescribed in present documents treating obtrusive lighting,
comparison between lighting calculation at design state and on-site measured values of outdoor installations
recommended procedure for inspection of obtrusive lighting from particular outdoor installations
4. Conclusions
Potential obtrusive lighting from outdoor lighting installation should be controlled in some way. Therefore, in the paper is presented possibilities of on-site photometric measurement with recommended procedure how to control obtrusive lighting of particular outdoor lighting installations according to requirements present standards and documents. Furthermore it is described two possibilities how to assess limits in which can be particular case of LED screen operated. The laboratory measurement is shown as possible way how to simplify measurements to avoid outdoor environment for estimate of measure of obtrusive lighting from the screen. Comparison between calculated photometric quantities based on results of laboratory measurements and on-site photometric measurements is provided.
CIE Session 2019 – Abstract Booklet
257

PP23 / PO094
TOWARDS AN OPTIMIZATION OF URBAN LIGHTING THROUGH A COMBINED APPROACH OF LIGHTING AND ROAD BUILDING ACTIVITIES
Muzet, V.1, Colomb, M.2, Toinette, M.2, Gandon-Leger, P.3, Christory, J.P.4 1 Cerema, Equipe projet ENDSUM, Strasbourg, FRANCE,
2 Cerema, Clermont-Ferrand, FRANCE, 3 AFE, Roissy, FRANCE,
4 Consultant, Rambouillet, FRANCE
Abstract
1. Motivation, specific objective
Road lighting installations are designed by calculating the performance in terms of luminance distribution as defined in the EN13201 standard. Since the photometric characteristics of the pavements are generally not measured, a standard r-table as defined in CIE144 is often used for lighting design.
These "standard" r-tables used for lighting design are more than 70 years old and several studies have shown that these tables are no longer representative of actual pavements. Their use can generate important errors (more than 30%) for the average luminance.
This failure to take into account the characteristics of pavements characteristics may be due to the partitioning of professions between coatings and lighting manufacturers who are not accustomed to work together. In addition, the life cycles of coatings and lighting installations are very different, which probably also explains the little interaction between the two professions.
However, technologies have evolved, both in terms of pavements and lighting solutions. This offers new opportunities, concerning the optimization of lighting design and the possibilities of retrofitting.
Nowadays, most of the lighting is urban and yet the standard EN13201 observation angle is 1° corresponding to a distance around 86m, which makes no sense for city driving where speeds are generally around 30 and 50km/h.
The objective of this work is to develop tools and methods for managers, lighting designers and road builders to optimize lighting both in interurban and urban areas. The goal is a complete characterization of the photometry of a large pavement sample panel, according to the criteria usually used in lighting such as Q0 and S1 and a characterization with an observation angle more adapted to the urban environment.
2. Methods
To this purpose, a working group propose a global approach that is both technical and didactic for experts and non-specialists of lighting design. This group, known as “Revêtements et Lumière“ for “Pavement builders and lighting designers”, brings together research laboratories, lighting engineers, road and urban paving builders and administrators.
The first step was to establish a panel of urban and interurban surfacings that countains representative and innovative French technologies. This panel includes 35 different pavements:
- road surfaces with bituminous, synthetic or cement binder,
- more or less clear aggregates,
- raw pavements or pavements with initial surface treatment (sandblasted, brommed,...),
- different types of paving blocks.
These samples were characterized in new condition by both colorimetric and 1° photometric measurements with the Cerema’s goniophotometer. Lighting calculations assess the impact of the actual use of the characteristics of these surfaces. A second series of measurements will be carried out after 3 years of natural outdoor ageing.
CIE Session 2019 – Abstract Booklet
258

Finally, a 10° characterization will be carried out in new and aged condition. Indeed, 10° corresponds to an observation distance of 8.5m, which could be relevant in an urban environment for drivers when they are close to intersections, cyclists and pedestrians. An adaptation of the lighting design will also be proposed, taking into account this new geometry.
3. Results
The first measurements done on new pavement samples show a high variability in the photometric characteristics of the pavements. In particular, the impact of surface processing on initial photometry is very significant. The use of innovative clear pavements with an initial treatment allows substantial stability and energy savings from the outset.
The samples are now exposed to the outdoors elements for ageing.
The surface catalogue will be presented in the form of files for managers and lighting designers and road builders. A first model of the file is proposed.
4. Conclusions
The database and the results of the analysis show:
- the real properties of current and innovative road materials and their important variability,
- confirm that the CIE standard tables are not representative of actual French pavements,
- the contribution of the use of specific pavements to achieve energy savings.
With the constitution of a measurement database of actual pavements and the proposal of new lighting designed adapted to different uses in urban environment, this project will contribute to the CIE TC 4.50 (Road surface characterization for lighting applications) and the Empir SURFACE project (16NRM02 Surface pavement surface characterization for smart and efficient road lighting).
CIE Session 2019 – Abstract Booklet
259

PP24 / PO096
IMPACT OF THE SPECTRUM OF LIGHT ON VISIBILITY IN ROAD TUNNELS
Talon, D.1, Dumortier D.1, Besson S.2, Manuguerra T. 2 1 University of Lyon, ENTPE, Lyon, FRANCE, 2 CETU, Bron, FRANCE
Abstract
1. Motivation, specific objective
LEDs will progressively replace the High Pressure Sodium (HPS) light sources used in tunnels. Going from HPS to LED technology means accessing a wide range of spectra, quite different from the one of HPS light sources. White LEDs come at different colour temperatures which means different spectra. Color LEDs can be mixed to produce almost any spectrum specifically designed to address the drivers’ photoreceptors: the cones, the rods and/or the intrinsically photosensitive Retinal Ganglion Cells (ipRGCs). Exciting ipRGCs could affect visibility since they have been shown to impact pupil diameter.
For the time being, tunnel lighting design is only based on photopic luminance levels and it is not known whether the change of spectrum at the same photopic luminance level, affects drivers’ visibility. If this were the case, this means that recommended luminance levels should vary with the spectral content of the source. This also means that more energy could be saved by selecting LED sources with a spectral content providing the same visibility at luminance levels lower than the recommended ones.
This study aims to find out (1) whether the change of spectrum due to the switch from HPS to LED technology impacts drivers’ visibility in their central vision (for this, we compare visibility under three spectra “typical” to HPS and to white LED at 3000K and 5000K), (2) whether exciting ipRGCs impacts visibility (for this, we compare visibility between each of the three “typical” spectra and a metameric one exciting the ipRGCs). All spectra are designed to provide the same photopic luminance level.
2. Methods
This study relies on a psychovisual experiment run under controlled conditions in laboratory using a 1:20-scale model of a tunnel. A screen showing simulated scenes could not be used since the spectra had to be real ones. The scale model is representative of a 100 m long section of a two-way 10 m wide, 5 m height road tunnel. It is fitted with 2 rows of 12 LED chips on board (COB) acting as luminaires (one every 8 m in the real tunnel). Each COB includes 7 different chips individually controlled to create a wide range of spectra. For future use, surfaces of the model (road or sidewalls) could be removed to reflect changes in reflectance. For this study, the road has a 9% reflectance, the sidewalls have a 43% reflectance over half of their height and a 6% reflectance over the other half. A 1 cm by 1 cm target with a reflectance of 25% is positioned in the middle of the road at 4 m of the scale model entrance; this is equivalent to a real target of 0.2 m by 0.2 m located at a distance of 80 m (stopping distance for a speed limit of 90 km/h on a dry road surface and with a reaction time of the driver of 1 s).
As mentioned in section 1, 6 spectra are used: 3 are “typical” of HPS and white LEDs at 3000K and 5000K, 3 are metameric of the others (same colour temperature and same colour rendering index) while doubling the energy content around 490 nm to stimulate ipRGCs. All spectra result in a photopic luminance of 4 cd/m² on the road surface right in front of the target. A specific optimization program was developed under Matlab to produce these spectra from the 7 chips of the LED COB. 7 DMX LED drivers control independently the 7 LEDs of the 24 COBs.
Around 40 observers with age ranging from 20 to 30 (50% male, 50% female) will be recruited for the experiment. The procedure will consist in a pairwise comparison of the 6 spectra based on target visibility. Each observer will be comfortably seated, his (her) head at the entrance of the scale model, positioned on a chinrest adjusted so that his (her) eyes be at an equivalent height of 1.50 m above the road surface (7.5 cm for the model). For each pair of stimuli (spectra), they will have to indicate under which stimulus the target will appear the most visible. The first stimulus will be presented for 5 seconds, followed by 1 second of dark, then the second stimulus will be presented for 5 seconds. The observers will be able to have as many looks at the pair as they wish, the pair will be presented using
CIE Session 2019 – Abstract Booklet
260

the same order and timing. The time taken to provide the final judgement and the number of looks will be recorded. A visibility score will be associated to each spectrum, it will gain 1 point when it will be preferred to another spectrum and it will lose 1 point if not. Spectra will be ranked according to their visibility score.
36 pairs of spectra will be judged by the observers. Since they are 6 spectra, this means that we will include pairs with the same spectrum and that two spectra will be compared twice in different presentation orders (S1 first then S1 second). These specific pairs will be used to check the consistency of the answers provided by the observers and identify experimental biases. The answers provided for pairs presenting twice the same spectrum will be compiled and compared to the theory which states that 50% of the observers would prefer this spectrum when presented first and 50% when presented second. If the results do not agree with this, it will imply that the experiment is biased. The answers provided by the pairs presenting two spectra in reverse order will be used to check the consistency of the answers provided by each observer. Answers from the observers which will have a low consistency rate will not be used in ranking spectra. This may be observers who didn’t understand the instructions or who answered randomly.
3. Results
The scale model is ready to be used, the experiment will be conducted in January 2019, the analysis will follow and results will be ready to be included in the conference article.
4. Conclusions
The conclusions will depend on the results of the experiment.
CIE Session 2019 – Abstract Booklet
261

PP25 / PO093
ENERGY EFFECTIVE OUTDOOR LIGHTING FOR VISUALLY IMPAIRED PEDESTRIANS
Pimkamol Mattsson1, Maria Johansson1, Thorbjörn Laike1, Agneta Ståhl2, Mai Almén3, Elizabeth Marcheschi4
1 Dept. of Architecture, Lund University, Lund, SWEDEN, 2 Dept. of Traffic and Roads, Lund University, Lund, SWEDEN, 3 Hinderfri Design AB, Lund, SWEDEN, 4 Dept. of Work Science, Business Economics and Environmental Psychology, The Swedish University of Agricultural Sciences,
SWEDEN
Abstract
1. Motivation, specific objective
As a form of mobility assistance, outdoor lighting should support pedestrians during the hours of darkness. This is particularly relevant to places where daylight is limited during the winter season. Today there is a transition to energy efficient lighting - LED for outdoor applications but still little is known about its impact on pedestrians.
The present study aimed to obtain a better understanding about how visually impaired pedestrians perceive LED-lighting and whether it is considered to support their accessibility and safety in urban environments.
2. Methods
The empirical study was designed as an intervention study and was carried out after sunset in a residential quarter in a southernmost city in Sweden with about 340,000 inhabitants. The outdoor lighting in the area had been designed for different groups of road users. Fifteen participants with different types of visual impairments walked a predetermined route of approx. 500 meters before and after the intervention. The route could be divided into 5 parts according to differences in physical characteristics and lighting features.
The first data collection was conducted with the existing lighting along the route, which mostly was equipped with high pressure sodium-vapor (HPS) lamps (80 watt, CCT of 1,900 kelvin, Ra of 8.4). The second part of the route was a 60 meter-bike/walking path equipped with 4 LED lamps (60 watt, CCT of 3000, kelvin, Ra of 75).
In the intervention, all HPS lamps were replaced by LED ones (83 watt, CCT of 3,000 kelvin, Ra of 84), except along the last 120 meter of the route (part five) where the original 3 HPS lamps were kept as a reference. Three LED lamps was added to part one as it had been perceived to be insufficient lit. The original LED lamps along the bike/walking path, part two were kept but with a small adjustment of the pole’ height.
Data were collected by a validated protocol which included walk-along observations of walking behaviours and structured interviews about perceived lighting quality, accessibility and safety in the environment.
3. Results
Wilcoxon signed ranks test showed that the participants' perceptions of the lighting quality between before and after the intervention differed. The Perceived Strength Quality (PSQ) was rated significantly higher along part one where LED lamps had been added (Z = -2.60, p < 0.01) and those parts where the original lamps were replaced by the new ones (Z = -2.81, p < 0.01). Perceived comfort quality (PCQ) of lighting was rated higher after the intervention but the differences were not significant. It was only part five where the original lighting has been kept that PCQ was rated significantly higher after the intervention (Z = -1.97, p < 0.05). Furthermore, the participants perceived that after the intervention the lighting was significantly more evenly distributed and that they could see better along the route except for part five with the original lighting. Here the participants reported that they could see better before the intervention; the difference was significant (Z = 2.21, p < 0.05).
The observations revealed that overall accessibility for the entire route increased after the lighting intervention; McNemar’s test showed that the participants’ opportunities to orient themselves and
CIE Session 2019 – Abstract Booklet
262

detect details in the walking environment increased from 47.60% to 52% (p < 0.001). In particular, accessibility increased significantly from 44.50% to 50.70% (p < 0.001) for the parts where the original lamps were replaced by the LEDs. Further, it was found that opportunities to detect buildings and basement entrances significantly increased from 47.4% to 68.8% (p <0.001) and 32.1% to 60.7% (p <0.01) respectively. Also, the detection of bicycle parking nearby the building entrances increased from 46.8% to 64.3% (p <0.001). There was no significant difference in the detection of details in the walking environment such as sign and/or lamp posts, trash bins, driveways, white line and different pavement materials.
The participants also reported that after the intervention, it was quite easy to walk along the route, except along the last part. To detect a white line on the walkway was easiest compared to other objects i.e. lamp and/or sign posts and cobblestones. Eight participants (about 57%) responded that they would walk the entire route alone and would not particularly want to avoid it; this number increased from 6 participants (about 40%) as the responses before the intervention.
4. Conclusions
The results showed that lighting quality from different types of outdoor lighting was perceived differently by a group of visually impaired pedestrians and this could affect their accessibility in urban environment. In this study LED-lighting was perceived as having better strength quality and to be perceived as more evenly distributed. The participants also perceived that they could see better in the new lighting Overall, accessibility observed for the entire route was also found to increase. This result is in line with the interview responses to some extent.
Taken together, the results suggest that LED-lighting hold a great potential to support accessibility in urban environment for visually impaired pedestrians. However, questions remain about perceived comfort quality and also how the lighting support opportunities to detect details in the walking environment that could be important for a safe walk. Thus, further improvements should be made since it is important that outdoor lighting supports equal opportunity in accessibility as well as mobility for all users in the environment.
CIE Session 2019 – Abstract Booklet
263

PP26 / PO092
IMPACT OF ROADWAY LIGHTING ON DRIVER BEHAVIOR AT FREEWAY RAMP LOCATIONS
Eric Li1, Ron Gibbons1, Alejandra Medina1 1 Virginia Tech Transportation Institute, Blacksburg, USA
Abstract
1. Motivation, specific objective
Nighttime safety has long been an important concern for the traveling public. Adding roadway lighting has been widely used as a countermeasure for nighttime crashes. However, partly due to a lack of comprehensive understanding of lighting effects on safety and driver behavior, roadway lighting practices for freeways and intersections vary significantly among state and local transportation agencies in the United States. Some agencies provide lighting on most urban freeways for safety benefits, while some others do not own and maintain any lighting on freeways concerning about their costs and energy consumption.
2. Methods
This project used the Second Strategic Highway Research Program (SHRP 2) Naturalistic Driving Study (NDS) data and the VTTI field lighting performance data to investigate how different roadway lighting characteristics affected driver behavior at freeway mainline ramp locations. Based on the NDS time series data, the research team analyzed the correlations between 10 driver behavior variables and 5 roadway lighting variables. The driver behavior variables included:
Speed in miles per hour relative to speed limit (ΔV) including mean (ΔV-μ) and standard deviation (ΔV-σ);
Longitudinal (along) acceleration including mean (along-μ) and standard deviation (along-σ);
Lane offset from center (Loff) including mean (Loff-μ) and standard deviation (Loff-σ) (used only for freeway analysis);
Lateral acceleration rate (alat) including mean (alat-μ), absolute mean lateral acceleration (alat-μAbs), and standard deviation (alat-σ); and
Mean time-to-collision (TTC) (used only for freeway analysis).
The lighting variables included:
Right-lane horizontal illuminance (Eright), which is the mean horizontal illuminance in lux calculated based on measurements taken within the rightmost lane for a specific analysis area.
Overall horizontal illuminance (Eall), which is the mean horizontal illuminance in lux for all lanes calculated based on measurements collected in all lanes for a specific analysis segment.
Right-lane uniformity (Uright), which is the lighting uniformity for the right lane at a specific analysis area.
Overall uniformity (Uall), which is the lighting uniformity for all lanes at a specific analysis segment.
Right lane to overall illuminance ratio (Eright/Eall), calculated as the right lane illuminance divided by the overall illuminance for the same analysis segment.
The analysis used data from 11,558 NDS trips at 298 ramp locations on major freeways in Washington and North Carolina. To examine the potential correlations in detail, the research team considered a large number of scenarios defined by variables such as ramp type, driver age, traffic type, and analysis segment. The research team used both multiple regression and Generalized Linear Model (GLM) regression to mitigate challenges associated with the large number of modelling scenarios and independent/explanatory variables with categorical, discontinuous, or continuous outcomes.
CIE Session 2019 – Abstract Booklet
264

3. Results
In general, roadway lighting characteristics exhibited significant correlations with safety-relevant driver behavior, indicating potential impacts of roadway lighting on safety and driver workload during nighttime. However, the scale of the correlations seemed to be relatively small and their practical implications may be debatable. The following summarizes the major findings:
Among the various safety surrogate variables, roadway lighting had more significant correlations with lateral acceleration mean and variance, followed by longitudinal acceleration mean and variance. These significant correlations suggest that roadway lighting characteristics tend to affect the lane-changing (i.e., when and how fast drivers change lanes) and acceleration behavior of drivers more than their selection of speeds. The fact that lighting had significant correlations with longitudinal accelerations but less significant correlations with speeds seemed to indicate that roadway lighting affected the number of short accelerating/decelerating actions of drivers that did not result in significant speed changes. This could be an indicator of significantly changed driving workload during nighttime attributable to roadway lighting.
Models for freeway segments at exit ramps were more likely to have a higher R2 value and to contain significant lighting variables. For exit ramp locations, it seemed that models for diverging traffic in general had higher R2 values and more significant lighting variables compared to those for through traffic.
Models for older drivers as a separate group tended to have higher R2 values but fewer significant lighting variables compared to models for all drivers. This suggests that the driver behavior of older drivers was more significantly correlated with roadway-related variables. A potential explanation was that older drivers drive more cautiously during nighttime and therefore differences in roadway lighting may not significantly affect their speeds and accelerations. Note that the correlation analysis based on time series data did not look at driver workload. Models for older drivers also contained a smaller sample size and more homogeneous driver population, which may have contributed to the higher R2 values.
In a number of cases, the correlation analysis results showed correlations for older drivers opposite those for all drivers. This observation suggests that lighting could have different influences for older drivers than for younger drivers.
The results suggest that higher right lane illuminance particularly benefits merging traffic, including older drivers at entrance ramp locations. Higher overall illuminance could likely yield more safety benefits at exit ramp locations. Better overall uniformity, however, seemingly had mixed effects for different scenarios.
4. Conclusions
The findings of this study indicated statistically significant correlations between driver behavior (including visual behavior) and lighting characteristics at freeway mainline ramp locations. However, the scale of the correlations seemed to be relatively small and their practical implications may be debatable. These findings may help safety engineers to better understand how safety may be affected by roadway lighting at freeway mainline ramp locations. They also demonstrate the potential for using different roadway lighting characteristics to guide driver behavior towards improved safety.
CIE Session 2019 – Abstract Booklet
265
PP27 / PO097
ANALYSIS AND DESIGN APPROACH FOR A NOCTURNAL IMAGE OF THE CULTURAL LANDSCAPE
Valetti, L.1, Pellegrino, A.1 1 Politecnico di Torino, Department of Energy “Galileo Ferraris”, Torino, ITALY
Abstract
1. Motivation, specific objective
This paper reports the results of a research project aimed at critically analyse the nocturnal image of territorial contexts with variable morphological characters, consisting of widespread settlements and architectural assets and at show the possibility of developing a design approach.
The current debate and heritage policies has been focused on an inclusive definition of cultural landscape, for which it has been proposed active enhancement practices and local planning tools that are also dedicated to the study of scenic-perceptive components and visual values. However, the current indications are limited to the definition of day images of sites, and are not based on investigations of the corresponding nocturnal images.
From a preliminary study of the current condition in Italy emerges that today the criteria for the lighting project of widespread settlements and cultural heritage depends especially on functional requirements or is associated with architectural lighting project of single monuments and buildings. A culture of the light aimed to guarantee the enhancement of the nocturnal image of the cultural landscape as a system is missing.
2. Methods
The paper proposes a critical analysis of the nocturnal image of territories characterized by widespread settlements, considering points of observations external to the settlement and visual relations. The current image of the sites and the visual impact, as determined through the artificial lighting conditions, has been identified as the central elements of investigation.
A methodology, consisting of two phases, was applied: a subjective comparison between day and night images and an objective measurement survey of luminance distribution, which was aimed at identifying luminance ratios and contrasts corresponding to certain defined visual effects.
The first phase was aimed at the collection of qualitative data. Photographic investigations were carried out in order to investigate the image of some representative case studies of recurrent territorial situations. The survey was conducted by comparing day and night photographs taken from analogous observation points, located along the main road and tourist routes in the territory, in order to connect the study to strategies for the enhancement and promotion of the territory.
The second phase consisted on an in situ measurement campaign that was carried out in order to obtain quantitative data on the nocturnal lighting condition. The analysis was conducted through a luminance measurement campaign: pictures, taken with a videophotometer from representative points of view along the main roads, were elaborated in order to analyse the luminance distribution of the considered area. Luminance ratios and contrasts between the different parts of the perceived image of the cultural landscape were calculated and used to compare data on different sites and to develop critical considerations useful to define the subsequent design approach.
The analysis phase was applied to an Italian case study. An area was chosen within the UNESCO site “Vineyard Landscape of Langhe-Roero and Monferrato” (Piedmont Region). The area presents interesting characters both from the point of view of the recurrent morphology of the settlements, mainly characterized by a circumscribed village in a prominent position, and for the value of the surrounding landscape context.
3. Results
The comparison between day and night photographs and the analysis of the objective data made it possible to draw up some critical considerations.
CIE Session 2019 – Abstract Booklet
266

In most cases, the absence of a strategy that is able to connect the settlements and the landscape in a coordinate system is evident. The consequence is the lack of an overall perception of the settlements and of the context, where at night only some elements, considered to be the most significant, are highlighted. The luminance data show the absence of a balanced luminance distribution among the parts that compose the image of the cultural landscape: often excessive and annoying contrasts were detected. Also a random heterogeneity in the use of light sources characterised by different colour temperatures emerged. Moreover in many of the analysed cases, it was possible to observe that the ambient lighting of a settlement was not the result of a designed lighting, but the effect of the diffusion of a light beam from street lighting. Assuming that the current plants are being replaced with LED systems, a substantial change in the nocturnal perception of the environment can be predicted.
From the analysis, it emerges that, in most cases, there is a general lack of attention to the nocturnal design of the image of the cultural landscape. Obviously, it would be impossible to illuminate all the elements of the territory; however, innovative strategies could be directed towards creating lighting scenarios, based on the definition of a specific nocturnal image.
4. Conclusions
The results support the hypothesis that a new approach to the lighting of these territorial contexts is necessary. It is now required to identify valorisation strategies that consider all the hours of life of goods, and which also pay attention to the nocturnal perception of the cultural landscape. According to this point of view, artificial light could be set up as one of the instruments of a valorisation project, and it could supply a significant contribution by facilitating the use of a site and defining its nocturnal image, with positive effects on the promotion of the territory and on touristic visibility.
The final aim of the research is to underline the importance of the study of the nocturnal image and to present a preparatory analysis methodology for the drawing up of design guidelines for landscape contexts in which a widespread patrimony is present. The methodology we are currently setting up is intended to combine perceptive requirements with performance requirements. In this way, it is hoped to encourage the development of strategies that will overcome the perception connected to municipality boundaries to arrive at a more articulated and coordinated extra-municipality view, shared by several subjects and connected to the valorisation circuits of the cultural landscape. This in fact does not mean more lighting, but rather lighting in a more informed, sustainable and coherent manner in order to guarantee the correct use of the widespread patrimony and not of single monuments.
CIE Session 2019 – Abstract Booklet
267

PP28 / PO095
THE VEILING LUMINANCE IN TUNNEL LIGHTING INSTALLATIONS
Rossi, G., Iacomussi, P. INRIM,Torino, ITALY
Abstract
1. Motivation
The design of lighting installations in tunnels is particularly critical because during daytime the lighting level in the first part of the tunnel shall be high enough to compensate the effects of peculiarities of the human visual system and assure the driver is able to perceive danger objects on the road surface in time to stop safely the vehicle.
For this reason, the first part of a tunnel (the entrance zone) is divided into two different zones with different lighting requirements:
In the threshold zone, the obstacle shall be perceived while the driver is outside the tunnel. The driver eyes are adapted at a relatively high level of luminance also if the driver is looking at a dark surface inside the tunnel. The glare due the external environmental luminance and the atmospheric scattering of light are the main factors that reduce the perceived contrast between object and background. The lighting level shall be high enough to compensate this reduction of the perceived contrast, mathematically modelled using the well-known concept of veiling luminance.
In the transition zone the driver is inside the tunnel, (i.e. it is in the threshold zone). The influence of glare and atmospheric scattering is greatly reduce and the lighting level could be gradually reduced considering the adaptation time, i.e. the time the visual system requires to adapt himself to the new stimuli conditions.
Generally, if the length of tunnel is lower than 1,5 km – 2 km, the main energy consumption of the lighting installation is concentrate in the entrance zone and for this reason the correct design (i.e. highest illumination level required) and control (i.e. correlation between the actual veiling luminance and the imposed illumination level) of this zone of the lighting installation play a key role in the total cost of the lighting installation.
The CIE 88 technical report gives sound scientific basis of the design approach, but introduce several simplifications that could not optimize the cost benefit ratio of the lighting installation.
This work:
Proposes the definition of the veiling luminance function, a function that characterizes the tunnel behaviour from the human vision point of view.
Adopts the CIE 88 equation that correlate the veiling luminance at the stopping distance to the average road surface luminance at the tunnel portal as a safety condition that, with some constrains, gives the link between the veiling luminance function in the access zone to the average road surface luminance in the threshold zone.
Compares different approach in the measurement of the veiling luminance.
Introduces and compares statistical techniques to correlate the measurement of the veiling luminance at a given instant to the reasonable value that should be adopted in the design of the lighting installation.
2. Methods
The veiling luminance function Lv(x) can be measured at a given instant in the access zone (-ds ≤ x < 0 ) where x is the road longitudinal coordinate starting at the entrance portal and ds is the stopping distance. For a given tunnel this is a stochastic function that depends on the hour of the day, day of the year, and years.
CIE Session 2019 – Abstract Booklet
268
the veiling luminance can be measured using an ILMD (Image Luminance Measure Device) considering the approximate method described in CIE 88 (Adrian diagram) or directly using the integral equation of disability glare that is the basis of the Adrian diagram. The values and uncertainty of the two measurements method are compared considering the approach of a moving ILMD in the access zone or of a fixed detector and a set of zoomed imagines of the tunnel portal to simulate different values of x.
The measured values at a given instant can be used to control the lighting installation level in the threshold zone and, consequently, in the transition zone.
For design of the lighting installation, a measured value is not sufficient to define the highest value that can be expected with a given probability.
The simplest method to obtain this value is to use tables of suggested luminance values of the framed environment (sky, road surface, forest, grass, walls, etc.). The experience highlights these results are overestimated and therefore three different approaches are suggested and compared:
The use of measured horizontal and vertical illuminance to scaled the measured veiling luminance considering their maximum expected values.
The use of climatic data available for other purpose, like the energy requirements for building.
The use of tool available in internet for evaluating the daily position of the sun and the application of the CIE standard sky
3. Results
The results of measurements and simulations carried out considering different tunnels are compared to highlight pro and contra of the different approaches.
Examples of measured veiling luminance function demonstrate the possible energy saving compared with the CIE 88 rule (constant value in the first part of the threshold zone and linear decrement in the second part).
Measurements carried out with a wearable eye-tracker of pupil dilation of drivers traveling through a tunnel, give a physiological indication of the influence of glare and adaptation.
4. Conclusions
The proposed methods can be adopted in design optimized tunnel lighting installation. The possible energy saving justify the greater effort to obtain more detailed data and information before defining the characteristic of a tunnel lighting installation.
CIE Session 2019 – Abstract Booklet
269

PP29 / PO098
DYNAMIC MULTI-LED LIGHTING SYSTEMS THAT MIMIC DAYLIGHT IMPROVES MEASURED ALERTNESS, COMFORT AND SLEEP QUALITY
Llenas, A.1,2 *, Hurlbert, A.3, Carreras, J.2 1 Institut de Recerca en Energia de Catalunya (IREC), Barcelona, SPAIN, 2 Ledmotive Technologies
SL, Barcelona, SPAIN, 3 Newcastle University, Newcastle upon Tyne, UNITED KINGDOM.
Abstract
Lighting installations in offices and buildings are based on the spectral sensitivity of the classical visual system and do not take into account the recently discovered melanopsin-based, blue-light-sensitive photoreceptive system and the whole human centric lighting paradigm. The authors investigated the effects of novel spectrally tunable light-engines that mimic daylight during daytime workhours in an office setting. Subjective and objective measurements could imply that exposure to a spectral CCT-changing light sequence improves alertness, performance, comfort and sleep quality of workers.
1. Motivation, specific objective
For centuries, humans have developed all our activities only under the light of the Sun. Its well-defined, dynamic, with all the wavelength components and always changing spectrum is what we perceive as more natural. Today, and although the influence that the Sun spectra has in our biology remains unchanged, we master several artificial lighting technologies and our main activities have shifted inside buildings, shortening the natural light exposure in our daily basis.
The blueprint for lighting in occupational settings are based on the well-established visual effects of light, with aspects such as illuminance, glare, colour-rendering index (CRI) and correlated colour temperature (CCT) being taken into account. However, during the past two decades evidence has accumulated in the support of the claim that, in parallel to the visual path of light, there is also a non-visual path that shapes many cognitive functions in our brains. Currently, the role that light plays in the regulation of our approximate 24-hour circadian rhythm is well accepted and understood. It also affects our body temperature, attention, hormonal secretion and sleep. The discovery of a fourth type of retinal photoreceptor, the Intrinsically Photosensitive Retinal Ganglion Cells (ipRGCs), in the 90s was the missing link proving that light does not only play an image forming role but has an equally important non-visual influence on our sleep-wake cycle. Furthermore, melanopsin is a photopigment found in the ipRGCs of the eye and is the most sensitive to wavelength of approximately 480 nm. Exposure to blue light in this region has been shown to have a greater effect on various physiological measures such as melatonin suppression, alertness, thermoregulation, heart rate, cognitive performance and electroencephalographic dynamics. This explains why not only illuminance levels or colorimetric properties such as the CCT or CRI of light are important, but the whole spectral information of light, i.e. the spectral power distribution (SPD), needs to be considered.
So far, some studies have been published that compare the performance of individual subjects under different artificial lighting conditions. However, these works used only two types of fixed white light (cold blue-enriched white light and warm white light) and they didn’t take into account the SPD of the light or if this spectrum was a close match to natural daylight. In fact, prior works only use fluorescent lights or white LEDs, sources known to have a spectrum very different from natural daylight.
Today, Light Emitting Diodes (LEDs) are present in a wide range of wavelengths across the visible and IR regions, showing fast time responses (in the microsecond range). In addition, LED present narrow emission bands (typically about 20 nm), low power consumption, long lifetimes and good dimming capabilities. All these properties enable the development of novel spectrally tunable lighting systems by combining several colour-LEDs together. Thus, for the first time in the history of artificial lighting technologies, we are able to have a light source capable of delivering a close match to the SPD of natural daylight in dynamic, custom-made and always changing sequences.
In this work, and for the first time to our knowledge, we investigate the effects that a dynamic spectrally tunable lighting system that mimics daylight has in the subjects under study compared to a traditional lighting system made of fluorescent lights. Within this work we will assess alertness, mood,
CIE Session 2019 – Abstract Booklet
270

sleep quality, performance, mental effort, headache and eye strain through a 6-week intervention using subjective and objective tests.
2. Methods
The tunable light source developed is made of 7 different LED channels, essentially spread all over the most sensitive part of the visible region (400-700 nm). The amplitude of an LED channel is controlled with a pulse-width modulation (PWM) constant current driver with a 12 bit-depth resolution.
The experiment was conducted on 30 workers in one office floor. After one baseline assessment under existing lighting conditions (2 weeks), every participant was exposed to a CCT-changing dynamic sequence made by generating the best match to the blackbody SPD with our light engine (2 weeks). Finally, the previous lighting system was installed, and measurements were made for 2 more weeks.
The kind of measurements made were subjective ones: questionnaires and rating scales were used to assess alertness, mood, sleep quality and comfort; and objective ones: actigraph measurements made with 24/7 wearables were used to assess body temperature, heart rate and sleep/awake cycles thorught the 6-weeks intervention.
Based on the actigraph measurements, we can quantify the Alertness Index of each worker by taking into account the body temperature (an increase in skin temperature, associated with an increase in sleepiness/tiredness) and heart rate. The alertness index provides a real-time estimate of objective arousal state.
All in all, we will study the behaviour of workers under different lighting conditions to assess the alertness, performance, sleep quality, mental effort, headache, eye strain and evening fatigue.
3. Results
Our aim is to assess the behaviour of subjects under different lighting conditions. The experiment will conclude on Q1 2019 and results will be presented in CIE Session 2019.
4. Conclusions
Exposure to a CCT-changing spectra during daytime workhours has the potential to improve subjective and objective alertness, performance, fatigue and sleep quality and final results will be presented in CIE Session 2019.
CIE Session 2019 – Abstract Booklet
271

PP30 / PO099
CIRCADIAN LIGHT EXPOSURES OF SHIFT WORKING NURSES
Price, L.L.A.1 Udovicic, L.2, Khazova, M.1 1 Public Health England, Centre for Radiation Chemical and Environmental Hazards, Harwell, Didcot, Oxfordshire, UNITED KINGDOM, 2 Federal Institute for Occupational Safety and Health, Dortmund,
GERMANY
Abstract
1. Motivation, specific objective
Studies have linked work during the body’s subjective night, which also results in ill-timed exposure to light that may cause circadian disruption, to a number of adverse health outcomes. The measurement and interpretation of light exposures in the majority of these studies are limited for several reasons:
The contribution from daylight is often excluded, which can be inappropriate, e.g. in northern European latitudes in summer;
Measurement timing does not represent 24-hour exposures due to work schedules, and in particular outdoor exposures due to travel to work are routinely excluded;
Measurement locations (e.g. devices worn on the wrist, or the illuminance on work surfaces) are not representative of the exposure of the eye or the full range of conditions in the workplace;
Measurement quantities relating to “ipRGC-influenced responses to light” are now the subject of an international standard, but typically studies have reported only illuminance and correlated colour temperature of artificial lighting;
Interpreting circadian exposure timing requires information about individual’s subjective clock state, but chronotype methods are often overlooked, and may not even be appropriate tools in the case of shift workers; and
Time-weighting in dose calculations are not directly relevant to circadian responses, and are usually based on time above threshold or hourly averages.
This study aimed to characterise circadian aspects of 24-hour personal light exposures of shift-working and day-working nurses in the UK and Germany, whilst exploring the possibilities of shift-work appropriate chronotyping and applying physiological dose-estimation methods. In particular, reusable data relating to the melanopic irradiance time-series near to the eye were collected.
2. Methods
Approximately 40 nurses were recruited in each of Kings College Hospital (London, UK) and Klinikum Dortmund (Germany). The two population centres have the same latitude (51.5°) and the longitude difference is 7.5°; on average sunrises and sunsets take place half-an-hour earlier in Dortmund in Coordinated Universal Time, but half-an-hour later using local clocks.
Participants completed a demographic and basic health questionnaire plus a brief workplace and home lighting questionnaire. Participants were studied during three separate weeks in January, April and June 2015 (“winter”, “spring” and “summer”), completing a shift-work chronotyping questionnaire prior to each week. Daylight saving applied in April and June.
24-hour light data were collected with commercial actimeter sensors (Actiwatch Spectrum, Philips Respironics) closely matching the melanopic function, worn as a badge on the upper chest on the outer layer of clothing. The activity data were supplemented with wrist-based actimeters worn exclusively during extended sleep (as opposed to naps), when the light sensor was to be placed at the bedside (UK subjects - Motionwatch8, CamNtech; Germany - GeneActiv original, Activeinsights). Sleep and activity diaries were completed, specifying time spent outdoors vs indoors. In order to track wellbeing and satisfaction outcomes two questions were repeated for every activity period between extended sleeps.
CIE Session 2019 – Abstract Booklet
272

Establishing compliance with the actimetry protocol (i.e. correct use of the devices) for both light data and sleep analysis required extensive exploratory interrogation of the data. Missing data periods of up to an hour per day whilst at home were permitted. Sleep actimetry software relied on devices being worn during the activity period, so sleep timing data had to be taken from questionnaires. Inactivity from the light sensors was also looked for: smooth light exposures can indicate when the light sensor has been removed.
Information about the study was provided in advance, participants gave written consent, and were free to withdraw at any time. Data were stored and processed securely and anonymously, and no identifiable individual data were available to employers or third parties.
3. Results
Recruitment was largely successful, and withdrawal rates were low. As already presented elsewhere, difficulties with questionnaires and diaries were greater than were predicted, and compliance was lower than predicted based on similar published studies and related methods validation studies. In particular, the data relating to the questionnaire-based chronotype adjustment did not appear to be suited to the different types of shift arrangements:
London shifts ran from 07:30 to 20:00 and 19:30 to 08:00 (day-workers 09:00 to 17:00); and
Dortmund shifts ran from 06:30 to 14:30, 14:30 to 22:30 and 22:30 to 06:30.
When exposure dose levels are relatively low, they introduce minimal influence on subsequent dose levels. This is typically the case following extended sleep at night only. Selected periods of actimetry compliance starting during extended sleep at night were identified for further analysis:
For daytime, morning or evening work, 24 hours fully compliant data, and
For night work, including consecutive nights, multiples of 24 hours.
The average hourly melanopic irradiance, dose plots, sleep quality and duration in UK and Germany, for each season and shift are presented.
The advancing seasons extended the photoperiod, defined as continuous time above 10% exposure threshold relative to maximum exposure. 24-hour-averaged winter exposure values were lower than spring or summer, but the UK spring and summer values were similar. Morning photoperiod onset was delayed 2 hours in winter compared to spring. Over the year, the change in relative timing of sunrise and shift start times is partly mitigated by daylight saving.
4. Conclusions
This investigation demonstrates 24-hour personal light exposure data can be collected for analysis of cricadian exposures to light. The two actimeter method was essential to collect both light and sleep data. Wearing the sleep actimeter before and after sleep would help automate sleep analysis.
Studying shift work presents additional challenges for data collection and analysis. Daily paper-based questionnaires appeared to overload busy employees and may have reduced actimetry compliance. App-based diaries and tracking of subjective aspects may be more convenient in future studies.
The UK night shifts introduce fence-post exposure profiles, creating 12-hour dose cycles in summer and especially in spring. These exposure profiles, long shift times, exposure to Light at Night (LAN) and sleep opportunities restricted to daytime periods with prior bright light exposure may combine to produce substantial circadian and sleep disruption.
Further investigation might be worthwhile into the potential benefits of morning shift start and end times that are more closely linked to sunrise times.
CIE Session 2019 – Abstract Booklet
273
PP31 / PO198
ESTIMATION METHOD OF DISCOMFORT GLARE FOR LED TUNNEL INTERIOR LIGHTING
Hirakawa, S.1, Tamoto, A. 2, Takamoto, S. 1, Muraki, T. 3, Ito, H.4 1 Nippon Expressway Research Institute Co. Ltd., Tokyo, JAPAN,
2 East Nippon Expressway Co. Ltd., Chiba, JAPAN, 3 Nexco-East Engineering Co. Ltd., Tokyo, JAPAN,
4 Panasonic Corp., Osaka, JAPAN
Abstract
1. Motivation, specific objective
Glare is classified roughly into disability glare showing the influence on visibility and discomfort glare showing the effect on comfort. In CIE publication, it is recommended that the relative threshold increment TI be 15% or less to suppress glare in tunnel interior lighting. However, in the interior tunnel lighting installation using LED, even if the TI is within the specified value, drivers may feel discomfort glare. Therefore, we propose a new discomfort glare evaluation method for LED tunnel interior lighting.
2. Methods
2.1 On-site experiment
An experiment was conducted to verify the correlation between discomfort glare and TI in tunnel on-site. In the tunnel, LED luminaires capable dimming were arranged with opposite arrangement, mounting height of 4,8m and spacing of 4,4m. The experiment carried out under 20 conditions by adjusting the dimming ration of luminaires and thinning-out lighting. 9 subjects evaluated discomfort glare in the car placed in the carriageway at 4 observation position using five-point evaluation scale.
2.2 Laboratory experiment
4 LED luminaires with symmetrical luminous intensity distribution in the laboratory were installed at a height of 4,8 m. One of these luminaires was placed at the position of 4,0 m in front of a subject. The other luminaires were arranged 2,5 m apart from the first luminaire toward the front of a subject. After turned one of these luminaires on, 8 subjects evaluated discomfort glare using nine-point evaluation scale. Subjects under evaluation gazed at the road surface of the CG image in the tunnel projected on the screen. In the experiment, the dimming rate of the luminaires was 9 levels, and luminance of the road surface portion of the CG image in the tunnel projected on the screen was 4 levels, 144 conditions were taken. Also, experiments were conducted under conditions where multiple luminaires were on.
3. Results
3.1 On-site Experiment
The results of on-site experiment showed that there was no correlation between TI and observation evaluation of discomfort glare. On the other hand, the correlation between the equivalent veiling luminance calculated based on the conditions of the on-site experiment and discomfort glare was shown. In this experiment, the influence on the discomfort glare due to the equivalent veiling luminance was not verified at a certain road surface luminance.
3.2 Laboratory experiment
The results of the laboratory experiments showed that there were the correlations between the evaluation of discomfort glare and the equivalent veiling luminance of the single luminaire and between the evaluation of discomfort glare and the luminance of the road surface portion of the CG image. Also, in order to obtain the evaluation value of discomfort glare, a prediction expression with the equivalent veiling luminance of the single luminaire and average road surface luminance was derived by multiple linear regression analysis. The predicted value of discomfort glare calculated using the equivalent veiling luminance of the single luminaire and average road surface luminance obtained based on the design conditions of the site tended to agree with the evaluation of discomfort glare by the driver in the site.
CIE Session 2019 – Abstract Booklet
274
4. Conclusions
Discomfort glare of the tunnel interior lighting using LED luminaire cannot be evaluated by TI but depends on the equivalent veiling luminance by single luminaire and average road surface luminance. By designing value of discomfort glare appropriately and carrying out the lighting plan by using prediction expression of the discomfort glare derived in this paper, it is possible to installed tunnel interior lighting installation with suppressed discomfort glare.
CIE Session 2019 – Abstract Booklet
275
Poster session 1
Monday, June 17, 16:30-18:00
CIE Session 2019 – Abstract Booklet
276

PO001
IMPROVEMENT OF COLOUR RENDERING OF URETHANE SKIN SAMPLES BY USING COMPUTER COLOUR MATCHING METHOD
Akizuki, Y.1, Osumi, M.2 1 University of Toyama, Toyama, JAPAN, 2 Office Color Science, Yokohama, JAPAN
Abstract
1. Introduction
Human skin colour is controlled by genetic, environmental element, and health condition. The most important pigments affecting skin colour are melanin and haemoglobin concentration. First, melanin determines one’s skin colour to be darker-or-not by genetic or the amount of ultraviolet radiation. Next, haemoglobin concentration determines one’s skin colour to be reddish-or-not by one’s health condition that includes the effects of heat environment condition, amount of exercise, nutrition status, and so on.
We had developed database of circulatory dysfunctional skin colour taking consideration of age and gender by using Japanese subjects’ skins which are artificially shocked or congested in part of upper arms. In our previous paper, the urethane skin model samples (previous urethane samples) which had
similar spectral reflectance factors as real skin under circulatory dysfunction had been developed. In
consequence, the spectral reflectance factor curves of previous urethane samples were closer to real skin than the commercially available skin colour paper charts (paper charts) at longer than 580 nm, but they still did not match sufficiently.
This paper reports, based upon the database of each pigment with matching an urethane base material, that we have developed better pigment mixing ratio with spectral reflectance factors same as the real skin’s using the method of computer colour matching (CCM), thereby creating better spectral reflectance factors than previous urethane samples.
2. Methods
Before simulating by CCM method, we made a pigments database which accumulated each pigments’ spectral reflectance factors and Kubelka-Munk’s absorbing and scattering coefficients (K/S). Twelve used pigments were made by Mikuni-Color Ltd, and a transparent urethane base material was made by Takebayashi Chemical Industry Co. One pigment or blended pigment (a 30% pigment and 70% white pigment mixed) was added to the 100g urethane base material with density of 1%, 3%, and 5% and then painted to a BYK chart with 200 micrometer-thick. The BYK chart was a substrate (test chart) for measuring colour and opacity of painting materials, following the guidelines of ASTM-D344 and ISO6504-3, and had a black part (reflectance 6.3%) and a white part (reflectance 89.4%). We measured two kinds of spectral reflectance factors of the painted parts on white and black from 400 to 700nm by a spectrophotometric colorimeter. The measuring spectrophotometric colorimeter was Konica-Minolta CM2600d (specular component excluded, visual field 10 degrees, and standard illuminant D65 for calculation values of CIE L*a*b*).
The calculation by CCM method was performed so that the colour difference delta E*ab of CIE L*a*b* between a target spectral reflectance factor and a reference one (i.e. the real skin colour data) reached the value as 0, and the error sum of squares of spectral reflectance factors (%) between the target and the reference got the minimum value. We used the Kubelka-Munk’s absorbing and scattering coefficient (K/S) by the pigment database, Kubelka’s absolute two-constancy equation, and Duncan’s colour mixing equation for the calculation by CCM method. The calculation condition was 5% density of blended pigments against the 100g urethane base material. And we got the optimal pigment mixing ratio to make the target reflectance factor closer to the reference spectral factors.
3. Results
In our previous paper, we categorized all the real skin colour results by three circulatory states (healthy, shocked, and congested) and subjects’ age and gender, and selected four typical subjects’ spectral skin colour for each circulatory state.
CIE Session 2019 – Abstract Booklet
277

We calculated colour differences delta E*ab under the standard illuminance D65 among paper charts, previous urethane samples, CCM urethane samples, and these selected real skin data (twelve spectral reflectance data consisted of four typical subjects and three circulatory states) by using a spreadsheet program “NIST CQS ver.9.0.1”. The result was that the average colour difference between CCM urethane samples and real skin data was 0.5 plus/minus 0.1, which was very small as compared with the colour differences between paper charts and real skin data (3.0 plus/minus 1.3) or the ones between previous urethane samples and real skin data (4.0 plus/minus 1.7).
Also, we calculated error sum of squares of spectral reflectance factors (%) among paper charts, previous urethane samples, CCM urethane samples, and these selected real skin data. The result was that the average error sum of squares in the range from 400 to 700 nm of CCM urethane samples was the smallest (230 plus/minus 48), and especially within the range from 500 to 600nm (18 plus/minus 8), it really matched with the real skin data. Within the range from 500 to 600nm, the average error sum of squares of previous urethane samples was larger (319 plus/minus 154) than paper charts (194 plus/minus 95). However, the average error sum of squares in the range from 400 to 700nm of previous urethane samples was much smaller (603 plus/minus 238) than paper charts (1578 plus/minus 663).
4. Conclusions
This study showed that we could find the pigment mixing ratio by using a CCM method, which produced the almost same spectral reflectance factors as real skins’ under circulatory disfunction conditions, significantly better than previous urethane samples’.
We will conduct further study to improve skin samples taking into consideration real skins’ transmittance. Ultimately, we aim at the development of light source which is effective in distinguishing skin colour changes for medical care.
CIE Session 2019 – Abstract Booklet
278
PO002
COLORIMETRIC VALUES OF IMAGE SKIN COLOUR IN THE WHOLE FACE AND CHEEK PART, AND THEIR RELATION TO SUBJECTIVE EVALUATION
Ayama, M.1,2, Shiromizu, S.1, Kawame, K.1, Arimoto, K.3, Kimura, M.3, Hata, H.3, Koshino, M.3, Ishikawa, T.1
1 School of Engineering, Utsunomiya University, JAPAN 2 Center for Optical Research & Education, Utsunomiya University, JAPAN
3 Shiseido Global Innovation Center, JAPAN
Abstract
1. Motivation, specific objective
Foundation is the cosmetics used to make the colour of facial skin appear more uniform, brighter, whitish by masking spots, freckles, and erythema. Increasing brightness and whiteness is important especially for oriental women. Recently, many researchers use not real faces, but facial images on a display in the studies of facial skin colour, because of the stimulus controllability. Yoshikawa et al. employed various colour-rendered facial images as test stimuli and did the whiteness matching using a series of scale-images of which lightness is changed in the same step. Results showed that decreasing chroma increases perceived whiteness. Zeng et al. used 12 face images, the skin colour of them was morphed toward various colour-center, and carried out the preference evaluation experiment. Color centers close to (a*, b*) = (20, 20) were the most preferable for all ethnic facial images. Wang et al. used 4 different faces, each of them was rendered into 26 images of different colour surrounding the original one, and carried out the subjective evaluation experiments using five attributes such as “Likable” or “Health”. In these studies, number of colour-rendered images for one original test face is relatively small up to about 50, and thus the change of subjective rating score in 3D colour space was not shown. To seek the range of preferable foundation colour, how the subjective rating changes in 3D colour space is needed to be explored.
On the other hand, most of the studies using real face, colorimetric measurement was done in some small parts of the face such as cheek or forehead. It seems that when people judge preference, whiteness, or any kind of perceptual evaluation, they look at whole area of the face. So, colorimetric values of whole face rather than those of limited portion are more proper measure to comprehend subjective evaluation results. If we have a data-set of colorimetric values of cheek or forehead and whole face for the same stimulus, we could estimate the values of whole face from those of the measurement in a limited portion. However, no studies have provided such data.
In this study, we have two aims. First one is to investigate the change of subjective evaluations in a wide range of colour difference from the original face image. The second one is to provide the data-sets to compare the colorimetric values of the small part in the cheek and the whole face.
2. Methods
A facial image of 3 Japanese women in her twenties without makeup was taken by a digital camera and set as an original image. Image group composed of 343 was created for each of them in which the L*, a*, and b* of the skin colour area were changed with nearly a constant step.
Chromaticity and luminance of the small areas in the left and right cheeks of the test images on the display were measured using spectroradiometer (Konica Minolta CS-2000). For all the test stimuli, facial part of skin colour was extracted by deleting the eyes, eyebrows, and lips, and chromaticity and luminance of these images on the display were also measured using 2D colorimeter (Konica Minolta CA-2500). L*a*b* values were calculated using the maximum white of the display as the reference white.
Subjective evaluations of “Finish-up impression”, “Color affinity to her skin”, “Difference between face and neck colour”, “Brightness or darkness”, and “Redness or yellowness” were done. Rating scores from 1 to 5 were employed in all evaluations, while the description of the perceptual degree differs among the evaluations. For example, in the case of “Finish-up impression”, scores of 5, 3, and 1 correspond to “preferable”, “neutral”, and “unlikable”, respectively, while in the case of “Redness or
CIE Session 2019 – Abstract Booklet
279

yellowness”, scores of 5, 3, and 1 correspond to “very yellowish”, “neither yellowish nor reddish”, and “very reddish”, respectively. Five females and 5 males in their twenties participated the experiment.
3. Results
For the whole face measurement, frequency distribution of colorimetric values, (L*, a*, b*), were analysed, and the average of top 50% is employed as a representative colour of the image [Kawame et al., CIE2019]. Then the values are compared with those of the average colorimetric values of small parts in the left and right cheeks. For all images examined, L* is larger and H (derived from a* and b*) is smaller in the cheek than in the top 50% of the whole face.
High scores of “Finish-up impression” appears in the images of larger L* and lower C* than the original image. Brightness increases as C* decreases, which is opposite to Helmholtz-Kohlrausch effect, but similar to the previous results. Perceptual hue changes steeper in the lower L* stimuli around L* = 65 compared with the change in the higher L* stimuli around L* = 75.
4. Conclusions
Colorimetric values of whole face and small parts in the cheek were compared in a large number of facial image. Lightness of the cheek is larger and H is lower than those of whole face, respectively. The colour in the cheek is lighter and reddish than the colour of whole face.
It is indicated that the increase of L* and slight decrease of C* from the original image give a good “Finish-up” impression for all 3 test faces.
CIE Session 2019 – Abstract Booklet
280
PO003
STUDY OF TARGET VISIBILITY ON THE ROAD WITH DRIVING AS WORKLOAD
Cao, D.W.1, Tu, Y.1, Wang, Z.C.1, Wang, L.L.1, Liu, L.1, Chen, Z.Y.1, Lou, D.2, Zhu, X.Y.2, Teunissen, K.3
1 Joint International Research Laboratory of Information Display and Visualization, School of Electronic Science and Engineering, Southeast University, Nanjing 210096, CHINA
2 Signify Research, Shanghai, CHINA 3 Signify Research, Eindhoven, NETHERLANDS
Abstract
Road lighting is very import to ensure the traffic safety during night driving. Good quality of road lighting can improve drivers’ visual performance at night effectively, leading to a reduction in the number of accidents. The visibility on the road must be enough to ensure that the driver can detect the obstacles on the road within the safety distance. It is economically viable since the costs of lighting are offset by the savings in accident reduction. However, all of these must be based on the appropriate lighting design. Relevant study has shown that a bad lighting design may be worse than no lighting condition.
Detecting targets on the road is directly dependent on the visibility and it is also affected by the driving workload, which in turn is related to traffic safety. A study has indicated that the passenger’s detection performance is significantly better than that of the driver’s, showing that even a very easy driving task (straight lane, no traffic, low speed) does lower the visual detection performance, which means that driving workload has a significant impact on target visibility in night driving environments. While the present visibility models are based on simple psychophysical experiments, which cannot reflect the impact of real driving workload on visibility, including the Small Target Visibility (STV) model. The STV model provides a link between lighting design and driving performance and it is widely used to evaluate the road lighting quality. The target visibility on the road with driving as workload is investigated in this paper.
Considering the difficulty of the field experiment, a driving simulator is used in the study. Compared with the field experiment, parameters in the driving simulator are more controllable and the experiments are easy to be performed. In order to simulate the real driving environment more truthfully and reliably, a virtual driving simulation system was designed. All parts of the driving simulation system were synchronized through the E-prime program. Based on the designed driving simulation system, the effect of driving workload on the visual performance of target detection under the condition of mesopic vision is studied. Three driving scenarios with reference to the STV scenario were designed corresponding to three levels of driving workload. Small target detection task was required to perform in all three scenarios. The influence of the target contrast, target distance and target position on the small target visibility are also studied.
The experimental results show that all factors have significant effect on detection rate and reaction time. The effect of driving workload and target contrast is greater than other factors, and the interaction between most of factors is significant but only a few of them has a large effect size. For detection rate, there is a significant interaction between all the factors, while only the interaction between driving workload and contrast has a large effect size. The trend of detection rate changes with contrast in larger driving workload scenario is different from others. The increase of detection rate with low contrast in larger driving workload scenario is significantly slower, the detection rate tends to be saturated also slower at high contrast. For reaction time, there is no interaction between distance and position, contrast and position, and the interaction in all other cases is significant but with small effect size. In general, the smaller driving workload, the larger target contrast, the shorter target distance and the closer location to the center help to increase the target visibility, which is consistent with the existing studies. In addition, the relationship between the visual power function (MVP) and influencing factors is studied. We defined the MVP as a combination of the detection rate and reaction time. The results show that MVP has a positive correlation with visibility. All factors including workload, contrast, distance and position all have significant effect on MVP. The interaction between different factors is significant too.
CIE Session 2019 – Abstract Booklet
281

The corresponding target visibility level (VL) is calculated with different target contrast, position and distance for the 3 scenarios. The results show that in order to achieve the same detection rate, the VL values with driving workload condition is greater than the currently recommended VL value, which means that driving workload does cause poor visual performance in a significant way. We recommend that the STV model may need to be improved to describe target visibility with driving workload under night-driving condition.
CIE Session 2019 – Abstract Booklet
282

PP004
COGNITIVE PERFORMANCE EVALUATION UNDER CONTROLLED DAYLIGHT LEVELS AT DIFFERENT INDOOR TEMPERATURES
Giorgia Chinazzo1, Jan Wienold1, Marilyne Andersen1 1 Ecole polytechnique fédérale de Lausanne (EPFL), Lausanne, SWITZERLAND
Abstract
1. Motivation, specific objective
Cognitive performance, as defined as the extent to which a particular goal is achieved after an activity has been carried out, can be influenced by many factors such as motivation, type of task and personal well-being. Amongst these parameters, indoor environmental factors might be influential contributors. In particular, the majority of the studies have linked human performance to indoor temperature and to electric and daylight conditions. With reference to the latter, illuminance and spectral distribution of light in the room have been suggested to influence the performance both directly and indirectly; affecting the mood, arousal, and motivation of office workers. In particular, bright light conditions have been identified as potential enhancers of alertness and performance. However, results are sometimes contradictory, especially in terms of cognitive performance tasks rather than of self-reported measures. For this reason, further studies on the topic have been encouraged, with a particular emphasis on real-life conditions.
To this end, this study compares the results of different types of paper-based tasks performed under three daylight illuminance levels (~140, 610 and 1440 lux, average levels measured on the horizontal plane) in a controlled environment, at three different indoor temperatures (19, 23 and 27°C). Despite the conduction of the experimental investigation in a controlled setting, the use of daylight is considered more realistic and representative of indoor situations commonly found in buildings than the use of electric light, predominantly investigated in past studies. Furthermore, by choosing stable sunny weather conditions and north orientation, the illuminance levels varied only a little, allowing researchers to assess the actual impact of different daylight levels without the confounding effect of varying daylight conditions. These conditions usually occur or are more difficult to control in field studies. The combination of daylight levels with indoor thermal conditions could further expand our understanding of the impact of indoor factors on human performance, potentially explaining some past contradicting or null results, as environmental stimuli always occur in combination.
2. Methods
Experimental investigations were carried out in an office-like test room with controllable indoor temperature and easy-to-change glazing visible transmittance thanks to the application of colour-neutral filters. A total of 84 participants took part in the experiment, performed only under clear sky conditions to avoid illuminance changes. In a randomized order, participants were exposed to three daylight illuminance levels for 30 minutes (considered a short exposure time), corresponding to a visible transmittance of 7% (dim), 30% (medium) and 75% (bright) resulting from the glazing-filter combinations. During the entire experimental session, each participant was exposed to one of the three temperature levels. Each temperature was experienced by 28 participants and gender was completely balanced.
To evaluate the cognitive performance of participants, three types of paper-based tasks were repeated at different stages of the experiment. One task evaluated the distributed visual attention (Tsai Partington), another the sustained vigilance (D2 test) and the last the logical reasoning (Baddeley test). The first round of performance tasks was performed before the exposure to the daylight levels, in the pre-test phase in which electric light was turned on and daylight was blocked from entering the test room. Then, the same tasks were performed during the three daylight exposures. The last round was conducted at the end of the daylight exposure, under the same electric light conditions as at the beginning. After the completion of the tasks, participants replied to a questionnaire investigating their alertness and self-estimated performance.
CIE Session 2019 – Abstract Booklet
283

3. Results
Mixed-model statistical analyses were performed to evaluate the main effects of daylight levels and temperatures, as well as their interactions, considering the repeated measures of the performance tasks and of the subjective measures. The gender of each participant and the time of the day (morning or afternoon) were also included as covariates. The values of the three tasks, considered as dependent variables in the analysis, were calculated from the total number of responses minus the number of errors.
Although some trends are visible from the graphical analysis (i.e., under the bright daylight the performance of the Tsai Partington test is higher, only in the thermally conformable situation – 23 °C), we did not find a significant decrease in performance under dim daylight or an increase of it under bright daylight.
For the objective performance, statistical results indicated significant differences only between the first round of tasks and the other four evaluations (three during daylight conditions and one at the end under electric light), implying a learning effect but only between the first trial and the others. A consistent learning effect was also observed across consecutive evaluations for the D2 test, confirming results reported in past investigations.
In terms of subjective measures of alertness and performance, statistical analyses were performed only on the responses during the three daylight exposures. A significant difference under different exposure to daylight levels was indicated only for the self-evaluated level of concentration (F (2, 168) = 3.69, p = 0.026). Post-hoc tests indicated that the self-reported concentration was lower under the dim exposure compared to both the medium (p = 0.046) and the bright (p = 0.056) ones, independently of the thermal condition.
4. Conclusions
This study reported the combined effects of illuminance and temperature levels on cognitive performance and subjective measures of alertness and self-estimated performance. Experimental investigations were conducted in a controlled environment to be able to change and control the indoor conditions, and to study the effects of daylight without introducing confounding variables as in field studies.
Results did not indicate significant differences between the dim, medium and bright daylight levels for all the dependent variables investigated, except for the self-evaluated level of concentration, which resulted lower under the dim daylight exposure. As a consequence, results do not confirm the hypothesis that bright daylight could enhance objective or self-related performance as has been suggested in previous investigations. Moreover, as performance differences between the dim exposure (well below any recommended thresholds) and the other two levels were not significant, findings suggest that lower minimum illuminance thresholds could be considered for short exposure time. Further investigations should expand the current findings for longer exposures.
CIE Session 2019 – Abstract Booklet
284

PO005
EVALUATION OF HUE SHIFT FORMULAE IN CIELAB AND CIECAM02-UCS
Dorukalp Durmus1, Wendy Davis1 1Wilkinson Building (G04), 148 City Road, the University of Sydney, NSW 2006, AUSTRALIA
1. Introduction
The colour appearance of objects can be quantified using three-dimensional colour spaces. The three dimensions of a colour space are typically lightness, colourfulness, and hue. Lightness can be described as the brightness of an area, and colourfulness indicates the strength of the chromatic content (e.g., redness of a red object). The International Commission on Illumination (CIE) describes hue as the “attribute of a visual perception according to which an area appears to be similar to one of the colours: red, yellow, green, and blue” [2011], which is categorically different than lightness and colourfulness for inexperienced observers. Humans are typically more sensitive to hue shifts than saturation and lightness changes. Although hue can be calculated using colour appearance models (CAMs) (mathematical models quantifying the perceptual attributes of coloured stimuli), it is not widely used to quantify object colours.
Hue shift (H) can be calculated in two of most widely used colour spaces: CIE 1976 L*a*b* (CIELAB) and CIECAM02-UCS. A recent study showed that the calculated hue of a surface can vary greatly even when the total calculated colour difference is small. This suggests limitations of the hue shift formula in CIECAM02-UCS for highly structured spectral power distributions (SPDs). Here, hue shifts in CIELAB and CIECAM02-UCS are investigated to identify the underlying issue.
2. Methods
Hue shifts were investigated for 24 Macbeth ColorChecker samples using four formulae in CIELAB and CIECAM02-UCS colour spaces. The colour appearance of the test samples was compared when lit by CIE standard illuminant D50 and white phosphor-coated LED (pcLED) references and test SPDs. Test SPDs were created by iteratively mixing seven narrowband LEDs in six steps (0 %, 20 %, 40 %, 60 %, 80 %, and 100 %) for each LED channel, a total of 279,936 combinations. For example, one test SPD consisted of 0 % LED channel 1, 20 % LED channel 2, 60 % LED channel 3, 80 % LED channel 4, 100 % LED channel 5, 0 % LED channel 6, and 40 % LED channel 7. The peaks of the test SPDs were adjusted to equalize the luminance of the sample in the reference and test conditions, to prevent changes in hue and chroma caused by brightness differences.
Hue shifts were calculated using four formulae, all based on Seve’s hue shift calculations [1991]. The
first formula, HSeve, is recommended by the CIE to calculate hue shifts [2004]. The second formula
was an alternative method offered by Stokes and Brill (HSB) to calculate hue shifts more efficiently (to reduce computation time) in CIELAB [1992]. The third and fourth methods were Seve’s hue shift
formula adapted to CIECAM02-UCS with no modification (HCAM02) and minor modifications
(HCAM02_mod).
HSeve and HCAM02 are based on chroma, C, and hue angle, h, (calculated using a-b coordinates).
While chroma, and therefore HSeve, in CIELAB is solely dependent on a* and b* coordinates, CIECAM02-UCS makes a distinction between colourfulness (M’), chroma (C), and saturation (s), and
provides three outputs for this dimension. HCAM02 uses chroma instead of colourfulness. Unlike HSeve, in which chroma is not brightness dependent, in CIECAM02-UCS, the calculation of chroma includes
lightness and the achromatic response, as well as a’ and b’ coordinates. It is likely that HCAM02 is
affected by chroma-colourfulness separation in CIECAM02. To address this, HCAM02 was modified by
replacing chroma with colourfulness in CIECAM02-UCS (HCAM02_mod).
3. Results
Computational simulations showed that largest differences in average hue shift values were between
HSeve and HCAM02 for both references (D50 and pcLED). The average hue shifts were HSeve,avg = -
0.3 and HSeve,std = 51.8 when the reference was D50 and were HSeve,avg = -0.1 and HSeve,std = 51.4
when the reference was pcLED. The average hue shifts were HCAM02,avg = -2.0 and HCAM02,std = 43.8
CIE Session 2019 – Abstract Booklet
285
when the reference was D50 and were HCAM02,avg = -2.5 and HCAM02,std = 43.0 when the reference was pcLED.
HCAM02 varied more (from -321 to 317 when the reference was D50, and from -351 to 414 when the
reference was pcLED) than HSeve (from -285 to 283 when the reference was D50, and from -372 to
332 when the reference was pcLED). The wider range of values from HCAM02 can be explained by the contribution of the lightness and achromatic response in the CIECAM02-UCS hue calculations, since
the reference and test a’ and b’ coordinates did not vary greatly (a’avg = 0.2, b’avg = 0.6) compared to
the a* and b* coordinates (a*avg = 13.3, b*avg = -15.6). Although average lightness values were similar (J’avg = 57, L*’avg = 54), lightness in CIECAM02-UCS (J’) ranged from 9 to 180, while lightness in CIELAB (L*), which is mathematically limited from 0 to 100, ranged from 21 to 96. This indicates that CIECAM02-UCS compresses the a’-b’ dimensions, but not lightness J’, which may explain the larger calculated hue shifts.
Modified hue shift calculations in CIECAM02-UCS (HCAM02_mod) resulted in similar average values but
smaller deviations when the reference was D50 (HCAM02_mod,avg = -1.1, -116 < HCAM02-mod < 114) and
pcLED (HCAM02_mod,avg = -1.5, -123 < HCAM02_mod < 133).
4. Conclusions
A previous study showed that hue may vary significantly for very similar test SPDs (almost identical), which suggests a shortcoming of the CIECAM02-UCS hue shift formula. To address this issue, hue shift calculations were performed in CIELAB and CIECAM02-UCS with a large number of test SPDs and standard illuminant D50 and white pcLED references.
The results show that, although average hue shifts were similar, a wider range of calculated hue differences resulted from CIECAM02-UCS than CIELAB. The differences between a’ and b’ coordinates were smaller compared to a* and b* coordinates, which indicates that the hue difference results are likely due to the lightness dependence of hue shift calculations in CIECAM02-UCS. Future work will investigate the visual assessment of hue shifts and test the performance of hue shift formulae.
CIE Session 2019 – Abstract Booklet
286
PO006
THRESHOLD METRIC CHROMA OF IMAGES FOR CHROMATIC PERCEPTION
T. Fujiwara1, S. Nakada1, T. Ishikawa1, M. Ayama1
1 Graduate School of Engineering, Utsunomiya University, Utsunomiya, JAPAN.
Abstract
1. Motivation, specific objective
Color was introduced in the movie in early in the 20th century, spread to colour TV broadcast and colour photography by 1970s, and then expanded to computer display with a rapid spread of PC. In the time of development, people in related fields eagerly elaborated to devise new technique that made beautiful colour image possible. Nowadays, HDR wide colour gamut display is available and even a small display of mobile phone has satisfiable colour quality.
Generally speaking, most people prefer colour image to monochromatic image. However, why people seek or prefer colour image has not been investigated systematically. Nowadays, real time colour processing to enhance or reduce colours becomes possible, and any imaging device such as camera, display, and TV has its own colour processing engine to render colours. In this time and age, psychological effect of colour should be reconsidered, and systematic approach to reveal the effect of colour is needed. Psychological effect here means how and to what degree colour of image contributes to various subjective impressions, such as preference, powerfulness, comfortableness or beautifulness. These are called KANSEI evaluation recently. Before we start KANSEI evaluation experiment using images of different chromatic strength, it is appropriate to obtain a threshold of
chromatic strength as the basis. We take average of metric chroma, Cab*, as an index of chromatic
strength of images. Therefore, objective of the study is to reveal the threshold metric chroma for various colour images that gives observers “chromatic impression” as a whole.
2. Methods
Nine different images representing the following colour names, “red”, “green”, “orange”, “yellow”, “pink”, “blue”, “purple”, “red and green”, and, “yellow and blue”, were chosen as the original images. Color names of each image were based on our previous study. Each pixel of original image, the metric chroma Cab
* was calculated and then multiplied by multiplying factor k from 0 to 0.2. Eight or ten different Cab* images were prepared for each of the original images. Total of 97 images were used as test stimuli. In addition to these test images that are called normal images here, shuffled-mosaic images (one block was 100 x 100 pixels) of each test images were also prepared to examine the contents dependency.
Observer took 5-min dark adaptation at the beginning of each session. A test stimulus was presented on the display (EIZO ColorEdge CG277) with the visual distance of 120cm and the observer was asked to choose a colour name among 14 colour names, as the colour name to represent the colour of the image as a whole. Color names of “red”, “green”, “blue”, “yellow”, “orange”, “pink”, “blown”, “purple”, “red-green”, “blue-yellow”, “gray”, “white”, “black” and “monochromatic”, were written in the answer sheet. The last one, “monochromatic” is not a colour name, but the expression is quite appropriate for some of the test images of very low k. They appeared neither white, gray, nor black, but “monochromatic” as a whole. Test stimulus was presented continuously until the observer made the response. Uniform gray image (R, G, B = 38) was presented about 3 sec between trials to avoid the effect of chromatic after image of the preceding test stimulus. One test stimulus was presented 3 times throughout a session, and 2 sessions were repeated for each observer. Test stimuli were presented in a random order.
Twenty observers with normal colour vision participated the experiment using normal images (the first experiment). 12 males and 8 femals participated the former half of the first experiment using 5 test images ("red", "green", "orange", "yellow", "pink") and 11 males and 9 femals participated the latter half of the first experiment using 4 test images ("blue", "purple", "red and green", "yellow and blue"). So far one observer finished the experiment using shuffled-mosaic images (the second experiment).
CIE Session 2019 – Abstract Booklet
287
3. Results
The number of achromatic responses for one test stimulus were counted for each test image. Achromatic responses here mean that observer’s choice was one of the following colour names, “gray”, “white”, “black”, or “monochromatic” in the answer sheet. Maximum number of achromatic response is 6 and minimum number is 0 because one test stimulus was presented 6 times. The number of achromatic response is plotted against the Cab
*. Threshold Cab*, 50% of achromatic
response, was derived by the fitting using sigmoid function. It is called BCACI, Border Chroma between Achromatic and Chromatic Impression here. We calculated average of BCACI for all of observers for each of the test images.
In the first experiment, results of normal images indicated that BCACIs of various colour images are in the same range around Cab
* = 7 except “pink” and “purple” images of which BCACIs are lower than those of others. Reason why the BCACIs of “pink” and “purple” are lower than other test images is not known at the present. In the second experiment using shuffled-mosaic images, results showed nearly the same BCACI values as those of the first experiment for one observer so far.
4. Conclusions
In order to gather basic data in a research on psychological effect of colour in digital images, BCACI, Border Chroma between Achromatic and Chromatic Impression, was measured. Threshold degree of chroma for various colour images that gives observers “chromatic impression” was obtained for normal images for 20 observers and shuffled-mosaic images for one observer. Our results indicated that when the metric chroma Cab
* exceeds 7, observer’s perception of the whole image turns from achromatic to chromatic, except “pink” and “purple” images. It is interesting that no significant difference was found between normal and shuffled-mosaic images suggesting little effect of contents. Data collection for more observers is necessary.
In the next step, subjective evaluation experiments using various KANSEI evaluation words for images of different metric chroma will be carried out.
CIE Session 2019 – Abstract Booklet
288

PO008
EXPLORING THE MICHAELIS-MENTON FORMULA FOR APPEARANCE MODELLING
Hanselaer, P.1, Smet, K.A.G.1 1 ESAT/Light&Lighting Laboratory, KU Leuven, Ghent, BELGIUM
Abstract
1. Motivation, specific objective
Colour appearance models (CAM) have been developed to predict visual perception of a stimulus (object or light source) in relation to the background and surround. Most of these models include a compression step to reduce the high-dynamic range excitation range and a luminance adaptation step to account for the background. Usually, these steps are modelled by an S-shaped function as proposed by Michaelis and Menton (MM) and confirmed by Naka-Rushton. Originally, the formula has been put forward to model individual neural responses. However, in many cases the MM formula is also applied to a general stimulus-background scene.
In its simplest formulation, the MM formula can be written as:
n
n nR
with the stimulus excitation as input, n the shape factor and the semi-saturation value. The
output R represents the compressed and adapted response attributed to the stimulus. From this equation, the effect of compression becomes evident as the output response is always limited between 0 and 1 (although inclusion of a gain factor is possible) while the stimulus excitation exhibits a large dynamic range comparable to that encountered in real world scenes. Adaptation of
the response to the adapting field surrounding the stimulus is modelled by considering the semi-saturation as a variable which monotonically increases with the strength of the adaptive field. An
increase of the strength of the adapting field induces an increase of , resulting in a lower output
response, mimicking the effect of adaptation. If however increases at the same rate as the stimulus
excitation , changes in cone excitation are completely balanced by changes in , resulting in a
constant cone response R. This is called "complete adaptation", which rarely occurs in reality. If
does not depend on the adapting field and remains constant, there is "no adaptation" to the variations of the adaptive field. In most cases, "partial adaptation" occurs and a large variety of functional behaviours of has been reported in literature.
In this paper, the MM formula will be explored with respect to its interpretation in terms of contrast, to its application in terms of chromatic adaptation and receptive field concepts and to its potential to be included in image based colour appearance models inspired by retinal neural networks.
2. Results
1. Interpretation in terms of a logarithmic compression
The impact of an adaptive field on the perception of a stimulus can be considered as an effect of adaptation to the background or as an effect of simultaneous contrast between stimulus and background. The MM formula makes clear that this shouldn't to be a hard choice: adaptive shift on one hand and contrast to the background at the other hand might be two equivalent interpretations.
2. Interpretation in terms of Michelson contrast
The MM formula can be simply rewritten in terms of a Michelson contrast between stimulus and background including a power compression .
3. Interpretation in terms of the Weber-Fechner law
It will be shown that the MM conversion curve preserves near its midrange the Weber-Fechner law.
CIE Session 2019 – Abstract Booklet
289
4. Modelling the semi-saturation constant in terms of the adaptive field
A number of applications in which the semi saturation constant is modelled in terms of the luminance of the adaptive field (such as in CIECAM02) will be discussed.
5. Merging chromatic adaptation and luminance adaptation
CAM16 offers a nice opportunity to model chromatic adaptation in terms of a channel selective semi saturation constant which depends on the chromaticity of test white and reference white.
6. Microscopic versus macroscopic application level
In most colour appearance models, the application of the MM formula is done on a macroscopic level: represents an average "cone" excitation of the stimulus considered as a
whole, the semi-saturation constant is considered to be dependent on the (uniform) background. However, the MM formula can be applied to model individual cone and neuron responses where represents the central stimulus while is determined by the output of
the receptive field surrounding the central stimulus in terms of a weighted mean of red, green and blue sensitive cones. In this way, the MM formula can be considered as an alternative to a difference of Gaussian model and this concept might cover the Helmholtz-Kohlrausch effect at cone level. We believe this could be an important step regarding the development of a physiological inspired image colour appearance model
3. Conclusions
In conclusion, it will be shown that the MM formula allows for a number of interpretations which increase the understanding of both adaptation and contrast. The modelling of the semi saturation value on macroscopic and microscopic level will be discussed. This opens some opportunities to develop an image based colour appearance model inspired by retinal neural networks.
CIE Session 2019 – Abstract Booklet
290

PO009
EVALUATING BRIGHTNESS AND GLARE PERCEPTION OF SELF-LUMINOUS STIMULI.
Stijn Hermans1, Kevin Smet1, Peter Hanselaer1
1 ESAT/Light&Lighting Laboratory, KU Leuven, Ghent, BELGIUM
Abstract
1. Motivation, specific objective
The fundamental goal of Colour Appearance Models (CAM) is to look for correlates between the measured optical spectral data of both the stimulus and its surrounding and the corresponding perceptual attributes, such as Brightness, Colourfulness and Hue (absolute colour attributes) and Lightness, Chroma and Saturation (relative colour attributes).
Very recently a new colour appearance model, CAM18sl, has been developed for the evaluation of self-luminous stimuli surrounded by a self-luminous neutral background. Modelling these kind of stimuli becomes very important when dealing with issues such as the brightness of LEDs, OLEDs, mobile phones, luminaires, and advertisement bill boards at different times of the day.
Light sources can also cause glare and visual discomfort. CIE defined discomfort glare as: “glare that causes discomfort without necessarily impairing the vision of objects”. In 1995, the CIE proposed the Unified Glare Rating (UGR) for the assessment of discomfort glare in interior lighting. In this UGR formula, the luminance levels of the light sources and background are included; together with the solid angle and the Guth position index of each source. In this paper, the application of CAM18sl is discussed and it is investigated if brightness perception as predicted by CAM18sl can be correlated to the UGR value.
2. Methods
The observer data and the spectral radiance data used for the development of CAM18sl was gathered in as specific designed experimental room (3 m x 5 m x 4 m). The walls are covered by black curtains, there is a black carpet on the floor and the ceiling is grey. One wall (5 m x 4 m) has been modified so that it is self-luminous. It is composed of a large diffusor illuminated from the back by a series of dimmable fluorescent tubes. A circular test stimulus with diameter D = 0.35 m is created in the centre of the wall by a RGB-LED light source encased in a cylindrical tube placed behind the diffusor.
Observers were seated in front of the wall at a distance such that the stimulus has a field-of-view of 10°. The neutral self-luminous wall itself has a field-of-view exceeding 70°. Both the background and the stimulus were optically characterized using a telescopic measuring head coupled to a spectroradiometer. The uniformity of the wall and the stimulus was within 10% of the mean. Magnitude estimation experiments were performed to investigate the brightness, hue and amount of neutral perception of the stimulus when presented with a particular background. In total, 305 scenes of neutral and coloured stimuli combined with neutral backgrounds, both covering a wide luminance range, were evaluated.
To compare the brightness scale of CAM18sl with the CIE UGR formula, a spectral equal-energy white light and uniform luminaire (with a field of view of 2° and 10°) was modelled. The luminance level of the luminaire varied from 0 to 1500 cd/m2 with a step size of 100 cd/m2. The average background luminance level varied between 0 and 100 cd/m2 with a step size of 10 cd/m2. The assumption was made that an observer would look directly, head on, into the light source.
3. Results
Concerning brightness, it is clear that the brightness of stimuli increases with their luminance if the luminance level of the background is kept constant. However, stimuli with the same luminance value, but more saturated in colour are also perceived brighter. This effect is called the Helmholtz-Kohlraush effect and has already been successfully modelled by the CAM15u model for unrelated stimuli. Also, the average brightness perception of a fixed stimulus decreases when the background luminance increases.
CIE Session 2019 – Abstract Booklet
291

Based on this set of data, CAM18sl, a new colour appearance model for self-luminous stimuli, was developed. It combines the approach used in CAM15u (coloured stimuli and a dark background) with the successful implementation of the effect of the background on the brightness by using the Michaelis-Menten compression and adaptation formula. The input of CAM18sl is limited to the absolute spectral radiance of the stimulus and background. The brightness scale of CAM18sl is expressed in "bright". One bright corresponds to the apparent brightness of a 10° spectral equal-energy self-luminous stimulus having a CIE 1964 10° luminance of 100 cd/m2 and surrounded by a dark background.
CAM18sl has been applied to the virtual luminaire and background and the brightness has been calculated for each combination. In the same way, the UGR for direct view has been calculated too. Comparing both values has revealed a very high correlation (coefficient of determination R2 = 0.99).
4. Conclusions
Recently, a colour appearance model for self-luminous stimuli surrounded by neutral luminous backgrounds, called CAM18sl, has been developed. It has been investigated if the absolute brightness (in "bright") predicted by the model is correlated to the CIE UGR index for uniform luminaires at direct view. A very high coefficient of determination (R2 = 0.99) has been found, showing that the CAM18sl brightness perception is strongly linked to the UGR scale for a wide range of the luminance of both luminaire and background (at least for uniform luminaires). It also illustrates the wide application domain of CAM18sl.
CIE Session 2019 – Abstract Booklet
292

PO010
DEVELOPENT FOR THE OPTIMUM DISPLAY COLOURS ON ROAD INFORMATION BOARDS WITH CONSIDERATION FOR COLOUR VISION BARRIER FREE
Hidaka, E.1, Yoshimoto, N.1, Nishino, S.1, Akeno, K.1, Kawakami, Y.1, Sagane, Y.2, Kawase, S.2
1 Honshu-Shikoku Bridge Expressway Company Limited, JAPAN, 2 Association of Electricity and Telecommunication Engineering for Land and Infrastructure, JAPAN
1. Objectives
Three colours, red, orange and green are usually used on road information boards. Red is used for important events such as emergency and road closures, orange is used for alerts concerning weather and traffic congestion, and green is used to highlight instructions such as traffic safety campaign.
Road information boards that can display seven colours are getting popular. These are red, orange, yellow, yellow-green, green, light blue and white.
According to the previous studies, it was reported that white is easy to see for both colour vision normal person and colour vision impaired person under any weather conditions, and also, that red is difficult to see for colour vision impaired persons.
We conducted two series of experiments. First experiments were to evaluate the visibility of the coloured character to prove the visibility of white colour in order to the most effectively provide road information by using the road information board that can display 7 colours. Second experiments were to evaluate the visibility improvement of the character with background colour such as red, orange and green in order to improve the visibility, and the efficacy as a new barrier-free colour visibility measure was verified while ensuring consistency with events and taking into account the current situation where red is used for important events in actual operation.
2. Methods
Using small LED display board as a virtual road information board, in an environmental simulated facility comprising a glass greenhouse that can simulate the normal and thick fog weather conditions, "character colour evaluation" and "character with background colour evaluation" were conducted. The licensed drivers between ages 20 and 60 (vision acuity of 0.7 or more in both eyes) attended the experiments. Since visibility range of less than 50m in fog is the criterion for road closure, the small LED display board was placed in the facility simulating 50m visibility range. For verification of barrier-free colour visibility measures, an observation was performed using a spectacle type colour weak simulation filter which simulates the perception of colour vision impaired persons. A Chinese character meaning “time” was used on the boards during the experiments.
Experiment 1: For character colour evaluation experiment, a different colour for "time" was displayed on the left side and on the right side of the small LED board in the facility in order to perform pairwise comparison.
Experiment 2: For evaluation of the characters with background colours, background colours of red, orange, green, and black were imposed behind a white character or yellow character, and experiment participants saw the Chinese character with a different background colour displayed on the left side and the right side. In addition, border font and non-border font were used for these characters in the experiment.
In both experiments, evaluation was resulted in five categories: (1) left side is good, (2) left side is slightly good, (3) cannot judge, (4) right side is slightly good, (5) right side is good.
In this experiments, the daylight standard display luminance (cd/m2) for each display colour on the small LED board was the followings red: 1,600, orange: 2,900, yellow: 3,800, yellow green: 2,200, green: 2,200, light blue: 2,700, white: 4,300.
3. Results
Experiment 1: For evaluation of character colour experiment, white, yellow and green of 7 colours were the most prominent in visibility under the normal condition by colour vision impaired person, but in heavy fog the difference among the colours was small. This indicates that there is not much
CIE Session 2019 – Abstract Booklet
293

difference in character visibility in thick fog, and we can infer that there is not a problem in setting the character colour to white which has the highest display luminance.
Experiment 2: For evaluation of the characters with background colours experiment, white non-border character with green background colour resulted in the highest evaluation. Evaluation of white character with red or orange background is better than black background. Especially, white character with red background was recognized by colour vision impaired person and was confirmed to improve the visibility.
4. Conclusions
The following findings were obtained from the experiments. For each weather condition, white is the optimal display colour for colour vision normal person and colour vision impaired person. In addition, characters with colour backgrounds positioned as a new barrier-free colour measure was confirmed as having a positive impact on visual recognition of colour vision impaired persons for providing road information on warnings and cautions. We obtained results that contribute to improvement of visibility and safety for drivers, taking into account the impact of colour vision variation on visibility,
CIE Session 2019 – Abstract Booklet
294

PO011
COLOUR APPEARANCE MATCH UNDER TWO LIGHTINGS HAVING DIFFERENT LUMINANCE LEVELS
Hong, Y.1, Kwak, Y.1, Lee, D.2, Hwang, J.2* 1 Ulsan National Institute of Science and Technology, Ulsan, SOUTH KOREA,
2 Korea Research Institute of Standards and Science, Daejeon, SOUTH KOREA
Abstract
1. Motivation, specific objective
Color appearances of the objects are changing, depending on light sources. In everyday life, it is common to see a scene having two or more light sources together, or to look at an object that is shadowed by other objects. However, these situations cannot be interpreted by current colour appearance models, which are based on a single illuminant. Thus, colour appearance research that can explain these multi illumination situations is necessary. In this research, it is intended to explain the situation where observers alternately see two light sources having largely different luminance levels being present at the same time. An example for this context is, when a car enters a tunnel and then exits the tunnel, an observer often alternately sees between a bright light and a dark light. In this study, through the appearance matching - between reference colour patch under low luminance lighting and test colour patches under high luminance lighting - experiment, colour appearance phenomenon will be analysed in that context.
2. Methods
In the colour appearance matching experiment, two LED booths having high luminance level (6000 K, 5000 cd/m2) and low luminance level (6000 K, 100 cd/m2) were used. The colour patches used in the experiments had been extracted from the NCS colour chart. The CIE L*a*b* values of all colours belonging to the red series (Y90R, R, R10B), yellow series (Y10R, Y, G90Y), green series (G10Y, G, B90G), and blue series (B10G, B, R90B) were measured by a spectrophotometer (CM-2600d, Minolta). Since there would be a comparison among colour pathces under the two lightings with different luminance, it was decided to select the experimental stimuli based on L * values. The reference colour patches to be placed under low luminance lighting were selected among those with L* values between 70 and 80, while the test colour patches to be placed under high luminance lighting were selected in L* value 60 – 80 range. At last, 4 colour patches for each hue were selected as the reference colour patches and 20 to 30 colour patches were chosen for the test colour patches. The reference colour patches of each hue were also included in the test colour group.
Eight participants with normal colour vision took part in the experiment. In a dark room, participants adapted to the experimental environment for five minutes. It had been advised that participants look around the experimental environment so that they would not be adapted to a specific lighting. In the experimental session, participants were asked to select a colour patch placed under high luminance lighting that appeared to be the same with the reference colour patch under low luminance lighting for a series of red, yellow, green and blue colour patches.
3. Results
Matched colour patches for each reference colour patch in each hue were averaged respectively in terms of their CIE XYZ and CIE L*a*b* values. The differences in CIE XYZ values (or in CIE L*a*b* values) between the reference patch and the matched test patch were taken for the analysis. Additionally, the uncertainty was taken into account with regard to the factors that might have caused errors in the experimental result, such as inter-subject variability; chromaticity difference between the reference lighting and the test lighting; and colour difference between the nearest pair of the test colour patches in NCS colour chart.
As a result, most of the matched colour patches under high luminance lighting have higher CIELAB C* values and show small hue changes in CIELAB space, compared to those of the reference patches under low luminance lighting.
CIE Session 2019 – Abstract Booklet
295

Experimental results indicate, as for red hue, colour samples looked reddish (bluish) and less colourful under high luminance lighting, while looked yellowish under low luminance lighting. Regarding yellow hue, it appeared to be bluish (decrement in yellowness) and less colourful under high luminance lighting. Green colour seemed to be bluish under high luminance lighting, while they were to be more greenish (yellowish) under low luminance lighting. In the case of blue, colour samples appeared to be greenish (yellowish) and somewhat less colourful under high luminance lighting, whereas they looked bluish under low luminance lighting.
According to the Hunt effect, the higher the brightness of the colour is, the higher the colourfulness becomes. However, the opposite behaviour of colourfulness decrease under higher brightness was observed. The observation is discussed in terms of incomplete adaptation and observers’ eye movement between very bright illuminant and dark illuminant. The colour patch looked relatively white and fuzzy due to an abrupt eye movement between two illuminants with large difference of luminance, which might be responsible to the decrease of colourfulness under higher luminance.
4. Conclusions
The colour appearance matching experiment was conducted when observers alternately saw bright lighting and dim lighting being present at the same time in this research.
In general, most of the colours across hue domain appeared to be rather less colourful under high luminance lighting, contradicting the Hunt effect, and also hue shifts were observed. Further intensive colour appearance experiment is needed to evaluate the colour appearance under multi illuminants viewing conditions.
CIE Session 2019 – Abstract Booklet
296
PO012
TRICHROMATIC AND DICHROMATIC COLORIMETRIC ANALYSIS OF THE FARNSWORTH-MUNSELL D-15 COLOUR VISION TEST
Hovis, J.K.1, Almustanyir, A.2 1 School of Optometry and Vision Science, University of Waterloo, Waterloo, ON, CANADA.
2 Department of Optometry Science, King Saud University, Riyadh, Kingdom of SAUDI ARABIA
Introduction
Several programs are available to simulate dichromatic colour vision using digital images. Although the programs provide reasonable qualitative renderings of dichromatic colour perception, we were interested to determine whether an algorithm could provide quantitative predictions using the Farnsworth-Munsell D-15 Color Vision Test (D15) as the colour-related task. The D15 is frequently used to determine whether an applicant, who has a colour vision defect, has the adequate colour vision discrimination to perform a job safely and efficiently. That is, the D15 is a test of adequate versus poor colour vision discrimination.
Methods
The colorimetric properties of the D15 were measured using PR-670 Spectroradiometer (Photo Research, Syracuse, NY). An Illuminant C fluorescent lamp illuminated the caps. The illuminance on the caps was 1400 lx (±5%). The distance from the photometer to the caps was approximately 75 cm with the photometer located 45o form the normal of the caps. The measurement aperture was 0.5o and the measurement speed was set to normal. The final values were an average of 3 separate measurements, with each measurement an average of 3 readings.
The colour differences between the colour caps were calculated using the CIE L*a*b* chromaticity space for normal and red-green dichromat colour vision. The dichromat colour differences were calculated based on the Brettel et al. [J Opt Soc Am (A) 1997;14:2647-55] algorithm. Briefly, the colour-normal tristimulus values were transformed to L, M, and S-cone responses. Next, the colour-normal cone responses were converted into deuteranopic and protanopic cone responses. These cone responses were then used to calculate the dichromat tristimulus values and finally the dichromat L*a*b* colour difference.
The ΔEs for all possible comparisons were used to predict the possible arrangement of the D15 caps based on the minimum ΔEs between adjacent caps. Nevertheless, it is possible that a cap with a slightly larger ΔE will be a viable option because a larger ΔE could still be below a dichromat’s threshold. For this reason, additional predictions were carried out for these situations when the next cap had a ΔE greater than the minimum, but less than 6. Subsequent caps were placed based on minimum ΔE. The value of 6 was selected after calculating the average difference between adjacent lines of confusion in dichromat space for the D15 test.
The predicted arrangements were compared with the results from 60 subject with normal colour vision, 7 deuteranopes and 19 protanopes. The comparisons were based on both visual assessment of the score sheet and the Color Difference Vector Program (CDV) parameters (Vingrys & King Smith, 1988).
Results
The predicted order for the colour-normals was a perfect arrangement of the caps. Ninety-two percent of the CVN had a perfect arrangement. The remaining 8% had only a single transposition. The average of 63 predicted arrangements for the protanope and 384 predicted arrangements for deuteranopes were compared with the subject’s results. In general, the mean values based on the predictions were close to, and overlapped with, the actual dichromat results for the number of crossings, transpositions, and the three CDV parameters of C-index, S-index and angle. Although, the ranges of the predicted angles overlapped with the deuteranopic results, the mean predicted angle and angle using the minimum ΔE criteria were slightly more negative than the subjects’ results. The mean predicted S-indices for both deuteranope and protanope were slightly lower than the dichromat results, within the range of the actual results.
CIE Session 2019 – Abstract Booklet
297
Conclusions
Transformations that provide a qualitative rendering of red-green dichromatic vision may be used to make quantitative predictions. The transformation of the D15 cap colours into dichromatic L*a*b* space provided predictions that were very similar to the actual dichromat arrangements. Although the predicted arrangements using the minimum ∆E between adjacent caps were within the range of the actual dichromat arrangements, they were not always as good as the mean values when other possible arrangements were considered. Allowing alternative arrangements when two caps may be within 1 JND, obviously increased the number of possible arrangements, but it also provided a better fit to the average data and an estimate of the possible variability in actual arrangements. Our model suggests that 1 JND in dichromat space corresponds to a dichromat ΔE of greater than 6 in the respective red-green dichromat colour space, at least for tasks similar to the D15’s. Although, a ΔE of 2.2 is considered to be a 1 JND in colour-normal L*a*b* space, 10% of the colour-normals may require a ΔE of at least 4.7 based on the D15 results.
CIE Session 2019 – Abstract Booklet
298

PO013
THE IMPACT OF GENDER AND OBJECT COLOUR ON THE PREFERRED COMBINATION OF ILLUMINANCE AND COLOUR TEMPERATURE
Huang, Z.1, Liu, Q.1, 2, Liu, Y.1, Wu, B.3, Lin, H.1 and Wang, W.1
1 School of Printing and Packaging, Wuhan University, Wuhan, CHINA 2 Shenzhen Research Institute, Wuhan University, Shenzhen, CHINA
3 Guangdong JG Lighting Technology Co., Ltd, Dongguan, CHINA
Abstract
1. Motivation, specific objective
Correlated colour temperature (CCT) and illuminance are widely acknowledged as two crucial influencing factors for colour preference of lighting. At current stage, most psychophysical studies in this field were carried out with constant illuminance. Meanwhile, some researchers have been focusing on the interaction between CCT and illuminance to further investigate how human colour preference varies with lighting conditions.
It should be noted that the existing research results are far from consistency. The authors believe that one of the important reasons for such an inconsistency is subject to the different characteristic of experimental objects. Therefore, a psychophysical experiment that contained six monochrome ornaments and three levels of CCT as well as illuminance was designed to explore the effects of CCT, illuminance and object colour on lighting preference.
At the same time, we also hold the opinion that the inconsistency of different research is still influenced by the design of experimental process. In order to obtain more robust conclusions, several related studies were involved in a comparative analysis.
2. Methods
In this work, 20 students (10 males and 10 females) with normal colour vision were invited to make their visual appreciation of six bird ornaments with monochrome colour (i.e. white, black, red, green, blue and yellow). The experiment included nine light settings organized as a 3 × 3 factorial design, in terms of three levels of vertical illuminance (that is, 50, 200 and 600 lx) and three levels of CCT (that is, 3500 K, 5000 K and 6500 K). The lighting sources adopted in this work all have high colour rendering indexes (CRIs ≥ 90) and their chromaticities lie on the blackbody locus (that is, Duv ≈ 0).
In addition, since it requires longer time of adaptation from a high to a low illuminance level, observers always completed the evaluations under the lighting conditions of 50 lx, and then the conditions of 200 lx, and finally the conditions of 600 lx. The order of the three CCT levels and six birds were all randomized for each observer.
3. Results
The experimental results show that the CCT and illuminance both have significant impact on the appreciation of viewing the 3D monochrome birds. The preference rating of the six birds increase when illuminance and CCT rise, which partially agrees with the Kruithof rule. Besides, strong gender difference was observed in this study. It is found that the colour vision of females is more sensitive under low CCTs while that of males is better at high CCTs.
By comparing with other related research, it is found that the colour characteristics of objects have an obvious influence on the lighting preferences. In addition, it is quite likely that oversaturation or excessive whiteness perception may impair colour preference. Moreover, since different experimental design may result in different visual perception and thus leads to different conclusions, the authors recommend a meta-analysis approach for this topic.
4. Conclusions
In this contribution, the interactive influence among CCT, illuminance and object upon the colour preference of lighting was investigated. It was found that the illuminance and CCT had great overall impact on viewing monochrome objects. The characteristics of objects and gender difference were
CIE Session 2019 – Abstract Booklet
299

revealed to be important factors influencing the preference towards the combination of illuminance and CCT.
CIE Session 2019 – Abstract Booklet
300

PO014
COLOUR DIFFERENCE DISCRIMINATIONS OF YOUNG AND OLD OBSERVERS BASED ON DIFFERENT DISPLAYS
Min Huang1, Chun Li Guo1, Yonghui Xi1, Ruili He1 Beijing Institute of Graphic Communication, Beijing, CHINA
Abstract
1. Motivation, specific objective
The observers with normal colour vision will have different colour perceptions when they see the same colour stimuli, because of the different spectral responses of their cone fundamentals. The colour differences will be enlarged when the colour pairs were composed of different narrowband primary colours, which we called metameric colour samples.
2. Methods
In order to investigate the influences of the displays with different spectral primaries on the observers’ colour discrimination, two displays (iPad and Qauto-220ex) with different RGB spectral primaries were selected and CIE recommended 5 colours (gray, red, yellow, green, blue) were presented on the iPad display as the target colours. 30 young (aged from 20 to 27) and 17 old observers (aged from 61 to 74) were organized to carry out the colour matching experiments. The spectral radiative power distributions of the target colours and matched colours on the two displays were measured by the Photo Research 655 after the observers finished the experiments.
3. Results
The results indicated that colorimetric values obtained from the observers of different ages are quite different, which have different distributions when plotted on a*b* and L*C* plane. Moreover, the old observers have larger colour difference thresholds than those of young observers from the colour difference discrimination ellipses plotted on CIELAB a*b* plane.
4. Conclusions
The differences between young and old observers were revealed by the metameric colour pairs and detailed information of the spectral responses of their cone fundamentals can be concluded from the experimental data.
CIE Session 2019 – Abstract Booklet
301

PO015
STUDY ON THE RELATIONSHIP BETWEEN PREFERRED ILLUMINANCE AND CORRELATED COLOUR TEMPERATURE OF LED LIGHTING FOR VISUALLY
CHALLENGED PEOPLE
Iwata, M. Faculty of Science and Engineering, Setsunan University, Osaka, JAPAN
1.Introduction
Diverse activities, including gathering with the family, listening to music, enjoying tea or alcoholic beverages and more, take place in the living room of a house. It is required to appropriately provide pleasant visual environments including visibility of colours and details of related objects for respective activities. While dimmable and colour adjustable LED lighting has become popular and has been actively introduced in residential buildings in recent years, very few researches on dimmable and colour adjustable LED lighting have been conducted so far.
This research aims to clarify the relationship between the preferred illuminance and correlated colour temperature for activities of gathering and reading by conducting subjective experiments using dimmable and colour adjustable LED lighting in an experiment room set up in such a way that it resembles a living room.
2.Experiments
2-1 Experiment room
We set up a 3.0 m (depth) x 3.0m (width) x 2.3m (height) experiment room resembling a living room in the dark room. The walls and ceiling were covered with white paper and the floor was covered with wood-patterned tile floor mats. Gray (N5) sofas and a brown (7.5YR5/6) table for family gathering were placed in the center of the room. Indoor plants, newspaper, and a comic book were placed on the table.
Dimmable and colour adjustable LED lighting was installed on the ceiling and the illuminance and correlated colour temperature were measured at the center of the table.
2-2 Evaluation method
We asked each subject to use a colour-adjusting remote controller of the ceiling-mounted LED lighting to set his/her preferred brightness and light colour for respective activities of "family gathering" and "reading (newspaper/comic book)". At the same time, the illuminance and correlated colour temperature were measured at a spot on the table under the lighting.
2-3 Subject
The subjects were 16 male and female students in their 20's (hereafter referred to as "YG") and 31 visually challenged persons (hereafter referred to as "LV").
3. Results and Summary
3-1 Family gathering
For family gathering, the average values for YG's preferred illuminances and correlated colour temperatures were 248.4lx for the illuminance and 3855K for the correlated colour temperature. These evaluated values were mostly situated within the pleasant zone indicated by Kruithof, while slightly shifted toward the low colour temperature and low illuminance. On the other hand, a part of evaluated values was situated in the unpleasant zone toward the low illuminance. The average values for LV's preferred illuminances and correlated colour temperatures were 288.9lx for the illuminance and 4033K for the correlated colour temperature. In terms of family gathering, there were almost no differences between YG and LV in both the illuminance and the correlated colour temperature.
3-2 Reading
For reading, the average values for YG's preferred illuminances and correlated colour temperatures were 300.9lx for the illuminance and 5048K for the correlated colour temperature. While some of these
CIE Session 2019 – Abstract Booklet
302
evaluated values were situated within the pleasant zone indicated by Kruithof, most of the evaluated values were located in the unpleasant zone toward the high colour temperature and low illuminance. The results clearly indicate that Kruithof's curve does not coincide with the evaluated values for reading. The average values for LV's preferred illuminance and correlated colour temperature were 364.6lx for the illuminance and 4510K for the correlated colour temperature. The font size of the characters in texts used in LV's evaluation of reading varied individually because different font sizes were used according to the legible font size for each subject. The results indicated that LV prefers a slightly higher illuminance and correlated colour temperature than YG.
CIE Session 2019 – Abstract Booklet
303
PO016
PEDESTRIANS TEND TO LOOK AT SCENES WITH HIGHER LUMINANCE AND GREATER SALIENCY AT NIGHT
Jiang, Xin, Yang, Biao School of Architecture, Harbin Institute of Technology(Shenzhen), Shenzhen, CHINA
Abstract
1. Introduction
The use of eye-tracking technology in lighting research enable better understanding of visual behaviour. Past studies have investigated the visual behaviours and visual needs of various groups of lighting users, including drivers, pedestrians, customers, pilots, etc. Among those studies, visual fixation is regarded as one of the best indicators that can reveal the visual information acquired by the subjects.
Visual environment should provide what people need to fixate and like to fixate. Fixation can be used as a predictor of the quality of lighting environment. For a visual environment, the distribution of luminance and saliency are two possible main factors that extract visual attention – represented by fixation.
The main objective is to study whether luminance and saliency affect the visual fixation of pedestrians at night. The preliminary hypothesis is that pedestrians tend to look at scenes and areas with higher luminance and greater saliency. In this paper, a field experiment using mobile eye tracking glasses device (ETG) was carried out in street, for that natural visual behaviour is more expected to be found in real-life scene, comparing with in virtual visual stimuli such as image or video presented on computer screen.
2. Methods
Four commercial streets were selected as experimental sites, which had relatively complex light environment and rich visual information after dark. At each street, four pedestrians (two males and two females) wore ETG and walked freely for about ten minutes respectively at night. Data of 16 pedestrians were gained in total so as to compare them in different sites and different people. Pedestrians under test needed to have good visual acuity and normal psychological state. Before every experiment, the ETG was recalibrated using near infrared pupil measurement and 3-point-calibration method to ensure a precise experimental result. The ETG took videos of what the pedestrians saw and recorded fixations during experimental time.
After experiment, videos and images were processed by Python. Every frame of the video was saved as a digital image. The video framerate was 24 frames per second so each video was saved to about 15000 frames. The central frame among the frames during which fixations happened according to the data given by the ETG were picked out as target images. The target images were converted from colour to grayscale. The level of 8-bit grayscale of the pixel/area was defined as relative luminance of that pixel/area. This won’t distort the expected results, for that the relative luminance will only be
compared within the same target image. Resolution of each image was 1280960, and luminance of each pixel was computed to get an average luminance of each target image. Luminance of the fixation points in all target images were obtained by calculating the average luminance of the circular area around the fixation point, making results more precise. The radius of the area was 20px and 100px, corresponding to visual angles of 2 and 10 degrees after calculation. Average luminance of fixation areas and average luminance of all corresponding target images were compared to get a result.
Till now, 6 pedestrians have finished their experiments and the analyses of luminance have been done. The analysis of saliency is in process and the methods are similar to above.
3. Results
For every pedestrian, the distributions of average luminance of fixation areas of all target images (radius=20px&100px) are clearly higher than those of the average luminance of all whole target images. A paired t test of these two groups of data was made and the significance level was close to
CIE Session 2019 – Abstract Booklet
304

0.000 so there was a significant difference between them. This phenomenon tells us pedestrians indeed have a trend of looking at a brighter area.
To confirm the above finding, the average luminance of fixation areas in each target image was calculated with extra radius of 5px, 10px, 15px, 30px, 40px, 50px, 60px, 70px, 80px, 90px on top of 20px and 100px. The average luminance of this sequence decreases as the radius of the fixation area increasing. This trend implies that the central vision plays the dominant role in this phenomenon.
4. Conclusions
This research focuses on influencing factors of visual fixation and find out that pedestrians tend to look at scenes with higher luminance at night. Greater sample and further analysis on saliency and other factors are still in need. The result of this study should be able to promote visual-behaviour analyses and prediction which lead to the improvement of human-centred lighting environment design.
CIE Session 2019 – Abstract Booklet
305

PO017
KANSEI EVALUATION OF THE RED OBJECT IMAGES USING DIFFERENT RED PRIMARIES
Kageyama, S., Inuzuka, Y., Ishikawa, T., Ayama, M. Graduate School of Engineering, Utsunomiya University, Utsunomiya, JAPAN
Abstract
1. Motivation, specific objective
In display quality comparison, gamut area has been employed as one of the important specifications. It is true that the wider the colour gamut is, the higher the colour reproduction capability is. For colour reproduction of display, however, what has been required by ordinary observers the most is not a colour fidelity but a colour production with comfortableness, preference, or impressiveness. These are called KANSEI properties, and their quantitative evaluation is gathering attention in various fields to put additional values to new products.
KANSEI is a Japanese word meaning a mental sense of subjectivity, being a higher order function of the human brain. KANSEI properties are usually measured by subjective evaluation experiment using adjective words such as “preferable”, “comfortable”, and/or “impressive”, etc..
Technology to widen colour-gamut has progressed immensely in these 10 years, and resulted super-wide colour gamut displays in everyday life. Display of mobile phone has DCI-P3 gamut that has few has 25% larger than sRGB area. However, colour images in a laser display or high quality display are sometimes encountered with criticism of that the colour is too strong or unnatural. In the history of image technology, sRGB compliant display has been lasted relatively long time, and observers might adapt to colour reproduction in a sRGB display. Furthermore, very recent study showed that reddish colours in a laser display appeared less saturated than those in a LCD [Yaguchi et al. 2018]. Reason is unknown at the present. Despite these problems, few has been reported on KANSEI evaluation of colour images presented in different colour gamut wider than the sRGB (BT709).
We have conducted a series of experiments on KANSEI evaluation of colour images presented on different gamuts [Ayama et al. 2016, Inuzuka et al. 2017]. The next is the red turn. Therefore, objective of this study is to investigate the effect of the gamut expansion in the long-wavelength region on KANSEI evaluation of colour images. In other words, to seek the most proper colour gamut for red colour image presentation.
2. Methods
Two sets of 15 colour images that were made for sRGB, were used as test stimuli of Group1 and Group2. In addition to them, 7 images selected from the ITE Ultra-high definition/wide-colour-gamut (UHD/WCG) standard test images were employed as the test stimuli of Group3.
Two projectors (P1 and P2) were used to present test images. P1 is for the green and blue primaries
of sRGB, and another one is for variable red primaries. For P2, interference filter (IF) of λp = 610nm,
620nm, 630nm, and 640nm were inserted in front of the projector to achieve different red primaries. White point was set nearly the same by inserting appropriate ND filters in front of the two projectors. Two PCs were used to send G&B signals to P1, and R signals to P2, respectively. They were controlled synchronously to present test images. Images from P1 and P2 were very carefully superimposed on the screen.
Five adjective pair, “Deep colour vs Pale colour”, “Beautiful vs Dirty”, “Like vs Dislike”, “Impressive vs Mundane”, and “Natural vs Unnatural”, were selected based on previous studies. Observers were asked to evaluate each test image for each adjective pair by marking proper position on seven point scale (-3 to 3) between the bipolar. Observers were 10 males and 10 females with normal colour vision.
3. Results
Significant difference of rating score was found in the test images including reddish objects, such as tomatoes or apples etc.. Results of sRGB images (Group1 and Group2), rating scores of “deep colour
CIE Session 2019 – Abstract Booklet
306

vs pale colour” and “Impressive vs Mundane”, increased with the wavelength of the red primary. The longer wavelength primaries, 630nm and 640nm, indicated higher rating scores. Contrary to that, result of “natural vs natural”, the rating score decreased in the longer the wavelength primaries. Significant difference was found among 4 wavelength condition for all images. In the results of “Beautiful vs Dirty” and “Like vs Dislike”, no significant difference was found among different red primary conditions. These results indicate that the expansion of the colour gamut toward longer wavelength region is effective to have observers feel the images “Deep colour” and “Impressive”, but non-effective for “Natural” feeling. Result of UHD/WCG images of Group3, generally, similar tendency to the Group1 and Group2 was observed. Images were evaluated as deep colour, impressive and unnatural as the wavelength of the red primary becomes longer. Results of the test image, Flower, showed this tendency most clearly.
Luminance and chromaticity coodinates of sRGB images on the screen were measured using 2D colorimeter (CA-2500). Those of reddish portions of UHD/WCG images were measured using spectroradiometer (CS-2000). As the number of pixels of larger value of C* increases, the rating scores of KANSEI evaluation become higher, except “Natural vs Unnatural”.
4. Conclusions
As the colour gamut expands to the long wavelength region, colour images were evaluated as deeper colour and more impressive, while they were assessed as more unnatural for all of the sRGB images including red objects, and the flower in the UHD/WCG images. Our results suggest that ultra-wide colour gamut is better for deep colour and impressive feeling, but when naturalness is important, conventional gamut is satisfiable.
CIE Session 2019 – Abstract Booklet
307
PO018
EFFECT OF DIRECT GLARE OF LED FLOODLIGHT ON CATCHING A MOVING OBJECT
Kamei, M.1, Yamada, T.2, Kohko, S.2, Ishikawa, T.1, Ayama, M.1 1 University of Utsunomiya, Tochigi, JAPAN, 2 Iwasaki Electric Co. Ltd., Saitama, JAPAN
Abstract
1. Motivation, specific objective
In recent years, development LED floodlights for large stadiums is progressing and they have been already introduced in some baseball stadiums, soccer stadiums, and gymnasiums. LED has many advantages such as high energy-efficiency, long life-time, and no-overheating, etc., while glare is one of the disadvantages. LED floodlights are of course designed and installed not to produce disability and/or discomfort glare that hinder players, but still sometimes complains are raised by athletes that light is too dazzling when they happened to view directly. In baseball game, for example, complaints have been expressed by professional players that they could not catch the ball because they missed it due to strong glare often in the case of fly. It is well known that radiant angle of LED device is not wide as that of conventional floodlights such as HID lighting that radiates light in all directions. To qualify the illuminance regulations for stadium lighting, LED floodlight shows very high luminance to some directions and it might cause disability and discomfort glare. However, few have been reported that how and to what degree the luminance of LED floodlight disrupt visual functions in the viewing conditions that can be applicable to sports scene.
Objective of the study is to explore the effect of LED floodlight luminance on visual function and visual task relating to glare in direct vision. Direct here means the light source is seen in foveal vision. Two experiments were carried out. The first one was to measure the temporal properties of the glare caused by high luminance LED, such as visual acuity recovery time, and afterimage duration. Relation to subjective evaluation of glare was also investigated. The second one was to measure the luminance to fail a target capturing performance to simulate a fly catch of a baseball game at an outdoor and indoor stadiums.
2. Methods
Visual target was presented on the display that was placed on the direct line from observer’s eyes. The white LED installed in stadiums were used as the glare light that was placed orthogonally to the above line and the source image was superimposed on the visual target using a half mirror. This setting was common to the experiments 1 and 2.
2.1 Exp.1: Effect on temporal properties and glare evaluation
Recovery time of visual acuity using Landolt ring, duration of afterimage of the glare, and subjective evaluation of discomfort glare using 2 different rating scales were measured under 4 luminance levels of glare light, from 0.25 to 2.0 x 10⁶ cd/m2, and 2 durations of glare light with 0.2 and 0.5sec.
2.2 Exp.2: Effect on catching a moving object
Stimuli of vertically moving object imitating three kinds of fly balls with different heights were prepared. The ball went up from the bottom of the display and came down from some height in the display, varying the speed and the size just like a liner, middle-fly, or fly. We call them “high”, “middle” and “low”. Catch area for each of the fly balls was indicated in the movie with the upper and lower horizontal lines. Observers were asked to push some key when the ball was in the catch range. Luminance of the ball was 90 cd/m², that of the background was 5 and 20 cd/m² simulating outdoor and indoor stadium, respectively. The glare light was presented 0.5 s in a proper timing during the movie. Seven luminance levels were employed from 0 to 1.2 x 10⁶ d/m2.
3. Results
3.1 Exp.1
All results increase as luminance and duration. Under the maximum condition of 2.0 x 10⁶ cd/m2 with 0.5 sec presentation, it took 7 sec to recover visual acuity, after image continued about 140 sec, and subjective evaluation was “very uncomfortable”. Even under the minimum condition of 0.25 x 10⁶ cd/m2
CIE Session 2019 – Abstract Booklet
308

with 0.2 sec presentation, recovering time of visual acuity was around 2 sec, after image continuation was 60 sec, and subjective rating corresponds to “bothersome”.
3.2 Exp.2
The correct answer rate of the catch was defined as that the observer could respond in the frames of the movie when the ball is fully or partially in the of the catch area. In the “low” condition, the correct answer rate was lower in the lower background (simulation of outdoor stadium), and decreased as the increase of the luminance of glare light in both background conditions.
Time difference of observers’ responses from the frame where the ball was in the center of the catch area, i.e., the perfect catch, was analysed. In the “high” condition, average difference is less than 25 msec in all conditions, while in the “middle” and “low” conditions, it increased with the luminance of glare light. Especially in the “middle” of 5 cd/m2 background, and “low” of 5 and 20 cd/m2 background conditions, the average values of the time difference sharply increased around at 2.9, 1.2, and 4.0 x 10⁵ cd/m2, respectively.
4. Conclusions
Our results of Exp.1 clearly showed that luminance and presentation duration of glare light affects visual function and subjective evaluation of glare. Results of Exp.2 showed the effect of the luminance of LED flood light and background on catching a moving object. It is indicated that glare becomes serious problem around at 1.2 x 10⁵ cd/m2 in catching lower fly in outdoor stadium. These factors should be taken into consideration in designing LED flood light in sports arenas.
CIE Session 2019 – Abstract Booklet
309
PO019
REPRESENTATIVE COLOUR OF THE WHOLE-FACE IMAGE AND ITS RELATION TO FINISH-UP IMPRESSION
Kawame, K.1, Shiromizu, S.1, Arimoto, K.3, Kimura, M.3, Hata, H.3, Koshino, M.3, Ishikawa, T.1, Ayama, M.1,2
1 School of Engineering, Utsunomiya University, JAPAN 2 Center for Optical Research & Education, Utsunomiya University, JAPAN
3 Shiseido Global Innovation Center, JAPAN
Abstract
1. Motivation, specific objective
Recently, facial image is utilized in various ways such as certifications, resumes, and instagram or blogs. Facial colour in digital images that gives good impression is getting more and more important. A number of researches have been done on the relation between colorimetric values of facial colour and impression of preference, whiteness, and/or other subjective evaluations. In relatively old studies, colorimetric values of small area(s) in the face, often in the cheek or forehead, were measured and employed as a representative colour of the face. Since 2D-colorimeter being developed and commercially available, colorimetric values of whole face has become to be used as a facial colour. However, colorimetric values in the whole face is not a single value. In some of previous studies, average value is used probably due to statistical expediency, but it has not been shown that the average value is a good representative of facial colour. Therefore, the purpose of the study is to determine an appropriate representative colour of the whole-face image.
2. Methods
2-1. Colorimetry and analysis
A facial image of 3 Japanese women in her twenties without makeup was taken by a digital camera and set as an original image. They are denoted as the faces, A, B, and C, respectively Image group composed of 343 was created for each of them in which the L*, a*, and b* of the skin-colour area were changed with nearly a constant step.
Chromaticity and luminance of test images on the display were measured using 2D colorimeter (Konica Minolta CA-2500). L*a*b* values were calculated using the maximum white of the display as the reference white. At first, we wanted to grasp the distribution of pixels in 3D colour space. So, a histogram of appearance frequency of (L*, a*, b*) is created for 119 test images that were evenly sampled from the all test images. Secondly, we wanted to know the locations of the pixels of high-appearance-frequency in the face. So, all pixels of which (L*, a*, b*) is included in the high-appearance-frequency group were plotted on the face. Then the distribution map in the face for high-appearance-frequency was obtained. We created the maps of the top 10% to 100% with a step of 10%.
2-2 Subjective evaluation
Subjective evaluations of “Finish-up impression”, “Blendable to her skin”, “Difference between face and neck colour”, “Brightness or darkness”, and “Redness or yellowness” were done. Rating scores from 1 to 5 were employed in all evaluations, while the description of the perceptual degree differs among the evaluations. In the case of “Finish-up impression”, scores of 5, 3, and 1 correspond to “preferable”, “neutral”, and “unlikable”, respectively. Five females and 5 males in their twenties participated the experiment. Experiments using the test faces of A and B have been done, and that using C is being carried out.
3. Results
Average value of L* was calculated for each of the top 10% to 100% for each of 119 images, and plotted against the percentage. As the percentage increases, L* decreases because the number of low L* pixels, especially in the outside boundary, increases. The rate of decrease, i.e., the slope of L* decrease is all negative, showed a relatively large change between the top 60% and 70%. The change of the slope of a* and b* values indicated quite similar tendency. The same analysis was done for the test faces A, B and C. No significant differences were observed among different test faces. Therefore,
CIE Session 2019 – Abstract Booklet
310

we employed the average values of luminance and chromaticity of (L*, a*, b*) values of the top 60% in the appearance-frequency as a representative colour of the whole-face image. It is denoted as (L*
av,60,i, a*
av,60,i, b* av,60,i), where i indicates the test image number.
In the relation to the results of “Finish-up impression” evaluation, colorimetric values of the images that obtained high scores commonly among observers were plotted in the L*vs C* graph. All results locate in the larger L* area than the original image for both test faces A and B, while the areas along the C* axis slightly differ between the test faces A and B. In the case of the test face A, all results locate smaller C* area than the original image, but for the test face B, that tendency is not clearly observed.
4. Conclusions
To determine an appropriate representative colour of the whole-face image, L*a*b* values of the whole-face images were calculated based on the 2D colorimeter measurement. A histogram of appearance frequency of (L*, a*, b*) was created, and the average values were calculated from the top 10% to 100% with a step of 10%. Based on the slope of decrease of L*, a*, and b* , average values of the top 60% in the appearance-frequency seem a good representative colour of the whole-face image, that is not strongly affected by extremely dark pixels in the outside border, or extremely bright pixels in the cheek, nose, and/or forehead.
Test images that obtained high scores in “Finish-up impression” evaluation commonly among observers show larger L* values than that of the original image both test faces A and B.
CIE Session 2019 – Abstract Booklet
311
PO020
HYBRID WHITE LED STREET LIGHT FOR MESOPIC VISION
Kongbuntud, K.1, Pattanapakdee, K.1, Naetiladdanon, S.1, Apainipat, C.1, Chuntamara, C.1 1 King Mongkut’s University of Technology Thonburi, Bangkok, THAILAND
Abstract
1. Motivation, specific objective
In the night time, Street lights are used to illuminate for drivers or pedestrian. The main purposes have improved visibility in night vision and safety. LED Street light was used instead traditional luminaires. The range of colour temperature is starting at 2700K from now on. Light sources with high colour temperature and more blue light colour are appearing brighter due to the high scotopic lumen. Cause of short wavelength is more affect eye sensitivity in the mesopic vision. But the light sources with high colour temperature are make glare. Then, the colour temperature and scotopic lumen per photopic lumen ratio or s/p ratio are used in this case to indicate.
2. Methods
This paper presents LED Street light with colour temperature at 4000K and improve s/p value for higher ratio. Street light luminaire was made by COB luminaire type. LED white colour 4000K, bluish-green, and red were used to make this luminaire. Scotopic lumen are high value cause of bluish-green LED were added. Three LED colour are combined and generate light source at colour temperature 4000K follow to ANSI Standard and high s/p ratio. This luminaire was designed by power. Spectral Distribution Power, and Chromaticity coordinate data were used to analyze and calculation. This luminaire was tested by using Integrating sphere, Spectroradiometer, and Goniophotometer. Moreover, the results were simulated in Dialux software.
3. Results
Finally, the result found this luminaire was generated quite green light, but still remain 4000K of nominal colour temperature. The ratio of s/p value 2.2 was measured, which is more than common street light luminaires, and Color Rendering Index value is 53. Efficacy value of this luminaire is more than 80 lumen per watt. Spectral Power Distributions have 3 dominant wavelength of blue, bluish-green and red colour.
4. Conclusions
This Street light luminaire use LED chip bluish-green and red colour combined with neutral white 4000K to get high s/p ratio but within the range of ANSI standard. The s/p ratio is up to 2.2 which more than traditional luminaires or common LED luminaires. However, the Color Rendering Index value and efficacy are quite low due to characteristics of the light spectrum.
CIE Session 2019 – Abstract Booklet
312

PO021
CHROMATIC DEPENDENCE OF THE CONTRAST SENSITIVITY FUNCITON OF THE PHANTOM ARRAY EFFECT
Lee, C-.S.1, Hwang, J.S.2, Lee, D.H.2 1 Yeungnam University, Gyeongsan, SOUTH KOREA,
2 Korea Research Institute of Standards and Science, Daejeon, SOUTH KOREA
[email protected], {jhwang, dh.lee}@kriss.re.kr
Abstract
1. Motivation
Our previous study implies chromatic dependence of the threshold frequency of the visibility of the phantom array effect at high modulation frequency. In this study, the contrast sensitivity functions of the phantom array effect in different chromatic light sources and luminance levels are investigated.
2. Methods
New apparatus for the experiment was implemented with Xe light source, 12 bandpass filter wheels, a chopper system, an ND filter, a diffuser, and high dynamic range light booth. 12 bandpass filter from 430 nm to 670 nm with 10 nm band width are used to select the experiment light wavelength from the Xe light source. The selected chromatic light source passed a chopper system which is used to control modulation frequency of the observed light source. Two sets of chopper wheels are used to control modulation frequency from 60 Hz to 1500 Hz. In the experiment, 60 Hz, 80 Hz, 100 Hz, 150 Hz, 300 Hz, 600 Hz, 900 Hz, 1200 Hz, 1500 Hz, 1800 Hz modulation frequencies was evaluated for monochromatic light sources with center wavelengths of 460 nm, 530 nm, 590 nm, and 650 nm. Continuously grating ND filters was used to adjust the different wavelength light source to the same luminance level. 400 cd/m2, 100 cd/m2, 25 cd/m2 luminance level was used in the experiment. A lighting booth implemented to evaluate high dynamic range camera system was used to precisely adjust background luminance during finding the threshold contrast level of the visibility of the phantom array effect.
3. Results
Preliminary experiment results show that the contrast sensitivity of the phantom array effect depends on the chromaticity of the light source as well as its luminance level not only at high modulation frequency but also at moderate modulation frequency. In addition, the peak contrast sensitivity modulation frequency of the phantom array effect, which requires saccadic eye movement during the evaluation of the contrast sensitivity function, is much higher than the peak of the conventional temporal contrast sensitivity function without eye movement.
4. Conclusions
The preliminary experiment result shows that the contrast sensitivity of the phantom array effect depend on the chromaticity of the light source and is different from the conventional contrast sensitivity. We may need a new contrast sensitivity function to model phantom array effect. We plan to further experiment with more subject to find out statistical characteristics of the contrast sensitivity function of the phantom array effect compared with conventional contrast sensitivity function.
CIE Session 2019 – Abstract Booklet
313
PO022
EFFECTS OF CRI AND GAI ON EMOTION AND WORK PERFORMANCE IN OFFICE LIGHTING
Hou, D.1,2, Lin, Y.1,2* 1 lnstitute for Electric Light Sources, Fudan University, Shanghai, CHINA
2 Engineering Research Center of Advanced Lighting Technology, Ministry of Education, Shanghai, CHINA
Abstract
1. Motivation, specific objective
The light source colour rendering index (CRI) is a parameter that quantifies the degree of agreement between the object colour appearance under the light source to be measured and the object colour appearance under the reference lighting object. And the full colour gamut index GAI can be used to reveal the sensitivity of the hue saturation and the hue sensitivity. Current standards and studies on colour rendering of light sources mainly focus on the research on colour preference and colour matching. Considering the universality of the results, this study chose most widely used CRI and GAI as variables to investigate the impact of light sources colour rendering index on emotion and work performance, in order to find suitable value for office environment.
2. Methods
The participants were randomly recruited between ages of 18~29 years old, with total number of 10 including 4 males and 6 females, average age at 22.60±(std)2.73. All with normal orthoptists and no colour blindness, colour weakness or other eye diseases.
The experiments were conducted in a lighting lab and the room size is L3.7m×W3.2m× H3.1m laid out as an office. One side of the room is open and has a neutral grey curtain. The curtains were closed during the experiment. There are desks, sofas, tea tables, chairs, paintings and so on. In this experiment, six THOUSLITE LED CUBE with a spectral tunable light source were used to create 9 different lighting conditions with different CRI and GAI. The three CRI conditions were 60, 80 and 100, and the three GAI conditions were 80, 100 and 120.
A variety of test methods were adopted in the experiment, including subjective scale and objective test. Chromatic anfimov alphabet test and Farnsworth Munsell 100 Hue Test were carried out for measuring work performance. Fatigue scale was used to evaluate the fatigue degree of people in different light conditions. To access the emotion of participants, we asked participants to perform PANAS (Positive and Negative Affect Schedule) to investigate the emotional states of subjects in different conditions.
3. Results
MANOVA analysis was carried out for lighting appraisal and analyses were made for work performance, emotion components both under CRI and GAI. The results of data analysis showed that work performance in chromatic anfimov tests were significantly different under different CRI conditions, in general, the higher CRI, the higher performance. And the CRI=100, GAI=100 condition is the best case. Work performance in 100 hue tests were significantly different under different CS and GAI conditions, and there are interactions between them and the work performance in CRI=100 was significantly higher than the others, GAI=100 has the same effect. About emotion effect, we used a repeated measurement and the mean comparison, discovered GAI is likely to have a certain influence on positive and negative emotions, but the influence of CRI is relatively small. It is easier to generate positive emotions, less accumulated negative emotions in the condition of GAI = 100, Ra=100 and GAI = 120, Ra = 80.
4. Conclusions
In this study, the effect of CRI and GAI on work performance and emotion was investigated
experimentally. Experiments have verified that in the range of 80 ≤GAI ≤120 and 60 ≤Ra ≤100,
participants ha higher work performance with the increase of CRI, and GAI=100 had the best
CIE Session 2019 – Abstract Booklet
314
performance among different GAI. In terms of emotional influences, GAI = 120, Ra = 80 and GAI = 100, Ra = 100 is the easiest to produce positive emotions.
CIE Session 2019 – Abstract Booklet
315
PO023
ASSESSING LIGHTING APPRAISAL, PERFORMANCE, PHYSIOLOGICAL COMPONENTS IN OFFICE WORK
Zhuang, Y.12, Lin, Y.12 1 lnstitute for Electric Light Sources, Fudan University, Shanghai, CHINA
2 Engineering Research Center of Advanced Lighting Technology, Ministry of Education, Shanghai, CHINA
Abstract
1. Motivation, specific objective
Most would agree that lighting does affect performance, physiological components and other parameters. In office practice, people who perceived lighting as being higher rated the space as more attractive, reported more pleasant, and showed greater well-being. Physiological components, as HRV, blood pressure, ERP components and so on, were also correlated with lighting. This paper is to assess the effect of lighting appraisal, performance and physiological components under different office lighting conditions.
2. Methods
This paper laid out 4 lighting conditions, each with different illuminance and CCT. The two CCT conditions were 4000K and 5000K and the two illuminance conditions were 300 lx and 750 lx. The participants were randomly selected between ages of 18-30 years old, with total number of 10 including 4 males and 6 females, average age at 22.9±(std)1.97. All with no intake of psychotropic drugs before and during the experiment.
We used the semantic differential rating scales for environment perception. D2 tests were carried out for measuring work performance. PANAS (Positive and Negative Affect Schedule) were filled in by participants which used to measure ones’ emotion before and after each trial, together with heart rate and blood pressure.
3. Results
Factor analysis was carried out for lighting appraisal and analyses were made for work performance, physiological components both under different CCT and illuminance. 4000K provided more integrated environment than 5000K, and people felt less sleepy under 4000K. Similarly, accuracy of D2 tests were higher and HRV were less significant both under 4000K. However, comparison of blood pressure across different CCT indicated that light at 5000K resulted more significant increase. 750 lx provided more colorful and luxury environment than 300 lx, and people felt less sleepy under 750 lx. Similarly, 750 lx resulted in higher CFF and less significant HRV. However, comparison of blood pressure across different illuminance indicated that light at 300 lx resulted more significant increase.
Lighting appraisal, work performance, physiological components were analyzed through analytic hierarchy process and weight coefficients were calculated.
4. Conclusions
The study of assessing lighting appraisal, work performance, physiological components in office environment has been carried out. Through analyses we found that lighting appraisal, work performance, physiological components were influenced by both CCT and illuminance. Practice effects were verified through and 4000K, 750 lx were evaluated the best and most suitable for office work.
CIE Session 2019 – Abstract Booklet
316

PO025
BEST LIGHTING FOR JEANS: OPTIMISING COLOUR PREFERENCE, COLOUR DISCRIMINATION AND COLOUR CONSTANCY
Huang, Z.1, Liu, Q.1, 2, Liu, Y.1, Luo, M.R.3, Wu, B.4, Wang, W.1 and Gong, H.1
1 School of Printing and Packaging, Wuhan University, Wuhan, CHINA 2 Shenzhen Research Institute, Wuhan University, Shenzhen, CHINA
3 State Key Laboratory of Modern Optical Instrumentation, Zhejiang University, Hangzhou, CHINA 4 Guangdong JG Lighting Technology Co., Ltd, Dongguan, CHINA
Abstract
1. Motivation, specific objective
Jeanswear is perhaps the most popular clothing during the past century, which has survived every fashion trend and is always reflecting the zeitgeist of the fashion world. The blue colour of jeans is a typical feature of such clothing and it always serves as a paramount factor for the selection by consumers.
In this contribution, a series of psychophysical studies have been conducted, with the aim of investigating the impact of the light sources upon the colour perceptions of jeans, including colour preference, colour discrimination as well as colour constancy. The ultimate goal of this study is to propose the best lighting strategy for jeans.
The authors believe that those three colour-perception dimensions are crucial to both retails and customers, since first, the visual preference of jeans will urge the consumer to purchase; second, better colour discrimination will help the buyers to find their favourite product; and third, a light source providing similar colour rendering properties as that of daylight environment will effectively avoid the colour inconstancy problem (i.e. a buyer perceives a colour differently in indoor and outdoor environments)
2. Methods
This work contains three groups of psychophysical studies.
In Group 1, two visual tests, one on colour preference and the other on colour discrimination, were conducted. 27 subjects with normal colour vision were asked to rate their visual appreciation of 7 pairs of jeans with a colour gradient pattern. Nine LEDs, with uniformly sampled correlated colour temperature (CCT) values ranging from 2500 K to 6500 K (500 interval), were adopted to illuminate the jeans. Those lights were of a constant illuminance level of approximately 200 lx and their colour rendering indexes (CRIs) were between 79 and 91. In addition, in a Farnsworth-Munsell 100 Hue Test experiment, the blue-region colour discrimination of 42 observers was assessed for 5 LEDs from the same light group with different CCTs (2500 K - 6500 K, 1000 K interval).
In Group 2, the protocol is quite similar. Two panels of observers (30 and 24) were respectively invited for the colour preference experiments and colour discrimination test. Compared to Group 1, the major difference of Group 2 is that different light sources were adopted. Nine 5500 K light sources with different Duv values (-0.02 to 0.02, 0.005 interval) and consistent CRI values were used for preference rating test while five lights from the same group of lights (-0.02 to 0.02, 0.01 interval) were adopted for the colour discrimination test. In addition, the illuminance level of this series is 500 lx.
In Group 3, the colours of the same experimental jeans were judged by observers under indoor and outdoor environments, respectively. For indoor lighting, 6 light sources (5500 K, Duv=-0.010, illuminance=500 lx) were used while for outdoor environment, consistent daylights of natural scene were adopted. The participants were asked to response with their perceived similarity towards the colour of the jeans by a 7-point rating method. In addition, the blue colour samples in Farnsworth-Munsell 100 Hue Test were also used. That is, a randomly selected blue sample was firstly observed under one experimental light. After that, the observer was asked to choose the same colour sample from a pool of blue samples under daylight environment. Obviously, an experimental light source (indoor) with minimum selecting error tends to provide better colour constancy.
CIE Session 2019 – Abstract Booklet
317
3. Results
In the first group of visual test, it was found that there is an optimum CCT of 5500 K for jeans, at which observers were found to exhibit greatest capability for colour discrimination and highest rating for colour preference. Similarly, in Group 2, an optimum Duv of -0.010 was found, under which the colour preference and colour discrimination reach the optimum simultaneously. It is quite interesting that the colour preference and colour discrimination of the observers were also closely related the whiteness of lighting, since as revealed by our latest work, those optimum lights for colour preference and colour discrimination were also the whitest lights according to visual judgment. As for Group 3, the best light source exhibiting optimum colour constancy was found and a quantifying measure was proposed. In addition to this, significant gender difference was observed in those experiments.
4. Conclusions
In this contribution, the impact of light sources upon the colour perception of blue jeans was comprehensively investigated. According to our findings, a lighting solution was proposed for jeans lighting, which could optimize the colour preference, colour discrimination and colour constancy simultaneously. Those findings should provide a deeper understanding for the lighting design of shopping malls for jeans.
CIE Session 2019 – Abstract Booklet
318

PO027
RELATIONSHIP BETWEEN COLOUR RENDERING INDICES AND SUBJECTIVE COLOUR DIFFERENCES
Mukai, K.1 1 Panasonic Corporation, Kadoma, JAPAN
Abstract
1. Motivation, specific objective
International Commission on Illumination (CIE) recommends general colour rendering index (Ra) and special colour rendering index (Ri) as indices of colour rendering properties in the Technical Report (CIE13.3). But it has been indicated that Ra and Ri have some problems to be considered, for example used colour space is outdated CIE 1964 Uniform Colour Space (U*V*W*). CIE published the Technical Report 224 "CIE 2017 Colour Fidelity Index for accurate scientific use" to solve the problems above. But even the new index Rf has some technical issues to be considered, and Rf is not a replacement of Ra neither for the purpose of rating and specification of products nor for regulatory or other minimum performance requirements.
One of the issues is that Rf shifts very sensitively by the wavelength of the blue LEDs composing white LEDs. It is pointed by Smet et al. And another issue is the correlation between Rf value and the result of evaluations of colour differences by observers is not higher than Ra value. It is pointed by Gu et al.
To compare the correlation of Rf and Ra with the observed colour differences, we conducted a series of experiments.
2. Methods
The experiment was conducted in a pair of booths. In the left booth 20 test colour samples and some coloured items set on the table were illuminated by 11 test LED illuminants in order. In the right booth the same test colour samples and items were illuminated by a reference LED illuminant. In the both booth illuminance on the table was 1000 lx. Subjects answered the observed colour difference according to the scale. The scale was "0: no different", "1: barely different", "2: somewhat different", "3: clearly different", "4: very different" and "5: completely different."
First, the subject answered only the observed colour difference of the red colour samples between two booths. Second, he/she answered the difference of yellow samples. Next, green samples and next, blue. And finally, he/she answered the observed colour differences of all 20 colour samples and items on the table comprehensively.
The correlate colour temperature of all test illuminants and reference illuminant were 3000K and Ra, Rf of them were various. Some test illuminants had approximately the same Ra and different Rf, and some had different Ra and approximately the same Rf.
3. Results
- The value of Ra and the observed colour difference (OCD) are in a linear relationship and the larger Ra is, the smaller the OCD tend to be.
- The value of Rf and the OCD are also in a linear relationship and the larger Rf is, the smaller the OCD tend to be.
- The correlation coefficient between Ra and OCD is larger than that between Rf and OCD although there is no significant difference.
- The larger Ra is, the smaller the OCD tend to be even if Rf is approximately the same. On the other hand the OCD tend to be approximately the same if Ra is approximately the same even if Rf is different.
- The correlation coefficient between the OCD and the both colour difference calculated on the CIE 1964 colour space and CAM02-UCS are high.
CIE Session 2019 – Abstract Booklet
319
- On the CIE 1964 colour space, the OCDs of red and blue are equally smaller than calculated colour difference and the OCDs of yellow and green are equally larger than calculated colour difference.
- On the CAM02-UCS, the only OCDs of blue is smaller than calculated colour difference and the OCDs of red, yellow and green are equally larger than calculated colour difference.
4. Conclusions
CIE 224 indicates there remains some technical issues in the calculating method of the Colour Fidelity Index Rf. To make clear the issues, a series of experiments to evaluate the colour differences under various SPD LEDs were conducted.
Both Ra and Rf are well correlated with the observed colour differences. But under some illuminants, observed colour difference is not same even if Rf is same, and observed colour difference is same even if Rf is not same. These results are not seen in the case Ra.
Focusing on the slope of calculated colour difference against observed colour difference, only the slope value of blue is different from red, yellow and green. This is one of the issues of Rf. If the calculated colour difference of blue will be made as small as red, yellow and green, the correlation coefficient may get higher and Rf may become more practical. Rf is needed to revise to calculate the blue colour difference smaller.
CIE Session 2019 – Abstract Booklet
320

PO028
CHROMATIC ADAPTATION EFFECTS AND LIMITS OF AMBIENT ILLUMINATION SPECTRAL CONTENT
Nagy, B.V.1, Urbin, Á.1, Sípos, L.2 1Department of Mechatronics, Optics and Mechanical Engineering Informatics, Budapest University of
Technology and Economics, Budapest, HUNGARY 2Department of Postharvest and Sensory Evaluation, Szent István University, HUNGARY
Abstract
1. Motivation, specific objective
To understand colour discrimination changes under various ambient illumination spectra for adaptation using vision research tools and specific application in the food industry.
2. Methods
The study was based on the application of different standard colour discrimination methods for visual tests under varied spectral illumination. The adaptation illumination was realized in a spectrally tuneable light booth using five primaries. Eighteen different spectral conditions were applied in the visual tests addressing human chromatic discrimination and the ellipse test of the Cambridge Research Systems standard monitor based test and the Lanthony D-15d reflective test with desaturated samples were used to test human colour discrimination. Sixteen participants took part in the visual tests having three minutes of adaptation in each lighting condition. The monitor based test was applied outside of the light booth within 8 degrees of visual angle to avoid direct screen reflections but to maintain the adaptation ambient in the rest of the visual field. The reflective tests were applied within the light bo oth. The results were evaluated in the CIE u’v’ colour space using the ambient colour coordinates as references.
The application of the tests were done with specific food samples for human sensory testing to induce masking and/or alteration of chromatic information of the food sample colours. Four naïve participants did ordering and grouping tests of food samples in different spectral ambients calculated specifically based on the transmission and reflection spectra of the samples.
3. Results
The results show that close to quasi monochromatic ambients strongly affect chromatic adaptation when the visual task is colour discrimination. However there are specific spectral conditions, such as the ones related to blue ambients where the reducing effects on colou r discrimination are generally larger and less dependent on the test colours. Reflective and monitor based colour discrimination tests also show differences that can be taken into account in lighting design for specific purposes.
The food tests indicate that alteration of colour information of the food samples has effect on the primary visual input on the sample characteristics. Further tests will be carried out including other sensory information, such as taste and smell to evaluate the magnitude of the visual alteration on these.
4. Conclusions
Chromatic discrimination alteration is significant under specific spectral lighting conditions and normal colour discrimination limits within the CIE u’v’ colour space can be defined based on our measurements.
The specific application of spectral ambients in the food industry has effects on visual evaluation and might be useful in the general sensory evaluation of different food products.
CIE Session 2019 – Abstract Booklet
321

PO029
OBSERVING THE EFFECT OF CHROMATIC ADAPTATION ON COLOUR DISCRIMINATION UNDER DIFFERENT VIEWING CONDITIONS
Urbin, Á., Nagy, B.V., Wenzel, K. Department of Mechatronics, Optics and Mechanical Engineering Informatics, Budapest University of
Technology and Economics, Budapest, HUNGARY
Abstract
1. Motivation, specific objective
The objective of our study was to compare the effect of different spectra induced chromatic adaptation on colour discrimination.
2. Methods
In the study just-noticeable stimuli of normal colour observers measured with the trivector test of the Cambridge Colour Test were compared under two types of chromatic adaptation conditions: wearing coloured filters and sitting in a spectrally adjustable light booth. The conditions were equal regarding chromaticity and luminance however the spectral content and the field of view were different. The tests were accomplished using tests without filter as reference and with booth settings that provided the chromaticity of the neutral point of the display.
The reference points were shifted from the neutral point towards the chromaticity points that defined the above mentioned conditions in the CIE (1976) u’v’ diagram, calculated based on the transmission spectra of the coloured filters. The test directions were set to the confusion axes towards the Protan, Deutan and Tritan points. The range of luminance values both of the pseudoisochromatic plates and of the adjustable light booth were set considering the spectral transmission of the applied filters in order to reach equi-luminance among the perceived stimuli.
Statistical analysis was executed regarding the following factors (and their levels): state of adaptation, condition of adaptation (filter or booth), analysed confusion line (Protan, Deutan, Tritan) and background chromaticity.
3. Results
The analysis shows that while adapting to the filters causes significant changes in chromatic discrimination depending on the background chromaticity compared to the results with the reference tests, adapting to the light distribution of the adjustable booth did not cause such change at all.
4. Conclusions
Our results show the importance of paying attention to details of viewing conditions such as field of view and spectral content of the illumination that defines the state of chromatic adaptation.
CIE Session 2019 – Abstract Booklet
322

PO030
A STUDY ON COMPREHENSIBILITY OF INFORMATION OF INDUCTION SIGNS: DEGREE OF INFORMATION SEPARATION IN SIGNBOARDS
Nishikawa, M.1, Hirate, K.1 1 The University of Tokyo, Tokyo, JAPAN
1. Motivation, specific objective
Many induction signs are set up in places where people gather, such as streets, public transportation facilities, and commercial facilities. These give the users information to go to the destination quickly and safely. In order to correctly communicate the content of the signs it is important to make it easy to understand the information in the board. Dimensions such as font size and width of the margin are prescribed by the public transportation companies, and in the field of design, proper layout method and margin setting are shared from empirical rules. However, these rules are mainly aimed at readability and beauty of appearance. Although there are few signs that are not transmitted in the space with regulation or induction signs of small amount of information, there are signs that a lot of information is messed up. If there are specific rules in the board surface, it is considered that it will help to make it easy to understand even complicated contents. In addition, as a rule to easily convey the intention of the designer, it is considered that it can be diverted as a guide for multiple information besides the induction signs.
In our laboratory, we classify the elements related to comprehensibility within the induction signs into colour scheme, pictogram, arrow, layout, number of languages, expression. We consider that exist of clear rules and whether these are obeyed or not for colour scheme and expression, effects on user’s judgment for pictograms and arrows, impression of users with the layout and the number of languages used for number of languages. Also, the layout includes how to arrange contents and how to set margins. In this research, focusing on separation of information by margins, the purpose is to investigate how the degree of information separation changes depending on how the area is divided in one board face.
2. Methods
Experiments were carried out by presenting images on the screen of the PC and letting the subjects operate by the arrow keys. Experiments were conducted in two ways: one to examine the threshold of separation degree and one to investigate the difference in separation degree depending on the type of division. In each experiment, we used images simulating a sign in which two destinations in two different directions are posted on one board surface, and adjusted the position of the right destination information among the two. Experiment 1 presented two destinations on a white background, and the subjects adjusted the position to "barely understood" and "clearly understood" that they were different information, and their widths were measured. For the destination information on the right side, there were prepared two types of arrow directions, upward and rightward. Experiment 2 presented a comparison target image (the destination information was the same) using various division methods were presented on the upper half of the screen, and in the adjusted image of the lower half of the white background, the subjects adjusted the position of the destination information on the right so that the separation degree of information was equal at the upper half and the lower half. For the image to be compared, there are frames, border lines (thick, medium, fine, medium and short, fine and short), colour coded (white / yellow / green / black) with frame, no frame. The width ratio of each image to the upper half image was calculated. The subjects were 20 males and females in their twenties.
3. Results
In Experiment 1, there was no statistically significant difference in the position and orientation of the arrows. A significant difference was seen in the width of "barely understood" and "clearly understood". When calculating the ratio of the adjustment width to the height of the destination information, they were 0.26 and 0.62.
In Experiment 2, when comparing with the distribution when assuming an average of 1, a significant difference was observed in all images. Since there was no significant difference in the difference between left and right in colour coding, it was averaged. It was adjusted to about 1.6 times for the separated board, about 1.3 to 1.9 times for the borderline and about 1.8 to 2.6 times for the colour
CIE Session 2019 – Abstract Booklet
323
codes. The width was significantly wider in the frame compared with the case without the frame. This tendency was particularly large in colour coding. This is considered that the subjects felt that it is more emphasized that it was different information because of different colours enclosed by the frame. With thick borders (thickness was equal to the frame) was adjusted narrower than other borders. This is considered that the boundary line was recognized as a part of the frame and did not function as a boundary line. When comparing in colour coding, only the width of the combination of white and yellow was slightly narrowed, the other combinations did not show large difference, and the correlation with the brightness ratio was also low. The luminance ratio by combination of colours was 1.1 for white and yellow, 2.2 for yellow and green, and 2.4 to 16 for other combinations. If the luminance ratio is twice or more, it is judged that it is "another information", and it can be considered that no big difference appears over that value.
4. Conclusions
In this research, by adjusting the width of two pieces of information, it was clarified how the degree of separation differs depending on the method of segmentation. Although colour coding has a strong power, it was shown that the effect does not change if the difference in colour is more than a certain value, and when using the boundary line, it is necessary to pay attention to thickness and length. However, in this research it is only images using two pieces of information, and we cannot examine the large signboard surface with multiple division methods. In future research, we would like to consider about images with more than 3 information and verify whether the area is properly divided using the actual sign images.
CIE Session 2019 – Abstract Booklet
324
PO032
ISN’T COLOUR VISION AN ILLUSION?
Kazim Hilmi Or1 1 Private Office of Ophthalmology, Istanbul, TURKEY
Abstract
1. Motivation, specific objective
Scientists work on colour as a feature, as if it is precise and measurable. Studies in visual perception sciences and neuroscience prove that colour perception in ophthalmologically healthy and “colour vision normal“ subjects is an illusion. Colour perception is also -like the visual perception itself- individual. Light and illumination scientists should be aware of this in their scientific and professional life.
2. Methods
Visual perception and colour perception cannot be defined by science. They are both subjective. So they can be only explained to other people by scientific illusions. They are used to show that the colour perception is an illusion. Colour vision deficiencies are not included in this topic.
3. Results
There are many characteristics of colour. To show these characteristics numerous scientific visual illusions have been created, which are named according to the creator of the illusion.
One of the newest illusions is #thedress illusion. In this illusion from the clinically colour normal subjects about 45 % see the dress in gold-white, another 45 % in n blue-black and the remaining 8-10 % see in other colour combinations.
From the colour constancy to colour contrast, from colour metamers to colour temperature, from physical colour properties (red low, blue high temperatures) to perceived colour temperature (blue low, red high temperatures) there are a lot of discrepancies.
On the other hand the photoreceptors in the brain are colour blind. Perception of colour is in the brain. The electrical signal which is created by the photon in the photoreceptor is transmitted through three neurons in the eye and two neurons in the brain to the visual cortex, where the transformation to information becomes as a colour perception.
Perception of colour may be without any eye involvement also. Which is physiologically “seen” in normal dreams.
These discrepancies will be shown to the audience with many different visual colour illusions, so that everyone realizes that colour vision isn’t objective.
4. Conclusions
Scientists should experience by theirselves individually, that human colour vision is an illusion, so that they can differentiate between measurement of colours by instruments and perception of colours by clinically colour vision normal persons.
CIE Session 2019 – Abstract Booklet
325

PO033
REVIEW OF EXPERIMENTS ON SUBJECTIVE QUALITIES OF COLOUR RENDITION
Royer, M.P.1, Wei, M.2, Wilkerson, A.M.1
1 Pacific Northwest National Laboratory, Portland, OR, USA; 2 The Hong Kong Polytechnic University, Kowloon, HONG KONG
Abstract
1. Motivation, specific objective
It has generally been found that objective measures of average colour fidelity, such as Ra and Rf, are not closely correlated with subjective evaluations of colour quality, including naturalness, normalness, vividness, preference, or acceptability. Some past research has suggested that supplementing a measure of average colour fidelity with a measure of gamut area can solve this problem, but more recent research has exposed the limitations of this approach when gamut shape is varied. In all, dozens of measures of colour rendition have been proposed based on experimental results, relying on a variety of approaches and calculation frameworks that are not necessarily harmonious with one another.
A critical review of colour rendition research was performed with the objective of identifying psychophysical experiments that met a defined set of best practices. The qualifying experiments were then examined and re-analysed to identify combinations of measures suitable for predicting common perceptual attributes. The candidate measures were all compatible with the recently-published CIE 224:2017; that is, they are derived from the same calculation framework (colour samples, colour space, and reference illuminant scheme).
The analysis focused on multi-measure specification criteria, rather than attempting to combine measures into a single model of a subjective attribute(s). Establishing specification criteria is compatible with current lighting specification practice, acknowledges the great variety of lighting applications, and preserves transparency to empower lighting specifiers.
This review and analysis can serve as a useful guide for future experimental work and establishes new knowledge that can be used by lighting specifiers, researchers, manufacturers, and standards organizations.
2. Methods
Relevant work was identified via searches of peer-reviewed journals. The identified articles examined perceptions of naturalness, normalness, vividness, preference, and/or acceptability in a polychromatic environment at illuminances greater than 200 lux. Next, a set of criteria were applied to identify studies following best practices for designing and carrying out psychophysical experiments:
Well-defined research hypotheses to isolate the independent variables.
Appropriate counterbalancing of order effects, including random order of presentation.
Control of chromaticity and/or allowance for chromatic adaptation.
Presentation of a sufficient number of SPDs to allow for variations in gamut shape.
Consideration of object spectral reflectance.
Consideration of demographics.
To be eligible for further analysis, two additional stipulations had to be met:
SPDs were available, either within the article or through personal communication. This was necessary to calculate measures of colour rendition beyond those included in the initial report.
Response data was in interval format. This was necessary to compare the data.
The qualifying studies were first analysed using a best-subsets procedure, followed by a more detailed regression analysis. The results from eligible studies were compared with one another, and
CIE Session 2019 – Abstract Booklet
326

explanations for any differences were sought. Optimized specification criteria were developed based on a weighting algorithm.
3. Results
Dozens of studies were initially identified, covering more than 50 years of research. Notably, there have been substantial changes in this field in the past five years. Two changes are key: (1) there have been both practical and conceptual advancements in the quantification of colour rendition, and (2) the increased prevalence of LED-based tunable lighting systems has allowed substantially more variation in the stimuli presented to study participants.
Despite the repeated interest in this topic, a strong majority of the reviewed studies failed to meet the documented best practices—some of which have only been understood thanks to the aforementioned advancements. For example, some work has indicated a significant effect of CCT on colour preference evaluations; however, chromatic adaptation was not controlled, such as when viewing mixed-chromaticity stimuli side by side or in rapid succession. Other research found that perceptions of colour quality were stable across CCT when allowing for proper chromatic adaptation and tight control of chromaticity with a carefully calibrated lighting system.
Another area of deficiency that was frequently observed was in the variation of the stimuli. Many past studies examined fewer than eight SPDs. Further, given reliance on commercially available light sources and the availability of only measures of colour fidelity and gamut area, the SPDs offered little variation in gamut shape. Thus, they were unable to detect factors that have been shown by others to be critically important to perceptions of colour rendition. More notably, using limited stimuli can show higher correlation between perceived attributes and average measures of colour rendition than exists when more varied SPDs are presented.
Several studies met all the best practices and stipulations, although it was only a small percentage of the overall number of studies reviewed. Within the eligible work, there was strong consensus that the chroma of red-hued objects is critical to short-term subjective evaluations. This characteristic, quantified with ANSI/IES TM-30-18 Rcs,h1, can be combined with Rf and ANSI/IES TM-30-18 Rg to form an effective, multi-tiered specification for a variety of lighting quality aspects, such as naturalness, vividness, preference, or acceptability.
4. Conclusions
The quantity of studies included in this review indicates the continued recognition of the limitations of existing measures of colour rendition. At the same time, the lack of experiments determined to have followed best practices indicates the importance of critical review—as well as the changing paradigm of research in this field and the need for more discussion of research methods.
Several experiments from multiple institutions have found consistent results. In polychromatic environments (a mixture of objects sampling all hues) with illuminance levels typical of an architectural interiors (200-500 lux), short-term subjective evaluations of colour naturalness, preference, vividness, and acceptability are most strongly correlated with measures of red chroma, such as Rcs,h1. Effective specifications for these attributes can be made using Rcs,h1, Rf, and Rg. These measures are all compatible with the framework of CIE 224:2017. Levels for each measure can be adjusted to address needed trade-offs with other considerations, such as cost, energy efficiency, and product availability.
CIE Session 2019 – Abstract Booklet
327

PO034
VISIBILITY OF HANDRAILS UNDER 500 LUX AND 0.5 LUX FLUORESCENT LIGHT: SUITABLE RAILING-COLOURS FOR ELDERLY PEOPLE
Sakamoto, T.1, Yoneda, M.2 1 National Institute of Advanced Industrial Science and Technology (AIST), Tsukuba, JAPAN
2 YKK AP Inc., Kurobe, JAPAN
Abstract
1. Objective
We investigated visibility in the elderly for the combinations of handrail-colours and illuminance of lighting. Handrails are important facilities for the elderly to walk safely, but rarely installed considering visibility in elderly people. Visibility of the handrails depends not only on their colours, but also on the brightness of lighting environment. If this point is not emphasized, not a few elderly people will fail to notice and grasp the handrails. To clarify suitable railing-colours for elderly people, this study focuses on an experimental evaluation on visibility of railing-colours under bright and dark lighting environment.
2. Methods
The experimental evaluation was done using six handrails coloured with pale yellow (with woody texture), dark brown (with woody texture), white, red, orange, silver (with metallic texture), and two pale yellow handrails with luminous tapes and LED lights. Lighting environment was provided with two illuminance conditions and three wall colours: Illuminance conditions were 1) 501 lux under 6500K fluorescent light, and 2) 0.51 lux under 4000K fluorescent light. Wall colours were 1) white, 2) dark brown (with woody texture), and 3) gray (with concrete texture). Fifteen elderly participants aged from 75 to 85 were Japanese and passed colour-vision and visual acuity tests. These elderly participants evaluated the visibility of handrails based on the magnitude estimation method scaled from 0 to 100.
3. Results
Under the 501 lux illuminance condition, red and orange handrails had the best visibility. On the other side, under 0.51 lux illuminance condition, two pale yellow handrails with luminous tapes and LED lights had the best visibility; however almost all elderly participants could not recognize these as handrails, even though they could find bright, long objects.
4. Conclusions
The handrails are almost always installed, whether indoors or outdoors, in places where stairs are located. However, handrails are rarely installed considering visibility in elderly people. Almost all customers and contractors only emphasize the beautiful and satisfactory appearance of handrails harmonized with the architectural design. Our research results emphasize that the visibility of the handrails, as well as their physical design, is a subject to be considered.
CIE Session 2019 – Abstract Booklet
328

PO035
ON DETERMINING UNIQUE HUES FOR OBJECT STIMULI
Shamey, R. Color Science and Imaging Laboratory, TECS Dept., North Carolina State University, Raleigh, USA
Abstract
1. Motivation, specific objective
This was a component of the CIE TC1-76 committee to determine unique hue stimuli for object colours. The purpose of this work is to develop a CIE method to define mean perceived unique hues. Unique hues (uHs) occupy a distinct place in the study of colour perception. They are based on Hering’s theory of opponent colour vision in which three orthogonal, opponent colour channels are present: red-green, yellow-blue and white-black. Unique hue data obtained under different illumination conditions allow one to test the validity of uniform colour spaces such as CIELAB and CIECAM based models which are widely used in industrial applications. Unique hues could also serve as a set of hues that should be preserved when viewed on different displays and could be useful constraints for gamut mapping algorithms.
2. Methods
Techniques employed in this study include selection of object colour patches from Munsell samples and NCS colour set by a group of observers over repeated trials.
The roles of chroma and stimulus size in selection of unique hue object colour stimuli under light sources simulating illuminants D65, A, F2 and F11 are examined. Twenty-five colour-normal observers selected samples representing uH stimuli from rotatable trays, three times separately with at least 24 hrs. gap between trials. One study included two sets of high chroma NCS chips that generated full hue circles, one at 5.7o field of view size and the other at 1.4o. The second study involved a set of low chroma and a set of high chroma Munsell samples each forming a full hue circle. The mean as well as the range and variability in uH selections from several thousand uH assessments were calculated according to illumination conditions, sample size and chroma.
3. Results
The uH responses obtained from all observers were used to calculate the frequency and mean for selected uH stimuli. Out of 40 chips on each of the trays, 21 chips from the high chroma set, 31 from the low chroma set, 26 from samples at 5.7o field of view size and 21 from the 1.4o field of view size were selected by at least one observer as a representative of uHs. These frequencies represent substantial variability among observers. The frequency of uH selections under artificial daylight for the two sets show a larger range of selections for the larger samples. The overall mean uH Munsell samples based on observer selections for all trays and all illumination conditions are 3.9Y, 4.5B, 4.5R and 2.3G. Individual tray mean values are 4.5Y, 9B, 3.9R, 2.5G for the MLC set; 4.8Y, 2PB, 6.8R, 2.7 G for the MHC set. For the NCS samples the mean values are Y3R, R94B, Y97R, G5Y for smaller samples and Y9R, B2G, R3B, G11Y for the 5.7o NCS samples. This indicates a clockwise shift in hue selections from low to high chroma Munsell samples and from 1.4o to 5.7o NCS samples, respectively.
In the case of Munsell samples the mean uH selections under daylight shifted by approximately 0.8 hue steps for uY, 3.2 hue steps for uB, 2.4 hue steps for uR and 0.3 hue steps for uG from low chroma to high chroma samples.
4. Conclusions
The mean uB and uR responses were significantly different under the four lighting conditions between MLC and MHC samples. However, uY choices were significantly different only under incandescent and CWF light sources and uG selection differences were not statically significant. In comparison to daylight, some uH selections were significantly different under other light sources. Thus, variations in chroma seem to affect uH selections, especially when combined with assessments under various light sources. Variability among observers was lower for the MHC compared to the MLC set, likely due to larger colour differences between adjacent chips in the MHC set. In the case of NCS samples, the mean uH selections for the 1.4o and 5.7o set have a difference of up to approximately one hue step as
CIE Session 2019 – Abstract Booklet
329

well as a clockwise shift on the NCS hue circle and were less variable for the 1.4o NCS set. In all cases, inter-observer variability was significantly larger than intra-observer variability.
CIE Session 2019 – Abstract Booklet
330

PO036
LUXPY: A PYTHON PACKAGE FOR COLOUR AND LIGHTING SCIENCE
Smet, K.A.G.1 1 ESAT/Light&Lighting Laboratory, KU Leuven, Ghent, BELGIUM
Abstract
Luxpy is an open source Python package that supports several common lighting, colorimetric, colour appearance and other colour science related calculations and models. The following functionality is currently implemented:
spectral data interpolation (conform CIE15-2004) and normalization
calculation of daylight phase, blackbody radiator and other reference illuminant spectra
calculation of tristimulus values
correlated colour temperature and Duv
colour space transformations
chromatic adaptation transforms
colour appearance models
colour rendition indices
calculation of photobiological quantities
Multi-component spectrum creation and optimization
Hyper-spectral image simulation and rendering
Read IES and LDT files
...
It was written and is distributed freely (under GPLv3 license) with the aim to facilitate lighting and colour science related calculations and to foster scientific collaboration using Python 3, a free, easy to learn and powerful high-level scripting ‘language’, which does not suffer some of the limitations of the often used excel spreadsheet (for example: the lack of flexibility when existing calculations need to be adjusted or need to work on different sized data sets, difficulty in following complex calculations, no native support for plots of 3D data such as e.g. L*a*b*) or of matlab (need for a quite expensive yearly renewable license). In addition, it is hoped that LuxPy can also be used in an educational setting to help students become familiar with and gain practical skills in basic lighting and colour science, while at the same time learning the basics of the Python programming language.
In the presentation I would like to introduce the LuxPy package and illustrate some useful basic functions using a Jupyter notebook.
Practical info:
Luxpy can be installed from:
- the Python Package Index: pypi.python.org/pypi/luxpy/
CIE Session 2019 – Abstract Booklet
331

PO037
PILOT STUDY ON COLOUR MATCHING ACCURACY USING DIFFERENT PRIMARIES
Li, J.1, Hanselaer, P.1, Smet, K.A.G.1 1 ESAT/Light&Lighting Laboratory, KU Leuven, Ghent, BELGIUM
Abstract
1. Motivation, specific objective
Good colour description starts with accurate colour matching functions (CMFs) or cone fundamentals (CF). However, it has become increasingly apparent that there are substantial discrepancies between visual matches and the matches calculated using the 1931 (and 1964) CMFs defined by the International Commission on Illumination (CIE), especially for narrowband sources such as solid-state and laser based sources.
This paper reports on the results of a series of pilot matching experiments using primaries with different wavelength (different channels of a spectrally tunable light source). The aim is to determine the most accurate set of CMFs and to identify which regions in wavelength space are most sensitive to generating matching inaccuracies for a given CMF set.
2. Methods
Matching was done in a specially designed viewing box, allowing the match field to be viewed in a reflective / object appearance mode. In the box, a tilted mirror (3° field of view) was used to provide the matching field. By carefully positioning the observer, the mirror showed only the reflected image of a neutral grey plate illuminated by a calibrated ThousLite LED cube. The grey plate and the LEDcube were positioned in a separate compartment of the viewing box to avoid contributing to the background and surround of the match field. By changing the illumination of the LEDcube the apparent colour of the match field changed as well. Pilot experiments have shown that this mirror setup, can provide a stimulus which is indistinguishable from an illuminated opaque, reflective card covered by a glass plate, of the same luminance. The spectral radiance of each match made by an observer was measured with a tele-spectroradiometer after suitable calibration.
All experiments were performed in a darkened room. For the experiments reported in this paper, the inside of the box was lined with a minimally reflecting black cloth to generate a dark surround. Before starting the experiments, observers were allowed to adapt to the dark environment.
In a first set of experiments, observers were asked to make achromatic (neutral grey) matches based on memory and the immediate background was also set to black using the same cloth. In a second series of experiments, observers were asked to match the colour appearance of the immediate surround (frame) of the mirror. For these experiments, the mirror frame (5° field of view) was composed of spectrally neutral (grey) material and was illuminated by a filtered halogen source (with chromaticity slightly above the blackbody locus at around 5000 K). Because of the tilt of the mirror, observers did not see the halogen, but only the mirror image of the reflection plate.
Two target colours, the memory neutral grey and the grey of the mirror frame were used in this experiment. The matching luminance was set at 40 cd/m².
During the experiment, the observers were asked to adjust the ‘reflected colour’ in the mirror to neutral grey by navigating in the CIE 1976 u’v’ space using a keyboard. After finishing a match, they were asked to rate their result on a 0 (not satisfied at all) to 10 (very satisfied) scale. Two red primaries, two green primaries, and two blue primaries were chosen to be the test primaries. Six different primary-sets (RGB) were created by making combinations of the 6 chosen primaries. Different primary-sets were used to investigate the accuracy of existing CMFs for calculating colour matches. To minimize starting bias, the match for each primary-set was repeated 5 times with 5 different starting chromaticities, with hues evenly distributed along the hue circle. The primary-sets and starting points were presented in a random order in a single experiment trial to avoid order bias. Six observers (3 males and 3 females) were invited to this experiment, all with normal colour vision, as tested by the Ishihara 24-plate test. A total of 360 estimations were made during the experiments: 2 stimulus targets x 6 observers x (6 primary-sets x 5 starting points).
CIE Session 2019 – Abstract Booklet
332

3. Results
If basic colorimetry holds, for each individual participant, the matching colour should be visually the same for different primary-sets. For an average observer, the calculated tristimulus values should also match closely. However, substantial and significant calculated chromaticity differences were found for both the CIE 1931 CMFs and CIE 1964 CMFs. The inter and intra-observer variabilities were analysed by measuring standard deviation ellipses and standard error ellipses. The significance of the difference in matched chromaticity values for different primary-sets was determined with a doubly multivariate repeated measures MANOVA.
4. Conclusions
The results show that the CIE 1931 CMFs and CIE 1964 CMFs were not strongly predictive for visual matches made with different narrow-band primaries. Future research will further put basic colorimetry (matches) under test. A discovery of key problems and the derivation of a better colorimetric system would have important consequences not only for the prediction of colour (mis)matches, but also for all colorimetric calculations based on CMFs, such as colour difference equations, colour appearance models, computer renderings and VR, etc. A better understanding of the extent of observer variability would also help shed light and might (partially) explain the, often large, variability found in other colorimetric and psychological colour variables.
CIE Session 2019 – Abstract Booklet
333

PO038
PILOT STUDY ON A NEW APPROACH FOR ESTIMATING ROOM BRIGHTNESS
Lin, C.W.1, Hanselaer, P.1, Smet, K.A.G. 1 1ESAT/Light&Lighting Laboratory, KU Leuven, Ghent, BELGIUM
Abstract
1. Motivation, specific objective
Spatial brightness plays an important role in the experience of indoor lighting. How to balance between brightness and energy saving is a challenge for interior lighting design. Nowadays, regulations mostly use illuminance to quantify the amount of light. However, illuminance is not enough to predict the brightness perception of a room. As far as we know, there are only a limited number of models, and no clear model to predict the spatial brightness of a room since there are so many diverse features such as lamp positions, light-intensity-distribution of lamps, colour of lamps, room shape, wall and object colours, etc.
With the aim of developing a model, this research focusses on identifying valid experimental indicators for estimating room brightness. This paper reports on the results of an indicator based on the concept of “brilliance”. Brilliance is related to the appearance mode of stimuli and how it changes from a black object, to a clearly reflective object (containing some grey), to a fluorent surface (no grey content visible in object) to finally a self-luminous surface as its luminance changes. The luminance thresholds at which the appearance switches mode could be used as estimators for room brightness, since immediate surround and observer adaptation state will also impact these threshold levels.
2. Methods
In this pilot study, spatial room brightness will be investigated in a room for 2 correlated colour temperatures and at 3 illuminance levels and 3 kinds of spotlight patterns. According to these 18 different interior lighting conditions, observer magnitude responses of room brightness perception B will be collected by asking them to draw a mark on a scale. After estimating the room brightness directly, observers will have to adjust the luminance of different matt and internally lit translucent spheres located at different room positions until those spheres reach a critical luminance which make them appear just self-luminous (defined as GL in brilliant research) and which make them appear just reflective (defined as G0 in brilliant research). Spheres are used to equally represent the impact from all directions. The brightness perception B, the critical brilliant luminance values G0 and GL of all testing positions for each room lighting condition will be statistically analysed.
3. Results and conclusions
This research is still in a very initial stage. Detailed results and conclusions will be reported in the full paper. It is hoped that new insights will be gained on which factors drive perceived room brightness and how it can be modelled accurately.
CIE Session 2019 – Abstract Booklet
334

PO039
IMPACT OF BACKGROUND FIELD SIZE AND CORNEAL ILLUMINANCE ON THE DEGREE OF CHROMATIC ADAPTATION
Ma, S.1, Hanselaer, P.1, Teunissen, K.2, Smet, K.A.G.1
1 ESAT/Light&Lighting Laboratory, KU Leuven, Ghent, BELGIUM 2 Signify, High Tech Campus 7, Eindhoven, THE NETHERLANDS
Abstract
1. Objective
Chromatic adaptation is an important visual mechanism for adapting to the changes in the colour (spectrum) of the illumination. As a result of chromatic adaptation, objects tend to have nearly the same colour appearance in many illumination conditions, a phenomenon known as colour constancy. CIE recommended the CAT02 chromatic adaptation transform (CAT) embedded in CIECAM02 to predict adaptive colour shifts.
CAT02 is a CAT of the von Kries type applied in a sharpened sensor space. The equation predicting the degree of adaptation (D), is only related to the luminance of adaptation field (La). In a recent study the impact of field extent on the degree of adaptation was investigated for 3 field sizes with the same luminance level. Degree of adaptation was found to increase at larger field extents. However, on the premise of the same background luminance, a larger background results in more light entering the eyes. Therefore, rather than the background field extent, it is possible that luminous flux received by eyes is the driving factor. This paper will report the results of a series of experiments with background fields of varying sizes, but with luminance values adjusted to result in equal vertical eye illuminance.
2. Method
Memory Color Matching (MCM) method has been used to collect corresponding colour sets for varying extents of the adapting field illuminated by a number of neutral and coloured illuminations. Observers were required to adjust the colour appearance of the presented stimuli until it matched the target colour in their memory. In the experiments, the stimulus background, providing the adaptation field, was a white stage. The test stimulus was a 3D grey (spectrally flat) cube centrally positioned in the stage scene. A calibrated data projector was used to provide independent and controllable illumination on the background and the stimulus. The reflected spectral radiance of the background and cube was measured by OceanOptics QE65Pro tele-spectroradiometer.
Neutral grey was the target colour used in the MCM experiments (achromatic matching). There were 3 levels of the field extent: 20°, 40°, 60°. Each experiment session included one field extent. The vertical illuminance measured at the eye position of observers was kept constant at 7 lux for all the adapting fields. The background luminance values for the three field extents were 180 cd/m2, 35 cd/m2 and 20 cd/m2, respectively. For each extent, thirteen illumination conditions were selected including four neutral illuminations (illuminants A, EEW and D65, and the most neutral white found by Smet et al.), four Planckian radiators at 2000 K, 4000 K, 12000 K and infinite K, and five high chroma illuminations (Red, Yellow, Green, Blue, and magenta). These illuminations cover a large gamut in colour space.
During the experiments, the observers were asked to adjust the apparent colour of the cube to neutral grey by a keyboard. Note that they needed to adapt for 45 seconds before starting their matching. Then they needed to rate their satisfaction of their colour match on a 0 (not satisfied at all) to 10 (very satisfied) scale. To minimize starting bias, each experiment was repeated 4 times with 4 different chromaticity starting points evenly distributed in hue. To avoid order bias, the illumination (background) colours and starting points were presented randomly within a single experiment session and the order of three sessions was also randomized. Eleven observers with normal colour vision, as tested by the Ishihara 24-plate test, participated in the experiments.
3. Analysis
Observer uncertainty and variability (intra- and inter-) were quantified by MCDM (Mean colour difference from the mean) in terms of colour difference in CIE 1976 u’10v’10 chromaticity diagram. Note that intra-variability for each illuminant condition has been evaluated with observer’s own memory
CIE Session 2019 – Abstract Booklet
335

colour, which was repeated 4 times corresponding to the 4 starting points. The higher the MCDM, the larger the observer variation (inter-variability), and the lower the repeatability or the consistency (intra-variability). The mean inter- and intra-observer MCDM values calculated across all illumination conditions for 20o, 40o and 60o adapting field are respectively 0.0097, 0.0075, 0.0094 u’10v’10 units and 0.0095, 0.0105, 0.0081 u’10v’10 units.
For each field of view, 12 sets of corresponding colour (CC) sets were derived from the 13 illumination conditions by selecting the data for illuminant EEW as reference. Firstly, the performance of the CAT02 model has been evaluated by calculating the colour difference between the visual result and the CAT02 predictions (when using the CAT02 D-formula, which is only dependent on the luminance of the adapting field). The colour differences averaged over the 12 CC sets are 0.0348, 0.0232, 0.0201 for the 20o, 40o and 60o adapting field sizes respectively. Note that prediction error decreases as the adaptation field becomes larger which indicated that the degree of adaptation is less overestimated under larger background. Previously, Smet et al. (2016) had also shown that for more chromatic illuminations, the CAT02 D overestimates the effective degree of adaptation.
Secondly, to minimize the prediction error (colour difference), the D value was optimized for each field of view and illumination condition. For almost all the illuminations, the optimized D value increases with larger adapting field even though the luminance is eight times lower for 60o adapting field than 20o. Furthermore, the difference between 20o and 40 o is more substantial than between 40o and 60o, which may result from a higher proportion of larger to smaller area of the adapting field (4.00 vs 2.25). It can therefore be concluded that the failure (lower performance) of the CAT02 model is due to an overestimated degree of adaptation, especially for small background sizes.
4. Conclusion
Even though the luminous flux entering the eyes of observers was kept constant, the extent of the adapting field still had a substantial impact on the degree of adaptation: the degree of adaptation was larger for larger backgrounds, despite their much lower luminance. In conclusion, the extent of the adapting field should be taken into account to improve the degree of adaptation formula in the future.
CIE Session 2019 – Abstract Booklet
336

PO040
REAL VS RENDER: COLORIMETRIC AND PERCEPTUAL ACCURACY USING A REAL AND RENDERED CORNELL BOX WITH HEAD-MOUNTED DISPLAY VIRTUAL REALITY
Walkom, G.V.1, Hanselaer, P.1, Smet, K.A.G.1 1 Light&Lighting Laboratory, KU Leuven, Ghent, BELGIUM
Abstract
1. Motivation, specific objective
The Cornell box, consisting of gray walls with one red and one green wall, has been adopted in many computer graphic studies to show the interaction of light in computer renderings versus real scenes. Although the Cornell Box is used throughout studies in computer graphics, it is currently unknown how the colorimetric and perceptual accuracy of the Cornell Box renderings actually correspond to that of a real Cornell Box.
The main objective of this study is to bridge the gap between the unidentified colorimetric and perceptual accuracy of the lighting in a rendered and real Cornell Box. As DIALux is one of the most commonly used software packages by industry for simulating real lighting scenes, the Cornell Box will be modelled using DIALux and also the current state-of-the-art, spectral and physical based renderer (SPBR), Mitsuba. Comparisons of colorimetric and perceptual accuracy will be made with the real Cornell Box, a Cornell Box in DIALux, and a Cornell Box in Mitsuba to truly show how the interaction of light with materials compares amongst them.
2. Methods
A real Cornell Box will be built using the same characteristics of Cornell Boxes mentioned in literature, with the walls and objects layered with uniformly coloured paper. The spectral reflectance of the coloured paper shall be measured with a HunterLab UltraScan Pro and checked for (absence of) fluorescence. Once assembled, the XYZ tristimulus maps of the Cornell Box will be acquired using a TechnoTeam LMK-5 Color Luminance Camera. The spectral irradiance of the real Cornell Box will then be also measured, using a GigaHertz Optik BTS256E spectral irradiance meter.
A 3D model of the Cornell Box will be accurately created in DIALux evo using the same measurements as the real Cornell Box. DIALux evo allows Light-Intensity-Distribution (LID) (LDT files) to be easily added to a scene, accurately showing the same distribution of light as a real luminaire. The measured spectral reflectance data of the paper – necessarily assumed to have a Lambertian Bi-Directional-Reflectance-Distribution (BRDF) in DIALux – in the real Cornell Box will be added to the objects accordingly in the DIALux scene to model the scenes as closely as possible.
Similar to in DIALux, a 3D model of the Cornell Box will be produced in Blender using the same measurements as the real box, and then rendered in Mitsuba. As Mitsuba does not have a function to include LDT files in a scene, but it is however open-source, a function that uses a lamp with a texture to portray an LID can be added. The BRDF of the paper shall be measured in a goniophotometer and modeled with a combination of a diffuse (using the Oren-Nayar model) and a specular (using a Torrance-Sparrow model with a Beckmann facet distribution) BRDF. The fitted parameters and the measured spectral reflectance will then be used as input to Mitsuba. The XYZ tristimulus values are then acquired from the same point of view and with the same field of view as the luminance camera in the real scene. Mitsuba’s default settings use Tone-Mapping-Operators (TMOs) to tone map the images after rendering. As most TMOs do not currently consider colour appearance and are often followed by colour correction, tone mapping will be avoided. This is achieved by adapting the XML code of the Mitsuba scene to render to a pixel format of XYZ, changing the film type to mfilm, and the file format to numpy to be able to open and analyze the XYZ tristimulus values using the luxpy package in Python.
To evaluate the colorimetric accuracy of the real Cornell Box, the Cornell Box in DIALux, and the Cornell Box in Mitsuba, the measured XYZ tristimulus maps will be compared to analyze the luminance difference and CIE 1976 u’v’ chromaticity difference.
CIE Session 2019 – Abstract Booklet
337

The rendered Cornell Box from Mitsuba will then also be visually evaluated using Head-Mounted Display Virtual Reality (HMD-VR) for perceptual accuracy in terms of perceived brightness, colourfulness, hue, and contrast in comparison with the real Cornell Box. Perceptual accuracy will be evaluated using magnitude estimation, rating scales, memory colour matching (MCM), and a questionnaire on the perceived quality.
3. Results and conclusions
Detail results and conclusions will be reported in the full paper.
CIE Session 2019 – Abstract Booklet
338

PO041
COLORIMETRIC ACCURACY OF A SIMULATION OF THE LIGHTING IN A REAL TUNNEL
USING A PHYSICAL BASED RENDERER AND USING DIALUX
Smet, K.A.G.1, Walkom, G.V.1, Lin, C.1, Hanselaer, P.1 1 ESAT/Light&Lighting Laboratory, KU Leuven, Ghent, BELGIUM
Abstract
1. Motivation, specific objective
The aim of this study is to verify the use of Mitsuba – a state-of-the-art, open-source, spectral and physical based renderer (SPBR), often used as the benchmark in the field of computer graphics – in tunnel lighting design. The results have been compared to results obtained with the commonly used non-SPBR lighting design software DIALux. A second objective was to check if the lighting installation in real tunnels is over-dimensioned compared to their designed target values.
2. Methods
A 3D model of the central zone of a real tunnel, the Gaasperdammer tunnel near Amsterdam, was created in DIALux (4 and evo) and in Blender 2.79b. DIALux models were produced using several different scene options: ‘street’ and ‘outdoor and building’ (DIALux evo); and ‘street’, ‘outdoor’ and ‘indoor’ (DIALux 4).. The Blender generated XML file was then used as input for spectral, physical based rendering using Mitsuba.
The Light-Intensity-Distribution (LID) of the luminaires was set based on information provided by their LDT file. LDT files can be directly imported in DIALux. However, Mitsuba did not have this functionality. Its C++ code was therefore extended with a new type of lamp that wraps a UV texture representing the LID around a point light source.
In street lighting, road surface characteristics are typically characterized by an R-table containing reduced luminance coefficients specifying the luminance for a viewing direction of 1° with the road surface along the driving direction. Measured R-tables can be directly imported in DIALux 4, while in DIALux evo the user has to select one of several predefined standard R-tables (N2 was used in this study). In Mitsuba, material properties are specified in a model of a surface’s Bi-Directional-Reflectance-Distribution (BRDF). The BRDF of the road surface was modeled using a combination of an Oren-Nayar (diffuse) and a Torrance-Sparrow (specular) BRDF model based on microfacets. Model parameters were obtained by fitting to the reduced luminance coefficients of the road’s measured R-table.
In DIALux, all surfaces (except for the road in a ‘street lighting scene’) are considered Lambertian. However, this is not necessarily the case in practice. This discrepancy has been reported as one of the reasons why luminance measurements can substantially deviate from the designed target values. It is therefore expected that the use of more representative BRDFs, such as is possible in Mitsuba, should provide better agreement with the measured luminance values. As no real material samples could be provided for BRDF measurement, the BRDFs of other materials (walls, barrier, ceiling) were estimated based on parameters for the Oren-Nayar model reported in literature, specifically the online CURET BRDF database.
To verify the values reported by the DIALux and the Mitsuba simulations, spectral and colorimetric measurements (spectral irradiance and XYZ tristimulus maps) were made on-site in the real tunnel. Tristimulus maps were measured from the point of a view of a centre lane driver, i.e. the camera was positioned 1.5 m above the road surface and had a 1° downward tilt.
An analysis was made of the agreement between the measured and simulated horizontal illuminance distribution in a 100 m long section of the tunnel. Colorimetric agreement between the measured and the rendered (using Mitsuba) XYZ maps was also analyzed in terms of luminance and colour difference in CIE u’v’ coordinates based on a comparison of spot sampling at different locations in the maps.
CIE Session 2019 – Abstract Booklet
339
3. Results
The results show that there is some discrepancy between the measured and rendered XYZ maps. However, the magnitude of the differences is small or comparable to the inherent non-uniformities present in the real tunnel. It is also found that the use of appropriate BRDFs for the walls, barriers, ceiling and road surface is important to realizing accurate predictions. They also indicate that good agreement of the horizontal illuminance distribution is not a sufficient condition for good agreement of the road surface luminance as viewed by a driver. Using Lambertian BRDFs for all surfaces, such as when using a 500 m long room in the ‘outdoor and building’ option in DIALux evo and the ‘indoor lighting’ option in DIALux 4, gave good agreement in terms of horizontal illuminance, but failed to reproduce accurate road luminance as viewed by a driver. Ignoring the contribution of walls, barriers and ceiling altogether, such as when using the ‘street’ lighting scene option in DIALux, leads to an underestimation (and hence over-dimensioning of the tunnel lighting system and waste of energy) of approximately 22% in horizontal illuminance and 11% in road luminance as viewed by a driver. Finally, a comparison of the rendered and measured road luminance values (as viewed under a 1° angle with the road surface) with the values predicted from Q0 and the average horizontal illuminance showed that they were substantially underestimated by 35% and 39% respectively. Such underestimation would again lead to a substantially over-dimensioned lighting installation.
4. Conclusions
State-of-the-art renderer capable of including specific characteristics of light sources and materials, such as spectrum, light-intensity-distribution, and BRDFs are promising tools for accurate tunnel lighting design. In particular, the open source nature of Mitsuba, offers additional opportunities, as it can be adapted to suit the specific needs of a project. It does, however, require a quite steep learning curve, technical know-how, and coding skills, if one intends to extend its functionality. A sensitivity analysis of the various rendering choices that have to be made is recommended to optimize and facilitate (by proposing default setting) its use for non-technical users.
The use of appropriate BRDFs is important to realizing accurate predictions. Ignoring the impact of walls and ceiling, or using the road’s Q0 value to estimate the road luminance as seen by a driver lead to substantial underestimations, resulting in over-dimensioned lighting installations and an excessive consumption of electrical energy.
CIE Session 2019 – Abstract Booklet
340

PO042
MEASUREMENTS OF INTRAOCULAR STRAYLIGHT, VISUAL SENSITIVITY, AND DISCOMFORT GLARE FOR YOUNG AND ELDERLY OBSERVERS
Tachikawa, Y.1, Tsuchiya, N.1, Ishikawa, T.1, Ohnuma, K.2, Ayama M.1 1 Utsunomiya University, Tochigi, JAPAN
2 Chiba University, Chiba, JAPAN
1. Motivation, specific objective
Disability glare is known as the light-veil by glare sources that disturbs a visibility of target caused by straylight in the eye. Factors that brought straylight in the eye are the forward scatter by the ocular media such as crystalline lens, the fundus reflection, and the penetration through sclera and iris. We have been studying to estimate the amount of straylight in the eye using psychophysical technique for the last few years to accumulate data for elderly and young observers. Because we employed a veiling method, our results reflect disability glare property of individual observers.
Discomfort glare is known as a dazzling of light that causes uncomfortable sensation. A number of studies have been reported on discomfort glare using LED lighting in the past 10 years. Let’s say the the border luminance between acceptable and unacceptable discomfort glare, Lborder,glare, here. About the age dependency, the previous study by Kimura et al.(2010) indicated no significant difference of Lborder,glare between elderly and young observers for various colour LEDs except the blue LED. They tried to explain the results by the decreases of crystalline-lens transparency of and spectral brightness sensitivity of elderly observers in short-wavelength region, but the data employed in their analysis were not measured using their observers.
Kimura et al.(2010) considered spectral brightness sensitivity as a factor to explain discomfort glare property, but did not fully succeed. So, we consider not the brightness sensitivity, but the absolute visual sensitivity of individuals might be related to Lborder,glare.
Few has been reported on the factors to contribute discomfort glare except the study by Bargary et al.(2018). Objective of this study is to reveal the relation between the straylight in the eye, visual sensitivity, and discomfort glare for elderly and young observers.
2. Methods
We conducted three experiments using young and elderly observers.
2.1 Estimation of straylight in the eye
Four colour LED of white, blue (p = 444nm), green (p = 533 nm), and red (p = 630nm), were used as glare sources and set at 7 degree on the right-hand side from the line of sight. Illuminance at the eye, denoted as Lglare, was set to 7 to 9 lux. In this study, only the results of white LED are shown because discomfort glare and visual sensitivity were measured only for the white LED. A Gabor stimulus, of which carrier wave of spatial frequency is 2.2 cpd and standard deviation of the envelope wave is 0.46 deg, was used as the visual target.
The first step was to determine the threshold contrast of the Gabor stimulus with one of the LED glare source. Then in the second step, the same LED source was moved to the position perpendicular to the observer’s line of sight and superimposed to the Gabor stimulus using the half mirror. Luminance to veil the Gabor stimulus, Leq, was measured. Then the straylight parameter, s ( = square of degree multiplied by Leq and devided by Eglare ) was calculated. Log s is widely used as an index to the amount of straylight in the eye.
2.2 Discomfort glare measurement
The same white LED was used as a glare light, and the ND filters were combined to generate 7 levels of illuminance. Subjective evaluation was carried out using 9 levels of evaluation words, “1: Noticeable, 3: Acceptable, 5: Just admissible, 7: Disturbing, 9: Unbearable”.
CIE Session 2019 – Abstract Booklet
341

2.3 Visual sensitivity measurement
The same white LED was used as the test stimulus and the ND filters were combined to generate 10 levels of luminance. After 5 min dark adaptation, stimulus including dummy (no stimulus) was presented 0.5 sec. 2AFC method was employed. Luminance value of 50% seen in the probability of seeing curve, Lth, was defined as the threshold. This means detection threshold of individual observer using the same apparatus was measured.
2.4 Observers
So far 6 elderly in their 60’s and 9 young in their 20’s participated all experiments.
3. Results
Straylight parameter s is larger in the elderly group than younger group, mainly due to the yellowness of crystalline lens in the former. Detection threshold Lth of elderly observers is generally higher than that of young observers, i.e., visual sensitivity of the elderly is lower than the young in this study. Average value of border luminance of discomfort glare, Lborder,glare, of elderly is slightly higher than that of young, but no significant difference between them.
We plotted elderly and young data together, in the graphs to see the relations between 1) log s and log Lborder,glare, and 2) log Lth and log Lborder,glare. No significant correlation was found between log s and log Lborder,glare, however, within the young observers, weak negative correlation was found. This suggests that in the same age group, the more straylight, the more sensitive to discomfort glare. Fairy strong correlation was observed between log Lth and log Lborder,glare. This implies that the more sensitive to light, the more sensitive to discomfort glare.
Multiple regression analysis was applied with log s and log Lth as explanatory variables and with log Lborder,glare as the target variable. In the regression equation, correlation coefficients for log s and log Lth were -0.15 and 0.82, respectively, and correlation between experimental and estimated results was 0.74, indicating relatively strong correlation.
Conclusion
Triad relation among 3 properties, the straylight in the eye, visual sensitivity, and discomfort glare, for elderly and young observers was investigated. The first step of straylight parameter is equivalent to the measurement of disability glare. Therefore, our results will provide a bridging data between two glare properties with the consideration of visual sensitivity. Further collection of data is needed.
CIE Session 2019 – Abstract Booklet
342
PO043
EFFECTS OF LIGHT COLOUR ON WORK EFFICIENCY AND ALERTNESS
Takahashi, H.1, Watanabe, S.1 1 Kanagawa Institute of Technology, Atsugi, JAPAN
Abstract
1. Introduction
The use of light-emitting diode (LED) lighting has now become widespread. Such light sources emit light in the primary colours of red, green, and blue, and are thus capable of reproducing most chromatic colours. Such light colours have been found to have both physical and psychological effects on human beings. For example, some studies have reported that long-wavelength (red) light increases alertness in the daytime. Other studies have reported that chromatic colour lighting influences cognitive performance. However, the lighting conditions used in past studies are considered to be unnatural because they were conducted under low illuminance conditions, and those studies did not clarify the effects of chromatic colour lighting on alertness. Therefore, this study aims to investigate how work efficiency and alertness can be affected by chromatic light.
2. Methods
In this experiment, the work surface illuminance was set to 200 lx. White, red, green, blue lights were used in this experiment. From test subjects electroencephalogram (EEG) data recorded throughout the experiments. Data were grouped into the following two frequency ranges: 8-12 Hz (alpha), 13-30 Hz (beta). In this experiment, the subjects were asked to perform three different tasks: calculation, typing, idea after adapting each lighting condition for 10 minutes. Calculation task was hundred-square calculations. Hundred-square calculations involve a 10-by-10 grid, which is filled in by adding the numbers at the top and side of the grid. Typing task was typing Japanese sentences. Idea task was matchstick puzzle.
Each test subject was given 10 minutes to adapt to the each lighting condition. Then, the subject performed calculation task for 10 minutes and then performed typing task and idea task for 10 minutes each. The test subjects were 5 males in their 20s.
3. Results
The average of alpha wave intensity during adaptation was lowest for green light. It is suggested that the alertness may be increased by green light. EEG power during each task was normalized to the power obtained during the initial adaptation. In all conditions, power in the alpha was higher than during initial adaptation. The subjects may have relaxed during performing experimental tasks since these tasks were simple tasks. In the calculation task, powers in the alpha were lower in all chromatic lights colours compared with white light. In the typing task, powers in the alpha were lower in blue and red lights colours compared with white light. In the idea task, powers in the alpha were almost the same for all light colours.
Working efficiency with green light was the highest in calculation task and typing task. Working efficiency with red light was the highest in idea task.
4. Conclusions
In this study, the effects of chromatic lighting environment on work efficiency and alertness were investigated. As the results, it was suggested that power in the alpha could be suppressed by chromatic light. Furthermore, it was found that there is a difference in working efficiency depending on light colour. However, since this study has fewer subjects, a more detailed investigation with an increased number of subjects will need to be undertaken in the future.
CIE Session 2019 – Abstract Booklet
343

PO044
APPLICATION OF CIE 13.3-1995 WITH ASSOCIATED CRI-BASED COLOUR RENDITION PROPERTIES
Teunissen, C.1, Denneman, J.2, Mukai, K.3, Wang, S.4 1 Signify, Eindhoven, NETHERLANDS, 2 CarpeLucem, Eindhoven, NETHERLANDS, 3 Panasonic,
Osaka, JAPAN, 4 China Academy of Building Research, Beijing, CHINA
Abstract
The CIE general colour rendering index (Ra), as defined in CIE 13.3-1995, is widely adopted and used by the lighting industry, in regulatory documents and in international and regional standards and specifications. Ra represents an average shift in colour appearance for a set of eight moderately saturated test-colour samples (TCS) under a test light source in comparison to a reference illuminant, having the same correlated colour temperature (CCT) as the test light source. Neither Ra nor the special colour rendering indices, Ri, provide information on the direction of the colour shifts. However, it is well-known that the direction of the colour shifts (e.g., resulting in an increase or decrease of the colourfulness) can also contribute to the appreciation of the perceived object colours. In addition, still many people believe high Ra provides superior colour quality and that two light sources with similar CCT and Ra values should have equal colour rendition performance. At this moment, there is no international (CIE) standard that provides additional information, beyond CCT & CRI, with which differences, in colour rendition, between light sources (with similar CCT and Ra values) can be objectively characterised. Without these additional, internationally standardized, objective measures, it will remain difficult, for non-experts in the field of colour science (e.g. normal consumers), to compare the colour rendition performance between light sources in all aspects.
In 2017, the CIE published Technical Report 224 “CIE 2017 Colour Fidelity Index for accurate scientific use”, describing a scientifically more accurate fidelity index, Rf, prepared by CIE Division 1 Technical Committee (TC) 1-90. As mentioned in the report, practical applicability of Rf is still under evaluation and the development of a harmonized set of colour quality measures for assessing perception-related effects beyond fidelity has been proposed. The new CIE 2017 colour fidelity index, Rf, is not recommended as a replacement of the CIE general colour rendering index, Ra, neither for the purpose of rating and specification of products nor for regulatory or other minimum performance requirements. Consequently, Ra will continue to be used in the lighting industry until the CIE completes this work.
Meanwhile, the lighting associations, such as the Global Lighting Association (GLA), LightingEurope, and the Middle East Lighting Association (MELA), expressed in their respective position statements the urgent need for additional colour-related specification items that can supplement the well-established Ra.
Based on the work completed within CIE Reporter DR 1-68 “A Gamut Area Measure and Colour-shift Graphic, based on CIE 13.3-1995”, the GLA published a document and an associated calculation tool, that describes the precise procedure for computing the CRI values, Ra and Ri, and, in addition, it provides information on the direction of the colour shifts for all CIE 13.3-1995 TCS. The Excel calculation tool is provided for the users of CRI as the old DOS-based tool, provided by CIE in the past, may no longer run on modern computers. Furthermore, the calculation tool ensures a consistent calculation of the correlated colour temperature and all CRI values. CIE publications 13.3-1995 and 224:2017 do not specify the exact procedure for calculating the CCT, whereas the CCT is used to generate the reference illuminant. Small variations in CCT, e.g. due to differences in wavelength range or wavelength interval, may impact the CRI values, which became apparent during the update of CIE publication 15 in TC 1-85. The CCT and CRI values, between participating TC 1-85 members, were slightly different, initiating the discussion which values are the “correct” ones. Providing an easy to use calculation tool is therefore important to enable a consistent reporting of the CRI values for as long as CIE 13.3-1995 is in use.
The associated CRI-based colour rendition properties, described in the GLA publication, provide information on the direction of the colour shifts. To retain the characteristics of CRI, the associated colour rendition properties are based on the same CIE 1964 uniform scale coordinates as for
CIE Session 2019 – Abstract Booklet
344

calculating the CRI values. The described properties include a colour gamut index (Ga) to indicate if the colour gamut of the test source becomes smaller or larger than the colour gamut of the reference illuminant, it includes chroma indices (Ci) to indicate if the chroma (related to colour saturation) of the individual TCS will become smaller or greater (leading to a less or more colourful appearance of object
colours), and it includes hue-angle changes (hi) to indicate if the tone of the colour will change or not. Together with Ra, the associated colour rendition properties may be useful to objectively explain why object colours can appear differently when illuminated under light sources with similar CCT and Ra values.
It should be noted that in addition to the method described in the GLA publication, other methods have been proposed to augment colour fidelity with gamut area, chroma and/or hue metrics, including IES TM-30, but none of these methods is compatible with CRI. Furthermore, as also indicated in the disclaimer of the GLA publication, the GLA does not prescribe mandatory use of any method, but the GLA document with the CRI-based colour rendition properties is provided for evaluation and voluntary usage by members of the lighting industry and other interested parties and can serve as input for a future global colour rendition standard. As mentioned before, the calculation tool is provided for an easy and consistent calculation of all values.
The poster will explain the most important details of the CRI-based colour rendition properties, described in the GLA publication, and the importance of the accompanying calculation tool.
CIE Session 2019 – Abstract Booklet
345
PO045
A QUANTITATIVE VISUAL EVALUATION METHOD FOR IN-VEHICLE OPTICAL DEVICES BY LIGHTING SIMULATION
Toyota, T., Shichi, W. and Suzuki, T. Industrial Research Institute of Shizuoka Prefecture, Shizuoka, JAPAN
Abstract
1. Motivation and purpose of the study
The market for automotive in-vehicle optical devices in 2022 is expected to grow 1.7 times the size of the 2013 market. These in-vehicle optical devices are roughly divided into devices for lighting, display, and sensing. Displays, such as speed meters and head up displays (HUD), account for about 70% of the entire market.
In recent years, many new car models in Japan now have HUDs as a manufacturer-supported part. HUDs can convey information effectively without the need to change the driver's visual focus.
HUD products generate a virtual image at an appropriate distance from the driver so as not to hinder driving. The driver observes the virtual image, fused with their surroundings, through the windshield. Since the quality of the observed virtual image varies dynamically with the movement and vibration of the vehicle, it is important that the projected virtual image has adequate visual contrast against the surrounding environment.
Generally, HUDs are designed by optimizing the shape and arrangement of its optical components under an ideal lighting environment using a computer aided engineering (CAE) method.
The visual quality of HUD products is evaluated in a specific experimental environment at a certain date, time, and weather conditions, with the prototype products mounted on automobiles.
As the environmental factors of the experiments are influenced by the date, time, and weather conditions, they are difficult to control, leading to problems in reproducibility.
However, CAE technology can take a simple environment, such as the daylight described in CIE S 011, into account, but it is difficult to reproduce complicated external environmental factors such as the interreflections from buildings and roads.
In this study, we introduce the Image Based Lighting (IBL) method and expand upon it to reproduce the surrounding environment without the need for things such as complicated shape modeling or surface reflection characteristics measurements of the external structure.
The final goal of this study is to quantitatively evaluate the visual evaluation of automotive in-vehicle optical devices, such as HUDs, in consideration of photometric and colorimetric values using lighting simulation.
2. Method
Light Probe is a light source in IBL. It is a panoramic image with omnidirectional view information (all around view), and each pixel contains information with a high dynamic range. In this study, a celestial spherical camera (THETA V; manufactured by Ricoh) was used to reduce the time lag between the captured images as much as possible, reducing the spatial unconformity between a set of images. The exposure time was systematically controlled for the measured images and the other capturing parameters were fixed.
Light Probe was generated using the following four steps:
1. Inverse gamma correction. All base images were converted to linear tone levels in order to cancel nonlinearity of tone levels by the gamma correction. The gamma value was estimated beforehand using reflectance standards.
2. Tone level conversion. Based on the exposure time, the pixel linear tone level of the base image was converted in proportion to the exposure time.
CIE Session 2019 – Abstract Booklet
346
3. Image construction. Each pixel value of Light Probe was calculated by averaging over the linear tone level of a set of base images except underexposure image and overexposure image.
4. Store image. Light Probe was saved in HDR format, which is compatible with many lighting simulation systems.
A series of image processing was performed by MATLAB R2015a. While a single original image has 256 tone levels for each colour channel, the Light Probe generated by this method has 4,294,967,296 tones in each colour channel.
3. Results
Four different scenes (corridor, garage, outdoor, indoor) were selected, and 11 base images were captured for each scene. The geometric projection of the Light Probe was an equidistant cylindrical projection. The resolution of the images was 5,376 pixels width by 2,688 pixels height and approximately 0.07 degrees per pixel in viewing angle.
In order to validate the capability of the Light Probe processed by the proposed method, a shape model with three hemispheres, three semicylinders and three rectangular parallelepipeds on the desk was prepared, and three kinds of surface attributes (perfect mirror, opacity paintings, and clear resin) was defined on each model surface. In this study, two types of ambient environmental lighting conditions were set: One was IBL using Light Probe processed by the proposed method and the other was reproduced daylight based on CIE S 011. Monte-Carlo ray tracing was performed using Integra Lumicept until the accuracy of the illumination maps reached 0.5% or less. The result of lighting simulation was generated as a rendered image with a fixed viewpoint. The resolution of the image was set to 1,024 pixels width by 768 pixels height.
These results found that lighting simulation using IBL was achieved realistic rendered image which were based on physical phenomena such as inter-reflect and reflection image on the surface caused by ambient light however the reproduction of the shadow made by objects were absent.
On the other hand, the result of lighting simulation using only Daylight showed that the boundary of reproduced shadow formed by objects were sharp however feeling of material for each object were different with the images by IBL.
4. Conclusions
Image Base Lighting using Light Probe can reproduce complex ambient light environments without any geometric modeling or measurement of surface characteristics of any structures except for the objects to be evaluated in the scene.
In order to realistically reproduce the shadows cast by the object, further study is necessary on the combination of Light Probe and daylight as auxiliary light.
A future work is to correlate the pixel value of Light Probe with the photometric value in order to evaluate quantitatively in absolute luminance values by lighting simulations.
CIE Session 2019 – Abstract Booklet
347
PO046
COLOUR PREFERENCE IS DEPENDENT OF CORRELATED COLOUR TEMPERATURE, CHROMA ENHANCEMENT AND ILLUMINANCE LEVELS - EXPERIMENTS AND
ANALYSIS
Vinh, Q. T.1, Bodrogi, P.1, Khanh, T. Q.1 1Technical University Darmstadt, Laboratory of Lighting Technology, Darmstadt, GERMANY
Abstract
Colour fidelity (CF) was studied for a long time in the manner of the comparison between test and referent light sources based on the several concepts of colour differences. Colour saturation (CS) is also discussed in the applicable approach of colour gamut or chroma differences. Colour preference (CP) plays the middle role of two mentioned colour metrics regarding the asymmetric combination of CF and CS. Some studies for this approach were carried out since the beginning idea of the Flattery Index (Judd, 1967) to the advanced concept of colour preference (Qp, CQS, Ohno et. at., 2010). However, all of them was not operated well in the full concern of correlated colour temperatures and illuminance levels. Therefore, in this work the visual experiments are applied and analysed for describing the colour preference under different correlated colour temperatures and illuminance levels. The new correlations in the context of multi - dimensions are discussed operatively in order to establish the new direction of an available colour preference. As a result, the progress from the colour quality (CQ) into lighting quality (LQ) is conducted as the essential demand of modern lighting systems.
1. Motivation, specific objective
Natural light sources, what are familiar with human life, cannot serve themselves in the condition of night and dark environments. Incandescent lamps of Thomas Elva Edison helped to open the night life, but yellow spectral ratio cannot satisfy the human demand of the beauty of lighted objects. The early improvement of fluorescent lamps served mainly to enhance for the energy efficient use, although colour factor including correlated colour temperature (CCT) and colour rending index (CRI) have been also accounted in some extent. Nowadays, the modern solid state lighting system with semiconductor LEDs, phosphor converted LEDs and hybrid multi-channel LED-luminaires can fulfil nearly all diversified aspects of static and dynamic human demands on both colour quality and light quality. Therefore, the scientific requirements of the appropriate colour metrics and light metrics are issued naturally. Then, the traditional colour metrics based on only unique CF must be modernized appropriately and the frequent discussion of CS should be more deeply operated. The visual experiments and corresponding computations should be implemented as parallel so that possible issues can be processed for more available and applicable solutions of metrics. In this work, the visual experiments under specific illuminances, CCTs and chroma enhancement levels and the mathematical formulations will be described for moving gradually from the colour quality into the light quality for a relevant evaluation of modern lighting systems.
2. Methods
In the framework of the experiments, the test persons experienced under the lighting conditions of three CCTs (warm white 3000 K, neutral white 4100 K and cold white 5600 K) of a hybrid multi-channel LED-luminaire that can be programmed for its absolute spectrum with different CCTs, illuminance and chroma enhancement levels. The test colour samples (TCSs) in the experiments are both standard Macbeth Colour Checker and familiar coloured objects (such as children pullover, paintings and others). The unique question is, how high your preference level is, based on observing the coloured objects under the lighting conditions of different correlated colour temperatures, chroma enhancement and illuminance levels. The answer of test persons is expressed in a semantics scale.
3. Results
The most available results achieved from the visual experiments in Part 2 are used for establishing the three - dimensional correlation of the visual evaluation with illuminance and chroma enhancement levels under three lighting conditions of warm white (WW), neutral white (NW) and cold white (CW). Based on the achievements, it can be recognized that although the absolute levels of the computed
CIE Session 2019 – Abstract Booklet
348

models are different, but their mathematical formats are similar and they have an important meaning correlating specifically with the quality evaluation and optimization of modern lighting systems.
4. Conclusions
The results of this work identified obviously that the visual evaluation of the human perception is not only dependent on the colour fidelity, but also on chroma enhancement, correlated colour temperature and illuminance. As well, the total chroma difference (TCDa) in the mentioned computation can play a good role for describing the chroma enhancement, mathematically.
Based on the achievements, the evaluation of light sources following only test colour samples and consequently colour quality is out of date and necessary to be renovated into the new format of light quality, where the illuminance, correlated colour temperature, colour difference, chroma difference and even hue difference should support each other for a complete perception of the quality of light sources and lighting quality which are more available, practical and effective in the real applications of human-oriented lighting systems.
CIE Session 2019 – Abstract Booklet
349
PO047
DISCOMFORT GLARE FROM UNIFORM LIGHT SOURCES WITH IMMEDIATE SURROUNDS
Tyukhova, Y 1 Acuity Brands Lighting, San Francisco Bay Area, USA
Abstract
1. Motivation, specific objective
Significant improvement of lighted environments requires understanding of the impact that lighting quality has on human needs. Visual comfort and glare are important aspects of lighting quality. Glare is an extreme form of non-uniformity (high contrast), and it occurs if luminance is too high, or luminance ratio is too high. Glare can have a disturbing effect on visual performance, it is known as disability glare, and glare may also have a distinct discomforting effect, and it is called discomfort glare. These two types of glare may be caused by partly different mechanisms in the eyes, nerves and brain.
Small and bright LED sources provide flexibility for designing luminaires with various optical distributions, but, also, increase the number of complaints about glare from these sources. To avoid the non-uniform look of the LED array and to reduce high luminance, edge-lit light guide plates (LGP) are used in some indoor and outdoor luminaires. Light sources are placed at the edge of the panel and light propagates through the panel by total internal reflection and exits through the etched pattern on a side of the LGP as visible illumination. In some cases, these sources might still have a high average source luminance, which is one of the four factors that is known to participate in the perception of discomfort glare from a single source (other three being size and position of the light source in the field of view, and the luminance of the background).
Immediate surround to the glare source is another factor to be considered when estimating discomfort glare. Hopkinson (1957) had a term for the immediate surround luminance in his formulation of the glare sensation. He found that an immediate surround decreased the glare sensation, when its luminance was intermediate between the glare source luminance and the background luminance. Recently, Sweater-Hickcox (2013) showed that the luminance and colour of the immediate surround influence the perception of discomfort glare from an LED array.
With the introduction of LEDs with various spectral power distribution (SPDs), the effect of spectrum has received renewed interest. A number of authors have found that SPD has an influence on discomfort glare perception.
The goal of this study is to investigate the influence of immediate luminous surrounds of different CCTs with a uniform light source on discomfort glare perception at the lower end of the photopic vison.
2. Methods
To investigate the effects of the immediate surround on the perception of discomfort glare from a uniform light source, a special light source was built. The test light source consisted of two parts – the centre part and the surrounding ring. Both luminance and the CCT of the centre and the surround were controlled separately. The light source was viewed against a white wall that was illuminated by three LED flat panels. Background luminance was 5 cd/m2 across all experimental conditions. Black curtains were placed in the room to absorb scattered light. The source was positioned 4.88 m from the
observer with the total light source subtending a visual angle of 7⁰ and the centre part of the source
subtending a visual angle of 5.1⁰.
A human subject experiment consisted of 12 experimental conditions. Two independent variables were used in this study – luminance of the centre part of the source (5,500, 25,000, 40,000 cd/m2) and CCT of the surround (“reflected”, 2,700, 4,000, and 6,500K). Three “reflected” surround conditions imitated the surround with a low reflectance (L= 200 cd/m2, 4,000K). In the other 9 conditions, luminance of the surround was 5,000 cd/m2. The CCT of the centre part of the source was 4,000K for all conditions.
CIE Session 2019 – Abstract Booklet
350

A total of 27 human observers (6 female and 21 male) with the mean age of 37 (ranged from 24 to 67) participated in the study. All participants signed a consent form. All observers had normal vision (at least 20/63 in both eyes) that was checked using the visual acuity test from Precision Vision and normal colour vision using Ishihara’s Tests for Colour Deficiency. After the vision check-up, the participants were instructed on the procedure of the study. Then observers were positioned on the chin rest to directly view the light source (on the line of sight). Before starting the experiment, participants completed three experimental trials to get familiar with the procedure.
Each subject saw each of the 12 experimental conditions in random order. Subjects were continuously viewing the glare source until they made the assessment on a glare rating scale from 0 (no discomfort) to 6 (intolerable). There was an approximately 1 minute of adaptation time between the experimental conditions. During each experimental condition and each subject, an illuminance reading was taken at the eye level with the CL-200 chroma meter (Konica Minolta) and the luminance and CCT of the surround of the test light source were measured with a spectrophotometer Spectaval 1501 (JETI) to ensure that the conditions were stable for all subjects. After the experiment, subjects filled out a survey on the study.
3. Results
Data were collected in late December of 2018. The data will be analysed using a repeated-measures Analysis of Variance (ANOVA). The results of this study will investigate the effects of CCT of an immediate luminous surround for a uniform light source of a normal size.
4. Conclusions
Based on the results of this study, future direction/recommendations and/or follow-up studies will be proposed.
CIE Session 2019 – Abstract Booklet
351

PO048
EXPERIMENTAL STUDY ON CHEMICAL AND COLORIMETRIC CHANGES OF ART MATERIALS BY LED IRRADIATION
Szabo, F. 1, Pintus, V. 2, Csuti, P.1, 1 Light and Colour Research Laboratory, University of Pannonia, Veszprem, HUNGARY
2 Academy of Fine Arts, Vienna, AUSTRIA
Abstract
1. Motivation, specific objective
The main focus of the bilateral research project entitled “LED lighting ageing studies of paint materials used in art” was the investigation of the effect of LED-lighting on some art paint colours by reproducing indoor museum conditions applied on art materials.
2. Methods
The materials selected for this project were aimed to reproduce as much as possible paint colours used in the field of modern and contemporary art and thus mostly based on different types of synthetic organic binders and pigments. “2-components self-made paint” mock-ups were prepared by mixing inorganic pigments (P) powders with an alkyd, acrylic and linseed oil binding media (BM) in different ratio (P/BM) depending on the consistence of the paint achieved. For the lighting exposure of the samples three different lighting systems were used. i) and ii) were based on spectrally tuneable LED lighting booths, with different spectral shape and content between 410 nm and 490 nm. iii) A set of cold mirror incandescent halogen lamps, which is widely used in museum environment.
The test lights had high colour rendering index (CRI Ra ≥ 88), high colour fidelity and gamut area index (Rf ≥ 79 and Rg ≥ 97 according to IES TM-30-15) and the correlated colour temperature was 3700 K in both cases. Furthermore for all three ageing spectra the illuminance level was set to 3000 lx. The light booths were placed in an air conditioned dark laboratory room. The room temperature was stabilized at 22 °C ±1 °C and during the ageing process. The temperature and humidity data in the LED ageing chambers were monitored.
In order to achieve not only data on the colour change of the prepared samples but also on the chemical stability of the organic and inorganic components of the specimens the following scientific methods were used before and after each ageing cycle. For colour change detection an UV/Vis/NIR spectrophotometer equipped with a D65 illuminant and 2° standard observer was used, which allowed to acquire spectra between 350 nm and 1050 nm. The stability of the organic part of the 2 components samples was investigated on the other hand by Pyrolysis Gas Chromatography / Mass Spectrometry (Py-GC/MS) analyses and also in Thermally assisted Hydrolysis and Methylation mode (THM-GC/MS). Additionally, Fourier Transform Infrared Spectroscopy analyses in Attenuated Total Reflection (FTIR-ATR) mode was also used for the same latter purpose. Furthermore, the stability of the inorganic part of the 2 main components samples was investigated not only by using FTIR-ATR technique but also by µ-Raman spectroscopy.
3. Results
Generally, among all samples the ultramarine blue-linseed oil combination resulted to be the most sensitive towards the ageing under the used lighting systems. In accordance to the Py-GC/MS results, indeed the linseed oil mixed with the ultramarine blue PB29 pigment had in the highest increase of the dicarboxylic azelaic acid formed during oxidation, cross-linking and chain scissions of unsaturated fatty acids portion of the dying oil binder. Additionally, the slightest decrease of the ratio value between the carbonyl IR band of the binder and the Al,SiO4 IR band of the ultramarine blue indicated a relative enrichment of the pigment at the surface while a photo-oxidative degradation processes occurred on the organic part of the sample. Concerning the inorganic pigments, no noticeable differences were registered by µ-Raman spectroscopies demonstrating their high stability to the used ageing conditions. Finally, in support to the chemical changes occurred on the blue linseed oil mock-up during the ageing, colour measurements showed the highest colour change for this kind of pigment-binder combination. Thus the average CIELab colour difference (ΔE*) was more than four units in case of all aged blue linseed oil samples and the LED-A irradiation proved to be the most harmful one. In this case the
CIE Session 2019 – Abstract Booklet
352

average ΔE* colour change was even greater than five units. The green PG18 and yellow PY37 pigments also showed the largest change in combination with the linseed oil binder. While the halogen spectrum is considered to be the most harmful for PG18–linseed oil combination, the PY37–linseed oil sample showed the greatest change in case of LED-B spectrum. On the other hand, the red PR108 pigment can be considered as stable with all binders. In case of these combinations the average ΔE* was less than 1.5 units. Based on those results, the type of binding material and the inorganic pigment demonstrated to have a major effect on the degree of colour shift.
4. Conclusion
Effects of LED illumination on art materials can be investigated deeply particularly by combining chemical analysis and colorimetric investigations. Results of the two scientific area harmonizes and shows the background of material and colour changes of art materials.
CIE Session 2019 – Abstract Booklet
353
PO050
WHITENESS FORMULA BASED ON CIECAM02 AND THEIR TEXTILE APPLICATION
Vik, M.and Viková, M. 1 Laboratory Color and Appearance Measurement, Technical University of Liberec, CZECH
REPUBLIC
Abstract
1. Motivation, specific objective
The CIE whiteness and tint equations were published in 1982, after more than 12 years of systematic study and consideration. However, the application of the equations is restricted to samples that are called "white" commercially, that do not differ much in colour and fluorescence, and that are measured on the same instrument at nearly the same time. These restrictions hinder the industrial application of these equations, and it would be important for the stakeholders to have the equations in such a way that their application conditions be less limiting. For example, in case of different light sources it is necessary to adapt parameters of CIE Whiteness formula. If are used tinted white samples frequently rating of whiteness made by observers is different in comparison to rating whiteness formula. In 2017 Vik and Viková published derivation of new whiteness formula based on linear formula following Ganz well known concept. Magnitude, respectively measured quantities are with relation to CPWS and based on that formula gives values near to Ganz-Griesser linear whiteness formula. Main aim of this study is to test modification of Vik and Viková whiteness formula that gives values near to CIE whiteness equation.
2. Methods
In the experiment was used set of selected 50 white textile samples. In order to prepare different white samples, the scoured and chemically bleached plain-woven cotton fabrics were treated with 5 different commercial FWAs, at 10 different concentrations. CIE Whiteness of tested samples varies from 80 till 140 and tint values were in range of -5.5 to 6 units. Total radiance factor and computed luminescence factor of each sample was derived from CIBA Plastic White Scale, Avian white plastic set and LCAM Cotton White Scale s. 024/2017, which was used during calibration of Datacolor SF600+ spectrophotometer in de:8° mode. The measurement was carried out in the range 360 to 700 nm at 5 nm intervals. For comparison and correction was measured the same sample set by using bispectral method on spectrofluorimeter Konica-Minolta CM-3800d. Visual test were made in SPL III lighting cabinet with panel of 6 colour normal observer.
3. Results
A linear prediction equation using measured chromaticity coordinates is capable of determining the whiteness of near-white cotton cloth samples. As expected relationship between CIE Whiteness and its predecessor Ganz-Griesser whiteness formula is strongly linear. Correlation between whiteness indices calculated by the new whiteness formula for many samples and CIE Whiteness formula appear linear in point of view of CIE whiteness values above 60 unit. Bellow this limit relationship between Vik-Viková Whiteness formula and CIE Whiteness formula becomes nonlinear. We understand this trend as advantage, because solve one of big problem of two-dimensional formula – its interpretation. That means in case of industrial comparison of two nearly white materials which one has whiteness value for example 50 and tint +3, will this product understand as whiter in comparison to almost neutral tint sample with CIE whiteness 45 units? Negative whiteness values, which are common for yellowish sample in Ganz-Griesser formula will result in zero or quite small white value in case of new whiteness formula.
4. Conclusions
In practical terms, fluorescent whitening may reliably be predicted using tristimulus values measured by suitable calibrated spectrophotometer. In this paper, the performance of new whiteness formula and CIE whiteness formula was compared on set of white textile fabrics visually assessed under D65 simulator. From experimental study, it is revealed that new CIE CAM02 based whiteness index WVV is appropriate for the prediction of whiteness of tinted textile fabric in comparison to CIE whiteness formula.
CIE Session 2019 – Abstract Booklet
354
PO051
DESIGN OF ALTERNATIVE WARNING SIGN AND PEDESTRIAN CONSPICUITY
Viková, M.1, Zelová, K.2, Kuzmová, M.2, Vik, M.1, Havelka, A.2 1 Laboratory Color and Appearance Measurement,Technical University of Liberec,CZECH REPUBLIC,
2 Department of Clothing Technology, Technical University of Liberec, CZECH REPUBLIC
Abstract
1. Motivation
Despite the benefits of both reflective clothing and headlight illumination, the problem of pedestrian detection and pedestrian overestimation at night still exists. Design of warning cloths is well known issue, nevertheless it is focused on special conditions following some rules related to traffic regulation. Outside of these conditions people doesn’t prefer to wear it. Based on that mainly children or sportsman doing outdoor activities are protected insufficiently. Presented study is discussing alternative design allowing increasing of pedestrian conspicuity with use pedestrian contrast profile, dominant contrast DC respectively, found by Saraji and Oommen (2013) for various pedestrian locations. The objective of this work is to examine the DC under local street condition with some disturbing light sources in horizon position including vertical illuminance from street lighting and contribution of car headlamps.
2. Methods
Conspicuity of different alternative warning signs was tested visually in two street lighting scenarios: a) unlit local road in winter time with car headlights only, b) lit street with car headlights, with use of panel of five observers. The street was illuminated with poles that are 14 meters high and 50 meters apart using LED of CCT 4000K and spill control optics. Along the longitudinal direction of the street were chosen three distances from car: 50, 100 and 200 m. The car used during test was Peugeot 307 CC Cabrio with Xenon headlamps and both – low and high beam illumination was tested. As luminance measuring video photometer was used Nikon D70 digital camera equipped with zoom lens 70-300 mm connected with laptop including LCAM software under MATLAB platform. Each of twelve different alternative design was applied on small size jacket and dressed on manikin with high of 150 cm positioned in distance 1.5m from right edge of street. Vertical illuminance levels were found at various longitudinal and lateral points along the street at 3 different heights 0.5 m, 1 m and 1,5 m above ground. Same point were used for control measurement of diffuse reflectance target (Zenith Lite™) with spectroradiometer PhotoResearch PR740.
3. Results
Here summarizes the results. To the maximum conspicuity was found with so called biomotion design and arrangement which accent the human silhouette contrary to simple circle or rectangular patterns with the similar retroreflective area. Street lighting contributed most to the Illuminance values at 1.5 m high than at other heights. And is effective mainly on the parts of jacket with diffuse reflectance than with retroreflective signs. The other two control points (0.5 and 1 m height above ground) were greatly affected by the car headlamps and in point of view of retroreflective sign arrangements appear bottom part of tested jacket as most effective. Dominant contrast due to car headlights changed as a function of the distance between the car and beam mode (high or low). It was also confirmed that the dominant contrast due to car headlights combined with streetlights gave larger DC values than due to car headlights alone.
4. Conclusions
This study showed the influence reflective material, and its various configurations, can have when trying to detect pedestrians at night. The use of reflective treatments on clothing has been shown to enhance drivers’ ability to detect pedestrians at night. In congruence with recent studies have further explored this topic of reflective clothing and have looked into the effects of reflective material placement and arrangements including reflective vests and biological motion configurations.
In addition to clothing, headlight illumination has also been shown to both positively and negatively affect a driver’s detection of pedestrians at night. Although headlights may provide more illumination
CIE Session 2019 – Abstract Booklet
355

and contrast, the glare from headlights of oncoming cars may interfere with drivers’ abilities to detect pedestrians, particularly those wearing clothing that does not provide substantial contrast. It was found that mainly individual retroreflective patterns are less visible than simple strips following biomotion design. The Dominant Contrast could be a useful metric in street lighting design as well as night time visibility studies.
CIE Session 2019 – Abstract Booklet
356

PO052
INVESTIGATION OF EFFECT OF CCT AND LUMINANCE OF ADAPTING FIELD ON DEGREE OF CHROMATIC ADAPTATION VIA MEMORY COLOUR MATCHING
Zhu, Y.1,2, Wei, M.1,*, Luo, M.R.2 1 The Hong Kong Polytechnic University, Kowloon, HONG KONG;
2 Zhejiang University, Hangzhou, CHINA
Abstract
1. Motivation, specific objective
Chromatic adaptation, an important mechanism in the human visual system, helps to maintain the colour appearance constant under different lighting conditions. Great efforts have been made to investigate this mechanism and to develop models to predict and characterize such a mechanism. These models have been widely used in different applications that are related to colour appearance, such as cross-media colour reproduction and light source colour rendition characterization. In these models, a factor is developed to characterize the degree of chromatic adaptation, which is only affected by the surrounding condition and the luminance of the adapting field. Several recent studies investigating light source colour rendition and surface colour whiteness, however, found the degree of chromatic adaptation was also affected by the colour of the adapting field.
This study aimed to quantify how the chromaticities and luminance of the adapting field jointly affected the degree of chromatic adaptation. It included two experiments, both of which were carried out by adjusting the colour of objects on a display to match their colour appearance in observers’ memory.
2. Methods
In Experiment 1, a 24-inch calibrated EIZO-CG243W display, with a peak luminance of 125 cd/m2, was used. The display was adjusted to create five neutral backgrounds (i.e., CCT of 2856, 3119, 4966, 6902, and 9719 K) with a luminance of 23 cd/m2 (i.e., L* ≈ 50), as the adapting fields. Nineteen objects, including 14 familiar objects (i.e., red apple, tomato, blueberry, sky, green pepper, grass, banana, lemon, and eggplant) and five coloured cubes (i.e., pure red, pure yellow, pure green, pure blue, and neutral grey) were used as the colour stimuli, with one stimulus being presented a time at the center of the display. Under each adapting condition, the observers were seated around 60 cm away from the display and adjusted the chroma and hue of each object, which occupied around 5° field of view and was presented in a random order, using four keys on a keyboard to match the appearance in their memory. Twenty observers with normal colour vision completed the experiment.
In Experiment 2, a 24-inch calibrated EIZO-CG247X display, with a peak luminance of 400 cd/m2, was used. The display was adjusted to create six neutral backgrounds, organized as three CCTs (i.e., 2856, 4966, and 6902 K) and two luminance levels (i.e., 8 and 70 cd/m2) (Note: the display was calibrated twice with two peak luminance levels of 40 and 400 cd/m2, so that both adapting luminance levels had an L* ≈ 50), as the adapting fields. The experiment followed similar procedures as in Experiment 1, with 20 observers adjusted the colour appearance of five objects (i.e., red apple, green pepper, yellow banana, orange, and sky) under each adapting condition.
3. Results
The inter-observer variations were characterized using Mean Color Difference from the Mean (MCDM), with a lower value for a smaller variation. The average MCDM values were 5.06 and 5.84 ∆E*00 units in the two experiments, which were smaller than those in recent studies using memory colour matching techniques.
For Experiment 1, CAT02, with the degree of chromatic adaptation factor D being calculated using the adapting luminance and a ‘dim’ surround, was used to transform the chromaticities of the objects that were adjusted under the 2856, 3119, 4966, and 9719 K adapting conditions to their corresponding chromaticities under the 6902 K condition. The average colour difference ∆E*00 between these transformed chromaticities and those that were adjusted under the 6902 K condition were 14.47, 12.67, 3.34, and 2.33 units for the 2856, 3119, 4966, and 9719 K conditions respectively, suggesting a lower degree of chromatic adaptation under a lower CCT level (Note: the colour difference unit
CIE Session 2019 – Abstract Booklet
357

represents the degree of adaptation. A larger difference means a more incomplete chromatic adaption). Optimization was then performed on the degree of chromatic adaptation factor D for each adapting CCT level to minimize the average colour differences between these transformed chromaticities and those that were adjusted under the 6902 K condition. The trend of these optimized D factors corroborated those modelled in a recent study.
For Experiment 2, the chromaticities of the objects were calculated in CAM02-UCS with the degree of chromatic adaptation factor D being calculated using the adapting luminance and a ‘dim’ surround. It was found CAM02-UCS may overestimate the effect of adapting luminance, since the chromaticities were closer to the origin when the adapting luminance was lower. Then, similar transformations were performed on the chromaticities being adjusted under the 2856 and 4966 K conditions to their corresponding chromaticities under the 6902 K condition. At the lower adapting luminance level, the average colour differences ∆E*00 were 11.2 and 3.0 units for the 2856 and 4966 K adapting conditions respectively; at the higher adapting luminance, the average colour differences ∆E*00 were 11.6 and 3.1 units. Similar optimization was performed on the degree of chromatic adaptation factor D for each adapting CCT level and adapting luminance level. It was found the adapting CCT and luminance levels jointly affect the degree of chromatic adaptation, with a higher CCT and a higher adapting luminance level introducing a more complete chromatic adaptation.
4. Conclusions
Two psychophysical experiments were carried out to investigate how CCT and luminance of the adapting field affects degree of chromatic adaptation using the memory colour matching technique. Observers adjusted the colour appearance of objects under different adapting conditions with different luminance and CCT levels to match the colour appearance in their memory.
It was found that a lower degree of chromatic adaptation happened under the adapting condition with a lower CCT or a lower luminance level, and the existing models may overestimate the effect of adapting luminance. Moreover, the CCT and luminance levels of the adapting field jointly affected the degree of chromatic adaptation, which needs to be modelled for colour appearance models and uniform colour spaces.
CIE Session 2019 – Abstract Booklet
358

PO054
DEVELOPMENT OF WHITENESS INDEX FOR FACIAL COLOUR
Mengmeng Wang1, Kaida Xiao2 , Michael Pointer2 and Changjun Li3 1 Jiangnan University, Wuxi, P.R.CHINA
2 University of Leeds, Leeds, UNITED KINGDOM 3 University of Science and Technology Liaoning, Anshan, P.R.CHINA
Abstract
1. Motivation, specific objective
Skin colour is an obvious character of human. The skin whiteness is frequently used to describe the skin colour in the cosmetic area. It is also considered as an important element in Asian beauty. Many indices were developed to evaluate the whiteness, such as CIE whiteness index (WIC), whiteness index for oral (WIO), etc.. But these indices were developed for evaluating the whiteness of paper, textile or tooth, which have small range of hue and chroma. Some of the whiteness scales were developed for describing colours with larger hue and chrom range, such as Adam’s whiteness scale, Cho’s whiteness scale, Berns’ Depth, etc.. However, these scales were developed based on paper colour patches. The real human skin colour is unevenly distributed on a curvy surface with texture and
gloss. The Individual Typologic Angle (ITA°) was developed to determine the melanisation of the
skin. It is commonly used to determine the Fitzpatrick skin prototype types of the skin. Even though there many research were developed to investigate the perceived whiteness, limited research showed that these formulas can be used to predict the skin whiteness of real human skin. It is also very interesting to investigate whether perception of facial whiteness affects by ethnic group. This study aim to investigate the relationship between the perceived whiteness and the physical colour of the skin. Effect of ethnic group to facial whiteness perception is assessed using both Caucasian and Chinese subjects. The whiteness scales that developed in the previous research were evaluated. Based on this study, a new skin whiteness formula is proposed.
2. Methods
A psychophysical experiment was carried out to assess facial whiteness of both Caucasian and Chinese on display. Facial image of 80 subject (40 Caucasian and 40 Chinese) were captured in a controlled viewing condition and their colour appearance were faithfully reproduce on the BenQ display, respectively. The magnitude estimation method was used to scale facial whiteness in this experiment. During the experiment, two facial images, including a target face and a reference face, were displayed side by side on a calibrated display. The participant was asked to sit in front of the display in a dark room to estimate the whiteness of the target face by referencing a reference face. The whiteness of the reference face was set to be 50. The score range of the target face was set between 0 and 100, which 100 represents the whitest skin colour according to the participant’s knowledge. The location of the reference face and the target face were set to be random. The reference face is selected from image database with an average skin colour of all subjects. Forty participants, including 20 Caucasian (10 females and 10 males) and 20 Chinese (10 females and 10 males), were participated.
3. Results
The observers’ variation were calculated by using root-mean-square deviation (RMSD). The variation of Caucasian and Chinese participants was 5.13 and 5.29 with standard deviation of 1.84 and 1.99, respectfully. It shows that Caucasian and Chinese observers have similar variations in terms of facial whiteness assessment.
The perceived facial whiteness of 40 subjects were averaged to represent panel results. Relationship between facial whiteness and each of colour appearance attributes in CIELAB colour space was investigated using Correlation Coefficient value. The correlation between the experimental results and L*, a* and b* are 0.90, 0.31 and 0.90, respectively. It shows that the perceived whiteness of the skin have stronger correlation with L* and b* than with a*. It indicates that the perceived skin whiteness have stronger correlation with the yellowness than the redness.
CIE Session 2019 – Abstract Booklet
359

Two whiteness related scales, the ITA°and Depth scale from Berns, were evaluated in this study.
The R-square is used to evaluate the performance of these scales at skin whiteness prediction. The
R-square of the experimental results with ITA°and Depth are 0.93 and 0.88, respectively. It shows
that both whiteness related scales showed good correlation with the experimental results. The ITA°
gave better prediction than the Depth scale from Berns. However, the ITA°and the experimental
results only show good linearity within certain ITA°range, as the ITA°uses angle to present the skin
whiteness. The ITA°only including the L* and b* for whiteness prediction. But the redness of the skin
was found have strong correlation with the skin whiteness. Here, a new skin whiteness scale which is developed based on the Depth scale is proposed. In the Depth formula, the whitest colour was set to be the one with L* equal to 100, as this formula was developed for the full colour range. For the skin colour, the whitest skin colour was found to have L* equal to 80.7 which based on the LLSD database. Therefore, a new formula was developed by set the whitest point in the formula to 80.7. The R-square of the experimental results with the new whiteness formula for skin is 0.92.
4. Conclusions
This study investigated the relationship between perceived skin whiteness and their skin colour for 40 Caucasians and Chinese faces by a psychophysical experiment. The experimental results showed that the perceived skin whiteness have stronger correlation with lightness and yellowness of the skin.
The performance of two whiteness scales, ITA° and Depth, at predicting skin whiteness were
evaluated. ITA°has better performance than the Depth scale. A new whiteness scale for skin colour
was developed based on the Depth scale, as the Depth scale including both redness and yellowness data of the skin. The new developed scale shows improved performance with R-square from 0.88 to
0.92, which is close to the performance of the ITA°(R-square equal to 0.93).
CIE Session 2019 – Abstract Booklet
360
PO055
THE IMPACT OF LIGHTING SOURCE AND CALLIGRAPHY FONTS ON THE DEGREE OF PREFERENCE OF CHINESE CALLIGRAPHY WORKS
Nianyu Zou1, Yuanming Zhang1, Jing Liang1, Jiayi Zou 2, Zhisheng Wang 1, Jiayuan Lin 1, Jing Ai 3 1 Research Institute of Photonics, Dalian Polytechnic University, Dalian, CHINA
2 Chaoyang School of The High School Affiliated to Renmin University of China, Chaoyang, CHINA 3 National Museum of China, Beijing, CHINA
Abstract
1. Motivation, specific objective
Chinese calligraphy originated in China is a unique art form. There are many museums which have exhibitions of calligraphy in China. Lighting source and calligraphy font are important factors influencing the degree of preference of visitors in the exhibition of Chinese calligraphy works. Now, most of Chinese museum lighting standards are based on traditional light sources. The lower lighting colour temperature and illumination on calligraphy exhibits is for the better protection of historical relics. However, with the increasing application of LED light sources in museum lighting, Chinese museum lighting standards are not suitable. In addition, through the subjective survey of museum visitors, it was found that visitors' preference for calligraphy exhibits under low illumination and low colour temperature was not too high. Therefore it is highly required to understand the degree of preference of visitors for calligraphy works under the conditions of LED light sources. In this paper, observers will be invited to simulate museum visitors for psychophysical experiments. The experimental results were used to analysis the correlation of the degree of preference between different fonts of calligraphy exhibits in different lighting source from factor analysis, pearson correlation and normal distribution analysis. and the results are reported.
2. Methods
Above all, a luminous environment display space was built in the experiment to simulate the museum calligraphy exhibition hall, and 12 groups of different lighting source conditions have been created to illuminate calligraphy works. The illumination of 12 groups of lighting source conditions is 100lx, 150lx, 200lx, and the colour temperature is 2500K, 3500K, 4500K, 5500K. The selected LED intelligent light source has a colour rendering index Ra=92, and the colour temperature and luminous flux are adjustable. 27 observers from Dalian Polytechnic University were invited do psychophysical experiments to obtain their preferences, attractiveness and comfort for the 4 fonts of calligraphy works (seal script, official script, running script and cursive scrip) in different light sources.
In the experiment, the experimenter randomly used different LED light sources to illuminate the calligraphy works to achieve different illumination and colour temperature groups. The experiment asked the observer to score the preference, attractiveness, and comfort of the calligraphy works, which is very like/ comfortable/ attractive (3 points), like/ comfortable/ attractive (2 points), slightly like/ comfortable/ attractive (1 point), slightly dislike/ uncomfortable/ not attractive (-1 points), less like/ comfortable/ attractive (-2 points), very dislike/ uncomfortable/ not attractive (-3 points).
3. Results
The coefficient of variation (CV) is used to compare the stability of data between observers. The experimental data are all within the CV range of psychophysical experiments. According to compare the mean value, the observers' illumination with the highest degree of preferences, attractiveness and comfort for calligraphy works is 150lx, 150lx,200lx, the light source colour temperature is 3500K, 3500K, 4500K.
The pearson correlation and factor analysis was used to analysis the correlation and significance of the impact between illumination, colour temperature and calligraphy fonts on the degree of preference, attractiveness and comfort. It is found that illumination, colour temperature, and calligraphy fonts all affect the degree of preference for calligraphy works.
CIE Session 2019 – Abstract Booklet
361

The light source colour temperature has the greatest impact on the preference of calligraphy works through normal distribution analysis. Compared with illumination, calligraphy fonts have less influence on the degree of preference.
4. Conclusions
In a summary,a luminous environment display space was built in this paper. Psychophysical
experiments were unfolded and obtained experimental data on the observers's preference for Chinese calligraphy works. Through the processing of experimental data, the calligraphy works have a higher degree of preference in the illumination of 150lx, and the light sources colour temperature of 3500K. The influence of light source colour temperature on the preference of calligraphy works is stronger than that of illumination and calligraphy font.
CIE Session 2019 – Abstract Booklet
362

PO056
QUANTIFICATION OF VISUAL ENVIRONMENT RECALL RADIO OF OMNIDIRECTIONAL VIRTUAL REALITY (VR)
Cui, F.1, Hirate, K.2 1 The University of Tokyo, Tokyo, JAPAN, 2 The University of Tokyo, Tokyo, JAPAN
Abstract
1. Motivation, specific objective
Since the launch of HMDs such as HTC VIVE and PSVR in 2016, omnidirectional VR using HMD has developed rapidly. Many software companies have updated their software to incorporate with this new technology. Thanks to that, now, the omnidirectional VR becomes widespread. With little instruction, anyone who has a fundamental knowledge of personal computers can use omnidirectional VR easily.
The greatest merit of VR is that it is easy to reproduce what is difficult to reproduce in real space. The omnidirectional VR using HMD is more immersive than those projected on conventional large screens, etc. Furthermore, due to the development of graphic technology, the image became clearer and more real.
However, it has not yet been quantified how much omnidirectional VR using HMD can reproduce real space. In the future, it is considerable that by using omnidirectional VR, the number of experiments which were difficult to do in the real space beforehand will increase. We believe that it is necessary to quantify visual environment recall ratio of omnidirectional VR in order to perform these experiments.
In this research, we aimed to quantify the visual environment recall ratio of omnidirectional VR by comparing and analysing the feeling that real space and VR space gives to people.
2. Methods
First of all, it is assumed that the real space can be divided into three types, large outdoor space, indoor space with window and indoor space without window. Generally, the outdoor space is a spacious space which has high luminance due to daylight. The indoor space with window is a space where the luminance contrast is very large. The Part which the daylight enters has high luminance. Meanwhile, The part where the daylight does not reach directly have a lower luminance. The indoor space without window is a dark space with no daylight as long as lighting equipment is not used. Even when lighting equipment is used, it is a low-luminance space compared to a space with daylight.
This time, we conducted comparative experiments of real space and VR space in these 3 type of spaces. Since there is no daylight at night, we compared each space during day time.
We need to conduct experiments in the space where daylight enters, but when we do experiments, the luminance contrast becomes remarkably high on the surface which receiving direct sunlight. Furthermore, as weather and time change, there are also changes in the surface that receives direct sunlight. We thought that this could greatly affect the unification of the conditions when conducting comparative experiments. Therefore, the space to receive direct sunlight is not selected as the comparison target this time. We selected shaded spaces as the outdoor space with daylight and the indoor space with window.
While doing Experiments, we have subjects come to the evaluation point and asked them to give their impression evaluation on both real space and VR space then compare. Prior to the experiment, we set up the facility so that HMD can be used at the evaluation point. Panoramic photos were taken with the 360 degree camera (THETA S) at that time, prepare to present as VR space. In order to unify the condition of the real space and the condition of the VR space as much as possible, the panoramic photographs presented to the HMD were taken before carrying out the comparative experiment.
Human eyes can discriminate from high luminance to low luminance because of adaptation. When it comes to take pictures, shooting a high luminance space and a low luminance space by unifying camera settings, either one becomes whitish or black, which sometimes makes it impossible to properly discriminate the space. Therefore, panoramic photographs were taken with the ISO sensitivity fixed at 100 and the shutter speed set to auto.
CIE Session 2019 – Abstract Booklet
363

For the Impression evaluation, subjects were asked to evaluate spaces on 7 levels for each space. To compare the real space and the VR space, the ME method was used. With the brightness, glare, spaciousness, oppression of the reality space fixed to 100, we asked subjects to impress their feeling by number.
Furthermore, after comparative evaluation at all evaluation points is completed, panoramic photos of each evaluation point are presented as the VR space. When each value mentioned above in the designated indoor space with window is fixed as 100, subjects were asked to evaluate other spaces by number.
3. Results
We compiled the responses of the subjects and conducted an analysis of variance on seven levels of impression evaluation. As a result, significant differences in the evaluation values of the real space and the VR space in each environment were not found in most items.
As a result of comparing the real space and the VR space, the evaluation value of luminance and glare tended to rise as the average luminance value was smaller. There was a tendency that the spaciousness and the sense of oppression were the same regardless of the luminance value in the real space and the VR space.
4. Conclusions
Therefore, it is considerable that the impression people received in real space is the same as what they received in VR space. Not only in the low luminance space but also in the space with large luminance contrast as in indoor space with window, even in the high luminance space like the outdoor space people give the same impression on the real space and VR space.
Furthermore, in this experiment, as a basic experiment to quantify the recall radio of omnidirectional VR using HMD, we were able to find the relationship between real space and omnidirectional VR space.
CIE Session 2019 – Abstract Booklet
364
PO057
COLOUR EFFECTS IN THE RENDERING OF MIXED-REALITY SCENES
Kim, A., Cheng, W.-C., Beams, R., Badano, A. Division of Imaging, Diagnostics, and Software Reliability, OSEL/CDRH/FDA, Silver Spring, UNITED
STATES
Abstract
1. Motivation
Enthusiasm surrounding mixed reality (MR) technology, including augmented reality (AR) and virtual reality (VR), has prompted the development of many opportunities and use cases in medicine. Current development and assessment of medical MR applications is often reliant on Unity 3D, a popular game engine for cross-platform development of interactive applications. Unity is frequently used in AR and VR medical visualizations including simulations for pre-operative surgical and therapy planning, educational tools, and training. Despite the increase in MR medical applications, many aspects of the visualization pipeline are not fully understood. While colour properties of the rendering pipeline have been referred to for a few applications, no detailed reports are available on the characterization of colour transfer and how parameters including lighting, materials, shaders, and cameras interact with the physics models to affect colour accuracy of objects in a scene. The pipeline in Unity was initially developed using pre-calculated and stored (baked) ad-hoc rendering calculations to mimic indirect lighting. Since the 2014 release of Unity 5.0, a physically-based rendering (PBR) model now can interact with a new standard shader enhanced with primary parameters for diffuse colour, specular colour, surface smoothness, and normal surface mapping. In addition, global illumination (GI) is a range of computational techniques that attempts to mimic light interacting with surface meshes. While PBR and GI are designed to provide convenience for developers, the anticipated effects may add uncertainty in the visualization of medical data. For instance, 3D visualization approaches for diagnostic imaging using X-rays utilize pseudo-colour representations and require predictable colour stimuli or compliance to a target model (typically, the DICOM Grayscale Standard Display Function) from the Unity scene to the 3D head-mounted displays (HMD). This visualization mode has no need for extraneous calculations mimicking ambient light. In this work, we describe the transfer of colour properties from the digital objects developed for the scene, through the rendering and image processing steps, to the actual RGB values sent to the display device. In addition, we report measurements of the change in colour image properties associated with different settings for a digital test object.
2. Methods
A modularization approach was used to separate the AR/VR device into the software/hardware component (Unity and computer) and the display component (HMD). In this study, only the driving component was addressed to isolate the performance variability in HMD devices. Color transformation was investigated based on input values for material colour, shader categorization, type and intensity of light source spectrum, and rendering path of the main camera. The output was measured with two methods. The first method was software-based and analyzed the RGB values produced by Unity. The second method was hardware-based. A field-programmable gate array (FPGA) circuit board was used to capture the digital pixel data transmitted on the high-definition multimedia interface (HDMI) to capture the final pixel data altered by the colour management, the graphics card driver, and the AR/VR applications following the rendering done by Unity. The output of the display component was assumed to be within the sRGB colour space. We assessed the influence of the Unity variables such as lights, materials, shaders, and rendering properties of the camera on the colour transformation for the primary colours red, green, blue, cyan, magenta, yellow, and gray defined by the RGBA value (119, 119, 119, 255). Project settings were kept at gamma colour space, as linear colour space is not yet supported by some mobile devices. Default settings for the main camera, light, shader, and materials were preserved for the initial set of measurements.
3. Results
Output values for each change in parameter covered a large range of the sRGB colour space despite a single RGBA value specified for every colour. For example, output values for the R in the default
CIE Session 2019 – Abstract Booklet
365

Unity material ranged from 255 to 39, G from 80 to 1, and B from 80 to 0 on a sphere mapped with the material colour set to (255, 0, 0). When changed to “Metallic” red, R output ranged linearly from 254 to 1, while G and B ranged from 0 to 1 and 0 to 2, respectively. Our results indicate that colour transfer is heavily affected through the rendering process. A standardized instrument for colour measurement of virtual objects will be designed and implemented to characterize colour transfer throughout the rendering pipeline. Our plan is to build a measurement apparatus in the virtual space following the d:8° specular included (SPIN) and specular-excluded (SPEX) colour measuring geometry. A 6” integrating sphere with 100% reflectance on the inside and four ports is created virtually to generate the diffused lighting and the observing angle with respect to the object, which is a 4” x 4” flat surface with controllable material properties in Unity. The object is placed under the 2.5” diameter port of the integrating sphere so that its axis is perpendicular to the object surface. The light source with an adjustable spectrum in Unity is guided through the 1” diameter port on the side to create the diffused illumination. A 1” diameter port near the top but 8° away from the axis is used for the view port in Unity to observe the stimulus reflected. Another 1” diameter port symmetrically placed on the opposite side of the view port is kept closed to include (SPIN), and open to exclude specular reflection (SPEX).
4. Conclusion
As the user community for Unity expands to include medical professionals and applications, so does the need for a framework to understand Unity’s rendering properties and optimizing visual conditions. This work provides an initial step for colour standardization and consistency in MR medical applications. We plan to provide distinct colour characterizations for Unity so that future developments in medical MR can ensure that the colour information in pixels displayed in the headset is accurate and consistent. A need to define a standardized instrument for colour measurement of virtual objects has been identified, and further colour investigation using the d:8° (SPIN and SPEX) virtual apparatus as a standard of colour measurement will be explored.
CIE Session 2019 – Abstract Booklet
366

PO059
PHYSICAL INDICES FOR REPRESENTING MATERIAL PERCEPTION WITH REGARD TO GLOSSINESS, TRANSPARENCY, AND ROUGHNESS
Tanaka, M.1, Osumi, M.2, Horiuchi, T.1 1 Chiba University, Chiba, JAPAN, 2 Office Color Science Co., Ltd., Yokohama, JAPAN
Abstract
Our goal is to build a total appearance model encompassing the colour appearance model. To achieve this objective, as a preliminary approach we investigated the relationship between the physical properties and the perceptual appearance of real materials and rendered images in this study. In our physical measurements and subjective evaluations, we used 34 exemplars comprising ten material categories with reference to the three appearance factors of glossiness, transparency, and roughness. As the result, we found physical indices for each appearance factor as follows: (1) The physical index of glossiness perception is the reflectance characteristics in wide angle using a Gonio spectrophotometer. (2) The physical index of transparency perception is the luminance difference for real materials between black and white background colours and the variance of anisotropy obtained from the difference images. (3) The physical index of roughness perception is the physical glossiness value.
1. Motivation, specific objective
In addition to colour recognition, evolution has provided us with various other abilities for instant recognition of object features through sight. In the field of imaging science and technology, the study of the material appearance of objects has been actively discussed with consideration being given to the visual appearance information including not only colour but also other factors such as texture. In the previous study, the authors investigated the perceptual appearance of materials obtained from real objects and their rendered images by conducting psychometric experiments. If perceptual characteristics can be estimated by physical measurements, human material perception can be predicted without psychometric experiments. Moreover, the establishment of new perceptual models and formulae is desirable for correctly representing the total perceptual appearance of real objects and digital images. Our specific objective is to find effective physical indices by analysing the relationship between the physical appearance and the perceptual appearance.
2. Methods
2.1. Psychometric evaluations
In this study, we used data from psychometric evaluations which investigated the perceptual appearance of various materials using both real materials and their displayed images. The dataset of 34 stimuli (size: 50 mm x 50 mm) was selected from 10 material categories—stone, metal, glass, plastic, leather, fabric, paper, wood, ceramic, and rubber—thereby covering a wide range of material appearances. A rendered image dataset was faithfully reproduced by capturing the samples after setting them in a viewing booth. The intensity, colour and resolution of the rendered images were precisely reproduced to compare with those of the real materials. The observers evaluated the perceptual glossiness, transparency and roughness using a 6-point scale for each stimulus in the two datasets containing real materials and rendered images.
2.2. Physical measurements
To obtain the physical characteristics, we analysed captured images, surface reflectances measured using a Gonio spectrophotometer and a spectroradiometer, and physical glossiness values with a gloss checker conforming to ISO 2813 and ISO 7668 standards.
In our preliminary investigation into the relationship between the physical characteristics and the psychometric evaluations, anisotropy values based on the frequency properties of captured images were correlated with the psychometric evaluations. Therefore, texture information obtained from digital images, histogram and anisotropy based on frequency properties was calculated for each experimental image stimulus. Furthermore, we captured the images of real materials with white and black background colours to detect the transmitted light within the materials. The difference images
CIE Session 2019 – Abstract Booklet
367

calculated from the different background colours were also used as physical information for indicating the perceptual transparency.
The effect of surface reflectance was also investigated because humans can estimate the reflectional properties using binocular parallax. Furthermore, the spatial change of the reflection produced by the minute unevenness of the surface can affect judgements of the perceptual appearance. We measured the surface reflectance properties and physical glossiness of real materials as the bidirectional reflectance distribution function (BRDF) using a Gonio spectrophotometer (Murakami Color Research Lab. GSP-2), an appearance analyser (Canon Inc. RA-532H) and a spectrophotometer (BYK Additives & Instruments. BYK-mac i).
We calculated statistical characteristics such as kurtosis, skewness, variance, and average value using the data measured by each device.
3. Results
The significance of the psychometric evaluations for each stimulus was verified using a t-test after excluding the outlier data using the Smirnoff–Grubbs test. The correlations between the psychometric evaluations and the physical characteristics were calculated.
As a result, a strong correlation was confirmed for each appearance factor. (1) The reflectance characteristics from a wide degree using a Gonio photometer were strongly correlated with the perceptual glossiness evaluation for real objects and their images. (2) For perceptual transparency, the luminance difference of real materials and the variance of anisotropy obtained from the difference images between black and white background colours had a high correlation. (3) The perceptual roughness for real materials and their rendered images were linked to physical glossiness values. In addition, the skewness and standard deviation of the histogram for rendered images had significant correlation with the perceptual roughness.
4. Conclusions
In this study, we investigated the relationship between physical characteristics and perceptual appearance for real materials and rendered images as a preliminary approach. In our physical measurements and subjective evaluations, we used various materials comprising ten material categories to describe the three appearance factors of glossiness, transparency, and roughness. As a result, we observed physical indices for each appearance factor as follows: (1) The physical index of glossiness perception is the reflectance characteristics in a wide angle using a Gonio spectrophotometer. (2) The physical index of transparency perception is the luminance difference for real materials between black and white background colours and the variance of anisotropy obtained from the difference images. (3) Physical index of roughness perception is the physical glossiness value. These results indicate that it may be possible to construct a total appearance model representing not only colour but also multiple appearance factors such as glossiness and roughness.
CIE Session 2019 – Abstract Booklet
368

PO060
DYNAMIC LIGHTING FACILITATED BY COMPUTER VISION
Tran, A.1, Persky, R.1, Bednarz, T.1, Cowling, I.1 1 Queensland University of Technology, Brisbane, AUSTRALIA
Abstract
1. Motivation, specific objective
A lighting application was produced, which used the pointer as a virtual light source. Shadows were cast from the corners of objects, simulating the line of sight from the perspective of the pointer. This application demonstrated the generation of dynamic data, using the state of the scene to generate the lighting information.
Multiple objects are supported, and will all cast independent shadows. In the case of one object obstructing the line of sight of another, the second object will be covered in shadow. By drawing not on top of objects, but in the scene based on information about the objects, this application shows the potential of dynamic data.
This data is being generated by a layer of processing between input and output, and shows that the program is not only extensible, but also capable of generating data that uses the state of the scene as a data input. Other layers of processing could be added in place or additionally to the lighting engine. The continuous nature of homographies is shown, as the shadows that are being generated are not on or even near the detected feature points of the objects, but can still be relatively accurately projected.
2. Methods
The projector and camera are mounted above a surface. They both oriented to project down at the surface. The term scene will be used to represent the area on the surface visible in the view of the camera. Objects will be tracked if they are located and visible in the scene.
The focus of this project has been the development of technologies that enable these goals, as well as developing some practical applications. This technology enables many practical uses, and as such, a technical demonstration was developed.
The fundamental concept used in this project is using a homography to represent a transform between coordinate systems. The system is best thought of in terms of different coordinate systems, which the program will find a homography to transform between.
Where homographies truly become useful is that a homography can be constructed from 4 matches between two planes. Using only these 4 correspondences, a whole plane transformation can be created. The method was relevant to this application, as matches are found between initial feature points and current ones, which represent discrete positions in a plane. The homography creates a continuous transform from these discrete samples, allowing any coordinates in the initial plane to be transformed. This is needed so that parts of the object that have no correspondences can still be transformed.
Each objects feature points and bounds are being tracked and updated in real time. The locations of the corners of the objects are known in the object's current location. These corners are used to cast shadows from. For every object, each edge is subject to a check to see whether the virtual light source is on the right of the edge.
A vector expressing the difference between the light source and a corner is generated for each corner that is positioned on a shadow casting edge. Once all the positions have been generated, two for each corner, they are drawn by generating a polygon that spans the space generated in between all points. This polygon is then drawn in projector space where it will then appear in physical space.
3. Results
Reduced latency
CIE Session 2019 – Abstract Booklet
369
Reduction of the time between an object being physically moved and the projected digital data responding to this movement. This latency was reduced to the minimal level that was possible due to hardware performance, approximately 160ms.
Increased frame rate
The frame rate of the camera was 30 frames per second, meaning that a new frame was being processed every 33.3ms. This set the maximum amount of time that the program could process a frame for. This was achieved, with an average processing time of 16ms per frame.
Accuracy of projection
The accuracy of this project was defined as whether objects could be recognized while being moved around the scene, and how accurately they could be projected on. This project achieved permanent recognition of objects with no mistakes, and 4-millimeter accuracy for projecting on any part of the object.
Multiple object tracking
The system is able to track multiple objects throughout the scene simultaneously, independently and in real time. 4 objects could be tracked before the processing time of a frame was exceeded.
Automatic calibration
Automatic calibration of the relationship between camera and projector, allowing for changes in the environment, and opening further doors for more complicated situations, such as multiple cameras or projectors.
Application
A lighting application was produced, which used the pointer as a virtual light source. Shadows were cast from the corners of objects, simulating the line of sight from the perspective of the pointer. This application demonstrated the generation of dynamic data, using the state of the scene to generate the lighting information.
4. Conclusions
The goal of this paper was the development of technologies that enable the tracking and projection upon of physical objects, and to develop a practical lighting application. These stated goals have been achieved to well within the specified performance requirements for both speed and accuracy. The most logical further optimizations would lie in the hardware domain, rather than software changes.
An automatic calibration system for determining the relationship between camera and projector was developed and produces an accurate homography. The system can track multiple objects independently in real time, with minimal response time to changes in the scene. Combining these two developments, the system can track objects, generate dynamic data and project it accurately onto the scene.
A practical application demonstrating the rotational and positional invariance of the projection system was developed in the form of a drawing engine. To demonstrate the generation of dynamic data, which requires further processing in between the input and output stages, a lighting engine was implemented. A large amount of optimizations was made to achieve the performance goals, over both the hardware and software domain.
CIE Session 2019 – Abstract Booklet
370
PO061
A METHOD FOR ESTIMATING FISH-EYE LENS’ FIELD-OF-VIEW ANGLE AND PROJECTION FOR HDR LUMINANCE CAPTURE
Viula, R.1, Hordjik, T.1 1 Delft University of Technology, Delft, THE NETHERLANDS
Abstract
1. Motivation, specific objective
The calculation of field-of-view luminance based metrics for visual discomfort and glare evaluation in real scenes via HDR luminance capture does generally require the use of wide view fish-eye lenses.
The filed-of-view and type of projection of the lens is a requirement for correct capture of the solid angle and position of the glare sources in a visual scene and in this way, for accurate glare evaluations.
It is known that the exact view angle and lens projection type is not always provided by the manufacturers of fish-eye lenses and it is left to the researcher to make sure these are known prior to any measurements.
Ideally this estimation is performed with specific materials such as very sturdy tripods with high precision rotating heads or cameras mounted on motorised heads with stepper motors. However, these materials are not readily available to most researchers and research labs.
The paper describes a low-cost method to perform this estimation based on a single photograph and an easy to built physical set-up.
2. Methods
Marker curves corresponding to angles between 10° to 100° of one or more fish-eye lenses’ projection types are plotted in a CAD drawing and printed on a 2-board set-up. This set-up is mounted on a table with the camera positioned in its centre and aligned with the 90° curve of the set-up. A photograph from that position is taken. A comparison of the match between the photographed marker curves and the curves from the CAD drawing for the different projections can be either done using image-based software or using the circular zone option of Evalglare, a Radiance-based software tool.
3. Results
The paper explains the method in the form of an illustrated tutorial, based on the estimation of a Sigma 4.5mm Circular Fisheye. Using this method it was possible to find that the lens has an equi-solid-angle projection and a total field-of-view of 184.988°. The manufactures information regarding the lens projection is therefore confirmed but not the lens total view-angle, which was thought to be of 180. Possible result deviations in luminance capture when using a wrong image projection or total field-of-view angle are briefly discussed.
4. Conclusions
The method was found to be easy to implement and provide reliable results. Instructions to adapt the tutorial to other types of lenses are described and a web link to the specific materials and templates required to perform this estimation will be made available.
CIE Session 2019 – Abstract Booklet
371
PO063
SPATIALLY RESOLVED MEASUREMENTS OF DIFFUSE REFLECTANCE
Basic, N.1, Blattner, P.1, Pastuschek, M.2 1METAS, Bern, SWITZERLAND, 2PTB, Braunschweig, GERMANY
Abstract
1. Motivation, specific objective
Diffuse reflectance measurements are usually performed using a photodetector. Graininess measurements however require also spatial resolution, thus the diffuse measurements are performed using a camera attached to the integrating sphere in the measurement geometry d:0°. When performing such measurements on glossy samples, an interesting phenomenon was observed; a dark area corresponding to the specular excluded area. The objective of the proposed paper is to explain the phenomenon and relate it to measurement setup and sample parameters.
2. Methods
METAS and PTB have performed a systematic study using two different measurement setups for spatially resolved diffuse reflectance measurements. PTB measured glossy coloured and neutral samples using measurement geometry d:0° and d:8°i, varying the distance of the camera to the integrating sphere port. METAS on the other hand measured gloss scale (4 grey values, 7 values of glossiness per grey value) along with a mirror (as an example of a perfectly glossy material) in three different geometries: d:0°, d:8°e, and d:8°i, while varying the integrating sphere port sizes.
3. Results
It was found that the size of the dark area could be calculated using geometric relations of the measurement setup. The measurement data with varying measurement setup parameters fit well the proposed theory. Furthermore, the intensity of the dark area, compared to its surround can be correlated with the gloss value of the sample; the glossier the sample, the greater the difference between the dark area and its surround.
4. Conclusions
METAS and PTB have performed spatially resolved diffuse reflectance measurements on a set of samples having different values of gloss, lightness, and colour. When using specular excluded measurement geometry, a dark area was observed. The size of the dark area was correlated with the measurement geometry setup (size of integrating sphere port, distance from the sample to the camera), while the difference in intensity between the dark area and its surround was correlated to the glossiness of the sample.
CIE Session 2019 – Abstract Booklet
372

PO065
REFERENCE DATA SET AND VARIABILITY STUDY FOR HUMAN SKIN REFLECTANCE
Cooksey, C.C., Allen, D.W., Tsai, B.K. National Institute of Standards and Technology, Gaithersburg, MD, USA
Abstract
1. Motivation, specific objective
The optical properties of human skin have been of interest to researchers for some time. Their interest is based on a need to know for variety of different applications, which range from spectral imaging for automated or stand-off detection, non-invasive clinical diagnostic tools, improved models for understanding light propagation, to colour-based applications, such as reproduction of skin colour in photography and printing and colour-matching in cosmetics industries.
The aim of this study is to compile a large data set of high-quality, human-skin reflectance spectra and investigate the variability of the resulting spectral data set. Here, we report on the data set and its collection as well as the results of various statistical methods applied to the data set to assess variability in terms of both the population of the participants and the broad spectral range measured.
2. Methods
The reflectance spectra of 100 people were collected at the National Institute of Standards and Technology (NIST) using a commercially available spectrophotometer equipped with a 150 mm integrating sphere. Three scans of the bare, right forearm of each participant were acquired over the spectral range of 250 nm to 2500 nm in 3 nm intervals. The resulting data was processed to produce
spectra of reflectance factor values for a measurement geometry with an 8 angle of incidence and
hemispherical detection, abbreviated as 8/di. The values from the 3 scans were averaged to obtain
the final 8/di spectral reflectance factors for each participant. The final 8/di spectral reflectance factors are directly traceable to the US national scale for directional-hemispherical reflectance factor.
3. Results and Conclusions
This data set provides reliable spectra of human skin reflectance, which are traceable to the US national scale for directional-hemispherical reflectance, with stated measurement uncertainties. Further, the data set reveals a range and distribution of “typical” human skin reflectance values. Although it is not known what sample size or source of participants would best describe the population at large, it can be expected that the variability is no smaller than the distribution represented in this set.
A variety of statistical methods, including colour analysis, was applied to the data. Overall, the variability population, i.e. the variability observed for the set of subjects in this study, is the most significant source of uncertainty for the skin’s spectral signature over the UV-Vis-NIR region. In general, the variability attributed to measurement error and method are significantly smaller than the variability between any two individuals. This suggests that the overall variability observed for this set can primarily be attributed to biological variability. It is also observed that the greatest variation in spectral signatures of human skin occurs in the UV and the least in the shortwave infrared.
CIE Session 2019 – Abstract Booklet
373
PO066
DETECTOR BASED PHOTOMETRIC CALIBRATION OF GONIOPHOTOMETERS
Csuti, P., Szabo, F. University of Pannonia, Faculty of Information Technology, Light and Colour Research Laboratory,
Veszprem, HUNGARY
Abstract
1. Motivation, specific objective
For the photometrical characterization of a luminaire a fundamental instrument is a goniophotometer. From goniophotometric investigation the total luminous flux of the device under test (DUT) and detailed luminous intensity distribution information can be gained. Usually one calibrates a goniophotometer by a standard total luminous flux calibration source. Total luminous flux calibration sources are mostly realized in the form of specially conditioned, pre-aged tungsten lamps by calibration laboratories. By practice, one needs at least a set of 3 total luminous flux calibration sources because of the altering nature of tungsten lamps. To maintain such an etalon source set can be costly and since the banning of the incandescent light sources it doesn’t seem to be future proof anymore. An alternative way to calibrate goniophotometer systems was developed which can be applied to several types of goniophotometer systems including those which have additional optical elements (like mirrors) between the device under test and the photometer. The developed method can be split into two sub methods, one uses a standard photometer for systems where the light source illuminates the detector directly, like the other one can be applied for such systems where a mirror or multiple mirrors are placed between the light source and the detector system. The detector system can be a photometer or a spectroradiometer.
2. Methods
Goniophotometers can work based on different methods. One turns the luminaire in front of a photometer to sample the luminous intensity of the DUT from different directions, while the other type letmove the photometer around the luminaire. The common thing of the different methods is that the luminous intensity in a given direction is measured. The first part of the method is to use a standard photometer and a stabilized light source which produces a stabilized and homogeneous light intensity inside the solid angle seen by the photometer and the calibration can be performed if the detector light source distance is also measured.
By goniophotometer types using mirrors another important question is the spectral transmission of the whole photometer system since mirrors may have some spectral distortions. First, with our method this spectral transmission factor can also be characterized and the result can be included into the calibration package of the system. In such cases where mirrors are used the same stabilized light source is used but for the mirror type case two measurements will be done, first the light source will be measured directly in a distance where still the general photometric distance rule applies. In this case no other optical elements are influencing the spectral power distribution of the light source. The second measurement will be carried out after the optical elements in place of the original photometer or spectroradiometer. This method is especially useful to calibrate gonio-spectroradiometers. If only a standard photometer is used the derived factor will be the luminous intensity transmission factor.
3. Results
In the paper a detailed description of both methods will be presented which will show also the practical aspects of this new method applied on different types of goniophotometer systems. This method can be taken as an alternative method of using standard total luminous flux light sources. By replacing standard lamp based calibration, uncertainty is decreasing as parts of the uncertainty budget concerning transfer uncertainty, lamp stability, lamp ageing and power supply accurateness can be substituted by only one component of detector transfer uncertainty.
4. Conclusions
By using a standard photometer or calibrated spectroradiometer as the calibrating detector and a stabilized light source a detector based luminous intensity calibration can be realized on any
CIE Session 2019 – Abstract Booklet
374

goniophotometer system including those which have additional optical elements (like mirrors) between the measured light source and the photometer. In the latter case also the spectral transmission of the system can be characterized.
CIE Session 2019 – Abstract Booklet
375
PO067
MAINS OPERATED LED BASED TRANSFER SOURCE FOR LUMINOUS FLUX SCALE REALISATION AND DISSEMINATION
Dekker, P1, Ali, M1, Houtzager, E1, Zhu, Y1, Zhao, D1, Poikonen, T2, Klej, A3 Stuker, F4, Källberg, S5, 1 VSL, Delft, NETHERLANDS, 2 VTT, Espoo, FINLAND, 3 Signify, Eindhoven, NETHERLANDS,
4 METAS, Bern-Wabern, SWITZERLAND, 5 RISE, Borås, SWEDEN
Abstract
1. Motivation, specific objective
Global phase out of incandescent light sources has drastically changed the lighting industry over the past years. Consequently, many laboratories are nowadays measuring LED light sources rather than incandescent light sources. This has changed the requirements for traceability chains and calibration lamps used by laboratories. Traditional luminous flux measurements rely heavily on the use of tungsten filament standard lamps operated close to the correlated colour temperature of CIE Standard Illuminant A (2856 K), and integrating spheres or goniophotometers equipped with V(λ)-filtered photometers. A new traceability route has been introduced based on LED calibration sources and detectors without optical V(λ)-filters. To facilitate this traceability route, LED based luminous flux transfer light sources with highly stable luminous flux and commonly agreed spectral power distribution are required.
In this work, the aim was to design an LED-based luminous flux transfer light source that can not only be used for luminous flux realisation at NMI level, but also directly by industrial test laboratories. This introduces additional requirements such as: compatibility with European two wire mains power (230 VAC) and E27 fitting. The lamp is designed to have a luminous flux output of approximately 800 lm stable to 0.1 %, an active power consumption that is stable to within 0.5 % and a high power factor.
The developed luminous flux transfer standard source will be validated in a future round robin comparison among several test laboratories that will be using the new source for their traceability. In this work, characterization and calibration of the new luminous flux transfer source will be reported.
2. Methods
The designed transfer light source, contains five high-power LEDs on a printed circuit board (PCB) with spectral properties selected close to correlated colour temperature of 4000 K, based on a new proposal of an LED reference spectrum [1]. The LED circuit board is covered with a diffuse dome to improve the uniformity of the angular intensity distribution. The LEDs were selected to yield high luminous flux and colour stability. To ensure both constant power consumption from the mains as well as stable current driving the LEDs, a LED driver has been developed. An AC/DC LED driver was built for this purpose. The driver was designed to consume more power than needed to drive the LEDs. The excess power makes it possible to regulate both the consumed power from the mains as well as the power (current) needed for the LEDs. Any excessive power is dissipated as heat. The driver was built by combining a rectifier followed by a special power factor correcting DC/DC converter. From the stable intermediate DC voltage, a constant current regulator stabilizes the current flowing through the LED PCB to ensure a stable light output. Special care has been taken to make the circuit insensitive to temperature changes by both selecting components that are temperature insensitive and placement on the PCB away from heat sources. A circuit board with a specific form factor, not to obscure the light emitted from the LEDs, has been developed which contains the LED driver. Furthermore, the components on the circuit board as well as the LEDs are actively cooled with a built-in DC fan. The driver circuit was tested for power consumption with varying load and stabilisation time of consumed power when switching-on the driver.
The total luminous flux of the new AC-operated standard light source is calibrated using an absolute integrating sphere that utilises a stable external LED standard lamp with spectral properties close to the LED reference spectrum. In the luminous flux calibration, the external reference luminous flux is produced by measuring illuminance of the external LED source using an unfiltered Predictable Quantum Efficient Detector (PQED) accompanied with a double monochromator spectroradiometer for obtaining the photometric weighing, and passing the emitted light into the sphere through a precision
CIE Session 2019 – Abstract Booklet
376

limiting aperture. The relative spectral radiant flux of the luminous flux standard sources are measured using a goniospectroradiometer. In the calibration, the standard sources are operated with a stable programmable AC voltage source with 230 V output.
3. Results
Prior to assembly, the electrical performance of the driver has been characterized.
The results are as follow:
-LED driver current stability of better 0.1 %; -Active power (P) controlled within 0.1 %; -Root mean square of current (iRMS) controlled within 0.32 %; -Power factor (PF) of 0.96; -Total harmonic distortion of the current (THDi) of 4.16 %.
Transfer lamps were built with the driver circuit and assessed for basic properties such as stabilisation time, luminous flux stability and power consumption after warmup. Typically, the luminous flux is about 830 lm at a power consumption of 19 W. After 30 minutes of warmup, both the luminous flux and the consumed power are stable to within 0.1%. In order to further verify the luminous flux transfers sources and improve their long-term stability they will be seasoned for several hundred hours while having their luminous flux, electrical parameter and colour characteristics, periodically measured.
After seasoning the lamps will be fully characterized for electrical and optical parameters relevant to for their use as luminous flux transfer lamps i.e. stabilisation time, luminous flux stability, active power stability, power factor, total harmonic distortion, root mean square of current, spectral power distribution, CCT and luminous intensity distribution.
4. Conclusions
A mains operated LED-based transfer standard source for luminous flux scale realisation and dissemination has been developed. After seasoning, characterisation of optical and electronical performance, and calibration, the standard will be used for a round robin comparison among test laboratories. The first measurements of optical and electronical performance look promising. The results for the characterisation and calibration of the transfer sources will be presented at the conference.
CIE Session 2019 – Abstract Booklet
377
PO068
OPTICAL PARAMETERS COMPARISON OF DENTISTRY OPERATION LIGHTS
Ferreira Junior, A.F.G.1 1 Institute for Technological Research - IPT, Sao Paulo, BRAZIL
Abstract
1. Motivation, specific objective
The recent publication of standard ISO 9680:2014 - Dentistry Operation Lights change the requirements for equipment colour performance according to the type of light source used in the equipment, so that equipment using LED light sources are excluded from colour redering index requirement stated in the standard. This work presents spectral irradiance distribution, colour rendering index and colour coordinate comparison of dentistry operating lights with LED light source and filament light source and evaluate this parameter according to ISO 9680:2014 requirements.
2. Methods
A setup was built for spectral irradiance distribution measurement using commercial spectroradiometer from Photoresearch Inc. model PR-705, PTFE (Polytetrafluoroethylene) plane diffuser, spectral irradiance certified reference material 1000W FEL-type lamp and a low pressure mercury spectral lamp. The dentistry operation light spectral irradiance measurement procedure was performed according to ASTM G138:2012 and CIE 63:1984 using the measurement geometry of 0° incidence light and 45° measurement (0°:45°). This procedure consisted of spectroradiometer calibration using FEL-type and mercury spectral lamps followed by dentistry operation light spectral irradiance distribution measurement. The colour rendering index and colour coordinates was calculated from the spectral irradiance measurement using the software included in the CIE 13.3:1995 publication.
3. Results
The results from three different dentistry operation lights concerning two from LED source type and one from filament source are obtained. The filament source type spectral irradiance distribution does not match the shape of an illuminant A which is mainly associated to head reduction elements included in the equipment optics. The LED source type spectral irradiance distribution presents differences in the maximum irradiance in blue part of spectrum which impact the colour rendering index results.
The general colour rendering index (Ra) and correlated colour temperature obtain from LED source equipment are: for LED1 Ra = 72.3 and Tc = 4995 K and for LED2 Ra = 87.0 and Tc = 5165 K. The general colour rendering index (Ra) and correlated colour temperature obtain from filament source equipment are Ra = 94.5 and Tc = 4400 K.
4. Conclusions
The majority general colour rendering index obtained from the evaluated dentistry operation lights are above the ISO 9680:2014 requirement of Ra = 85. Although the ISO 9680:2014 excludes LED light source from this requirement, it is observed that a dentistry operation lights with LED light source could attain the standard requirement. The coordinated chromaticity of LED1 is at the border limit of ISO 9680:2014 requirement far enough for equipment conformity to the standard.
Although the ISO 9680:2014 excludes LED light source from the general colour rendering index requirement it is observed that there is dentistry operation lights in the market fulfilling this standard requirement. This LED2 type source could be a strong candidate for filament substitution in dentistry operation light application.
CIE Session 2019 – Abstract Booklet
378

PO069
VISUAL SCALE DEFINITION FOR GRAININESS TEXTURE BY APPLYING MULTIDIMENSIONAL SCALING
Perales, E.1, Ferrero, A.2, Martínez-Verdú, F.M.1, Viqueira, V. 1, Campos, J.2 1 Universidad de Alicante, Alicante, SPAIN, 2Instituto de Óptica, Consejo Superior de Investigaciones
Científicas, Madrid, SPAIN
Abstract
1. Motivation, specific objective
The visual appearance of a product is a critical parameter implicated in the purchase decision of customers and allows the manufacturer to know about the reproducibility of its production. For these reasons, during the last years different efforts have been carried out by industrial manufacturers to provide attractive visual effects by using, for instance, special-effect pigments. Special-effect pigments provide a change in colour with viewing and illumination direction and a visually complex texture. Depending on the properties of the finish and the viewing and illumination conditions, the flakes exhibit a sparkle or graininess like texture. Under bright direct illumination conditions, such as sunlight, the flakes in a metallic finish glitter create a sparkling effect. Under diffuse illumination such as a cloudy sky, metallic finishes create a salt and pepper appearance or a light/dark irregular pattern. However, there are no standards that propose the mathematical and optical algorithms to measure and calculate the sparkle or graininess effect. Therefore, the objective of this work is to propose a visual scale for graininess texture based on the multidimensional scaling algorithm (MDS) to be compared with instrumental scales.
2. Methods
The visual experiment to scale the graininess differences is based on the triad method. Three different samples are shown to the observer at the same time. The observer selects the sample (right or left) more similar regarding graininess to the sample located in the centre. Each observer performethree repetitions after a training session. The VeriVide viewing booth is used to run the experiment. The experiment was conducted in a dark room and the observers spent 3 minutes to adapt to the lightness conditions. A set of 9 achromatic samples are used to run the experiment (84 triad combinations). The samples belong to the Effect Navigator® chart from Standox with 3 different grades of lightness and effect. After the visual experiment, the multidimensional scaling is applied with the data obtained from the psychophysics experiment to construct a low dimensional perceptual embedding of the graininess effect.
3. Results
The multidimensional analysis is carried out to evaluate the minimum number of dimensions needed to define or characterize the graininess attribute and to obtain a proper visual scale. From a first analysis, it seems that one dimension is necessary to define the graininess attribute with a consistent perceptual embedding.
4. Conclusions
In this work, the graininess characterization was conducted by MDS and visual perception. It was concluded that one dimension is involved in the perception of graininess.
CIE Session 2019 – Abstract Booklet
379

PO070
CHARACTERIZATION OF BYKO- SPECTRA EFFECT LIGHT BOOTH FOR DIGITAL SIMULATION IN A RENDERING TOOL
Huraibat, K.1, Perales, E.1, Ferrero, A.3, Martínez-Verdú, F.M.1, Kirchner, E.2, Van der Lans, I.2, Campos, J.3
1 Universidad de Alicante, Alicante, SPAIN, 2 AkzoNobel Technology Group Color; Sassenheim; the Netherlands, 3Instituto de Óptica, Consejo Superior de Investigaciones Científicas, Madrid, SPAIN
Abstract
1. Motivation, specific objective
Digital simulation by rendering of gonio-apparent coatings is nowadays a very active hot topic for optical metrology, colour science, computer graphics, and visual perception. Since this type of coatings changes visual attributes such as colour and texture, depending on illumination and viewing geometry, rendering three-dimensional objects covered by these coatings is a technological challenge. The encoding and representation of gonio-appearance in computer graphics platforms is usually done by 3D rendering software packages, and by applying theoretical optical models of the interaction between light and matter. A first step to get visual fidelity is to simulate the illumination scene. For this purpose, a directional light booth is simulated in a new rendering software developed by the AkzoNobel Technology Group Color. This new software is based on a multi-spectral physics-based approach to represent the BRDF when rendering three dimensional objects. For the illumination scene we selected the Byko-spectra effect multi-directional light booth (BYK-Gardner). This light booth is particularly suitable for this task, since it was designed such as to optimize the visibility of sparkle and other texture effects in gonio-apparent automotive coatings. The lighting environment for the rendering tool is specified in terms of the IES/EULUMDAT format. This enables the user to specify the luminous intensity distribution from lamps and reflective areas surrounding the object that needs to be rendered. Unfortunatly, IES/EULUMDAT files of the light tubes inside the Byko-spectra effect light booth were not available from the manufacturer. Therefore, the aim of this work is to delvelop a methodology to include the light emission characteristics of the light tubes, in order to be able to consider the bidirectional reflectance for any geometry of the coatings to be rendered. This methodology is based on measured illuminance levels inside the light booth.
2. Methods
The light source in the light booth (Philips Master PL L90 De Luxe 55W/950/4p) is simulated taking into account that it is composed of two separate tubes. To calculate its emission, we represent the two large tubes by N point sources, each one with a given angular luminous intensity distribution to be determined. Inside the light booth, we measured illuminance on M positions on the sample plane of the booth. In this approach, the measured value at one position equals the sum of the illuminances produced by each of the N point sources. Each single illuminance depends on the relative position of the each single point source and the position on the sample plane, and it involves considering the
angular position ϴ with respect to the normal to this plane. Under these conditions, and assuming a
Gaussian angular luminous intensity distribution for each point source, the best values for the
Gaussian model parameters (sigma and luminous intensity at ϴ=0o) were obtained by fitting the
modelled illuminances to the measured ones.
3. Results
From the results of the optimization, it is possible to conclude that the behaviour of the light source installed in the Byko-spectra effect multi-directional light booth is almost isotropic since it does not depend on the angle (extremely high sigma value for N=100 and M=55). Therefore, each of the N points emits isotropically with the same luminous intensity. By comparing theoretical and measured illuminance levels we find good accuracy.
4. Conclusions
In this work, a methodology to simulate a specific lighting scene is proposed. This methodology is based on the computation of the illuminance as a sum of N point sources by assuming a Gaussian angular luminous intensity distribution, which is characterized by comparison with measured
CIE Session 2019 – Abstract Booklet
380

illuminance values. This way, it is possible to consider the bidirectional reflectance for any geometry of the coatings to be rendered. Our results show that the studied light source can be well described by N points that emit isotropically, and with each having the same luminous intensity. This result simplifies the design of the lighting environment for the developed rendering tool. It shows that the light tubes can be accurately represented by a polygon with N points, and by using Real-Time Polygonal-Light Shading with the Linearly Transformed Cosines algorithm.
CIE Session 2019 – Abstract Booklet
381

PO072
CACULATION OF CCT AND Duv BASED ON POLYNOMIAL UP TO THIRD ORDER
Gao, C.1, Wang, Z.1, Xu, Y.1, Li, C.J.1* 1 University of Science and Technology Liaoning, Anshan, CHINA
Abstract
1. Motivation, specific objective
For estimating the correlated colour temperature (CCT) of a light source, a nonlinear optimization problem must be solved as definition by CIE. In order to avoid using an iterative method for solving the non-linear optimization problem, many empirical methods such as McCamy, Qiu and Robertson methods were proposed for estimating the CCT. However, its accuracy is poor. Recently, Ohno [LEUKOS, 10:47–55, 2014] proposed a method. The method uses certain points in CIE 1964 (u,v) space on the locus of Blackbody radiator as lookup table (LUT). Then, for the given chromaticity coordinates (u0,v0) of the light source, two and three points in LUT nearest to the given point (u,v) can be selected. For the two points selected, a linear function in (u,v) space can be established. Thus, a shortest distance denoted as Duv1 to the line for the given point (u0,v0) can be found. Hence, the distance Duv1 can be an estimation to the true distance Duv for the given point (u0,v0) to the Planckian locus. Furthermore, a quadratic function of the colour temperature T can be established based on the three selected points from the LUT. The shortest distance denoted as Duv2 from the given point (u0,v0) to the quadratic function or the minimum of the quadratic function can be an estimate to the true Duv for the given point (u0,v0). Note that all the estimated Duv having a sign. If the point is located above the the Planckian locus, it has a negative sign, otherwise it has a positive sign. The final estimated Duv = Duv1 if the absolute value of Duv1 < 0.002, otherwise, Duv=Duv2. The CCT of the given light source can be finally estimated based on the choice of the final estimated Duv. The Ohno method accuracy depends on the number of points selected in the LUT. It is also found that the accuracy of the method become worse when the true Duv is large. As we all know that when the spectral of LED light source is designed based on three or four or more primaries, an optimization method is needed based on many objectives such as high colour rendering index and high f luminous efficacy of radiation. An iteration method is needed for the optimization. For each iteration, the corresponding Duv and CCT are needed to test if the current combination of the LED primaries satisfies the objectives. It is often in this case, the Duv is large, thus, the estimation from Ohno method will have large error, which affects the optimization result.
The objective of this paper is to further improve the Ohno method and the new proposed method will be more accurate in predicting the CCT and Duv compared with the Ohno method. It will have an important application in LED spectral optimization.
2. The Proposed Method
Similar to the Ohno method, a certain number of points in (u,v) space on the Planckian locus is selected as a LUT. Note that each point selected in LUT associates a colour temperature T. Firstly, for the given light source chromaticity (u0,v0), two, three and four points from the LUT closest to the given point (u0,v0) can be found. Thus, for the sets having two and three points, the associated Duv1, Duv2 can be found using the method similar to Ohno method. For the set having four points, a third order polynomial of the colour temperature T can be established. The minimum (denoted as Duv3) of the third order polynomial can be found and can be an estimate to the true distance Duv for the given light source. As noted above, all the estimated Duv have a sign, i.e. if the point is located above the the Planckian locus, it has a negative sign, otherwise it has a positive sign. Finally, the one whose absolute value equals the minimum of the thee values |Duv1|, |Duv2|, and |Duv3| is selected as the estimate to the true Duv. The corresponding CCT can be obtained at the same time.
3. Results
For testing the above proposed method, testing set in (u(T),v(T)) in (u,v) space can be selected on the Planckian locus. Specifically, for any selected colour temperature T from 1000 K to 20000 K (with step equal to 1K), the point (u(T),v(T)) on the Planckian locus can be computed and an associated isotemperature line in (u,v) space can be found. On each of the isotemperature line 5 equi-spaced
CIE Session 2019 – Abstract Booklet
382

samples can be selected. Note for each isotemperature line associated to the selected colour temperature T, the isotemperature line goes through the point (u(T),v(T)), i.e., the isotemperature line and the Planckian locus intersects at point (u(T),v(T)). Furthermore, isotemperature line is orthogonal to the tangent of the Planckian locus at point (u(T),v(T)). Thus, all 5 samples have by definition the same CCT for a perfect computational method. Then, we can compute the five equi-spaced samples in each isotemperature line: sample #3 is just placed on the Planckian radiator locus in the u, v space;
samples #1 and #2 are placed above the Planckian locus at distances of 5x10² and 2.5x10² units in u, v space, respectively; samples #4 and #5 are placed below the Planckian locus at distances of
2.5x10² and 5x10² units in u, v space, respectively. The distance of 5x10² units to the Planckian locus in the u, v space is chosen because it is the limit currently established by CIE in order to apply the concept of CCT.
Note that the range for colour temperature T from 1000 K to 20000 K was considered by Ohno in his paper. Since the step is 1K, the above test set having 95005 samples (19001 isotemperature lines and 5 samples on each line) with known CCTs. Thus, the Ohno method and the proposed method can be applied to the test set. Performance for each method can be measured in terms of the absolute value of the difference between the predicted CCT and the true CCT for each sample. Initial test indicates the proposed method is better than the Ohno method.
Remember, in the LED spectral optimization application, for each iteration, the current spectral may
have the Duv larger than 5x10². Furthermore, the Hernandez-Andres et al.[ Applied Optics, 38(27), 5703-5709(1999)] considered CCT range up to 106K. Comprehensive test with colour temperature T from 20000K to 106K have been additionally considered and test result have showed the proposed method is much better. All detailed analysis and result will be reported in the full paper.
4. Conclusions
A new method is proposed for computing CCT and Duv for a given light source. The method is simple and is a generalization of the Ohno method. Testing results show the proposed method is more accurate than the Ohno method, especially when the true Duv value is larger. The proposed method has an important application in LED spectral optimization applications.
CIE Session 2019 – Abstract Booklet
383

PO074
A STEP FORWARD IN LIFETIME MULTI-DOMAIN MODELLING OF POWER LEDS
Hegedüs, J.1, Hantos, G.1, Poppe, A.1, 2 1 Budapest University of Technology and Economics, HUNGARY, 2 Mentor, a Siemens business (ex
Mentor Graphics), HUNGARY
Abstract
The recent industrial trends are continuously pushing product development under digitalization in order to reduced time-to-market and development cost. This mostly means computer aided simulations on the so called digital twins of the real life components, like light sources, optical parts, heatsinks, etc. Power LED modelling is still an active research area; a recent European wide H2020 project undertook to fulfil the growing industrial needs and aimed to generate the measured-data based digital twins of power LEDs. Besides many considerations like round-robin testing, product variability analysis, chip-on-board device modelling, etc. a question also arose: how could the electrical, optical and thermal parameter degradation of LEDs be modelled? How could a lifetime-lasting digital pair of an LED be generated? This exceeds the goals of the ongoing H2020 research project but the answer is an increasing must as it offers improved reliability, lower power consumption and a higher visual comfort during the whole lifetime of streetlighting luminaires.
1. Motivation, specific objective
Unlike incandescent and fluorescent light sources, the common failure mode of LEDs is not catastrophic failure. End-of-life criteria of SSL (Solid State Lighting) products are usually connected to the IES LM-80-08 approved method that measures total luminous flux depreciation of LEDs. Measuring the continuously shifting forward voltage of the LEDs may be part of the life tests but it is still not required and therefore such measurements (or the results reporting) is often omitted. In addition, LM-80-08 (like any other common life testing method) is defined at predetermined ambient temperatures and does not consider any change in the dissipated power or the degradation of the heat flow path, i.e. the cooling capability of the LED. In the lack of accurate lifetime models, streetlighting luminaires are usually designed by rules-of-the-thumb or by experimental data of existing prototypes.
The so called L70 or L50 means that the product lifetime ends when the luminous flux depreciation reaches down to 70% or 50% of the initial value. LEDs are usually driven by current sources where the current value is pre-defined at the design stage and is constant during the whole product lifetime. In case of automotive and streetlighting applications the forward current should be set, in order to fulfil the minimum light output performance even until the specified end-of-life criteria (like L70 or even L90) are reached. Therefore, a design methodology (that has been published earlier) resulting in constant light output performance throughout the whole product lifetime could further enhance efficacy and permanence of SSL devices. To achieve such a control scheme the first step is generating the lifetime multi-domain model of the LEDs.
2. Methods
The multi-domain LED model developed at our Department and refined in the recent H2020 project is based on the so called isothermal forward current – forward voltage – radiant flux (i.e. iso-flux) measurements. It implies that the optical and electrical parameters are simulated according to the pn-junction temperature of the light emitting diode. The pn-junction temperature is calculated by the compact thermal model of the LED package which can be further extended by the compact thermal model of the cooling assembly. This makes the model capable of performing system level simulations of the whole luminaire, appropriately calculating the light output of the device at any forward current and ambient temperature conditions.
Aging tendencies of LEDs (like interconnection, package or chip scale degradations) can be measured accurately by the above mentioned isothermal measurements. By periodically performing the characterisation as the life test elapses, the multi-domain models of the aging LED can be generated and that way the time dependence of the model parameter shifts can be revealed.
CIE Session 2019 – Abstract Booklet
384
As a base concept, the model must be suitable even for the freely available circuit simulator software, that way trying to push the methodology into everyday development practice.
3. Results
In the above mentioned H2020 project a high number of power LEDs were characterised and modelled. For this purpose, an automated global parameter fitting process was developed to handle such large volumes of measured data. In the same run the parameter fitting process was performed on a sample LED set aged and characterised in a previous European wide research project with some additional boundary conditions (or constraints). From the achieved results a well-established aging trend of the model parameters cannot be identified yet, but they still demonstrate the suitability of the method. The gained experiences provide useful considerations in the preparation of the further development directions.
4. Conclusions
Iso-flux characterisation of LEDs is the key to accurate modelling. An ongoing research project has already conducted extensive study for generating measured-data based compact LED models to serve the most recent industrial needs for component digitalisation. Preliminary investigations were also done as a step forward in lifetime multi-domain modelling of power LEDs.
Well-defined aging trends of the model parameters could not be revealed yet but the gained experiences will be necessary to specify the next research directions. The results are also promising, calling for further development in order to replace any rule-of-thumb technics with accurate system level simulations in the field of streetlighting luminaire designing.
CIE Session 2019 – Abstract Booklet
385
PO075
EXTENDED WAVELENGTH LED FOR RADIOMETRICAL AND PHOTOMERICAL CALIBRATION
Hui, L.1, Lan, W.2, Weiqiang, Z.1, Jinyun, Y.1, Lin, J.1, Su, Y.1, Xueping, W.2 1 National Institute of Metrolog, Nowherecity, 2 Xiamen Xindeco lot&Optoelectronics Technology
Institute Co.,ltd, CHINA
1. Motivation
Standard Light source having sufficient intensity in UV and blue range is lack in the field of radiometry. Halogen lamp and xenon lamp are widely used as a transferring standard in near UV band, unfortunately, incandescent lamp doesn't have sufficient intensity at this band even burning at high CCT, xenon lamp is not stable enough as a standard lamp. As well, the spectral reflectance of the integrating sphere coating, the responsivity of spectrorradiometer and photometry detector is lower in this band, which caused higher measurement uncertainty. The International comparison of APMP.PR-S3 in measuring photometric, colorimetric quantities of a group of colour and white LED showed the deviation of measurement result of blue LED is obviously bigger than white and green, possibly due to the big uncertainty for the spectroradiometer calibration in blue band and imprecise spectral mismatch correction applied for photomter.
Recently, with the remarkable development of LED, the efficiency of LED in blue and UV band is improved. Special spectrum designed LED with sufficient intensity in blue and UV band that be used as a standard light source is becoming possible , as reported NMIJ has been developed a standard LED for total spectral radiant flux.
2. Methods
Most of commercial white LEDs generate white light by mixing the blue emission from the blue LED die and the yellow fluorescence from the phosphor, which has limited energy beyond the band of (420-720)nm. For that reason, white LEDs developed to date have not been suitable as standard sources for spectral irradiance. In order to generate sufficient light intensity over the full visible range, without step ripple and gorge of the spectrum. . A special spectrum designed LED has been developed, which combined of six types LED dies with different central wavelength from 390nm to 460nm, to excite RGB fluorescent material. The developed LED is a COB model composed of 48 LED dies, with a diameter of 9.8mm, the maximum driven current is 200mA, forward voltage Vf is 36V, typical luminous flux is 250lm. A mechanism heat sink and temperature control system is used to keep It work in a
stable temperature. It could be worked in 2Пmodel or 4Пmodel for integrating sphere.
3. Results
The developed LED has greatly enhanced the intensity in the blue range compared to commercial white LED and incandescent lamp, in the range of (380-450)nm is 4 times stronger than incandescent lamp, in the range of (650-780)nm is stronger than commercial LED , when each spectrum normalized at their maximum value individually.
A sample of this LED, burning in 4Пmodel, was used as a reference spectral radiant flux lamp to
calibrate the integrating spectroradiometer, then a group of LED with colour of white, blue, green, red were measured. In order to investigate the robust of this kind LED being used as spectral radiant flux standard, we first do the measurement using the spectroradiometer CAS 140CT made by Instrument system, and then repeat the experiment using spectroradiometer OL770 made by Optronic Laboratories Corp. The measurement result was compared with incandescent reference lamp, the deviation of luminous flux is within 1.3%, the deviation of chromatic coordinate is within 0.002.
4. Conclusions
With the corporation of a LED manufacture we have developed this extended wavelength LED, which has sufficient intensity and relative smooth spectrum in the whole visible band, especially in the blue band. One advantage of this LED is, it could be used both as radiometry and photometry standard; the second is, the spectra is easy to be extrapolation and interpolation based on limited amount of measurement points to enable calibration of photometric and radiometric instruments.
CIE Session 2019 – Abstract Booklet
386

PO077
CEILING-BASED LUMINANCE MEASUREMENTS: A FEASIBLE SOLUTION?
Kruisselbrink, T.W., Dangol, R., Van Loenen, E.J. Eindhoven University of Technology, Eindhoven, THE NETHERLANDS
Intelligent Lighting Institute, Eindhoven, THE NETHERLANDS
Abstract
1. Motivation, specific objective
Lighting is an important aspect of the indoor environment, having effects on occupants’ visual comfort, visual performance, alertness, circadian rhythm and general health. It has been shown that the luminance distribution is a good measure for the experienced visual comfort and visual performance as it directly relates to the brightness. Previously, the luminance distribution was measured by a spot luminance meters, which was a tedious and imprecise method due to rapid changes in the luminous environment. However, current High Dynamic Range Imaging (HDRi) technology has enabled the scientific community to measure the luminance distribution using image-based systems (so-called luminance cameras). Moreover, important user requirements, such as autonomy and modest costs, can be met for the implementation of this type of sensor in lighting control systems. It is expected that luminance camera based control systems, will exceed the performance of current control systems, typically equipped with only an illuminance and/or motion sensor, because they can measure the full luminance distribution. The luminance distribution contains information on numerous lighting quality aspects such as quantity (luminance, illuminance), glare, dynamics, and distribution. Nevertheless, numerous practical issues occur when these kind of control systems are implemented in real-life. For instance, to indicate the visual comfort or visual performance, luminance distributions are needed that correspond to the visual field of the user However, this is not feasible for long term measurements, as required for a control system, because this will impede the users from moving or doing their work. Therefore, it is suggested to place the image-based system in the ceiling, similar to traditional light sensors, where it is unobtrusive to the user; additionally, it enables the luminance camera to monitor multiple desks at once. However, this will reduce the relevance of the measurement. Therefore, the objective of the study is to validate whether ceiling-based luminance distribution measurements are able to approximate relevant data for deriving a measure of the human experience in an office environment.
2. Methods
In a mock-up office located in Eindhoven and measuring 5x5.5m, with windows facing west (5.5x1.9m), luminance distributions are continuously measured with ten minute intervals, for one day of clear sky conditions, one day of intermediate sky conditions and one day of overcast sky conditions during November and December. Each day is described by a morning (8.30-12h) and afternoon (13-16.30h) period. The electric lighting is completely switched off to provide extreme situations.
Two luminance cameras are placed at eye level using tripods representing the true visual fields of a seated office user facing south and north, respectively. To compare these with the proposed ceiling based solution, one luminance camera is attached to the ceiling. The average luminance on the desktop area of the two virtual users is extracted from the representative luminance cameras at eye level and ceiling for each sky condition and day period.
Using the root mean square error (RMSE), indicating the difference between the approximated and actual values, it is analysed whether the ceiling-based camera (approximation) is able to replace the representative luminance camera at eye level (actual values). A calibration is applied for the ceiling-
based camera such that for each individual sky condition and day period. Additionally,
a single calibration factor is applied for the aggregate of conditions.
3. Results
For the experimental conditions used, on average the relative RMSE between the approximated and actual value was 16% when applying a calibration factor for each individual sky condition and day period. The approximation performance of the ceiling-based camera was better in the morning (12%),
CIE Session 2019 – Abstract Booklet
387
due to no direct light, compared to the afternoon (20%). Controversially, the overcast (17%) and intermediate (21%) sky conditions in the afternoon caused larger relative errors than the clear (9%) sky conditions; however, the absolute errors are, as expected, larger for clear sky conditions compared to overcast sky conditions. Nevertheless, the predictive performance of the ceiling-based camera is the lowest under intermediate conditions with a relative RMSE of 21%.
In general, the order of the relative predictive performance of the ceiling-based camera for the different conditions remains the same using one single calibration factor for all conditions. However, the RMSE’s are then significantly higher, on average the relative RMSE almost doubled to 28%. Still the predictive performance of the ceiling-based camera performs worst under intermediate sky conditions with a relative RMSE of 33%.
4. Conclusions
Based on these results, it can be stated that the ceiling-based luminance camera cannot exactly approximate, as expected, the luminance of the desktop area as experienced by the office user. The average relative RMSE was 16% which can be considered significant. However, the experienced luminance can be approximated to a large extent, at least the order of magnitude. Moreover, it is expected that the addition of artificial light will reduce the RMSE of the ceiling-based camera because this will reduce the contrast within the scene.
CIE Session 2019 – Abstract Booklet
388

PO078
AUXILIARY DETECTOR POSITIONING SYSTEM WITH SIX DEGREES OF FREEDOM FOR THE EXTENSION OF A PHOTOMETRIC BENCH
Ledig, J., Schrader, C., Lindner, D., Sperling, A. Physikalisch-Technische Bundesanstalt (PTB), Bundesallee 100, 38116 Braunschweig, GERMANY
Abstract
1. Motivation, specific objective
The traceable calibration of an Imaging Luminance Measurement Device (ILMD) or of the luminance distribution of a light source requires knowledge about numerous contributions to measurement errors and uncertainties. In order to characterize ILMDs, especially those with a large measurement field angle (e.g. up to 90°), a large range of its pose (position and direction) with respect to a light source is required. Such a large pose sequence can only be achieved by an automated positioning system with appropriate, in general six, degrees of freedom.
2. Methods
An established photometric bench is extended by a wall mounted articulated industrial robot with six axes. The drives of these axes are monitored by absolute encoders, giving access to the joint angles. Safe operation with clearance to the environment is ensured by a collision model and monitoring of the robot working zone by safety contact mats. In contrast to laser scanners (which represents external sources or light or IR radiation), the used safety system does not disturb the photometric measurement.
The pose is initially referenced with respect to the existing photometric bench system by using autocollimation and a laser tracker. The wrist flange of the articulated robot is equipped with a stable and repeatable mount for ILMDs with a weight of up to several kilograms.
3. Results
A precise absolute pose is achieved by an accurate calibration by Denavit–Hartenberg parameters of the kinematic chain and compensation of gravity related distortion. The robot joints are in most poses placed behind the ILMD and thus provide a small cross section to the light source, which keeps interreflections and stray light on the light source at a low level.
In combination with a well-characterized ILMD, the system will also be used for measuring the partial luminance distribution of a light source. Thanks to the flexible positioning system the focus plane of an ILMD with respect to the light source can be varied and a measurement sequence with partly redundant datasets, e.g. by tilting the camera around arbitrary points, can be obtained. Such redundant results are useful for demonstrating critical aspects in sampling of a luminance distribution and related limitations of its reconstruction. The latter are an intrinsic property of the measurement result and of ray data extracted from it. Therefore, the limitations need to be known when using ray data for subsequent simulations, e.g. of a luminaire or illumination scene.
4. Conclusions
The new positioning system extends the photometric bench facility – which is already unique worldwide – by a precise change of the ILMD pose at different measuring distances up to 40 m. This enables a characterization of ILMDs as well as of the partial luminance distribution of a light source and will be advantageous for estimating uncertainty contributions related to their spatial and angular characteristic. Although the positioning system is not dedicated for measuring the luminance distribution in a full 2π geometry, these insights are beneficial for discussing uncertainties related to conventional near-field goniophotometry.
The positioning system itself and experimental results for its precision will be presented. In addition, concepts for characterization of ILMDs and light sources will be outlined.
CIE Session 2019 – Abstract Booklet
389

PO079
BEAT FLICKER – A TEMPORAL LIGHT ARTEFACT DUE TO MULTIPLE SOURCES OF TIME MODULATED LIGHT
Lindén, J.1, Dam-Hansen, C.1, Thorseth, A.1 1 DTU Fotonik, Department of Photonics Engineering, Technical University of Denmark, Roskilde,
DENMARK
Abstract
Temporal light artefacts, abbreviated TLAs (including flicker, stroboscopic effect and phantom arrays), i.e. undesired visual perception effects caused by temporal light modulation (TLM) of a light source, has shown to be a threat to wider SSL adoption especially related to dimming functions and low-quality LED products. This is due to both the noticeable and unperceivable effects of TLM on human perception and wellbeing. Currently, no standards for assessing TLAs exists, however several metrics have been suggested the latest years, including the visibility measure Mv in 2016 and compact flicker degree (CFD) in 2015. However, all the suggested metrics requires a temporal modulated light intensity with well-defined periodicity. These measures do not take into account the effect that could arise from several light sources with similar, but not identical, waveforms and/or frequencies, resulting in a superposition waveform, giving rise to a phenomenon, which in this work is called beat flicker. In the present work, waveforms as such, both authentic and simulated, are investigated with respect to several TLA metrics.
1. Motivation, specific objective
TLA metrics, such as stroboscopic visibility measure, percent flicker and CFD, are tools meant to quantify the magnitude of the impact of temporal modulated light generated by light sources. However, as lighting systems are becoming more and more complex, just assigning a TLA metrics to a light source is not necessarily an easy task.
Since the temporal characteristics of any LED based lighting are directly mimicked by the characteristics of the electronic driver, any light source comprising more than one driver could, in principle, generate a superposition waveform that turns out not to be so straight forward to asses.
For example, a luminaire containing two drivers operating on slightly different frequencies could generate a light intensity waveform, resulting in some TLAs at one moment, and different TLAs at another moment. If the frequencies of the drivers differs with 1 or 2 Hz, the resulting superposition waveform would show a periodic behaviour with a frequency of 1 or 2 Hz. In acoustics, the corresponding phenomena would be two tones with slightly different frequencies, giving rise to something called “beats” – a perception of intensity variation of a tone, the frequency of the intensity variation being the difference in frequencies of the two original tones. The authors of this paper therefore calls the “light”-version of this phenomena beat flicker.
Depending on the number of temporal modulated light sources involved, and depending on the difference in frequencies from the same, the measured values of the different TLA metrics – let it be stroboscopic visibility measure, percent flicker or whatever – will vary with time.
The objective of the present work is to draw attention to a challenge that might arise, when assessing temporal modulated light, using tools currently available. The presence of beat flicker could be such a challenge to handle, both in the case of a single luminaire or in the case of an entire lighting environment containing several light sources.
2. Methods
In the present work, a superposition waveform from two ceiling luminaires is investigated with respect to several TLA metrics. The luminaires contains electronic drivers, enabling pulse width modulation dimming at frequencies of 552 Hz and 547 Hz, respectively. The dimming levels are set close to 50 %, meaning both the square waveforms exhibit a duty cycle of 50%.
The resulting light intensity variation are recorded, for a period up to 20 seconds, using a photodiode and an amplifier connected to a data acquisition unit and a computer. The sample rate is 20.000 S/s.
CIE Session 2019 – Abstract Booklet
390

In addition to the measurements, TLA assessments on simulated waveforms are performed, in order to estimate and analyse some worst-case scenarios.
3. Results
The resulting waveforms are analysed with respect to different TLA metrics, at different starting positions in time. The expected results are that, depending on starting position and size of investigated time window of the waveform, the resulting values of the different TLA metrics will differ with time.
4. Conclusions
It is expected that the variation of the TLA metric values depend on the complexity of the original waveforms and the difference in frequency between the waveforms in question. It is the opinion of the authors that the highest obtained value of the TLA measures is the one to be used, and that should serve as the result of such an assessment.
CIE Session 2019 – Abstract Booklet
391
PO080
SPECTRAL SUPRALINER BEHAVIOR OF SILICON PHOTODIODES WITH OVER-FILLED ILLUMINATION
Minoru Tanabe1 and Kenichi Kinoshita1 1 National Metrology Institute of Japan, National Institute of Advanced industrial science and
technology, Tsukuba, JAPAN
Abstract
1. Motivation
Silicon (Si) photodiodes (PDs) are favorable for optical measurements in a wide power range of more than six orders of magnitude and at the wavelength region from visible to near-infrared light. Si PDs have been used for accurate optical measurements in the field of metrology, and they have been installed in photometric instruments such as the illuminance and luminance meters. However, the absolutely determined optical flux range is limited from tens of microwatts to milliwatts. The linearity of the Si PD with respect to the incident optical power at various wavelengths is a fundamental element to determine the absolute optical power at a wide power range.
The response of an ideal Si PD is linear. However, the response of almost all Si PDs is nonlinear at a certain optical flux, with a decrease and/or increase in responsivity. The responsivity decreases owing to saturation, which depends on the PD series resistance value. In contrast, the responsivity increases owing to the recombination losses of the generated minority carriers in the Si-bulk region and/or in the interface between the Si and the surface layer of the Si PD. This increase in the responsivity is known as supralinearity.
In the past studies, nonlinearity measurements of the Si PDs have been conducted in under-filled illumination condition, when the incident beam diameter is smaller than the available detection area of the Si PD. In photometry, Si PDs are occasionally used in over-filled illumination condition, with the beam diameter larger than the available detection area of the Si PD. A detailed spectral linearity evaluation with over-filled illumination in the visible region is important for determining the capabilities of Si PD as photodetectors. In this study, we report on the experimentally measured spectral supralinearities of Si PDs in the visible region with over-filled illumination.
2. Methods
The nonlinearity measurement with over-filled illuminations was performed with the flux addition method. The laser beam was divided into two paths (path A and path B) by applying a polarization beam-splitting (PBS) cube. By blocking one of the laser beams at a time and superimposing them on the PD using two mechanical shutters, the photocurrents IA, IAB, IB, were sequentially measured using a picoammeter. The linearity factor was calculated by LF=IAB/(IA+IB). By increasing the laser power multiplicatively, the nonlinearity of the Si PD can be obtained by summing up successive linearity factors.
A commercial silicon photodiode was selected. The detection area of the Si PD was 4.6 mm in diameter. The anode electrode of the Si PD was formed along the detection area.
Three lasers with wavelengths of 405 nm, 530 nm and 660 nm were used in this measurement. Each beam was adjusted with a collimating lens and a convex lens, allowing us to create a near-Gaussian shape of 1.0 mm in diameter on a Si PD. A commercial speckle reducer and a diffusion plate were used to create a uniform laser beam. The laser beam on the Si PD was approximately 20 mm in diameter and <0.1% in uniformity. This experimental setup enabled the Si PD to irradiate with over-filled illumination.
3. Results
We investigated the nonlinearity with over-filled illumination at the wavelengths of 405 nm, 530 nm, and 660 nm. Wavelength dependence of supralinearity was clearly observed, and the supralinearity values increased so that the incident wavelength was shorter. We found that the supralinearity values
sharply increased at the photocurrents of tens of nA from 1 A for all wavelengths. In wavelengths at which the incident beam penetrates the depletion layer of the Si PD, such as 530 nm and 660 nm,
CIE Session 2019 – Abstract Booklet
392

supralinearity values less than 4% were measured with over-filled illumination, although their values less than 0.1% had been obtained with under-filled illumination in previous research. In 405-nm wavelength, the maximum supralinearity value of approximately 5% was observed.
To examine the spectral supralinearity with over-filled illumination, the wavelength dependence of the linearity factor relating to the Si PD position was investigated. First, the photocurrent, IAB, was adjusted
at 128 A when the Si PD center was irradiated with the under-filled illumination. Next, the photocurrents for calculating the linearity factor as a function of the position were measured by moving across the Si PD diameter. Finally, the linearity factors were calculated along the diameter.
The calculated linearity factor increased as the laser beam approaches the Si PD electrode and, the linearity factor slightly increased from 660-nm to 405-nm wavelength. At 405-nm wavelength, the
surface recombination is dominant to generate supralinearity, as its absorption length is 0.1 m. This linearity factor results at 405-nm wavelength reveal that more surface recombination traps exited near the Si PD electrode than near its center. In the wavelengths of 530 nm and 660 nm, larger linearity factors near the Si PD electrode are also observed compared with those near the Si PD center. These linearity factor results and the supralinearity results with over-filled illumination indicate that the recombination trap that generates the supralinearity near the Si PD electrode exists not only in the interface between the Si and the surface layer of SiO2 but also in the Si bulk, as the absorption lengths
for 530-nm and 660-nm wavelengths are 1.3 m and 3.9 m, respectively.
4. Conclusions
The spectral supralinearity with over-filled illumination in the visible region was investigated. The supralinearity values sharply increased so that the incident wavelength was shorter. The wavelength dependences of the linearity factor relating to the Si PD position was examined. The measured linearity factor increased near the Si PD electrode in all wavelengths, and its wavelength dependence was confirmed. It is speculated that this wavelength dependence is caused by the minority carrier traps in the Si bulk and Si PD surface near the Si PD electrode, as the photon absorption length is dominant to the incident wavelength.
CIE Session 2019 – Abstract Booklet
393

PO081
DEVELOPMENT OF A COMPACT-SIZE STANDARD LED FOR SPHERE-
SPECTRORADIOMETER IN 2 GEOMETRY
Nakazawa Y.1, Godo, K.1, Yamaji, Y.2, Fujiki, A.2 1 National Metrology Institute of Japan (NMIJ), Tsukuba, Ibaraki, JAPAN,
2 Nichia Corporation, Anan, Tokushima, JAPAN
Abstract
1. Motivation, specific objective
For total luminous flux evaluation of LED products, total spectral radiant flux (TSRF) measurement is important. Recently, NMIJ and Nichia Corporation have developed a new LED based standard source
(2 standard LED) that is suitable for 2 TSRF measurements. The 2 standard LED has sufficient
spectral power over the full visible wavelength range. This 2 standard LED was developed as a reference source for a sphere-spectroradiometer with a large-size integrating sphere which is used for
measurement of LED module and LED luminaires, then the body diameter of the 2 standard LED is
62 mm, emitting area of it is 12 mm and the total luminous flux of it is about 200 lm.
On the other hand, LED package are recommended to be evaluated using a small-size integrating sphere of 20 cm to 50 cm diameter in CIE 127. Moreover, many manufactures evaluate LED package
using a small-size integrating sphere in 2 geometry. Therefore, there is a demand for a new standard source that can be used in the spectral measurement using a sphere-spectroradiometer with a small-size integrating sphere too.
The purpose of this study is developing a compact-size standard LED for the small sphere- spectroradiometer.
2. Methods
The compact-size standard LED had been developed to satisfy some requirements as well as the
2standard LED. For example, the requirements are that, having sufficient spectral power over the visible range (380 nm – 780 nm), emitting light to the forward direction and having ideal luminous intensity distribution, etc.
The most different requirement from the 2standard LED is that the size of a standard LED is preferably small to be mounted on a port of a small-size integrating sphere. Thus, the body diameter
and the size of emitting area of the compact-size standard LED was decided to useful for 1-inch port equipped in many commercial integrating spheres.
For downsizing a body size and an emitting area from the size of 2 standard LED, peak wavelengths of LED dies and combination of phosphors in the compact-size standard LED was reconsidered to make spectrum which meets above requirements. To obtain sufficient spectral power over the visible wavelength range, the method that combining UV-LED dies of multiple peak wavelengths and RGB
phosphors was used in the 2 standard LED development. In the compact-size standard LED development, however, we introduced a new method that combining single wavelength UV-LED (365 nm) dies, RGB phosphors and near UV phosphor (four type phosphors were used).
As a result, the new compact-size standard LED was developed that satisfies both characteristics of size downsizing and sufficient spectral power over the visible range. The body diameter of the
compact-size standard LED is 25 mm. The size of the emitting area located at the centre is 3.2 mm square. A thermo-module that controls the temperature of the emitting area is installed inside the compact-size standard LED and connected to external thermo-controller.
The spectrum shape of the compact-size standard LED was created considering the measurement uncertainties in spectral measurement: wavelength calibration uncertainty and slit function effect of the sphere-spectroradiometer. Thus, the spectrum was smooth and had no sharp peaks or dips.
CIE Session 2019 – Abstract Booklet
394

3. Results
The properties of the compact-size standard LED was evaluated using the LED goniophotometer system in NMIJ. This evaluation was operated under two conditions, (a) constant current of 350 mA and temperature of the emitting area at 55 °C, or (b) constant current of 500 mA and temperature of the emitting area at 65 °C. Total luminous flux was 5.9 lm and total radiant flux was 50.5 mW under condition (a), and total luminous flux was 7.8 lm and total radiant flux was 65.3 mW under condition (b). The luminous intensity distribution was almost equal to the Lambertian beam pattern. The angular dependence of spectrum was also evaluated, and it was revealed that the spatial distribution of the relative spectrum is almost uniform.
The stability and reproducibility of the compact-size standard LED were evaluated after 500 hours
aging processing. This aging time is longer than that of 2 standard LED. The short-term stability of radiant flux was about 0.01 % per hour and that of spectral radiant flux was below 0.05% per hour in almost all wavelength from 380 nm to 780 nm. The reproducibility of radiant flux and spectral radiant flux were evaluated in each of four independent 1-hour operations. As a result, reproducibility of the radiant flux was 0.02 % and that of the spectral radiant flux was within ±0.3 %.
The ambient temperature dependence of the compact-size standard LED was evaluated using thermostatic chamber at three temperatures (18 °C, 23 °C, 28 °C). The temperature variation coefficient of the radiant flux was less than 0.03 %/°C.
4. Conclusions
For TSRF measurement of LED package using a small sphere-spectroradiometer, a compact-size standard LED had been developed. For development of the compact-size standard LED, we introduced a new method that combining single wavelength UV-LED (365 nm) dies, RGB phosphors and near UV phosphor. By the new method, the emitting area of the compact-size standard LED was downsized to 3.2 mm square. The spectrum of the compact-size standard LED has sufficient power over visible wavelength range and no sharp peaks or dips. The compact-size standard LED has good properties such as stability. These properties indicate that developed compact-size standard LED is suitable for standard source of TSRF measurement of LED package.
CIE Session 2019 – Abstract Booklet
395

Poster session 2
Tuesday, June 18, 16:40-18:10
CIE Session 2019 – Abstract Booklet
396

PO100
COMPACT REFERENCE UV LED SOURCES WITH CONICAL DIFFUSE REFLECTOR
Nikanenka, S.V., Danilchyk, A.V., Lutsenko, E.V. B.I. Stepanov Institute of Physics National Academy of Sciences of Belarus, Minsk, BELARUS
Abstract
At present time, radiation measurements in UV range are non-uniform and the measurement uncertainties are high. A possible method to improve the accuracy of measurements in the UV range is to use of reference sources based on UV-LEDs. Recently a new generation of powerful LEDs in spectral range 265 – 320 nm was presented with a lifetime L70 – 10,000 hours (L70 - a drop of 70% power during the lifetime). The use of such LEDs in reference sources together with accurate current stabilization (accuracy ~ 0.025%, noise < 1.5 uA) and precise stabilization of the sources case
temperature (~ 0.01C) allows to create ultraviolet sources with high radiation stability.
In this work we describe the compact UV-LED sources with conical type of diffuse reflectors for UVA, UVB and UVC ranges, which is, as expected, will be suitable for metrology. Ultraviolet radiation sources for the CIE UVA, UVB, and UVC ranges based on UV-LEDs emitting at wavelengths of 265, 300, and 365 nm respectively, was created. Previously, we presented similar sources in our works. In this case, a significant difference is the use of a reflector from a Spectralon with a conical-shaped hole. This feature allowed to achieve greater uniformity of the spatial distribution of intensity and increase the radiation intensity. The optical power and spectral distribution of radiation from reference sources was measured at a distance of 0.5 m by calibrated UV silicon detector with aperture 10.3 mm.
The measurement of optical characteristics of the UV Reference LED sources were carried out using setup which was developed in B.I. Stepanov Institute of Physics of the NAS of Belarus. The main metrological characteristics of the measurement setup were determined: the spectral range of the measurement of the radiation power is from 200 to 1100 nm; the deviation angles in two perpendicular planes are ± 110° and 360°; the relative expanded uncertainty of the reproduction range of the rotation angle is 0.08 %; the relative combined uncertainty of LED spectral irradiance measurement in the spectral range from 200 to 900 nm is less than 2.8 %; the range of measurement of the LED spectral irradiance is from 102 to 1010 W·m-3; the relative combined uncertainty of the LED spectral radiance measurement in spectral range from 200 to 500 nm is less than 3.5 %; the range of measurement of the LED spectral radiance is from 102 to 1012 W·m-3sr-1; repeatability of automated positioning systems for moving the detectors 20 µm.
Before measurements, all LEDs were aged during 50 hours. The values of the optical radiation power density at nominal wavelengths of 265, 300 and 365 nm were 1,17, 2,86 and 229,03 W/m2 respectively. Accordingly, the FWHM of the 265, 300 and 365 nm sources were 10.5, 16 and 9.5 nm. UV holographic filter was used on the top of all three sources, which allows to smooth, and there for increase uniformity of the spectral-angular dependence, while the radiation loss is about 10%.The intensity of the reference LEDs is within ± 10º from the optical axis for 265 and 300 nm, and about ± 15º for 365 nm. The larger angle of spatial radiation of last mentioned source, compared to the sources at 265 and 300 nm, is due to the large LED with 4 chips and thus it needs larger diameter of the reflector.
Spatial distribution of spectral irradiance of the reference LED source of 365 nm was measured at the distance 500 mm from the surface of holographic filter. Measurements were performed on the area of 3x3 cm2, which is much larger than the characteristic photosensitive area of typical photodetectors used in precision optical radiometry, with 2 mm steps using photodiode head was limited by a 1 mm calibrated aperture. The standard deviation was about 0.4%, and the standard error was about 0.2% within the measurement area.
Compact reference UV LED sources were used to evaluate the measuring characteristics of UV radiometers Argus. The use of sources made it possible to show a significant overlap of the spectral ranges of radiometers for UV ranges A, B and C.
Good spatial characteristics of the radiation of compact reference UV LED sources, as well as their high short-term and long-term stability will improve the measurement accuracy in the UV range.
CIE Session 2019 – Abstract Booklet
397
PO101
EVALUATION WAY OF EFFECT COATINGS APPLYING GONIO-PHOTOMETRIC SPECTRAL IMAGING
Osumi, M. Office Color Science Co., Ltd., Yokohama, JAPAN
Abstract
1. Motivation, specific objective
Metallic and pearlescent colours such as recent automotive exterior coatings are included many types of effect pigments and applying multiplex coating. Effect coatings have colour, feel, and texture such as various sparkle and graininess images related with visual perceptions depending on illumination and observation angle. The main idea of evaluation is the use of combined colour and imaging information by gonio-photometric. In this study, a gonio-photometric spectral imaging system was applied to measuring colour and texture of effect coatings. It was composed of white LED illuminates, a liquid crystalline tuneable filter (LCTF), and CCD imaging device with Peltier cooler and anti-blooming function. To get highly accurate spectrum, each wavelength image was compensated to small pixel shift by black and white lattice pattern measuring. 40 effect coating samples were used and these were prepared with aluminium flake and interference micas by spray application. After measuring, the CIELAB colour value, the spatial distribution in CIELAB colour space, sparkle and graininess index were calculated. Analysis results in this study showed each value was related with characteristics of effect material.
2. Methods
Gonio-photometric spectral imaging system was composed of white LED illuminations, LCTF, and CCD imaging device with Peltier cooling unit. Illumination angles were 20, 45 and 70 degrees from normal direction, and detective direction was normal against sample, and the CCD device captures the images via the LCTF from 420 to 700nm with each 10nm and 380 dpi resolution of 772 by 580 pixels. Especially, it was considered the best ways of objective lens angle, CCD device resolution and illumination direction and distance to get highly sharpness for all measured area of effect coatings, and various optics dimensions were included in this image. Before measuring, the lattice pattern composed of white and black line was applied to compensation for registration error which was caused by LCTF optical aberration of each wavelength images. To get highly accurate gonio-photometric spectrum reflectance and imaging information, each wavelength sample image was compensated by measured lattice pattern to get small shift amount of x and y direction.
The effect coating test panels composed of absorption pigment, aluminium flake and interference micas were prepared. Each panel was coated on metal substrates by spray application. The thickness of base coat layer was 20 micron, and top coat layer was 35 micron.
3. Results
The lattice pattern image applying pixel shift compensation was shown in this study. Before compensation, measuring image was included a lot of false colour around peripheral part of black lattice line and reflectance profile was not horizontal and irregular. On the other hand, in the image applying pixel shift compensation, the false colour was disappeared and the registration error was decreased. Finally, this system could get highly accurate gonio-photometric spectral reflectance and colour values in a wide aspecular angle range from 3.5 to 80.8 degrees. Positioning difference in the centre and peripheral part of the images for each wave length were checked for spectral imaging, and confirmed high accuracy all over the image with no pixel shift.
The important point to note is measured panel which included interference pigment has wide distribution with all over the optimal colour area. This result suggests that recent effect materials need spectral imaging measurement to get high accurate L*a*b* value of sparkle and grain texture. As an example, the measuring result of Xirallic Crystal Silver interference effect pigment (Merck) with FW200 carbon black pigment is shown in this study. The distribution in CIELAB colour space calculated from measured spectral imaging of 20 degrees illumination was quite wide and distributed in optimal colour area. Especially, Xirallic Crystal Silver has large number of colour occurrence of 20 degrees
CIE Session 2019 – Abstract Booklet
398
illumination. Gonio-photometric spectral imaging was quite useful for evaluation of effect coatings to measure colourful sparkle index.
4. Conclusions
Developed Gonio spectral imaging system was composed by LCTF, CCD image sensor, and LED illumination. It was confirmed interference pigment had a very wide colour area. Developed system can get various and high accurate gonio-photometric spectral imaging information by short measuring time with no movement and simple structure. Moreover, this system has possibility to get high dimensional information such like distribution in CIELAB colour space, and colourful sparkle index. Especially, automotive exterior coatings apply many kind of interference effect material and they included high chromatic sparkle with sharp and high contrast image depending on optical dimension. Gonio-photometric spectral imaging with no registration error and simple measuring way is very important.
CIE Session 2019 – Abstract Booklet
399

PO102
DOES A SINGLE LED BIN REALLY REPRESENT A SINGLE LED TYPE?
Merelle, T.1, Sari, J.K.2, Di Bucchianico, A.2, Onushkin, G.3, Bornoff, R.4, Farkas, G,5, Gaál, L.5, Hantos, G.6, Hegedüs, J.6, Martin, G.6, Poppe, A.5, 6
1 Pi Lighting, SWITZERLAND, 2 TU Eindhoven, THE NETHERLANDS, 3 Signify (ex-Philips Lighting), THE NETHERLANDS, 4 Mentor, a Siemens business (ex Mentor Graphics), UNITED KINGDOM,
5 Mentor, a Siemens business (ex Mentor Graphics), HUNGARY, 6 Budapest University of Technology and Economics, HUNGARY
Abstract
In a recent H2020 European wide research project extensive study for generating multi-domain compact LED models based on measurement data was concluded. In this context combination of the latest LED testing standards and recommendations of JEDEC and CIE have been applied in testing and new models and modelling methods have been developed in order to capture the multi-domain operation of LEDs for the purpose of simulation. A valid question is: how representative a model is for a type of an LED package is, how to select a nominal LED device for modelling and how to capture the inherent variation of LED operating parameters. We had specific tasks dedicated to measure and model these variations. Findings related to capturing, quantifying and modelling of the thermal features of the mechanical structure of LED packages have already been published. In this paper we report about the measured variances of the multi-domain chip level operation of LEDs and the way how to model them. This completes other tasks of the project, related to an overall testing and modelling-simulation workflow and modelling large area CoB LEDs.
1. Motivation, specific objective
Design of today’s LED based applications such LED lamps with tuneable spectral power distribution for human centric lighting or temperature compensation in constant light output control of the most energy-efficient streetlighting applications or the latest LED based gas discharge lamp replacement solutions require careful design supported by extensive computer simulation in all operating domains (electrical, thermal, optical) of LEDs, at all levels of integration, from chip up to luminaire and lighting system level. At each level appropriate models (in an Industry 4.0 approach considered as digital twins of the physical devices) are needed, with the highest possible level of accuracy‡. To address this, a complete testing, modelling and simulation workflow has been worked out and proposed already at various conferences. An essential part of this is how to consider of sample to sample variations of LED packages selected from a given (even rather narrow) binning class of an LED package type.
LEDs have an inherent large variability in every operating parameter. For example, forward voltage (and power dissipation) has a typical ±10% variability between two LEDs of the same part number (when driven at constant current). The same applies to radiant flux, lumen equivalent (efficacy of radiation) or junction-to-pad thermal characterization parameter (in this case up to 50% variability). Physical placement of the chip within the package, with the associated tolerances, also impacts the light distribution, etc.
2. Methods
Round robin testing of the most popular LED packages (both in terms of spectral range and thermal design) with the participation of seven testing labs was completed last year and its results have been reported in a couple of conference papers. As expected, these tests revealed data about sample-to-sample variations (from 5 samples/package) of the different properties measured, as well as lab-to-lab variations of the test results. We also measured thermal impedances (revealing structural details of
the junction-to-ambient heat-flow path) and isothermal§ IVL characteristics at operating points (defined
by IF and TJ pairs) that covered all critical regions of the e(IF,TJ )/IF relative efficiency surfaces. For the
‡ Accuracy in terms of model predicted values of a certain operating parameter versus the measurable va lue of the same property, such as total luminous flux at operating junction temperature or chromaticity coordinates, ect.
§ Isothermal in terms of the TJ junction temperature
CIE Session 2019 – Abstract Booklet
400

specific purpose of variability analysis further 11 samples of a PCW LEDs and an additional set of 11 samples of their royal blue counterparts have also been characterised and modelled. Our aim was to investigate how the inherent LED parameter variations can be best represented in the developed models.
3. Results
The analysis of the thermal properties was already completed and published elsewhere, along with suggestions how to quantify and model the variations of the thermal properties of LEDs’ junction-to-ambient heat-flow path. These results revealed that the most variation of thermal properties were beyond LED chip/package level. PCW LEDs though, showed higher levels of variation on package level then their royal blue counterparts.
Evaluation of the multi-domain test results revealed that even within a single binning class pronounced
differences of the e(IF,TJ=const)/IF efficiencies were present. The comparison suggested at least two different sub-populations of LED chips were present in the investigated populations, though, the measured properties of LEDs were the same at the binning values of the IF and TJ.
As a next step, the complete set of the isothermal IVL characteristics of all the 11+11 LED samples have been individually fitted to our chip level, Spice-like multi-domain LED model. The core of this model is Shockley’s diode-equation. Based on the recent statistical analysis of the major parameters of this multi-domain model (I0 saturation current, ideality factor m and the RS electrical series resistance) also revealed again two clusters, suggesting that there are at least two sub-populations present in the set of samples we thought were homogeneous since they belonged to the same binning class.
4. Conclusions
As a next step, we are working on modelling the distributions of the multi-domain LED model parameters and find ways of defining the nominal LED device for the purpose of creating a representative multi-domain model for a given binning class of an LED package type. With the developed Monte Carlo models for the parameters of package level compact thermal models and chip level multi-domain models we aim to offer a comprehensive set of modelling and simulation solutions to LED application designers.
CIE Session 2019 – Abstract Booklet
401

PO103
CHARACTERIZATION OF THE INTENSITY DISTRIBUTION IN RETROREFLECTIVE ADHESIVES WITH NEAR FIELD GONIOPHOTOMETRY
Sanchez Junior, O.1, Silva, E.S.2, Vitro, J.G.1, Barros, K.N.1,3 1 Institute for Technological Research - IPT, São Paulo, BRAZIL, 2 University of São Paulo - USP, São
Paulo, BRAZIL, 3 Federal University of ABC – UFABC, Santo André, BRAZIL
Abstract
1. Motivation, specific objective
The overall objective of the present study was to explore some new possibilities for retroreflective film tests used in security signalling. The use of this safety material is increasing, and laboratories need to develop faster, cheaper and highly accurate means to give technical support to the developers of this material as well as to the adhesive’s applicators in signalling products in order to meet the technical standards applicable. One important and specific motivation is that the signalling sector has been increasingly regulated by national and international public bodies (airports, ports, railways and roads) and the certification of products has been used as an outlet to guarantee the service to security requirements, which facilitates the work of Accredited Inspection Bodies by public agencies.
2. Methods
The Technical Report CIE 054.2-2001, "Retroreflection: Definition & Measurement", deals with laboratory calibration and measurement techniques, together with basic instrument requirements and traceability to national metrology laboratories (chapter 6). However, since its publication, white light LEDs have emerged and the possibility of automating photometric processes with cheaper goniophotometers and the popularization of near field goniophotometry has emerged. ASTM E809-08 2013 and ASTM E808-01 2016 have gone a step further by incorporating methodological aspects of proper practice of using goniometers. The fact remains that the use of goniophotometers for retroreflection measurements is limited because the sensors can interfere significantly in the illumination of the sample or vice versa.
In the proposed method, the adaptation of a fixed source of white light LED, close to the CIE Illuminant A, was performed with very small dimensions, in order to minimize the effect of its "shadow" in the process of lifting the distribution curve of the retroreflective light. The experimental arrangement was developed to allow rapid, precise and low intervention measures. The validation of the method was performed with a study of the surface morphology of the samples, an estimate of the distribution profile of the expected retroreflective light, from a normalized and fixed position for the light source in relation to the illuminated surface (geometric optical simulation). Then, this expected profile was compared with the distribution profile obtained using near-field gonio-photometry. Conventional measurements were also performed for the same sample (standardized method) to support the final conclusions.
3. Results
The results obtained are subdivided into two parts. In the first part are presented the images of the microprismatic geometries of the films. The second part presents the photometric performance of the films returned by both the proposed method and the standard and conventional method.
In the analysis of the obtained results, we present some hypotheses of performance in function of the microprismatic geometry found. The differences in behaviour between the 0 ° - 180 ° and 90 ° - 270 ° angles are also highlighted, which led us to investigate the micro prismatic geometry pattern at each positioning angle. This gave rise to positional differentiations in the profiles of the angles between 0 ° - 180 ° and 90 ° - 270 °. In the case of the 0 ° - 180 ° angle, the positioning of the flat surfaces vertically causes the photometric performance to increase in the sample resulting in the larger peak presented. At the 90 ° - 270 ° positioning angles, the flat surfaces do not present significant reflection, thus reducing the effect of the retroreflection estimated for this condition.
With the retroreflecting tests by goniophotometry and by the conventional method, data were obtained for different angular positions and the distribution curve that allows to evaluate the performance of the
CIE Session 2019 – Abstract Booklet
402
retroreflective films. The results allowed to obtain the retroreflection coefficients for a receiver positioned at an observation angle of 0.2 ° in the positioning of 0 °, 90 °, 180 ° and 270 °. In the case of Goniophotometry, the data were obtained for a large set of plans and those of interest were selected after the measurements. The data refer to the sources used that meet the requirements for CIE Illuminant A.
4. Conclusions
Adaptation of a fixed source of white light LED, close to CIE Illuminant A, with very small dimensions was carried out, in order to minimize the effect of its "shadow" in the process of lifting the distribution curve of the retroreflective light. The obtained data were compared with an estimate made from the analysis of the surface morphology of the sample and also with the data obtained in the accomplishment of the measurements by the conventional normalized method.
The distribution curves obtained by goniophotometry correspond closely to the expected distribution curves, both for those estimated by the study of the surface morphology and for those obtained by measurements by the conventional standard method. The values of retroreflection coefficients (Ra) obtained diverged on the order of 5% on average.
It was observed that the influence of external factors such as the spurious ambient light and the vibration of the LED source support used in the near field goniophotometry can cause significant effects to the result. This leads to the need to improve the experimental arrangement in these aspects.
In general, it has been concluded that the proposed method, after a few modifications, can be a great option for measurements used in fast, cheap and precise processes for the certification of retroreflective adhesive films.
CIE Session 2019 – Abstract Booklet
403
PO104
AGEING PROPERTIES OF DEUTERIUM LAMPS USED IN CALIBRATIONS OF UV SPECTRORADIOMETERS
T. Schneider1, B. Eder1, G. Renkl1, E. Bothschafter1, M. Bandreddi1 1 Instrument Systems GmbH, Munich, GERMANY
Abstract
1. Motivation, specific objective
Light sources emitting radiation in the UV wavelength range from 200nm to 360nm have many important application including fluorescence measurements in biology, material inspection, disinfection, curing of polymers, lithography and energy efficient visible light generation in e.g. fluorescent tubes. Also light sources commonly used because of their emission of visible light, like e.g. high power halogen lamps or fluorescent lamps, can emit significant amounts of UV-radiation. Development, characterization and assessment of light sources with UV spectral content, especially in the context of photo-biological safety, require accurate spectroradiometric measurements which in turn require stable and well characterized reference sources for calibration of measurement instruments.
Most commonly, deuterium (D2) lamps are used for relative- and/or absolute calibration of spectroradiometers in the UV wavelength range. A significant contribution to the measurement uncertainties of those calibrations is the long term instability (ageing) of the spectral output of deuterium lamps which is significantly higher than the instability of halogen lamps typically used for spectroradiometer calibrations in the visible wavelength range or in photometric applications.
We present an analysis of the ageing behaviour of D2-lamps, identify typical characteristics of the ageing process and suggest simple strategies for monitoring and potentially correcting for the temporal changes in the spectra of deuterium lamps.
2. Methods
NMI traceable measurement data of the change in spectral output over time of a set of deuterium lamps is analysed. The data can be modelled by a simple empirical model including an overall wavelength shift, a linear spectral tilt and a total radiant flux (power) scaling. From the data and the model, linear coefficients for spectral- and power ageing of the studied lamps are deduced.
3. Results
Most of the temporal changes in the spectral output of the studied lamps can be well characterized by two “ageing” coefficients: a linear spectral tilt and a global scaling factor for the total radiant flux describing the respective rate of change per hour of lamp operation. All lamps are found to behave qualitatively very similar in accordance with the model, while values for the ageing coefficients show a significant variation between lamps. It is found that lamp spectra consistently “tilt” around a fixed wavelength point which presents an opportunity to monitor the change in radiant flux by a simple setup consisting of a photodiode and a bandpass filter. The spectral change in the vicinity of the tilt point is close to linear in wavelength.
4. Conclusions
The spectral ageing behaviour of a set of deuterium lamps is analysed. The lamps show consistent qualitative behaviour that can be described by a simple empirical model. Model parameters vary between lamps, but the common model allows to identify generic sets of wavelength suitable for monitoring and potentially correcting for the spectral ageing of deuterium lamps. Monitoring and/or correction of deuterium lamp ageing has the potential to significantly reduce measurement uncertainties and extend calibration intervals in applications of deuterium lamps.
CIE Session 2019 – Abstract Booklet
404

PO105
EXTRAPOLATION OF PHOSPHOR CONVERTED WHITE LED SPECTRA BEYOND THE VISIBLE WAVELENGTH RANGE
T. Schneider1, P. Dekker2, R. Young1, P. Blattner3, T. Poikonen4 1 Instrument Systems GmbH, Munich, GERMANY , 2 VSL, Delft, NETHERLANDS, 3 METAS, Bern,
SWITZERLAND, 4 VTT, Espoo, FINLAND
Abstract
1. Motivation, specific objective
CIE TC2-90 is currently working to propose a reference spectrum for use in photometer calibrations as a complement to standard Illuminant A, based on the white LED spectrum LED-B3 recently published by CIE in CIE015:2018. Sources realizing this new additional reference spectrum will provide an alternative calibration reference to halogen lamps that are becoming less and less available. In addition calibrating photometers with the new LED based reference is expected to reduce spectral mismatch errors in photometric measurements of LED sources as well as most other sources currently used for general lighting purposes.
In order to evaluate effects of photometer UV-/IR-leakage on calibrations with the new reference, the spectrum LED-B3 will have to be extended beyond the wavelength range from 380nm to 780nm over which it is currently defined.
We present physical as well as empirical models for the extrapolation of phosphor converted white LED spectra and apply them to LED-B3 as well as measurement data of white LED products. Good extrapolation models for white LEDs are of interest beyond the scope of CIE TC2-90. They help to understand and compare the behaviour of LED products, allow to identify systematic measurement errors like stray light or bandpass broadening in spectrometric measurements and can improve the results of spectrometric measurements with low dynamic range or low signal-to-noise ratio.
2. Methods
Several physical as well as empirical models and extrapolation strategies for spectra of phosphor converted white LEDs are presented and tested on high quality spectroradiometric measurement data.
3. Results
From the analysis of spectral data and physical models for the photoemission of LEDs we find that the short wavelength behaviour of the LED blue peak is well described by a single exponential decay. At long wavelength the spectral shape of the phosphor peak is more complex requiring more elaborate models.
4. Conclusions
The presented extrapolation models for phosphor converted white LEDs allow to extend the definition of CIE LED-B3 spectrum beyond the visible wavelength range in a way that is consistent with the current definition of LED-B3 as well as the physics of phosphor converted white LEDs. In addition, the models can help to identify systematic measurement errors or anomalous device behaviour in spectroradiometric measurements of white LEDs.
CIE Session 2019 – Abstract Booklet
405
PO106
EVALUATION OF THE INFLUENCE OF AN INTEGRATING SPHERE INTERNAL STRUCTURE ON TOTAL LUMINOUS FLUX MEASUREMENT
Shichi, W.1, Toyota, T1, Suzuki, T1, Ohkubo, K2. 1 Industrial Research Institute of Shizuoka Prefecture, Shizuoka, JAPAN,
2 Otusuka Electronics Co., Ltd., Koka, JAPAN
Abstract
1. Motivation and purpose
The total luminous flux of a light source is used as an objective value to measure the amount of light emitted by a light source and to evaluate its luminous efficiency. A method using an integrating sphere is commonly used to measure the total luminous flux of a light source. In this method, the measured value of the light source being tested is compared with the measured value of a pre-certified, standard light source. When there is a difference between the light distribution of the test light source and the light distribution of the standard light source, the non-uniformity expressed by the spatial response distribution function (SRDF) within the integrating sphere may cause inconsistencies in measurement. In recent years, there have been many different light distributions for illumination sources, but the light distributions of standard light sources have been limited to just 4π and 2π light sources. When measuring the total luminous flux of such illumination sources, the non-uniformity of the SRDF may affect the reliability of the measurement result. For this reason, it is important to identify the SRDF to evaluate the measurement uncertainty. One of the factors of SRDF non-uniformity is the internal structure of the integrating sphere. The SRDF is influenced by the internal structure of the integrating sphere, the reflection of its inner surface and the acceptance angle sensitivity of the light receiver. The purpose of this research is to evaluate the influence of the internal structure, and other factors, of the integrating sphere on the SRDF by comparing experimental results to modeled simulations. In addition, the error of the total luminous flux measurement when the light distribution of the test light source and the standard light source are different is estimated and evaluated from the SRDF.
2. Methods
The SRDF of a 2 m diameter integrating sphere (Optcom: LFM-080N) is measured using an LED spot light source. The spot light source was located at the center of the integrating sphere (4π geometry), illuminating the surface of a wall with a spot circle 120 mm in diameter. The irradiation angle of the spot light source could be changed by 5 degrees in both the horizontal direction and the vertical direction. The integrating sphere was equipped with a baffle for shielding direct light, an auxiliary bulb for measuring self-absorption, and a jig for attaching a measuring light source. The output signal was detected using a spectrometer from a detector port located at the same height as the center of the sphere. Measurement began 1 hour after the spot light was turned on.
Numerical simulation was performed using ray tracing software, Lumicept (Integra). The integrating sphere model has the same shape and internal structure as the integrating sphere on which the experiment was conducted. It was assumed that the diffuse reflectance of the inner wall of the integrating sphere and the internal structure is 95% at all wavelengths, and that it was a Lambertian surface. The spot light source was assumed to be a point light source at the center of the integrating sphere, irradiating the inner wall of the sphere with a spot circle 120 mm in diameter. The irradiation angle of the spotlight was set identical to the experiment. The uncertainty due to the reproducibility of the simulation result was 0.5%.
3. Results
The experimental results from the SRDF of the integrating sphere showed a characteristic inhomogeneity from the baffle and the hemisphere edges that open and close integrating sphere. These non-uniformities were also found in the simulations. In order to estimate the influence of the light distribution in the total luminous flux measurement, the total luminous flux of the conical light source, having a conical light distribution of cone angle alpha, was calculated using the results from the SRDF of both the measurement and the simulation. For a conical light source emitted in the vertical downward direction of the sphere, it was found that the difference in total luminous flux with a
CIE Session 2019 – Abstract Booklet
406

cone angle of 10 to 300 degrees was no greater than 1%. The total luminous flux of the conical light source calculated from the simulation result reproduced the basic tendency of the measurement result, although some parameters, such as coating non-uniformity and angle dependence of the receiver sensitivity, were not taken into account. These results show that the internal structure of the integrating sphere has a very large effect on the SRDF compared to other factors.
4. Conclusions
Our study results suggest that when measuring a test lamp with a narrow light distribution, like a spotlight, by using a standard light source with a wide light distribution like a halogen lamp, the position and shape of the internal structure, especially the baffle, affects the measurement result of the total luminous flux. The simulation result also approximately predicts the measurement result. From these results, we can estimate the uncertainty of this measurement. Furthermore, if it is necessary to reduce the measurement error of the total luminous flux, improvements to the non-uniformity of the SRDF can be considered by changing the shape and position of the baffle by computer simulation.
CIE Session 2019 – Abstract Booklet
407
PO107
REFERENCE RADIOMETER IN A DUAL-PHOTODIODE DESIGN FOR CALIBRATION OF UVA IRRADIANCE METERS
Shin, D.-J., Park, S., Jeong, K., Lee, D.-H. Korea Research Institute of Standards and Science, Deajeon, SOUTH KOREA
Abstract
1. Motivation, specific objective
UVA irradiance meters (UV-meters) measure the spectrally integrated irradiance of UV sources in a finite spectral band with a peak at 365 nm. One of the calibration methods for UV meters recommended by CIE is the comparison against a reference radiometer calibrated at a single spectral line. In this method, a filtered narrow-band mercury line source is often used with a reference radiometer based on a silicon photodiode, whose responsivity at the specified wavelength is calibrated against an absolute radiometer such as a pyroelectric detector with a spectrally-flat responsivity. This method is practical as long as the source is fixed. When the source spectrum changes, the irradiance responsivity of the reference radiometer should be re-calibrated.
In this work, we present a new design of a reference radiometer for the UV meter calibration, which can be used for any source spectrum as long as its range is limited from 330 nm to 450 nm. The new reference radiometer is based on the ratio measurement of two photodiodes separated by a beam splitter. The spectral responsivities of two photodiodes are engineered in such a way that the ratio of the photocurrent signals can be used to determine both the irradiance and the centroid wavelength of the source. We show that, in the specified wavelength range, the new reference radiometer completely replaces the absolute radiometer with a spectrally-flat responsivity. The UV meter calibration can be then realized with various types of UV light sources, including UV-LEDs, without any re-calibration.
2. Methods
The reference radiometer in the new design consists of a precision aperture, a diffuser, a beam splitter, and two silicon photodiodes. The beam splitter installed at an angle of 45 degrees inside the radiometer has the spectral transmittance/reflectance linearly varying with wavelength from 330 nm to 450 nm. The UV radiation incident on the diffuser is clipped by the precision aperture, and each photodiode measures the fractions of the radiation transmitted and reflected from the beam splitter, respectively. The responsivities of the photodiodes with respect to the spectral irradiance at the diffuser are separately calibrated in the unit of A/(Wm2) from 330 nm to 450 nm from three-step measurements: relative spectral responsivity by using a lamp-based detector comparator, absolute power responsivity by using a single-line laser, and aperture size by using a 3-D profiler.
The important condition for the dual-photodiode reference radiometer is that the responsivities of the two photodiodes should be linear with wavelength, but with different slopes to each other. When this condition is fulfilled, we can determine from the photocurrent readings of the two photodiodes not only the spectrally integrated irradiance in the range from 330 nm to 450 nm, but also the centroid wavelength of the input spectrum. The working principle verified by numerical simulation based on the measured spectral responsivity of the reference radiometer.
3. Results
The accuracy of the dual-photodiode reference radiometer is tested by comparing the results with a spectro-radiometer or a pyroelectric detector at different UV sources: a diode laser at a wavelength of 404 nm, a high-pressure Hg lamp filtered at 365 nm and 405 nm with a bandwidth of approximately 15 nm, and also at UV LEDs. We confirmed a good agreement of both irradiance and centroid wavelength measurements for all the cases tested. The dominant uncertainty sources of the reference radiometer is the uncertainty propagated from the spectral responsivity calibration, and the uncertainty due to the deviation from the ideal condition of the linear responsivity. The evaluation of the uncertainty is on-going, but we expect that the new reference radiometer can have the accuracy comparable to the typical pyroelectric absolute radiometer.
CIE Session 2019 – Abstract Booklet
408
4. Conclusions
We developed a reference radiometer consisting of two silicon photodiodes for calibration of UV-meters. The reference radiometer can simultaneously measure both the irradiance and the centroid wavelength for any source whose spectrum distributes within a range from 330 nm to 450 nm. The design and working principle is verified by numerical simulation, and the performance is experimentally tested by comparing the measured results with a spectro-radiometer or a pyroelectric absolute radiometer. For various types of UV source, we confirmed a good agreement. In conclusion, the developed radiometer is a promising candidate to extend the measurement range as well as to improve the accuracy of the UV meter calibration.
CIE Session 2019 – Abstract Booklet
409

PO108
OPTIMIZATION OF BARIUM SULFATE COATING FOR AN INTEGRATING SPHERE BY MEANS OF SPECTROPHOTOMETRIC ANALYSIS
Shitomi, H.1 1 National Metrology Institute of Japan (NMIJ, AIST), Tsukuba, JAPAN
Abstract
1. Introduction
Integrating spheres are widely used for many applications in Photometry and Radiometry. Its feature to spatially integrate the optical radiation within the sphere enables us to easily evaluate the total amount of radiation emitted from a source by means of a sphere photometer or a sphere spectroradiometer, and to obtain spatially uniform radiation used for a radiance or luminance standard. The spatial integration of the radiation attributes to spatial averaging due to multiple reflection of the radiation within the sphere. One of the critical parameters necessary for better spatial integration is having better reflectance uniformity of the sphere wall.
Barium sulfate (BaSO4) coating is most commonly used as the integrating sphere wall. Our past study revealed that, in many cases, commercial integrating spheres with sprayed BaSO4 surface have relatively poor reflectance uniformity, which sometimes causes significant error in the integrating sphere-based measurement. While achieving the BaSO4 surface with uniform reflectance for an integrating sphere needs a kind of skilled task, material parameter plays a major role to determine the final properties of the sphere wall. But major material parameter(s) to contribute reflectance uniformity hasn’t been well clarified. In this study, reflection properties of BaSO4 coating prepared with different material parameters have been evaluated to identify the decisive parameter(s) for reflectance uniformity and find out the best condition used for the sphere coating.
2. Methods
Commercial high-purity (> 99.9%) BaSO4 for chemical analysis was used as base material. As binding material, special-grade polyvinyl alcohol (PVA) whose polymerization degree of about 1700, was used with pure water. BaSO4 and PVA aqueous solution (PVA-aq) were combined to prepare BaSO4 specimens. The BaSO4 specimens were coated on the glass substrate of 50 mm x 50 mm x 1 mm to form test samples. In this study, 4 different PVA-aq concentration condition from 1.0 wt % to 7.0 wt % and 6 different coating thickness condition from 0.5 mm 5.0 mm were applied, and in total 24 types of test samples were prepared. For thick samples more than 3.0 mm were prepared by spatula coating whereas other ones by sprayed painting. Sample preparation was made five times to evaluate the reproducibility of the process. Spectral diffuse reflectance of each sample was measured with calibrated spectrophotometer in the wavelength range from 250 nm to 2500 nm.
3. Results and Discussion
Comparison of the samples with the same thickness reveals that higher PVA-aq concentration decreases the spectral diffuse reflectance in wide wavelength range regardless of PVA-derived optical absorption. That indicates the effect of crack inside the coating layer, which would be a kind of contraction crack generated during the drying process. It is suggested higher PVA-aq concentration causes more contraction. However lower PVA-aq concentration gives less binding power, which would result in fragile coating. Next, when the samples with the same PVA-aq concentration are compared, the spectral diffuse reflectance is increased with its thickness until the thickness is 3.0 mm. In the case that the samples thickness is more than 3.0 mm, thicker sample shows lower reflectance, which also indicates the existence of the crack inside the coating layer. Thicker sample has more crack due to inhomogeneous drying in depth direction. On the other hand, reproducibility of sample preparation in terms of reflectance shows inverse dependence on the thickness of the sample. Except for the samples with the crack effect, thicker samples generally show better reproducibility, which implies better sphere uniformity when this material condition is applied for the sphere coating.
A series of study leads to the conclusion that BaSO4 coating would show its best performance for the integrating sphere wall when the PVA-aq concentration is around 3.0 % with the thickness of around 2.0 mm to 3.0 mm. The detailed data analysis will be discussed at the conference.
CIE Session 2019 – Abstract Booklet
410

PO109
A MEASUREMENT METHOD OF SPATIAL ILLUMINANCE DISTRIBUTION FOR AN OUTDOOR STADIUM MAKING USE OF A QUADCOPTER
Suzuki, H.1, Iwata, M.2, Akizuki, Y.3 1 Kobe University, Kobe, JAPAN, 2 Setsunan University, Neyagawa, JAPAN, 3 University of Toyama,
Toyama, JAPAN
Abstract
1. Motivation
Nowadays, computer simulation system can predict precise illuminance distribution in a space before construction of buildings, facilities or structures. However, sometimes position and angle of lighting equipment in the space may be slightly different from designed position and angle. The slight error causes unexpected dark spot if the room is very large and the dark spot may be significant problem if the space is used for sports like gymnasium or stadium. To avoid such mistake, illuminance distribution in the space including higher space must be examined after construction of the buildings, facilities or structures, though continuous measurement of illuminance in larger space is highly troublesome and measurement in higher space needs special device like high elevation work vehicle. To solve these problems, a method of illuminance measurement making use of quadcopter had been already proposed. As the method was developed for measurement in the building, quadcopter with illuminance meter was flown along with the line under columns of light sources installed on the ceiling to get position information of flying quadcopter. In case of measurement for outdoor stadium, an operator cannot fly quadcopter while referring position of light sources. To enable the measurement in outdoor stadium, flying method must be extended to get position information without column of light sources.
2. Methods
To get position information of a quadcopter, movies taken from digital camera with gimbal structure attached to the quadcopter was used for an analysis. Before the measurement, red circle markers were set at the points of crossing of the grid in the stadium so that the operator could always make sure the relative position of the quadcopter with the image taken by the camera while the operator was flying the quadcopter. After the measurement, a movie taken through a series of measurement was cut into a set of still images. The position information of the quadcopter could be obtained through image processing method with the set of still image. Then, Illuminance values measured by mobile operation with quadcopter were compared with the illuminance values measured by manual operation with hand at the same point. After the comparison process, plural illuminance meters were attached to the quadcopter to measure spatial illuminance distribution.
3. Results
Through the comparison process, it was found that the illuminance values measured by mobile operation with quadcopter could be considered as the value measured by manual operation by hand to some extent. Then, distribution of horizontal illuminance and distributions of vertical illuminance (4 directions) were drawn based on the illuminance values measured by mobile operation with quadcopter. Finally, values of ratio of vertical illuminance to horizontal illuminance were checked whether the values were satisfying the regulation of the ratio for football.
4. Conclusions
A quadcopter manipulation method was proposed for a measurement of illuminance distribution for an outdoor stadium. And based on study of comparison between illuminance values measured by mobile operation with quadcopter and values measured by manual operation by hand, it was concluded that the values by mobile operation can be considered as that by manual operation to some extent. Proposed measurement method enable completion of various illuminance distribution drawings and finding of the area where quality of lighting environment was quite low.
CIE Session 2019 – Abstract Booklet
411

PO110
PHOTOBIOLOGICAL SAFETY OF COMMON OFFICE LIGHT SOURCES
Udovicic, L. and Janßen, M. Federal Institute for Occupational Safety and Health (BAuA), Dortmund, GERMANY
Abstract
1. Motivation, specific objective
Light emitting diodes (LEDs) are increasingly being used for general lighting in offices and play an important role in a growing number of other applications – for instance in electronic devices as computers, laptops, tablets or smartphones. It is sometimes claimed that LEDs would be more dangerous in terms of photochemical damage to the retina (known as the blue light hazard) than conventional light sources.
In order to address these concerns, the paper presents the results of the photobiological safety evaluation of a range of LED, incandescent, halogen and compact fluorescent lamps (CFLs), as well as computer, laptop, tablet and smartphone LED-displays following the requirements of the Lamp Safety Standard IEC/EN 62471 “Photobiological safety of lamps and lamp systems”.
2. Methods
The Standard IEC/EN 62471 describes the measurement methods for the evaluation of photobiological hazards, including the blue light hazard. The standard specifies a risk group classification for lamps in order to indicate their potential photobiological risk. A risk group provides information on the maximum exposure duration based on the emission limit value of the respective group. There is no risk (Exempt Group), if one can be exposed to the optical radiation of a lamp without restriction, a high risk (Risk Group 3), if the emission limit value is already exceeded after a short-term exposure. The emission limit values of the risk groups have been derived from the exposure limit values based on recommendations of the International Commission on Non-Ionizing Radiation Protection (ICNIRP). Exposure limit values, representing maximum exposure levels in order to avoid adverse health effects, are in Europe laid down in the occupational safety and health Directive 2006/25/EC “Artificial Optical Radiation”.
Measurements of the spectral radiance have been performed using a double monochromator DTM 300 (Bentham Instruments) with cooled photomultiplier tube detector (DH-30 TE, Bentham Instruments). The double monochromator has been calibrated with a 50 W halogen spectral radiance standard (SRS8, Bentham Instruments, traceable to a PTB standard). Fields of view of 1.7, 11 or 100 mrad have been realized with a telescope (TEL 301, Bentham Instruments).
According to the Standard IEC/EN 62471, lamps for general lighting should be evaluated at a distance which produces an illuminance of 500 lx, all other sources at a distance of 20 cm. Since the goal of this study was to compare photobiological risk of different light sources, all measurements were carried out at a distance of 20 cm.
3. Results
In terms of blue light hazard, the lamps assessed at a distance of 20 cm reached at worst Risk Group 1 (Low Risk Group, no photobiological hazard under normal behavioural limitations). A comparison of LED lamps and other conventional lamps (incandescent, halogen lamps and CFLs) reveals that the risk levels are comparable. Computer, laptop, tablet and smartphone screens were all assessed to be Exempt Group, as measured radiances were much lower than the level known to cause photobiological retinal damage.
4. Conclusions
In terms of their level of photobiological safety, LED lamps are not different from conventional lamps and can be considered safe under normal or reasonably foreseeable conditions of use. Computer, laptop, tablet and smartphone screens do not pose any photobiological hazard.
CIE Session 2019 – Abstract Booklet
412
PO111
APPLICATION OF THE EFFECTIVE INTENSITY CONVOLUTION METHOD FOR THE CALCULATION OF FLASH DURATION
Williams, A.I.1 1 General Lighthouse Authorities for UK and Ireland, Harwich, UNITED KINGDOM
Abstract
1. Motivation, specific objective
For marine aids-to-navigation, it is necessary to define the duration of the flash in order to ensure that the users are able to correctly identify the aid-to-navigation. In the past, with the use of incandescent lamps, this has been a straightforward process where the half-maximum full-width can be easily determined due to the relatively slow changing nature of the flash.
However, with the advent of modern LED light sources, the ability to pulse width modulate (PWM) the perceived light intensity has caused the definition based on half-maximum full-width of the measured flash to cause false results.
The definition, based on a maximum value during the flash, can also be misleading if the flash contains a high value peak during the initial switch-on. This is normally caused by the use of sub-optimal LED current drivers not regulating fast enough to deal with the initial in-rush of current. The consequence is that the half-maximum full-width is incorrect.
It is therefore necessary to review the definition of duration to reflect the modulation techniques used in modern visual signals.
2. Methods
The natural solution to the issue is to apply a filter to the data that removes the high frequency components such as spikes and PWM artefacts. Then, the question becomes, which filter to use?
The obvious candidate for this purpose is the Modified Allard Method (MAM), as described in the recently published CIE Technical Report 229:2018. MAM, after all, is simply a filter that is meant to represent the response of the human visual system to flashing lights. Normally, only the maximum value of the calculation that is used, which is the effective intensity of a flash of light. However, the convolution method produces a series of values, which represents the level of stimulation in the human visual system to the flashing light. If the maximum value of this series is the effective intensity, then it is reasonable to consider the half-maximum full-width to be the perceived flash duration.
The paper also considers the alternative to MAM described in the CIE Technical Report, the sheared impulse response function, to understand how changing this function can have an impact on the results.
3. Results
The technique was applied to relatively simple flash profiles to determine the difference between the photometric and filtered datasets. The technique is then applied to real photometric data to see the impact on such measurements.
The results show that the significant smoothing of the flash profile caused by applying the technique to photometric data can improve the reliability of defining the flash duration. It also resolves some of the issues relating to asymmetrical flash shapes caused by rotating lighthouse optics or light sources with AC power supply effects superimposed on the light intensity.
4. Conclusions
It is evident from the results that the flash length is dependent on the convolution function employed as a filter. Because the two convolution functions represent a low pass filter with a -3 dB cut-off frequency of approximately 2 Hz, any high frequency components due to PWM or momentary spikes are removed. However, it is also evident that, regardless of the impulse response function used, the flash length of simple flash shapes is usually longer than the simple half-maximum full-width method, which uses the photometric flash data directly.
CIE Session 2019 – Abstract Booklet
413

One should note that the results presented in the paper are entirely theoretical and have not been tested through observation. However, the approach presents a potential opportunity to investigate the effective intensity models from a different perspective that can provide additional evidence for the further development of CIE Technical Report 229:2018.
CIE Session 2019 – Abstract Booklet
414
PO112
THE INFLUENCE OF PARTICULATE MATTER CONCENTRATIONS ON SPECTRAL POWER DISTRIBUTION
Ye, S.1, Xue, P.1,*, Fang W.Y.1, Wei M.C.2, Xie J.C.1 1 Beijing Key Laboratory of Green Built Environment and Energy Efficient Technology, Beijing
University of Technology, Beijing, CHINA 2 Department of Building Services Engineering, The Hong Kong Polytechnic University, Hong Kong,
CHINA
Abstract
1. Motivation
Sunlight is a valuable resource in providing constant energy to our planet. Sunlight has radiometric and photometric characteristic which affects indoor luminous and thermal environment. Atmosphere attenuation happens along with the spreading, and the spectral power distribution (SPD) will also change. Since 2008, air pollution has been a critical issue for China, and particulate matter (PM) concentrations are still stay in a high level recent years. The shortwave light could be easily scattered by the PM, and SPD will change dramatically which decides the CRI, CCT and luminous intensity for the building facade.
Several researchers have studied the relations between PM concentrations and solar radiation. However, few studies focus on the relations between PM concentrations and SPD. In this paper, the indication between PM concentrations and SPD is investigated based on the experiments conducted in Beijing.
2. Methods
2.1 Hypothesis
The SPD is affected by many factors in the atmosphere, and to evaluate the influence of PM on the SPD, some factors should be ignored.
(1) As the effect of clouds on SPD is complicated and smog and fog are hard to be recognized by eyes, only the sunny days is selected.
(2) The selected experimental data is measured on adjacent dates, and the difference in solar altitude is not large.
2.2 Experiment
Two measured position are adopted in this experiment. Measurement in the horizontal direction refers to placing the spectrometer probe perpendicular to the ground, while the vertical direction places the probe facing to sunlight.
The SPD was measured by USB2000+ micro-fiber-spectrometer and the results were recorded in every 0.38 nm wavelength from 380 nm to 780 nm and the accuracy is till two decimal places. The experimental period is from July 11 to September 1 in 2017, and 20 sunny day experimental data was thus selected. The PM2.5 was measured by DUSTTRAKTM II dust meter and the accuracy could reach till three decimal places.
2.3 Programming and statistical analysis
The SPD data is firstly rounded with the wavelength of each 1 nm from 380 nm to 780 nm by R language, and total illuminance and irradiance could be obtained with integration. In this case, the illuminance and irradiance could be assessed with PM concentrations (PM2.5 value) by SPSS.
3. Results
3.1 Comparison of two measurement methods
To evaluate the measurement performance between horizontal and vertical directions, the vertical calculated values which is generated by the horizontal measured value divided by the sine of solar
CIE Session 2019 – Abstract Booklet
415
altitude is compared to vertical measured values. The difference between two values of illuminance is within 3%, while the difference in irradiance is about 8%. The errors seem not large due to the scattering of solar radiation.
3.2 The influence of PM concentrations on irradiance and illuminance
With the little error between two measured methods, both results of irradiance and illuminance are studied with PM concentrations by SPSS. In the result, weak relation is found between the PM concentrations and horizontal measured values, while a negative relations between PM2.5 and vertical measured values are revealed. With the increasing of PM concentrations, the illuminance and irradiance decrease.
3.3 The influence of PM concentrations (PM2.5 value) on SPD
Due to absolute SPDs are different in everyday, the relative percentage of SPD (RSPD) and the relative percentage of spectral illuminous intensity distribution (RSLD) are proposed to represent the relative change of spectral power in each wavelength. Spearman’s rank correlation coefficient in SPSS is analysed the influence of PM2.5 value on RSPD and RSLD.
3.3.1 The influence of PM2.5 value on RSPD
According to SPSS analysis, PM2.5 value has a great influence on several ranges of relative medium and long wavelength, which are respectively 563~577 nm, 603~637 nm, 660~682 nm, 746~780 nm. With the increasing of PM2.5 value, the RSPD increases. In order to study the quantitative relation between PM2.5 value and RSPD, the irradiance with a wavelength of 770 nm (P<0.01) is selected. This relation is confirmed by linear regression (R2>0.9), where the PM2.5 value grows from 0.007 to 0.101 mg/m³ and RSPD changes within 0.177~0.194%.
3.3.2 The influence of PM2.5 value on RSLD
The results show that the PM2.5 value has a great influence on several ranges of wavelength, which are respectively 499~517 nm, 562~572 nm, 607~633 nm, 664~681 nm, 746~780 nm. RSLD has a negative relation with PM2.5 value in the first wavelength range, while it has positive relation in other ranges. Due to the high significance level, a wavelength of 765 nm is selected to study the quantitative effect of PM2.5 value on RSLD. This relation is confirmed by the linear regression (R2>0.9), where the PM2.5 value increases from 0.007 to 0.101 mg/m³ and RSLD results in 0.174~0.192%. On the contrary, a wavelength of 503 nm (P<0.01) is selected for studying negative relation between PM2.5 value and RSLD. This relation is confirmed by the linear regression (R2=0.7), which the PM2.5 value starts from 0.007 to 0.101 mg/m³ and the RSLD decreases from 0.298 to 0.289%.
4. Conclusions
Results show a significant relation between the vertical calculated values and the vertical measured values of both irradiance and illuminance. However, the vertical measurement is validated with stronger relation with PM concentrations by SPSS analysis. From results of irradiance, RSPD has a positive relation with PM 2.5 concentrations in four wavelength ranges. While from results of illuminance, RSLD has a negative relation with PM2.5 concentrations in relative short wavelength and has a positive relation in other wavelength ranges.
The monotonic relation between the SPD and the PM concentrations could provide a reference for the mutual characterization between atmospheric spectrum and particulate matters. Results could offer spectral boundary conditions for the indoor thermal and luminous environment studies in the future.
CIE Session 2019 – Abstract Booklet
416

PO113
EFFECTS OF NON-UNIFORM SPATIAL RESPONSE DISTRIBUTION OF INTEGRATING SPHERE ON THE TOTAL LUMINOUS FLUX MEASUREMENT OF PANEL LIGHT
SOURCE
Yamauchi, Y.1, Tashiro, T.1, Ohkubo, K.2 1 Yamagata University, Yonezawa, JAPAN, 2 Otsuka Electronics Co., Ltd., Koka, JAPAN
Abstract
1. Motivation, specific objective
For total luminous flux measurement of light sources, an integrating sphere (IS) is widely used. Theoretically as the spatial response inside IS should be uniform regardless of the location of the IS, entire illuminance within IS is assumed to be uniform. However, in reality, due to the nonuniform spatial response due to the dusts and some other causes, the Spatial Response Distribution Function (SRDF) of IS is not uniform. The spatial response is less in the southern hemisphere than that in the northern hemisphere. This nonuniformity mediates non-uniform distribution of the illuminance. In case the luminous intensity distribution of test lamp is different from that of luminous flux standard lamp, SRDF of integrating sphere causes errors in the measurement value of total luminous flux of the test lamp. When a light source to be measured has a planar configuration, such as OLED panel, the light source emits light into half hemisphere. As a result, the illuminance distribution inside IS is not uniform. Moreover, reflected light is not uniformly distributed within IS as some portion of the light is absorbed or secondly reflected at the surface of the light source. Thus, it will be serious affected by both the characteristics of the SRDF of IS and the configuration of the measurement such as the position and the directions of the settings.
In this study, we aim to quantitatively estimate the amount of the errors caused by the nonuniformity of SRDF in measurement of a panel light source.
2. Methods
For the simulation of the total luminous flux measurement by the IS, we used hybrid light simulation software using bidirectional Monte Carlo ray tracing method (Lumicept, Integra Inc.).
In order to simplify the nonuniformity of the spatial response distribution functions, we first assumed the reflectance of the northern hemisphere to be higher than that of the southern hemisphere, whose hemisphere had uniform spatial response, i.e., uniform reflectance.
In the simulation, the geometry of IS was set to be similar to the general one whose diameter was 1 m. The northern hemisphere and the southern hemisphere had a reflectance value of 95% and 90%, respectively. We set the luminous distribution of the reference standard lamp to be 2π sr Lambertian. The sizes of the panel source were: 1, 10, 30 cm. In order to verify the direction of the light emitting surface of the light source, we adopted two directions: upwards and downwards direction. In former case, the direct light emitted from the light source first hit the northern hemisphere which had higher reflectance value, while in the latter case, the direct light hit the southern hemisphere with lowere reflectance value.
The calculations were continued until the difference between total luminous flux obtained from two successive rays became smaller than 0.1%. About 3 billion light rays are emitted depending on the conditions.
3. Results and Discussion
When the light source set upwards, i.e. the light emitted upwards towards higher reflectance area, the estimated total luminous flux was higher than that emitted downwards. The differences of the total luminous flux for 10cm panel (10% relative to diameter of IS) and 30cm panel (30%) were 0.7% and 1.0%, respectively. The larger the panel, the larger the difference. This trend arose from the configuration of the light source. However, considering the difference in reflectance value was large (=5%), the calculated difference is rather small. This compensation might be obtained by the light distribution of the standard lamp to be similar to the test light source.
CIE Session 2019 – Abstract Booklet
417

In our preliminary simulation, the difference of the SRDF inside IS was set to be larger than actual use case and also SRDF was assumed in a sort of extreme pattern. However, it is well compensated. We plan to further demonstrate that SRDF should be taken into consideration in obtaining integrating sphere to measure total luminous flux. We will show some empirical data and the results of the more realistic simulation.
CIE Session 2019 – Abstract Booklet
418
PO114
LED FILAMENT STANDARD LAMPS FOR TOTAL LUMINOUS FLUX AND LUMINOUS INTENSITY
Yan, J.Y., Liu, H., Zhao, W.Q., Su, Y., Jiang, L. National Institute of Metrology, CHINA
Abstract
1. Motivation
Incandescent lamps have been used as standard lamps in the field of photometric measurement for many decades. However, it is becoming more and more difficult and expensive to supplement the incandescent standard lamps. Because incandescent lamps are phased out globally due to their low energy efficiency, light emitting dioxides (LEDs) would inevitably dominate the Lighting market. The spectrum of LED is different from that of incandescent lamp. Using incandescent lamp as standard lamp to measure LEDs would produce great uncertainty. To develop LED standard lamp helps to solve this problem. “New Calibration Sources and Illuminants for Photometry, Colorimetry and Radiometry” is listed as one of CIE's top ten strategic plans.
2. Methods
Standard lamps are used to preserve and transfer photometric values. There are two important standard lamps. One is for total luminous flux and the other is for luminous intensity. Among many other types of LED lamps, such as LED bead, LED spot lamp, LED tube, etc. LED filament lamp is very suitable to develop for both standard lamps and easy to substitute for the traditional incandescent standard lamps.
A LED filament is composed of 28 or more LEDs which are fixed in series on the sapphire substrate. Four or more LED filaments with certain arrangement compose a lamp stem which is enclosed with a G95 or G125 glass bulb. The bulb is filled with an inert gas, and the heat of the filament is quickly transferred to the bulb surface by the inert gas. Thus, the thermal equilibrium is soon achieved and it do not require additional heat dissipation and cooling. Unlike the flexible tungsten filament, the LED filament is rigid. So that the LED filament standard lamp are shock resistant. The connector interface is E27 which is fully compatible with incandescent lamps. The correlated colour temperature is 2700 K or 4100 K.
The filaments of the LED filament standard lamp for luminous intensity are parallel to each other and equally spaced in the same plane. The typical parameters are 150 cd, DC 144 mA, 65 V.
Two types of standard LED filament lamp for total luminous flux is developed. Both with a uniform light distribution over 4π steradian. This feature helps to reduce uncertainty caused by the nonuniformity of the integrating sphere coating reflectivity. The typical parameters are: (1) 400 lm, DC 20 mA, 128 V, (2) 800 lm, DC 40 mA, 128 V.
The LED filament standard lamps are carefully tested. The warm-up time, long-term and short-term repeatability are tested in the sphere photometer. The angular intensity distribution is tested on the goniophotometer. The angular characteristic is measured on the optical bench.
3. Results
The warm-up time is about 6 min, while the others LED lamp needs about 30 min. The descent of total luminous flux is 2.0%-6.8%, after continuously ignited for 9700 hours, which is 1/30 of that of the incandescent lamp. The short-term repeatability of luminous flux is 0.10%. The angular intensity distribution of the standard lamp for total luminous flux is nearly omnidirectional.
4. Conclusions
LED filament lamp has well short-term repeatability, a shorter warm-up time, much lower descent of total luminous flux and better shock resistance. We believe future photometry will be based on LED standard lamps. The excellent properties make the LED filament standard lamp could be a good candidate for replacing incandescent standard lamps.
CIE Session 2019 – Abstract Booklet
419
PO115
STUDY OF THE SIZE-OF-SOURCE EFFECT (SSE) ON THE CALIBRATION OF SPECTRAL RADIANCE STANDARDS
Yang, S.L.S., Lam, H.S.B, Chau, Y.C. Standards and Calibration Laboratory, HONG KONG
[email protected] [email protected]
Abstract
1. Motivation, specific objective
The Standards and Calibration Laboratory (SCL) of Hong Kong, China has a spectral radiometric system for the calibration of spectral responsivity of photodetectors, spectral irradiance of standard light sources and spectral radiance of standard light sources in the wavelength range from 300 nm to 1800 nm. To better evaluate the performance and the characteristic of the system, an evaluation of the size of source effect (SSE) of the calibration of spectral radiance standards was carried out recently.
Spectral radiance is the ratio of the amount of electromagnetic radiant flux per unit solid angle to the projected area of the source element at a particular wavelength. The unit of spectral radiance is Wm-2sr-1nm-1 which steradian (sr) is the unit of the solder angle. At the SCL, source-based method is used to calibrate the spectral radiance light sources. The spectral distribution of the optical radiation emitted from the test source is calibrated by comparing with the laboratory reference standards through a high precision double monochromator and a series of detectors.
Size of source effect is an important parameter in precision radiation measurement, it is associated with the variation in measured signal due to the change in the size of source. For input optics, SSE usually comes from homochromatic stray light and scatter from optics. It is important and necessary to evaluate the SSE of the system and to minimize this effect as far as possible. In general two techniques was commonly used to determine the SSE, namely: the direct technique and the indirect technique. For the direct technique, a radiometer is focused on a uniform radiance source whose aperture diameter can be varied, and the SSE can be calculated by measuring the signal with respective to the diameter of the source. For the indirect technique, a radiometer is focused on a uniform source with a small light block that is slightly larger than the target size. The SSE can be calculated by the ratio between the blocked and unblocked signal at various aperture diameters.
At the SCL, the indirect method was used to evaluate and to improve the performance of the spectral radiometric system. Details of the measurement setup and results are presented and discussed in this paper.
2. Methods
For the calibration of spectral radiance light sources, source-based method is used, which is conducted by comparison with the laboratory’s reference radiance standards. A double monochromator is used for the selection of specific monochromatic optical signal from the source. Photomultiplier tube detectors, silicon detectors and InGaAs detectors are used as the detectors for testing in the wavelength range of 300 nm - 400 nm, 400 nm - 950 nm and 950 nm - 1800 nm respectively.
To evaluate SSE, a 12-inch diameter integrating sphere with a 100 mm diameter output port was used as the radiance source. The integrating sphere was illuminated by two 35 W tungsten filament lamps. A blocking ring, which hung a small light block of 10 mm high by 2.5 mm wide at the centre of the output port was used to block the light signal during SSE measurements. The integrating sphere was aligned such that the image of the input slit of the double monochromator was focused on the small light block. A 100 mm diameter variable aperture was placed in front of the integrating sphere for setting different aperture sizes.
3. Results
The SSE was evaluated at several wavelengths between 300 nm to 1800 nm and at the following aperture sizes (in diameter): 25 mm, 29 mm, 35 mm, 38 mm, 45 mm, 48 mm, 50 mm, 60 mm, 70 mm, 80 mm and 90 mm.
CIE Session 2019 – Abstract Booklet
420

From the evaluation results, it was found that the SSE of the measurement system is insignificant when comparing with other uncertainty components (e.g. the standard uncertainty of the reference lamp). The uncertainty contribution due to SSE was estimated as less than 0.1 % for wavelength from 300 nm to 1800 nm. Although it was predicted that more scattered light could be measured when the source diameter increased, measurement results do not show clear relationship between the SSE and the aperture size.
4. Conclusions
The SCL has evaluated the SSE of the spectral radiance measurement system. The SSE contributes to a very small fraction of measurement uncertainty of the system. The measurement results can ensure the system is suitable for calibrating radiance standards with a wide range of output diameters.
CIE Session 2019 – Abstract Booklet
421

PO116
MEASUREMENT AND ANALYSIS ON TABLE LAMPS WITH DIMMING AND TONING FUNCITONS
Xiaobo, Z.1, Yue, Y.1, Xiaohong, S.1 1 Shanghai Alpha Lighting Equipment Testing Ltd., Shanghai 201114, CHINA
Abstract
1. Introduction
With the rapid expansion of LED lighting technology, more and more table lamps for paper task with dimming and toning functions. RGB LEDs can create just about any visual colour and any brightness, but creating the right colour and the right brightness is a major challenge.
2. Methods
We will evaluate the blue light hazard of table lamps in various toning limits according to IEC/TR 62778, because the objects used for desk lamps are often used for teenagers. Similarly, we will assess the light fluctuations of table lamps at various dimming limits, according to IEEE Std 1789, IEC/TR 61547-1 and IEC/TR 63158. Furthermore, Illuminance, illumination uniformity, and discomfort glare will be measured.
3. Results
When the dimming depth is low, the light fluctuation does not meet the standard requirements. On the contrary, there will be discomfort glare.
4. Conclusions
The desk lamp should be dimmed in several steps. Do not steplessly dim the light. If it is lowered,
there will be serious flickering, which will harm the eyes.
CIE Session 2019 – Abstract Booklet
422

PO117
STUDENTS IN GOOD MOOD APPEAR SLOWER AND LESS ACCURATE: A PILOT STUDY INVESTIGATING DYNAMIC LIGHTING IMPACT ON STUDENTS’ PERCEPTION
AND PERFORMANCE
Aries, M.B.C.1, Beute, F.2, Fischl, G.1 1 Jönköping University, Jönköping, SWEDEN, 2 LightGreen Wellbeing, Eindhoven, THE
NETHERLANDS
Abstract
1. Motivation, specific objective
Dynamic daylight provides various stimulations throughout the day, and access to daylight can reduce stress and increase productivity. Not all locations in a building always have access to sufficient daylight and sophisticated electric lighting solutions that can vary in colour temperature and lighting amount can help substitute daylight. Tunable-white lighting is currently one of the biggest trends in commercial lighting. Tunable white LED-lighting fixtures enable adjustment of colour temperature and luminous flux. The output that most tunable systems follow these days is a 'daylight curve' with reduced lighting in the morning and evening and an increased level around noon while colour temperature goes from 'warm' to 'cool' and back to 'warm' again. This daylight course may occur on a day with a clear sky condition, but not on an overcast day. The first question is if, especially in cases where daylight is accessible, the tunable system should substitute the daylight situation rather than mimic it. Secondly, is the influence of dynamic lighting with tunable-white lighting beneficial for user performance and well-being?
The study’s objective was to investigate the effect of two opposite, daily patterns of dynamic light exposure for maintaining or improving students’ comfort and performance.
2. Methods
Second-year students participated in an experiment during a regular course. The pilot study was performed in a mimicked open office space in the school’s lighting laboratory with two dynamic light patterns that changed in illuminance level over a day. The colour temperature was kept constant. Light pattern A started at 8:00 with Ehor= 550 lx at the desk, increased between 8:30 and 11:30 to a maximum desk level of 870 lx, returned to start level between 12:00 and 13:00, and lowered to a minimum level of 240 lx from 13:30 until 15:30. Light pattern B reversed the minimum and maximum desk levels. The participants were 20 healthy second-year students (15 females, 6 males; age
24.60.86 years) who were not informed about the aim of the research and all gave their consent for publication of their data. For the pilot study, commercially available tunable luminaires were used.
On each of the two 8-hour experimental days, the students filled out momentary assessments five times regarding ‘alertness and sleep quality’, ‘comfort and satisfaction’, and ‘visual performance’ as well as performing two cognitive performance tests (3D mental rotation task and visual psychomotor vigilance task). Personal and job/study characteristics were collected once prior to the study including a short practice session for the performance tests. Due to the nested structure of the momentary assessment data, Hierarchical Linear Models (HLM) were employed to analyse the effect of lighting level as well as the timing of the light exposure on wellbeing and performance. Analyses were performed in STATA 13.1.
3. Results and Discussion
In this paper, only results regarding ‘pleasantness’ and ‘psychomotor vigilance’ are discussed for the interaction of light level and time of day. The paper will report the full statistical analysis.
Results suggest positive effects of an increase in light level on pleasantness but only for pattern A (High morning level). Even though there were baseline differences between day 1 and day 2, results showed increased pleasantness scores on day 1. No benefits were found for the afternoon peak in light exposure on day 2. Generally, the pleasantness scores were significantly better on day 1, even when exposed to the Low light level compared to day 2 when exposed to the High light level. This may indicate that a high light level in the morning has beneficial effects that last throughout the day,
CIE Session 2019 – Abstract Booklet
423
whereas a peak in light in the afternoon appears to have little to no benefits on mood and may come too late to exert benefits. The pleasantness difference between day 1 and 2 may be because of the loss of novelty regarding the experiment on the second day.
Besides mood, there were also indications for a performance-enhancing effect during the High-level condition in the morning as participants made fewer errors and were better able to detect the signal on the vigilance task. A steep increase in performance was found for the vigilance task for course A. The test, however, showed baseline differences in performance as well as potential learning effects between the first and second day. There appeared to be an improvement on day 1 between the first and second assessment. This could be due to the peak in light during this second assessment but could also be because they had a steep learning curve after performing the test for the first time. Therefore, for this test, it may be worth considering running a longer test-session before doing the baseline measurements.
Mood and performance combined showed, counter to expectations, that students appeared to be slower and less accurate when they were in a good mood.
4. Conclusions
Positive effects are shown for pleasantness, even though only for a pattern with a high light level in the morning and this effect can last thought-out the day whereas a light boost in the afternoon may come too late to exert benefits on pleasantness or vigilance. For cognitive performance tests, though, a longer practice period may be required to avoid a baseline difference between different test conditions. Despite the difference in start conditions, there are indications for performance-enhancing effects by use of dynamic light conditions, even though students seem to be slower and less accurate when in good mood.
CIE Session 2019 – Abstract Booklet
424

PO118
MUSEUM LIGHTING IN RUSSIA: STATE OF THE ART
Aleksandra Bartseva1, Georgy Boos2, Anatoly Chernyak1, Alena Kuznetsova1, Evgeniy Rozovskiy1
1 Russian lighting research institute (VNISI), Moscow, RUSSIA 2 National Research University "Moscow Power Engineering Institute" (MPEI), Moscow, RUSSIA
Abstract
1. Motivation, specific objective
The report deals with the analysis of the state of museum lighting in the Russian Federation, conducted on the basis of the results of a questionnaire survey and measurements of lighting parameters in 5 major museums in Moscow and St. Petersburg. In Russian Federation there are no relevant regulations and recommendations for museum lighting, that is why such an analysis is necessary.
The Ministry of Culture of the Russian Federation has initiated researches, the ultimate goal of which is to develop standards for museum lighting. The results obtained at the first stage of these researches are presented here.
2. Methods
For the purpose of getting a full picture of the real state of museum lighting in the Russian Federation we had developed and sent by e-mail a questionnaire on various aspects of museum objects lighting. The questionnaire consisted of 13 items, which contained questions directly related to museum exhibits lighting and to documents (standards) that could help museum staff in establishing the lighting. The questionnaire contained the following questions:
General Information about the museum or respondent.
The exhibited objects.
Used light sources.
Electrical lighting illuminance sustained level.
The tone of the background (walls) when exhibiting museum objects.
Background illuminance (as compared to exhibits illuminance).
What methods daylight control and protection from the daylight are used in your museum?
What lighting meters do you use?
What standards and/or recommendations do you use while establishing the lighting in your museum? Evaluate their practical value for your work according to 10-point scale.
Do current requirements for maximum permissible levels of illumination provide adequate perception and preservation of museum objects?
What would you like to change in your museum lighting?
Rate the need for the development of the following regulatory documents for monitoring and ensuring the conditions of museum objects preservation in exhibition spaces and depositories.
Your wishes for museum objects lighting standardization.
The questionnaire was sent to 168 national museums, and 90 of them filled it (54%). In the report we review the main results of the questioning, analyze the obtained data and the problems associated with the state and improvement of lighting in Russian museums and the needs of museums for standards and recommendations for lighting. It should be noted that the main problems of museums are connected, firstly, with daylight, which is impossible to exclude, since most Russian museums are located in historic state-protected buildings and secondly, with the absence of standards for museum objects lighting that are vital first of all for small museums that have no staff competent in lighting.
3. Results
To validate the results of the survey, we conducted studies of lighting and the luminaires usage in five major Russian museums (State Hermitage Museum, State Historical Museum, State Tretyakov Gallery, Alexander Shilov Gallery and St. Nicholas Church in Tolmachy) and the leading Russian restoration organization (The Grabar art conservation center). The measured parameters are listed below:
CIE Session 2019 – Abstract Booklet
425
- illuminance in the halls and on the exhibits; - illuminance flicker index; - luminance distribution and luminance of fragments; - lighting spectrum, correlated colour temperature, colour rendering index; - the level of ultraviolet radiation on the exhibits.
For these measurements we chose halls with different lighting options (only daylighting, only electric lighting and combined electric and daylighting), and the measurements were made at different (night and day) times of the day. The results of the measurements and their analysis are presented.
4. Conclusions
Based on the analysis of the results of the survey and research, a program of further research in the field of standardization of museum lighting in the Russian Federation is outlined, including the development of a terminological standard, a standard for luminaires for museums, and preliminary standards containing lighting requirements and methods for measuring normalized lighting characteristics.
CIE Session 2019 – Abstract Booklet
426

PO119
WINDOW PROPORTION AND DAYLIGHT IN BUILDINGS: THE USE OF GOLDEN SESSION AS A DESIGN AID
Beraldo, J.C.1, Scarazzato, P.S.2 1 Fundação Santo André, Santo André, BRAZIL, 2 Universidade de São Paulo, São Paulo, BRAZIL
Abstract
This research investigated the implications to daylight illuminance levels and distribution in the interior space of building due to application of an architectural proportions system, the golden section (division on extreme and mean ratio), on the window dimensions. Due to the fact that early decisions of building design parameters have great importance to daylighting, this research focused on a simple system that designers could use as a tool at the beginning of the daylighting design process. Add to this, the refinement of the calculation methods and energy analysis of the building as well as the accuracy of its results are directly related to the available input data. However, at the beginning of the design process, when the constructive premises are defined, the input data are neither detailed nor precise. What happens only with the development of constructive details, in the final stages of design. The investigation analysed the values of Daylight Factor of an internal space illuminated by a fixed window area in different situations of arrangements between the height and width proportion of the daylight opening. The results show that there is a range of proportions which produces a balance between illuminance values and interior daylight distributions. The use of the Golden Section, a classical architectural proportion system recognized as a method which brings beauty and harmony to building forms, as a daylighting design aid can help designers in the beginning phases of the architectural and daylighting design process.
CIE Session 2019 – Abstract Booklet
427

PO120
LIGHT SCIENCE IS NOT ONLY SCIENCE OF LIGHTING: THEORETICAL BASES AND APPLICATION AREA
Aizenberg, J.B.1, Budak, V.P.2 1 Lighting Research Institute (VNISI), Moscow, RUSSIA, 2 National research university “MPEI”, Moscow, RUSSIA
1. Introduction
The science of light is currently facing two fundamental and long overdue challenges. First, lighting engineering has long ceased to be only the science of electric lighting. The development of light sources and methods of spatial control of luminous fluxes are continually expanding the field of application of lighting engineering systems. In addition to the visual and non-visual effects of light on humans, the following intensively developing areas of the optical radiation use should be noted:
technological use in agriculture;
physiotherapy effects on the human body and the widest use of light in medicine;
use of the UV part of the optical spectrum in irradiating installations for purifying drinking water, disinfecting room volumes, and deodorizing the air;
problems of solar energy with the conversion of natural light into electric current with its subsequent accumulation and conversion into light;
optical remote sensing of Earth surface and cloud layer;
information transmission using light radiation;
lighting design;
and many other applications.
Such widespread use of lighting systems defines a second challenge: the formulation of the theoretical bases of this science. All the diverse areas of light use are united by a common theoretical basis - the unified physical principles of the optical radiation propagation. It constitutes the essence of the light field in the framework of ray photometric concepts about light.
This paper is devoted to the study of the theoretical foundations and the identification of the application fields of modern lighting engineering.
2. Theory of light field
The introduction of electric lighting into our lives necessitated the development of methods for calculating lighting systems, methods for measuring their characteristics, and determining the norms of lighting to perform an activity. A theoretical model of light was created for this. The theory of Bouguer-Lambert was based on Kepler's ideas about light as a combination of rays, so this model was called ray or photometric. The model was completed by Gershun in the light field theory: he studies the space from the standpoint of transmission of radiant energy within that space.
The development of the theory of the light field coincided with the development of the wave theory of light, and later with the development of quantum electrodynamics. The connection between the theory of a light field, the wave and quantum nature of light remained unclear for a long time and thus was regarded in physics as purely approximate, engineering, applied.
In the works of the late twentieth century, the connection of the light field with the wave theory of light and quantum electrodynamics was revealed and resulted in a hierarchy of three approaches to the nature of light. The highest of them is the quantum theory which explains all currently known light phenomena and is based on the representation of light as an ensemble of photons. This theory is the most abstract and therefore the most difficult to use to interpret real measurements. If the number of photons in the ensemble is huge, the movement can be described as a wave process, which naturally leads to wave optics.
In principle, the wave and ray descriptions are equivalent to each other in the region of wave homogeneity: at each point the ray is perpendicular to the wave. Therefore, knowing the wavefront in space, one can always restore the rays and vice versa. The condition of homogeneity (quasi-uniformity) of the field is a small change in the field on a wavelength scale. However the field is non-
CIE Session 2019 – Abstract Booklet
428
uniform and the ray description is impossible if the wavefront changes dramatically at the wavelength scale (e.g. the diffraction of light on a small hole).
The revealed connection of the three light theories showed that within their limits each model forms a closed approach and does not need any clarification. Moreover, the photometric, ray model is correct in most practical examples, and differences from the model are manifested in very subtle experiments.
3. New determination of light engineering
The light field theory is significantly beyond the scope of lighting technology and serves as a language for describing almost any technological use of light. Therefore, the scale of the lighting science is incomparably more significant than only the questions of lighting. And where are the boundaries of research in the field of lighting engineering, and how do they conditionally separate lighting engineering from optics, laser technology, radio engineering, and astronomy, for example?
The lighting science covers the transfer of only incoherent radiation based on the laws of the light field. And this is the primary and fundamental characteristic of any lighting research, development and their use.
The purpose and content of lighting engineering is to develop the science of light in the framework of radiation, photometric concepts and to apply the results for comfort lighting, as well as for technological purposes, e.g. medicine. Light engineering is a field of science and technology and its subject is development of methods for generation and spatial redistribution of optical radiation, as well as its conversion to other forms of energy and use for various purposes.
4. Conclusions
XXI century is the century of light. The scope of light is continuously expanding. The presence of a single international scientific and technical approach will allow considering the fundamental theoretical and applied problems in all areas of the use of light from a unified scientific position. Essentially the CIE should include further development of the lighting engineering science into its activities plan, primarily to ensure a unified approach of specialists from different countries in our science and the formation of training programs in the field of lighting engineering.
CIE Session 2019 – Abstract Booklet
429

PO121
PREFERENCE AND VISUAL IMPRESSION OF HUMAN FACES LIT IN VARIOUS DIRECTIONS
Chang, J. and Ou, L. National Taiwan University of Science and Technology, Taipei, CHINESE TAIPEI
Abstract
1. Motivation, specific objective
Lighting plays a much greater part in photography or life than most people realize. There is an increasing demand from the industry for understanding how the combination of ambient lighting can affect the human visual perception in terms of preference and visual impression. Lighting not only plays an important role for customer in making decisions on what they like and dislike, but also evokes various feelings such as liveliness, excitement, and naturalness. It is still unclear, however, as to how our preference and impression of a creature or an object, can be affected by types of lighting in terms of incident light angle.
2. Methods
To address the issue, the present study used a head of the Venus de Milo sculpture, with 6 by 6 by 10 inches in size, lit by a computer simulation of a ring light with 4 dimming sections, simulated using a 52-inch display, TOSHIBA 52XV500G. The 4 dimming sections were varied in luminance to generate various types of light directions, in order to produce different effects of light and shadow on the sculpture, each being taken as a test image for a panel of observers to assess using 9 bipolar semantic scales: two-dimensional/three-dimensional, soft/hard, strange/natural, unconfident/confident, unfashionable/fashionable, unclear/clear, lifeless/lively, common/mysterious and dislike/like.
Thirty observers, including 15 males and 15 females, took part in the experiment. They were all university students. Each observer assessed 48 images of the sculpture, 4 by 3 inches in size, presented one by one on a computer display. A uniform grey with L* of 50 was used as the background for each image. The viewing distance was about 20 inches for each observer.
The 48 test images were results of 48 types of lighting, generated from a computer simulation of a ring light with 4 dimming sections, top, bottom, left and right, presented on the 52-inch display in a darkened room. The sculpture was placed in front of the display, with a distance of 12 inches. Each image was taken using a Redmi Note 3 with ISO 200 and a shutter speed of 1/125, positioned at the centre of the simulated ring light. The 48 lighting types were generated by varying the luminance levels of each of the 4 dimming sections. The 4 dimming sections were set to a combination of the following luminance levels, 15.6, 9.12, 4.43, 1.13 and 0.06 cd/m2, using the following 5 lighting strategies:
O lightings where all the 4 dimming sections were of the same luminance,
C lightings where one section was at a lower luminance than the others, the latter all being at 15.6 cd/m2,
S lightings where two adjacent sections were both at 15.6 cd/m2, and the other sections were of the same luminance but at a lower level,
II lightings where two symmetrical sections were both at 15.6 cd/m2, and the other sections were of the same luminance but at a lower level, and
T lightings where only one section was at 15.6 cd/m2, and the others were at 0.06 cd/m2.
During the experiment, each observer was asked to assess the 48 test images using 6-point forced choice categorical judgement scaling method, e.g. “very soft”, “soft”, “slightly soft”, “slightly hard”, “hard”, “very hard”. The 48 images were presented in random order for each observer.
3. Results
For O lightings, the higher the luminance for all the 4 dimming sections was, the more the images tended to feel liked, three-dimensional, soft, common, natural, fashionable, clear, lively and confident.
CIE Session 2019 – Abstract Booklet
430

For C lightings, the observers tended to like the images where the dim section was at the bottom, and disliked images where the dim section was at the top. The larger contrast between the dim section and the other sections, the larger variation in all the scales studied when comparing different light directions. There is little difference in all scale values between images where the dim section was at the right and those at the left.
For S lightings, the observers tended to like the images where one of the dim sections was at the bottom, and disliked images where one of the dim sections was at the top. The larger contrast between the dim section and the other sections, the more mysterious the images tended to feel. There is little difference in all scale values between images where the dim section was at the right and those at the left.
For II lightings, the position of dim sections had little impact on the observer responses, but the luminance contrast between the dim sections and the bright sections played an important role. The larger the contrast was between the dim sections and the bright sections, the less the images were liked, and the more mysterious, more unnatural and less confident the images tended to feel.
Images of T lightings tended to be disliked and have negative impressions.
4. Conclusions
Experimental results show strong connection between light directions and visual impressions. Results for C and S lightings indicate that the observers tended to have positive impressions for sculpture images with the light coming from the top rather than from the bottom. Experimental results also show strong connection between luminance contrast in the simulated ring light and visual impressions. Results for C and II images indicate that the observers tended to have positive impressions for sculpture images generated by the simulated ring light with a small luminance contrast rather than a large contrast.
CIE Session 2019 – Abstract Booklet
431

PO122
EFFECTS OF LIGHTING ON VISUAL IMPRESSIONS OF A MEETING ROOM IN VIRTUAL REALITY
Chung, Y., Ou, L. National Taiwan University of Science and Technology, Taipei, CHINESE TAIPEI
Abstract
1. Motivation
With increasing popularity of virtual reality (VR) technology, there is a strong demand for how this technology can be applied to interior design area as a communication tool between designer and customer. Lighting as an environmental and architectural element can influence the viewer’s perception, emotion and even behaviour. Little is known, however, of the impact of lighting on a VR space, in particular the difference between direct lighting and indirect lighting in their contribution to visual impressions of a VR space. As an initial attempt in this new area, the present study took meeting room as an example to investigate how lighting can affect visual impressions of a VR space.
2. Methods
To achieve this aim, a psychophysical experiment was conducted using a Miniso Simple 3D VR Glasses headset. A Huawei P20 smartphone, with a 5.8-inch screen and a resolution of 2240x1080 pixels, was used to present the VR images. The 3DS MAX software was used to create a meeting room, 5.70m (width) by 3.70m (depth) by 2.85m (height) in size, where a meeting table, with 3.55m (width) by 1.40m (depth) by 0.75m (height) in size, was placed at the middle of the room. This study adopted 10 lighting designs for the room, as described below:
AH design – high intensity of direct lighting was created by a 1.40m by 0.70m pendant hollow LED panel; indirect lighting was provided by light cast upward to the central area of ceiling from LED strips hidden on a false ceiling installed around the ceiling lines. The measured luminance values from the VR image were 6.97cd/m2 for the main wall and 33.83cd/m2 for the table.
AL design – same as AH except the pendant LED panel provided low, instead of high, intensity of direct lighting. The measured luminance values were 2.03cd/m2 for the main wall and 8.75cd/m2 for the table.
BH design - same as AH except there was additional indirect lighting created by light cast upward to the ceiling at the ceiling line areas from another set of LED strips installed near the ceiling lines. The luminance values were 8.47cd/m2 for the main wall and 34.01cd/m2 for the table.
BL design – same as BH except the pendant LED panel provided low intensity of direct lighting. The luminance values were 3.22cd/m2 for the main wall and 8.80cd/m2 for the table.
CH1 design – same as BH except the indirect lighting was created by light cast downward, instead of upward, from the LED strips. The luminance values were 14.48cd/m2 for the main wall and 34.74cd/m2 for the table.
CL1 design – same as CH1 except the pendant LED panel provided low intensity of direct lighting. The luminance values were 8.29cd/m2 for the main wall and 9.49cd/m2 for the table.
CH2 design – same as CH1 except the indirect lighting created by the LED strips was less bright for CH2 than for CH1. The luminance values were 6.44cd/m2 for the main wall and 33.07cd/m2 for the table.
CL2 design – same as CH2 except the pendant LED panel provided low intensity of direct lighting. The luminance values were 1.71cd/m2 for the main wall and 8.25cd/m2 for the table.
DH design – same as AH except the indirect lighting was created by LED strips that cast light upward to the ceiling at the ceiling line areas, instead of the central area. The luminance values were 7.49cd/m2 for the main wall and 32.79cd/m2 for the table.
DL design – same as DH except the pendant LED panel provided low intensity of direct lighting. The luminance values were 2.27cd/m2 for the main wall and 7.90cd/m2 for the table.
CIE Session 2019 – Abstract Booklet
432
These 10 designs were selected for this study to cover the most commonly used lighting solutions for a meeting room nowadays. During the experiment, each of the designs were evaluated in VR using 7 semantic scales, like/dislike, relaxing/nervous, exciting/dull, intense/soft, spacious/tiny, safe/unsafe and bright/dark. For each observer, the 10 designs were presented in random order and were all presented twice. The observer responses were recorded and analysed using the categorical judgement scaling method.
A panel of 30 observers, including 15 males and 15 females, all university students with normal colour vision, participated in the study.
3. Result
Experimental data show good repeatability for all but the relaxing/nervous scale, with correlation coefficients for each scale between visual responses given for the first time and those for the second time, all greater than 0.85. Bright/dark shows the highest correlation coefficient (R=0.98), whereas relaxing/nervous shows the lowest (R=0.06). It is thus reasonable to remove visual data of relaxing/ nervous from further analysis due to its poor repeatability.
To compare the impacts of direct lighting and indirect lighting on the observer responses, the visual data were tested using ANOVA. The test results show that visual responses for the 6 scales are all significantly affected by direct lighting, with p values all below 0.001, whereas indirect lighting shows significant impact only on bright/dark (p<0.001), exciting/dull (p=0.002) and like/dislike (p=0.031). The results suggest that direct lighting had a greater influence than indirect lighting on some visual impressions of the room.
The visual responses were also compared with luminance values measured on the main wall and on the meeting table. As a result, high correlation was found between luminance on the table and responses for each scale, with a mean correlation coefficient of 0.83. High correlation was also found between luminance on the wall and the responses, with a mean correlation coefficient of 0.76.
4. Conclusions
A psychophysical experiment was conducted in a VR space, taking the meeting room as an example, to investigate the relationship between lighting design and visual impression of the room. The experimental results indicate that direct lighting has a greater impact than indirect lighting on some visual impressions of the room, and that the luminance measured on the meeting table has high correlation with the visual impressions.
CIE Session 2019 – Abstract Booklet
433
PO123
ENDURANCE TEST ON PHOTOMETRIC PERFORMANCE FOR FIRST GENERATION LED LUMINAIRES
Deroisy, B.1, Vanwelde, V.1, D’Herdt, P1. 1 Belgian Building Research Institute, Brussels, BELGIUM
Abstract
1. Motivation, specific objective
Manufacturers of LED luminaires promise very long lifetimes for their products. This is a main advantage compared to traditional light sources. Long operational lifetimes are particularly interesting for reducing maintenance efforts as well as for the ecological and economical relevance of this technology. However, LED sources typically show a gradual depreciation of their characteristic photometric performances.
The main objective of our study is to identify the light output over a long running time for luminaires in realistic conditions. Furthermore, the current standardized lifetime definition takes only the reduction of light flux into account. Nevertheless, other performances issues such as colour shift and variation of the input power should also be considered. Just as light flux decrease, these characteristics are essential for determining the operational service time of a product.
This paper addresses the results of a test on photometric performances and electrical factors for a selection of luminaires of various types and price categories.
2. Methods
The luminaires in this study are typical square luminaires (60 x 60 cm) intended to be placed in a recessed ceiling in offices. The luminaires have been selected based on an extensive survey realised in 2014 (first generation LED luminaires). The aim was to identify the available range of products and to select a variety of high, medium and lower performing products according to different criteria as declared by the manufacturer. Some luminaires were pretested for acceptability on visual comfort parameters during a retrofit operation. In total 18 luminaires of 9 different types are tested. For some luminaire types, we have several specimens, in order to explore the variability of performances within a product delivery.
The experimental conditions that were chosen are not intended to match a normalised accelerated endurance test. Standards often prescribe operating cycles in terms of temperature and switching. For these tests, the luminaires are installed in a hygrothermal-monitored room and are kept switched on continuously. The registered temperature in the room is always at 20°C +/- 5°C.
After an initial performance, tests the subsequent measurements are done at intervals between 2000 and 5000 hours. At each given time interval, we measured following characteristics:
Light flux.
Spectrum (ranging from 380 to 780 nm with a bandwidth of 10 nm)
Current, tension and input power
The initial measurements were done 100 hours after switching on the luminaire so that the reference value refers to the light output of the LED luminaire when it is fully warmed up. Initial performance of the luminaire was normalised to 100% and the loss of light flux is set out in relative terms to that initial performance.
The measurement equipment that is used to collect illuminance and spectral data, has a very good spectral match. This is particularly important for reliable readings of a typical LED spectrum. Based on the measured spectrum, colour temperature (Tcp) and chromaticity coordinates u’ and v’ can be calculated.
CIE Session 2019 – Abstract Booklet
434
3. Results
After 26.000 hours, following observations can be made about lumen maintenance. First, we noticed that none of the tested LED products suddenly failed. Secondly, with the exception of two product types, the lumen maintenance of all luminaires is equivalent or better than what is announced by the manufacturer (considering a linear depreciation path). The luminaires of one particular type have an atypical curve that quickly drops to 85% of initial light output after less than 3.000 hours and shows a more stable evolution afterwards. Finally, luminaire types for which the manufacturer announces lumen maintenance factors of 90% at 50.000h or higher, are strikingly stable. They still have a lumen maintenance that is above 100%. We could not identify if the luminaires have a lumen compensation functionality integrated in the drivers, however the measured voltage and current is very stable for all luminaires.
The colour shift is the deviation of chromaticity of the emitted light after several burning hours, compared to the characteristics of the initial spectrum. The measurements indicate that all luminaires have a typical spectral curve with a significant peak in blue wavelengths. In order to evaluate the colour shift we use the CIE (u',v') chromaticity diagram as it represents the most uniform colour space. Following the technical note CIE TN 001:2014 concentric u'v' circles are used to approximate the MacAdam ellipses. All luminaires tested reveal a consistent colour shift pattern between specimens of the same type. The colour deviation is mostly shifting towards colder colour temperatures and has a nearly linear progress. One luminaire type however shows a special colour shift. First, the deviation is in one direction up to the measurement at 10.000 hours and then the colour shift appears to be moving quickly in another direction in the u’v’ chromaticity diagram. This suggest that various ageing mechanisms occur and that one can overrule another over time. Only 4 out of 9 types of luminaires limit colour shift below 3-steps u'v' circles after 26.000 hours. The maximal deviation of chromaticity coordinates observed is close to a 9-step u’v’ circle.
4. Conclusions
Regarding the lumen maintenance, most products tested fulfil their promises, but an important variability has been noticed. Just 2 out of 9 types of luminaires do not meet the expected lumen decrease limits, but also 2 types clearly outperform positively. The products where the light flux reduced faster than declared both have a relatively low lumen maintenance factor of 70%, at different time intervals. Furthermore, they show a bigger dispersion of results between same type of luminaires. We can also conclude that the reduction in efficiency is similar to the light flux losses because the input power stays constant.
The colour shift appears more problematic. For less than half of the luminaires tested, the colour shift is limited to levels that are not noticeable by most observers. Besides this, there seems to be a clear correlation between lumen maintenance and colour shift.
CIE Session 2019 – Abstract Booklet
435

PO124
AN ANALYSIS OF LED DRIVER PERFORMANCE USING TRIAC AND DC LINK DIMMING
Erdem Atılgan, L.1, Bayram Kara, D.1, Üstün, Ö.1 1 Istanbul Technical University, Electrical Engineering Department, Istanbul, TURKEY
Abstract
1. Motivation, specific objective
The most common dimming control for medium power LED systems is triac chopping. Through this type of control, a potentiometer positioned on the switch at the input side provides phase control and establishing dimming. The biggest problem with triac dimming is that the input voltage and current waveforms are significantly distorted due to chopping and thus the resulting system has high total harmonic distortion (THD) values along with low driver efficiencies. Especially in high dimming levels, input voltage and current waveforms turn almost into alternating impulse waveforms. This situation results in THD values exceeding 100 %. The Electromagnetic Compatibility (EMC) standard EN 61000-3-2-2014 defines the limits of THD for lighting equipment above 25 W. Medium and high power LED drivers must adhere to these limits, making it difficult to use triac dimmers as these dimming systems distort the grid energy quality in important amounts. However, the standard does not specify a limit for systems below 25 W, making triac dimmers appealing for dimming low power LED systems even though the resulting THD, efficiency and power factor (PF) values are unsatisfactory. This study aims at evaluating the dimming properties of an LED driver which is below 25 W, therefore not limited by the EMC standard, when dimming is separately performed through triac and primary side control, to emphasize the negative effects of triac dimming on the aforementioned properties.
2. Methods
For the study, an experimental procedure was carried out using a 12 W flyback dimmable driver with a 12 W LED luminaire and a triac switch. The rated values of the driver are 220-240 V input voltage, 50/60 Hz frequency, 0.2 A input current, 280 mA output current, 36-44 V output voltage, 10-12 W output power and a PF above 0.95. The driver was initially dimmed using the triac dimmer switch. The experiment was then repeated using primary side DC link control. Assuming a linear relationship between drive current and luminous output, the output current was reduced in steps, starting from 100 % down to 4 %. To analyse the dimming performance, input voltage, input current, input power, PF, grid frequency, driver efficiency, output voltage, output current, output power, THD, current ripple, flicker index, percentage flicker, flicker frequency and stroboscopic effect visibility measure (SVM) values were measured for both cases and input, output voltage and current waveforms were recorded.
3. Results
For the dimming performance using the triac switch, full load driver efficiency, THD and PF values were measured as 76.9 %, 34.8 % and 0.896, respectively. In the full load operation, the current ripple was recorded as 0.5 %. In the final step of measurements, when the system is at a 4 % dimming level, the driver efficiency, THD and PF became 27.2 %, 324.6 % and 0.154, values which pose an important threat to energy efficiency and power system quality. Despite these results, the current ripple remained at 0.5 % at the last step of dimming for this type of control.
For the dimming performance using primary side DC link control, the full load driver efficiency, THD and PF were measured as 79.2 %, 25.9 % and 0.915, respectively. These values are insignificantly higher compared to triac dimming due to circuitry differences in the two topologies. In the full load operation, the current ripple was similarly recorded as 0.5 %. In the final step of measurements, when the system is at a 4 % dimming level, the total current harmonic distortion and PF became 50.7 %, 27.6 % and 0.939, current ripple stayed at the same value of 0.5 %. As can be seen from the results, the efficiency of the driver has decreased with primary side control as well, but not as dramatically as the triac switch and the remaining parameters of THD and PF have stayed the same, even with incremental raises to the benefit of the system.
For flicker measurements, as the dimming percentage increased, the flicker index decreased from 0.04 to 0.02 consistently with triac dimming. With DC link control however, the flicker index started out as 0.04 at full load, increased up to 0.06 at 50 % dimming and fell back to 0.03 at 4 % dimming. While
CIE Session 2019 – Abstract Booklet
436

these values are not significant, the SVM value raised up to 0.73 at 50 % dimming for the DC link control, while the value decreased from 0.45 to 0.24 once again consistently for triac switching. Overall, the SVM value has remained below 1, making the stroboscopic effect “not visible” in all dimming levels for both systems.
4. Conclusions
The results show that neither triac dimming nor input DC link control dimming have a significant effect on the regulation of the driver circuit output, ie. current waveform, current ripple and flicker. This is prominently due to the size of the output capacitor in the circuitry. However, input values such as PF, THD and driver efficiency show very important differences in these two different dimming topologies. Triac dimming switches are among the most popular and economic ways of dimming and they are commonly used in dimming low power LED lighting systems, especially due to the fact that the European EMC standard does not bring any limitations to THD values below 25 W of consumed power. It should be noted here that while a single low power driver controlled by triac dimming may not be an important threat to the power system individually, when a substantial number of these drivers are employed simultaneously, the amount of distress placed on the grid will be at concerning levels. The measurements show that triac dimming results in dramatic changes in PF, THD and driver efficiency values. As these attributes are important influencers of energy efficiency and grid quality, better design alternatives should also be developed for low power LED drivers, regardless of the lack of EMC limitations.
CIE Session 2019 – Abstract Booklet
437

PO125
AN INVESTIGATION OF A19 LED RETROFIT LAMPS IN THE TURKISH MARKET
Köseoğlu, C.1, Erdem Atılgan, L.1 1 Istanbul Technical University, Electrical Engineering Department, Istanbul, TURKEY
Abstract
1. Motivation, specific objective
The Turkish LED market receives from a significant number of different brands, providing the end user with similar retrofit A19 lamps easily purchasable from different shopping channels. Turkey, as a member of the Customs Union as well as a candidate for the European Union (EU) membership adopts EU Regulations, obligating the CE mark for the import and sale of LED retrofit lamps in the Turkish market. The Turkish Standards Institute makes detailed inspections of the conformity of LED lamps entering the Turkish customs, however, the inspections are on a sample of the products provided by the importing company and may not be representative of the entire population. The after-market monitoring system then removes the unsatisfactory products from the market if and when there are customer complaints. Within this context, this study aims at evaluating off the shelf A19 LED retrofit lamps in the Turkish market as of November 2018 through photometric, electrical and thermal measurements. In order to do this, 36 different A19 type E27 base LED retrofits have been selected. In selecting the retrofits, the major approach has been to choose retrofits which are readily available at easy access purchase channels, and that are below a purchase price of 20 Turkish Liras. The main objective of the study is to evaluate the properties of LED retrofits which consumers frequently buy and utilize in their interior lighting environments.
2. Methods
As the first step of the study, 36 LED retrofits which can easily be obtained from Turkish supermarkets, hardware stores and online shops have been purchased. All retrofits are non-dimmable frosted A19 lamps with E27 lamp bases. The maximum purchase price has been chosen as 20 Turkish Liras. Using the values given on the lamp packages if and when available, luminous flux, power, current, voltage, frequency, power factor, lifetime, number of switching cycles, energy efficiency class, correlated colour temperature (CCT), colour rendering index (CRI), minimum operating temperature, maximum operating temperature, mercury content, relative humidity, lamp size and the light angle values have been tabulated.
In order to investigate the actual properties of the lamps and make a comparison based on their rated values as well as evaluating the properties which are not available to the end user, measurements have been carried out. For this purpose, the lamps have been stabilized according to IES LM 79-08 and the luminous flux, power, CCT, CRI, fidelity and gamut indexes according to IES TM 30-15, current, voltage, power factor, percentage flicker, flicker index, stroboscopic effect visibility measure (SVM), driver frequency and maximum case temperature values have been measured. Using the measured values, efficacy, energy efficiency index according to the European Union (EU) regulation 874/2012 and the relevant energy class values have been calculated.
3. Results
According to the rated values given on the retrofit packages, the luminous flux values of the lamps range from 385 lm to 1055 lumens while rated power values range between 5.8 and 11 Watts, resulting in an efficacy range between 55 and 106 lm/W. Most retrofits claim to be in the A+ energy efficiency class, with a few claiming to be in the A++ class. The majority of the lamps have been made in China, along with 3 lamps made in Turkey, Egypt and Germany.
Using the results obtained from the measurements, a comparison has been made to the rated values of the retrofits. For the values obtained solely from the measurements, the validity of the measurement results has been evaluated according to the relevant standards and directives. The results show that in terms of luminous flux and power, while most retrofits adhere to the rated package values, some show great differences reaching 40 % in luminous flux and 48 % in power values. The calculated efficacy values according to the measurements are between 56 and 113.5 lm/W, the majority of the retrofits having efficacy values above 80 lm/W. Overall, lamps falling short of or exceeding the rated
CIE Session 2019 – Abstract Booklet
438

luminous flux values and/or the rated power values result in major changes in expected efficacy values. In terms of power factor, the measurements show that a number of lamps do not even meet the power factor values specified in the Commission Regulation (EU) No. 1194/2012 and should not be in the market at all. Several lamps fall short of the colour rendering index defined by the same regulation as well. In addition to these, problems in rated CCT and claimed energy efficiency classes have also been detected. Flicker measurements have resulted in high percentage flicker and SVM values for an important number of retrofits. The thermal measurements of the outer case of the retrofits have also resulted in quite high values, the highest reaching 98.6 ºC.
4. Conclusions
36 different A19 LED retrofits were evaluated in the scope of this study, through measurements regarding photometric, electrical and thermal properties. The results show that the majority of the lamps adhere to the rated values given on their packages. However, major differences have been spotted for several lamps especially in terms of luminous flux, power, expected efficacy, CRI and CCT values, which are very important attributes for lighting quality. In terms of electrical properties, power factor appears to be a significant problem. As most of the problems designated in the study are beyond the average customer’s depth, this indicates that steps should be taken to ameliorate the after-market monitoring for LED retrofit lamps.
CIE Session 2019 – Abstract Booklet
439

PO126
STUDY ON THE TRESPASS THRESHOLD OF STATIC LIGHT SOURCES ON INDOOR ACTIVITIES OF RESIDENTIAL BUILDINGS
Fan, Q.1, Zhang, M.Y.2, Song, J.Q.3, Yu, J.4 1 Tianjin University, Tianjin, CHINA, 2 Tianjin University, Tianjin, CHINA, 3 Tianjin University, Tianjin,
CHINA
Abstract
1. Motivation, specific objective
With the development of nightscape lighting construction, the problem of nighttime light pollution in residential buildings in China's cities and surrounding urban areas has gradually increased, and residents' nighttime life has been increasingly affected by lighting trespass. Especially the lighting trespass caused by static light source for function, signage, etc., has wide distribution, high brightness and long duration. Research shows that it is one of the interference factors affecting residents' indoor activities. The foundation for the prevention and control of static light trespass is laid. (static light trespass mainly refers to the non-essential lighting of the residential building subjected to non-dynamic, flashing static light into the room, or the presence of a high-intensity static light source within the window of the residential building, affecting the occupants and making them feel Discomfort or reduce vision.).
2. Methods
Through the on-the-spot investigation and parameter measurement of 36 residential areas which are under the influence of static light trespass from four cities of Beijing, Wuhan, Zhengzhou, Shanghai, we got a total of 171 set of static light trespass photometric parameters.
Based on this survey data and the subjective feelings of residents, the subjective evaluation experiment of static light trespass in laboratory environment was designed. The questionnaire was designed by Likert scale method. Thought the subjective evaluation experiment (it divided into pre-evaluation experiments and large-scale subjective evaluations), the trespass factors such as luminance, colour temperature and trespass area ratio (trespass source and window projected area on the retina of the human eye are compared to Sl/Sw) of the residential building window trespass lighting were analyzed.
3. Results
According to the statistical results of the subjective evaluation experiment, combined with the threshold operation definition, studied the brightness threshold of static light intrusion, and calculated the static light trespass threshold in the indoor light environment with the average illumination of 280.17lx and colour temperature of about 5000K. Including the trespass threshold of the trespass area full window, quarter window, 1/16 window, 1/64 window trespass threshold, and the trespass threshold when the light source is invisible.
According to the luminance threshold, the power function equation of luminance threshold and trespass area ratio (Sl/Sw) is obtained by curve fitting. The trespass luminance threshold is calculated, and the relationship between the light intrusion threshold and the area is characterized, which provides support for quantitative prevention and control of lighting trespass. This threshold is concerned with the subjective perception of lighting trespass by residents' indoor activities at night, and provides a quantitative reference value for determining the degree of trespass of outdoor light.
4. Conclusions
1) The colour temperature has little effect on the brightness threshold. In the case of full window trespass, the difference in luminance thresholds of different colour temperatures is small, and as the trespass area ratio(Sl/Sw) decreases, the difference in light colour is less noticeable.
2) The trespass area ratio(Sl/Sw) is strongly correlated with the degree of trespass and has a greater impact on the brightness threshold. The area ratio is inversely proportional to the luminance thresholds, and the larger the area ratio, the smaller the luminance threshold. When the area is relatively large, the change trend of the luminance threshold is slow, and when the trespass area
CIE Session 2019 – Abstract Booklet
440

ratio "Sl/Sw"is relatively small, the change trend of the luminance threshold is sharp. When the area is relatively large, the change trend of the luminance threshold is slow, and the area is small, and the luminance threshold changes sharply.
The power function equation of the luminance threshold and the area ratio is in accordance with the power function curve.
CIE Session 2019 – Abstract Booklet
441

PO127
DAYLIGHT WITHIN A ROOM IN THE EYES OF ARCHITECTURE STUDENTS
Natalia Sokol1, Federica Giuliani2 1 Gdansk University of Technology, Gdansk, POLAND, 2 University Niccolò Cusano, Rome, ITALY
Abstract
1. Motivation, specific objective
Lighting researchers focus on producing comprehensive daylight indicators, which describe temporal, spatial and spectral characteristics of daylight through image forming and non-image forming effects on building occupants. While future architects put their efforts into learning how to create spaces enhancing the quality of life. Therefore, for the designers the understanding of daylight semantics within built environment is crucial.
The motivation behind this study is to indicate possible challenges in apprehension and description of daylight dynamics in the enclosed space. The research involved 150 postgraduate architecture students. The project addresses the gaps in daylight education for future architects in Poland, which had been identified during the international survey on daylight knowledge and education for professionals.
The specific objective is to share the results of the daylight appraisal tasks undertaken by the students.
2. Methods
The research methods are based on two daylight appraisal tasks. During the first task, the students were asked to assess daylight conditions in their private dwellings and proposed design changes, if necessary. The aim was to evaluate their abilities to observe and describe daylight characteristics using tools which they were familiar with. This exercise focused on comparing daylight simulations results produced by students with their user experiences. During the second task, the students were engaged in an analysis of daylight conditions within a public building project, which was design by them. The students answered inquiries on how daylight appraisals findings affect their design decisions. The other questions focused on how the existing daylight recommendations influenced the design of the building. All project participants received 5 hours of a daylight introductory. None of the contributors had been familiar with daylight appraisal and simulations.
3. Results
During the private dwellings, day-lit appraisal the simulations of sunlight penetration within a space resonated well with the users' experience. In a case of the public building design task the understanding of daylight factor, luminance or illuminance simulation results was limited. In ¾ cases, the building’s design followed aesthetics more than daylight analysis conclusions. When students were asked for design solutions to tackle the observed issues like low DF values or possible overheating, glare, or veiling reflections - 90% of responses indicated only the use of internal shading. The results obtained from the design exercises demonstrated limited knowledge of modern daylight technologies and a low practical comprehension of day-lit environment characteristics.
4. Conclusions
The daylight appraisal tasks confirmed gaps and deficiencies in daylight education for architecture students, especially in a context of interpretation of the selected daylight parameters results. The majority of responders were not able to transfer the results of daylight analysis into the design solutions. The students demonstrated great interest in daylight assessment tools however expressed their confusion about a vast number of daylight indicators and appraisal tools available.
The reached conclusions suggest that the architecture students faced difficulties while identifying daylight dynamics within the specific spaces.
The study results also imply an introduction of the mandatory daylight design training for future architects.
CIE Session 2019 – Abstract Booklet
442
PO128
PREFERRED COLOUR TEMPERATURES OF AMBIENT LIGHT AT DIFFERENT LIGHT LEVELS AND SETTINGS
Goven, T.1, Laike, T.2 1 Svenska Ljusfakta, Stockholm, SWEDEN, 2 Lund University, Lund, SWEDEN
Abstract
1. Motivation, specific objective
LED is the most common light sources of today. It gives opportunities for an increased colour rendering and possibilities to vary the colour temperature in order to mimic daylight usually within a range of 2700 K to 6500 K. Ambient light is taken more into account in today’s lighting design since the ambient light has an impact on human well-being. We must therefore examine the preferences for the ambient light e.g. the room brightness at different light levels and ratios between task area and the surrounding areas of the room.
This study investigated preferred colour temperatures within an ordinary workplace area using various light levels and different ratios between task area and the ambient light in a laboratory environment. Furthermore we also compared different age groups and gender in order to examine if there were any such differences.
The early work by Kruithof has been disputed within the scientific community but has been a commonly used guidance in lighting design. Researchers have questioned the fact that looking only at the colour temperature is not enough. The room brightness room must also be taken into account. It has been found that warm light is preferred independently of the illuminance level. Other studies with different light sources have shown that people seem to prefer higher colour temperatures The present study, however, focus on the illuminance/luminance ratio between the task area and the room brightness using only LED lighting.
The general aim of the study was to investigate the preferred colour temperature at different lighting levels both horizontal at the task area and also at major room surfaces in a laboratory environment simulating a single office workplace. Another aim was to look for differences between different age groups and gender.
2. Methods
In total 47 subjects (27 women 19 men) participated in the study with a mean age of 43 yrs. The subjects were asked to select their preferred colour temperature for the different settings between 2700, 3000, 3500, 4000 and 6500 K at different light levels in a range between 50 and 1000 lux (in total 7 levels). Three different illuminance/luminance ratios between task area and the ambient light were also investigated (1:1, 2:1 and 5:1). All subjects started with the ratio 2:1. In total 21 different pre-set light scenes were used in the study. For all pre-set light scenes subjects were able to select the most preferable CCT between the five different colour temperatures. In total 105 light scenes were used in the study.
The study was conducted in a windowless room 6x4 m with a height of 3 m. The walls were painted in a bright grey scale with a reflectance of 82% and ceiling was white with a total reflectance of 84%. The luminaires were placed so no glare sources were seen within the normal visual field. The lighting conditions were measured concerning illuminance/luminance values, reflectance, CCT and CRI before and after the experiment. The deviation from all set values before and after the study was very small. Furthermore the SPD was also measured for all LED light sources.
3. Results
In general there were small systematic differences for the preferred colour temperatures in relation to the set light levels. On the other hand there were systematic differences between preferred colour temperature and the relation between the work plane and the ambient light. A significant difference was found between male and female in the illuminance/luminance ratio of 2:1 having 500 lux within the task area where female preferred a lower CCT. For the illuminance/luminance ratio of 5:1 a tendency was found. For the ratio 1:1 no significant differences were found. Furthermore, for the ratio
CIE Session 2019 – Abstract Booklet
443
2:1 there were few subjects preferring the lowest correlated colour temperature (2700 K) and the highest (6500 K) most subjects selected 3500 K and 4000 K.
4. Conclusions
The study shows that the relation between the illuminance/luminance on the work plane and the ambient light has a major impact on the preferred colour temperature. At the most commonly used illuminance levels within a work place task area of 300 lux and 500 lux and at a ratio of 2:1 the most preferred CCT was in the range of 3500 K to 4000 K. This implies that for normal working areas the selected CCT should be within this range.
Today there is a trend to use dynamic lighting in working environments. For this purpose in order to set the circadian rhythm the CCT range could be within 3000 K to 4000 K starting at 4000 K in the morning and decreasing to 3000 K in late afternoon then our results implies that there will be few perceptual complaints.
This study also shows the importance of measuring the relationship between the light levels on the work plane and the room brightness/ambient light. In preference studies these measures must be taken into account.
CIE Session 2019 – Abstract Booklet
444

PO129
EXPERIMENTAL RESEARCH OF DYNAMIC LIGHTING SCHEMES ON IMPROVING THE ANXIETY AND DEPRESSION IN LOW VISION PATIENTS
Hao, L.X.1,2, Wang, T.Y.1,2 1 College of Architecture and Urban Planning, Tongji University, Shanghai, CHINA,
2 Key Laboratory of Ecology and Energy Saving Study of Dense Habitat (Tongji University), Ministry of Education, CHINA
Abstract
1. Objective
Low vision patients usually suffer from obvious anxiety and depression as a result of factors such as low recognition efficiency, inadequate light stimulation and inconvenience in movement. This study aimed to improve the anxiety and depression of patients with low vision through lighting intervention.
2. Methods
The ward environment was simulated in the laboratory, and 16 subjects were randomly divided into four groups, with four in each group. Of them, one group was the control group, and patients could work and learn under normal lighting mode, while the other three groups were the intervention groups, which had changed the light parameters such as spectrum, illumination and period. At the same time, the variation rule of sunlight was simulated in the intervention groups, and the effects were evaluated using the self-rating anxiety scale (SAS) and self-rating depression scale (SDS).
3. Results
The anxiety and depression scores in intervention groups were remarkably lower than those in control group, and the difference was statistically significant (P<0.05). However, the differences between different lighting schemes were not obvious, and no significant difference was found (P>0.05).
4. Conclusions
Light environment intervention can effectively alleviate the anxiety and depression in patients with low vision, but the specific combination of lighting parameters should be further studied.
CIE Session 2019 – Abstract Booklet
445

PO130
HUMAN VISUAL RESPONSE TO OFFICE LIGHTING THROUGHOUT THE DAY
Yuan, Y.1, Huang, H.2, Ou, L.2 1 Giant Lighting Solution Co., Ltd., Taipei, CHINESE TAIPEI, 2 National Taiwan University of Science
and Technology, Taipei, CHINESE TAIPEI
Abstract
1. Motivation, specific objective
A wide variety of factors can affect office environment, such as interior temperature, interior lighting, interior design and style of furniture. Undoubtedly, lighting plays an important role in human visual response to office environment. Many studies have reported the influence of ambient lighting on visual performance. Little is known, however, as to whether our visual response in a lit environment will vary at different times of a day, e.g. whether the office feels less bright, or less comfortable, in the afternoon than in the morning at the same room where the lighting conditions remain unchanged. To answer this question, a psychophysical experiment was conducted in a real office space, as will be described in more detail in the following sections.
2. Methods
A psychophysical experiment was conducted in an office room, 238cm (height) by 200cm (width) by 300cm (depth) in size. The outdoor light was completely blocked using a black curtain. The only light source in the room was 4 tunable LED panel lights on the ceiling, which generated uniform light in the room at a correlated colour temperature of 5000K. There were 5 task tables in the room where observers were seated during the experiment. The LED panels had a vertical distance of about 168cm to the task tables. On each task table was a computer display for the observers to do their routine tasks during the experiment. All displays had a peak white luminance of 100 cd/m2.
Five colour-normal observers (2 males and 3 females), between 22 and 29 years of age, participated in the study. They were asked to assess the room in terms of 5 scales, liking, comfort, excitation, safety, and brightness, using a 6-point forced-choice categorical judgement scaling method, e.g. ‘like it very much’, ‘like it’, ‘slightly like it’, ‘slightly dislike it’, ‘dislike it’ and ‘dislike it very much’. The working hours from 9am to 6pm were divided into 9 timeslots, each taking one hour.
For each timeslot, the observers were asked twice to assess the room using the 5 scales, one at the start of the timeslot and the other at the end of the timeslot. At the start of each timeslot, prior to the assessment the observers were asked to look around the room for 2 minutes for adaptation. The observers then rated the room using the 5 scales, followed by their routine work for 50 minutes using computers and displays on the tables. At the end of the timeslot, the observers assessed the room again using the 5 scales. Thus, each observer evaluated the room twice using the 5 scales for each timeslot, including an evaluation at the beginning and another evaluation at the end of the timeslot. After all procedures of each timeslot were completed, the experimenter changed the illuminance level of the entire room into one of the following, 60, 150, 300, 600, and 1080lx, measured as horizontal illuminance on the task table using a Konica Minolta CL200A illuminance meter. This was followed by the same set of procedures for the next timeslot. The change of the illuminance level was made in random order throughout the day. Each observer was asked to perform the evaluation for all the timeslots and for all the illuminance levels. This resulted in 50 hours of experimental time for each observer in this study, i.e. 5 illuminance levels x 9 timeslots + 5 repeated illuminance levels = 50 hours. The entire experiment took more than two months to complete.
3. Results
The inter- and intra-observer variability values were 0.876 and 0.878 respectively, in terms of root mean square value. With the range of each scale being 5, these values indicate good data reliability in this study.
It is interesting to find that the visual response of all the 5 scales show similar trends for the 9 timeslots throughout the day. For each scale, the scale value tends to decrease in the morning until midday and
CIE Session 2019 – Abstract Booklet
446

to increase in the afternoon. This indicates that the room tended to feel less exciting, less comfortable, less safe, less bright, and less liked at midday, than in the morning and in the afternoon.
The two evaluation results, one at the start and the other at the end of each timeslot, were compared. As a result, the two evaluation results were found correlated somewhat closely for the 5 scales, with a correlation coefficient of 0.70 for liking, 0.70 for comfort, 0.61 for excitation, 0.68 for safety and 0.76 for brightness.
High correlation was found between brightness and safety, and between brightness and excitation, with correlation coefficients of 0.92 and 0.86, respectively. Note that these values are based on evaluation results obtained at the start of each timeslot. It is interesting to find that the correlation coefficients become lower at the end of a timeslot. Nevertheless, the correlation coefficient between brightness and liking increases from -0.01 to 0.81, for evaluation at the start and at the end of each timeslot, respectively. The findings seem to suggest that the perceived brightness had an impact on perceived safety and excitation soon after the change of illuminance level of the lighting, whereas the perceived brightness affected liking of the room only after the observer stayed in the room under the same lighting for a while.
4. Conclusions
A psychophysical experiment was conducted using a set of tunable LED panel lights to investigate visual impression of the office space for each hour from 9am to 6pm throughout the day. The findings indicate that the room tended to feel less exciting, less bright, less comfortable, less safe, and less liked at midday than at any other time of the day. Results of the study may help develop new guidelines for lighting design according to the time of a day.
CIE Session 2019 – Abstract Booklet
447
PO131
INFLUENCE OF COLOUR TEMPERATURE AND INTERIOR REFLECTANCE ON SPATIAL BRIGHTNESS DEMAND
Kato, M.1 1 Nihon University, Narashino, JAPAN
Abstract
1. Motivation, specific objective
In recent years, much research on spatial brightness has been done, especially in Japan. These studies explain the spatial brightness by the luminance distribution of the observing scene. And these are targeted for perception of spatial brightness.
However, for design, "how much spatial brightness is required" is more important than "how much spatial brightness perceives". Therefore, it is urgent to investigate the demand for spatial brightness according to space usage.
However, it is doubtful whether the space usage and the required spatial brightness are consistent. For example, some people like the impression of calm for the space for meals, others like gorgeous impression. I do not think they both want the same spatial brightness.
A large amount of light is necessary to make the space composed of the low reflectance interior material and the space formed of the high reflectance interior material identical. But is there really such a space required? If you want to create a space that feels bright, increase the reflectivity of the interior material and lower it if you want to create a quiet impression space. That is, it can be predicted that there is regularity in the relationship between spatial brightness demand and interior reflectance.
Also known as a Kruithof curve, preferred illuminance tends to differ depending on colour temperature. It is said that low illuminance is accepted at low colour temperature and high illuminance is accepted at high colour temperature. If the illuminance and the spatial brightness are regarded as almost equivalent, the colour temperature is also considered to affect it.
Therefore, in this research, we investigated the influence of interior reflectance and colour temperature on the demand of spatial brightness according to the room use.
2. Methods
Experiments were conducted using a scale of 1/6 model. The size is 8 Jo-ma (the size of a general room of a Japanese housing: 3.6m*3.6m*2.4m). A light is installed in the center of the ceiling. The size is 60 cm * 60 cm.
The experimental variables are colour temperature and interior reflectance. The colour temperature was set to 4 kinds, 3000 K, 4000 K, 5000 K, 6000 K. There are three types of interior reflectance, N 4.5(11.4%), N 7.5(45.7%) and N 9.5(77.5%).
Two types of experiments were conducted. The first is to evaluate the perception of spatial brightness, as in previous studies. This evaluation was done with the magnitude estimation method. The other was to evaluate the spatial brightness requirement for each room use. There are five types of room use, "talk while relaxing at home", "relaxing alone", "studying", "reading books", "watching TV". The floor illuminance is set to 5 stages of 32 lx, 63 lx, 125 lx, 250 lx, 500 lx, 1000 lx, and let the subject evaluate whether the brightness is appropriate when assuming the designated action. The evaluation scale is 7 levels (-3: very dark, -2: dark, -1: slightly dark, 0: just good brightness, +1: slightly bright, + 2: bright, and + 3: very bright).
The number of subjects is 19 males and 1 female in their twenties.
3. Results
The perception of spatial brightness showed the relation 3000K = 4000K ≠ 5000K = 6000K. It is also
clear in the previous research, but the higher the colour temperature, the more the space tends to feel bright. However, the difference is small.
CIE Session 2019 – Abstract Booklet
448

Next, the spatial brightness demand tended to be higher as the colour temperature was lower, regardless of the room usage. And when the interior reflectance is high, there is a tendency that the average luminance of the space that answers "just right brightness" increases.
4. Conclusions
From the above results, it became clear that the colour temperature and interior reflectance affected the spatial brightness demand. According to existing standards, the average luminance and illuminance of ceilings and walls according to the use of the room are determined, but a target value according to room situation will be required. The placement of lighting fixtures may also affect it, so experiment will be continued.
CIE Session 2019 – Abstract Booklet
449
PO132
INTEGRATION OF DAYLIGHT IN SCHOOLS AND KINDERGARTENS
Kobav, M.B.1, Močnik, N.2, Praper, P.3 1 University of Ljubljana, Faculty of electrical engineering, Ljubljana, SLOVENIA, 2 Velux Slovenija
d.o.o, Trzin, SLOVENIA, 3 EUTRIP d.o.o., Celje, SLOVENIA,
Abstract
1. Motivation, specific objective
Integration of daylight is more and more important in all types of buildings. Quality and quantity of daylight is important in private (residential) buildings and also in public buildings, especially in schools kindergartens and office buildings. Daylight has three major advantages: it helps synchronising circadian rhythm, gives you visual contact with surrounding and saves energy. In our study we are analysing the influence of daylight on illuminance in public building – in kindergarten. Energy consumption, illuminance levels, use of artificial lighting and user perception of the room were taken into account.
2. Methods
In this study we had a chance to compare two rooms of the same size, same purpose and equipped with the same furniture with different amount of daylight.
In a newly built kindergarten with more departments we analysed two bathrooms, equipped with different amount of daylight. Bathrooms are provided adjacent to each room. In bathrooms kids wash their hands before every meal, after the use of toilets (which are in the same room) and also many times during the active day. Room leaders or educators also use bathrooms to change the diapers. The bathrooms should be well illuminated since those premises or at least a part of the bathroom is used also for care. In our country, “premises for care” have to be illuminated with 500 lx and premises, which are not permanent occupied, have to be equipped with presence sensors to switch on luminaries.
Bathrooms are usually considered as secondary premises and because of that usually located inside the building without any daylight. This design mentality was also used in case of this kindergarten. This kindergarten has only a ground floor and because of that is possible to install skylights in practically all premises where there is not enough daylight. To investigate in influence of daylight from skylights we designed daylight and analysed both bathrooms. The first bathroom was practically without any daylight, only with indirect daylight coming through glazing part of the doors and small window in the wall. In the second one daylight was designed with appropriate software and two large fixed flat roof windows were installed.
For objective analyse of the daylight an “on-line” monitoring system was installed. With the monitoring system it was possible to observe and measure illuminance, energy consumption of artificial lighting and temperature for both bathrooms separately. Illuminance meters were installed above the working surface for care of kinder and could not be obstructed by users of the bathroom. In our study we analyse data for more than 24 months (October 2016 – December 2018).
3. Results
In this paper we will present the results in objective in subjective manner. The easiest way to present objective results is with the illuminance levels, consumed energy and duration of time when luminaries are switched on in a bathroom without skylight.
Difference in energy consumption between both bathrooms for artificial lighting depends on the time in a year. The highest difference is during summer months when altitude of the sun is the highest. In June and July consumed energy in a bathroom without daylight could be 13 times higher than the energy consumed in a bathroom with skylights. During the winter days with the sun at low altitudes the ratio is “only” 6!
Illuminance in bathroom without skylights is maintained above 500 lx practically all the time when the luminaries are switched on. In the daylit bathroom the illuminance follows outdoor illuminance pattern.
CIE Session 2019 – Abstract Booklet
450

During winter times and cloudy skies daylight is not sufficient during most of the day. On sunny days - also in winter - the illuminance in a daylit bathroom is maintained between 350 and 500 lx. If the skies are sunny than artificial lighting is needed in winter months only in morning before 9 AM and in afternoon after 3 PM. In summer months illuminance in daylit bathroom is much higher and with sunny skies it reaches up to 3,3 klx. With extremely cloudy skies, which are rare in summer, illuminance is maintained above 250 lx between 8 AM and 6 PM.
Working hours of artificial lighting in bathroom without skylights is on average 7 hours per day and the kindergarten is open from 6 AM to 4:30 PM (10,5 hours). As it can be seen it’s possible to save approximately 30 % of energy with presence sensors. We assume that without presence sensors light would be on all the time. In the bathroom with skylights duration of time when the lights are on depends on the available daylight. In summer months and clear skies, lights are on only in the morning for less than half an hour, and on cloudy days between one and two hours. In winter months and totally overcast skies lights are on practically the same time in both bathrooms since daylight is not sufficient. In winter months with sunny skies the lights are on for approximately 2 hours.
For the subjective evaluation we interviewed room leaders and educators. They all agree that bathroom with skylights is much more pleasant and that they prefer to perform care in this bathroom. On the other hand, they also complained that during summer months, the bathroom is too bright and they can sense glare since no shading devices are installed.
4. Conclusions
Sustainable construction design integrates comfort of users, energy efficiency and environmental impacts.
If we would consider only energy savings than it wouldn’t make any sense to install the skylights because the payback time could be more than 20 years. But if we consider the impact on the users health or indoor comfort and their satisfaction with the working premises, additional daylight coming through flat roof windows is very valuable. Well daylit indoor spaces are a matter of systematic approach in daylight design for all rooms, not only bathrooms.
CIE Session 2019 – Abstract Booklet
451

PO133
AN EXPERIMENTAL STUDY OF THE LIGHTING FOR NONE NATURAL LIGHT OFFICE SPACE BASED ON NON-VISUAL BIOLOGICAL EFFECTS
Study of non-visual biological effect of the spectrum based on the office health lighting needs
Lin, Y.1, Liu, C.1, Du, Y.T.1, Lu, W.H.1 1 Tongji University, Shanghai, CHINA
Abstract
1. Motivation
Light environment of office space is not only related to the visual performance of office workers, but also has influence on sleep, mood, and alertness and then has important effects on physical and mental health of the staff through the non-visual forming system. Daylight is the most ideal source for regulating the body's circadian rhythm system. Office staff spend over 80% of their daytime hours indoors. However, the on-site investigations of 20 office spaces in high-density urban areas in Shanghai showed that majority of office workers do not receive sufficient daylight stimulation because of big depth and low height of office space. In this study, a variety of artificial lighting modes in a simulate office space without daylight were used to quantified high-intensity blue-enriched-white light’s effects on human melatonin, cognitive ability, brain Electricity, alertness, mood, sleep quality, heart rate and blood pressure and other physiological, and psychological.
2. Methods
A none natural light space located in Wenyuan building of Tongji University in Shanghai was chosen as the experimental study space. While, 11 graduate students volunteered to participate in the experiment. The experiment is divided into two lighting modes; mode A is based on the architectural lighting design standards of the office lighting part, mode A has lighting control parameters for the desktop level illumination of 300 lux with colour temperature of 4000K; mode B is high intensity white light as rhythmic lighting added on mode A; mode B has lighting control parameters for the eye level illumination of 1000 lux with colour temperature of 17000K.The experiment was operated at 9 am to 11 am in the morning, the subjects were randomly assigned to work on visual tasks and cognitive tasks, and collect saliva melatonin, EEG, self-report alertness in two lighting modes. Jawbone UP3 bracelet was used to monitor sleep quality after lighting stimulation.
3. Results
The data collected in this experiment showed that high intensity blue-enriched white light has a significant effect on the secretion of melatonin in the human body. It is supposed that the amount of melatonin in human body could be significant increased under office lighting condition satisfying current lighting design standard. It is different from cyclical of human hormones under natural lighting. Human rhythm disorder could be caused by long-term staying in low illuminance office space. High intensity blue-enriched white light stimulation can generally improve the human alertness, shorten the reaction time, but the influence were significant differences between individuals. The use of artificial lighting to provide long-term high-intensity blue-enriched light stimulation can cause a significant increase in human visual fatigue, affect the visual effects of office workers. The effects on human cognitive ability, heart rate, and blood pressure weren’t observed after 2 hours of light stimulation. The resting EEG during open eyes and closed eyes for the whole brain as the basis for the average power intensity of the band did not observe a significant impact. Wireless EEG acquisition device in the event-related potential test has random mark signal delay, resulting in ERP EEG analysis results disorder. Short-term laboratory light exposure experiments did not show a significant impact on sleep quality.
4. Conclusions
Based on the results of this study, office space lighting design not only needs to satisfy the needs of human visual function, but also consider the needs of the body circadian rhythm system. In this
CIE Session 2019 – Abstract Booklet
452

experiment, the use of eye level illumination 1000lx, colour temperature 17000K blue-enriched white light stimulation can provide the body circadian rhythm system for the regulation of hormone content needs, but long time stimulation would cause visual fatigue. In the follow-up experiment, it is still necessary to study the appropriate time and appropriate intensity of rhythm illumination stimulation. Providing strong theoretical and experimental data to achieve the office health lighting, and to improve the existing visual design-oriented lighting design evaluation system.
CIE Session 2019 – Abstract Booklet
453
PO134
EXPLORATION AND RESEARCH ON VISUAL COMFORT MODEL OF NATURAL LIGHTING ENVIRONMENT IN COLLEGE CLASSROOMS
Liu, G.1,2, Qu, G.H.1, Yuan, Y.1, Dang, R.1 1 School of Architecture, Tianjin University, Tianjin, CHINA,2 School of Architecture, Tianjin University,
Tianjin Key Laboratory of Architectural Physics and Environmental Technology, Tianjin, CHINA
Abstract
1. Motivation, specific objective
In classrooms, natural lighting can directly affect the indoor light environment and students’ visual effects on desks, blackboards, and projector screens, resulting in the influence on their learning efficiency. Thus, it is necessary for architects to make full use of the natural light in the process of buildings design. Because of the space scale of the classrooms and the unreasonable window design (i.e. size and position), there are distinct illuminance differences and the phenomenon of dazzle in most classrooms. These uncomfortable problems lead the users to abandon the use of natural light in the operation stage. Even on a sunny day, they still close the curtains and rely on artificial lighting, which not only squanders architects’ elaborate design but also causes unnecessary energy consumption. Therefore, it is of great significance to identify the relevant indices of natural lighting and the interactions among them, so as to improve the natural lighting comfort.
2. Methods
Firstly, field investigations were conducted in the existing college classrooms to summarize the typical layout of classrooms. The parameters, including human eye position coordinates, human vertical illuminance, desktop average illuminance, window average lightness, blackboard and projection curtain average illuminance, have also been measured during different usage periods. Secondly, by analysing the measuring data, the average illuminance of visual surface, daylight glare probability (DGP) and the average visual lighting sensitivity of visual field were selected as the research variables. Thirdly, a south-facing classroom with 100 seats was selected as the experimental laboratory based on the survey results in Tianjin University, 12 students from different grades in Tianjin University participated in an experimental condition and 50 conditions were designed in the experiment by changing the three experimental variables. Moreover, the visual lighting comfort of the desks, blackboards, and projector screens in 50 working conditions was assessed by using the electroencephalogram (EGG). The event-related potentials (ERP) difference of the human eye from wearing the blindfold to removing the blindfold and adapting to the experimental conditions represent the natural light visual comfort evaluation results in classrooms. Finally, the experimental data are processed by MATLAB software and analysed the fitting relationship of the experimental data by the BP neural network classification algorithm.
3. Results
By analysing the investigation results, the illuminance and DGP distribution rule in the classrooms of different orientations during different time periods can be obtained. Moreover, by means of three research variables and the visual comfort evaluation of natural lighting in classrooms, a quantitative relationship among average illumination of visual surface, glare index DGP, average visual light sensitivity and brain potential evaluation results can be achieved.
4. Conclusions
On account of analysing the experimental data, the influence mechanism how the average illuminance of the apparent surface, the glare index DGP and the visual average light sensitivity exert impacts on the quantitative evaluation of visual comfort in natural lighting environment can be obtained. Meanwhile, the fitting algorithm can be determined, according to the mechanism’s regularity, which can provide the pre-conditions and data support for establishing visual comfort model of natural light environment.
CIE Session 2019 – Abstract Booklet
454
PO135
VISUAL DISCOMFORT ASSOCIATED WITH CEILING LUMINAIRES: OBSERVATIONS, TRENDS AND CHALLENGES 2009-2018
Long, J.1,2 1 Jennifer Long Visual Ergonomics, Katoomba NSW, AUSTRALIA, 2 University of New South Wales,
Sydney, AUSTRALIA
Abstract
1. Motivation, specific objective
There are wide variations in light tolerance between individuals. This paper documents visual discomfort reported by individuals working in offices and ways the visual discomfort was managed.
2. Methods
This is a retrospective analysis of onsite workplace assessments conducted during 2009-2018 where visual discomfort was associated with the luminance of ceiling luminaires.
3. Results
30 workplace assessment reports met the inclusion criteria. The ceiling luminaires included fluorescent lamps (n=28) fitted with prism diffusers (n=12) or glare-reducing louvres (n=16), and LED fitted with opal diffusers (n=2). The basis for discomfort was neurological (e.g. migraine) (n=10), physical (e.g. ocular disease, ocular disfigurement) (n=7) or non-specific (e.g. general discomfort and headaches) (n=13). The luminance of the luminaires as viewed from the workstations of affected individuals (range 1895cdm-2 to 19500cdm-2) was significantly greater than the surrounding ceiling (generally less than 50cdm-2) and other objects at the workstation (e.g. furnishings, computer displays, generally less than 200 cdm-2).
Strategies attempted by individuals to manage their discomfort included wearing tinted spectacles (n=9), wearing a hat/visor (n=8) and using barriers to block the view of luminaires (n=6). Half the workplaces were reluctant to switch off luminaires because of potential aesthetics, safety or task illuminance issues. Relocating individuals to alternative workstations was not always feasible (n=9) nor advantageous e.g. if other workstations had identical issues (n=8).
Some workplaces viewed fluorescent lamps as “bad” lighting and saw LED as a potential solution. However, observations so far indicate similar discomfort issues associated with fluorescent lamp and LED luminaires.
4. Conclusions
Not all workers will experience discomfort with high luminance luminaires, but those with underlying neurological or physical conditions may be more susceptible to discomfort.
If an individual has an assigned workstation then their visual comfort may be improved by interventions such as switching off the luminaire or installing a barrier which blocks the luminaire from direct view.
A current trend within office environments is to provide activity based work areas. In this type of office design, workers are not assigned a workstation but can choose their work area according to the task they are performing. If a worker does not have an assigned workstation then the options are limited for addressing visual discomfort associated with high luminance ceiling luminaires. Therefore, there is a challenge to provide lighting designs which meet the diverse visual needs of workers and which do not rely on high luminance luminaires.
CIE Session 2019 – Abstract Booklet
455

PO136
INVESTIGATION OF OPENING DESIGN INDEX FOR DAYLIGHTING IN HOUSES
Matsumoto, S.1, Yoshizawa, N.1, Takase, K.1, Itou, T.1, Shimizu, D.1, Saito, K.2, Yagi, S.2 1 Tokyo University of Science, Tokyo, JAPAN, 2 YKK AP, Toyama, JAPAN
Abstract
1. Motivation, specific objective
Daylighting is one of indispensable methods to secure indoor brightness. Artificial lighting became popular in the 20th century and lighting design to ensure required illuminance became easier without daylighting. However, in recent years, the role of daylight is being reexamined from the viewpoint of energy saving, further health and comfortability. Some indexes which relate to indoor daylight environment are proposed. One of them is ISO 8995-1 (CIE s008 / E), in which the light environment is evaluated comprehensively by the factors such as illuminance on desk surfaces, glare and so on. Other evaluation indexes are Spatial Daylight Autonomy (sDA) and Annual Sunlight Exposure (ASE), in which the annual daylight environment is evaluated by the horizontal illuminance. The latter indexes became used in LEED by the U.S. Green Building Council and WELL Building Standard which focusing on human health. However, since these indexes are proposed in targeting work space in office buildings, they may not be suitable for the daylight environment evaluation in houses. Furthermore, it is also concerned that the evaluation by vertical illuminance and cylindrical illuminance which are important in consideration of human health and comfortability are not included in these indexes.
In this study, we compared the results of the predicted annual daylight environment in the actual apartment houses by simulation and the results of the questionnaire survey for the residents. It is the prior investigation in order to establish a new opening design index for daylight utilization targeting houses.
2. Methods
In this study, we focused on the actual apartment houses called Passive Town Kurobe model. The buildings are located in Kurobe city, Toyama prefecture, Japan. The construction site is divided into three blocks. Each building has at least one southern side opening, which has high insulating performance by using triple pane window. From the difference of the window design, such as the window area, installed shading devices and so on, the indoor daylight environment in the houses on each block varies. The large south openings and the openings on east, west and north can introduce sufficient daylight to the space in the houses on the first and the second blocks. Moreover, especially on the first block, there are terraces outside the south windows called “Community deck” and the residents can use the movable overhang shading devices in hot seasons. In the houses on the third block, which were in renovated buildings, the area of the south openings with inner Venetian blinds are smaller compared to the houses on other blocks.
The following four steps were carried out to examine and propose the index.
(1) As a phase of accuracy verification, targeting one house on each block, we simulated the instantaneous daylight environment using Radiance, which is an open source lighting simulation program and compared the simulation results with the results by actual measurement. To perform the annual simulation more precisely, we estimated the proper reflectance of interior walls, ceiling and floor based on the calculated luminance distribution.
(2) We asked the residents living in each block to answer the satisfaction level of daylight environment in the living space on 5-point scales. In addition, we took photos of south windows to grasp the open or close states of the insolation shading devices attached to the openings. Therefore, annual opening and closing pattern data per every hour was obtained and classified according to the usage situation.
(3) Annual daylight environment simulation in the houses on each block was carried out using the interior reflectance values obtained in the former process. Annual room illuminance was calculated by using Honeybee, which is a Grasshopper's plug-in based on Radiance, taking into account the opening and closing pattern data.
CIE Session 2019 – Abstract Booklet
456

(4) We compared the results of the questionnaire survey about the residents’ satisfaction at daylight utilization with the simulated results of vertical and cylindrical illuminance value. Finally, we decided the applicable range of the daylight illuminance based on the results of each block.
3. Results and Conclusions
In this paper, as the prior examination to establish the opening design index, we examined the indoor daylight environment in the houses on three blocks in Passive Town Kurobe model. At first, by the verification of precision, the error rate of the simulated luminance on the interior surfaces in each house was within 10%. Secondly, the annual daylighting simulation considering the statement of shading devices became possible. Finally, we showed the applicable range of the daylight illumination for the residents based on the annual measurement, questionnaire survey and simulation results. The results were the keys to establish a new index of the opening design for daylighting.
CIE Session 2019 – Abstract Booklet
457

PO137
TOWARDS NEW DESIGN OF LASER CUT ACRYLIC PANELS FOR WINDOWS
Matusiak, B.S.1, Weibye, A.1 1 Norwegian University of Science and Technology, Trondheim, NORWAY
Abstract
1. Motivation, specific objective
Several studies have shown that transparent acrylic plates cut with laser, as invented by Ian Edmonds, can be an effective and useful device that can significantly improve the daylighting conditions of existing rooms. Laser Cut Panels (LCP) are usually designed to cover the upper part of the window i.e. over the eye height. This enables users of the room to enjoy an unobstructed view to the outside while still benefiting from the LCPs ability to deflect incoming daylight deeper into the room and create better daylighting conditions. The same studies also point out some concerns about glare as the Edmonds panels deflect light into the room in a rather focused beam, creating hot-spots of high luminance.
In previous studies Matusiak experimented with LCPs to improve daylighting conditions in students’ studios using LCPs mounted horizontally beneath skylights. The pattern of cuts was developed to i) maximize the deflection of sun rays around the skylight by optimizing the form, size and position of cuts and to ii) allow as large as possible penetration of the diffuse light from the sky by maximizing perforation degree of the panel. This resulted with a pattern consisting of regularly repeating circles. As a result, the stationary LCPs disperse light around skylights regardless of sun azimuth angle and simultaneously the vertical light from the overcast sky has nearly unobstructed way down to the room, a solution which proved highly successful regarding the light level and the appreciation by the users.
This paper aims to study various new-developed pattern designs in a vertical acrylic panel mounted on or nearby the window glass to increase side-spreading of light into the room. The novel design was either a repeating wave pattern (A, B and C panels, ordered according to increasing curvature/radius) or a parametric pattern (P). In P the sloping of each single cut is calculated to optimize the light distribution in the room by illuminating the ceiling evenly, and therefore differs across the width and height of the panel. The original Edmond panel (E) was also included.
2. Methods
High Dynamic Range (HDR) imaging technique was used to capture the luminance distribution of light in a simple cubic box (300mm) with panel samples (150x150x6mm) positioned in a square opening at the centre of one of the walls while HDR photography was made using a Nikon D600 camera with a Sigma Circular Fisheye lens positioned in a circular hole at the centre of the neighbouring wall. The method allowed us to register the luminance distribution in the whole box. HDR images were developed from a series of 11 images taken with increasing exposure. All 15 material samples (A, B, C, P and E, each with three alternative cut distances 1,2 and 3) were examined for incidence angles of light varying 0 - 50deg with 10deg step.
To obtain correct luminance data the HDR images have been calibrated according to a grey-card; also the luminance loss due to vignetting of the lens has been preciously accounted for.
Two factors have been proposed for examination of the panels: the light deflection factor DL and the spreading factor SL
DL = L(U) x A(U) / L(R) x A(R)
SL = L(T) x A(T) / L(U) x A(U)
where:
A(R), A(U) and A(T) are sizes of areas R, U and T defined equally at all images
L(R), L(U) and L(T) are mean luminances across areas R, U and T.
CIE Session 2019 – Abstract Booklet
458

3. Results
All panels creates areas of hotspots, being potential issues of high luminance contrast in the room. A simplified glare analysis points that all panels developed in this study could generate lower glare risk than the original Edmonds panels.
Evaluating overall performance of the panels over a wider range, A- and B-panels (wave panels smaller radiuses) show to be relatively consistent. These panels incorporate both the Edmond panels’ ability to deflect light and the curved design’s ability to spread light, without incorporating too much of the downsides of either design.
Parametrically designed panels show great potential in performance. However, since the cut design has to be individually calculated for a target room, they lack the ability to be applied in multiple scenarios, something that may limit the production volume or increase the cost.
For rooms where the maximum deflection is crucial for rather low angles of incidence (20-30° as is common situation in Nordic countries spring/autumn), A1, P1 and E1* could be used;
In rooms where maximum deflection is needed for high incidence angles P2, A2 and E2* are best, following by C3 and other 3 panels.
In rooms where maximum spreading factor is needed, all panels from C, B and P series are recommended.
4. Conclusions
The results indicate that deflecting of light is closely related to the panels’ D/W-ratio (distance between cuts/width of the panel) and the panels’ ability to spread light is related to the magnitude of curvature in the pattern-design. The parametric pattern and the wave pattern have both shown very promising results and are recommended for application in real buildings.
The paper introduces also a new developed method based on the usage of the HDR photography, which proved to be very useful for such experiments.
* the number after the letter refer to the distance between the cuts, 1- the smallest, 3- the largest cut distance.
CIE Session 2019 – Abstract Booklet
459
PO138
PRACTICAL CONSIDERATIONS FOR AN EFFECTIVE FLICKER METRIC
Naomi J. Miller1 1 Pacific Northwest National Laboratory, Portland OR, USA
Abstract
1. Motivation, specific objective
Flicker perception (or, more accurately, Temporal Light Artefacts) is a growing problem as LEDs proliferate in application. Without careful attention to the driver characteristics, LEDs can exhibit wide fluctuations in light output that a growing number of people recognize as causing headaches and other forms of discomfort. There are multiple flicker metrics, all of which have drawbacks. It is critical that we recognize and implement metrics that are predictive, easily measured, and can apply to a wide range of typical products and applications.
2. Methods
This study relies on detecting visibility of flicker, on the assumption that visibility relates to the neurological responses to modulating light. It does not confine the observations to fixed gaze or central vision detection, with the recognition that relative movement of the light source, the eyes, and lighted objects all play a role in the detection of flicker, the stroboscopic effect, and the phantom array effect. Furthermore, relative movement is a fact of the human experience with light sources. The number of subjects is small (three), since it had to be confined to individuals who can detect from a wide range of flicker frequencies but do not experience serious neurological consequences of the flicker. The sources of flicker are light sources collected from a variety of luminaires laboratory tested in recent years, as well as a waveform generator from a luminaire manufacturer.
3. Results
Preliminary results show the flicker detection to be related to the waveform, and repetitive area “missing” from a continuous output. This missing area is related to the modulation depth combined with the duty cycle, and this can be estimated by the flicker index. It is dependent on frequency, with higher flicker index values being tolerated or becoming invisible at higher frequencies. One question is how to evaluate the frequency when the waveform is complex and the fundamental frequency has a less critical flicker index than a secondary frequency. Ultimately, it will be necessary to identify how many products in application exhibit this characteristic and whether that number necessitates a more complex metric. An evaluation of flicker waveforms collected from a single testing laboratory over five years will be used to determine how often complex waveforms occur.
4. Conclusions
Flicker index evaluated according to frequency may be a simple metric that can be applied to a wide range of applications. Since the flicker index and fundamental frequency is already evaluated by flicker meters, it would be an easier metric to measure and publish on product specification sheets.
CIE Session 2019 – Abstract Booklet
460

PO139
TOP EFFICACY PERFORMERS: THE QUALITY TRADEOFFS IN LED LUMINAIRES
Naomi J. Miller1 1 Pacific Northwest National Laboratory, Portland OR, USA
Abstract
1. Motivation, specific objective
For the design professional, selecting light-emitting diode (LED) luminaires is a challenging task. The luminaire needs to deliver light where it’s needed, while providing a range of lighting characteristics such as colour quality, minimal flicker, and visual comfort. LED products posed a dramatic departure from earlier lighting technologies, and one of several databases developed to help identify products with good characteristics and high efficacy is the LED Lighting Facts Listings, supported by the U.S. Department of Energy (DOE) until 2018. In 2017, several lighting products were listed with claimed efficacies near or exceeding 200 lumens per watt (lm/W) in the U.S. Department of Energy (DOE) LED Lighting Facts database. The Top Efficacy Performers project was launched to procure samples for testing and visual evaluation.
2. Methods
Multiples of seven luminaire models listed from 140 to 209 lumens per watt were anonymously ordered, all but one having directly visible LED packages. Luminaires were selected to deliver between 15,000 and 22,000 lumens.
All seven luminaire types underwent IES LM-79-08 laboratory photometric testing for comparison to manufacturer-claimed values. Color, flicker, light output, and electrical data were obtained on the samples. The products were then installed in a lighting laboratory located in an industrial-type space, with luminaires mounted in pairs, 4.3 meters on center, each type controlled with a separate switch. Mounted in a movable ceiling at 3.5 m above the floor, in-situ measurements were taken to evaluate workplane and floor illuminances for levels and uniformity. Measurements of flicker (Temporal Light Modulation) were made, as well as direct measurement of nadir LED emitter luminance or, in one case, luminance of the diffuser covering the LED array. These were all made with a 1/3° luminance meter, but measuring conditions prevented filling the capture angle with the LED luminance only. Diluted with the luminance of the surrounding reflector material, the measured luminances likely underestimated the actual luminance of the LED package, except in the case of the luminaire using diffusers.
Typical industrial assembly tasks were located on a movable table below the ceiling. Twenty-three lighting-experienced observers were invited to visit the lighted mockup space and visually evaluate the luminaires. A questionnaire was provided to capture observations, including quality of the light in terms of colour, shadows, light distribution, visual comfort, appearance, and functionality. The intent was to glean information on quality issues that are more difficult to quantify using conventional metrics. Observers were asked to assign an overall quality value for each luminaire by estimating how much they would pay for the luminaire. (The point was not to estimate actual price, but to determine a relative value compared to a typical industrial lighting product.)
The observers were invited in small groups and presented the luminaires, one pair of energized luminaires at a time. The presentation order was randomized, with a unique first and last luminaire for each of the seven groups in order to minimize order effects. There was no identifying information on the luminaires, which were labeled A through G. Observers were asked not to talk among themselves while completing the exercise in order to avoid prejudicing responses from their fellow observers. They were verbally debriefed after completing the questionnaires.
3. Results
The laboratory testing showed the following maximum differences in performance compared to manufacturer claims: 9.6% in lumen output, 6.8% in power draw, and 12.0% in efficacy. Indeed, several performed at or near 200 lm/W. Color performance was consistent with claimed values.
CIE Session 2019 – Abstract Booklet
461

All luminaires produced fairly even workplane illuminances, most emitting a simple cosine light distribution. One luminaire exhibited potentially problematic flicker, with a Percent Flicker of 45%, Flicker Index of 0.14, Frequency of 120 Hz, and SVM of 1.7.
Direct measurements of the exposed LED packages revealed luminances ranging from 154,000 cd/m2 up to 478,000 cd/m2, although these values likely underestimate the actual luminances. One luminaire with diffusing tubes covering the LED packages was considerably lower at 40,000 cd/m2. (All of the product maximum luminances are considerably higher compared to the luminance of a T5 HO fluorescent lamp at approximately 25,000 - 30,000 cd/m2.)
The observers provided comments, subjective ratings, and overall perceived dollar values. Only two luminaires received reasonable ratings of visual comfort and overall quality, those with either diffusers or engineered reflector optics to reduce the view of the bare LEDs. The three highest rated luminaires received positive comments in light distribution, shadows, and colour in addition to visual comfort; the three lowest rated received the most negative glare comments. Quality rankings were corroborated by the overall dollar value assigned by observers. The product receiving the highest subjective rating exhibited the lowest tested efficacy of 136 lm/W, suggesting that other performance attributes such as visual comfort, light distribution, low flicker, softer shadows, and colour quality may end up being of equal or greater importance to the installation.
4. Conclusions
Laboratory testing plays a vital role in documenting lighting performance, and this information is applied by design professionals to produce more efficient lighted environments. However, less clearly measurable issues such as flicker and visual comfort frequently make high-efficiency less acceptable. This work demonstrates the need for improved glare metrics and measurement techniques that take luminaire luminance distribution into account. It is critical that the lighting industry develop predictive metrics in these areas; without them, specifiers cannot anticipate problems that could affect user comfort and product acceptability. This study demonstrates that very high efficacies are real, and with even better drivers, chips, and high-efficiency optics, impressive performance will be available for luminaires that people perceive as comfortable and acceptable.
CIE Session 2019 – Abstract Booklet
462

PO140
EFFECTS OF LIGHTING ON PERCEPTION OF SPACIOUSNESS
Miyake, H.1, Yamamoto, R.2, Yamaguchi, H. 3, Yoshizawa, N. 2 1 Arup, Tokyo, JAPAN, 2 Tokyo University of Science, Chiba, JAPAN, 3 National Institute for Land and
Infrastructure Management, Tsukuba, JAPAN
Abstract
1. Motivation, specific objective
In order to fully explain the perception of spaciousness (volume of space as psychophysical quantity) for spaces with different lighting environment, it is necessary to consider both of the luminance level of all the visible surfaces and their three dimensional localization in the space. In the existing researches about perception model for spatial brightness, the information of luminance level is captured as a luminance image in which the distance from the observer to the surface is ignored. However, experientially, the distance to the lighted surface has important impact to enlarge the spaciousness and that should contribute to the quality of the space. Our basic hypothesis is that the farther the lighted surface is from the observer, the bigger the spaciousness is. In our new perception model for spaciousness considering the localization of light, the distance to every surface is multiplied to the luminance level, and integrated to a value which is corresponding to the spaciousness. To realize this analysis, we are working on two calculation systems. One is to measure the value of an existing space using luminance level camera and depth capturing system. The other is to virtually calculate the value using Rtrace command of Radiance capturing the luminance level of each point and the localization (distance and direction to that point). In this presentation, the model of the spaciousness perception is descried and the result of two preliminary experiments are reported.
2. Methods
Experiment 1 (CG)
The aim of this subjective experiment with computer graphic was to understand the effect of light which is localized at the far side of the room. Comparing different images of a same room, with or without additional light hidden in the corner of the other side of the room from the observer, the subject reported their impression using SD method with pares of words about “atmosphere of openness”, “brightness” etc. (Because this experiment was executed before we particularly focused on the idea of the perception model for “spaciousness”, this word was not included in the pairs of words.) The room was simple 15m2 room with a table, four chairs and a book shelf, lit with a cove light at the center of the room. The plan is rectangular, but at the other side of the room, there is an additional dead space which is not visible from the view point and the additional light was set to there to give light to the surrounding area.
Experiment 2 (real living room)
The aim of this experiment is to verify the effect of the localization of light to the perception for spaciousness. Comparing different lighting environments in a same living room, the subjects reported their perception of spaciousness with ME method. The room was existing living room with downlight, stand light, ceiling indirect light and pendant light. These light s are controlled as 3 groups considering the location in the room. The first group was the downlight and stand light which was located at the far side. The second group was the pendant light hung on the table just in front of the subjects. The third group was the ceiling indirect light which was continuous from the near side to the far side. The standard configuration was set using all of the 3 groups so there was minimal localization of light in the room. By turning on only one of the groups, we made the different lighting environment in which the localization of the light is different. The subject reported their perception with ME method and SD method.
CIE Session 2019 – Abstract Booklet
463
3. Results
Experiment 1 (CG)
The effect of the additional light was obvious and it had positive effect to “atmosphere of openness”, “favourite”, “relaxing”, “atmosphere of lightness”, “atmosphere of softness”, “physical lightness”, “natural lighting environment”, “lightness of ceiling”, and “lightness of wall”.
Experiment 2 (real living room)
The result was different from the hypothesis and the standard configuration (all the 3 groups are ON) was better than all the other configurations which has localization of light in the room. Both the spatial brightness and the spaciousness have correlation with the average of luminance level, vertical luminance level, the integration of luminance level multiplied by distance, and the integration of luminance level by the distance and the cosine of the degree from the view axis. Regarding the spaciousness, the R squared with the luminance by distance was 0.79, which is bigger than the R squared with the average of luminance level (0.49) and the vertical illuminance level (0.39).
4. Conclusions
The result of the experiment 1 showed that the addition of light to the space can augment not only the spatial brightness but also the spaciousness.
The result of the experiment 2 showed that the speciousness can be explained with a formula using the luminance level, the distance and the direction to the surface. However, the localization only to the far side of the room was less effective to the mix of the different lights. This shows that not only the distance from the observer to the lit surface but also the distance between the lighted surfaces have impact to the spaciousness. In addition, the high R square between the spatial brightness and the integrate of luminance level multiplied with the distance and the cosine of the degree from the view axis, shows that taking the distance information to the calculation can develop better the existing models of the spatial brightness perception.
CIE Session 2019 – Abstract Booklet
464

PO141
GLARE FROM WINDOW CONSIDERING TIME FLUCTUATION AND TYPES OF TASK
Mochizuki, E.1, Maehara, Y.1 1 Chiba Institute of Technology, Chiba, JAPAN
Abstract
1. Motivation, specific objective
The importance of daylighting is being re-recognized from the viewpoint of not only energy savings but also human health and well-being. Controlling discomfort glare from window is an important task for active utilization of daylight.
Up to now, various formulae to evaluate discomfort glare have been proposed. Most of them are based on the momentary subjective evaluations obtained in laboratory experiments dealing with only 4 parameters- source luminance (which is quite constant and uniform), source size, background luminance and position of the source. However, in actual situations, light sources such as windows have non-uniform luminance distribution and the luminance of the source varies.
CIE JTC7 had worked to propose a method to modify UGR taking into account the non-uniformity of glare sources such as LED luminaires. However, it only focuses on the luminance distribution of LED luminaires, which have no view nor time fluctuation. It also has been pointed out that gaze behaviour which depends on the type of task and lighting condition should be considered for better understanding of discomfort glare.
In this paper, the results of subjective experiment to identify discomfort glare from window considering luminance distribution within the window, time fluctuation and the type of task are reported.
2. Methods
Two pairs of the experimental room (4.9 m in width, 3.2 m in depth and 2.5 m in height) were prepared for the experiment. The experimental rooms were located on the 17th floor of the building. One of them was equipped with the actual window facing south whose size was 970 mm in width and 890 mm in height on the front wall. The view from the window included both of sky and surrounding buildings’ surface. The other experimental room was equipped with two different kinds of the light source, the one was the artificial skylight (Coelux®45SQ, 270 W, 4300K) and the other was LED panels (XL574PFVJ RZ9, 5530 lm, 5100 K). Both of them had the same size with the actual window in the other room. Each light source was settled at 1.2 m in height from the floor. One subject at a time was seated facing each light source at a distance of 2.5 m away from the source. The interior of the experimental room was finished quite uniform with about 90% of the reflectance.
Subjective experiment was conducted between October and December 2018. Fourteen university age students participated in the experiment as the subjects. He/she stayed in the experimental room for one hour with doing the two types of task, reading a book or text typing each for 20 minutes. After each task, he/she measured critical fusion frequency of flicker (CFF) and answered a sheet of questionnaire identifying the degree of discomfort glare during the task, the visibility of letters on paper/VDT and the acceptability of the light environment as a workplace. Fourteen subjects experienced 124 different conditions in total in the experimental room with the actual window (6 subjects*6 times*3 days + 8 subjects*2 times*1 day) prior to the experiments with the artificial skylight and the LED panels. The average luminance of the artificial skylight and that of the LED panels were adjusted to be the same with that of the actual window he/she experienced if possible.
Horizontal illuminance on the desk (0.7 m from the floor, TR-74ui, T&D), vertical illuminance on the window surface and that at the subjects’ eyes (1.2 m from the floor, TR-74ui, T&D) and colour temperature at the centre of the experimental room with the actual window (0.7 m from the floor, KONICA-MINOLTA CL200) were measured during the experiment. In addition, luminance distribution within the subjects’ visual field was obtained at the beginning of each experiment by using camera (CANON EOS 70D).
CIE Session 2019 – Abstract Booklet
465

3. Results
From the results of the measurement, it was identified that the subjects experienced 1,018 lx of the vertical illuminance at their eyes in median (29,250 lx in maximum, 66 lx in minimum) during the one hour’s experiment in the room with the actual window. Because of the limit of the maximum luminance of the artificial skylight, the vertical illuminance at the eyes could not be set the same with that of the actual window he/she experienced. As results, the subjects were exposed to 211 lx of the vertical illuminance in median (226 lx in maximum, 156 lx in minimum) in the case with the artificial skylight and 291 lx of the vertical illuminance in median (1,609 lx in maximum, 283 lx in minimum) in the case with the LED panels.
The relationships between the vertical illuminance at the eyes and the subjective evaluation of discomfort glare during each task were analysed. There could be seen a tendency that GSV (Glare Sensation Vote, 0: just perceptible, 1: just acceptable, 2: just uncomfortable, 3: just intolerable) became higher with the higher vertical illuminance at the eyes. When the vertical illuminance was lower than 1,600 lx in median during reading task in the room with the actual window, more than half of the subjects did not sense glare. On the other hand, in the case with text typing task in the room with the actual window, GSV of some subjects became higher than 1.0 even in the case with under 100 lx of the vertical illuminance. There was no significant difference in glare sensation between the case with reading task and that with text typing task in the room with the artificial skylight and the LED panels.
4. Conclusions
Subjective experiment was carried out to identify the effects of the type of task and fluctuation in luminance of the source on discomfort glare. The experiment with the actual window resulted in higher GSV with text typing task than that with reading task. On the other hand, the experiment with the artificial window and that with the LED panels showed no significant difference in GSV between the types of task. There is a possibility that the subjects may be more sensitive to instantaneously high luminance when the line of sight faces the window.
CIE Session 2019 – Abstract Booklet
466

PO142
A NOVEL METHOD TO EVALUATE DYNAMIC LIGHTING ENVIRONMENT THAT MEASURES VISUAL AND NONVISUAL PERFORMANCE IN ARCHITECTURE SPACES
Mou, X.1,3, Mou, T.S.2 1 Smart and Health Lighting Research Center, Qingshan Lake, Zhejiang, CHINA
2 Zhejiang Sensing Optronics Co., Ltd, Hangzhou, Zhejiang, CHINA 3 Zhejiang SanTest Technology Co., Ltd, Deqing, Zhejiang, CHINA
Abstract
1. Motivation, specific objective
Light and lighting measurements have been out there since the era of Edison bulb. It provides a fair comparison between different products and technologies by quantifying the optical performance to determine its effectiveness in visual performance. In addition, in recent times, the light and lighting experts have continuously found the light contribution to human's non-visual functions such as circadian entrainment, mood regulation, and photobiological and photochemical effects to the retina. More and more lighting products have capabilities to change the lighting condition based on the user's preference. Due to that, the quantification of light and lighting becomes more challenging. In this paper, we focused on evaluating the lighting environment in an architectural space like a classroom or an open office, in which the lighting condition changes throughout the day to provide useful non-visual stimulus.
2. Methods
We proposed a portable measurement device that is able to collect the photometric data and spectral data over the usage of the space. A photometer and a spectroradiometer are equipped inside of this portable device to provide reliable results. Unlike conventional measurement, which the measure is less time sensitive, our method that locates the measurement equipment at the architecture space and quantified the visual and non-visual performance through the entire usage of the space. The measurement device was used to measure a school classroom and an open office with installed two different sets of the dynamic lighting systems.
3. Results
The uncertainty analyses were carried out, and a comparison between the conventional method and the proposed method was presented in the paper. The results showed the uncertainty was maintained in a controlled and precise way that the data can be useful to evaluate the lighting quality. Our method provides a better quantification on how dynamic lighting behaves. In addition, that our method provided more useful information on how human received the light stimulus from the environment.
4. Conclusions
The method provides a new way of thinking light and lighting methodology. It provided a starting point to consider the future of light measurement. The portable device can accurately measure the visual and non-visual performance of a dynamic lighting environment in a school classroom and an open office.
CIE Session 2019 – Abstract Booklet
467
PO143
CHINESE HIGH SCHOOL LIGHTING DESIGN TO IMPROVE STUDENT’S VISUAL AND NONVISUAL PERFORMANCE
Mou, X.1, Mou, T.S.2, Liu, S.1 1 Zhejiang Smart and Health Lighting Research Center, Qingshan Lake, CHINA
2 Zhejiang University, Hangzhou, CHINA
Abstract
In China, students spend long hours at their classrooms. Due to the lack of outdoor activities, the lighting environment in the classroom becomes very important to provide students with the right light at the right time. Due to the heavy school work, most students sleep less than 7 hours every night. Many students suffer from depression or anxiety due to lack of sleep. In addition, according to the National Visual Health Report claimed that the incidence of adolescent’s myopia in China has rapidly risen over the last ten years. Currently, more than 83% of high school students have myopia. The long hour of near work activities and the improper illumination causing eye fatigues have been appointed as the dominant factors to myopia. In this paper, we proposed a lighting design in the classroom that mainly uses area lighting fixtures that deliver diffusive, uniform, and efficient illumination to the classroom. In addition, the lighting condition is gradually changed throughout the day to mimic the behavior of daylight. The lighting was evaluated and quantified so that it satisfies the circadian entrainment, and optimized the light level and discomfort glare for visual performance. The spectrum, timing, and duration were carefully tailored such that it provides a dynamic lighting environment throughout the day to reduce student’s visual fatigue and improve their sleep quality. A short survey was collected from the students as a way to evaluate the design’s effectiveness.
CIE Session 2019 – Abstract Booklet
468

PO144
LIGHTING CONTROL USER INTERFACE STANDARDS
Nordman, B.1 1 Lawrence Berkeley National Laboratory, Berkeley, California, USA
Abstract
1. Motivation, specific objective
Human beings express their preferences for the quantity, type, and timing of light with lighting controls. To date, most controls have been relatively simple, but even with this, national differences such as how up and down map to on and off are common. Lighting controls are now starting to become much more complex with capabilities of LED sources to easily change their light output and communications technologies enabling easy use of these abilities. The likelihood of common mismatch between the light that the user wants and the light that the user gets will only rise.
In other domains of life, from vehicles to telecommunications to traffic, we use user interface standards to create a common language between humans and their environment. No such standard exists for lighting. This paper summarizes work over the past decade to create content suitable for an international standard on lighting control user interface elements.
Our goal is saving energy, but increasing user satisfaction with lighting is the means to that goal.
2. Methods
This effort drew on insights from creating an international standard for user interfaces for power control of electronics. This process included studying the relevant standards landscape, assessing products currently for sale, distilling out essential concepts to be represented, consulting with industry, and proposing a collection of content that works together to enable a simple but clear user experience for understanding devices and controlling them. That standard applies to product hardware, content on display screens, and documentation.
User interface elements are primarily symbols, but also include terms (to be translated to local languages), colours, metaphors, dynamic behaviour, and even auditory or haptic interaction. A given concept may map to several of these.
3. Results
We studied a variety of products currently for sale in the United States, plus a smaller number sold elsewhere. Our research identified key topic areas for lighting control as:
Lighting in General - the overall concept of lighting, for when other controls also present
Basic Switching - on/off control
Brightness - static control of light levels
Characteristics of Light - e.g. colour
Physical Mappings - e.g. that more light is up or to the right
Scheduling / timers - time-based control of light levels
Dynamic control - e.g. from occupancy or daylight sensors
Scenes - complex settings for collections of light sources
Other topics – e.g. window shades
For most of these, we identified some user interface content that had clear merit for a standard. This is primarily symbols, but also includes content for general principles, physical mappings, speech interfaces, and indicators. It mostly identifies existing symbols to use, but does propose new symbols for occupancy and for daylight sensing. For daylight, a new metaphor is proposed to replace colour temperature. Metaphor is critical in user interfaces as it enables content that crosses these types of interface elements and structures how humans think about and talk about the topic.
CIE Session 2019 – Abstract Booklet
469

We sought to address accessibility but were not able to identify any suitable content. Some topics such as colour selection and scenes did not seem amenable to standardization, at least at this time. A parallel document describes rationales for the decisions made in creating the proposed standard.
4. Conclusions
With our proposed standard content available, creating an international standard on lighting control user interfaces seems feasible and practical. The standard is not long. Such a standard should save energy, with economic and environmental advantages, as well as increase satisfaction with light and decrease frustration with confusing controls. The proposed content leaves plenty of room for manufacturers to innovate and differentiate their products and they are always free to deviate from the standard when it is worth doing so.
CIE Session 2019 – Abstract Booklet
470

PO145
FAÇADE DESIGN OPTIMIZATION BASED ON ENERGY USAGE, GLARE AND VIEW USING RADIANCE AND NEWHASP
Ohki, C.1, Okamoto, T.2, Tadaki, J.2, Ohga, H.1, Yoshizawa, N.2 1 Obayashi Corporation, Tokyo, JAPAN, 2 Tokyo University of Science, Noda, JAPAN
Abstract
1. Purpose
Daylight harvesting has recently attracted attention not only to save energy, but also to improve the health and comfort of people working in buildings. Although it is possible to reduce the amount of electric power usage used for luminaires by daylight harvesting, bringing daylight into interiors may increase solar heat gain at the same time, therefore it is necessary to comprehensively evaluate energy performance including thermal environment. In this research, we propose a method to make its evaluation by using light environment simulation program Radiance and thermal load simulation program NewHASP/ACLD.
NewHASP/ACLD was developed by SHASE (the Society of Heating, Air Conditioning and Sanitary Engineers of Japan) in 2004, and is now widely used in academic research and design practice in Japan. It has original functions to estimate the effect of daylight harvesting, but its algorithm is simple and cannot take into consideration the complex daylighting control systems. Integrated simulation using Radiance and EnergyPlus /TRNSYS has being developed, whereas no studies have ever been conducted on the integration between Radiance and NewHASP/ACLD.
Therefore, we developed a new “Meta_Simulation platform”, to calculate energy performance due to daylight harvesting by putting together Radiance and NewHASP/ACLD. And we made it also possible to evaluate the energy usage, glare and view of the room with window systems consisting of various outside sun shading devices and inside sun shading devices. In this paper, we report a parametric study on the window system that consisting of the vertical louver as the outside sun shading devices and the Venetian blind as the inside sun shading devices.
2. Evaluation Methods
2.1 Energy evaluation
2.1.1 Thermal load calculation of outside sun shading devices
In this research, in order to obtain the solar heat gain from windows by using Radiance, we divided the solar heat gain acquisition into three parts, which are direct solar radiation, diffuse solar radiation and diffuse solar radiation reflected by the ground and the outside sun shading devises.
For the calculation of the direct solar radiation, the sunlit area ratio which judged from the illuminance from the sun on the window obtained by Radiance was used. For the calculation of the diffuse solar radiation by skylight, we used the illuminance from the skylight obtained by Radiance. For the calculation of the diffuse solar radiation by the ground and the outside sun shading devises, we used the illuminance from the ground and the outside sun shading devises obtained by Radiance.
Through the proposed method, the diffuse solar radiation of the reflected light from the outside sun shading devices can be correctly calculated, which could not be considered in the conventional NewHASP.
2.1.2 Thermal load calculation of inside sun shading devices (Venetian blinds)
Firstly, we used Radiance to calculate the reflectance (ρ) and transmittance (τ) of the blind surface when the profile angle (φ) and the blind slat angle (θ) were changed. Next, we created the function of the reflectance ρ (φ, θ) and transmittance τ (φ, θ), and incorporated it into the NewHASP blind optical property model. Using this model, the solar heat gain from the window with various blinds such as slat cut-off angles control was accurately calculated.
CIE Session 2019 – Abstract Booklet
471

2.1.3 Calculation of lighting and air conditioning energy
Lighting energy usage can be obtained from lighting dimming levels calculated by Radiance. In consideration of daylight and the influence of artificial lighting from the surrounding lighting dimming zone, the illumination dimming levels which is sensed by the illuminance sensor for each dimming zone was obtained. The dimming levels were also used for calculation of lighting heat gain at NewHASP.
Air conditioning energy usage was calculated by dividing the thermal load of NewHASP by the COP (Coefficient Of Performance), corrected by the input / output ratio of outside and room temperature.
2.2 Glare evaluation
For the visual comfort of people working in the office, we used PGSVsat and simplified DGP to evaluate daylight glare. PGSV (Predicted Glare Sensation Vote) is the index for the window in the open plan office, and PGSVsat is used when the window is large and the background brightness is high. DGP (Daylight Glare Probability) represents the proportion of people who feel uncomfortable with the glare of daylight, and simplified DGP is suitable for the evaluation of facades and shadings. PGSVsat and simplified DGP can be evaluated by the vertical illuminance of the viewpoint (average luminance of windows in the field of view). In this research, we evaluated them at the centre of the room as a representative value.
2.3 View evaluation
In order to consider comfort, we also added an evaluation of view from the window. Using the Radiance's rtrace command, it was judged that the ray emitted from a certain viewpoint hit either the sky, the ground or the shadings. And the ratio of rays that penetrated to the sky through the shadings was used as an indicator of the view quality. As a representative value, we evaluated the view quality from the centre of the room.
3. Parametric Study of Energy, Glare and View
As a case study using the simulation developed in this research, we evaluated the energy usage, glare, and view of an office of 80 m2 with a vertical louver and Venetian blind in a full-height window facing south. The parametric tool Grasshopper and the optimization plugin OCTOPUS were used for multi-purpose optimization. Varying the angle of the vertical louver, the energy usage, glare and view could be optimized. The venetian blind angle was fixed.
4. Conclusion
In this research, we evaluated the lighting and air conditioning energy that combined the inside and the outside sun shading devices using the Meta_Simulation platform that combines the light environment simulation program Radiance and the thermal load simulation program NewHASP. And we obtained the angle of the outside sun shading devices that achieves both energy saving and comfort through a multi-objective optimization case study including glare and view evaluation.
CIE Session 2019 – Abstract Booklet
472

PO146
CASE STUDIES OF A THREE-DIMENSIONAL EXPRESSION OF COLOURED LIGHT FLOW USING VOLUME PHOTON MAPPING
Okamoto, T.1, Schregle, R.2, Yosizawa, N.1 1 Tokyo University of Science, Tokyo, JAPAN, 2 Floating Point Research, Horw, SWITZERLAND
[email protected] / [email protected]
Abstract
1. Motivation, specific objective
Considering the light distribution in an interior space is an important aspect in the process of architectural design. In most settings, the surface-bound illuminance/luminance distribution provides general cues describing the lighting environment. However, visualising the flow of light in three-dimensional space, similarly to thermal air-flow, can guide designers by providing an overview of the light field which surrounds people in the space, thus promoting advances in human centred lighting design. This visualisation can be effectively reinforced by complementing it with colour information, indicating the spectral interaction of the light with the space (e.g. colour bleeding from walls).
In this paper, we will propose a new method to depict the coloured light flow using the volume photon mapping algorithm and report the application results of this method for two case studies: the “Kimbell Art Museum” designed by architect Louis. I. Kahn, and the “Villa Müller” by Adolf Loos.
2. Methods
Photon mapping is a Monte-Carlo raytracing algorithm for global illumination consisting two passes: the first pass emits packets of energy called photons from the light sources via forward raytracing and stores them in the photon map when they hit surfaces within the scene. Each photon is characterised by its hit point position and energy (Luminant or radiant flux). After generating the photon map data structure, the final image is rendered using a standard backward raytracing algorithm that performs a nearest-neighbour lookup for photons around the area of interest; the illuminance is then proportional to the local photon density, as each photon contributes a fraction of the flux distributed throughout in the scene.
Although photon mapping is technically decoupled from the scene geometry, it is generally used in a surface-bound context; photons are deposited on the surfaces they hit, and the reconstructed illuminance is only valid for surface points. In contrast, the proposed method in this paper captures photons in three-dimensional space as they are emitted from the light sources by simulating their interaction with a participating medium between the surfaces in the room. This results in an efficient and intuitive representation of the three-dimensional light flow.
The proposed method uses the volume photon mapping extension and “mist” participating medium material implemented in the RADIANCE rendering and lighting simulation system. The RADIANCE photon mapping module was first developed by R. Schregle in 2002 and supports H. W. Jensen's volume photon map originally published in 1998.
In a first step, the entire model is enveloped with a “mist” material with a Henyey-Greenstein scattering eccentricity of g=1, implying forward scattering to prevent modifying the photon paths. The prepared scene is then passed to the volume photon tracing tool, which records each photon's position and flux colour as it interacts with the participating medium in the space. Thereafter, these data are extracted from the photon map, written in the point cloud data format, and finally displayed as point clouds using a three-dimensional modelling tool such as Autodesk’s ReCap or Revit, etc. The local point density and individual colour information convey and impression of the light flow in the simulated space, taking into account reflections from coloured surfaces.
3. Results
We applied this method to visualize the light distribution in the Kimbell Art Museum and the Villa Müller. The light flow in the Kimbell Art Museum can demonstrate that the skylights and spotlights play clearly distinct roles, i.e. the former mostly reach the ceiling throughout the day and admit spatial brightness into the gallery, while the paintings on the walls are mainly illuminated by the latter artificial lights. The Villa Müller is famous for its design concept “Raumplan”, which is a three-dimensional planning
CIE Session 2019 – Abstract Booklet
473

method that departs from traditional two-dimensional floor plans. This house has various coloured rooms with lots of openings at different levels, and these interconnected continual spaces provide a unique experience to visitors. The coloured light flow depicted by photons can reveal a latent depiction of the light distribution in the buildings. For example, white light entering a room with a brown floor and ceiling acquires a faint red tint that bleeds onto the white walls significantly affecting their perceived appearance.
4. Conclusions and future works
The three-dimensional expression of coloured light flow using volume photon mapping proposed in this paper could show the light characteristics in the buildings in a novel way, and architects or lighting designers could use it when they would like to assess the effects of skylights and fenestrations in combination with artificial lighting in their initial design stage using lighting simulation programmes. In future research, the relationship between this light flow expression and the physical/visual light field should be clarified in terms of an objective/subjective evaluation.
CIE Session 2019 – Abstract Booklet
474
PO147
PREFERABLE LIGHTING FOR APPEARANCE OF WOMEN’S FACIAL SKIN
Okuda, S.1, OKAJIMA, K.2 1 Doshisha Women’s College of Liberal Arts, Kyoto, JAPAN
2 Yokohama National University, Yokohama, JAPAN
Abstract
1. Introduction
The appearance of skin is extremely important for women and various products that improve the skin condition. However, the appearance of the facial skin depends on the lighting as well as the cosmetics, such as foundation, lip and cheek because the perceived colour affects the visual evaluation. To reveal the preferable lighting condition on the appearance of woman’s facial skin, we conducted an experiment on the appearance of woman’s face with and without make-up under some lighting conditions with several kinds of correlated colour temperature (CCT) and the distance to the blackbody locus (duv).
2. Methods
First, we set 20 kinds of lighting conditions with four levels of CCT (3000K, 4000K, 5000K, 6700K) and 5 kinds of duv (-0.010, -0.005, 0, +0.005, +0.010) in each CCT condition, using 6 RGB LED lamps [iColor Cove MX Powercore, Philips Color Kinetics] and 10 white LED lamps [iW CoveMX Powercore, Philips Color Kinetics] with 3 kinds of LED in different correlated colour temperature. Additionally, some kinds of colour rendition characteristic of each lighting condition were calculated: Ra (CIE CRI), R15 (for Japanese complexion, JIS), Rf (CIE 224) and PS (Preference Index of Japanese complexion).
Secondly, we asked a female university student for a model as the visual object. She was 22 years old and her facial skin colour with cosmetic foundation was almost the same as the average of Japanese women’s facial skin colours with cosmetic foundation in 2011. We prepared three patterns of facial skin without makeup, with “natural” makeup in orange lipstick and orange brusher and with “cute” makeup in pink.
Participants observed the lower half of the model’s face, especially the lower cheeks, and evaluated “naturalness,” “activity,” “sophistication” and “preference” with a numerical scale from -10 (bad) to +10 (good). Fifteen females in their twenties participated, and all had normal colour vision.
3. Results
The evaluations of “naturalness,” “sophistication” and “preference” were relatively high under the lighting conditions of 4000K and 5000K in duv=-0.005 but were relatively low under the lightings of 3000K in all types of facial skin. On the other hand, the “activity” was quite high under the lighting conditions of 3000K whereas the facial skin under 6700K lighting looks inactive. The lighting conditions in duv=+0.01 were relatively low in all types of facial skin. As compared with the patterns of facial skin, the evaluations of facial skin without make -up were similar to those of facial skin with “natural” make-up. Moreover, there was a correlation between naturalness, sophistication and preference of all types of facial skin and Rf (CIE-224). In contrast, the evaluations of activity of facial skin without make-up and with “natural” make-up were correlated with PS.
We analyzed these evaluation data by using a multiple regression; “preference” was used as the response variable, and “naturalness,” “activity” and “sophistication” were used as the explanatory variables. As a result, it was derived that the standardized partial regression coefficient of “sophistication” was 0.663, that of “naturalness” was 0.282, and that of “activity” was 0.128. This suggests that the contribution of “sophistication” is much higher than that of “naturalness” or “activity” in “preference” evaluation.
4. Conclusions
CIE Session 2019 – Abstract Booklet
475

Facial skin without make-up and with “natural” make-up look good under 4000K and 5000K in negative duv, and facial skin of all types looks active under 3000K. In addition, the evaluations of naturalness, sophistication and preference are correlated with Rf whereas the evaluations of activity are correlated with PS.
*This study was supported by JSPS KAKENHI Grant Number 17H01947.
CIE Session 2019 – Abstract Booklet
476

PO148
A STUDY ON THE APPROPRIATE CONTRAST OF LUMINANCE BETWEEN PAINTINGS AND WALL SURFACES IN MUSEUMS
Shimizu, Y.1, Muto, S.1, Yoshizawa, N.1 1 Tokyo University of Science, Chiba, JAPAN
Abstract
1. Backgrounds and Purposes
Current guidelines for the museum lighting prescribe the appropriate range of illuminance on the exhibits. The CIE standard (CIE 157:2004) categorizes the responsiveness of the exhibited material to light and sets a limit on the Illuminance for each category. This recommended value is important to reduce the damage to paintings while balancing the conservation and exhibition. On the other hand, the brightness of the paintings on the wall is determined by the luminance distribution, thus it is desirable to execute luminance-based design even for the museum lighting. In recent years, with the development and popularization of the simulation technologies and low-priced luminance measurement systems, it could be said that it has gradually become possible to introduce new design method even in the museums. By considering the appropriate luminance contrast by which the painting appears brighter, there is a possibility that illuminance on the painting could be reduced and lower the damage to the painting. The purpose of this study is to achieve the best light environment with the minimum illuminance on paintings by controlling the contrast of luminance between paintings and wall surfaces in museums.
2. Experiment Methods
In this research, a subjective experiment was conducted, and the subjects evaluated the appearance and brightness of oil paintings and the appropriateness of the luminance ratio (luminance of the painting divided by the surrounding luminance).
The experimental room measured 3000mm in width, 3000mm in depth and 2400mm in height. Four oil paintings were used in this experiment. “Red Mt.Fuji” has a reflectance of 7.3%, “La Transfiguration” has a reflectance of 15.7%, “Lake Como” shows colourful scenery and has a reflectance of 26.7%, and “The northern Japanese alps” is the image of snow mountains in Japan and has a reflectance of 37.2%. The size of all the paintings is 530mm wide × 455mm height. Walls with three kind of lightness, N2, N5 and N8, were prepared in this experiment to verify the effect of the lightness of the background.
A LED spotlight (blue-phosphor white LEDs, Ra : 97, CCT : 3000K, duv : -0.005 ) was trimmed off to illuminate only the painting. Ambient lightings (purple-phosphor white LEDs, Ra > 93, CCT : 3000K, duv <± 0.005) were installed in the high-sidelight position. Illuminance on the painting had three levels (200 lux, 100 lux, 50 lux) and luminance ratio was set to be ten levels (1/3, 1/1.5, 1, 1.5, 3, 4.5, 6, 10, 12.5, 15) by dimming the LED spotlight and ambient lightings. There were 159 experimental conditions in all.
25 university students, aged 21-25 with normal colour vision, participated the experiment. Subjects evaluated the appearance of the painting and the preference for the luminance ratio with 9-point bipolar scales. The experimental conditions were presented in random order for each participant.
3. Results and Conclusions
The results of the experiment are as follows; In all the evaluation items of the paintings, there was a tendency that the evaluation got higher as the luminance ratio increased. In addition, there was also a tendency that the difference on the evaluation under various illuminance on the painting became smaller when the luminance ratio was increased. This tendency was particularly clear as to the visibility of the paintings in most experimental conditions
In the case of the paintings except “Red Mt.Fuji”, there were certain differences in the appearance evaluation among various illuminances on the paintings when the luminance ratio was low. However, as to the “Red Mt.Fuji" which had the lowest reflectance among the paintings in the experiment, illuminance variation on the painting had no clear influence on the appearance. It indicates that, for some paintings with low reflectance, there is a possibility that the appearance evaluation keeps
CIE Session 2019 – Abstract Booklet
477

constant even if the illuminance on the painting is lowered. In future work, we will also analyze the relationship between the preferable appearance of paintings and the luminance ratio.
CIE Session 2019 – Abstract Booklet
478

PO149
OFFICE WORKER’S SATISFACTION WITH LIGHTING
Van Duijnhoven, J.1, Makaremi, N.2, Pisello, A.L.2, Kort, H.S.M.1 1 Eindhoven University of Technology, Eindhoven, THE NETHERLANDS, 2 University of Perugia,
Perugia, ITALY
Abstract
1. Motivation, specific objective
Office lighting influences the human performance of an office worker via three pathways. Firstly, the amount and type of light directly influences visual performance and through task performance indirectly human performance. Secondly, lighting conditions, over time, influence human performance via the circadian timing system. And lastly, lighting indirectly impacts human performance through mood and motivation. It is not only essential to know which aspects of office lighting influence the office workers’ needs but also which aspects influence their satisfaction with office lighting.
The current paper focuses on overall satisfaction with lighting. The objective was to identify lighting parameters which relate to the overall satisfaction with lighting in a cross-country field study, based on subjective data. A second objective is to check whether these identifiers for overall satisfaction with lighting differ between the two countries.
2. Methods
Two field studies were performed, one in the Netherlands in May 2016 and one in Central-Italy in June 2018. Office Lighting Surveys (OLS, developed by Eklund and Boyce) were distributed amongst 46 Dutch and 32 Italian office workers. The OLS was separated into four categories: (1) the general statements and questions regarding (2) attributes, (3) tasks, or (4) glare. In the Dutch field study, the participants were asked to complete the OLS at the end of their workday for 5 consecutive days (resulting in 113 completed questionnaires) whereas the Italians were only asked once (resulting in 32 completed questionnaires). The Dutch office workers were working in office landscapes and the Italian office workers worked in private offices (3-5 persons). Therefore, both studies were separately analysed and compared to each other.
The data was statistically analysed by determined correlation coefficients (i.e., Kendall’s correlation coefficients τ were calculated using IBM SPSS Statistics 23) between lighting descriptors (within the OLS) and the office worker’s overall satisfaction with lighting. The significance level of 0.05 was used to identify statistical significance.
3. Results
In the Dutch field study, self-reported general health was also included in the surveys (on a five-point scale from (1) excellent to (5) poor) and it was found to significantly correlate with overall satisfaction with lighting (τ=0.398, p=.000).
The results from the OLS were analysed per subcategory (1-4, as mentioned in the methods section).
Firstly, in both studies, a significant correlation was found between the overall satisfaction with lighting and the statements 1, 3, and 4 (S1: Overall the lighting is comfortable (τNL=0.740, τIT=0.465), S3: The lighting is uncomfortably dim for the tasks that I perform (τNL=-0.250, τIT=-0.597), S4: The lighting is poorly distributed here (τNL=-0.481, τIT=-0.520)). In addition, in the Dutch study, statements 2, 6 and 7 (S2: The lighting is uncomfortable bright for the tasks that I perform (τNL=-0.672), S6: Reflections from the light fixtures hinder my work (τNL=-0.394), and S7: The light fixtures are too bright (τNL=-0.515)) also significantly correlated with the overall satisfaction with lighting whereas in the Italian study only statement 5 did (S5: The lighting causes deep shadow (τIT=-0.562)).
Secondly, all three attributes (electrical lighting, brightness of the lights, and glare from the lights) significantly correlated with overall satisfaction with lighting according to the Dutch dataset (respectively τNL=-0.557, τNL=-0.356, and τNL=-0.367). According to the Italian office workers only the attribute electrical lighting significantly correlated with overall satisfaction with lighting (τIT=-0.369).
CIE Session 2019 – Abstract Booklet
479
Thirdly, in both countries, the evaluations of the office lighting conditions regarding all work tasks (e.g., writing on paper or using the computer) significantly correlated with the overall satisfaction with lighting (all τ values between 0.181 and 0.580).
Lastly, all glare cases were found to significantly correlate with overall satisfaction with lighting according to the Dutch office workers (all τ values between 0.290 and 0.454). In contrast, none of the glare cases were found to significantly correlate with the satisfaction with lighting of the Italian office workers.
4. Discussion and conclusion
In both field studies, the OLS results demonstrated that the light aspects ‘illuminance’ and ‘uniformity’ are of high importance. In addition, the significant correlation between overall satisfaction with lighting and the evaluations of the lighting conditions for all work tasks highlights that lighting conditions need to be checked for every work task.
In the Dutch field study, glare cases were found to influence the overall satisfaction of office workers whereas in the Italian study this link was not found. This discrepancy between the two studies may be explained by the fact that 90% of the Italian office workers filled in that they experienced glare as ‘not at all bothersome’, ‘not very bothersome’, or ‘fairly bothersome’. Glare experience may be influenced by the office configurations. In office landscapes, it is less easy to adjust the position and orientation of the desk according to individual preferences. In private offices this is easier and this may explain lower glare experiences in the Italian offices.
A limitation for the comparison of overall satisfaction with lighting between both field studies is the absence of objective light measurements. On one hand, it may be that the office lighting conditions were more in accordance to the recommendations (e.g., EN-12464). On the other hand, it may be that the Italian office workers were less bothered by high luminances (or luminance differences) because they were more used to it. Field studies including both subjective and objective measurements related to satisfaction with lighting are topic for further research.
Nevertheless, the large number of correlations between lighting parameters and overall satisfaction with lighting demonstrated that satisfaction with lighting includes multiple light aspects (e.g., illuminance or uniformity). This is in accordance to what the CIE proposed in their research roadmap for healthful interior lighting applications: describing the total lit environment and not individual elements within it. In addition, the significant correlation between overall satisfaction with lighting and self-reported general health recommends to not only look at individual’s needs but also to take into account individual’s preferences.
CIE Session 2019 – Abstract Booklet
480
PO150
ROBUST UNIFIED GLARE RATING EVALUATION FOR REAL LIGHTING INSTALLATIONS
Vissenberg, M.C.J.M., de Vries, A., Wouters, M.C.H.M., Yilmaz, C. Signify, Eindhoven, THE NETHERLANDS
Abstract
1. Motivation, specific objective
In 1995, CIE adopted the unified glare rating (UGR) to evaluate discomfort glare of indoor lighting installations. Meanwhile, the UGR has become a part of indoor workplace lighting standards around the world, like the European workplace standard EN12464-1. These standards employ the so-called tabular method of the UGR to ensure an ‘apples to apples’ comparison and provide an ‘average’ UGR value indicative of what one may expect in the actual installation. To achieve this average UGR value, an unrealistic high luminaire density is applied (luminaire spacing to height ratio of 0.25, which is typically a spacing of 0.5 m or less) to average out the variation in UGR that occur with small displacement of the observer. Aside from this averaged UGR value, an indication of the magnitude of these variations with observer position is provided in the bottom part of the UGR table.
This unrealistic spacing, in combination with the large number of boundary conditions of the UGR tabular method (rectangular luminaire distributions in rectangular spaces with specific room surface reflectance values and specific observer positions and observer viewing directions) have caused many discussions over the years leading to a tendency for designers to look at a ‘point-by-point’ type of calculation as a solution.
While considered cumbersome in 1995, such calculations are increasingly more popular nowadays because software packages can easily calculate the lighting conditions in any space. A drawback of this method is that the resulting UGR value is very sensitive to observer position and cannot be directly linked to the limiting values of the workplace standards, which are related to the averaged UGR values.
There is a need to have a UGR calculation methodology for any real lighting installation that produces robust values that are not sensitive to small variations in observer position, such that the outcome may be related to the workplace standards.
2. Methods
We propose an averaging method to calculate a robust UGR value for any lighting installation that is not resembling the ‘rectangular world’ of the tabular method. The method averages over small variations in observer position, similarly to the averaging done in the tabular method.
We compare two averaging methods:
1. “naïve” averaging of “local” UGR values that are calculated at an array of observer positions within an area defined by the luminaire spacing.
2. Averaging the luminance ratio’s at observer positions within an area defined by the luminaire spacing and calculate the UGR value related to that average luminance ratio.
These two methods are compared in a standard rectangular space of the tabular method, but with a more realistic, wider luminaire spacing. Two luminaires are compared, a luminaire with a sharp intensity cut-off that causes large variations in the local UGR value and a luminaire with a smoother intensity variation.
3. Results
The naïve averaging gives answers that cannot be compared to the average UGR values of the tabular method. The second method is shown to be mathematically identical to the averaging that is performed by the small spacing to height ratio of 0.25 (but now with a typical luminaire spacing). Without averaging, the variation in UGR value with observer position can be quite large, even for the luminaires with a smooth intensity distribution.
CIE Session 2019 – Abstract Booklet
481

4. Conclusions
An averaging method is proposed that enables a robust UGR calculation for any real indoor lighting installation, i.e. much more flexible that the tabular method that is limited to rectangular spaces with rectangular luminaire layouts of a single type. The method provides UGR values that may be compared to the limiting values of workplace lighting standards.
CIE Session 2019 – Abstract Booklet
482

PO151
BUILDING INFORMATION MODELING BASED ARCHITECTURAL LIGHT EMITTING DIODE LIGHTING DESIGN: A PROPOSAL
Wang, A.Y., Wang, L.X., Wang, C. School of Architecture, Tianjin University, Tianjin, CHINA
Abstract
1. Motivation, specific objective
Building information modeling (BIM) technology is a vital innovation in the field of Construction Engineering. With the powerful digital technology, most of the information related to the building was
involved including architecture, building structure, Heating, Ventilation and Air Conditioning(HVAC),
electricity, water supply and drainage system, etc. At the same time, the information may cover the whole life cycle of a building project from planning, design, construction, operation even to abandonment. This technology may seem complex and costly, but BIM can greatly improve efficiency, especially in the field of architecture design and construction management. So the BIM technology is becoming popular all over the world. As a part of architectural design, architectural lighting naturally should be involved in the application of BIM technology.
Light emitting diode (LED) was considered to be one of the most feasible future light source. Its features of high efficiency and small size cause the possible of the integration of light source and architecture. LED light sources are no longer existent independently, but combined with building components, such as acoustic components, or HVAC components and so on. The integration was defined to be architectural LED lighting, which may not only lead to more comfortable lighting environment but also work more efficiently.
In order to realize the idea of architectural LED lighting in the future, the BIM technology was took into consideration. Actually the former may become a new part of the BIM of a building. But at the same time the following things should be accomplished in BIM system, including:
(1) To define components which can be integrated with LED lighting;
(2) To gather Information carried by integration components;
(3) To cooperate with the whole BIM system;
(4) To guarantee the lighting efficiency and performance.
2. Methods
All the problem may be resolved by a series of software as following:
(1) To establish relevant LED light source database with the interface of BIM software, which includes not only the geometric size of light source (or illuminance), but also all optical information related to lighting, such as light intensity and distribution.
(2) To call the information from the BIM system with the software to calculate the possibility of integration between building components and LED light sources.
(3) To Program software to realize the functions of architectural LED lighting design, calculation, visualization etc.
(4) To evaluate the visual comfortability, health condition and energy consumption of the architectural LED light environment.
(5) To feed back the evaluation outcome to adjust the architectural lighting design until the best result was achieved.
3. Results
As a result, the implementation of BIM technology in architectural LED lighting may cause a development of architecture llighting. Light source may not expose to users, just like a wall means to people. In this case, the lighting environment should be more comfortable, healthy and efficacy.
CIE Session 2019 – Abstract Booklet
483

Furthermore, the BIM technology applied in LED architectural lighting design may improve the efficiency of design, operation and management work.
4. Conclusions
There were a lot of detail work to do in this research. Anyway, the BIM technology applied in LED architectural lighting design may promise to achieve the ideal lighting environment. It probably will become a trend in the field of lighting in the future.
CIE Session 2019 – Abstract Booklet
484
PO152
THE STUDY OF LED LIGHTING DAMAGE TO PAPER RELICS
Wang, Lei 1 Architectural Research Institute of Tsinghua University, Beijing, CHINA
Abstract
1. Motivation, specific objective
Protection of light-responsive paper relics is one crucial concern for lighting design of archives and museums. According to previous researches, duration of exposure, irradiance, spectral power distribution of incident radiation and action spectrum of receiving material are four main factors to determine the levels of photochemical action which would cause irreversible damage to fragile paper relics.
Materials are classified into four categories in accordance with responsivity to visible light in CIE157:2004. Paper, out of medium responsivity category, its threshold for illuminance is 50lx and annual exposure is 150000lx h/y, which was based on the colour change, one of the indications of photochemical action. In regards to paper inspection, compare with colour change, tensile strength and internal tearing resistance are two stronger indicators to reflect paper strength in terms of accuracy. Furthermore, most of the researches were based on traditional light sources. However, LED is wildly applied in museums currently due to its UV and IR free.
2. Methods
In order to quantify paper damage from LED in visible spectrum, paper samples were exposed to four LED lamps with peak wavelength of 410nm, 454nm, 519nm and 628nm in average horizontal illuminance of 50lx. Paper colour, tensile strength and internal tearing resistance were tested with exposure duration of 100h, 150h, 300h, 450h and 600h. Compare with original samples, damage of photochemical action can be defined. In addition, paper samples were also exposed to LED lamps with peak wavelength of 410nm and 628nm in average horizontal illuminance of 3000lx as another ageing test. All samples were scanned by electron microscope.
3. Results
This study showed that for samples with duration of 600h, although paper colour had no change, the parameters of tensile strength and internal tearing resistance decreased obviously. The electron microscope images showed that the fibers of samples with low tensile strength and internal tearing resistance were observed with broken edges.
4. Conclusions
In conclusion, this study provides a revised exposure threshold in consideration of two additional paper damage indicators, tensile strength and internal tearing resistance. In order to enhance protection of paper relics, definition of white LED spectrum for archives and museums is provided to lighting designers according to experiment data in this study.
CIE Session 2019 – Abstract Booklet
485
PO153
COMFORT SUBJECTIVE EVALUATION OF DIFFERENT READING MEDIUM UNDER THE ILLUMINATION ENVIRONMENT IN LIBRARY READING ROOM
Tongyao Wu, Zilong Feng, Lixiong Wang Tianjin University,Tianjin 300072, CHINA
ABSTRACT
VDT (Visual Display Terminal) equipment such as computer, mobile phone and tablet has become an important reading tools in library reading room. in the library reading room lighting conditions. the study of reading comfort by different type VDT work can effectively improve lighting quality, improve the reading efficiency, and provide the basic supporting for lighting design.
In this paper, the influence law of reading comfort by different reading tools in the library, the importance coefficient of influencing factors and the comfort prediction model can be concluded through study methods such as library research, subjective evaluation experiment, experiment data analysis, XG Boost machine learning algorithm. It is concluded that in the general reading room of the library, the importance coefficients of different influencing factors are ranked as follows: brightness of reading background (0.24), reading tools (0.20), relevant colour temperature (0.20), lighting mode (0.15), illuminance (0.13), reflection coefficient of reading background (0.08). The background brightness of reading surface has the most significant influence on reading comfort. The influence of illumination on the comfort of VDT reading and paper reading is obviously different. The light source which the colour temperature is 4000k-5000k is conducive to improve both the VDT reading comfort and paper reading comfort. The desktop with low reflection coefficient is conducive to improve both the VDT reading comfort and paper reading comfort. In low illumination environment, the adoption of mixed lighting is conducive to improve both the VDT reading comfort and paper reading comfort. the best lighting environment for VDT reading comfort and traditional paper reading comfort has a significant difference.
According to the influence law and comfort prediction model, the lighting design in today’s library can be optimized to provide a more comfortable lighting environment for different kinds of readings.
CIE Session 2019 – Abstract Booklet
486

PO154
DEVELOPMENT OF GENERIC COLORIMETRY SYSTEM FOR EVALUATION OF LIGHTING ENVIRONMENT
Yamaguchi, H. 1, Takasugi, K. 2, Sakurai, M. 3, Kato, M. 4, Hara, N. 5 1 National Institute for Land and Infrastructure Management, Tsukuba, JAPAN,
2 Kanazawa University, Kanazawa, JAPAN, 3 Shizuoka Institute of Science and Technology, Fukuroi, JAPAN, 4 Nihon University, Narashino, JAPAN, 5 Kansai University, Suita, JAPAN
Abstract
1. Motivation, specific objective
It is important to further develop and disseminate energy conservation design methods in recent years. Further improvement of energy conservation performance of buildings is required. On the other hand, comfort of the visual environment must also be adequately guaranteed. Evaluation method of the comfort of the visual environment, such as the spatial brightness and glare, have been studied, and estimation methods of visual comfort are being developed. To evaluate the spatial brightness or glare for the real environment, the luminance distribution of the field of view is required, and image photometry method is usually used to obtain the luminance distribution. But it takes a lot of time to build up the measuring system. To build up the system, knowledge of image processing and hardware control is necessary. Especially, to acquire the skill of hardware control takes a lot of time for researchers or designers who want to evaluate light environment. The important issue for researchers or designers is to reveal the relationship between the luminance distribution and the light environment assessment. It is a waste of time for individual researchers and designers to independently develop measurement systems. In order to develop lighting design method based on the comfort of the visual environment, it is necessary to have a luminance and chromaticity distribution measurement tool which is versatile and easy to construct the system. Therefore, we developed a measurement system for luminance and chromaticity distribution of field of view using arbitrary digital camera. In this paper, we examined the algorism to convert digital camera image into the CIEXYZ tristimulus values and confirmed the photometric accuracy.
2. Methods
The measurement system consists of any commercially available digital single lens reflex camera and PC. The measurement system consists of three functions: image shooting, image development, and image conversion to colorimetric value. The image shooting function is to control camera device with the external software (gPhoto2) so that it can shoot with any camera. Thus, it is possible to us to construct a system with various cameras. The image development function is also linked with external software (dcraw) so that raw data of an arbitrary camera can be converted into an uncompressed RGB value image (tiff format). The image conversion from the uncompressed RGB value image to the luminance and chromaticity value image is the same as the method used for general image photometry. That is, the XYZ tristimulus values of each pixels are converted by that the RGB values multiply 3x3 matrix. To get a conversion 3x3 matrix easily, the RGB values of each pixels are linearly varied with photometric values in our system. By creating an interface that combines these functions into one, we have constructed a measurement system compatible with arbitrary digital cameras. The most important point when set up this measurement system is calibration to find the conversion matrix. The conversion matrix is obtained by acquiring an image of a colour chart, such as Macbeth colour checker, whose XYZ value is known and comparing it with the RGB value.
3. Results and Conclusions
Measurement accuracy was confirmed for multiple models of cameras. Measurement error may be up to about 10% error, but we believe that it is a reasonable measurement result as a hardware-free system. As described above, it becomes possible to construct a photometric system compatible with arbitrary cameras easily, and it is expected that progress of research and development on the comfort evaluation of the visual environment.
CIE Session 2019 – Abstract Booklet
487

PO155
A PRELIMINARY EXPLORATION OF DYNAMIC DAYLIGHTING SIMULATION IN CHINESE TRADITIONAL ARCHITECTURE WITH WINDOW PAPER
Yao, Y.1, Zhang, X.1 1 Tsinghua University, Beijing, CHINA
Abstract
1. Motivation, specific objective
Paper was widely used on windows in Eastern countries before glass was introduced. Goryeo (the old name of Korea) paper was one of the most used paper types both in royal palaces and among ordinary people in China. Compared with conventional specular glazing, window paper can create a more uniform interior light environment, but we don’t know the specific daylighting performance of window paper. Moreover, this study may show us a real interior light environment of Chinese traditional architecture in the past, which would help in ancient architecture reservation, historical exhibition design and development of diffused glazing.
2. Methods
An annual climate-based dynamic daylighting simulation is conducted with DIVA 4.0 for Rhinoceros, using the Chinese Standard Weather Data (CSWD) typical year weather data of Beijing obtained from Energyplus. There are 5 simulation conditions with 5 different kinds of materials applied on windows, defined with a Radiance BRTDf (Bidirectional Reflectance and Transmittance Distribution Function) material:
(1) Single layer of Goryeo paper (made in China);
(2) Double layer of Goryeo paper pasted manually (made in China);
(3) Double layer of Goryeo paper pasted by machine (made in China);
(4) Single layer of Shoji paper (made in Japan);
(5) Single pane clear glazing of 90% transmittance.
Of all the materials used in the simulation, the 4 kinds of paper have to be measured to get the real optical parameters. With the approach of spectrophotometer and integrating sphere (with specular port), the measurement is conducted in the range of visible spectrum at a wavelength resolution of 5nm, including 8 parameters each wavelength. On the front, there are direct-hemisphere reflectance (total reflectance, Rt), diffuse reflectance (Rd), direct-hemisphere transmittance (total transmittance, Tt) and diffuse transmittance (Td); and the back side is the same as the front.
Bidirectional Scattering Distribution Function (BSDF) method is also used to study the light scattering and distribution properties of the paper, by measuring angular dependent scattering data in goniophotometer approach. Measurements are made on Klems basis in .xml format, and the results can be presented in BSDFViewer. BSDF is a more accurate way to define the optical properties of a material than BRTDf, but the BSDF material definition in Radiance doesn’t support climate-based dynamic simulation.
The simulation is conducted in a model of a Chinese traditional residence in Beijing called Siheyuan, which contains 4 main houses facing south, north, east and west respectively. The calculation planes are set on 7 surfaces in each house, including a working plane 750mm above the floor, and other 6 inner surfaces, among which the ceiling is set on a plane as high as the column instead of the original slope surface. Some dynamic lighting data is showen in the results to compare the daylighting characteristics of 5 conditions. And the annual Daylight Glare Probability (DGP) is also used to evaluate the visual comfort.
3. Results
All the 4 kinds of paper show a notable value of diffuse reflectance and diffuse transmittance compared with clear glazing.
CIE Session 2019 – Abstract Booklet
488

There are 3 main results taken into account to reach a conclusion:
(1) The hourly change of the average annual exposure of all 7 calculation planes especially the horizontal illuminance of the floor;
(2) The monthly change of the average annual exposure of all 7 calculation planes including the hourly change of the month with maximum and minimum average monthly exposure;
(3) The annual DGP of 2 selected viewpoint each condition.
4. Conclusions
This study is a preliminary exploration of the interior luminous environment in Chinese traditional architecture, which shows the light distributions of all inner surfaces under the condition of both window paper and clear glazing. It provides some elementary data for further studies such as daylighting and space using, daylighting and visual experience, etc. But there are still many limits in this study. For example, the BSDF data could not be well used in dynamic simulation at present. As there are too many types of Chinese traditional architecture, of which what I have done is just one small tip of the iceberg. And some details are also ignored such as the window lattice and the trees that will influence the interior daylighting in the real world.
CIE Session 2019 – Abstract Booklet
489

PO156
VALIDATION OF THE SPATIAL BRIGHTNESS ESTIMATION FORMULA IN OFFICES WITH WINDOWS
Yonekura, Y.1, Yoshizawa, N.1, Tamura, H.1, Kage, H.2, Harimoto, K.2 1 Tokyo university of science, Tokyo, JAPAN, 2 Taisei Corporation, Tokyo, JAPAN
Abstract
1. Backgrounds and Purposes
In recent years daylight harvesting has been one of the promising systems to reduce lighting energy consumptions. Usually in this system the lighting environment is taken into consideration by securing the horizontal surface illuminance on the desktop using photosensors on the ceiling, however, it has become clear in some studies that the quality of the lighting environment does not always link with the desktop illuminance, and luminance distribution at the occupant’s eye or vertical illuminances are more important for evaluating the lighting qualities. Therefore, in this research, we aim to develop a new method for daylight harvesting systems by measuring wall, ceiling and window luminance using simple photosensors. The goal of this system is to secure appropriate spatial brightness in the office space and to improve energy efficiency performance at the same time. In this paper the validation result of some simple formulae for estimating spatial brightness in offices with windows will be reported.
2. Experiment Method
Two subjective experiments were conducted. The first experiment was done at a small office room which is 4.3m in wide, 9.7m in depth, 2.7m in height and has a window which is 3.9m in wide, 2m in height on the east side. The inner reflectance is 12% for the floor surface, 49% for the wall surface and 77% for the ceiling surface. Dimmable 25 square light fixtures for ambient lighting (colour temperature: 4000K) were installed in the experimental space, and only 12 lightings of which were switched on during the experiment.
12 subjects in the early 20's participated in this experiment. The experimental factors and their levels are as follows: 1) Weather conditions – clear/cloudy, 2) Time period in one day – morning/afternoon/night, 3) Venetian blind tilt angle – 0 degree/45 degree/closed, 4) Artificial lighting intensity – 200/400/750 lux on the desktop at the centre of the room. There were 54 lighting conditions in total. Subjects evaluated the spatial brightness in the office space by using magnitude estimation method (ME method) comparing to the brightness in the reference box, which was a 1/8 scale model of a general small room and illuminated at 300 lux on the desktop surface. A subject sat at the desk 7m away from the window facing it.
In addition, a luminance camera using a 360° fisheye lens was installed at the viewpoint of the subject facing in the view direction, and luminance distribution was measured at the same time when the subject evaluated the brightness. Illuminance loggers were also installed to measure the vertical illuminance at the viewpoint of the subject and the desktop illuminance.
3. Results
From the luminance distribution of 180 degrees, the average luminance of the window, the average luminance of the ceiling, the average luminance of the desktops, the average luminance of the entire space and the average luminance of the upper half of the space (including the walls and ceiling and window) were calculated, and the logarithm values of them multiplied by the solid angle of the window from the viewpoint were used as explanatory variables. The logarithm of the brightness evaluation obtained from the ME method was an objective variable for the approximate expression (hereinafter referred to as brightness estimation formula). The brightness estimation formula with the highest coefficient of determination was found to be the combination of the explanatory variables of the average luminance of the window and the average luminance of the ceiling.
There was a difference between the coefficient of the average luminance of the window in the morning and the one in the afternoon. In the morning on both sunny and cloudy day the coefficient of the average luminance of the window was a negative value, thus it indicated that the luminance of the
CIE Session 2019 – Abstract Booklet
490
window had a negative effect on the spatial brightness perception. There is a possibility that the luminance of the window was higher in the morning because of the sunlight incidence, and the luminance contrast effect had a strong effect on the brightness perception, however, further verification is necessary to come to a conclusion.
4. Conclusions and future works
The brightness estimation formula with the combination of the explanatory variables of the average luminance of the window and the average luminance of the ceiling showed the highest coefficient of determination in this experiment, and while the luminance of the window was high, it had a negative effect on the spatial brightness perception. We are planning to verify the brightness estimation formula at the other offices with larger areas in future works.
CIE Session 2019 – Abstract Booklet
491

PO157
EXAMINATION OF THE APPLICATION RANGE OF THE AVERAGE LUMINANCE FOR ESTIMATING SPATIAL BRIGHTNESS
Yoshizawa, N.1, Numaziri, M.1, Kato, M.2, Yamaguchi, H.3, Hara, N.4, Iwai, W.5, Suzuki, N.6, Sakata, K.7
1 Tokyo University of Science, Chiba, JAPAN, 2 Nihon University, Chiba, JAPAN, 3 National Institute for Land and Infrastructure Management, Tsukuba, JAPAN, 4 Kansai University, Osaka, JAPAN,
5 Panasonic, Osaka, JAPAN, 6 Endo Lighting, Tokyo, JAPAN, 7 Kajima, Tokyo, JAPAN,
Abstract
1. Motivation, specific objective
As it is getting more important to strike a balance between energy efficiency and the high quality of light environment, the necessity of the luminance-based design has been gradually spread in the architectural lighting design, and the brightness design has been also brought back into the spotlight recently. Current CIE S 008/E-2001 (ISO 8995-1:2002/Cor 1:2005) clearly mentions the importance of luminance distribution for satisfying visual comfort, visual performance and so on, and the Europe lighting standard (EN 12464-1:2011 Light and lighting-Lighting of work places-Part 1: Indoor work places) says “it is highly desirable to have bright interior surfaces particularly the walls and ceiling”, and shows the maintained illuminances on the major surfaces. Architectural Institute of Japan published new standards for lighting environment (AIJES-L0002-2016) in 2016, and minimal average luminance values on the walls and ceiling are recommended to secure the spatial brightness in the buildings. On the other hand, some manufacturers proposed their original indexes for evaluating the spatial brightness and have already started to use them in Japan.
Now the revision tasks for CIE S 008/E-2001 (ISO 8995-1:2002/Cor 1:2005) will start in 2019, thus our questions are as follows: 1) To secure the brightness in buildings, which parameter is better as the quantifiable value in lighting standards, illuminance or luminance? 2) Which parameter is better for securing brightness in the space, illuminance/luminance on the surfaces or spatial brightness indexes? 3) To what extent the simple average luminance can be used for estimating the spatial brightness?
A working group for brightness perception has been organized in Architectural Institute of Japan, and in this paper, we will report the result of a subjective experiment on the spatial brightness conducted by the WG members to answer the questions mentioned above.
2. Methods
The experiment was done at the room whose size is 5.6m in wide, 12.3m in depth and 2.7m in height. The factors and their levels of the experiment are as follows: 1) lighting methods – ceiling lights/wall washer/downlights/pendant lights/daylight, 2) the size of the experimental space – large/small, 3) reflectance of the interiors – high(81%)/low(20%), 4) furniture – desks/none, 5) average luminance levels – basically 3 levels from 6 to 100 cd/m2, 6) Observation methods - looking around at the centre of the space/looking in one direction from the centre of the space. The size of the experimental space was changed using screen curtains. There are 134 lighting conditions in total.
20 university students participated the experiment. Firstly, they adapted the light environment whose average luminance is the same with the lighting condition to be presented in 20 seconds, secondly, after the lighting condition was shown, they observed it by looking around or looking in one direction and memorized its brightness, thirdly, they controlled the lighting in the reference box, which is a 1/8 scale model of a general square room, to make the perceptional brightness the same as in the experimental space, and finally, they evaluated the appropriateness of the spatial brightness as the working space using a 7-point bipolar scale.
3. Results
The results showed that the spatial brightness evaluation could be almost estimated by the arithmetic average luminance of the entire field of view (360 degrees), however, there were some faint differences on the spatial brightness evaluation among lighting methods, especially between the wall
CIE Session 2019 – Abstract Booklet
492
washer and the others, even if their average luminance values were the same. As to the appropriateness of the spatial brightness as the working space, there was more clear tendency that the space illuminated by the wall washer needs lower average luminance than the others. Further analysis and discussion are now ongoing in the working group for brightness perception.
4. Conclusions
It can be said that the arithmetic average luminance of the entire field of view is basically the useful index for estimating the approximate perceptional spatial brightness in the space, however, there are some lighting conditions that average luminance is not enough to accurately estimate the brightness. In future works, we are planning to clarify the application range of the average luminance index for the spatial brightness, and also analyze the experimental data, such as illuminance/luminance on the walls and ceiling, and other spatial brightness indexes, to compare which parameters are suitable for estimating spatial brightness evaluation.
CIE Session 2019 – Abstract Booklet
493

PO158
RESEARCH ON LIGHTING POWER DENSITY AND ENERGY-SAVING TECHNIQUES OF SPORTS LIGHTING
Jianping, Zhao1, Ruoci, Lin1 , Yachun, Gao1 1 China Academy of Building Research, Beijing, CHINA
Abstract
1. Motivation, specific objective
Lighting power density (LPD) is one of the most important evaluation index for energy-savings, which has been used as standard in USA, China, Singapore and so on. According to the practice, the standard in China helped reduce LPD by 20 percent, contributing a lot to China's energy-saving goals. High intensity gas discharge lamps (1000W/2000W) or LEDs with high-power are often used in sports venues. The sports lighting is characterized by high-power, much energy consumption and great potential in energy-saving as well. Because of the complexity of building structure, diversification of competitive events and high requirement of lighting performance, there exist difficulties in the determination of LPD limits. In this paper, the LPD limits of sports lighting and relavent technique will be proposed.
2. Methods
In the process of this research, the technique of computer simulation, the data accumulation of vast engineering practice, the analysis of key points of lighting energy-saving and the improving method of utilization factor of luminaire had been used to determine the LPD limits.
3. Results
In this research, LPD limits for different sports venues have been determinated according to the requirements of sports lighting, the fundamental of sports lighting design.
4. Conclusions
The LPD limits and energy-saving technique proposed in this paper is important to the saving of lighting energy consumption and has good prospects in engineering experience of sports lighting.
CIE Session 2019 – Abstract Booklet
494
PO159
DYNAMIC GLARE EVALUATION ALONG A ROUTE
Vincent Boucher1, Florian Greffier1, Fabrice Fournela1, Romain Dronneau1
1 Cerema, Direction Ouest, 23 avenue Amiral Chauvin, F-49130, Les Ponts-de-Cé, FRANCE
Abstract
Road ligthing audits imply to know luminances on the pavement and can be achieved by calibrated imaging systems. Glare evaluation requires to have access to sources luminances without sensor saturation and classical imaging systems are then inefficient. Capturing low luminances and high luminances in the same image is known as High Dynamic Range (HDR) imagery and the technique used here is based on four cameras, each dedicated to one luminance range. Then an image processing algorithm constructs the final 20-bit HDR image. From HDR images, visual adaption and threshold increment models are computed in order to measure glare dynamically along a tramway route.
1. Motivation
Evaluating road lighting performances is possible nowadays by mean of digital cameras. The first need is to acquire luminances on the roadway to check normative standards. A second step, reachable with High Dynamic Range (HDR) capabilities, is to measure luminances inside sources (previously always saturated). It opens the way to many calculations made until now only statically and punctually with a luminancemeter. With an HDR Imaging Luminance Measuring Device (ILMD) able to measure from 0,1 to 105 cd/m² and the methodology described hereafter, we developed a tool to quantify the disability glare along a route. The process consists of recording images as close as possible to human eye sensitivity and computing visual adaption and disability glare models.
2. Methods
Several techniques and architectures exist for extending image sensor dynamic range. The chosen technique is derived from multiple capture technique: several images are taken with different exposure times: short integration time captures high lighted regions and long integration time captures low lighted regions. The imaging system is based on four cameras, each dedicated to one luminance range. The signal over noise ratio is not affected and maintained over extended dynamic range. As the raw signal is used, the camera response is linear and conventional photometric and colorimetric calibrations can be performed. The photometric process leads to set the exposure times in the four cameras as well as objective F-number to obtain a theoretical global dynamic range of 20 Exposure Value (EV). A total luminance range between 0,1 cd/m² and 105 cd/m² is obtained. Precautions are also taken to correct non-uniformity due to optics and sensors recording flat-field and dark images.
The synchronization issue is solved by using four hardware triggered cameras. The time-lag has been measured inferior to 1 ms. The system is then embedded in a vehicle to acquire images dynamically. This configuration based on four cameras leads to four images with different points of view and classical image registration algorithms cannot be applied. The setup can be assimilated to a multiple stereoscopic system and a rigorous geometric calibration will allow to facilitate the HDR reconstruction. This specific process permits to retrieve a point source from one camera in the three others within a field of view of 0,5°. This is a key point to construct HDR images. Combination of all images into HDR image is then required using a HDR construction algorithm.
3. Results
The developped algorithm's purpose is to replace saturated zones where the measurement has failed by zones acquired in other images where the measurement is valid. A registration is then computed zone by zone and pixels replaced in the main image to obtain a complete well exposed image known as HDR image. HDR (or classical) images permit to measure and calculate standard parameters on the pavement: average luminance, longitudinal and overall uniformities. HDR (but not classical) images give access to sources luminances and high lighted regions without saturation. Therefore disability glare model as Threshold Increment (TI) can be applied to evaluate glare dynamically along a route. But this model is very expensive regarding processor calculation time and we propose an alternative model based on vision mechanism. The philosophy is to adjust sensor response to the
CIE Session 2019 – Abstract Booklet
495
incoming light like our eyes do in real life. For each scene pixel, the model computes retina-like response signals for cone and rod luminance. As an output, the visual adaption model gives the adaption luminance, the saturated and underexposed zones in relation with cone and rod response.We finally compare the two models along a tramway line and discuss about detected glare zones.
CIE Session 2019 – Abstract Booklet
496
PO160
OPTIMIZATION OF TUNNEL LIGHTING CONTROL BY RE-AIMING OF THE EXTERNAL L20 LUMINANCE METER
Bouroussis C.B.1, Topalis F.V.1 1 Lighting Laboratory, National Technical University of Athens, Athens, GREECE
Abstract
1. Motivation, specific objective
A road tunnel is one of the few areas where illumination is needed for both day and night time. During daytime, tunnel lighting level must follow the variation of the external illumination level while during night lighting must remain constant at a predefined level. Tunnel lighting design is performed since many years using the technical report CIE:88 as well as other national or international standards and regulations.
One common characteristic of all the design methods is that the illumination level inside the tunnel, during the daytime, will be controlled (triggered) by an external luminance meter. The meters are realized by either silicon detectors or imaging sensors (ILMDs). The role of these instruments is to measure the luminance of the tunnel portal on a certain Field of View (specific cone). The field of view depends on the used method (e.g. L20 or Lseq method).
L20 and Lseq are defined as the luminance that is measured from the position of the typical observer from the safe stopping distance before the portal of the tunnel. This luminance is a composition of the luminance of various elements that are included into the field of view, namely, sky, road, portal, surroundings, etc. Therefore, each tunnel has its own variation of the external luminance. In addition, the variation of this luminance during the day is strongly depend on the orientation of the portal, the geographic location of the tunnel and so on.
In order to imitate the field of view of the typical observer, the external luminance meters should be installed at this exact position and therefore, the field of view and luminance measurement would always be correct. As this is practically impossible, luminance meters are installed on the side of the road, 3-5m higher than the observer’s height and in some cases at a distance different from the stopping distance. This results to a different perspective (composition of field of view) of the meter compared to a theoretical meter at the typical observer’s position. In addition, several obstacles may block part of the field of view of the meter resulting a significantly different measured luminance. This wrong (by-default) meter position is producing the issue of unreliable luminance measurements especially in cases where the field of view is far more different compared to the ideal one. On the other hand, wrong luminance measurement lead to early or late triggering of certain luminance levels inside the tunnel, resulting an over-illuminated or an under-illuminated tunnel for the corresponding period. This affects both safety and energy consumption of the tunnel.
This paper investigates the effect of the lateral positioning of the luminance meter (L20 meter in particular) and proposes a method for the re-aiming of the existing luminance meter in order to imitate the behaviour of the typical observer and optimise the behaviour of the lighting control system.
2. Methods
As described above, the lateral positioning of the external luminance meter influences the field of view of the instrument. Thus, this work focuses to the investigation of the effect of the variation of the field of view in respect of the total luminance measurement and of the behaviour of the lighting control system. L20 field of view from typical observer position and L20 field of view from lateral meter position were analysed for several tunnel cases. The percentages of various components like sky, portal, road, etc were extracted for each case while the disparities of these results between typical observer position and meter position where calculated. In addition, the effect of the above issued to the lighting control behaviour was investigated.
3. Results
This research will demonstrate that there can be a significant difference between the mix of elements in the field of view of the typical observer, compared to the mix of elements in the field of view of the
CIE Session 2019 – Abstract Booklet
497

luminance meter at the side of the road, resulting an increased uncertainty in the measurement of the luminance of the tunnel portal and the erratic triggering of the lighting stages inside the tunnel.
In order to minimise these disparities, a method for re-aiming the luminance meter is proposed. Using the new aiming, the meter will have a composition of the field of view closer to the one of the typical observer. This will assist the lighting control system to trigger the corresponding lighting levels in a more precise way. The corresponding effect on the energy consumption will be also presented.
4. Conclusions
The re-aiming of the external L20 luminance meters play a significant role in the increasing of the tunnel safety and the appropriate illumination throughout the day. The proposed method should be applied during the installation and commissioning of the tunnel lighting system as well as during regular maintenance. This method is already proposed in the framework of TC4-53 in order to be included in the update of the CIE:88 publication.
CIE Session 2019 – Abstract Booklet
498
PO161
INVESTIGATION OF STROBOSCOPIC EFFECTS FROM CHROMATIC FLICKER
Bullough, J.D., Skinner, N.P. Lighting Research Center, Rensselaer Polytechnic Institute, Troy, NY, USA
Abstract
1. Objectives
The widespread use of light emitting diode (LED) sources for general illumination has reintroduced concerns about flicker and stroboscopic effects. Consequently, recent standards and guides have appeared that address these concerns, such as those from the Institute of Electrical and Electronics Engineers (IEEE), the National Electrical Manufacturers Association (NEMA), and the Commission Internationale de l'Éclairage (CIE). Such documents have not addressed chromatic flicker, which can be caused by LED systems that modulate individual colour components through pulse width modulation so that at any given instant a lighting system's colour output might not match the time-averaged output that would be seen under steady-state viewing conditions. Several studies of chromatic flicker at relatively low frequencies have been conducted; in addition, investigations of "colour break-up" have been undertaken as they pertain to displays and projector systems. An objective of the present study was to develop a preliminary understanding of how chromatic flicker impacts the perception of stroboscopic effects when rapid motion is present in the illuminated scene.
2. Methods
Red, green and blue LEDs were mounted along the interior surface of a white painted integrating sphere 20 cm in diameter. When the LEDs were illuminated, the sphere mixed their colour output and the mixed light was emitted from a 10 cm aperture at the bottom of the sphere, forming a luminaire that could be mounted onto a table top. The relative output of the three colours to achieve white illumination with a correlated colour temperature (CCT) of 4900 K was determined. The LEDs were operated with four different drive profiles: a direct-current ("DC") profile where each colour was operated at constant current without any temporal modulation; a "phased" profile where all three LED colours were switched on and off at the same time (with a 33% duty cycle); a "staggered" profile where the red, green and blue LED colours were each operated for one-third of the cycle with no gaps in light output; and a "spaced" profile where each LED colour was operated in turn for 20% of the cycle followed by a dark interval with a duration of 13% of the cycle, so that the entire duty cycle was 60%. A total of 12 study participants viewed each non-DC profile with a frequency of 100, 300 or 1000 Hz twice, and the DC profile twice. They were instructed to wave their hands and a white ruler back and forth against the black table top surface, and asked whether they detected any colour separation or flicker; whether they detected any stroboscopic or flicker effects at all (either chromatic or achromatic); and if any effects were detected, how acceptable the illumination would be for office work.
3. Results
As expected, no chromatic or achromatic effects were detected for the DC profile. For the phased profile, colour effects were hardly ever detected at any frequency. Color effects were widely detected (>90% of the time) for the staggered and spaced profiles at 100 and 300 Hz, but rarely detected (≤25% of the time) at 1000 Hz. Stroboscopic effects of any kind (chromatic or achromatic) were always detected for all three non-DC profiles at 100 Hz, almost always detected (>90% of the time) at 300 Hz, and detected 55%-70% of the time at 1000 Hz (slightly higher detection for the phased profile). Acceptability increased from somewhat unacceptable for all three profiles at 100 Hz to very acceptable at 1000 Hz; the phased profile was judged slightly more acceptable than the staggered or spaced profiles at 100 Hz.
4. Conclusions
The results suggest that there are differences between detection and acceptability of stroboscopic effects from chromatic and achromatic flicker profiles. The phased profile without chromatic flicker but having the lowest duty cycle, tended to be easiest to detect but was judged as somewhat more acceptable than the staggered or spaced profiles, which did produce chromatic flicker. Frequency-
CIE Session 2019 – Abstract Booklet
499

modified flicker index was a good predictor of stroboscopic effect detection and acceptability overall, but not for chromatic effects specifically.
CIE Session 2019 – Abstract Booklet
500

PO162
INFLUENCE OF LIGHT LEVELS ON VISIBILITY FOR SAFETY AT AUTOMATED TELLER MACHINE FACILITIES
Bullough, J.D.1, Rea, M.S.1, Skinner, N.P.1, Ross, J.2, Ross, G.M.2 1 Lighting Research Center, Rensselaer Polytechnic Institute, Troy, NY, USA, 2 GMR Protection
Resources, Inc., Heath, TX, USA
Abstract
1. Objectives
People need light to safely use an automated teller machine (ATM) at night. Standards and recommendations for the amount of lighting, as well as the locations to be lighted, at ATMs differ across organizations and jurisdictions. The objectives of the present study were to identify relevant visual tasks that the customer needs to perform for efficient and safe use of the ATM, and to investigate how different light levels impact performance of those tasks.
2. Methods
Three key visual tasks were identified: 1) detecting objects on the ground in walkways around the ATM (such as dropped money, keys, or cards; or potholes, curbs or other potential tripping hazards); 2) identifying the denominations of currency received from or to be inserted into the ATM; and 3) identifying features of other individuals (particularly facial features) approaching or leaving the ATM. Under task illuminances of 5, 10 and 20 lx, 12 study participants (half over 50 years of age) navigated a low-contrast maze on the floor, identified the denomination of simulated currency notes, and identified the skin tone and presence of hair, a moustache, and earrings on scale model heads varying in reflectance and with various combinations of these features. For the first two tasks, the time to perform the task was recorded; for the face identification task, the accuracy was recorded. The impact of a peripheral glare source in the field of view producing 2 or 0.2 lx at observers' eyes was also assessed.
3. Results
For the maze navigation task, there were no statistically significant effects of illuminance on the floor plane; the time needed to complete the maze was similar under all conditions. For the currency identification task, the average task completion time was longest for 5 lx but similar for 10 and 20 lx. Only for the older participants were the differences between 5 lx and 10/20 lx statistically significant. For the face recognition task, there were few errors at all task illuminances, but slightly more at 5 lx than at 10 or 20 lx; none of the differences were statistically significant. The presence of a glare source tended to result in slightly worse performance, but glare did not statistically significantly impact task performance. In all cases, the measured response times and identification accuracy followed very similar trends as calculated relative visual performance (RVP) quantities.
4. Conclusions
In general, the results indicate that minimum illuminances of 10 lx at and around the ATM are sufficient to achieve adequate visual performance for safety-related visual tasks such as those evaluated in the present study. Some jurisdictions require minimum illuminances of 20 lx in the area surrounding the ATM; this can result in the use of wall-pack or floodlight luminaires that can produce substantial levels of disability and discomfort glare. The present findings suggest that a lower minimum illuminance of 10 lx can be sufficient for many visual tasks required for safe ATM use. Visibility analyses using the RVP model can be useful in evaluating lighting in the ATM environment.
CIE Session 2019 – Abstract Booklet
501
PO163
LIGHT POLLUTION ANALYSIS USING HI-RESOLUTION NIGHT AERIAL LIGHTING MAPS
Chasseigne, R.1, Dubard, J.1, Pierrard. S.1, Hay, B.1 1 Laboratoire national de métrologie et d’essais, Paris, FRANCE
Abstract
1. Motivation, specific objective
Light pollution visualization is mostly known from the public thanks to the large scale satellite images and the ones taken from the ISS (International Space Station). It appears obvious that the human activity has a strong impact on the environment and those images are useful to illustrate the phenomenon.
Today, a lot of countries have decided to engage themselves for a better energetic management and reasonable energy consumption. In France, an increasing number of territorial authorities (cities, collectivities, regional corporations for energies…) are facing the problem with the question of the cities lighting. This topic regroups several preoccupations dealing with the energetic and environmental areas. Building the “city of tomorrow” comes with an optimised lighting system, less consuming, responding to human kind needs while avoiding perturbations on the Biodiversity.
Combined with the in-house knowledge and existing data (providing from ground studies), the use of hi-resolution night aerial lighting maps has proven ability to give precise technical information on light pollution sources identification and lighting points localization. The end-users maps are also particularly powerful to build awareness for both the general public and the decision makers to the light pollution and to motivate renovation projects.
This work is based on more than 15 years of experience in working with French territorial authorities in the area of the Energy Efficiency Improvement. It involves remote sensing projects from the very first step (data acquisition) to the delivery of the results and maps production, combining skills in aerial operation, mechanic and design, sensor manufacturing and GIS (Geographic Information System).
For the specific light pollution analysis, the above competences are completed by contribution from people involved in outdoor and indoor lighting characterization and metrology with knowledge in photometry and colorimetry.
2. Methods
The methodology of aerial lighting maps projects combines different steps:
Mapping, at night time, during a dedicated flight, a specified geographic area in the visible spectrum to have a visualization of the lighting from the sky. The used sensor (a low light digital camera) is combined with an inertial measurement unit to know the real-time vehicle’s position in respect to the flight dynamics (altitude, pitch and roll angles). A large amount of visible images is acquired (around 1000 images for a 1000 km² area). The time slot for this dedicated flight is defined with the territorial authority taking into account the possible street lighting on/off schedules for some cities and the aim of the overall study.
Data processing in laboratory in order to build a unique orthorectified and georeferenced lighting image in natural colours (which means a corrected image by removing distortions and related to a geographic coordinate system). The data is fully integrated within the GIS of the concerned territorial authority.
Processing of the previous lighting mosaic in a false colour 8-bit image to highlight the priority areas to study and allowing data classification and vectorization in polygon type data (conversion of the image into a classical GIS vector data where each polygon corresponds to an area regrouping pixels of the same class).
CIE Session 2019 – Abstract Booklet
502

Automatic identification and extraction of the major spots or “hot” spots (high luminance spots) of the territory. A point type vector data is generated for the GIS taking into account the possible aberrations and omissions.
Production and analysis of end-users maps: qualification of entire street performance (4 to 6 levels classification), hot spots distribution in the public and private spaces….
Characterization of light sources (LED, Sodium…) from the RGB (Red Green Blue) channels of the acquired aerial images (in development).
3. Results
From 2017, this methodology has been successfully applied with strong benefits through various projects of different French territorial authorities.
For example, one of the largest French cities has decided to acquire its first hi-resolution night aerial lighting vision with three major objectives:
investigate the benefits and potential additional information of such a product to the existing lighting database and knowledge ;
have a first global vision, a “reference” image, before the beginning of renovation programs consisting in light sources replacements (willingness to illustrate the evolution of the global perception through future periodic aerial data acquisitions) ;
prioritize the areas to focus on for the implementation of LED technology to maximize performance and energy savings.
Once integrated in the city’s geographical tools, the night aerial lighting mapping and GIS analysis have immediately demonstrated capability to:
identify and illustrate the effect of the major spots of the public lighting system (historical buildings lightings…) ;
improve and expand the existing lighting database by revealing and adding to the GIS layers new spots not previously referenced ;
give access to another dimension not covered by the original ground database: spots detection and qualification in the private spaces, representing a significant part of the global lighting. This gives the opportunity to build awareness in a pedagogic way for the private actors such as hotels, companies, industrial sites…;
offer a powerful and visual tool to decision makers (elected local authorities).
This study is still in progress with two another major objectives: the light sources characterization from the aerial images processing and the impact studies of the urban lighting on the Biodiversity, a major issue for the next few years.
4. Conclusions
Once perfectly integrated in a GIS technology and used in combination with the in-house knowledge of the territories about their own lighting situation, hi-resolution night aerial lighting maps are powerful tools for analysing the global situation and to allow prioritizing and acting.
Giving access to all lighting sources, including the ones coming from the private spaces, these maps allow to involve and to build awareness for all actors of the territory, not only the public authority.
Major issues such as the impact on the Biodiversity may be studied thanks to this type of data, for example with the precise identification of dark areas to relate to wildlife corridors.
CIE Session 2019 – Abstract Booklet
503

PO164
GLARE ASSESSMENT FOR LOW-REFLECTION DISPLAY DEVICES
Wen, C.H.1, Hung, S.T.1, Chang, K.J.2, Tsai, Z.H.2, Chen, C.H.1 1 Industrial Technology Research Institute, Hsinchu, CHINESE TAIPEI
2 AU Optronics Corp., Hsinchu, CHINESE TAIPEI
Abstract
1. Motivation
The world of electronic information displays has moved on a lot in the last few years. There are new technologies and certifications, all aimed at approaching display technology take the next leap forward. People typically watch displays under ambient light sources, even strong direct sunlit, that causes extremely intense perception by reflected light from the display surface. Extremely reflected glare on displays might affect visual performance, fatigue and headache, but there are rare reports to address the applicability of current glare metrics for the reflected glare on display, especially in low glare level.
In the previous work published in CIE x045:2018, authors reported the applicability of current glare metrics for predicting glare on electronic displays in indoor environments and the metric of ASSIST discomfort glare were superior to other metrics. This paper presents a serial of perceptual experiments for discomfort glare, fatigue and clinical optometric assessments and reports selected findings from those experimental results comparing with the predictions by the discomfort glare metric. This paper suggests ways to better display devices design in indoor scenario applications.
2. Methods
Sixty-two participants with normal or corrected colour vision joined in the experiments. 30 participants for normal ambient environment and the rest of participants for environment with a glare source. The experiment was conducted in a windowless laboratory. Subjects sat in a chair and the distance from the chair to the display was 75 cm. The subject's eyes' position were located at the horizontal angle to the centre of the display. Each subject was tested individually and was allowed to hold a tablet showing the discomfort glare or fatigue rating scale to use as an input device. The pretest-posttest was design to compare the effects on fatigue, all subjects were asked to perform a set of vision tests included critical fusion frequency (CFF), refractive error, visual acuity, distance heterophoria, near heterophorial, AC/C ratio, amplitude of accommodation and accommodative facility.
This work investigates three kinds of glossy, matte and light matte displays with 2 polarity contents under 2 ambient lighting conditions. One condition is the normal office with indirectly lighting on the target display and the other condition is the reflected glare condition that a set of linear fluorescent lamps is setup behind observers. For all treatments of the experiment, the objective discomfort glare values of three displays are measured as same as the previous study performed.
There were 6 sessions in total including 2 illumination conditions and 3 displays. Participants were requested to read articles on screen and answer about questionnaires using a 7 category-point scale (0: none, 2: a little, 4: moderate, 6: extreme). In term of subjective discomfort glare assessment, participants were asked to 8 questions and the study was based on a randomized factorial design with repeat measures on two factors that included illumination conditions and display type. In term of fatigue assessment, participants were asked to 20 questions and the study was based on a randomized factorial design with repeat measures on three factors that included illumination conditions and timing and display types. In term of clinical optometric assessment, participants took the set of vision tests in total 14 metrics to compare with the results of the subjective fatigue assessment.
3. Results
Bivariate Correlation
This work adopted the bivariate correlation to analyse the relationships among all measures included 6 vision test metrics, 8 questionnaires for glare assessment, 4 questions for fatigue assessment, 7 visual performance and 10 calculated glare indices for both positive and negative polarity. Results revealed that there were significant correlation between glare assessment questionnaire and the calculated glare indices, special in the case of positive polarity contents. And
CIE Session 2019 – Abstract Booklet
504

there were significant correlation between fatigue questionnaires and the calculated glare indices, special in the case of negative polarity contents. To UGR index, there was the most frequency of high correlation with other measures. In vision test metrics, only the near heterophorial measure was significant correlation between subjective score of the question about the dazzling feeling around the eyes. Therefore this study will focus on glare assessment and discussion in next paragraphs.
Glare assessment:
A multivariate analysis of variables (MANOVA) was conducted the test all three surface-treatment displays at 2 illumination conditions for 4 questionnaires including glare, dazzling, reflected light from source and mirrored image of objects. Results concludes that there is a significant interaction between displays and illumination. Furthermore, the main effects of illumination and display types are also significant. However the average scores of glare assessment over 4 questionnaires are lower than 3 point. It means that participants just feel a bit glare or dazzling during experiments. We also found that the light matte display maintains consistent performance under the glare source.
Polarity effects on glare index
Results showed that the mean of glare score is function of the discomfort glare (DG) calculated value for the negative polarity and positive polarity respectively. The DG calculated values of negative polarity content are smaller than the positive polarity content. In addition, results also revealed that the mean of glare score is function of ASSIST deBoer index for the negative polarity and positive polarity respectively. In the full paper, we will discuss how the polarity effects may be needed to take consideration in to the glare prediction models.
4. Conclusions
Most of glare metrics are well known to quantify the discomfort glare of light sources. There is rare work to investigate the annoying or neglectable reflected glare from electronic display devices. This paper conducts experiments to test the surface-treatment displays at different polarity contents under two illumination conditions. The results showed the most correlations of vision tests and subjective evaluation are not significant. Furthermore, the interaction effects of display types and illuminations are significant for glare assessment, and the mean of glare score is function of the discomfort glare calculated value. The results conclude the content polarity effects maybe take consideration into the glare prediction models in the future.
CIE Session 2019 – Abstract Booklet
505

PO165
ROAD LIGHTING MEASUREMENTS BY AN EQUIPPED VEHICLE
Hsu, S.W., Chen, C.H., Hung, S.T., and Chung, T.Y. 1 Center for Measurement Standards, Industrial Technology Research Institute, Hsinchu, CHINESE
TAIPEI
Abstract
1. Motivation, specific objective
In our previous studies, the on-site measurements of illuminance and luminance distributions on several LED-lighted roads had been carried out by semiautomatic systems and processes according to the CIE-140, CIE-194, and EN-13201 standards. Although the experimental results are effective for the evaluations of the qualities of the roads, the speed of the measurements are somewhat slow, especially for the long and/or heavy-traffic roads. To improve this disadvantage, we have developed new measurement technologies based on an equipped vehicle. The measured illuminance and luminance data were converted to relatively more fundamental parameters and practical quantities with algorithms derived from theory of photometry.
2. Methods
The equipped vehicle was built from a recreational vehicle by fixing a crossbar on the roof of the vehicle. Three sets of lux meters were mounted on the crossbar with distance of 1.5 m between the sets. Four lux meters with directions of up, forward, left, and backward were integrated as the sets mentioned above. An industrial camera was calibrated as an image luminance measuring device (ILMD), and also mounted on the roof of the vehicle to measure luminance images of road. An encoder linked with rear axle shaft and an inertial measurement unit (IMU) were combined for the vehicle positioning. Software developed with Labview was used for the automatic measurements and analyses in this work.
3. Results
To test the performance of the equipped vehicle, a 2-lane road with width of 7 m and light poles with height of 7.4 m was measured. This road is slightly sloped and curved for testing the flexibility of the measurement systems. From the automatically recorded distributions of illuminance at 2 m height along the measured road, the luminous intensity distributions of the road luminaires were obtained with lots of simultaneous equations. With these luminous intensity distributions, for example, the average illuminances and uniformities of ground horizontal illuminance distribution (at height ~ 0 m) for the downhill case were calculated as 19.8 lx and 0.56, respectively. These data is close to those measured form the semiautomatic method of 19.9 lx and 0.53, respectively. Other practical quantities such as vertical illuminance distribution at specific height, and flicker caused from non-uniformity can also be calculated furthermore.
The distributions of luminance along the measured road were measured with the ILMD, and the luminance reflected from the road can be analysed by the edge-finding algorithm on the luminance images. For example, the luminances for uphill with acceptance angle of 0.1o at observation distances of 20.6 and 44.5 m are between 1 and 1.5 cd/m2. The uniformities corresponding to the above distributions are between 0.76 and 0.87. That means the variation of the reflected luminance is small of this road.
4. Conclusions
New technologies have established with an equipped vehicle for rapid measurements of photometric quantities of long lighted roads. The measurement ranges of illuminance and luminance are 1 ~ 1000 lx and 0.1 ~ 100 cd/m2, respectively. The resolution of the equipped vehicle is 0.3 m, and the sampling distance is less than 2 m. Similar measurement results between those obtained by this and conventional methods show that this method would provide a contribution for the development of LED road lightings.
CIE Session 2019 – Abstract Booklet
506

PO166
TOOL FOR ANALYSIS OF TUNNEL LIGHTING BASED ON VISUAL PERFORMANCE AND VISUAL COMFORT
Corell, D.D.1, Jørgensen, A. 2, Hafdell, P. 3, Ekrias, A. 4, Sørensen, K.5 1 Technical University of Denmark, Roskilde, DENMARK, 2 Road Directorate, Oslo, NORWAY, 3 Trafik
Verket, Stockholm, SWEDEN, 4 LiCon-AT Oy, Espoo, FINLAND , 5 Johnson Consult, Kgs. Lyngby, DENMARK
Abstract
1. Motivation
This study provides a method for the determination of tunnel lighting levels needed in view of criteria for visual performance and visual comfort. An additional, optional criterion takes into account other concerns for the lighting of the inner zone. The method is applied in an Excel file.
2. Methods
A drive starts at a reference location one stopping distance in front of a tunnel entrance and ends well inside the tunnel. During the drive, the driver looks at an object placed at a point on the road surface one stopping distance ahead where the road surface luminance is set to bring compliance with the criteria for visual performance and visual comfort. The criterion for visual performance is represented by a minimum Visibility Level (VL) of the object.
The object is a vertical square facing against the driving direction with a contrast – positive or negative – to the local road surface luminance and observed in a short period of time only (a glance of certain duration).
The road surface luminance needed to create a certain VL is affected by disability glare, which is represented by a total equivalent veiling luminance (Lseq).
As long as the driver is still in front of the tunnel, there is a contribution to the Lseq from the daylight in the surroundings of the tunnel aperture. After entering the tunnel, the contribution to the Lseq, from the tunnel lighting installation, is given as a fraction of the local road surface luminance at the driver’s location. Glare from other glare sources, in particular headlamps on opposing vehicles, are presented by an additional contribution to the Lseq.
The criterion for visual comfort is represented by a maximum rate of decrease of the road surface luminance from point to point. This rate is set indirectly by means of a minimum number of seconds for a decrease of the road surface luminance of a factor of 10 (t10.)
The road surface luminance is calculated in a single flow from point to point from the tunnel entrance and onwards until well inside the tunnel. At some points, the criterion for visual performance is more demanding and determines the local luminance. At other points, the criterion for visual comfort determines the road surface luminance. Eventually, the road surface luminance reaches a final constant value.
The calculations cannot be done in a straight forward manner and, actually, involves repeated drives in which the road surface luminance values are adjusted. This is a converging iterative procedure.
The threshold zone has a length of one stopping distance. The transition zone starts after the threshold zone ends at the location, where the road surface luminance falls below a certain value. This is where the inner zone starts.
It has been recognized, that there are regulations and recommendations for the road surface luminance in the inner zone, and that these may take other criteria and concerns into account such as the traffic volume, the driving speed, and the length of the tunnel.
Therefore, as an additional criterion – the desired road surface luminance in the inner zone is set in an optional manner. Internally, this is handled by a change of the minimum VL for both the inner zone and the transition zone.
CIE Session 2019 – Abstract Booklet
507

Several input values determine the difficulty of the visual task: the driver’s age, the size and contrast of the object, the observation time and the actual visibility level VL. One can work with these input values to see their individual influences.
The driving speed is an input, which indirectly also determines the stopping distance, associated with the actual driving speed, defined in a separate table.
The veiling luminance from daylight at the reference location of the driver is an input together with fractions for each of the ten driver locations towards the tunnel entrance. The veiling luminance caused by the lighting installation as a fraction of the road surface luminance is a further input. The light scattering in the air and the car windshield is also taken into account.
The final inputs are the t10 value for visual comfort and the optional setting of the road surface luminance in the inner zone Lin.
3. Results
The results are a profile of the road surface luminance within the tunnel, a profile of VL and a number of additional values such as the initial luminance in the threshold zone Lth and the luminance in the interior zone Lin. The length of the transition zone, the duration of the drive in the transition zone and the k-factor have also been added.
Results obtained with the method show agreement with recommendations in CIE 88:2004 with, however, some additional features. In particular, the driving speed – in association with the stopping distance - has a stronger influence on the threshold luminance, the luminance profile in the threshold zone and the luminance in the interior zone than indicated in CIE 88:2004. Additionally, the disability glare created by the tunnel lighting itself, has a strong influence.
4. Conclusions
The method, implemented in an Excel file, is a tool that can be used to investigate tunnel lighting in an objective manner based on few criteria. The criterion for visual performance is obvious and has already been applied in CIE 88:2004. The criterion for visual comfort is introduced as a mathematical expression for visual comfort. An optional criterion for the road surface luminance in the inner zone is intended for acceptance of conventional levels that may reflect other criteria and concerns.
The method is recommended for use in the on-going revision of CIE 88:2004 by CIE TC 4-53.
CIE Session 2019 – Abstract Booklet
508

PO167
INTERPOLATION METHODS OF I-TABLES OF ROAD LIGHTING LUMINAIRES
Dubnicka, R.1, Lipnicky, L.1, Gasparovsky, D.1 1 Department of Electrical Power Engineering, Faculty of Electrical Engineering and Information
Technology, Slovak University of Technology, Bratislava, SLOVAKIA,
Abstract
1. Motivation, specific objective
For the calculation of the photometric parameters of the road lighting it needs to have photometric data of the luminaires used for illumination of carriage ways or walkways. These data are in the form of an intensity table (I-table) which gives the luminance intensity distribution emitted by the luminaire in all relevant directions. A goniophotometer is needed to measure the luminous intensity distribution of luminaires. The results from goniophotometric measurements are very important for lighting engineers who are using these results in lighting calculation of photometric parameters of the various lighting systems. Especially, in road lighting calculation distance between angles should be measured as much as possible providing sufficient photometric data for the calculation. In practice, some optical systems may contain various local extremes in the luminous intensity distribution curve (LIDC) which were found by means of the goniophotometric measurement. Due to measurement of luminous intensity in discrete values of angle interval, interpolation methods of I-tables will be needed to enable values to be estimated for calculation of performance of road lighting system. At present, recommended method is linear interpolation according to standard or recommendation documents treating with road lighting calculation of photometric parameters of lighting system.
2. Methods
This paper deals with investigation of the various interpolation methods of I -tables of luminaires using in road lighting applications. Especially, the luminaires with significant local extremes in LIDC are compared with interpolation method in comparison with linear interpolation accepted in national standards and document CIE No.140. Interpolation methods are validated by goniophotometric measurement with as small angular interval as possible to represent real LIDC of assumed luminaires. The calculation of photometric parameters by means of lighting calculation tools are shown as impact of used interpolation method in road lighting calculations.
3. Results
Based on the various interpolation methods for selected road lighting luminaires in combination with validation by goniophotometer was identified reliability of used methods. Also calculation of model road lighting situation by means of calculation tools which are used for photometric quantities according to relevant documents shows impact of the precision of particular interpolation method to calculated quantities. The presentation will show
comparison of various approaches of interpolation methods of I -tables which can be used in practice for selected road lighting luminaires with different LIDC,
impact of used interpolations on road lighting calculations by means of lighting tools
identification of appropriate interpolation method of I -tables of road lighting luminaires which can be used in the practice to reach best possible accuracy for road lighting calculations
4. Conclusions
LIDC of road lighting luminaires is very important for performance calculation of assumed lighting system. Interpolation methods of I-tables of selected road lighting luminaires were investigated. Validation measurement of each road lighting luminaire was performed by means of goniophotometer to show precision of used interpolation method. Furthermore, from results of interpolations were photometric data files were created and lighting calculations by means of lighting tool of model road
CIE Session 2019 – Abstract Booklet
509

lighting was performed to show how it impacts on photometric parameters of lighting system according to relevant standards and documents.
CIE Session 2019 – Abstract Booklet
510

PO168
LIGHTING, QUALITY AND ARTIFICIAL INTELLIGENCE
Burini Junior, E.C.1, Santos, E.R.2,3, Kanashiro, A.G.1 1 IEE/University of Sao Paulo (USP), Sao Paulo, BRAZIL, 2 PMT/USP, Sao Paulo, BRAZIL,
3 FATEC/SP, Sao Paulo, BRAZIL
Abstract
The main objective of the present article is to present data and results from investigations conducted with lighting equipment from Solid State Lighting (SSL) technology (inorganic White Light Emitting Diode - WLEDi). One focus is on the quality of the lighting in both exterior and interior. The reduction in electric energy consumption by WLEDi in a museum exhibit area will be sought with the use of artificial intelligence (AI) technique. This part of the work is intend to assist in the design of the so-called intelligent lighting, which should recognize the presence of users, light in the environment and to collect data for optimizing performance. Still focusing on quality, results of a long-term experiment started, also data collected from the road lighting of the University City Armando de Salles Oliveira (CUASO), which WLEDi equipment has already completed service for five years are considered.
1. Motivation, specific objective
When considering the different technologies of light sources, over a relatively long period it is possible to verify the positioning, in terms of luminous efficiency, of the SSL technology (WLEDi). The luminous efficiency threshold, 100 lm/W, considered to be possible from the fluorescent tube technology (T5 bulb) has already been overcome by the SSL technology. The University of São Paulo (USP) implemented WLEDi for road lighting of the CUASO since the year 2013, and the Institute of Energy and Environment (IEE) among other units from USP has already interrupted the acquisition of tubular fluorescent lamp (32 W-T8) for more than a year. Now, the replacement of the light source indoors is done exclusively by SSL technology and too much fails are reported. The commercialization of the conventional incandescent bulb, Edison base (E-27), has been banned and single base fluorescent lamp (LFBU) or compact fluorescent lamp has been replaced by SSL technology including the Brazilian residential sector. The quality is usually referred only when the product fails and becomes prematurely inoperative. WLEDi lamp with brand of traditional lighting fixture has not been easily found in the local trade. The central objective of the present article is to present data from experiments to investigate lighting equipment using SSL technology (WLEDi). For exteriors relevant aspects of Brazilian public lighting, in particular, records made on road lighting from CUASO are considered. For interiors, the quality of the SSL technology, E-27 base, is intended to be accessed from an experiment. For the commerce and services sector, the specific objective is to have a system to adjust digitally the level of lighting in the museum exhibit area according to needs: the use of space, light availability on site and by the use of artificial intelligence (AI).
2. Methods
The laboratory tests to access the performance of WLEDi general lighting lamps, base E-27, under tropical indoor environment conditions were firstly performed with eight different types. Light output depreciation and useful life are the main focus under evaluation on an experiment from regulated AC electric power source.
The light output, operation and output information from the software (SCADA) of the CUASO WLEDi road lighting installation were sampled on different dates will be presented and discussed.
For the commerce and services sector project, the monitoring will occur from sensors of light (natural and artificial) and human presence. The artificial light system is intended to be controlled from the availability of natural light and the depreciation of the luminous flux. Another important variable to be considered is the visitor's presence. Passive infrared sensor (PIR) is intended to be used for motion detection or space occupancy. Using data from sensors and AI software the system will keep the light level adjusted. This part of the research still depends on financial subsidies requested from USP.
CIE Session 2019 – Abstract Booklet
511

3. Results
The researches already done focused on aspects related to the production of light by artificial electrical source, the effects on users and materials. The present paper present results from experiments summarize data collected and results from CUASO's WLEDi lighting.
For indoor lighting, residential sector, the preliminary results of an experiment, already under development, on the quality and durability of WLEDi lamps, E-27 and rated electric power from 7 W to 12 W, for a period of 3000 h will be presented and considered.
Light sources or luminaires can be equipped with sensors and network elements to aid in lighting control. This can provide greater power savings, flexibility and data collection to optimize energy end use. In addition, energy efficiency and a wide range for dimming the light output are fundamental design considerations. For the commerce and services sector it is intended to establish an automatic system for the monitoring and control of lighting based on human presence and light availability. The system will act on what is "taught". The work seeks to take into account the accelerated growth scenario from the Internet of Things (IoT) technology.
4. Conclusions
The recommended intervention in end use of energy should help from the reduction of electricity, maintenance costs and in carbon emissions.
The road lighting of CUASO is in operation, unlike the management system (SCADA).
The experiment related to the performance of WLEDi lamps for general illumination has already been started. The first 100 h date was record. The experiment will run for the period of at least 3000 h.
The so-called intelligent lighting project intended to recognize the presence of users in the environment. Artificial lighting shall be controlled mainly from light sensor (visible band) and presence sensors. An intelligent network can automatically change patterns and lighting intensity by combining needs, minimizing negative impacts and providing alternatives to the environment. The development of the project can stimulate our ability to learn, as well as improve our knowledge about the new road lighting of CUASO.
CIE Session 2019 – Abstract Booklet
512
PO169
WHAT ARE YOU LOOKING AT? TESTING NANCY’S RULES FOR PEDESTRIAN INTERACTIONS
Fotios, S.1, Hamoodh, K.1, Clanton, N.2 1 University of Sheffield, Sheffield, UNITED KINGDOM, 2 Clanton & Associates Inc., Boulder, CO,
USA
Abstract
1. Background
You are walking alone along a road after dark and see another pedestrian ahead: what are the visual cues about the approaching person that help to decide whether it is safe to keep walking towards the other person or whether they should be avoided? Lighting guidance and, until recently, most lighting research, has tended to focus on facial recognition, more precisely known as Facial Identity Recognition (FIR) . That may be an inappropriate target for lighting research because familiar faces are easily recognised even when severely distorted. FIR may also be inappropriate because identity does not say anything about intent. More-recent research has focussed instead on Facial Emotion Recognition (FER) the ability to discriminate between facial expressions, because it has been demonstrated that these are associated with approach-avoid decisions. However, FER still uses the face as the target and it is not yet known whether that is the most appropriate visual cue.
This question was discussed within the IESNA outdoor lighting committee. A hierarchy of factors was proposed by committee chair, Nancy Clanton:
• gender (women, or man/woman together gives me the least anxiety),
• number (two or three against one is high anxiety),
• eye contact (are they looking at me and scoping me out?),
• walking direction (are they walking towards me to block my path?),
An experiment was conducted to compare the relative importance of these visual cues
2. Methods
A series of target photographs were constructed. These were actors posing in front of a green screen, and subsequently embedded into photographs of outdoor locations at night. Male and female actors were used, and asked to pose facing towards and away from the camera, and with face and hands revealed and hidden (by hoods and pockets). Sixteen images were generated providing combinations of gender, singles and pairs, hand and face visibility, and direction of travel. The photographs were manipulated so that targets were either front lit or backlit, with the target being at a distance of approximately 9 m.
The images were observed on a PC screen. Two test procedures were used, category rating of each image separately (1 = very unsafe, 5 = very safe) and a forced choice discrimination of all possible pairs (which of the two scenes is safer?). The experiment was carried out by 30 test participants.
3. Results
To date, results from the rating procedure have been analysed. Regarding the feeling of safety portrayed by the test images the data suggest the feeling of safety is lower for:
• Single males rather than single females.
• People (either singles or pairs) walking towards the observer rather than people walking away.
• Back-lit people rather than front-lit people
• People with their hands and face hidden rather than people with their hands and face visible.
The results did not suggest a difference in safety between single people and pairs of people. One reason for this may be that the pairs were always one male and one female: a group of two (or more)
CIE Session 2019 – Abstract Booklet
513

males may be perceived less safe than a single male but that remains to be confirmed. There may also be a need to clarify the actions of other people in these images. For example, if the pair of people are engaged in lively conversation with each other this may indicate one’s own presence is not of immediate interest. But if one of the people points in my direction, that indicates an interest which raises anxiety. The images used in the current test were neutral: in further work they should portray these two scenarios.
These data did not, however, suggest a clear hierarchy. It may be that the images were not sufficient to reveal such an effect, and if confirmed by the pair-comparison data, the experimental design will be revised and the investigation repeated.
4. Conclusions
An experiment was conducted to test the features of other people which influence whether it feels safe to approach them when walking alone. It was confirmed that single males, with hands and face hidden, back-lit, and walking towards you are associated with a lower sense of safety. The data were not able, however, to establish a rank order for these factors.
CIE Session 2019 – Abstract Booklet
514

PO170
LED APPLICATION IN HELICOPTER COCKPIT LIGHTING
Gao, Y.P, Yu, J., Wang, L.X, Ma, X.F, Ma, J.R. School of Architecture of Tianjin University, Tianjin, CHINA
[email protected] Contacts: Juan Yu
Abstract
1. Motivation, specific objective
LED has been widely used in indoor and outdoor spaces of buildings. But for the internal space of the vehicle, which is also an important space for modern people, there is a lack of theoretical research and corresponding data bases for LED applications.
Helicopter as a special vehicle,putting higher demands on the quality of the lighting environment
required to meet visual tasks. Also, the external light environment of the helicopter's cockpit is variable and the self-luminous equipment in the helicopter's cockpit is sophisticated and varied. Therefore, Increased the difficulty of basic research in LED applications.
This paper is a basic data study of the application of LEDs in helicopter cockpit lighting systems, obtained the lighting environment parameters of the in-service helicopter cockpit and the subjective feeling evaluation data of the corresponding driver. Based on subjective and objective data, The research and development needs of LEDs for use in helicopter cockpit lighting environments have been clarified.
2. Methods
Launched the day and night on-board measurement, obtained luminance and chromaticity test data for self-emitting devices (Including LCD screens, meters, light guides, signal lights), and work plane illuminance, uniformity of illuminance, colour rendering index, spectral distribution and other parameters of environmental lighting (Including floodlights and spotlights). Aims to provide an objective data base for the application of LEDs based on visual ergonomics and visual comfort requirements to helicopter cockpit lighting systems.
Conducted a questionnaire survey and subjective interview with drivers,Topics include:Satisfaction with the cockpit light environment; Satisfaction of the interior lighting environment and the recognition of self-illuminating equipment of the cockpit under four conditions of sunny, cloudy, dusk and night; The degree of glare on sunny days; Satisfaction with interior surfaces, control surfaces and luminaire forms. The existing problems in the lighting environment of the in-service helicopter cockpit are sorted out, and the first-hand data from the user is provided for the LED application to the helicopter cockpit lighting system.
3. Results
1) Test data includes luminance and chromaticity parameters of 16 colours of 4 types of self-illuminating devices, illuminance and spectral parameters of ambient illumination.
2) Regarding the sun glare, although the driver has the adaptability, it causes the problem that the identification of the equipment in the cabin is not satisfactory.
3) The cockpit lamp has insufficient illumination and occlusion problems. The side-by-side cockpit is more obvious because its larger opening , which leads to the problem of unsatisfactory recognition of non-lighting equipment.
4) There are direct glare (such as over-illuminated warning lights) and indirect glare (glass reflective) at night interfered with equipment identification.
5) The brightness adjustment of some device is inconvenient and insensitive.
6) the cockpit colour recognition problem is mainly caused by insufficient illumination, and has nothing to do with the chroma itself.
CIE Session 2019 – Abstract Booklet
515
4. Conclusions
In summary, unlike conventional lighting space, the study of the cockpit lighting environment should consist of 3 parts:The first is the outdoor light environment, and the sunny and night cabin light environment is the key research condition ; followed by is the luminance and chrominance of the self-illuminating device ; the last is the ambient lighting in the cabin.
Therefore, the research and development needs of LEDs for use in helicopter cockpit lighting environments are as follows:
Improve the recognition of self-illuminating equipment under sunny and night conditions: to obtain the luminance range and luminance self-adjusting control curve that meet the requirements of the recognition of self-illuminating equipment under sunny and night conditions;
2) Improve the ambient lighting comfort at night: to obtain the Illuminance and illuminance uniformity of the ambient lighting under the night conditions that meet the visual comfort and visual efficacy requirements.
CIE Session 2019 – Abstract Booklet
516
PO171
MODELLING OF LARGE LIGHT SOURCES RADIATION TO THE UPPER HEMISPHERE – OBTRUSIVE LIGHT
Novak, T.1, Gasparovsky, D.2, Becak, P.3, Sokansky, K.4 1,3,4 VSB-TUO Faculty of Electrical Engineering and Computer Science, Ostrava, CZECH REPUBLIC
2 Slovak University of Technology, Bratislava, SLOVAKIA
Abstract
1. Motivation, specific objective
This article describes one possible way of conducting evaluation of lighting system in aspect of influence of emitted luminous flux on outdoor environment in upper hemisphere.
The first part of the article presents the current situation in the area of obtrusive light. It consists mainly opinions and motivations of individual professional associations. It is also bout different evaluations of influence of street lighting. Different opinions are compared into normative requirements on the street lighting and its influence in potentially influenced and observed areas.
The second part is focused on measurement, evaluation and limitations of the obtrusive light on practical/everyday examples and applications. For example, practical solution of critical situation that occur on the facades of residential buildings and solutions of excessive luminance that might be caused by active advertisement etc. Centers of cities and villages which are normally residential apartments that have windows facing out into narrow streets, in combination with installations of the street lighting, pedestrian crossing lighting, active advertisement lighting or architectural lighting, are areas with the highest occurrence of such a problem. Other options are represented as well, for example situation that are closely linked to the phenomena of dynamic sky (changes) in different areas. The discussion about dynamic sky phenomenon is accompanied with a summary of long-term observations. Of course, the discussion doesn’t end at the primary problematic areas of the city centers but rather extends to even relatively dark national parks where it compares the measured data in regard to time and location.
2. Methods
The above mentioned information stimulated research to find “simple” model of the radiation of the luminous flux to the upper hemisphere. It means that the model will evaluate the luminous flux (direct and indirect) not only generally, but to the affected directions too. The contribution describes how the model works. There is description of basic calculations of the luminous flux radiation characteristic. It is possibly modeled big outdoor lighting systems by the standard software. The calculations use direct and indirect part of the luminous flux. This vision allows evaluation of standard outdoor lighting systems on the base of known distribution curves and reflections of diffuse surfaces around. There is description of philosophy which allows setting of the calculation points in the net. Calculation points are spaced around the hemisphere surface and every point is directed to the center of hemisphere. This net of the calculation points work like software goniophotometer. It can evaluates distribution curves of the lighting systems or group of the luminaires. In case of the software goniophotometer it is necessary to calculate only direct part of the luminous flux. When we take the complete lighting system or lighting systems of town including reflected luminous flux from building and road surfaces it is necessary to build big enough radius of the calculation points. That is why it is possible to evaluate whole given space in the phase of project preparation. Because of the outdoor lighting systems are not only classical ones, the contribution shows how to implement billboards, windows and cars radiation to the calculation. There are used average distribution curves of it.
3. Results and Conclusions
Last parts of the contribution try to shows example of the real town lighting systems. Model can calculates different lighting system like street lighting, billboards, windows and cars separately. It shows their influence to the overall luminous flux radiated to the upper hemisphere. Other part of example is comparing two different types of street lighting system from this point of view. It means classical luminaires with high pressure sodium lamps against new luminaires with LED´s. Because of
CIE Session 2019 – Abstract Booklet
517

separating different lighting system it is possible to make a frame vision about structure of the luminous flux which is radiated to the upper hemisphere by artificial lighting systems.
CIE Session 2019 – Abstract Booklet
518

PO172
SMART POLYGON AT VSB – TU OSTRAVA 24 H/DAY USING OF PUBLIC LIGHTING NET
Tomáš Novák1, Radek Martinek1, Dionýz Gasparovský2, Jan Látal1, Karel Sokanský1, Lukáš Šoustek1, Radim Kunčický1, Lumír Kunčický1
1 VSB–Technical University of Ostrava, Ostrava, CZECH REPUBLIC, 2 Slovak University of Technology in Bratislava, Bratislava, SLOVAK REPUBLIC
Abstract
1. Motivation, specific objective
This contribution tries to explain basic philosophy and potential of modern traffic lighting. Its main idea is built on the permanent power supply principle. It means 24 hours a day instead of contemporary on average 12 hours a day. Permanent power supply allows application of CCTV security systems as part of comprehensive solution for towns, using of the traffic lighting network for data transmission, dynamic traffic lighting controlling based on real-world operation gained from the camera systems, or possibly reading for traffic lighting network to implement concepts of Smart City, Car2Car Communications, etc.
2. Methods
Currently, the polygon is equipped by 3 types of LED luminaires. These luminaires contain dimmable electronic ballast. Roads on the polygon were designed by norm EN 13201- 2 and set to the highest class of illumination (M1). The highest class of illumination was selected on purpose. It is possible to dim (regulate) every parts of polygon in a whole range of normative recommendations for traffic lighting. Dimming on polygon is realized because of used a control system testing. As a part of complex solution at polygon there were calculated light model included not only luminaires but every surface reflections too. This lighting model is used for comparisons between different set, measured and calculated situations on the polygon.
The entire polygon, included additional SMART technologies is controlled on the base of broadband communication. It is a real implementation of BroadbandLIGHT technological unit. An integral part of the system is a unique system for remote control of luminaires.
All key competencies and technology properties of BroadbandLIGHT technology are built on the base of protocol MQTT (Message Queuing Telemetry Transport). Controlling applications of it make an independent layer. This layer is separated from data transmissions. Our solution allows centralized management within web space and it uses server-side and browser-side technologies. Applications are divided via multilayered architectures. The control application itself works at servers and attendance layers. Solution like this provides a very good division of individual functional parts from the security, functionality, data distribution to whole technological complex of BroadbandLIGHT.
Basic system module on the luminaire level is BroadbandLIGHT LED driver. The driver works in connection with Ethernet standard. By this driver it is possible applies BroadbandLIGHT technologies to real operation via remote regulation and lighting management of all lighting classes. This module also provides connectivity to power supply system and allows communication via optical radiation in the visible parts of spectrum (reverse direction is in the infrared parts of spectrum or in the area of the non-license RF band).
Additional Bias-T based power LED modulator is designed on the luminous flux modulation. Lower frequency of luminous flux modulation is 2 MHz with the current minimum bandwidth 100 MHz. These parameters of Bias-T, allows deployment a chipset technology operating in the frequency band from 2 MHz to 34 MHz. It enables a data transfer rate up to 100 Mbps. That is why the developed LED modulator transmits information in visible parts of spectrum via LED´s of all power classes.
Measurement of the power quality through virtual instrumentation within the BroadbandLIGHT technology is part of the system at the level of the traffic lighting switchboard. The principle of the proposed system is the measurement and evaluation of electrical units (voltage, current) according to EN 50160 and EN 61000 standards. The measuring system itself consists of a standard chassis,
CIE Session 2019 – Abstract Booklet
519

measuring card, current and voltage converter. Every output of the converters is connected to the measuring card and these data are processed by a virtual measuring device.
The system also includes software for centralized remote control of other individual SMART- technologies. The main goal of the developed application is to perform system integration to use components from different manufacturers into one comprehensive control application. It is designed for long-term measurement, control and monitoring of the BroadbandLIGHT polygon. The application architecture includes plug-in solutions based on a producer-consumer because of the extensibility and overall modularity of the application. Inbuilt plugins included official toolkits and a custom library of plugins as well.
The system described above is currently ready to simulate various lighting situations, to measure electrical parameters and especially to test SMART superstructure applications implemented in modern traffic lighting networks.
3. Results
All results from our developed BroadbandLIGHT polygon will be posted in the full article.
4. Conclusions
BroadbandLIGHT polygon consist of many SMART technologies/IoT/ Wi-Fi modules etc. Our future plans is using of special types of cameras for digital image processing of cars and another objects. Another challenge is data mining from the SMART sensors.
CIE Session 2019 – Abstract Booklet
520

PO173
IMPLICATIONS OF LIGHT SOURCE SELECTION IN A NIGHT TIME ENVIRONMENT
Ronald B. Gibbons1, Rajaram Bhagavathula1, Paul Lutkevich2, George Brainard3, John Hanifin3
1 Virginia Tech Transportation Institute, Blacksburg, Virginia, USA 2 WSP Inc, Boston, MA, USA
3 Thomas Jefferson University, Philadelphia, PA, USA
Abstract
1. Motivation, specific objective
The selection of the light source and the lighting level to be used on a roadway has become increasingly more complex with the implementation of LED. The issue is primarily the spectral output and the CCT. With increasing knowledge of the impact of lighting on humans, fauna and flora along the roadway, the spectral choices are becoming more critical. The objective of this investigation is to consider the light source selection from a variety of impacts both positive and negative and to provide some guidance on an approach for light source selection.
2. Methods
This effort is primarily the evaluation of existing research on the impact of lighting including the positive impact of lighting on the human in terms of visual performance and visibility in the roadway and the negative impacts on humans, vegetation, animals and sky glow. These documented results are evaluated for 6 different areas of consideration. The first is roadway safety, followed by energy consumption, impact on humans, impact on the environment, public acceptance and the impact on light pollution. Each of these characteristics of the lighting system need to be considered in the light source selection process and the importance of one characteristic over another may change based on the location of the roadway and the surrounding area. As an example, impact on animals and turtles would be a more critical consideration in area close to hatching areas where as road safety may be most critical in an area with high pedestrian activity.
3. Results
The results of this investigation provide a literature review of the effects of lighting in the roadway environment. It also provides the approach to reduce the impact. These approaches are highlighted below.
Issue Solution
Roadway User Safety Depends on Application
Energy Consumption Lower Light Levels and use Solid State
Public Perception and Acceptance Depends on Application
Environmental Impact Reduce or Remove Lighting
Impact on Light Pollution Control Lighting, Reduce or Remove Lighting
Impact on User Health Use Warmer Colors / Reduce Lighting
The balance of these factors is a decision made through agency and public review of the user needs.
4. Conclusions
The results provide information and guidance to evaluate the positive and negative impacts of roadway lighting. Through careful evaluation of the lighting needs, the proper light source and lighting level can be selected for the application in the roadway environment.
CIE Session 2019 – Abstract Booklet
521
PO174
DEVELOPMENT OF PRO-BEAM ROAD LIGHT
Toru Hagiwara1, Shunsuke Kohko12, Katsunori Okajima3, Hidekatsu Hamaoka4, Shoji Kobayashi1 1 Hokkaido University, Sapporo, Hokkaido, JAPAN
2 Iwasaki Electric Co., Ltd., Tokyo, JAPAN 3 Yokohama National University, Yokohama, Kanagawa, JAPAN
4 Akita University, Akita, Akita, JAPAN
1. Backgrounds and Objectives
The Cabinet Office of the Japanese Government has set a target for reducing the annual number of traffic fatalities in which the death occurs within 24 hours after the accident to less than 2,500 by the year 2020. To achieve the abovementioned target in Japan, it is required to reduce night time pedestrian-vehicle accidents at mid-block locations. Most pedestrian fatalities at mid-block locations result from the failure of the driver to detect pedestrians at night. The visibility of pedestrians who cross highways at night should be improved.
The present study proposes a novel road lighting system that uses pro-beam light distribution. The visibility performance afforded by conventional road lighting has raised concerns about conflicts between road lighting and vehicle lighting, and the visual contrast of the pedestrian is known to depend on the relationship between the driver’s position and the pedestrian’s position. Pro-beam road light is a foundational solution for enhancing the visibility of pedestrians crossing the road. The pro-beam road light is oriented toward a traffic flow. The luminance under the pro-beam road light was constantly higher for targets on the road than for the background. In the present study, we developed a proposed pro-beam luminaire that uses existing LED lamps and is designed to adjust the pro-beam road lighting distribution to achieve an ideal distribution.
2. Experimental Method
In the present study, we designed and produced luminaires equipped with an LED module with a lens to achieve the performances of the pro-beam road light. There are three different types of units, each containing different LED modules with a lens: narrow-angle beam (8 deg.), middle-angle beam (16 deg.) and wide-angle beam (28 deg.). Each unit has a different irradiation angle to satisfy the light distribution of the pro-beam road light. The produced pro-beam road light fulfilled the criteria defined in “Road Lighting Installation Standards 2007” of Japan.
The study conducted a field experiment and a laboratory experiment. The field experiment evaluated the visibility performance of pro-beam road lighting in comparison with conventional road lighting on the dry and wet road surface. Road surface luminance, vertical illuminance and glare assessment were measured on a test track. The laboratory experiment used recorded images and a test subject who simulated a driver in order to determine from how far away pedestrians crossing the road could be detected. These images were recorded to show pedestrians crossing the test track in front of a running vehicle at night for each of the pro-beam road light condition.
3. Results
We measured the vertical illuminance at 0.8m high under the pro-beam road light. The average value was 26(lx), the maximum value was 38(lx) and the minimum value was 9.7(lx)) . However, when the distance was 40m for vehicle position VA and 50m for vehicle position VB, the values of vertical illuminance with the conventional road lighting were less than 5(lx). The value of threshold increment (TI) of the proposed pro-beam road light for the driver was 7% to 11%. Also, the TI value for the pedestrian on the sidewalk was 8% to 12%. These values are less than the standard maximum permitted TI value 15% for the road lighting.
The averaged distances from the conflict point for the pro-beam road light were approximately 5 m for the right-to-left crossing. Also, the averaged distances from the conflict point were approximately 4 to 5 m for the left-to-right crossing. These values indicate that the pedestrians on the right and the left sidewalks were detectable by the drivers. However, the averaged distance from the conflict point with the conventional road light under low vertical luminance area was approximately 2 to 3 m for both
CIE Session 2019 – Abstract Booklet
522

crossing directions. This is similar to the averaged distance from the conflict point for the only low-beam condition.
4. Conclusions
The following findings were obtained from the experiment using the pro-beam road light on the test track.
1) The pro-beam road light provided enough vertical illuminance in both the driving lane and the opposing driving lane.
2) The glare for the driver and the pedestrian on the sidewalk were at an acceptable level.
3) The laboratory experiment using images indicated that the distances from the conflict point were greater for each of the two types of the pro-beam lights than for conventional road lighting.
Based on the results of the present study, the pro-beam road light was found to afford considerably stable visibility performance in the driving lane than conventional road lights afforded. It can be concluded that the pro-beam road light is effective at increasing the visibility performance of a pedestrian crossing the road.
CIE Session 2019 – Abstract Booklet
523
PO175
EFFECTIVE LIGHTING FACTORS FOR IMPROVING VISIBILITY OF FALLEN OBJECTS ON THE ROAD AT EXPRESSWAY TUNNEL
Ikeda, Y.1, Okusa, K.1, Utsunomiya, S.1, Miyake, K.2, Jinno, M.1 1 Ehime University, Matsuyama, JAPAN, 2 West Nippon Expressway Engineering Shikoku Company
Limited, Takamatsu, JAPAN
Abstract
1. Motivation
To secure the driver’s visual environment has the priority in tunnel lighting design. The visibilities of preceding vehicles and of on-road obstacles are the most important factors in tunnel lighting determining the safety in the visual environment. In this study, the authors verified the visibility improvement effect of the Pro-beam lighting. The authors investigated the necessary luminance ratio of objects and background road surface to recognize the objects in a tunnel. The authors also investigated the other lighting factors (including the equivalent veiling luminance and illuminance) and the relationship between these lighting factors and visibility.
2. Methods
The 1/24 scale of miniature tunnel model in which LED lights were installed was used. The road surface was prepared two types of asphalt and concrete. The LED lights were consisted of two different types of luminaires. One of the light distribution characteristics of them is Pro-beam distribution and the other is symmetric distribution. The illuminance on road surface occupied by Pro-beam was changed from 0% to 100 % by 25 %. The angle between the direction of Pro-beam and vertical line (Pro-beam angle) was varied at 45 °, 60°, 70°, and 80°. The average road surface illuminance was kept regulated value for asphalt and concrete road following Japanese installation standards of road illumination [1]. The necessary luminance ratio was determined by subjects’ evaluation and optical measurement. The illuminance on road surface occupied by Pro-beam was changed three patterns of 0 %, 70 %, 100 %. The Pro-beam angle was kept constant at 45°.
3. Results
Firstly, Luminance contrast between objects and background road surface dependency of visibility was confirmed. In case that the luminance contrast between objects and background road surface was higher than 1.40, subjects recognized the objects as reverse silhouette on the asphalt road. In case that the luminance contrast was lower than 0.73, subjects recognized the objects as silhouette. Namely, the range of the luminance contrast where the subject could not recognize the object was from 0.73 to 1.40 on the asphalt road. On the other hand, on the concrete road that range was from 0.82 to 1.35.
These results show that the visibility is mostly determined by the luminance contrast. However, the luminance contrast that the subject could recognize the object was different between asphalt road and concrete road. The range of the luminance contrast where the object is invisible depends of the type of the road surface. This difference is attributed to the lightness of a surrounding environment. We calculated multiple regression analysis with the visibility as the objective variable and the illumination factor as the explanatory variable. For the explanatory variables, the horizontal plane illuminance, the vertical plane illuminance, the luminance of background road surface, the object reflectance, the equivalent veiling luminance, luminance of the object, the luminance ratio between the object and the background road surface were used. From the result calculated by the stepwise method, there is a possibility that the vertical surface illuminance around the object is an explanatory variable in addition to the luminance ratio.
The effect of vertical illuminance on subjects is currently under consideration. These results show that the visibility can be sufficiently evaluated easily by the luminance ratio between the object and the background road surface. Such a method of statistically extracting lighting factors for visibility is effective. In addition, the lighting factor which was not considered as an explanatory variable this time, for example, the colour difference between the object and the background road surface is an effective factor which improve the visibility sufficiently.
CIE Session 2019 – Abstract Booklet
524
4. Conclusions
The visibility is mostly determined by the luminance contrast between objects and background road surface. The objects are not recognized in case that the luminance contrast was between 0.73 and 1.4 on the asphalt road or between 0.82 and 1.35 on the concrete road. The surface luminance contrast is important index to evaluate the visibility. However, the visibility is affected by the lighting environment. In statistical analysis results, the vertical illuminance was an important lighting factor in addition to the luminance ratio.
CIE Session 2019 – Abstract Booklet
525
PO176
EVALUATION BETWEEN ENERGY EFFICIENCY, ECOLOGICAL IMPACT AND THE COMPLIANCE OF REGULATIONS OF ROAD LIGHTING
Jägerbrand, A.K.1 1 Department of Construction Engineering and Lighting Science, School of Engineering, Jönköping
University, P.O. Box 1026, SE-551 11 Jönköping, SWEDEN
Abstract
Road lighting and outdoor lighting often have a high energy consumption owing to the long operating hours and requirements of luminance levels needed for fulfilling the regulations for traffic safety. Light emitting diodes (LED) is now widely applied as road lighting and can offer energy-efficient and environmentally friendly solutions when used correctly, while still fulfilling the traffic safety requirements. However, considering LED lighting from a sustainable and ecological perspective, the use of outdoor lighting can cause unwanted light pollution, ecological impact and environmental degradation.
Such unwanted impact will be especially harmful for endangered and protected species such as those protected by the Habitat Directive and national legislations to ensuring the conservation of protected species. When species that are sensitive to artificial light will be exposed in their natural environment, their survival or foraging might be affected in a detrimental way, which is forbidden by the legislation. Such ecological impact must be minimised by measures and reduced to levels that will not have a negative impact on species survival and well-being. Despite this, light designers and environmental officials have very little information on how such road lighting should be designed and still fulfil the regulations needed for safety reasons for road lighting while being the most energy efficient solution. In fact, neither light designers nor ecologists know how such road lighting should be designed, which leads to suboptimal and costly solutions without any evidence of reduced ecological impact.
By using dialux simulations, a number of scenarios of road lighting designs was tested and evaluated from the three perspectives of energy efficiency, ecological impact and compliance of regulations for road lighting. The road had a width of 7 m and was surrounded by green lanes (40 m into the surrounding), and the burning hours was 4000. Four different luminaries were used for the same dimension of road (width), where the luminaire pole distance varied between 10-40 m and the pole height varied between 3-8 m. The compliance of regulations was analysed by the computed average road surface luminance, longitudinal uniformity and threshold increment, whereas energy efficiency was analysed by power density indicator (DP), and the AECI (annual energy consumption indicator). The ecological impact was analysed by ecological thresholds for horizontal illuminance at distances from the road lighting installation (back and front).
CIE Session 2019 – Abstract Booklet
526

PO177
STUDY ON IMPROVEMENT OF LOW-LEVEL ROAD LIGHTING INSTALLATIONS IN A POOR VISUAL RANGE
Karasawa, Y.1, Wada, H.2 1 Panasonic Corp., OSAKA, JAPAN, 2 Central Nippon Expressway Co. Ltd., Tokyo, JAPAN
Abstract
1. Motivation, specific objective
Low-level road lighting installations are effective to prevent collapse and drop of road facilities in the event of accidents and disasters, provide ease of inspection and produce less light pollution. In a poor visual range such as in dense fog or heavy rain, irradiation from road lighting installations may produce veiling luminance, resulting in a further decline in visibility. Low-level road lighting installations that are mounted on a lower position emit considerably less light in space, namely producing less veiling luminance as compared with lighting poles. In addition, a shorter distance between each lighting installation provides ease of recognition of road alignments. Strengthening these advantages of Low-level road lighting installations may contribute to enhanced driving safety at high speed.
With this in view, this paper conducted operational experiments with the aim of finding the best combination of colour temperature and luminous intensity distribution in a poor visual range.
2. Methods
(1) Experiment 1(February 28, 2018 at Mitaka-city, Tokyo)
[Objective] Evaluate an effective colour temperature and luminous intensity distribution in a poor visual range
[Equipment] Low-level road lighting installations: 3 units (spacing of 6 m respectively)
[Conditions]
- Environmental conditions: Visual range in fog: 10 m
- colour temperature: 5000 K, 4000 K, 3000K
- Luminous intensity distribution: (a)Lighting concentrated on the roadway , (b)Lighting concentrated on the shoulder of a road
[Evaluation method] Evaluate colour temperature and luminous intensity distribution by10 lighting engineers
(2) Experiment 2(June 5, 2018 at Chuo Expressway, Yamanashi-pref)
[Objective] Evaluate glare and flickering on actual roads
[Equipment] Low-level road lighting installations: 10 units (spacing of 6 m respectively)
[Conditions]
- Environmental conditions: Nighttime
- colour temperature: 5000 K
- Luminous intensity distribution: (a)Lighting concentrated on the roadway , (b)Lighting concentrated on the shoulder of a road
[Evaluation method] Subjective evaluation on glare and flickering under driving by 10 lighting engineers
(3) Experiment 3(August 7-9, 2018 at Tsukuba-city, Ibaraki-pref)
[Objective] Evaluate an effective luminous intensity distribution in a poor visual range
[Equipment] Low-level road lighting installations: 17 units (spacing of 6 m respectively in a lighting section of 96 m)
CIE Session 2019 – Abstract Booklet
527

[Evaluation method] Subjective evaluation (five or nine ranks) and free exchange of opinions for “visibility of preceding vehicle” and “recognition of road alignments (visual guidance)” in a visual range of 50 m/100 m, and driving experiment for “glare,” by 10 lighting engineers
3. Results
(1) Experiment 1
No differences were observed in visibility (preceding vehicle, lane mark) in a poor visual range between colour temperatures. It was verified that lighting concentrated on the shoulder of a road had a capability of reducing veiling luminance significantly as compared with the lighting concentrated on the roadway and of improving visibility of a tail lamp of preceding vehicle and lane mark.
(2) Experiment 2
It was found that adverse effects on visual appearance of the driver were caused by trespass of a small amount of light into the vehicle from lighting installations that had no glare issues in standstill experiment.
(3) Experiment 3
1) Nighttime fog
a) Visibility of preceding vehicle
In subjective evaluation, lighting concentrated on the roadway (1.0 cd/m2) had slightly better results in a visual range of 50 m. In a visual range of 150 m, however, there were no significant differences between the two types of lighting installations.
In free exchange of opinions, the lighting concentrated on the shoulder of a road (60 lx) got favorable feedback such as “affording high visibility of a tail lamp of preceding vehicle”.
b) Recognition of road alignments (visual guidance)
In subjective evaluation, the luminaires on the Lighting concentrated on the shoulder of a road installations provided a longer visible distance approximately by 20% than others in the visual range of 50 m. In free exchange of opinions, the Lighting concentrated on the shoulder of a road (60 lx) got favorable feedback such as “making the shoulder of a road clearly visible” and “affording high visibility of lane mark.”
c) Glare
In subjective evaluation, all luminous intensity distributions produced “almost no annoying glare”. According to the feedback gained in free exchange of opinions, the lighting concentrated on the shoulder of a road was advantageous in reducing glare. But, even on the ordinary lighting installations, the luminaires with strictly restricted upward luminous flux produced favorable results.
2) Nighttime rain
In subjective evaluation, ordinary luminous intensity distributions had a slight advantage over those of Lighting concentrated on the shoulder of a road. But, water splashes by driving vehicles and veiling luminance could not be replicated. In a video taken on an actual road after the subjective experiment, strong veiling luminance were caused by water splashes in rainfall of 20 mm per hour.
4. Conclusions
Low-level road lighting installations with strictly restricted upward luminous flux not only contribute to environmental conservation and prevention of glare, but also reduce veiling luminance in foggy weather etc., providing higher visibility.
Under veiling luminance in nighttime dense fog, the lighting concentrated on the shoulder of a road (60 lx) brings the effects to provide “better recognition of road alignments” and “higher visibility of a tail lamp of preceding vehicle and lane mark. It is deemed appropriate that colour temperature is set to 5000 K based on the results of preliminary experiments.
In conclusion, we would like to express our sincere gratitude to Professor Toru Hagiwara, Hokkaido University for his advices and suggestions for this study.
CIE Session 2019 – Abstract Booklet
528

PO178
TUNNEL INTERIOR LIGHTING FOR SAFETY IN TWO-WAY TRAFFIC
Kishimoto, S.1, Ito, H.1, Abe, S.2, Soma, R.3 1 Panasonic Corp., Tokyo, JAPAN
2 Central Nippon Expressway Co. Ltd., Tokyo, JAPAN 3 Central Nippon Highway Engineering Tokyo Co. Ltd., Tokyo, JAPAN
Abstract
1. Motivation, specific objective
This paper proposes tunnel interior lighting systems for safety in two-way traffic on expressways. The target tunnel had longitudinal slopes with a sag vertical curve of 4 % at the maximum, which had been the concern of the rear end collision in speed degradation and a serious accident in the two-way traffic. Since 2010 in Japan, many tunnel lighting systems had been replaced by LED luminaires, which in some cases results in uneven luminance distribution of the road surface and discomfort glare even in the tunnels considered CIE recommendation of the uniformity of luminance and the glare restriction. Therefore, we studied the requirement for the tunnel interior lighting in two-way traffic.
2. Methods
2.1 Review of design values
The visibility of cars driving in tunnel depends on brightness in the rear end of the preceding cars and the front of the oncoming cars. Required values of vertical illuminance to foresight distance according to design speed already were proposed in order to secure the visibility of cars. Based on previous studies, required vertical illuminance of the rear end of the preceding cars and the front of the oncoming cars had been defined to 34 lx in 70 km/h of design speed as the target tunnel of this study. The level of vertical illuminance here is 1,7 times greater than the symmetrical lighting system used before, then the pro-beam lighting system that has ability to efficiently provide vertical illuminance had been adapted.
To calculate the uniformity of luminance, C classification system of road surface luminance reflection properties have applied in Japan. For generally used asphalt pavement with drainage in Japan expressways, C2 class in the C classification system has been used to calculate road surface luminance, however the difference between calculated results and measuring results on in-site of the luminance distribution of the road surface for LED tunnel lighting system tend to be large. Following to the on-site experiment for the LED tunnel lighting system in the asphalt pavement with the drainage, and by using the W2 class in the W classification system for calculation of luminance distribution of the road surface we could obtain roughly same results as actual experiment results in many cases. For that reason, we decided to apply W2 class in calculating the uniformity of luminance for convenient. CIE proposes recommended values of overall uniformity and longitudinal uniformity, however, no recommendation of the luminance uniformity which include the impact on comfort caused by luminance distribution of road surface against tunnel transversal direction. Thus, we conducted an on-site experiment for observational evaluation in order to define the transverse uniformity which was obtained to use the luminance distribution of the road surface and to divide a value of minimum luminance by a maximum luminance. As defined there, the value of the transverse uniformity of luminance should to be more than 0,6.
Regarding glare restriction in tunnel interior lighting systems, if TI had not exceeded 15 % of the CIE recommended value, it was considered that discomfort glare is acceptable. However, that was not a typical case for LED tunnel lighting. The on-site experiment showed that the discomfort glare was correlated with an equivalent veiling luminance, thus the value of the equivalent veiling luminance was defined as not to exceed 0,3 cd/m2.
2.2 On-site experiment
Experiment was conducted to evaluate the visibility of car located ahead, and visual environment for the LED tunnel lighting system at Hachinoshiri tunnel in Yamagata, Japan installed pro-beam lighting
CIE Session 2019 – Abstract Booklet
529
system based on above lighting requirements for tunnel interior lighting. In the tunnel, LED luminaires were arranged with opposite arrangement, mounting height of 4,73m and spacing of 8,7m.
11 subjects in the car placed in the carriageway evaluated the visibility of car located ahead using five-point scales, discomfort regarding of uniformity of road surface luminance using five-point scales and discomfort glare using nine-point scales.
3. Results
Regarding the visibility of the cars located ahead, the result of the experiment showed that it was found that the visibility was higher than “Just admissible” in the five-point scales. Our concern was that the increased vertical illuminance to improve the visibility of oncoming car might be a discomfort glare for the drivers. However, we could receive good results more than level of “Satisfactory” in nine-point evaluation. Additionally, about uniformity of luminance, we had an overall rating of better than average in the five-point scales.
Asphalt pavement with drainage was used in the tunnel carried out experiments. Comparing the measurement of the road surface luminance distribution with the calculation results, the use of W2 rather than C2 properly predicted the degree of uniformity.
4. Conclusions
In tunnels with-two way traffic, since actions to avoid danger are restricted, it is necessary to make the driver properly recognize the behavior of both the preceding cars and the oncoming cars. Subject to LED lighting criteria in this paper, the level of visibility for the preceding cars and oncoming cars can be enhanced one grade out of five-point scales evaluation compared to the visibility of the traditional symmetrical lighting systems. In this way, we can control the uneven luminance distribution of the road surface and discomfort glare to ensure the required visual environment in driving. In the evaluation of the uniformity of luminance uniformity in the asphalt pavement with drainage, the road surface luminance distribution at the site can be relatively appropriately predicted by using W2.
CIE Session 2019 – Abstract Booklet
530

PO179
VISIBILITY OF TUNNEL EVACUATION LIGHTS IN A REAL FIRE
Larsen, Pål Johannes1, Jørgensen, Arne2, Hafdell, Petter3 1 Norconsult AS, Sandvika, NORWAY, 2 Norwegian road authorithy, Oslo, NORWAY, 3 Swedish road
authorithy, Stockholm, SWEDEN
Abstract
1. Motivation, specific objective
Many products in evacuation lighting for tunnels the later years has been introduced with LED. The possibilities for more light, dynamic lights and coloured lights are greater then what was the case with traditional lighting. The supporting road authorities for this study wanted to investigate what level of guiding, orientation and general feeling of safety evacuation lighting according to todays demands give, and to what extent an increased light level is linear related to these criteria’s.
2. Methods
A 100 m test tunnel were equipped with 30 m of continuous LED line light at 1 m above ground, 3 different evacuation light fixtures with a 25 m CC distance, and 3 normal tunnel luminaires. 3 cars were fired up, with 3 different ventilation schemes giving different setups of smoke density and layering. The visibility of the lights were evaluated by 7 test persons and 2 firemen, all 9 persons were present during the whole relevant period of fire (approx.. from fire and 20-25 minutes) with oxygen masks. All luminaires light level were also documented by a logged illuminance meter and a videocamera at 1 m distance.
3. Results
Field test is done, but report on results are under work.
4. Conclusions
Field test is done, but report on results are under work.
CIE Session 2019 – Abstract Booklet
531
PO180
UNIFORMITY PREDICTS PEDESTRIAN REASSURANCE BETTER THAN AVERAGE ILLUMINANCE
Fotios, S.1, Liachenko Monteiro, A.1 1 University of Sheffield, Sheffield, UNITED KINGDOM
Abstract
1. Background
There is a common belief that brighter lighting results in roads that are perceived as being safer, an increase in reassurance. This is a primary determinant of the light levels specified in design guidance. One problem with measuring this effect is the influence of range bias – higher reassurance will correlate with higher brightness regardless of the absolute level of brightness. Boyce et al proposed the day-dark method to overcome this and conduced a field study of lighting in car parks. This paper describes two field studies carried out to measure reassurance in residential streets using the day-dark method.
2. Methods
The day-dark method uses category rating to evaluate factors associated with reassurance in both daytime and after dark. The current studies sought evaluations of nine items using a six-point response scale. The optimal illuminance is that which minimises the difference between ratings given in daytime and after-dark. Two field studies were carried out, in the winter periods of 2016 and 2018, using an overlapping selection of urban locations. The overlap allowed an analysis of repeatability. The roads were in residential areas in a European city. They had average illuminances in the range of about 1 to 60 lux and were lit using HPS and LED sources. The photometric characteristics of each test location were measured following European Standard 13201-3:2015.
The first study included 24 test subjects who evaluated ten locations, while in the second study 36 subjects evaluated 16 locations. A repeated measures design was used, in which subjects carried out evaluations of the same locations in daytime and after dark. The day-dark order was balanced as was the order in which the roads were evaluated. The daytime questionnaire contained nine questions (plus an attention-checking question) ‘how safe do you think this street is’ and ‘how risky do you think it would be to walk alone here at night?’. The after dark questionnaire contained these plus five further rating scales about the lighting (e.g. brightness and evenness).
3. Results
Two key findings of the winter 2016 field study were (1) that after-dark evaluations of reassurance do not correlate with horizontal illuminances, and (2) that the day-dark difference correlates better with uniformity (r2=0.85) or minimum illuminance (r2=0.85) than with average illuminance (r2=0.53). The 2018 field study is therefore targeting a wider range of uniformities to confirm that is a robust conclusion.
4. Conclusions
Two field studies were carried out in residential roads to determine which photometric characteristics best predict the degree of reissuance held by pedestrians. The results suggest uniformity to be a better predictor than average illuminance. To reduce the day-dark difference to an average of 0.5 units (on the 1-6 response scale) would require a minimum uniformity of approximately 0.25, slightly higher than the uniformity implied by CIE115:2010.
CIE Session 2019 – Abstract Booklet
532
PO181
CHARACTERIZATION OF REFLECTIVITY AND GEOMETRY FOR SOFT CAR TARGETS
Lindgren, M., Spetz, J., and Nord, S. RISE Research Institutes of Sweden AB, Borås, SWEDEN
Abstract
1. Motivation, specific objective
Advanced Driver Assistance Systems (ADAS) and Automated Driving (AD) vehicles rely heavily on optical sensors. Extensive testing of optical sensors is required and typically performed at test tracks like AstaZero in Sweden. Soft surrogate vehicle targets are used for safety reasons, but the optical characteristics of surrogate targets may differ considerably from that of real vehicles. During tests the quality of the soft surrogate targets deteriorates due to repeated impacts and reassembly of the targets, and there is a need for methods to secure the quality of the soft surrogate targets over time.
The objective of the project was to enable efficient and reliable verification of optical sensor systems, including ADAS and AD systems that rely on the optical sensors, through:
• Development and validation of accurate and repeatable measurement methods of the optical and geometrical characteristics of soft surrogate targets.
• Provide input to the development of more realistic surrogate car targets for safe testing of automotive optical sensor systems.
• Demonstration of improved verification with the developed measurement methods.
• Supporting international standardization with standard methods enabling future verification and calibration of optical and geometrical characteristics of active safety soft surrogate targets.
2. Methods
RISE has conducted a project together with Volvo Cars and Veoneer to develop and validate accurate and repeatable measurement methods of the optical and geometrical characteristics of 3D soft car targets. In particular, the Euro NCAP 2018 Global Vehicle Target, which is used in the car-to-car test protocol, was evaluated. The goal is to support international standardisation with standard methods enabling future verification and calibration of optical and geometrical characteristics of active safety 3D soft car targets. In the project, suitable and repeatable measurement methods for these characteristics have been studied.
Spectrally resolved measurements of reflectivity were performed on new and used 3D soft car targets from different manufacturers. A portable measurement apparatus based on an array spectrometer and fibreoptic probes was developed for this purpose. In particular, one target was exposed to 100 hits at 50 km/h by a test vehicle and measurements were performed during the entire test campaign. In addition, measurements were made on real vehicles, in order to compare with results from soft car targets.
Laser scanning was used to measure the geometry of the soft car target with millimetre precision. Measurements were also made on a 2011 Ford Fiesta, which is the model vehicle for the soft car target. The repeatability of disassembly and assembly was also tested in this way.
3. Results
The 3D soft car target had 43 points marked on its shell to make sure all measurements were taken at the same spot on the target. These points were divided into four groups, left, right, front and rear. The measurements consisted of data from 300-1150 nm and the areas from 400 to 800 nm (visible range used by the camera system) and 890 to 920 nm (infrared range used by Lidar systems) were analysed. Measurements were made with 10-hit interval during the 100-hit campaign.
The results from measurement of reflectivity show little dependence on the number of hits. The variation observed was shown to depend on the weather conditions and general cleanliness of the soft car target. Analysis was made for spectral reflectivity, RGB response (similar to visual camera signal), and u’v’ chromaticity.
CIE Session 2019 – Abstract Booklet
533

High-precision measurements of the soft car target geometry showed significant deviations, both resulting from assembly/disassembly and from the 100-hit accelerated ageing. The typical variation due to assembly/disassembly was ~80 mm, while the variation due to accelerated ageing was ~120 mm.
4. Conclusions
The study has shown that the change in reflectivity induced by wear-and-tear is not large and generally masked by changes caused by varying weather conditions, dirt, rain, snow, etc. Consequently, the recommendation for future standardization is to focus more on handling of the soft car target in terms of cleaning during test campaigns than exact reflectivity measurements.
The geometry measurements showed a significant variation in physical dimensions for the soft car target. Consequently, future standardization should include requirements for the target geometry, both in static and dynamic conditions. Furthermore, the study showed that simpler measurement devices, e.g. camera-based geometry measurement provides sufficient accuracy to determine the target integrity.
CIE Session 2019 – Abstract Booklet
534
PO182
HAZARD DETECTION: TESTING THE CAVEATS OF PREVIOUS STUDIES
Fotios, S.1, Mao, Y.1, Yao, Q.2 1 University of Sheffield, Sheffield, UNITED KINGDOM
2 Shenzen University, Shenzen, CHINA
Abstract
1. Background
Recent experimental studies have examined how the detection of pavement hazards is affected by changes in the illuminance of road lighting. For the proposed critical hazard these studies suggest a horizontal illuminance of 1.0 lux. However, those experiments were conducted using simplified situations which raise questions of the extent to which the results can be safely generalised to wider situations. In particular, the hazards were always raised above ground level (kerbs, but not pot holes); variation in lighting geometry was ignored; and detection was not impaired by glare. This paper describes further experimental work carried out to explore the significance of these factors.
2. Methods
The detection of peripheral objects was examined in a scale model, a chamber approximately 1.2 m wide, 1.2 m deep, and 1.2 high. Test participants looked towards a dynamic fixation target on the rear wall of the apparatus: this included a simple digit recognition task to ensure foveal viewing was maintained. The floor of the apparatus contained four cylinders, normally flush with the floor of the apparatus, but which could be raised or lowered by incremental amounts. The chamber was lit from overhead by LED arrays in three positions – either overhead of the furthest target, or in front / behind that target relative to the participant. In a trial, the scene was observed for 500 ms (as controlled by occlusion glasses) and the participant reported which, if any, of the obstacles were raised. Null condition trails were included; experiment sequences were randomised. Data were analysed using correct detection rate plotted against target height.
EXPERIMENT 1 examined light source location and compared detection of raised and lowered targets. There were three lighting conditions, this being changes in the location of the light source (above, behind and in front of the target), with each providing the same illuminance (1.0 lux) and SPD ratio at the target location. Detection targets were both raised and lowered cylinders. There were 20 participants. EXPERIMENT 2 examined the influence of glare. There were four lighting conditions, target illuminances of 0.2, 0.6, 2.0 and 6.3 lux, all with the same SPD. The targets were lowered cylinders. Glare simulated the headlamps of an oncoming vehicle. There were 20 participants.
3. Results
Experiment 1: The results did not suggest a difference between the detection of raised and lowered hazards. There was a significant effect of lamp position, with a lower (p<0.001) detection rate when the hazard was front lit than when it was lit from overhead or behind.
Experiment 2: The results suggest a significant effect of glare at the lower illuminance (0.2 lux) in that the detection rate reduced by approximately 50%. At the higher illuminances, the results do not suggest a significant effect of glare on hazard detection rate.
4. Conclusions
The aim of this work was to question aspects of experimental design in previous work which has led to a proposed horizontal illuminance of 1.0 lux as being adequate for obstacle detection. There was no difference in the detection of raised and lowered hazards (i.e. both kerbs and potholes) which means the proposal is supported. There was an effect of light source position: it would be impractical to conduct experiments for all possible observer-lantern-hazard geometries. What might be necessary is to establish worst-possible arrangement and investigate hazard detection in that context. The presence of glare reduced detection ability at low ambient illuminance. One way to account for this would be to establish a representative set of glare sources and use disability glare models such as CIE146:2000 a model to establish the threshold adaptation illuminance at which the impairment due to
CIE Session 2019 – Abstract Booklet
535

glare transfers between the escarpment and plateau. Note, however, that for the conditions of this experiment, disability glare did not have significant effect at the proposed design minima of 1.0 lux.
CIE Session 2019 – Abstract Booklet
536
PO183
CORRELATING THE PARAMETERS OF COMMERCIAL SIGNAGE IN URBAN AREAS AND VISUAL COMFORT OF PEDESTRIANS
Yingying MENG, Biao YANG School of Architecture, Harbin of Institute Technology (Shenzhen), Shenzhen, Guangdong, CHINA
Abstract
1. Introduction
With the development of urban economy, the number of people liking to go around at night has increased significantly, and commercial lighting at night has also flourished. But at the same time, night-time commercial lighting also caused light pollution. There are quite a few studies have shown that commercial signage will cause visual discomfort on drivers. However, few studies have put attention on pedestrian visual discomfort that caused by commercial signage. The lack of government monitoring and the lack of regulation on the luminance of commercial signage are the main reasons for the abuse of commercial signage, which leads to visual discomfort of pedestrians. Therefore, it is necessary to study the technical parameters of commercial signage, which can improve commercial lighting standard in urban areas, and thus prevent light pollution. In order to improve the visual environment of pedestrians at night, this study will explore the influence of commercial signage on the visual comfort of pedestrians.
2. Methods
Ten commercial districts were selected in Shenzhen. The criterion of selecting commercial streets in the 10 commercial districts was that the number of commercial signage was more than 100 in a 100-meter-long street. Ten participants were asked to walk freely on the street to find out two comfortable and two uncomfortable examples of commercial signage. Considering the inter-rater reliability, commercial signage provided by at least two people were considered as target samples. The experimenters went to the selected street to measure the parameters of commercial signage. At present, the comfort evaluation and measure of commercial signage on three streets in Shenzhen has been completed. 10 comfortable and 10 uncomfortable commercial signage photos were regarded as target examples of commercial signage.
The luminance photo was measured using the imaging luminance meter. The ambient light was measured using the illuminometer, and the size, height, observation distance, and observation angle of the commercial signage were measured using a rangefinder. The luminance photos were used to recreate the luminance distribution of target commercial signage in lab. Since the luminance of conventional display cannot reach the range of luminance that outdoor commercial signage can achieve. Therefore, two 1.2m*1.2m LED displays were used. The maximum luminance of each LED is 4000 cd/m2. In order to preserve the fidelity of actual luminance of the target commercial signage, luminance photo were exported directly into the LED display.
Two different luminance photos of commercial signage were presented on the LED displays simultaneously. Ten participants have taken part in the experiment. They need to make a binary choice of the one with more visual comfort, between one of the two presented commercial signage. For each participant, all possible pairs (190 in total) of target commercial signage were presented in counterbalanced sequence.
3. Results
For each target commercial signage, the frequency of being chosen by the 10 participants was recorded as raw data. Technically, this frequency may vary from 0 to 190 (indicating a perfect perceived visual comfort). The rank of target commercial signage can be determined according to the order of such frequency. Commercial signage comfort order is arranged from 1 to 20. Correlation between the target commercial signage based on visual comfort rank and parameter measure in field were explore statistically. In the preliminary experiment, three target parameters were selected: average luminance level, background environment illuminance, and maximum brightness.
CIE Session 2019 – Abstract Booklet
537
Significant correlation was found between visual comfort and maximum luminance (p<0.05). However, no significant correlation was found between visual comfort and either average luminance level or background environment illuminance. The results suggest that the greater the maximum luminance value of commercial signage is, the lower level of visual comfort of pedestrians will be.
4. Conclusions
The two aims of this study are explore the impact of commercial signage in commercial city centres on pedestrians’ visual comfort and to find the threshold for each target parameter under visual comfort conditions. It was found that maximum brightness is the factor that affects pedestrian comfort until now. The next step is to complete correlation analysis of comfort and other parameters such as solid angle, brightness uniformity and so on. The follow-up work is to complete the subjective evaluation and measurement of commercial signage on the remaining seven streets, and compare all the commercial signage in pairs. For further study, more target alternative parameters is needed to determine the comfort threshold.
CIE Session 2019 – Abstract Booklet
538

PO184
EFFECT OF BACKGROUND LUMINANCE CALCULATION METHOD ON VL VALUE IN ROAD LIGHTING
Buyukkinaci, B.1, Onaygil, S.2, Guler, O.2, Yurtseven, M.B.2 1 ISBAK Istanbul IT and Smart City Technologies Inc., Istanbul, TURKEY,
2 Istanbul Technical University, Energy Institute, Istanbul, TURKEY
Abstract
1. Motivation, specific objective
In road lighting calculations, visibility level (VL) is one of the performance criteria for determining the lighting quality. Visibility level is defined as the measure that indicates how far the luminance of an object of defined size, shape and reflectance, is above the threshold of the luminance. Visibility of an object is calculated by the difference in luminance between an object and its background. Because it is not clear what to take as the background luminance, different methods may be used such as taking the average background luminance of the bottom and top, right and left, the four sides of the object or the background luminance on that side of the object that leads to the highest contrast. The objective of this study is to show how given background luminances change the VL values for objects under different road lighting classes. Thus, it is to draw attention and contribute to the need to determine the method of background luminance determination which will be accepted as general in VL calculations for the road lighting designs.
2. Methods
The luminance measurements are carried out in our test road for the fixed observer, located 60 meters behind the calculation area. The luminous flux of the luminaires on the test road are controlled by 1- 10V and different luminous flux values are adjusted to deliver M2, M3, M4, M5 road lighting classes according to the EN 13201-1 standard. A 20 cm x 20 cm flat square object with a Lambertian surface is used. VLs of critical objects for all measurement points on the test road are calculated for the average background luminance at the right and left sides, bottom and top sides of the object, the average background luminance at four sides of the object and the background luminance with the maximum contrast.
3. Results
The change of VL’s for different methods of background luminance calculations are shown under different road lighting classes.
4. Conclusions
When calculating the visibility of an object, the method of background luminance calculation is very important. However, there is no clearly accepted approach to what should be considered as a background luminance. There is a suggestion that when the background luminance is taken as an average value, it may lead to an incorrect evaluation of the object's visibility. In this study it is aimed to point out the importance of the effect of the calculation method for background luminance on VL. For this reason it may be beneficial to include the method for background luminance calculations in the recommendations and standards for road lighting.
CIE Session 2019 – Abstract Booklet
539

PO185
CALCULATION OF ENERGY SAVINGS FOR A SAMPLE ROAD USING LED CONTROL SYSTEMS AND REAL TRAFFIC DATA
Yurtseven, M.B.1, Onaygil, S.1, Guler, O.1, Buyukkinaci, B.2 1 Istanbul Technical University, Energy Institute, Istanbul, TURKEY
2 ISBAK Istanbul IT and Smart City Technologies Inc., Istanbul, TURKEY
Abstract
1. Motivation, specific objective
Luminaires using Light Emitting Diodes (LEDs) are replacing the luminaires with conventional light sources. Especially with increasing efficacy and lifetime values, decreasing thermal problems, wide colour options and compatibility to electronic control systems, LED based luminaires has improved dramatically over the past decade. Many countries initiated lamp replacement programs utilizing LED light sources both for indoor and outdoor lighting applications. Road/Street lighting is one of the application areas that High Pressure Sodium Lamp (HPSL) based luminaires may be replaced by LED based luminaires for energy efficiency and maintenance issues. The energy savings achieved utilizing LED luminaires for low lighting class roads are usually better than high lighting class roads since high power LED luminaires typically have smaller efficacy values than the low power ones, however, it is the exact opposite for HPSL based ones. Since LEDs are electronic components, it is easier to control them with more precision than conventional light sources. Using a light source with high efficacy coupled with a precise electronic control creates an easily manipulated road lighting system. On the other hand, it should be pointed out that the main objective of the control is achieving energy savings without compromising traffic safety and comfort conditions.
In this study, a sample road located in Istanbul utilizing HPSL based luminaires will be selected. Past vehicle and speed data for a year will be used. Energy consumption before and after changing the present luminaires with LED based ones will be determined. Also energy savings after LED replacement and the effect of using a control system to dim LED luminaires will be calculated. In addition, it is also aimed to use the control strategy developed on a test road using real traffic data.
2. Methods
Firstly, the sample road’s yearly energy consumption of the luminaires will be calculated using real operating hours. A suitable LED based luminaire will be selected using a lighting simulation program for that road and energy savings will be determined. Hourly past year sensor values including number of vehicles passing and vehicle speed will be investigated thoroughly for the road. Using EN 13201-1 “Road Lighting Part 1: Guidelines on Selection of Lighting Class” and yearly sensor data and developed control strategies, an adaptive lighting scheme will be created. The data will be separated according to weekdays/weekends, months and seasons. The parameters that determine road lighting classes will be changed accordingly to the sensor data and ambition conditions. For a one-year period the energy savings gained from adaptive lighting scheme will be calculated.
3. Results
The energy savings using an LED replacement system and using a control system will be presented considering driver safety and comfort. Also a detailed analysis of traffic of the sample road will be given in order to create an adaptive lighting scheme.
4. Conclusions
It is a well-known fact that the high saving amounts in LED replacements for energy efficiency can only be achieved with appropriate control strategies. However, these control systems should be used without compromising traffic safety and comfort conditions. In this study, a real road in Istanbul with HPSL based luminaires will be selected and then a LED conversion project maintaining the lighting quality criteria will be done and the energy savings will be calculated. Yearly expected energy savings amount will be calculated by creating control scenarios using EN 13201 and developed strategies without compromising driver safety and comfort.
CIE Session 2019 – Abstract Booklet
540

PO186
VISIBILITY IMPROVEMENT BY CCT TUNABLE LED HEADLAMP UNDER THE ADVERSE WEATHER CONDITIONS
Pak, H.1, Lee, C-H.1,2 1 ALLICE, Yeungnam University, Gyeongsan, SOUTH KOREA
2 Dept. of Electronic Engineering, Yeungnam University, Gyeonsan, SOUTH KOREA
Abstract
1. Motivation, specific objective
Visibility is one of the most important factors on the road environment. Particularly, it is critical when people drive under the adverse weather conditions like fog, rain, snow, and yellow dust and much more in nighttime. Driving at such situations seriously threats the safety of pedestrians as well as drivers. However, there is not enough research on the characteristics of visibility under the adverse weather conditions in nighttime until now because there is some difficulties to control the weather conditions and to perform the experiment. Therefore, in the first place, it is necessary to understand the visibility under the adverse weather conditions using artificial conditions but systematic experiments and to find out some implications from the results. Then, if it is possible, we need to propose some proper solutions for the improvement of visibility under the visual conditions.
2. Methods
For this research, firstly, we have built two test-beds to simulate the adverse weather conditions, one for fog, rain, and snow (3m x 3m x 12m) and the other for yellow dust (1.2m x 1.2m x 8m). At the same time, we have developed a set of CCT tunable LED automotive headlamp for the diverse tests collaborating with some research institutes and companies. To control the artificial weather conditions, we changed the volume of incoming water or oil to the pipes and nozzles in fog, rain and snow conditions, or manipulated the speed of fans for the yellow dust environment. The CCT range of the headlamp was from 3000K to 6500K, but we used the two CCT conditions, low CCT and high CCT for the measurement and observation.
Using these facilities and manipulating the conditions, we have measured the reflective luminance (cd/m2) from the visual targets like pedestrians, traffic sign, and high reflective colour sheets using 2-D colour analyser (Konica-Minolta CA-2000) and calculated the relative luminance and contrast ratio. In addition, we have collected the subjective evaluation (rating or preference) data from the university students who have participated and observed the visual targets in the same experimental conditions.
3. Results
According to the overall measurement data, the visibility was higher at low CCT conditions in fog and rain but it was higher at high CCT conditions in snow and yellow dust, although there is a bit of variability and irregularity in its tendency. Likewise, the results of subjective evaluation also showed the similar tendency that the low CCT is helpful under fog and rain but the high CCT is helpful under snow and yellow dust conditions. However, the differences between CCT conditions are very small and sometimes there was no difference in the visibility at some density or intensity levels of the weather conditions.
4. Conclusions
Our results provided some implications on the visibility under adverse weather conditions and for the development of automotive headlamp functioning adaptively under the situations. However, our research and data have some limitations, e.g., difference between the artificial weather conditions and the real ones, reliability of the measurement, validity of the visibility index, proper number of samples in the measurement and participants in the observation, etc. Therefore, it is required to repeat the measurement using more systematically designed experiment and observations using more participants, and then we will be able to make a more reliable interpretation based on the data.
CIE Session 2019 – Abstract Booklet
541
PO187
EXPERIMENTAL INVESTIGATION OF PAVEMENT LIGHT REFLECTION CHARACTERISTICS IN WET CONDITIONS
Pattanapakdee, K.1, and Chotigo, S.1 1 Department of Electrical Engineering, Faculty of Engineering,
King Mongkut’s University of Technology Thonburi, Bangkok, THAILAND
Abstract
1. Motivation, specific objective
Road lighting certainly impacts on traffic accidents and varies with pavement materials and weather conditions. Generally, luminance level and light uniformities are significantly considered in a road lighting design. However, they are required in only dry pavement conditions. In conditions of wet pavements, poor uniformities and glare due to high specular reflection of wet surface have been found and negatively effect on visual performance of drivers. To improve light quality, the adaptive smart luminaire which has multi light distributions which are suitable for dry and wet road surfaces is proposed. Therefore, the pavement light reflection properties in wet conditions and dynamically characteristics while they are drying were studied in this paper to investigate the change of specular reflections. The measured luminance coefficient at the selected angles may be applied to creating the approximated the r-tables in wet conditions for optimization of the appropriate light distribution curves.
2. Methods
Pavement samples of three various materials and aging having concrete, rough asphalt and fine asphalt were extracted by coring drill with 14 cm diameter size to investigate light reflection properties in laboratory. The gonio-reflectometer was modified from a rotating-luminaire type of goniophotometer. The goniometer was combined to the imaging luminance meter installed on the supporter for measuring the reflected light from the pavement surface. Moreover, the reflected light spectrums were measured by using the spectral radiance meter and were compared to the original spectrums of incident light. The 4,000K LED light source was used for emitting the light over the test sample. Rotation of light source and installation of light instrument were arranged according to CIE 140 standard. The average luminance and average illuminance over sample at any positions of β and γ angles were measured to calculate the reduced luminance coefficient (r). The complete r-tables of all samples were tested in dry conditions, then the reflection parameters, which are the average luminance coefficient (Q0) and the specular factor (S1), were calculated together by the software. To investigate light reflection characteristics in drying state, sample was sprayed water onto its surface. Tests were started from wet in the inundated condition to 120 minutes with naturally drying in 25±1oC, 60-70% RH of surrounding conditions and air flow <0.2m/s. Changing of specular factor (S1) and the spectral power distribution of the reflected light versus time were investigated. The r(0,2) and r(0,0) were measured during drying together with the reflected light spectrum. Moreover, the reduced luminance coefficient at major incident angles and observing angles were measured for approximately creating the r-table of wet-road surfaces in the future works.
3. Results
In dry condition, the specular factor (S1) of concrete and rough asphalt samples are around 0.4-0.6 or R2 class (slightly specular) in R-classification systems, but the average luminance coefficient (Q0) of concrete samples and rough asphalt samples are in R1 class (0.09-0.10) and 0.05 (high absorption) respectively. For fine asphalt samples, their specular factors are in R4 class (S1>1.7) but the average luminance coefficient (Q0) close to concrete values. When they were in the inundated wet condition, their specular factors are very low or approximately zero. In drying conditions, the results showed dynamically changing of specular factor (S1) and the major r-values. They can be divided into three stages. Specular factor (S1) is raised to the maximum point in the first stage. Next stage, it is declined and slightly become to dry specular factor in the last stage. The specular factor of rough asphalt surface is rapidly swung within 10 minutes with highest specular factor then slowly decrease to dry condition with quite long time (more than 2 hours). In case of concrete and fine asphalt pavements, the results showed longer rise and fall time, except shorter slightly decreasing period before dry condition. Their rise time and total drying period are approximated around 30-45 minutes and 60
CIE Session 2019 – Abstract Booklet
542
minutes respectively. The r(0,2) of wet rough asphalt surface may be more than 12 times of r-value in dry condition. They are around 7 and 3 times for concrete and fine asphalt pavements respectively. The measurement results of the reflected light spectrum show the lightly decreasing of CCT due to absorption of short wavelength light. The maximum colour drift appears in concrete pavements. However, changing of the reflected light colour are disappeared over wet surfaces. The reduced luminance coefficients at the significant angles in each period of wet conditions show the different effects of pavement materials and wet levels.
4. Conclusions
The light reflection properties of wet surfaces were investigated by gonio-reflectometers. The test results of three type pavement materials showed differently changing of specular factor versus time in three stages. The rough asphalt samples have very high specular factor in short time and slightly decreasing in long time. The fine asphalt and concrete samples have longer rise time and lower specular factor. The drift of light colour by absorption of short light wavelengths do not show in the inundated wet condition. The reduced luminance coefficients at the significant angles present the different effects of pavement materials and wet levels. They may be created the approximated r-tables of wet conditions in the future works.
CIE Session 2019 – Abstract Booklet
543

PO188
REVIEW OF THE COLOUR SHIFT AND ATTENUATION OF SIGNAL LIGHTS OVER LONG DISTANCE
Powell, L.D.1 1 General Lighthouse Authorities of the UK and Ireland, Harwich, UNITED KINGDOM
Abstract
1. Motivation, specific objective
CIE S 004/E-2001 specifies the allowable colours for light signals and the chromaticity coordinate boundaries for compliance with each colour. It is known that the colour of light can shift as the light propagates through the atmosphere, due to the greater scattering effects towards the blue end of the visible spectrum. CIE S 004/E-2001 notes this effect on white signals over longer distances (>5 km). It also notes that the shift is more pronounced under conditions of reduced visibility and states that white signals that may be observed under these conditions should have an emission chromaticity located close to the blue boundary of the white region.
Marine aids-to-navigation (AtoN) authorities around the world utilise signal lights that are intended to be viewed from a distance of several nautical miles (M), 18 M (33 km) being a common requirement. At these distances, there can be a marked colour shift, even in clear atmospheric conditions.
The colour of marine AtoN lights is assessed against a recommendation from the International Association of Marine Aids to Navigation and Lighthouse Authorities (IALA). This recommendation consists of a modified version of the colour regions specified in CIE S 004/E-2001.
The range performance of marine AtoN lights is published in the form of a nominal range – the luminous range at which the colour and rhythmic character of the light can be identified when the meteorological visibility is 10 M (18.5 km). IALA recommend the required effective illuminance at the eye of the observer at the nominal range to be 0.2 µlux for signal lights at night. Nominal range calculations for all lights, regardless of the colour, are performed using an atmospheric transmissivity of 5 % over 10 M.
A desktop study was conducted to:
investigate the colour shift of marine AtoN signal lights over practical viewing distances and assess conformance of the resulting chromaticity to the recommended boundaries, and
determine the intensity requirements of different coloured marine AtoN light signals to provide a given nominal range.
2. Methods
A series of measured atmospheric spectral transmissivity profiles were collected from previously published papers and the meteorological optic range of each profile assessed. The profile with a meteorological optical range closest to 10 M was then selected. The meteorological optical range of this profile was 9.95 M. Measured spectral profiles of marine AtoN signal lights were then modelled propagating through a homogenous atmosphere having that transmissivity profile. The chromaticity of each light source was plotted at viewing distances of 1 M increments up to a range of 24 M.
The required intensity of each light to provide a nominal luminous range of 1, 5, 10, 15 and 17.5 M in the selected atmospheric transmissivity profile was then calculated.
Additionally, the maximum viewing distance, where the chromaticity of a given white light signal remained within the IALA recommended white region, was calculated for a range of atmospheric transmissivity profiles.
3. Results
Unsurprisingly, the lights that exhibited the greatest shift were white lights, while the narrower band light sources, such as blue, red and green, exhibited less shift. It was found that the chromaticity of many white marine AtoN lights shifted outside the recommended colour boundary for the selected
CIE Session 2019 – Abstract Booklet
544
atmospheric transmissivity profile over an 18 M viewing distance. Starting close to the leftmost IALA recommended white boundary extended the distance at which the light remained in the recommended white region, in some cases remaining in for over 20 M. However, the maximum distance varied somewhat between transmissivity profiles.
The maximum distance for a given light source was plotted against the meteorological optical range of the atmospheric transmissivity profiles. While there was a general trend that profiles with a lower range reduced the maximum distance, there was significant variability in the curve. Apparent subtle changes in the atmospheric transmissivity profiles compound over the long viewing distances and the shift in chromaticity could occur at a significantly different rate or in a significantly different direction, even for profiles of similar meteorological optical ranges.
The intensity requirement of marine signal lights to provide a nominal range of 17.5 M using the selected atmospheric transmissivity profile yielded significant differences compared to the uniform transmissivity recommended by IALA. An example blue LED light required 56 % greater intensity, a green LED light 47 % greater and a white LED light 10 % greater. An example red LED light required 35 % less intensity.
4. Conclusions
This study utilised measured atmospheric spectral transmissivity profiles to model and investigate the effect of long distance viewing of signal lights. Further work and eventual guidance on suitable atmospheric profiles would be beneficial. This work might include assessing the sensitivity of colour shift to variations in the atmospheric profile to further understanding of benefits and limitations of using a standard profile or set of profiles.
There appears to be little guidance on the implications and mitigating measures for using signal lights for long distance viewing. The CIE colour boundaries appear to have been set based on the chromaticity of the light when observed at a short distance, not at long range.
It was found that the colour of many marine AtoN signal lights shifted outside the recommended colour over the intended viewing distance. For example, many white lights significantly shifted towards yellow/red and there is a potential risk of incorrectly identifying the colour of the light.
There may be a need divide the white region into several sub-regions and limit permissible initial chromaticity to given sub-regions based on the intended viewing distance. These regions may even need to start beyond the existing boundaries to allow for optimal conformance with the white region over the intended range of viewing.
CIE Session 2019 – Abstract Booklet
545

PO189
MODELING REFLECTION PROPERTIES OF ROAD SURFACES BY DADA BASE METHOD
Li, W.1, Zhang, Z.2, 3, Yang, Y.2, 3, Liu, M.1, Shen, H.1* 1 Fudan University, Shanghai, CHINA, 2 China Road Transport Inspection and Certification Hi-tech CO. Ltd., Beijing, CHINA, 3 National Center for Quality Supervision & Inspection of Traffic Safety Facilities,
Beijing, CHINA
Abstract
1. Motivation, specific objective
For a precise designing of road/street lighting, the reflection properties (described by a reduced luminance coefficient table, short as r-table) of the road surface should be known. Since measurement of a full r-table is costly and time consuming, a better and practical way is to measure finite number of reduced luminance coefficients under several specified angles, then make a prediction for the full r-table by using a model. Extensively investigations have been carried out by scientists, trying to get an analytical expression model with an acceptable prediction precision. To obtain higher model precision, this paper proposes a new method to model r-tables without an analytical expression, but by data base method.
2. Methods
The idea is borrowed from the popular data science nowadays. We build up a so-called ‘knowledge base’ for of road surfaces, which is constructed by verified data, like CIE r-tables, data from European scientist and our own measured data. The data model is trained and built up by some selected r-tables. Then we make predictions for the other r-tables in the knowledge base, and analyse the prediction errors with their real values.
3. Results
In our recently finished study, a knowledge base of 287 r-tables of dry road surfaces is built up, and a model is built up by its r-tables with even number indices. The r-tables with odd number indices are then predicted. Results show that 90% of the prediction errors are below 15%, and a great number of examples are distributed around 5%. Only two worst cases are of error around 50%. These results are much better than those we obtained by analytical expression methods.
4. Conclusions
By this knowledge based model, if we have a large enough data base with reliable r-tables, covering road surfaces of different materials, service and weather conditions, we can make predictions for most road surfaces with a few measured value, then make a precise road/street lighting design.
CIE Session 2019 – Abstract Booklet
546

PO190
THE BALANCE BETWEEN VISUAL EFFECT AND ENGINEERING CORRECTNESS IN ARCHITECTURAL LIGHTING
Skarżyński, K. Warsaw University of Technology, Warsaw, POLAND
Abstract
1. Motivation, specific objective
Energy efficiency and light pollution are crucial problems in modern lighting technology nowadays. The importance of these problems is related to the issue of environmental protection. The wasting of electrical energy is an unwelcome phenomenon in many different engineering areas. The area of lighting has much to offer the environment, especially when it is considered as a potential source of energy savings. Technical reports, requirements, laws and regulations, standards for energy efficiency lighting and the analysis of nearly-zero energy waste in particular engineering fields are being developed all over the world. However, in the lighting field, these are mostly connected with interior lighting and road lighting. There is no document linking energy efficiency to architectural lighting. Although the latest technical reports and standards related to exterior lighting do actually take into account intrusion light and sky glow (essential factors in light pollution), architectural lighting is completely omitted from them. At first, this declaration appears to be a misstatement. It is a well-known fact that electric floodlighting installations are characterised by quite a low value of electric power (amounting to just a few or perhaps up to a dozen kilowatts). However, this does not justify the lack of any specific guidelines related to this issue. In addition, the occurrence of light pollution is strongly linked to architectural lighting because of the high possibility of such a lighting type havin a significant impact on sky glow, light intrusion and even on the issue of glare. Architectural lighting designs have so far been assessed only on the basis of their visual effect and the beauty of their night-time images, either during the design process or just after their completion. However, it would appear to be essential to find a method of assessing this type of lighting from an engineering perspective as well. The balance between visual effect and engineering correctness with regard to energy efficiency and light pollution in architectural lighting ought to be described using a simple, but obligatory system of assessment. It should also be stated as a practical and easily-understood requirement for lighting designers.
All of the above-mentioned problems have formed the basis of research done in the field of energy efficiency and light pollution in architectural lighting. The main objective of this paper is to present the possibility of assessing architectural lighting not only from the viewpoint of the beauty of the architectural object, but also in a rational, engineering-led way that takes into consideration both energy efficiency and light pollution.
2. Methods
A new method of assessment of architectural lighting in terms of energy efficiency and light pollution has been created by the Author. This method also takes into consideration the visual effect of the night-time image of the architectural object as well as energy efficiency and light pollution parameters. The analysis is based on new engineering parameters dedicated to architectural lighting and that are related both to the utilisation factor of such lighting and the balance of luminous flux in the installation.
It was decided that the best way of presenting the importance of the balance between visual effect and engineering correctness was to study one object. The White Pavilion, which is located in the Royal Lazienki Museum in Warsaw, was chosen as being the perfect object to be studied for this case-study analysis. The visualisations of different lighting situations and the calculations of new parameters for the engineering assessment of the White Pavilion were conducted using a computer simulation of lighting on dedicated software. (In this case it was Autodesk 3dS Max).
3. Results
The results obtained showed that there are a number of important factors that have a significant influence on architectural lighting designs in terms of visual effect, energy efficiency and light pollution. The research has allowed us to synthesize these and they are listed below:
CIE Session 2019 – Abstract Booklet
547
the method of floodlighting the arrangement and directionality of the lighting equipment the photometric solids of the lighting equipment the quality of the lighting equipment (light output ratio) the spectral power distribution (SPD) of the light source and the spectral distribution of the
reflectance factor of the illuminated material
Each of these factors can have a different impact, and it is crucial to analyse all factors carefully during the process of designing architectural lighting. The research established that sometimes it is impossible to improve the design in terms of all the factors combined. Nevertheless, it is definitely possible to improve the design and find a balance between visual effect and those engineering parameters which are related to energy efficiency and light pollution.
4. Conclusions
This paper shows that the assessment of architectural lighting does not only have to be done in a subjective way, by simply analysing the beauty of the visual effect. There is also a method of introducing real and useful parameters, which are related to energy efficiency and light pollution. These parameters allow for the possibility of assessing and controlling architectural lighting in a much more objective way, which still also takes into consideration the beauty of the visual effect. The choice of the most proper lighting solution should be the responsibility of the lighting designer. Specific lighting requirements or guidelines, related both to energy efficiency and light pollution, should be developed, e.g. as a unified system of assessment or as standard values of particular objective parameters for different types of architectural objects. This will form the basis of much wider research to be conducted by the Author.
CIE Session 2019 – Abstract Booklet
548
PO191
REAL ENVIRONMENT RESEARCH LABORATORY WITH LIGHT POLLUTION OPTIMIZED STREET LIGHT LUMINAIRES
Szabo, F. 1, Csuti, P.1, Kollath, Z. 2 1 LightingLab Calibration Laboratory Ltd., Veszprém, HUNGARY, 2 Eötvös Loránd University,
Szombathely, HUNGARY
Abstract
1. Motivation, specific objective
Light pollution is a growing problem for the natural environment, but also for human health. More and more international surveys show that blue radiation content of certain (mostly cool white) LED lighting increases the risk of some illness compared to earlier orange-yellow sodium lamps. This is one of the reasons why some of today’s laptops and mobile phones are already set to decrease CCT (and blue content of the radiation) after sunset. Lighting trends of the last decade have been favoured by LED technology based on phosphor converting technology, which means significant emission in the 430 nm – 480 nm wavelength range, where ipRGCs are most sensitive. As a consequence of Rayleigh scattering, short wavelength photons are the most efficiently scattering photons, 9.4 times more efficient as scattering of 700 nm photons. As an experience of LED public lighting projects of the last decade, public lighting strategy is moving nowadays to warm white LEDs and Amber LED based solutions.
2. Methods
As a strong cooperation of astronomy, photometric laboratory and luminaire manufacturer, a real environment research laboratory has been realized at two venues in Hungary, by total reconstruction of the whole public lighting system of Répáshuta and Bárdudvarnok villages in Hungary.
Two aspects were considered during the design:
Recent research has shown that cool white light is harmful to the environment and to the human health and species of fauna and flora. Therefore, in designing the new public lighting, the primary consideration was to emit only warm white light with minimal blue radiation. In addition, on the side streets after 10 pm, the lights of the public lighting are weakened (according to the reduced traffic) and then only the biologically optimum amber yellow light illuminates. This capability is realized by specially developed spectrally tuneable LED public lighting luminaires. Further innovative content of the system is that the different LED channels have different lens optics as well. Thanks to that, spatial distribution of light output can be optimized as well for different needs of public lighting at night hours. An innovative control system translates the given schemes into LED current values at the luminaires. This solution is a novelty in the world as well.
Another aspect was to totally exclude any light output at 90° and above (ULOR=0). This also helps to improve and maintain the status of the sky in two Starry Sky Parks in Central Europe affected by settlements and gives a liveable environment for village residents at the same time.
3. Results
Development of luminaires has been a multiple step process with continuous laboratory control and feedback. Market survey revealed the most suitable LEDs to be applied in the luminaires. Photometric and electrical parameters of prototype luminaires have been tested. In order to compare the before-after state, illuminance measurements on the roads and sky luminance measurements had been done. After the installation of the developed luminaires, a public survey has been started and opinions of residents have been collected at both venues.
4. Conclusions
One of the most important conclusions, that it is possible to create minimal light pollution public lighting compared to traditional high pressure sodium public lighting installations, which provides safe and liveable environment of residents at the same time. These two real environment laboratories will
CIE Session 2019 – Abstract Booklet
549

host more scientific investigations in the future. With the improvement of phosphor amber LED technology, further advantages on energy efficiency can be reached.
CIE Session 2019 – Abstract Booklet
550

PO192
INNOVATIVE DESIGN AND METROLOGICAL APPROACHES TO SMART LIGHTING
Valpreda, F.1, Iacomussi, P.2, Rossi, G.2 1 Politecnico di Torino, Torino, ITALY, 2 INRIM, Torino, ITALY
Abstract
1. Motivation, specific objective
In the last fifteen years large technological advances in lighting engineering emerged: mass production of innovative lighting sources like SSL (Solid State Lighting), wide control range of the luminous flux, new design tools and innovative maintenance approach based on scientific findings are telling arguments for modifying the approach to public lighting design and management and to metrological characterisation of devices and systems. Of course, energy savings got the biggest advantages by the introduction of SSL, but in the future to reach higher general savings will be not only a matter of source change, the so called LEDification. Indeed, an action toward a high efficiency source only is condemned to fall away: in the future years the expected potential saving due only to light source performances (6%) will be very less significant than the one reached by the LEDification of installations. Significant future additional savings can be achieved only by smart lighting systems specifically designed with a multidisciplinary approach and considering on site measurements. Nowadays smart controls are mostly addressed to cut energy consumptions by means of lowering the lighting levels accordingly to users needs.
The definition of users’ needs considering a soft metrology approach, the characterization of devices in different working conditions and the on site measurement of installation is a challenge for applied metrology. For example the mesopic approach to road lighting is hardly expendable in urban areas while it could be adopted in the internal zone on one-way tunnel. Moreover the technology to design advanced smart control is already available and nowadays, at least in industrialised countries, LED impact is aimed toward not only energy savings, but to improve night-time safety, health and wellbeing thanks to lighting systems based on connectivity and smart controls. But new design paradigms and metric headed to these new objectives are necessary: energy consumption and light levels will be no longer reference parameters to measure.
The paper will present the main outcomes of a project set up by a European University and a NMI (National Metrology Institute) and aimed to define new approaches 1) to design smart controls of road lighting installations consistent with user’s and society needs and 2) to define and assess their metrological performances. Designing a product for Smart Society means starting from the idea that human being is the main node of a complex system where the environment, the resources, the quality of life (from a wide point of view) and the effects of each node onto the others are all converging towards a global asset of effects. In such kind of conditions, even a very specific and technical field like the lighting for new society needs should be considered a node of a more complex net, even more if we introduce hi-tech devices assets, data gathering and management and, at last, people with their fundamental needs.
Such kind of awareness is not achievable with a metrology oriented to quantify peculiarities ascribable only to mere SI units like the luminous intensity or illuminance, but needs a metrology more related to measure the quality of lighting in strict conjunction with human perception and comfort that wherefore entails the problem of calibration of smart devices that are based on ILMD (Image Luminance Measuring Device). In road lighting applications, devices currently available on the market measure the road surface average luminance for controlling smart adaptive road lighting systems, but infer also weather conditions from the spatial distribution of reflected light: in this application a deep knowledge of road surface behavior is absolutely necessary. Currently this behavior is described by data in r-tables, and is usually measured as ratio between two SI units: luminance and illuminance for given directions of illumination and single direction of observation. It is clear that the geometrical conditions defined in r-tables are not suitable for smart systems that for practical reasons observe the road, or a lit environment, from completely different point of view, but must also play the role of a reference user to adapt the lighting set up according to users needs. In this metrological framework, calibration on mere SI units is not effective. Smart materials and IoT approaches can help building reference
CIE Session 2019 – Abstract Booklet
551

calibration procedures and Reference Materials (RM). Indeed RM is a “material sufficiently homogeneous and stable with respect to one or more specified properties (qualitative or quantitative), which has been established to be fit for its intended use in a measurement process”.
2. Methods
During a dedicated multidisciplinary workshop including designers (with competencies on IoT and Systemic Design) and metrologists as well, several smart systems for public lighting have been defined including their metrological capabilities and procedures for performances verification. Keys strengths of the results are in the aforesaid topics: satisfaction of users needs based on lighting quality as suggested by European Standard (EN), circular economy with a comprehensive overview of energy re-use, concurrent definition of metrological procedures to assess measuring capabilities toward a lighting quality assessment as in EN standards, IoT for Smart Lighting for Smart Cities.
3. Results
The paper will present the two most promising smart control devices including their calibration procedures.
CIE Session 2019 – Abstract Booklet
552
PO193
THE INFLUENCE OF VEHICLE HEADLIGHT SOURCES ON THE RETROREFLECTIVE OPTICAL PROPERTIES OF TRAFFIC SIGNS
Yang, Y.1, 2, Zhang, Z.1, 2, Shen, H.3, Zhu, C.1, 2* 1 China Road Transport Inspection and Certification Hi-tech CO. Ltd, Beijing, CHINA, 3 National Center for Quality Supervision & Inspection of Traffic Safety Facilities, Beijing, CHINA, 3 Fudan
University, Shanghai, CHINA
Abstract
1. Motivation, specific objective
Traffic signs have the functions of providing instructions to road users and warning of danger. The visibility of these signs mainly depends on the intensity and colour of the reflective light from all of the graphic symbols and the sign plates. In most cases, the symbols and plate of traffic signs are made of retroreflective materials. Under night conditions, the indexes of evaluating the optical performance of traffic signs are the retroreflective coefficient and the nighttime colorimetric characteristics.
Conventional testing methods and equipments are used to measurement the directional reflection characteristics of the reflective material under certain light path geometry conditions, and the standard A source is used as the incident light source. The spectrum of the testing light source is similar to that of the traditional automobile halogen lamps, and the results of retroreflective coefficient and nighttime colorimetric characteristics are also close to the actual situation.
In recent years, with the rapid development of new light source technology, white LEDs, Xenon lamps and other light sources have been widely used in vehicles, and show a trend of rapid popularization. Due to the effect of human spectral luminous efficiency, under the same surface (sign) illumination conditions, the different emission spectra of vehicle headlamp sources may make the same sign material present different results about the retroreflection intensity and colour. The deviation also affects the luminance contrast and chromaticity contrast of the graphic symbols and the plate of the signs, and then affects the visibility and security of the traffic signs. The purpose of this study is to propose an optical index test and evaluation method for retroreflective signs matching the development of vehicle light sources.
2. Methods
In this experiment, three different levels of retroreflective materials were selected as test samples, and each stage sample includes five kinds of common colours. Halogen light, Xenon light and two kinds of white LEDs (with different CCTs) light sources were used to simulate the vehicle headlamp as the incident light sources of the samples. Based on the measured emission spectra of the light sources and the spectral reflectance curves of the reflective materials, by spectral fitting method, the correction coefficients of the retroreflective coefficient of different grades and colour samples and their deviations of the coordinates of the retroreflective chromaticity, under different vehicle headlamp source incident conditions, are calculated, compared with results of a standard A source.
3. Results
The retroreflection coefficients of white materials with continuous spectral reflectance curve distributions in visible light range is less affected by the spectral variations of the incident light sources, while that of monochrome materials are more affected by the spectral differences of the incident light sources. We the made modification to our existing equipment for measuring the reflectance coefficients. Under the same light path conditions, by replacing the incident light source, we verified the measured results with the calculated results, and obtained good agreement.
4. Conclusions
Based on the existing test equipment, this method and correction coefficient can test and modify the optical indicators of traffic signs according to the actual situation of vehicle headlamp sources, and provide data basis for the study of traffic signs visibility in the current traffic environment.
CIE Session 2019 – Abstract Booklet
553

PO194
PHOTOBIOLOGICAL RESEARCHES – A WAY TO OPTIMIZE LED’S PLANT LIGHTING
Prikupets L.B.¹, Boos G.V.², Shakhparunyants A.G.¹, Bartsev A.A.¹, Terekhov V.G.1, Tarakanov I.G.³ ¹ LLC "VNISI named after S.I Vavilov, RUSSIA, ² National Research University "Moscow Power
Engineering Institute" (MPEI) , RUSSIA, ³ Russian State Agrarian University - Moscow Timiryazev Agricultural Academy (RSAU – MTAA) named after K.A. Timiryazev), Moscow, RUSSIA.
Abstract
1. Motivation, specific objective
Currently, the problems of using LEDs for plants growing are moving into a practical plane, in particular, due to the rapid expansion of the use of multilayer systems of vertical cultivation of green salad plants. For these purposes an optimal lighting technology with a reasonable selection of spectra and photosynthetic photon flux densities (PPFD) levels should be developed.
2. Methods
The report presents the methodology of photobiological researches (PBR) conducted by VNISI together with Russian Agrarian University (RSAU – MTAA) in a phytotron. The test objects were lettuce and basil plants.
The plants were grown in a phytotron installation, consisting of six modules, with 6 LED irradiators in each of them. In the first phase of the research, there were used coloured quasi-monochromatic irradiators emitting in the blue (λmax = 447 nm), green (λmax = 517 nm) and red (λmax = 656 nm) PAR regions.
Thanks to the use of adjustable drivers, the level of PPFD, which was constant in the course of a particular experiment, has varied in research within 60-300 μmol∙s-1∙m-2, simultaneously with PPFD, the irradiance the PAR region (hereafter – irradiance) (in W/m2) was recorded simultaneously with PPFD.
At least 4 vegetation were carried out (30 days for lettuce, 35 days for basil) for each alternative spectrum. This made it possible to obtain for both plants a series of “light curves” - dependences of productivity (weight in g) on the PPFD level. The content in the plants of the main ("major") components of the biochemical composition, which determine the nutritional value of the product, was also determined. For salad, the content of vitamin C (in mg/100 g of biomass) was chosen, and for basil the content of the main type of essential oil (eugenol) was chosen. The content of nitrates in biomass was also estimated.
For measurements of PPFD and irradiance and for spectral measurements, Li-205A (Li-COR, USA) and MK350S (UPRtek, Taiwan) were used.
3. Results
An analysis of salad producing capacity dependence on the PPFD level shows a rather abrupt plant reaction to low-energy red radiation quanta. With low PPFD, the reaction efficiency for red radiation was lower than for blue radiation. With average PPFD equal to 100 μmol∙s-1∙m-2, the effect was slightly lower than for blue radiation and even for green, but within a higher PPFD range of about (130 ÷140) μmol∙s-1∙m-2, a maximum level of producing capacity was reached in all experiments.
The length of the “ascending section” of the productivity light curve is the biggest for blue radiation. Maximum values of producing capacity are reached in this case at the PPFD about (170÷180) μmol∙s-1∙m-2. This fact confirms the previously obtained data and means that providing a high percent of blue in LED phytoirradiators spectra have no future in industrial growing of salad cultures.
The results of this research demonstrate that as far as salad is concerned the green spectral region is not an “outlaw” at all and provides a higher producing capacity than red and blue radiations at PPFD equal to 100 μmol∙s-1∙m-2.
Productivity light curves for the basil somewhat differ from the salad curves. Here the PAR red region is also the most effective in providing a high producing capacity. An experiment with red radiation at E
CIE Session 2019 – Abstract Booklet
554

> 140 μmol∙s-1∙m-2 revealed an effect of a quick inhibition of plant growth, which is hard explain. In the curve family, positions of maxima for all PAR regions are very close and correspond to PPFD about (125 ÷ 150) μmol∙s-1∙m-2.
The report provides data on the influence of the spectrum and the level of exposure on the biosynthesis of the major components, as well as the nitrate content of lettuce and basil.
“Rough” action spectra for the synthesis of biomass of lettuce and basil which significantly differ from each other and from the McCree curves are determined for two fixed PPFD levels (70 and 100 μmol∙s-
1∙m-2) and one fixed irradiance level (28 W/m2).
4. Conclusions
The influence of main PAR spectral regions on producing capacity of two types of vegetative plants was investigated in wide ranges of PPFD and irradiance, and the largest efficiency of the PAR red region was confirmed.
It is shown that the action spectrum for producing capacity depends on the PPFD level even for vegetative plants, and in general it should be estimated using two-dimensional scale (λ and E). Summing up, we can say that at present there is no alternative for the experimental method of optimizing key lighting parameters for plant photo culture.
At the next stage of the PBR, experiments will be conducted to optimize for lettuce and basil the ratio of radiation in blue, green and red PAR regions.
This work was funded by the Ministry of Education and Science of the Russian Federation (project" Comprehensive research in the field of photoculture and the development of a series of high-performance LED phytoradiators, providing energy efficiency of industrial greenhouses", contract No. 14.576.21.0099 dated 26.09.2017, Unique Number: RFMEFI57617X0099).
CIE Session 2019 – Abstract Booklet
555

PO195
COMPARISON OF THE EFFECTS OF BRIGHT CHROMATIC STIMULI OF EQUI-LUMINANCE AND EQUI-RADIANCE ON THE PUPIL LIGHT REFLEX AND
INVESTIGATION OF THE PERFORMANCES OF BLUE-GREEN BANDPASS SUNGLASSES
Ehrismann, C.1, Barrau, C.1, Poletto, E.1 1 R&D Light & Vision Sciences, Essilor International, Paris, FRANCE
Abstract
1. Motivation, specific objective
1 to 3% of intrinsically photosensitive retinal ganglion cells (ipRGCs) express melanopsin, a photosensitive pigment discovered in the beginning of the 2000s which is highly sensitive to blue-green wavelengths between 460 and 510 nm with a peak around 480 nm. Among the non-visual functions regulated by melanopsin-based ganglion cells, pupil light reflex (PLR) is the most fact-acting and observable one. Under photopic conditions, strong evidence support that ipRGCs are involved in the rapid constriction and in the sustained phases of the PLR. Indeed, ablation of ipRGCs almost completely eliminates PLR in mice. If the higher pupil response to bright blue-green light compared to red light of equi-luminance has been widely explored, to our knowledge, equi-radiance stimuli (i.e. equal quantity of photons without weighting by the photopic visual sensitivity) were never used. In a first experiment we compared the effects of equi-luminance and equi-radiance chromatic stimuli on the PLR. Then, as the current sunglasses usually transmit less than 15% of blue-green wavelengths, we developed sunglasses with higher blue-green transmittances up to 60%, while keeping the same overall protection. Thus in a second experiment, we studied their performances compared to standard sunglasses on the PLR.
2. Methods
Two groups of 20 young healthy volunteers each (first experiment: 28 years ± 4 SD; second experiment: 26 years ± 3 SD) participated to the experiments. In a complete dark room, each participant faced a Ganzfeld stimulator (MonColor, Metrovision) that can be illuminated with 5 types of LEDs from violet to deep red, adjustable in luminance. During the whole experiment, the pupil sizes of each participant were recorded with 200Hz infrared cameras.
After at least 30 s of dark adaptation, the participants were exposed to 3 successive short light stimuli (500 ms to 1 s), either blue-green (465 nm), red (619 nm) or white (daylight-like), separated by 50 s of darkness. In the first experiment, we used red and blue stimuli of equi-luminance (100 cd/m²) and of equi-radiance (619 nm - 130 cd/m² and 465 nm - 18 cd/m²). In the second experiment, we compared the performances of 4 pairs of sunglasses on PLR, tested randomly, under blue stimuli (100 cd/m²) and daylight-mimicking light (800 cd/m²)
3. Results
Blue stimuli induced both a significantly higher amplitude and a longer sustainability of pupil constriction compared to red for equi-luminance (p<0.001), as previously reported in the literature, and also for equi-radiance (p<0.001).
Under both blue and white light stimuli, the sunglasses with the highest blue-green transmittance (60%) led to 1 mm higher pupil constriction (p<0.001) and to 9-seconds longer sustainability (p<0.001), compared to standard sunglasses.
4. Conclusions
As previously reported, with an equi-luminance, blue-green stimulations convey higher pupil constriction and sustainability. The complementary results obtained for equi-radiance stimulations strongly confirm the major implication of ipRGCs. Sunglasses letting pass over 30% of blue-green light can be valued to ensure optimized pupil constriction and thus improve visual quality.
CIE Session 2019 – Abstract Booklet
556

PO196
MECHANISM STUDY OF LIGHT-INDUCED VISUAL FATIGUE BASED ON PHYSIOLOGICAL PARAMETERS AND EVALUATION METHOD CONSTRUCTION
Cai, J-Q1,*, Hao, W-T2, Wen, R-R2 1 China National Institute of Standardization, Peking, CHINA, 2 Beijing YangMing ZhiDao Photoelectric
Science &Technology Co., Ltd, Peking, CHINA
Abstract
1. Motivation, specific objective
Human eye is a special and complex kind of optical system, which is able to obtain clear image by self-adjusting. In poor light quality, visual fatigue is likely to be accumulated during the adjusting process especially. In this paper, we aim to construct the equation for light-induced visual fatigue evaluation based on ocular physiological parameters. We combine computational simulation and large-sample human-factor experiment for the research. This is the first time that light-induced visual fatigue is evaluated based on ocular physiological parameters in objective method.
2. Methods
In this study, it is expected to construct evaluate visual fatigue degree in an objective method based on ocular physiological parameters. We concentrate on physiological parameters related to visual fatigue. It is proposed that the cause of visual fatigue perception may be either ocular structure variation or micro-variation of related organizations, or both of them. For a confirmation, we performed by ocular physiological parameters measurement as well as psychological questionnaire scoring on 400 participants.
2.1 Physiological parameters
Physiological parameters are selected by evidence based method. For the selection of physiological parameters, we performed stability experiment on 20 participants. Then we perform the measurement of light-induced variation. By experiment, it is confirmed that obvious variations emerge in ACC, MTF, HOA4 and HOA12. As a special optical system consists of lens and CCD camera, human eye adjust its assemblies to obtain clear image. Variations of the status could be described by ACC, HOAs and MTF, and the focal distance of the optical system could be described by the structural parameter AL. These four types of physiological parameters are employed in this study to design the measurement and construct the calculation formula for the objective and quantitative evaluation of light-induced visual fatigue.
2.2 Experiment process
Light-induced visual fatigue is a process-related accumulation effect. Based on this fact, we design a quantitative evaluation method of light-induced visual fatigue by physiological parameters measurement.
3. Results
In this study, our aim is to evaluate visual fatigue degree by objective method based on physiological parameters. It is expected to develop a formula in which physiological parameters are independent variables and dependent variable is visual fatigue degree. AL, MTF, ACC and HOAs are chosen to serve as independent variables. From experiments, variations of these parameters are not correlated to each other. Consequently, any one of these parameters is not likely to describe visual fatigue degree solely. The independent variables should be some or all of these four parameters. To obtain the final formula of visual fatigue degree based on these parameters, it is necessary to figure out their variation regularity.
3.1 Computational simulation
In this study, our aim is to figure out formula between visual fatigue degree and physiological parameters. Visual fatigue degree could not be measured directly, so first of all it is necessary to choose a parameter to represent fatigue degree. Then we can figure out the formula between this parameter and other physiological parameters.
CIE Session 2019 – Abstract Booklet
557
3.2 Visual fatigue degree
For more reliable equation of visual fatigue evaluation, regression should be performed based on human factor experiment.
3.3 Practical tests
The purpose of measurement is to evaluate light-induced visual fatigue of human eye. Sample capacity of this experiment should be above 20 participants (we choose 400 participants).
In previous discussions above, we have constructed the equation for visual fatigue evaluation during the 45min duration based on objective physiological parameters (AL, HOA4 and HOA12) by computational simulation. To test its application, we perform human factor experiments. There are 4 experiments used in this study. In experiment 1 and 2, participants watch videos in 2D and 3D patterns respectively for 45min. In experiment 3 and 4, participants count Landolt rings in classroom reading pattern with illuminances of 250lux and 500lux respectively.
4. Conclusions
In this study, we combine computational simulation and human factor experiment with large sample capacity to investigate the mechanism of light-induced visual fatigue. By analysis of structural parameters and physiological functional parameters, it is implied that light-induced visual fatigue is a special micro-variation of physiological function instead of ocular structure. According to the results of stability analysis, we found that HOAs, MTF and ACC could effectively reflect the variation regularity of assemblies in the front of human eye. Based on the duration and results of parameter selection and stability analysis, we designed a measurement method that could objectively quantify light (lighting and displaying) induced visual fatigue, resolving issues of traditional subjective questionnaire scoring such as instability and non-traceability. In addition, we constructed a calculation equation for the quantitative evaluation of light-induced visual fatigue. In measurements of ocular structural parameters, there are 400 participants. In stability experiment of functional parameters, there are 20 participants for the stability measurement and 20 participants for the variation measurement. In equation construction experiment, there are 400 participants. For practical test, measurements are performed on 120 participants for displaying experiment and 120 participants for lighting experiment. In total, there are 1080 measurements performed on 540 participants in this study. This method could quantify the influence of various light parameters (SPD, CCT, intensity and distribution) on visual fatigue of human eye, thus constructing the relation between physical parameters of light and physiological parameters of human eye. It is promising to provide an effective solution for quality improvement and design optimization of lighting or displaying products. More experiments on photo-biology are needed in the future to improve the efficiency and accuracy of this method. It is expected to investigate the mechanism of light-induced myopia by in the future, and figure out the method to depress myopia by optimizing light quality.
CIE Session 2019 – Abstract Booklet
558

PO197
THE RESPONSES OF THE AUTONOMIC NERVOUS SYSTEM ON HUMANS WHEN WORKING WITH DIFFERENT LED LIGHTING CONDITIONS
Chen, C.Y.1, Luo, M.R1, Wu, P.J.2, Lin, B.S.3, Tseng, C.Y.3, Hou, H.Y2, Chen, C.T.2, Tai, W.S.2 1 Graduate Institute of Colour & Illumination Technology, National Taiwan University of Science and
Technology, Taipei, CHINESE TAIPEI, 2 College of Information and Distribution Science, National Taichung University of Science and
Technology, Taichung, CHINESE TAIPEI 3 Institute of Imaging and Biomedical Photonics, National Chiao Tung University, Tainan, CHINESE
TAIPEI,
Abstract
Long working hours is common in the busy and changeable environment. Good working luminous environment therefore is primary for interior workers. LED is generally used as the lighting source for interior illumination. In this study, human responses of autonomic nervous system to different white LED lighting work environment are proposed, expecting to find out the interior working light source being able to effectively enhance concentration and comfort.
A general office space was simulated as the experimental architecture in this study. Using white LEDs as the experimental light sources, the lighting conditions contained 2 colour temperatures (4000K/6000K), 2 illuminances (400lux/700lux), and 3 dominant wavelengths (420nm/460nm/480nm).
Total 12 subjects (average age 23.7±0.6) participated in this experiment. The subjects executed
reading and tasks for about 1 hour, when the electrocardiograph signals were fully measured in the experimental process. The electrocardiograph information can be transferred into heart rate variability (HRV) information, where the high frequency power (HFP) stands for the parasympathestic activity index in human autonomic nervous system and low frequency power (LFP) represents the sympathestic activity index. The experimental results reveal that the subjects obviously enhance the sympathestic activity index under colour temperature 6000K and dominant wavelength 420nm. It shows that the subjects might feel energetic and enhance the concentration under such luminous environment.
CIE Session 2019 – Abstract Booklet
559


