Ranking Well-Being by Congressional District SARAH BURD-SHARPS and KRISTEN LEWIS Patrick Nolan Guyer | CHIEF STATISTICIAN Bob Land | EDITOR Alex Powers | RESEARCHER Rebecca Rasch | STATISTICAL ANALYST & CARTOGRAPHER Diana Tung | REPORT DESIGNER DOWNLOAD THIS REPORT: WWW.MEASUREOFAMERICA.ORG/CONGRESSIONAL-DISTRICTS-2015 MEASURE OF AMERICA of the Social Science Research Council The MEASURE OF AMERICA Series GEOGRAPHIES OF OPPORTUNITY
Transcript
Ranking Well-Being by Congressional District
SARAH BURD-SHARPS and KRISTEN LEWISPatrick Nolan Guyer | CHIEF STATISTICIAN Bob Land | EDITOR Alex Powers | RESEARCHER Rebecca Rasch | STATISTICAL ANALYST & CARTOGRAPHER Diana Tung | REPORT DESIGNER
DOWNLOAD THIS REPORT: WWW.MEASUREOFAMERICA.ORG/COnGRESSIOnAl-dIStRICtS-2015
MEASURE OF AMERICA of the Social Science Research Council
What Is Human Development?.................................................................………........…………………….....3
How Is Human Development Measured?.....................................................................…………………....5 Congress and US..................................................................................................................................8
What Does the American Human Development Index Reveal about U.S. CongressionalDistricts?.................................................................………………….....…………………….…………….....9
A Long and Healthy Life………..…………………….…………………..……........................................................20
Access to Knowledge......………..…………………….…………….…………........................................................28
A Decent Standard of Living……………..………….………….….…………........................................................35
Agenda for Action.......….....……………………………….………………………....................................................43
Notes and Bibliography.......................................................................................................................51
Congressional District Indicator Tables..............................................................................................55
DOWNLOAD THIS REPORT: WWW.MEASUREOFAMERICA.ORG/CONGRESSIONAl-dISTRICTS-2015
iGEOGRAPHIES OF OPPORTUNITY | Ranking Well-Being by Congressional District
GEOGRAPHIES OF OPPORTUNITY: Ranking Well-Being by Congressional District
GeoGraphies of opportunity is an in-depth look at how residents of America’s 436 congressional districts are faring in three fundamental areas of life: health, access to knowledge, and living standards. While metrics in these three areas do not measure America’s natural bounty, the rich diversity of its population, or the vibrant web of organizations and individuals engaged in making it a better place, they capture outcomes that are essential to well-being and opportunity. This report makes the case that geography- and population-based approaches offer a way to address the multiple and often interlocking disadvantages faced by families who are falling behind. Only by building the capabilities of all residents to seize opportunities and live to their full potential will the United States thrive.
The hallmark of this work is the American Human development Index, a supplement to Gross Domestic Product and other money metrics that tells the story of how ordinary Americans are faring. The American Human Development Index brings together official government data on health, education, and earnings and allows for well-being rankings not just of congressional districts but also of states, counties, census tracts, women and men, and racial and ethnic groups. The Index can empower communities and organizations with a tool to identify priorities and track progress over time.
HOW dO CONGRESSIONAl dISTRICTS FARE ON THE AMERICAN HUMAN dEvElOPMENT INdEx?
The American Human Development Index combines fundamental health, education, and standard of living indicators into a single number between 0 and 10. It is based on the Human Development Index of the United Nations, the global gold standard for measuring the well-being of large population groups. This report is Measure of America’s third exploration of well-being among congressional districts, building on over a dozen quantitative studies of well-being at the national, state, and community levels.
TX
MT
AZ
ID
NV
NM
OR
WY
UT
KS
IANE
MN
ND
FL
WI
GA
LA
NY
PA
MI
VAKY
MS
ME
WV
AK
CA
WA
CO
AL
NC
OHINIL
VTNH
MA
CTNJ
MD
DCDE
HI
RI
SC
TNAR
MO
OK
SD
Ov
ER
vIE
W
iiGEOGRAPHIES OF OPPORTUNITY | Ranking Well-Being by Congressional District
• The top ten congressional districts in terms of human development are all in the greater metropolitan areas of Los Angeles, New York City, San Francisco, and Washington, DC. These global cities attract skilled workers, world-class employers, diverse immigrants, and substantial investment of private and public resources.
• The bottom ten districts disproportionately comprise struggling rural and urban areas in the South. These lagging areas face interlocking challenges in terms of residential segregation by income and race, poor health, under-resourced educational infrastructure, and limited job prospects.
• Gaps in human development within states tend to be bigger than the gaps between states. While state population differences make comparisons difficult, among large states, California is the most unequal; among medium-sized states, Missouri has the largest gap between its highest- and lowest-scoring districts; and for small states, New Mexico contains the biggest disparities.
• In the 22 congressional districts where almost all residents (98 percent or more) are native-born, American Human Development Index scores are all below the national average.
•
• Life expectancy, the primary indicator of health and survival, ranges from just under 84 years in California District 19 (San Jose and part of Santa Clara County) to just under 73 years in Kentucky District 5 (rural southeastern Kentucky). Put another way, residents of the San Jose area can expect to live longer than the people of the longest-lived country, Japan (83.1 years)—while residents of southeastern Kentucky can expect to live about as long as residents of Gaza and the West Bank (73.0 years). Long-lived districts tend to be clustered in cities; districts with low life expectancies are mainly in the South.
• Disconcertingly, African Americans fare particularly poorly on health indicators. Whites outlive blacks by 3.6 years; African Americans have higher death rates from a variety of causes, chief among them heart disease, cancer, homicide, diabetes, and infant death. Furthermore, African American women outlive their male counterparts by over half a decade, the largest gender gap of any racial or ethnic group in life expectancy.
• The higher the proportion of foreign-born residents in a congressional district, the longer the district’s average life expectancy. Nationally, about 13 percent of the country is foreign-born. However, in the ten districts with the longest life expectancy, the share of immigrants ranges from roughly 25 to 50 percent.
Key Findings: A long and Healthy life
Key Findings: American Human development Index Ov
ER
vIE
W
iiiGEOGRAPHIES OF OPPORTUNITY | Ranking Well-Being by Congressional District
• Topping the charts in education are districts from the San Francisco, Boston, New York, Los Angeles, and Washington, DC, metro areas. They occupy this rarefied position for two primary reasons: these cities attract highly educated workers from elsewhere and support (with some notable exceptions) their youth with robust pathways to high school and college completion.
• A large body of research highlights the importance of preschool education in terms of future educational, professional, and social outcomes. However, there are 23 districts where less than one-third of 3- and 4-year olds are enrolled in preschool. These districts are found chiefly in Texas, California, Arizona, Washington, Nevada, and West Virginia.
• There are over 5.5 million disconnected youth in the United States—young people between the ages of 16 and 24 who are out of work and out of school. In 32 districts, at least one in every five youth are disconnected. These districts are concentrated in the South and Southwest.
• Median personal earnings by congressional district range from about $20,000 in the highly diverse Los Angeles neighborhoods of California District 34 to more than triple that sum (nearly $61,000) in New York District 12 (Manhattan’s East Side and parts of Brooklyn and Queens). However, the distribution of earnings between these two extremes is heavily skewed toward the lower end; in over half of all districts (222 out of 436), median personal earnings fall between $20,000 and $30,000. While certain areas are thriving economically, most of the United States cannot claim the same.
• Pockets of high and low earnings are found in every part of the country. The greatest earnings inequality is in the Middle Atlantic region—home to both the storied glamour of the top-earning Upper East Side of Manhattan and, just five subway stops away, the entrenched poverty of the South Bronx neighborhoods that make up District 15, which has the fourth-lowest earnings in the nation.
• Earnings are highly dependent on the nature of regional job markets and the skills of available workers. Each year, management and business workers earn, on average, $35,000 more than service job workers. Unfortunately, higher-paying jobs in management and business or skilled construction roles that require technical skills are out of reach to Americans with little education—or simply in another place.
Key Findings: Access to Knowledge
Key Findings: Standard of living
Ov
ER
vIE
W
GEOGRAPHIES OF OPPORTUNITY | Ranking Well-Being by Congressional District 1
GeoGraphies of opportunity: ranking Well-Being by Congressional District ranks the country’s 435 congressional districts and Washington, DC, using the American Human Development Index. While Gross Domestic Product (GDP) and other money metrics tell us how the economy is doing, the American Human Development Index measures how people are doing, taking into account health, education, and earnings.
To understand why this Index is an important supplement to GDP as a measure of America, consider Connecticut and Wyoming, states with similar GDPs per capita, in the $65,000 to $68,000 range. Does this mean that the people living in these two states enjoy similar levels of health, education, and living standards? It does not: Connecticut residents, on average, can expect to outlive their western compatriots by nearly two and a half years, are 40 percent more likely to have bachelor’s degrees, and typically earn $6,000 more per year. 1 GDP tells us many important things about economic development, but the American Human Development Index and GeoGraphies of opportunity provide policymakers, advocates, and the public a unique window into human development, revealing challenges and opportunities on which to act.
What does it mean to live in a congressional district ranked near the top of the Index? Compared to living in one of the country’s lowest-ranking districts, living in one of the highest-ranking districts can mean eleven more years of life expectancy, being about eight times as likely to have a bachelor’s degree, and for the typical worker, earning three times as much. Vast differences in fundamental aspects of human life are found not just across the country but also within states. In fact, our nation’s greatest extremes are found in a single state (see SIdEBAR).
The top-ranked district on the American Human Development Index is California’s 18th District, the epicenter of Silicon Valley; the bottom-ranked district is California’s 21st District, which includes part of Bakersfield and the Central Valley—a leading agricultural producer that feeds the country, but where many can barely afford to feed their families. These stark gaps tell us a lot more about progress and quality of life in America than do quarterly GDP reports and the minute-by-minute stock ticker.
Introduction
DISTRICT 213.04
OUT OF 10
Both the top- and bottom-ranked districts in the nation can be found in California.
DISTRICT 188.18
OUT OF 10
GEOGRAPHIES OF OPPORTUNITY | Ranking Well-Being by Congressional District 2
The Great Recession is now five years behind us, and many indicators give reason for optimism that its lingering effects are finally fading. Unemployment rates have dropped to 5.6 percent from a high of 10.0 percent in 2009. The foreclosure rate is down 61 percent from its 2010 peak.2 GDP growth has rebounded,3 and the stock market recently hit an all-time high.4
Yet other indicators are troubling. Too many middle-class jobs lost during the recession seem to have disappeared for good, replaced by low-wage jobs with few benefits. Though the unemployment rate is down, millions of Americans have stopped looking for work altogether, and wages have remained flat despite the tightening labor market.5 Equally concerning is the uneven nature of the recovery; cities with strong tech and energy sectors are thriving, while many Rust Belt metros continue to struggle.6
These money metrics show a mixed picture. The news is good for some parts of America, bad for others. But how are these national trends playing out in everyday lives? Are things getting better or worse, and for whom? GeoGraphies of opportunity answers these questions, because if we want to know how different groups of people are doing, we need to track indicators that focus directly on them.
TRADITIONAL Approach
GDP
How is the
economy doing?
HUMAN DEVELOPMENT Approach
How are
people doing?
PROGRESS In America
Although the gerrymandering of districts can concentrate populations with similar characteristics together in a way that distorts the diversity of many locales, congressional districts nonetheless provide a fascinating and revealing lens through which to view the U.S. population. They are all roughly the same size in terms of population—about 725,000 people, allowing for apples-to-apples comparisons—and each sends a representative to Congress, connecting the population to national priority setting and policymaking.7
The pages that follow define the American Human Development Index; rank our country’s 436 districts; explore what the rankings reveal about different places in the United States; take a deeper look at differences in health, education, and earnings; and offer recommendations for boosting the scores of the districts that lag behind.
GEOGRAPHIES OF OPPORTUNITY | Ranking Well-Being by Congressional District 3
Human development is a hopeful, optimistic concept that values the real freedom of women and men to decide for themselves what to do and how to live. Human development is defined as the process of improving people’s well-being and expanding their choices. It focuses on the everyday experiences of ordinary people and the degree to which they are able to seize opportunities, invest in themselves and their families, and live to their full potential.
The human development concept is the brainchild of the late economist Mahbub ul Haq, who, during the 1970s and 1980s, came to believe that existing measures of progress failed to account for the true purpose of development: making people’s lives better. He found particular fault with reliance on the commonly used measure of GDP, which he believed provided misleading information about the everyday conditions of people’s lives. Haq argued that money and economic growth were essential means to an end but were not ends in themselves. Healthier, freer people were.
Working with Nobel laureate and Harvard professor Amartya Sen, Dr. Haq developed an alternative to GDP: the Human Development Index, which debuted in the first Human Development Report in 1990. Published by the United Nations every year since then, the Human Development Report and Index are now the global gold standard for measuring the well-being of large population groups. In addition to the annual global report, national reports have been produced in 135 countries. They boast an impressive record of spurring public debate and political action and shining a spotlight on both progress and setbacks.
The work of Measure of America (MOA), a nonpartisan project of the nonprofit Social Science Research Council, is built upon the UN Human Development Index and approach. MOA relies on the same conceptual framework and areas of focus as the United Nations does, but uses data more relevant to an affluent democracy. Since MOA introduced its modified American Human Development Index in 2008, organizations and communities across the country have used it to understand local needs and shape evidence-based policies and people-centered investments (see BOx 1).
What Is Human Development?
Human development is defined as the process of improving people’s well-being and expanding their choices. It focuses on the everyday experiences of ordinary people.
GEOGRAPHIES OF OPPORTUNITY | Ranking Well-Being by Congressional District 4
BOx 1 Measure of America’s Human development Work in Action
A Portrait of Sonoma County has been music to my ears. It has been a new language for writing a new narrative for how we can begin to talk about improving the human condition in our community.
Oscar chavez, assistant directOr Of human services, sOnOma cOunty
This congressional district brief is Measure of America’s fourth national-level report. In addition, portraits have been developed in collaboration with local partners in three states, and research briefs have been published on economic opportunity, women’s well-being, and youth disconnection.
What impact has Measure of America’s work had on local policymaking?
• Following A Portrait of Sonoma County’s recommendation to “make universal preschool a reality,” the county Board of Supervisors requested a costing estimate for this program. Policymakers estimated requiring $70 million for instruction and facilities and the Board is exploring financing options for a universal preschool program.
• Shortly after publication of A Portrait of Sonoma County, the Sonoma County (CA) Board of Supervisors voted to regulate e-cigarette use, citing the Portrait’s findings on high teenage tobacco use in the county as an important impetus for new limitations.
• MOA’s 2013 report “One in Seven: Ranking Youth Disconnection in the 25 Largest Metro Areas” explored Phoenix’s last-place youth disconnection ranking. Following its release, the city’s mayor and a coalition of other Phoenix leaders vowed to tackle the issue head-on. They’ve held town-hall meetings, developed a Mayor’s Roundtable to partner with schools, and mobilized considerable resources, including a $1.5 million U.S. Department of Justice grant for prevention efforts.
• The Marin Community Foundation commissioned A Portrait of Marin in 2012, which reframed the debate about disparity and opportunity in this California county and led to implementation of countywide universal preschool education.
GEOGRAPHIES OF OPPORTUNITY | Ranking Well-Being by Congressional District 5
The concept of human development is very broad. It encompasses all of the human capabilities we need to chart our own course in life, from good health, access to knowledge, and sufficient income to physical safety, a sustainable environment, the respect of others, religious freedom, political participation, and equality under the law. These and other capabilities are the tools we have to live with dignity, care for our families, and realize our dreams and ambitions (see SIdEBAR). Measuring all the facets of such an expansive concept is an impossible task. The UN’s Human Development Index, therefore, measures just three fundamental human development dimensions: a long and healthy life, access to knowledge, and a decent standard of living (see FIGURE
1). There is broad consensus that these three capabilities are essential building blocks for a life of value, freedom, and dignity. From a practical perspective, reliable and regularly collected proxy indicators are available for each dimension.
The American Human development Index rests on these same three capabilities but uses a different set of indicators to better reflect the conditions in an affluent democracy. Each of the three dimensions is weighted the same, on the premise that all are equally central to human well-being.
The final American HD Index is expressed on a scale from 0 to 10, with 10 being the highest possible score. The Index score for the whole country is 5.06 using the most recent available data. Alone, that number is not especially meaningful, but it provides a helpful benchmark for understanding the tremendous variation that exists among congressional districts—from districts with scores over 8 to about fifty districts with scores below 4, less than half the value of the top scores.
To calculate the Index, these indicators, which are presented in years, percentages, and dollars, are put on a common 0- to 10-point scale. Three subindexes, one each for health, education, and earnings, are created; they are then added together and divided by 3 to yield the American Human Development Index value. A more detailed technical description is contained in the Methodological Notes at: www.measureofamerica.org/congressional-districts-2015/methodological-note/
How Is Human Development Measured?
Capabilities and Human development
The human development approach rests on a robust conceptual framework: Nobel laureate economist Amartya Sen’s seminal work on capabilities.8 Simply put, capabilities—what people can do and what they can become—are a person’s tool kit for living a fulfilling life. Our capabilities are expanded both by our own decisions and actions and by the institutions and conditions around us.
Capabilities shape the real possibilities that are open to people. Individuals with extensive, well-developed capabilities have the tools they need to make their vision of a good life a reality. They have more control over the conditions of their daily lives, greater ability to direct their life course, and a much better shot at realizing their dreams than people with fewer capabilities.
GEOGRAPHIES OF OPPORTUNITY | Ranking Well-Being by Congressional District 6
CAPABILIT IES
A DecentStandard of Living
Access toKnowledge
A Long andHealthy Life
THREE DIMENSIONS
AmericanHuman Development
INDEX
3
HealthINDEX
+ +Education
INDEXIncomeINDEX
INDICATORS
Life expectancyat birth
Medianearnings
Schoolenrollment
Educationaldegree attainment
equality before the law
respect of others
digital access self-expression
physical safety family and community
political participation voice and autonomy
religious freedom
sustainable environment
FIGURE 1 Human development: From Concept to Measurement
A long and Healthy life is measured using life expectancy at birth. It is calculated using mortality data from the Centers for Disease Control and Prevention’s National Center for Health Statistics and population data from the U.S. Census Bureau, both for 2011, the most recent year for which data are available.
Access to Knowledge is measured with two indicators: school enrollment for the population ages 3 to 24 and educational degree attainment for those age 25 and older. A one-third weight is applied to the enrollment indicator and a two-thirds weight to the degree attainment indicator. Data for both come from the U.S. Census Bureau’s 2013 American Community Survey.
A decent Standard of living uses median earnings of all full- and part-time workers age 16 and older from the 2013 American Community Survey.
GEOGRAPHIES OF OPPORTUNITY | Ranking Well-Being by Congressional District 7
Recent years have seen a flurry of new indexes, scorecards, and dashboards that, like the American HD Index, measure well-being. What sets the American HD Index apart from the pack? Six features make the American HD Index particularly useful for understanding and improving the human condition in the United States.
An overreliance on economic metrics such as GDP per capita can provide misleading information about the everyday conditions of people’s lives. Connecticut and Wyoming, for instance, have nearly the same GDP per capita. Yet Connecticut residents, on average, can expect to outlive their western compatriots by roughly two and a half years, are 40 percent more likely to have bachelor’s degrees, and typically earn $6,000 more per year.
The cross-sectoral American HD Index considers the interlocking factors that create opportunities and fuel both advantage and disadvantage. For example, research overwhelmingly points to the dominant role of education in increasing life span, yet this link is rarely discussed. In fact, 25-year-olds with an education beyond high school have an average life expectancy seven years longer than those whose education stops with high school.9
Human development and the HD Index focus on the end result of efforts to bring about change. Lots of data points help us quantify inputs to address a problem (for example, funding for neighborhood health clinics, or the number of participants in a wellness program). But we typically stop short of measuring the outcome of these efforts to truly understand if they are making a difference. Are people living longer, healthier lives?
The HD Index moves away from the binary us/them view of advantage and disadvantage provided by today’s poverty measure to one in which everyone can see him- or herself along the same continuum.
Because it includes a limited number of data points that are consistently collected in the same way in states across the country, and are updated annually, the Index allows for reliable “apples-to-apples” comparisons over time and from place to place and population group to population group.
American Human Development Index scores for different geographies, major racial and ethnic groups, and women and men make plain the extent of fundamental disparities between different groups of Americans.
BOx 2 What Sets the American Human development Index Apart?
It connects sectors to show problems, and their solutions, from
a people-centered perspective.
It supplements money metrics with
human metrics.
It focuses onoutcomes.
It countseveryone.
It is comparablefrom place to place
and over time.
It directly measures inequality in a way that is
easy to understand.
GEOGRAPHIES OF OPPORTUNITY | Ranking Well-Being by Congressional District 8
96%30%
AT LEAST BACHELOR’S DEGREE
10
9
8
7
6
5
4
3
2
1
0
The American Human Development Index is a measure of well being and access to opportunity. It combines three central building blocks of a life of choice and value—good health, access to knowledge, and a decent standard of living—into a single number on a ten-point scale, with 10 being highest.
HEALTH: Life Expectancy
Every 9 weeks, members of
Congress earn what the typical American earns
in a year.
EARNINGS: Median Personal Earnings
$30,454
$174,000
EDUCATION: Degree Attainment
U.S. CONGRESS
U.S. CONGRESSData sources: http://www.measureofamerica.org/
www.measureofamerica.orgA project of the Social Science Research Council
HD
IN
DE
X S
CO
RE
CONGRESS AND US
How Representative Are Our Representatives?
As members of the 114th Congress took their seats on January 6, 2015, there were more women among them than at any time in U.S. history. In addition, this group of lawmakers is one of the most racially diverse Congresses.
Yet despite this progress, today’s Congress is still a far cry from representing the diversity of all Americans. Members of the 114th Congress are significantly more likely to be male, white, and over 65 than other Americans.
Women make up more than half of the U.S. population, but only 19.5 percent of Congress.
Whites make up 62.4 percent of the total U.S. population, but 82.1 percent of the 114th Congress. The Democratic delegation looks a bit more like the U.S. population in terms of race and ethnicity than the Republican side.
HUMAN DEVELOPMENT: Members of the 114th Congress score much better on the Human Development Index than the United States as a whole, thanks mainly to their very high incomes and educational levels. But while they are far ahead of the rest of the United States when it comes to education and income, they lag in life expectancy.
HEALTH: The disproportionate number of men (women live longer) and dearth of Asian Americans and Latinos (groups that have relatively long life expectancies) result in Congress having a lower life expectancy than the U.S. average by 1.5 years.
EDUCATION: Over 95 percent of Congress has completed a bachelor’s degree or higher; only 30 percent of the general population has. Everyone in Congress has completed high school—27 million Americans have not.
EARNINGS: Members of Congress earn a base salary of $174,000 a year; they earn in nine weeks what the typical American makes in a year, $30,454.
What would the U.S. look like if members of Congress were to support earnings and education outcomes like theirs for all Americans? Write your representative to ask!
Measure of America, a nonpartisan project of the Social Science Research Council, provides easy-to-use yet methodologically sound tools for understanding the distribution of well-being and opportunity in America and seeks to foster greater awareness of our shared challenges.
77.6 years
79.1years80
75
70
65U.S. CONGRESS
THE AMERICAN HUMAN DEVELOPMENT INDEX
@MOA_org
measureofamerica
5.06
67%11%
30%
87% 100%
96%
U.S. CONGRESS CONGRESSIONAL DEMOCRATS
CONGRESSIONAL REPUBLICANS
GEN
DER FEMALE
MALE
AGE
MEDIAN AGE 38 years 59 years 62 years 59 years
RACE
& E
THN
ICIT
Y
WHITE 62% 82% 66% 95%
LATINO 17% 7% 11% 4%
AFRICAN AMERICAN 12% 9% 19% 1%
ASIAN AMERICAN 5% 2% 5% 0%
NATIVE AMERICAN 0.7% 0.4% 0% 0.7%
Note: Data are accurate as of April 2015, which includes three vacant House seats.
MEASUREOFAMERICAof the Social Science Research Council
GEOGRAPHIES OF OPPORTUNITY | Ranking Well-Being by Congressional District 9
It won’t surprise many readers to know that well-being levels, as measured by health, education, and earnings combined, reach their highest levels on the country’s coasts. While every region has its strengths, a reinforcing mix of thriving knowledge industries, financial capital, research universities, attractive jobs for highly educated workers, and well-developed infrastructure underpins the economic dominance of cities on the East and West Coasts. The top twenty districts are all on either the East or West Coast, except for Texas’ 3rd District, which includes the northern Dallas suburbs, and seventeen of the top twenty districts are in just four greater metro areas: Los Angeles, New York, San Francisco, and Washington, DC (see TABlE 1).
What Does the American Human Development Index Reveal about U.S. Congressional Districts?
Sources: Measure of America calculations using data from the Centers for Disease Control and Prevention 2011 and U.S. Census Bureau Population Estimates 2011 and American Community Survey 2013.
GEOGRAPHIES OF OPPORTUNITY | Ranking Well-Being by Congressional District 10
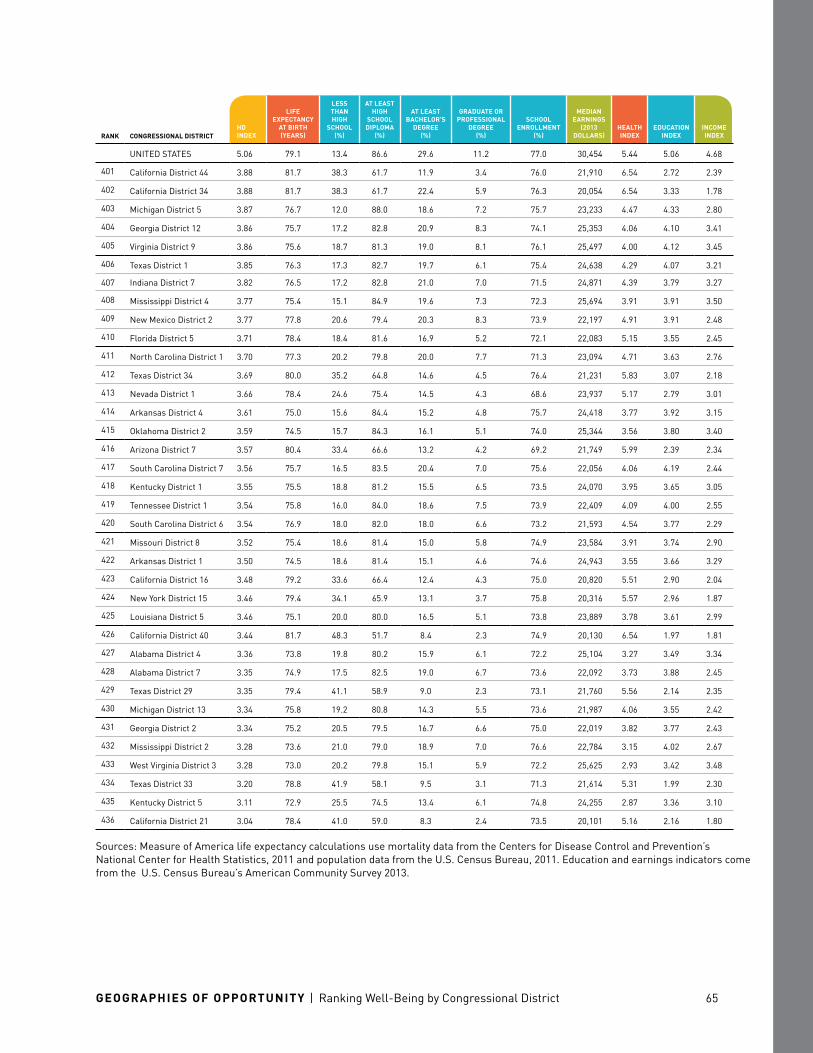
At the other end of the rankings are twenty districts that face considerable well-being challenges (see TABlE 2). They fall largely in the South: Alabama, Arkansas, Georgia, Kentucky, Louisiana, Mississippi, South Carolina, Tennessee, Texas, and West Virginia. Only six of the twenty districts are outside these southern states: Three are in California (two in the rural Central Valley, one in inner-city Los Angeles), one is in New York (in the Bronx), one is in Michigan (Wayne County and parts of Detroit), and one is in rural Missouri. These twenty struggling districts disproportionately comprise inner-city, high-poverty neighborhoods (in the North, South, and California) and rural areas in California and the South.
436 California District 21 3.04 78.4 41.0 8.3 2.4 73.5 20,101
Sources: Measure of America calculations using data from the Centers for Disease Control and Prevention 2011 and U.S. Census Bureau Population Estimates 2011 and American Community Survey 2013.
Well-Being in the Top Three Congressional districts
Topping the chart with a score of 8.18 out of 10 is California District 18, which includes the Silicon Valley cities of San Jose, Palo Alto, Mountain View, and Los Gatos. Residents in these communities have an average
GEOGRAPHIES OF OPPORTUNITY | Ranking Well-Being by Congressional District 11
life expectancy of 83.7 years, about four and a half years longer than the average American. Three of ten residents hold graduate or professional degrees (nearly triple the national average), and median personal earnings in this high-tech stronghold are $55,215.
Close on its heels is New York District 12 (8.05), comprising much of New York City’s East Side as well as several neighborhoods in Queens and Brooklyn. Interestingly, compared to the top-ranked Silicon Valley district, this district performs significantly better in terms of earnings, $60,953. In addition, a slightly higher share of the New York district’s adults have bachelor’s degrees. However, life expectancy and the school enrollment rate are both lower.
The third-place finisher is California District 33 (7.82), which encompasses the Los Angeles metro area’s Beach Cities, the Westside, and the Palos Verdes Peninsula. California District 33 has the highest rate of children and young adults ages 3 to 24 enrolled in school among the 436 districts.
Well-Being in the Bottom Three Congressional districts
The district with the lowest well-being score is, like the district with the highest score, in California. California District 21 comprises Kings County and parts of Fresno, Kern, and Tulare Counties (see TABlE 2). Though this agricultural powerhouse in California’s Central Valley soars when it comes to dairy and crop production, it lags badly in terms of human development, scoring just 3.04 on the 10-point scale. Putting this score in historical perspective is sobering; 3.04 is roughly the score of the United States as a whole more than thirty years ago (see TABlE 3).
TABlE 3 Historical Trends in Human development, 1960–2013
YEAR Hd INdEx
lIFE ExPECTANCY
AT BIRTH (YEARS)
lESS THAN HIGH SCHOOl
(%)
AT lEAST BACHElOR’S
dEGREE (%)
GRAdUATE OR PROFESSIONAl
dEGREE (%)
SCHOOl ENROllMENT
(%)
MEdIAN EARNINGS
(2013 dOllARS)
Today 5.06 79.1 13.4 29.6 11.2 77.0 30,454
2010 5.03 78.9 14.4 28.2 10.4 77.6 30,876
2000 4.76 77.0 19.6 24.4 8.9 76.6 33,210
1990 3.77 75.4 24.8 20.3 7.2 73.4 26,680
1980 3.02 73.7 33.5 16.2 7.6 68.3 24,821
1970 2.36 70.8 47.7 10.7 4.6 71.5 24,675
1960 1.63 69.7 58.9 7.7 3.0 75.6 20,039
Source: Measure of America calculations using data from historical resources of the U.S. Census Bureau and Centers for Disease Control and Prevention. Please see Methodological Note in Lewis and Burd-Sharps, The Measure of America 2013–2014, for more details.
California District 21 has a well-being score roughly equal to that of the United States more than thirty years ago.
GEOGRAPHIES OF OPPORTUNITY | Ranking Well-Being by Congressional District 12
In this Central Valley district, four in ten adults did not graduate high school, and median personal earnings barely top $20,000, roughly the poverty line for a family of three.
Kentucky District 5 is next-to-last. This rural Appalachia district has the lowest life expectancy, 72.9 years, of any district in the country. Again, the historical perspective is telling; 72.9 is the life expectancy that prevailed in the United States in the mid-1970s.
Texas District 33, comprising parts of Dallas and Tarrant Counties, is third from the bottom, with a score of 3.20. A Washington Post study identified this district as one of the country’s ten most gerrymandered districts, drawn such that it joins two noncontiguous, highly disadvantaged areas. The district’s population is over 80 percent African American and Latino combined.10
The peaks and valleys of human development are attention-grabbing—but not always surprising. Equally important is what’s happening in all the districts in between. Although every region has highs and lows, even a cursory glance at MAP 1 makes clear that some parts of the country (represented with darker colors) are doing much better than others.
MAP 1 American Human development Index by Congressional district
TX
MT
AZ
ID
NV
NM
OR
WY
UT
KS
IANE
MN
ND
FL
WI
GA
LA
NY
PA
MI
VAKY
MS
ME
WV
AK
CA
WA
CO
AL
NC
OHINIL
VTNH
MA
CTNJ
MD
DCDE
HI
RI
SC
TNAR
MO
OK
SD
Hd INdEx
5.82–8.185.19–5.814.71–5.184.23–4.703.04–4.22
GEOGRAPHIES OF OPPORTUNITY | Ranking Well-Being by Congressional District 13
The Human Development Index for the U.S. Census Bureau’s nine regional divisions, which fall within the four main Census regions of the Midwest, Northeast, South, and West, shows that the top-performing part of the country, New England, scores 5.91; the bottom-performing area, the East South Central United States (encompassing Alabama, Kentucky, Mississippi, and Tennessee), scores 4.09 (see FIGURE 2). A New Englander lives, on average, 4.6 years longer, is about 60 percent more likely to have a bachelor’s degree, and earns over $8,000 more than the typical resident of the East South Central United States. The adjacent New England (5.91) and Middle Atlantic (5.50) regions are doing the best, and the adjacent West South Central (4.58) and East South Central (4.09) areas are doing the worst (see FIGURE 2).
FIGURE 2 American Human development Index by Regional division
RANK U.S. REGIONAl dIvISIONS Hd INdEx
lIFE ExPECTANCY
AT BIRTH (YEARS)
lESS THAN HIGH SCHOOl
(%)
AT lEAST BACHElOR’S
dEGREE (%)
GRAdUATE OR PROFESSIONAl
dEGREE (%)
SCHOOl ENROllMENT
(%)
MEdIAN EARNINGS
(2013 dOllARS)
United States 5.06 79.1 13.4 29.6 11.2 77.0 30,454
4 WEST NORTH CENTRAl 5.12 79.2 9.4 29.4 10.0 77.3 30,262
5 SOUTH ATlANTIC 4.99 78.8 13.2 29.7 11.5 76.5 30,017
6 EAST NORTH CENTRAl 4.96 78.4 11.2 27.8 10.4 77.8 30,024
7 MOUNTAIN 4.95 79.5 11.9 29.6 10.7 75.2 28,901
8 WEST SOUTH CENTRAl 4.58 77.9 17.2 26.0 8.7 75.7 28,843
9 EAST SOUTH CENTRAl 4.09 75.9 15.5 23.2 8.8 75.1 26,720
Source: Measure of America calculations using data from the Centers for Disease Control and Prevention 2011, U.S. Census Bureau Population Estimates 2011 and U.S. Census Bureau American Community Survey 2013.
Note: These nine divisions are defined by the U.S. Census Bureau.
NEW ENGlANd(CT, ME, MA, NH, RI, VT)
5.91
MIddlE ATlANTIC(NJ, NY, PA)
5.50PACIFIC
(AK, CA, HI, OR, WA)
5.34
WEST NORTH CENTRAl(IA, KS, MN, MO, NE, ND, SD)
5.12
SOUTH ATlANTIC(DE, DC, FL, GA, MD, NC, SC,
VA, WV)
4.99
EAST NORTH CENTRAl(IL, IN, MI, OH, WI)
4.96
MOUNTAIN(AZ, CO, ID, MT, NV, NM, UT, WY)
4.95WEST SOUTH CENTRAl
(AR, LA, OK, TX)
4.58
EAST SOUTH CENTRAl(AL, KY, MS, TN)
4.09
GEOGRAPHIES OF OPPORTUNITY | Ranking Well-Being by Congressional District 14
Interestingly, the range in congressional district scores in New England is fairly compact compared to, for instance, the range in the Middle Atlantic and Pacific regions (see FIGURE 3). The high in New England is Massachusetts District 5 (7.07), which lies to the north and west of Boston and includes the cities of Cambridge, Lexington, and Framingham; the low is Maine District 2 (4.45), which encompasses the majority of the state’s land area and is heavily rural. In addition, all the districts in New England except for Maine District 2 score above the U.S. average.
East South Central regional well-being scores are also very close together. In this region, however, only one district, Alabama District 6, scores above the national average, but not by much, with a 5.25; it is made up almost entirely of suburban communities that ring the urban core of Birmingham. All the other districts in the region fall below the national average, with Kentucky District 5 in last place with a score of 3.11.
Although residents of New England districts have, on average, higher earnings and a larger proportion of adults with a bachelor’s or graduate degree, the Pacific region dominates in health, with an average life expectancy of nearly 81 years. The West North Central region (districts in Iowa, Kansas, Minnesota, Missouri, Nebraska, and the Dakotas) performs the best in terms of adults who have at least a high school degree; only 9.4 percent lack one.
GAP: 5.14
GAP: 4.58
GAP: 4.47
GAP: 3.86
GAP: 3.54
GAP: 3.15
GAP: 2.80
GAP: 2.61
GAP: 2.14
FIGURE 3 Gap in Well-Being Scores within Each Regional division
HU
MA
N D
EV
ELO
PM
EN
T I
ND
EX
10
9
8
7
6
5
4
3
0
MIDDLE
ATLANTIC PACIFICSOUTH
ATLANTIC
EAST SOUTH
CENTRAL
NEW ENGLAND
MOUNTAIN
WEST NORTH
CENTRAL
EAST NORTH
CENTRAL
WEST SOUTH
CENTRAL
LOWEST HD INDEX SCORE
IN REGION
HIGHEST HD INDEX SCORE
IN REGION
3.043.463.283.203.34
3.57 3.52
4.45
3.11
5.25
7.07
6.376.67
6.88 7.06
7.758.05 8.18
The range in congressional district well-being scores in New England is fairly compact compared to the range in the Middle Atlantic and Pacific regions.
GEOGRAPHIES OF OPPORTUNITY | Ranking Well-Being by Congressional District 15
These regional differences are not new. Measure of America produced a ranking of U.S. congressional districts in its Measure of America 2008–2009. Although the redistricting that occurred following the 2010 Census makes it impossible to compare today’s districts to the pre-2010 districts, it is possible to group the previous districts into the Census divisions and make comparisons that way. The 2005-vintage congressional district data likewise show the East South Central and West South Central regions in the last two places, and the New England and Middle Atlantic regions on top.
The good news, however, is that parts of the South are making faster progress on human development than the country as a whole. Between 2005 and 2013, the West South Central region (comprising Arkansas, Louisiana, Oklahoma, and Texas) saw its score improve by 7.3 percent, the most of any region, compared to 2.9 percent for the entire nation. This improvement resulted from modest increases in life expectancy and impressive gains in adult educational attainment. Earnings, on the other hand, fell in most regions between 2005 and 2013—but they remained essentially unchanged in the West South Central region; nationally, earnings fell 6.5 percent during this period, adusted for inflation.
Human development gaps within states tend to be bigger than the gaps between states. As discussed above, the top- and bottom-ranking districts are both in California. The range between these two districts is a considerable 5.14 points on the 10-point index scale. In Virginia, another state with large inequalities, the range between the top- and bottom-scoring districts is also large, at 3.90 points. Yet the difference in scores between Virginia (5.49) and California (5.36), using state-level Index data, is very small. Eight states have districts in both the fifty top-scoring districts and the fifty bottom-scoring districts: California, Georgia, Michigan, Missouri, New York, North Carolina, Texas, and Virginia. For a closer look at some factors that drive large intrastate disparities in Virginia, see BOx 3.
Comparing states with tens of millions of people to those with fewer than 1 million can be problematic; dividing the states into three roughly equal groups by the number of congressional districts they have allows for more defensible comparisons. Among large states (with at least nine congressional districts), California is the most unequal in well-being outcomes between its congressional districts; among medium-sized states (between four and eight districts), Missouri is the most unequal; and among small states (three or fewer districts), New Mexico has the highest inequality in well-being and access to opportunity.
largest Human development disparities within States
lARGE STATES: California
DISTRICT 188.18
DISTRICT 213.04
Hd INdEx GAP:
2.94
DISTRICT 26.46
DISTRICT 83.52
MId-SIZEd STATES: Missouri
SMAll STATES: New Mexico
Hd INdEx GAP:
1.08DISTRICT 1
4.85DISTRICT 2
3.77
Hd INdEx GAP: 5.14
GEOGRAPHIES OF OPPORTUNITY | Ranking Well-Being by Congressional District 16
The relationship between immigration and well-being is not straightforward. Congressional districts with a high proportion of immigrants have some of the highest HD Index scores—and some of the lowest. This dichotomy is due to the tremendous range of capabilities immigrants arrive with. Some come to the United States with high levels of education, in-demand skills, and extensive social networks, while others come from places where opportunities for higher education or the development of skills for the knowledge economy are far more limited. These differences have a major impact on education and earnings.
One clear trend emerges, however: The higher the proportion of foreign-born residents in a congressional district, the longer the district’s average life expectancy.11 Previous MOA research for a report on well-being in California revealed a surprising 3.2-year life expectancy gap in favor of foreign-born Latinos as compared to their U.S.-born counterparts.12 This advantage, however, generally does not last. Research suggests that the longer immigrants are in the United States, the more acculturation tends to erode these health advantages. For instance, as immigrants adopt fast-food-heavy diets typical of native-born Americans, their risk of obesity-related health problems increases. The health risks associated with acculturation are discussed below.
Interestingly, in the 22 congressional districts where almost all residents (98 percent or more) are native-born, Human Development Index scores are all below the national average; scores range from 3.11 to 4.77. Many reasons can help explain this outcome. As discussed above, immigrants tend to have better health than native-born Americans, so the near-total absence of immigrants may be pulling down the life expectancy in this group of districts. Another possible explanation is that areas with higher levels of well-being are more attractive places for immigrants to settle than areas with lower levels of well-being; new arrivals may be less likely to move to places where low levels of income and education indicate faltering economic opportunity.
The overall American Human development Index score for a specific place signals how well or poorly people living there are faring. But the Index is just the start of a conversation about well-being. Going into greater depth is important to understand what’s behind the summary scores. The following pages explore the health, education, and living standards of the country’s 436 congressional districts.
The higher the proportion of foreign-born residents in a congressional district, the longer the district’s average life expectancy.
GEOGRAPHIES OF OPPORTUNITY | Ranking Well-Being by Congressional District 17
Virginia Congressional Districts 8 and 9 epitomize the increasingly sharp divide that separates thriving America from struggling America. Virginia District 8, part of the Washington, DC, metro area, is home to an ethnically diverse population of comparatively well-educated, well-paid knowledge workers living and working in and around a vibrant urban hub. The largely rural southwestern District 9 is home chiefly to U.S.-born whites, a large share of whom work in service occupations and blue-collar jobs. They lie at different poles of the 10-point scale, 7.75 vs. 3.86.
BOx 3 A Tale of Two districts: Human development in virginia
MEdIAN EARNINGS (2013 dOllARS)
$52,003
$25,497
lIFE ExPECTANCY AT BIRTH (YEARS)
vA 8vA 9
83.5years75.6
years
vA 8vA 9LESS THAN
HIGH SCHOOLAT LEAST
BACHELOR’S DEGREE
GRADUATE OR PROFESSIONAL
DEGREE
9.0%
18.7%
61.4%
19.0%
31.1%
8.1%
77.0%76.1%
SCHOOl ENROllMENT
vA8
vA 9
EdUCATIONAl ATTAINMENT
vA 8
7.75vA 9
3.86
virginia Congressional district 8 includes urban and suburban communities in Northern Virginia’s Arlington County, parts of Fairfax County, and Alexandria and Falls Church. With a score of 7.75, it is clearly thriving; it ranks fifth of all 436 districts, and first in Virginia. Life expectancy is 83.5 years, over four years longer than the national average. The share of adults age 25 and older with bachelor’s degrees, 61.4 percent, is more than double the national average, and the share of adults who have a graduate or professional degree (31.1 percent) is about triple the U.S. share.
The population is also highly diverse. Residents born overseas make up 27.8 percent of the district’s population, double the national rate, and District 8 is home to proportionately fewer whites and more African Americans and Asian Americans than the country as a whole. People over age 65 as well as people with disabilities are underrepresented, however. Participation in the labor force—74.4 percent as compared to the U.S. average of 63.2 percent—is high.
The largest share of workers, 56.7 percent, is employed in the highest-paying job category: management, business, sciences, and the arts; the share in the lowest-paying U.S. employment sector, service occupations, is below the U.S. average. Government jobs account for a significant share of the labor market. The three largest employers are Fairfax County Public Schools, the U.S. Department of Defense, and the County of Fairfax. The fifty largest employers in the district are
GEOGRAPHIES OF OPPORTUNITY | Ranking Well-Being by Congressional District 18
a mixture of public- and private-sector organizations, with many federal agencies and Fortune 500 companies among them.13
The southwestern virginia Congressional district 9 borders West Virginia to the north, Kentucky to the northwest, and Tennessee and North Carolina to the south. Close to six in ten residents live in rural areas.14 Its score of 3.86 places this district 405th in the United States, last in Virginia. Here, residents can expect to live a striking eight years fewer than their fellow Virginians in District 8, close to one in five adults never finished high school, and earnings are half those of their DC metro–area counterparts.
Only about half (53.3 percent) of the working-age population is in the labor force, and the disability rate is almost three times that of Virginia District 8 and about 50 percent higher than the national rate. The shares of people living in poverty and elderly residents in poverty are both higher than the national rates. The population is overwhelmingly white—nine in ten residents as compared with five in ten in Virginia District 8.
Economic mainstays of the past, such as coal mining and tobacco farming, have long been in decline. Today a larger share of workers in Virginia’s 9th District are employed in service occupations, construction and maintenance occupations, and production, transportation, and moving materials
vA 9
vA 8
10.3%24.2%
GEOGRAPHIES OF OPPORTUNITY | Ranking Well-Being by Congressional District 19
occupations than in the country as a whole, and fewer work in fields that tend to pay better—management, business, science, and the arts. The largest employers in Virginia District 9 are Virginia Tech, Walmart, Food City, Volvo, and the Roanoke and Montgomery County School Boards.15
Improving human development outcomes in southwestern Virginia requires greater investment in people’s capabilities to thrive in the new economy. Research consistently finds that a high-quality preschool experience helps all children enter kindergarten on an equal footing and also contributes to better health, economic, social, and emotional outcomes ten, twenty, even forty years later. Boosting the rate of 3- and 4-year olds who attend preschool—now a very low 36.6 percent—is an intervention that would pay huge dividends down the road. Increasing the share of adults who complete high school and go on to some form of postsecondary education as well as attracting businesses that pay well are likewise important priorities for improving well-being in the “Fighting Ninth.”
GEOGRAPHIES OF OPPORTUNITY | Ranking Well-Being by Congressional District 20
The increase in life expectancy in the United States, nearly a decade since 1960 and almost four years since 1990, represents meaningful human progress. But some Americans, especially African Americans (see BOx 4) and people living in the South, have not benefitted from this progress to the same extent as others. In Mississippi District 2, West Virginia District 3, and Kentucky District 5, residents have an average life expectancies today similar to those found in the country as a whole in the late 1970s.
One-third of the American HD Index measures health. The metric used to stand in for “a long and healthy life” is life expectancy at birth, the number of years that a baby born today can expect to live if current mortality patterns continue throughout his or her life.
This basic indicator of survival ranges from just under 84 years in California District 19 (San Jose and parts of Santa Clara County) to just under 73 years in Kentucky District 5 (rural southeastern Kentucky)—a gap of more than a decade. Put another way, residents of the San Jose area can expect to live longer than residents of the longest-lived country, Japan (83.1 years), and residents of southeastern Kentucky can expect to live about as long as residents of the West Bank and Gaza (73.0 years).16 Because life expectancy at birth is not regularly calculated and made public in the United States at anything more specific than the level of states—except by Measure of America, the Institute for Health Metrics and Evaluation, and a few other organizations— these differences do not get the attention they deserve.
Regional differences are hard to ignore when it comes to health (see MAP 2). Of the twenty-nine districts where life expectancy at birth is less than 76 years (lighter colors on the map), twenty-five are in the South. The remaining four are Michigan District 13 (which includes Detroit), Pennsylvania Districts 1 and 2, both of which include parts of Philadelphia, and Missouri District 8 (which includes rural southern Missouri). Of the twenty-seven districts where the average life expectancy is greater than 82 years, all but three are in the Los Angeles, New York, Oxnard–Thousand Oaks, San Francisco, San Jose, or Washington, DC, metro areas.
A Long and Healthy Life
A gap of 11 years separates the nation’s top and bottom congressional districts.
CAlIFORNIA dISTRICT 19:
83.9 years
KENTUCKY dISTRICT 5:
72.9 years
GEOGRAPHIES OF OPPORTUNITY | Ranking Well-Being by Congressional District 21
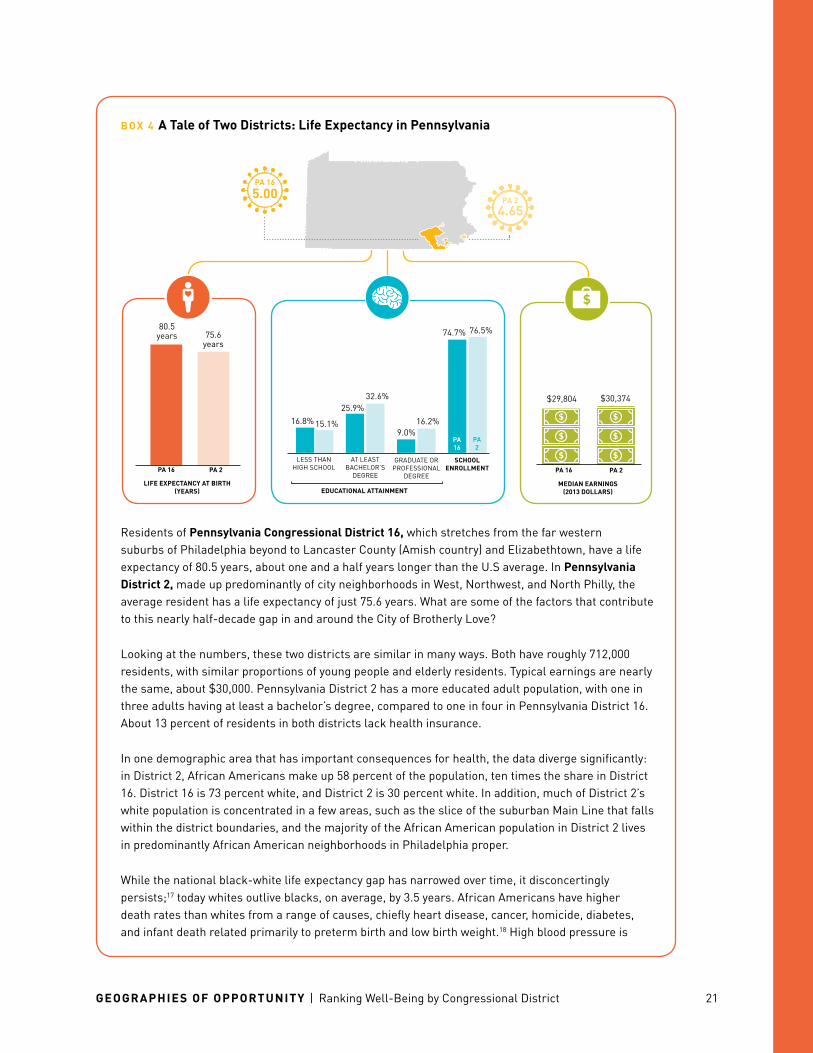
Residents of Pennsylvania Congressional district 16, which stretches from the far western suburbs of Philadelphia beyond to Lancaster County (Amish country) and Elizabethtown, have a life expectancy of 80.5 years, about one and a half years longer than the U.S average. In Pennsylvania district 2, made up predominantly of city neighborhoods in West, Northwest, and North Philly, the average resident has a life expectancy of just 75.6 years. What are some of the factors that contribute to this nearly half-decade gap in and around the City of Brotherly Love?
Looking at the numbers, these two districts are similar in many ways. Both have roughly 712,000 residents, with similar proportions of young people and elderly residents. Typical earnings are nearly the same, about $30,000. Pennsylvania District 2 has a more educated adult population, with one in three adults having at least a bachelor’s degree, compared to one in four in Pennsylvania District 16. About 13 percent of residents in both districts lack health insurance.
In one demographic area that has important consequences for health, the data diverge significantly: in District 2, African Americans make up 58 percent of the population, ten times the share in District 16. District 16 is 73 percent white, and District 2 is 30 percent white. In addition, much of District 2’s white population is concentrated in a few areas, such as the slice of the suburban Main Line that falls within the district boundaries, and the majority of the African American population in District 2 lives in predominantly African American neighborhoods in Philadelphia proper.
While the national black-white life expectancy gap has narrowed over time, it disconcertingly persists;17 today whites outlive blacks, on average, by 3.5 years. African Americans have higher death rates than whites from a range of causes, chiefly heart disease, cancer, homicide, diabetes, and infant death related primarily to preterm birth and low birth weight.18 High blood pressure is
BOx 4 A Tale of Two districts: life Expectancy in Pennsylvania
MEdIAN EARNINGS (2013 dOllARS)
$29,804
lIFE ExPECTANCY AT BIRTH (YEARS)
PA 2PA 16
75.6years
80.5years
PA 2PA 16LESS THAN
HIGH SCHOOLAT LEAST
BACHELOR’S DEGREE
GRADUATE OR PROFESSIONAL
DEGREE
15.1%16.8%
32.6%25.9%
16.2%9.0%
76.5%74.7%
SCHOOl ENROllMENT
PA2
PA16
EdUCATIONAl ATTAINMENT
PA 16
5.00 PA 24.65
$30,374
GEOGRAPHIES OF OPPORTUNITY | Ranking Well-Being by Congressional District 22
a particular challenge for African Americans.19 Blood pressure is heavily affected by social class, poverty, and the degree to which one has autonomy to shape one’s life course. African Americans are disproportionately poor, which contributes to chronic stress that damages blood vessels and makes health-harming behaviors like smoking more likely. Moreover, African Americans of all income levels are more likely than other Americans to experience discrimination in ways large and small, likewise a cause of health-harming stress.
African American men face an additional set of hurdles. In the United States, African American women outlive their male counterparts by over half a decade, the largest gender gap of any racial or ethnic group in life expectancy.20 Tragically high premature death rates among young men due to homicide contribute to this disparity. Homicide trends in Philadelphia confirm the heartbreakingly high incidence of murder among African American males: In 2013, the police department reported 51 murders of whites (21 percent of all murders) and 191 murders of African Americans (77 percent of all murders). Over 90 percent of murder victims were male, and well over half were ages 18 to 34.21 Pennsylvania District 2 does not encompass the entire city of Philadelphia, of course, but it includes many hard-hit neighborhoods. These tragic deaths are the antithesis of human development and an urgent priority for city leaders.
WHITE
73.4%
WHITE
29.8%
AFRICAN AMERICAN
5.8%
AFRICAN AMERICAN
57.6%
LATINO
17.3%
LATINO
5.8%
ASIAN AMERICAN
1.8%OTHER
1.7%
OTHER
2.2%ASIAN
AMERICAN
4.6%
POPUlATION BY AGE
HOMICIdES IN PHIlAdElPHIA (2013)
FOREIGN-BORN
8.1%7.4%PA 2PA 16
0–17
20.1%
18–64
66.6%
65+
13.3%
51 victims
191 victims
WHITE AFRICAN AMERICAN
PA 2
PA 16POPUlATION BY RACIAl/ETHNIC
GROUP
PA 2
PA 16 24.9% 14.8%60.3%
lACK HEAlTH INSURANCE
PA 2
12.5%PA 16
12.9%
GEOGRAPHIES OF OPPORTUNITY | Ranking Well-Being by Congressional District 23
Many of us think we know what causes poor health. Lack of health insurance is generally high on the list. Low levels of wealth and income are also assumed to contribute to poor health. Many people would include bad diet and lack of regular exercise, too. Less discussed are the roles of race, ethnicity, and immigration status in understanding health disparities. How do these factors relate to congressional districts?
Health insurance. As would be expected, there is a positive correlation between health insurance and life expectancy: holding constant differences in demographics and education levels in congressional districts, a one-percentage-point decrease in the proportion of uninsured residents is associated with a gain of an additional month of life expectancy at birth.22 But while having health insurance certainly matters, it seems to matter less for predicting longevity than several other important factors that will be discussed further below, including social determinants of health such as educational attainment and the demographic characteristics of communities.
MAP 2 life Expectancy by Congressional district
AK
CA
WA
CO
AL
NC
OHINIL
VTNH
MA
CTNJ
MD
DCDE
HI
RI
SC
TNAR
MO
OK
SD
FL
GAMS
LATX
KS
NE
NM
AZ
VA
NVUT
WY
IDOR
MT NDMN
WI
KY
WV
PA
NY
ME
IA
MI
lIFE ExPECTANCY
81.1–83.9 years79.7–81.0 years78.7–79.6 years77.5–78.6 years72.9–77.4 years
GEOGRAPHIES OF OPPORTUNITY | Ranking Well-Being by Congressional District 24
Income. Many Americans assume that earnings and health move in tandem, with more money buying better health. An examination of the relationship between life expectancy and median personal earnings by congressional district shows only a moderate correlation (.50) between these two factors. Income certainly matters for health, but the link between them is not automatic. Across the nation, for example, Latinos outlive whites by an average of nearly four years,23 yet their median earnings are considerably less—about $21,000 for Latinos, compared to roughly $32,000 for whites.24 Florida District 27, which is 75 percent Latino, exemplifies this phenomenon: this coastal district has an impressive 81.8-year life expectancy, nearly three years longer than the U.S. average, yet earnings are only $25,592, about $5,000 less than those of the typical U.S. worker.
The phenomenon of Latinos living longer than whites despite having lower educational levels and incomes as well as being far less likely to have health insurance (29.9 percent of nonelderly Latinos in the United States lack health insurance, compared to 12.3 percent of nonelderly whites25) is referred to as the Latino Health Paradox.
Further research on the Latino Health Paradox is needed, but evidence points to a few possible contributors to Latino longevity. Latinos binge drink at slightly lower rates than whites and smoke less; 26 smoking and drinking to excess both contribute to premature death from heart disease, stroke, and cancer. In addition, a growing body of research suggests that aspects of Latino culture, such as strong social support and family cohesion, help bolster health outcomes for a population that otherwise faces considerable challenges. Latino women have low rates of preterm birth and low-birth-weight babies, for instance, and researchers have tied these positive outcomes to the knowledge and support that Latino families and the larger community provide women when they are pregnant.27
In his landmark study Heat Wave, Eric Klinenberg explores why during the period of extreme heat in July 1995 in Chicago that killed 739 mostly elderly people, only 2 percent of the heat-related deaths were among Latinos, although they then accounted for at least 23 percent of Chicago’s population. Klinenberg also offers social support as a possible explanation. He argues that although the city’s Latinos were disproportionately very poor, their “cultural practice of caring,” and the way this practice was embedded in the “ecology and economy—including the clustered households of multigenerational networks, the busy sidewalks, and the relative security of the neighborhoods”—of chiefly Mexican immigrant communities prompted people to look in on and assist their elderly neighbors and family members.28
BOx 5 The latino Health Paradox
GEOGRAPHIES OF OPPORTUNITY | Ranking Well-Being by Congressional District 25
TABlE 4 Top and Bottom Ten Congressional districts by life Expectancy
RANK CONGRESSIONAl dISTRICT
lIFE ExPECTANCY AT BIRTH (YEARS)
AFRICAN AMERICAN
(%)
ASIAN AMERICAN
(%)lATINO
(%)
NATIvE AMERICAN
(%)WHITE
(%)
NATIvE-BORN
(%)
FOREIGN-BORN
(%)
United States 79.1 12.3 5.0 17.1 0.7 62.4 86.9 13.1
TO
P T
EN
1 California District 19 83.9 3.3 26.7 41.7 0.1 25.3 62.8 37.2
2 California District 18 83.7 1.5 20.0 17.0 0.1 56.7 72.4 27.6
3 Virginia District 11 83.6 12.6 17.9 18.5 0.1 47.4 69.1 30.9
4 California District 14 83.6 3.1 31.8 24.1 0.2 35.7 63.3 36.7
5 Virginia District 8 83.5 14.3 11.1 18.8 0.1 52.6 72.2 27.8
6 California District 17 83.4 2.6 51.5 15.6 0.2 26.3 53.9 46.1
Sources: Measure of America calculations using data from the Centers for Disease Control and Prevention 2011 and U.S. Census Bureau Population Estimates 2011 and American Community Survey 2013.
Note: Percentages of the population by race and ethnicity do not sum to 100 because the category “some other race or races” has been omitted for brevity.
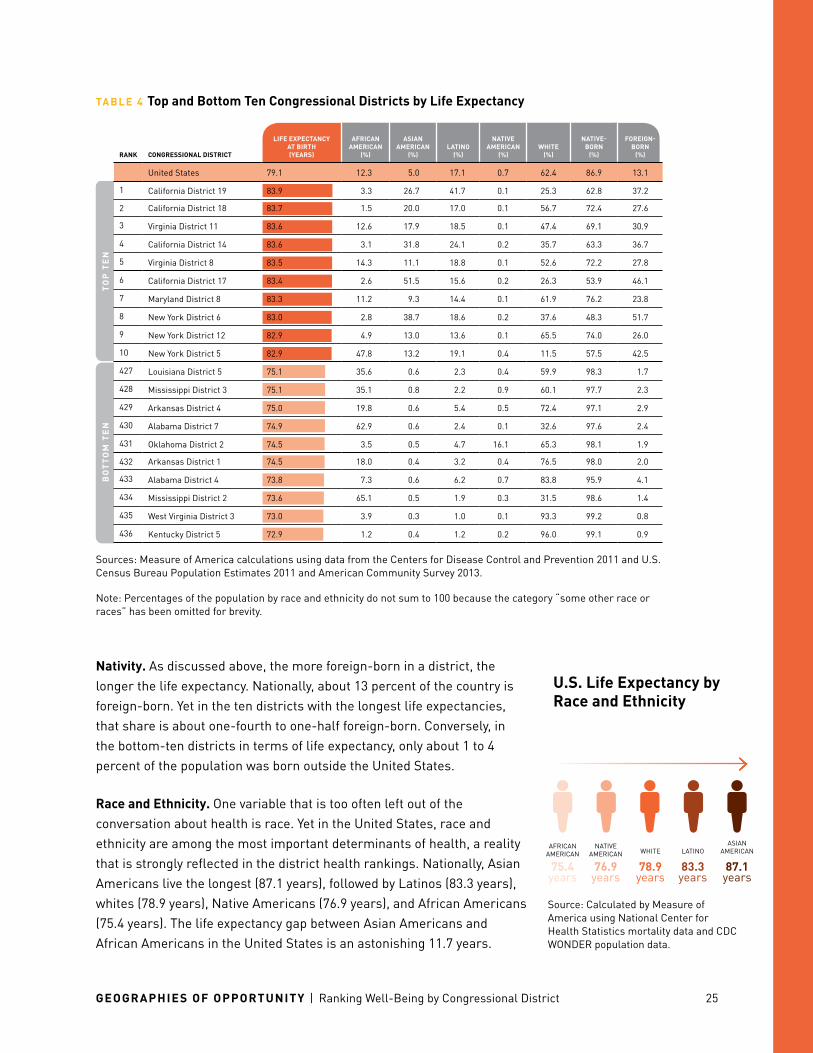
Nativity. As discussed above, the more foreign-born in a district, the longer the life expectancy. Nationally, about 13 percent of the country is foreign-born. Yet in the ten districts with the longest life expectancies, that share is about one-fourth to one-half foreign-born. Conversely, in the bottom-ten districts in terms of life expectancy, only about 1 to 4 percent of the population was born outside the United States.
Race and Ethnicity. One variable that is too often left out of the conversation about health is race. Yet in the United States, race and ethnicity are among the most important determinants of health, a reality that is strongly reflected in the district health rankings. Nationally, Asian Americans live the longest (87.1 years), followed by Latinos (83.3 years), whites (78.9 years), Native Americans (76.9 years), and African Americans (75.4 years). The life expectancy gap between Asian Americans and African Americans in the United States is an astonishing 11.7 years.
U.S. life Expectancy by Race and Ethnicity
WHITE
78.9 years
NATIVE AMERICAN
76.9 years
AFRICAN AMERICAN
75.4 years
LATINO
83.3 years
ASIAN AMERICAN
87.1years
Source: Calculated by Measure of America using National Center for Health Statistics mortality data and CDC WONDER population data.
GEOGRAPHIES OF OPPORTUNITY | Ranking Well-Being by Congressional District 26
BOx 6 The Social determinants of Health
Health disparities are rooted much more in the circumstances in which different groups of Americans are born, grow up, work, and age than they are in other areas that receive much more attention, especially medical treatment. Though doctors and medicines are essential once we are sick, medicine’s capacity to prevent chronic diseases, the leading causes of death in the United States, pales in comparison to the power of our environments and the cumulative effect of the thousands of small decisions we make each day.
Some people live in low-crime areas with parks and farmers’ markets and work in jobs that offer respectful work cultures, good wages, regular hours, and comprehensive health insurance; their environments protect their health and make good health decisions easy. But others, particularly Americans of color and Americans with limited education, tend to live and work in environments that expose them disproportionately to very real health risks, such as workplace injury, toxins in the air and water, gun violence, and the unrelenting, health-sapping stress of economic insecurity.
The daily conditions in such environments not only directly harm health but also often make good health choices difficult. Toxic stress and lack of control over the conditions of one’s daily life at home and work can fuel health risk behaviors like the “fatal four”—smoking, poor diet, physical inactivity, and drinking to excess—which are the most significant contributors to premature death in the United States today.29
THE FATAl FOUR
How do these racial and ethnic life expectancy differences nationwide relate to district longevity patterns? All of the ten longest-lived districts have a disproportionately large share of Asian Americans, from roughly two to ten times as many as the share in the general U.S. population (about 5 percent). Further, in six of the top ten districts with the longest life expectancy, the share of Latinos in the population is larger than the U.S. Latino share. Among the lowest-scoring districts in health, African Americans, Native Americans, and whites are overrepresented (see TABlE 4). In the one top-ten district with a large share of African Americans, New York District 5, a substantial portion of the African American population is immigrants from the Caribbean.
GEOGRAPHIES OF OPPORTUNITY | Ranking Well-Being by Congressional District 27
While this brief paper does not delve into this topic, previous Measure of America reports have undertaken research on the causes of racial and ethnic health disparities nationally and in select states and counties.30 Through this research, several patterns become clear.
The effect on health of both place and race tend to overlap because of residential segregation. Residential segregation by race and ethnicity as well as by income often leads to concentrations of poverty and marginalization as well as islands of affluence and privilege. This bifurcation affects local revenue streams, which in turn has an impact on the quality of public services such as schools, amenities like parks, and transportation options. Segregation also mediates access to the social networks and connections so vital to job opportunities and for neighborhood safety and trust. Each of these sets of community conditions affects health (see BOx 6).
The dearth of health data broken down by race and ethnicity impedes greater understanding. Measure of America is one of the only organizations calculating the basic survival indicator of life expectancy for major racial and ethnic groups in states, congressional districts, and metro areas, yet this information is clearly vital to crafting effective health policy. Another perennial data challenge stems from the fact that the major racial and ethnic categories for which most health-related data are currently available are extremely broad. For example, the Census Bureau–defined racial category “Asian” encompasses a huge range of both native- and foreign-born inhabitants; the category includes, among others, third- and fourth-generation Americans who trace their heritage to China, Japan, or Korea; immigrants from Vietnam, Laos, and Cambodia who came to the United States as refugees from the mid-1970s to the mid-1980s; South Asians who arrived in the country more recently; and all their U.S.-born children and grandchildren.
While a decade-long gap in life expectancy at birth from one place or group to the next is not a health accomplishment to trumpet, the good news is that the chief causes of premature death are largely preventable. But progress can only be made by going beyond today’s near-exclusive focus on health coverage and doctors to encompass the economic, social, and political forces that shape people’s environments and decisions.
doing so requires more and better data, especially for racial and ethnic subgroups; understanding the factors that contribute to longevity among some groups is key to shaping effective policies for everyone.
Residential segregation by race and ethnicity mediates access to the connections so vital to job opportunities and for neighborhood safety and trust.
GEOGRAPHIES OF OPPORTUNITY | Ranking Well-Being by Congressional District 28
The Education Index measures people’s access to knowledge and is made up of two parts: the share of children and young adults ages 3 to 24 currently enrolled in school and the highest degree attained of all adults age 25 and older. Taken together, these two components provide a snapshot of education in a congressional district.
This snapshot reveals tremendous variation. For example, in Minnesota District 3 and Colorado District 2, fewer than 5 percent of adults lack high school diplomas; in California District 40, nearly half of the district’s adults are without this basic credential.
Topping the charts in education are two districts in California: District 33 (Los Angeles’ Westside) and District 18 (Silicon Valley). Rounding out the top ten are Massachusetts District 5, New York District 3, New York District 10, New Jersey District 11, New York District 12, Maryland District 8, Virginia District 8, and California District 17 (see TABlE 5). All are in the Boston, Los Angeles, New York, San Francisco, or Washington, DC, metro areas (see MAP 3).
Five California districts (51, 16, 44, 21, and in last place, 40) are in the bottom ten in terms of educational outcomes. New York District 15, Nevada District 1, Arizona District 7, and Texas Districts 29 and 33 complete the list.
In four districts, three in ten adults have graduate or professional degrees (California District 18; Washington, DC, district-at-large; New York District 12; and Virginia District 8). In twenty-four districts, between half and two-thirds of all adults have at least a bachelor’s degree; these districts fall within the Atlanta, Boston, Chicago, Dallas, Denver, Los Angeles, New York, San Francisco, Seattle, and Washington, DC, metro areas.
Some of the districts at the top of the education list have earned the spot by supporting their children and youth (at least a large segment of them) in completing high school and continuing to higher education, whereas others excel on the Education Index because they attract well-educated adults from elsewhere.
Access to Knowledge
Topping the charts in education are two districts in California: District 33 (Los Angeles’ Westside) and District 18 (Silicon Valley).
GEOGRAPHIES OF OPPORTUNITY | Ranking Well-Being by Congressional District 29
Those in the Boston and Minneapolis areas fall more in the first camp. They do a good job of educating the young people who grow up there and guiding their productive transition to adulthood; those two metro areas have the lowest rates of young people ages 16 to 24 neither working nor in school among the twenty-five most populous metro areas.31 Of course, legions of college students also flock to Boston from elsewhere for higher education. Washington, DC, falls in the second camp; it gains its educational advantages chiefly by acting as a magnet, attracting large numbers of highly educated knowledge workers to well-paying jobs in government, research organizations, consulting, and other highly skilled jobs that demand educational credentials and connections.
Enrollment includes everyone ages 3 to 24 who is enrolled in school; it covers both the compulsory years of schooling and the preschool and postsecondary school years on either end when schooling is voluntary. States vary in the ages of required school attendance. Most states require children to start school by age 5 or 6, but Pennsylvania and Washington don’t require it until age 8; compulsory schooling ends by age 16, 17, or 18, depending upon the state.32 School enrollment rates range from 88.3 percent in California District 33 to 68.5 percent in North Carolina District 3, a difference of nearly 20 percentage points (see TABlE 6).
TX
MT
AZ
ID
NV
NM
OR
WY
UT
KS
IANE
MN
ND
FL
WI
GA
LA
NY
PA
MI
VAKY
MS
ME
WV
AK
CA
WA
CO
AL
NC
OHINIL
VTNH
MA
CTNJ
MD
DCDE
HI
RI
SC
TNAR
MO
OK
SD
UT
MAP 3 Education Index by Congressional district
EdUCATION INdEx
5.93–8.645.20–5.924.75-5.194.19–4.741.97–4.18
GEOGRAPHIES OF OPPORTUNITY | Ranking Well-Being by Congressional District 30
Although areas with low enrollment tend to have a low overall HD Index score, some anomalies exist. For instance, Virginia District 2 (the Virginia Beach area) and Washington District 10 (directly south of Seattle) are near the national average in terms of human development overall but at the bottom in school enrollment. Part of the reason for low enrollment in these two cases is the strong military presence in both areas; young adults in the armed forces are typically not enrolled in school. Even states that generally perform well in education have some areas that lag behind on this fundamental indicator (see BOx 7).
An important part of the Education Index is the rate of 3- and 4-year-olds in a center-based preschool. When it comes to our youngest children, California District 33, the leader in enrollment overall, is also way out in front, with more than eight in every ten 3- and 4-year-olds in preschool. Washington, DC, proper is close on its heels with a 78.5 percent preschool enrollment rate, the result of the district’s universal preschool program that began in 2008.
TABlE 5 Top and Bottom Congressional districts on the Education Index
RANK CONGRESSIONAl dISTRICTEdUCATION INdEx
lESS THAN HIGH SCHOOl
(%)
AT lEAST HIGH SCHOOl
dIPlOMA (%)
AT lEAST BACHElOR’S
dEGREE (%)
GRAdUATE OR PROFESSIONAl
dEGREE (%)
SCHOOl ENROllMENT
(%)
United States 5.06 13.4 86.6 29.6 11.2 77.0
TO
P T
EN
1 California District 33 8.64 4.5 95.5 61.6 26.6 88.3
2 California District 18 8.36 6.8 93.2 60.0 30.1 85.6
3 Massachusetts District 5 7.74 7.4 92.6 54.5 27.0 83.3
4 New York District 3 7.73 7.4 92.6 52.2 24.5 85.5
5 New York District 10 7.67 11.5 88.5 60.6 29.2 80.6
6 New Jersey District 11 7.65 5.9 94.1 51.6 20.8 86.0
7 New York District 12 7.61 7.3 92.7 69.2 30.4 73.5
8 Maryland District 8 7.57 8.9 91.1 52.2 28.6 82.6
9 Virginia District 8 7.55 9.0 91.0 61.4 31.1 77.0
10 California District 17 7.55 8.9 91.1 54.3 25.3 82.9
BO
TT
OM
TE
N
427 New York District 15 2.96 34.1 65.9 13.1 3.7 75.8
428 California District 51 2.93 31.9 68.1 13.4 3.6 74.4
429 California District 16 2.90 33.6 66.4 12.4 4.3 75.0
430 Nevada District 1 2.79 24.6 75.4 14.5 4.3 68.6
431 California District 44 2.72 38.3 61.7 11.9 3.4 76.0
432 Arizona District 7 2.39 33.4 66.6 13.2 4.2 69.2
433 California District 21 2.16 41.0 59.0 8.3 2.4 73.5
434 Texas District 29 2.14 41.1 58.9 9.0 2.3 73.1
435 Texas District 33 1.99 41.9 58.1 9.5 3.1 71.3
436 California District 40 1.97 48.3 51.7 8.4 2.3 74.9
Source: Measure of America calculations using data from the U.S. Census Bureau American Community Survey 2013.
GEOGRAPHIES OF OPPORTUNITY | Ranking Well-Being by Congressional District 31
The Middle Atlantic region performs particularly well on this indicator; of the twenty-five best districts in terms of preschool enrollment (with rates of 64 percent and up), seven are in New York, five are in New Jersey, five are in California, two each are in Connecticut and Illinois, and one each is in Massachusetts, Pennsylvania, Georgia, and Washington, DC. In contrast, in the bottom twenty-five districts for this indicator, one-third of preschoolers or less are enrolled in school. The five worst performers are Idaho District 1, Washington District 4, Nevada District 1, Washington District 10, and, in last place with just one in five 3- and 4-year-olds enrolled in preschool, Arizona District 7 (see SIdEBAR).
Another critically important area that enrollment data highlight is youth disconnection. In Arizona District 7, about one in four young people between the ages of 16 and 24 are disconnected—neither working nor in school—and in thirty-one other districts, at least one in every five teens and young adults in this age range are disconnected.
In contrast, in Wisconsin District 2, Nebraska District 2, Massachusetts District 7, Colorado District 2, and California Districts 52 and 24, fewer than one in sixteen young people are disconnected. Youth disconnection has grave, costly consequences for the young people who experience it, as well as for society as a whole. Emerging adulthood, the years that stretch from the late teens to the mid-twenties, is a critical period for forming one’s adult identity, gaining skills and credentials, building social networks, and moving toward independence and self-sufficiency. Rather than laying the foundation for a productive life, these disconnected youth
districts Where Fewer Than One-Third of 3- and 4-Year-Olds Are in Preschool
TABlE 6 Top and Bottom Five districts by School Enrollment
RANK CONGRESSIONAl dISTRICTSCHOOl ENROllMENT (%)
Hd INdEx
United States 77.0 5.06
TO
P F
IvE
1 California District 33 88.3 7.82
2 New Jersey District 11 86.0 7.39
3 California District 18 85.6 8.18
4 New York District 3 85.5 7.50
5 Massachusetts District 4 85.3 6.86
BO
TT
OM
FIv
E
432 Virginia District 2 70.2 4.94
433 Washington District 10 70.0 5.01
434 Arizona District 7 69.2 3.57
435 Nevada District 1 68.6 3.66
436 North Carolina District 3 68.5 4.03
Source: Measure of America calculations using data from the Centers for Disease Control and Prevention 2011, U.S. Census Bureau Population Estimates 2011 and U.S. Census Bureau American Community Survey 2013.
U.S. AvERAGE
TENNESSEE 4
CALIFORNIA 21
CALIFORNIA 36
CALIFORNIA 8
WEST VIRGINIA 3
ARIZONA 3
NEVADA 4
INDIANA 3
TEXAS 29
TEXAS 23
CALIFORNIA 41
TEXAS 4
ALABAMA 4
INDIANA 7
ARIZONA 4
KENTUCKY 5
WEST VIRGINIA 2
TEXAS 33
IDAHO 1
WASHINGTON 4
NEVADA 1
WASHINGTON 10
ARIZONA 7
Source: U.S. Census Bureau American Community Survey 2013.
46.1%
33.2%
33.1%
32.9%
32.6%
32.1%
31.8%
31.4%
30.7%
30.7%
30.0%
29.9%
29.8%
29.7%
29.3%
29.2%
29.1%
28.7%
28.6%
27.2%
26.2%
25.9%
23.8%
20.7%
GEOGRAPHIES OF OPPORTUNITY | Ranking Well-Being by Congressional District 32
find themselves adrift at society’s margins, unmoored from the systems and structures that confer knowledge, skills, identity, and purpose—a situation that benefits no one.33
three areas require particular focus if education is to boost human development in areas that lag behind.
1. the days when someone without a high school degree could find regular, decently paying work are long gone, and, sadly, those when a high school degree alone was a sufficient qualification for a job that pays middle-class wages are similarly behind us. States that perform poorly on this indicator—among them, California, Kentucky, louisiana, Mississippi, and texas—should give greater priority to ensuring that all adults have at least the basic high school credential, and states that perform well overall should prioritize those congressional districts that lag behind.
2. School enrollment must move to the top of the list of priorities in states where rates are low, such as Alaska, Hawaii, Montana, nevada, and north dakota. Preschool enrollment is a particularly crucial part of the puzzle; the evidence is overwhelming that high-quality early childhood education is the best educational investment the country can make.34 Far too few young children in districts in Arizona, California, Idaho, Indiana, Kentucky, nevada, texas, Washington, and West Virginia enjoy the lifelong boost that a high-quality, developmentally appropriate preschool provides.
3. the plight of disconnected young people requires concerted attention. Fortunately, momentum is growing across the nation to tackle the issue of youth disconnection. Policymakers, business leaders, researchers, philanthropists, advocates for social justice, community leaders, and young people themselves have come together around the idea that the human and financial cost of leaving behind large numbers of young people is unacceptably high. An effort is ongoing in Arizona to address the high rate of youth disconnection (see BOX 1).
For more on disconnected youth in the United States, check out the MOA report, halve the Gap.
GEOGRAPHIES OF OPPORTUNITY | Ranking Well-Being by Congressional District 33
BOx 7 A Tale of Two districts: Garden State Neighbors differ Sharply in Educational Outcomes
MEdIAN EARNINGS (2013 dOllARS)
NJ 8NJ 11LESS THAN HIGH SCHOOL
AT LEAST BACHELOR’S
DEGREE
GRADUATE OR PROFESSIONAL
DEGREE
22.7%
5.9%
28.7%
51.6%
11.4%
20.8%
75.6%
86.0%
SCHOOl ENROllMENT
NJ11
NJ 8
EdUCATIONAl ATTAINMENT
NJ 11
7.39
NJ 85.06
lIFE ExPECTANCY AT BIRTH (YEARS)
NJ 8NJ 11
80.2years
80.9years
New Jersey performs very well on the Education Index, ranking fourth among U.S. states, and even better on the school enrollment indicator; in only Connecticut and Massachusetts are a higher share of children and young adults ages 3 to 24 enrolled in school. Yet even New Jersey has areas that struggle.
Northern New Jersey Congressional Districts 8 and 11 are adjacent, meeting for a short stretch at the border of Nutley and Belleville. district 11 includes parts of cities like Paterson, but primarily comprises the affluent exurban and suburban areas of Morris, Essex, Sussex, and Passaic Counties, locations that have easy commutes to New York City and are home to numerous Fortune 500 companies, particularly pharmaceutical firms. The district boasts high earnings, high levels of educational attainment, and the second-highest rate of school enrollment, 86 percent, among the 436 congressional districts.
district 8 includes Kearney; parts of Jersey City, Bayonne, and Newark; and Elizabeth. Although District 8 performs worse than its neighbor, it is nonetheless close to the national average when it comes to the overall Human Development Index score, life expectancy, earnings, and college attainment. However, it is badly behind District 11 on two key educational indicators; the share of adults lacking high school diplomas in District 8—22.7 percent—is nearly four times as large as in District 11; and school enrollment is 75.6 percent, compared to 86 percent in District 11.
District 8 encompasses a range of areas, from neighborhoods that are predominantly home to low-income Latino immigrants and their families, to others, like Hoboken and parts of rapidly gentrifying Jersey City, that are increasingly locales for well-educated young professionals in search of an urban vibe and a quick commute. The numbers reflect what research generally shows—namely, that Latino
$51,436
$31,019
GEOGRAPHIES OF OPPORTUNITY | Ranking Well-Being by Congressional District 34
immigrants tend to arrive in the United States with low levels of educational attainment and Latino young people are more likely to leave school before graduating and to experience periods of youth disconnection (being out of school and work) than young white people. Nine of the ten congressional districts at the bottom of the educational rankings have a population that is over half Latino.
Two pieces of information give cause for optimism about the future. First, MOA research in California shows that second-generation Latino adults are as likely as the average Californian to have graduated high school, meaning that educational outcomes improve in second and third generations (as is true for all immigrant groups in the United States).
Second, policy matters. Despite District 11’s challenges relative to District 8’s, which include a child poverty rate four times as high, the two districts have nearly identical rates of preschool enrollment, about 70 percent. New Jersey provides two years of pre-K, requires pre-K teachers to be certified in early childhood education, and offers free pre-K in the state’s poorest school districts. Studies show that this effort is succeeding on both quality and accessibility grounds.35 The state is investing in arguably the most cost-effective educational intervention available by giving its youngest residents a strong start.36
LATINO
55.1%
WHITE
75.1%
CHIld POvERTY
OTHER
14.4%LATINO
10.5%
WHITE
25.5%OTHER
19.4%
dISCONNECTEd YOUTH(AGES 16–24)
FOREIGN-BORN
44.7%17.8%NJ 8NJ 11
POPUlATION BY RACIAl/ETHNIC
GROUPNJ 8
NJ 11
NJ 8
70.3%NJ 11
69.8%
PRESCHOOl ENROllMENT (AGES 3 ANd 4)
4.6%
29.2%
NJ 11 NJ 8NJ 11 NJ 8
7.4%
16.1%
GEOGRAPHIES OF OPPORTUNITY | Ranking Well-Being by Congressional District 35
Last but certainly not least is the third dimension of the HD Index: standard of living. How are districts doing in terms of residents’ ability to afford safe, adequate housing; cover essential living costs like child care and transportation; and save for a rainy day, a child’s education, or a secure, dignified retirement?
The metric in the American HD Index for a decent standard of living is median personal earnings—the wages and salaries of all full- and part-time workers age 16 and older. Much of the research on living standards focuses on household earnings—the combined earnings of all adults in a household. While this indicator is important, using it makes it impossible to compare and analyze the relative earnings of women and men; for this reason, the HD Index uses personal earnings. Another important aspect of standard of living is wealth. Gaps in wealth, also called net worth or assets, are far greater than gaps in earnings. However, wealth data are officially collected only once every three years and are not available for congressional districts; thus this indicator cannot be incorporated into the American HD Index.
Earnings by congressional district range from about $20,000 in the highly diverse Los Angeles neighborhoods of California’s District 34 to more than triple that sum in New York’s City’s District 12—Manhattan’s
does Cost of living Figure In? The earnings figures used in the Human Development Index are not adjusted for cost-of-living differences. Cost of living varies by region, and even more so by town or neighborhood within a metro area.
These variations, however, are not random; rather, they are tied to the presence of desirable characteristics like a thriving local economy, community assets and amenities, or even great weather. Neighborhoods with higher housing costs—the major portion of cost of living—tend to be places with sought-after features like top-quality public schools, safe streets, easy commutes, or proximity to enviable amenities like beaches, museums, and restaurants.
People don’t live in expensive parts of the country because they are unaware that other places are cheaper; they do so primarily because these places have something valuable and worth paying for. Thus, to adjust for cost of living would be to wrongly assume that all places are equally desirable and to explain away some of the factors that the HD Index measures.
A Decent Standard of Living
1 district
10 districts
34 districts
169 districts
222 districts
$70,000
$60,000
$50,000
$40,000
$30,000
$20,000
ME
DIA
N E
AR
NIN
GS
NUMBER OF DISTRICTS
FIGURE 4 The distribution of Earnings by Congressional district Are Heavily Skewed toward the low End
Source: Measure of America calculations using data from the U.S. Census Bureau American Community Survey 2013.
GEOGRAPHIES OF OPPORTUNITY | Ranking Well-Being by Congressional District 36
East Side and parts of Queens and Brooklyn (see MAP 4). The distribution of earnings between these two extremes is heavily skewed toward the lower end. The typical worker earns above $40,000 in only forty-five of the 436 congressional districts. Workers in the remaining 391 districts have median earnings in the $20,000 to $40,000 range (see F IGURE 4).
Given that one-third of the HD Index is the earnings measure, the overall HD Index generally tracks closely with earnings. But some districts are doing far better in terms of well-being than their earnings would predict. For example, Utah’s 3rd District, the southeastern part of the state below Salt Lake City, has earnings under $25,000, placing it near the bottom of the district earnings table. Yet educational achievements in the district are impressive, with nearly 39 percent of adults having at least a bachelor’s degree, as compared with the U.S. average of just under 30 percent. Similarly, Colorado District 2, encompassing greater Boulder and the area’s tech start-up hubs and world-class ski destinations, ranks thirty-eighth of the 436 districts in human development despite earnings far below that ranking.
MAP 4 Median Personal Earnings by Congressional district
TX
MT
AZ
ID
NV
NM
OR
WY
UT
KS
IANE
MN
ND
FL
WI
GA
LA
NY
PA
MI
VAKY
MS
ME
WV
MEDIAN EARNINGS$35,394–$60,953
$30,773–$35,394
$27,794–$30,773
$25,652–$27,794
$20,054–$25,652
CA
WA
CO
AL
NC
OH
INIL
VTNH
MA
CTNJ
MD
DCDE
HI
RI
SC
TNAR
MO
OK
SD
AK
$35,394–$60,953
$30,773–$35,393
$27,794–$30,772
$25,652–$27,793
$20,054–$25,651
MEdIAN EARNINGS
GEOGRAPHIES OF OPPORTUNITY | Ranking Well-Being by Congressional District 37
Analysis of the distribution of median personal earnings across the nation reveals several interesting patterns. Pockets of both high and low earning are found in every regional division of the country. The typical worker in New England earns $35,059, about $4,600 above the national average. New England, which comprises Connecticut, Maine, Massachusetts, New Hampshire, Rhode Island, and Vermont, has the highest median earnings among the nine regional divisions. In the East South Central states of Alabama, Kentucky, Mississippi, and Tennessee, median earnings are $26,720, about $3,700 below the national average and the lowest of the nine divisions. This $8,000 difference between regions, however, is dwarfed by the highs and lows of congressional districts within them.
Every one of the nine divisions (see FIGURE 5) has districts with residents in the highest earnings band. Similarly, each of the nine divisions has districts with earnings in the lowest band—in the $20,000 to $25,600 range. The East South Central division has one district in the highest fifth: Alabama’s District 6. This predominantly suburban Birmingham-area district, with earnings of $35,871, is surrounded by Districts 2, 3, 4, and 7, all with earnings below $26,500. This is the most extreme example of a high-earnings district surrounded by low-earnings districts in the fifty states (see SIdEBAR).
dISTRICT 6: $35,871
The most extreme example of a high- earnings district surrounded by low- earnings districts in the fifty states can be found in Alabama.
DISTRICT 4: $25,104
DISTRICT 3: $26,406
DISTRICT 2: $26,240
DISTRICT 7: $22,092
FIGURE 5 Median Personal Earnings Gaps by Regional division
NEW ENGlANd
GAP: $17,494HIGH: Massachusetts 8: $42,829
LOW: Maine 2 $25,335
MIddlE ATlANTIC
GAP: $40,637 HIGH: New York 12: $60,953 LOW: New York 15: $20,316
WEST NORTH CENTRAl
GAP: $17,817 HIGH: Minnesota 3: $41,401
LOW: Missouri 8: $23,584
SOUTH ATlANTIC
GAP: $30,410HIGH: Virginia 8: $52,003
LOW: South Carolina 6: $21,593
EAST NORTH CENTRAl
GAP: $20,767 HIGH: Illinois 6: $42,754
LOW: Michigan 13: $21,987
MOUNTAIN
GAP: $15,402HIGH: Arizona 6: $37,151LOW: Arizona 7: $21,749 WEST SOUTH CENTRAl
GAP: $35,161 HIGH: California 18: $55,215LOW: California 34: $20,054
Note: This conclusion is derived from spatial autocorrelation analysis using Anselin Local Moran’s I statistics.
GEOGRAPHIES OF OPPORTUNITY | Ranking Well-Being by Congressional District 38
The greatest earnings inequality is in the Middle Atlantic region. The typical worker in New York District 12, comprising Manhattan’s East Side and part of Brooklyn and Queens, earns nearly $61,000. The typical worker in New York District 15, comprising the South and West Bronx, earns just over $20,000. These two districts are separated not just by a river but also by the ability of families to seize opportunities, live to their full potential, and invest in themselves and their children; they may as well be on different continents.
The smallest earnings inequality is found in the four East South Central states, Alabama, Kentucky, Mississippi and Tennessee. Here, the highest-earning district is Alabama District 6, mentioned above. But earnings in this district are not that high, reducing the overall earnings inequality. The lowest earnings in this region are also in Alabama, right next door. Alabama District 7 includes Birmingham, Tuscaloosa, and
430 South Carolina District 6 21,593 27.5 22.6 15.7
431 Texas District 34 21,231 28.2 23.1 12.6
432 California District 16 20,820 21.0 19.2 17.7
433 New York District 15 20,316 17.2 38.5 13.1
434 California District 40 20,130 15.3 21.2 26.9
435 California District 21 20,101 16.8 17.0 16.1
436 California District 34 20,054 24.9 26.6 15.4
Source: Measure of America calculations using data from the U.S. Census Bureau American Community Survey 2013.
Note: Percentages of the workforce employed by occupational group do not sum to 100 because three of the categories have been omitted for brevity.
TABlE 7 Top and Bottom Ten Congressional districts by Earnings
GEOGRAPHIES OF OPPORTUNITY | Ranking Well-Being by Congressional District 39
areas to the west and south. The typical worker in District 6 outearns one in District 7 by nearly $14,000.
California, Texas, Florida, and New York are the four most populous U.S. states. In a demonstration of the influence of population size on earnings inequality, three of these four are also at both ends of the congressional district earnings spectrum. Looking at states in three groups by population size, New York has the greatest income gaps among its districts for large states (those with nine or more congressional districts), Missouri has the greatest income gap among medium-sized states (four to eight districts), and Hawaii the greatest among small states (two to three districts). For an in-depth look at the highest- and lowest-earning Missouri districts, see BOx 8.
Among Missouri’s eight districts, earnings range from over $40,000 in district 2, which is well above the U.S. median of $30,454, to under $24,000 in district 8, roughly the poverty line for a family of four. The largely white (87.2 percent) residents of the suburban areas south and west of St. Louis that make up District 2 are a highly educated population. Nearly half of residents work in relatively higher-paying management, business, science, or arts-related occupations, with only a small portion of the workforce in predominantly manual-labor occupations related to production and transportation.
BOx 8 A Tale of Two districts: Earnings in Missouri
MEdIAN EARNINGS (2013 dOllARS)
MO 8MO 2LESS THAN HIGH SCHOOL
AT LEAST BACHELOR’S
DEGREE
GRADUATE OR PROFESSIONAL
DEGREE
18.6%
5.2%
15.0%
48.7%
5.8%
18.7%
74.9%83.3%
SCHOOl ENROllMENT
MO2
MO8
EdUCATIONAl ATTAINMENT
MO 26.46
MO 83.52
lIFE ExPECTANCY AT BIRTH (YEARS)
MO 8MO 2
75.4years
79.4years
$40,176
$23,584
GEOGRAPHIES OF OPPORTUNITY | Ranking Well-Being by Congressional District 40
MANAGEMENT, BUSINESS, SCIENCE & ARTS
26.5%
CONSTRUCTION, EXTRACTION, MAINTENANCE & REPAIR
10.1%
CONSTRUCTION, EXTRACTION, MAINTENANCE & REPAIR
5.0%
PRODUCTION, TRANSPORT & MATERIAL MOVING
19.1%
PRODUCTION, TRANSPORT & MATERIAL MOVING
7.6%
SERVICE
19.4%SERVICE
13.0%
WHITE
91.2%
WHITE
87.2%
AFRICAN AMERICAN
4.0%
AFRICAN AMERICAN
4.7%
LATINO
2.7%
LATINO
1.7%
ASIAN AMERICAN
4.2%OTHER
1.8%
ASIAN AMERICAN
0.4%
OTHER
1.9%
MO 8
PEOPlE WITH A dISABIlITY
MANAGEMENT, BUSINESS, SCIENCE & ARTS
48.8%
MO 2
POPUlATION BY RACIAl/ETHNIC
GROUP
POPUlATION BY OCCUPATION
MO 2
The mostly rural District 8 in the southeastern and south central parts of the state is also largely white (91.2 percent), and the proportions of children and older adults in both districts are virtually the same. But education levels in District 8 are well below those of District 2 and also below the national average.
About half as many workers hold management-type positions as in District 2, twice as many are in construction, extraction, maintenance, and repair, and two and a half times as many work in production-related labor. These very different labor markets are related to other important differences.
While about one in ten of District 2 residents have a disability, the rate in District 8 is almost double that; a strikingly high one in five residents face some sort of physical or cognitive disability. Health insurance rates also vary wildly. Only 6.3 percent of District 2 residents lack health insurance, whereas in District 8, 13.8 percent, or more than one in seven residents, do.
Earnings are highly dependent on the nature of the local or regional labor market. All jobs are not created equal. The federal government categorizes occupations into five broad categories. In the top ten congressional districts, where the typical worker earns more than $50,000 annually, about half or more of all workers have jobs in the highest-paying categories of occupations: management and business (see SIdEBAR). Service occupations, such as food preparers and servers
FARMING, FISHING & FORESTRY
1.8%
FARMING, FISHING & FORESTRY
0.1%
SALES AND OFFICE
23.2%SALES AND OFFICE
25.5%
lACK INSURANCE
MO 8
13.8%MO 2
6.3%MO 8
MO 2 MO 2
10.7%MO 8
20.1%
GEOGRAPHIES OF OPPORTUNITY | Ranking Well-Being by Congressional District 41
and home health care aides, are generally the lowest paid by far, and comparatively few workers in these top-earning districts fall into this category. All ten districts are in major metro areas on the East or West Coasts. In these high-earnings districts, production, transportation, and material moving occupations also account for comparatively little employment, between 2 percent and 8 percent, compared to 12 percent for the country as a whole.
In the lowest-earning districts, the situation is reversed. Fewer occupations that tend to be well remunerated are options, a major factor that has contributed to median personal earnings in the range of $20,000 to $22,000 among the bottom ten districts. This group includes urban as well as rural districts mainly in California and Texas but also in Arizona, New York, and South Carolina. But some overwhelming characteristics they share in common are a workforce with relatively low levels of educational attainment, disproportionate employment in service occupations (except in California District 21 where agriculture is an important occupational group), largely Latino communities (except for South Carolina District 6), and poverty rates roughly double the national average.
This analysis matters because one of the most important priorities for leaders in the public and private sectors alike is to create the conditions for employment that offers stability and long-term prospects. The best way to do so is to invest in education. While not everyone in Phoenix or Los Angeles needs a graduate degree, the days when just a high school diploma paved the way to a secure future are long gone. In fact, correlations between the various indicators in the American Human Development Index tell a compelling story: The association between earnings and both bachelor’s and graduate degrees are the strongest of any correlation of variables within the Index. In other words, no two variables of human development are more closely related than earnings and higher education.
What is fueling these large gaps in living standards? The discussion above has focused on two very important factors. The first is education: in today’s knowledge economy, higher education is the single biggest predictor of earnings. No other association between the various parts of the index is stronger than the association between earnings and both bachelor’s and graduate degrees. Expanding opportunities for education is key to helping people exit low-paying jobs for more secure, better-paying livelihoods.
$17,425
SERVICE
$27,412
SALES AND OFFICE
NATURAL RESOURCES, CONSTRUCTION & MAINTENANCE
$33,084
$52,478
MANAGEMENT, BUSINESS, SCIENCE & ARTS
$29,425
PRODUCTION, TRANSPORT & MATERIAL MOVING
U.S. Median Earnings by Occupational Category
Source: U.S. Census Bureau, American Community Survey 2013.
GEOGRAPHIES OF OPPORTUNITY | Ranking Well-Being by Congressional District 42
The second factor relates to wages and opportunities in the labor market. The decline in middle-wage jobs like construction and manufacturing, coupled with the growth in jobs at the top and bottom of the earnings scale, has created an hourglass-shaped labor market with what economists have called a “hollowed-out middle.” For those at the top, incomes have climbed—an Urban Institute analysis found a 70 percent increase in earnings and dividends from 1963 to 2013 for the top-earning families (those at the 90th percentile). during this same period, families at the bottom barely saw any income increase.37
So while helping more people bypass or exit low-paying sectors by getting more education is an obvious economic strategy in today’s knowledge economy, not everyone has an interest in higher education, or the wherewithal to enter higher-paying fields. Equally important is to ensure that all jobs, including those that do not require a college degree, pay wages that afford workers the dignity of self-sufficiency and the peace of mind of economic security. The low-wage service sector is the country’s fastest-growing job category. Improving the pay and quality of such jobs, as well as reducing the variability of work schedules, is central to improving well-being for millions of American families.
GEOGRAPHIES OF OPPORTUNITY | Ranking Well-Being by Congressional District 43
Agenda for Action
What will it take to improve the American Human Development Index scores for the country as a whole? And what can be done to boost the scores of the congressional districts lagging behind in areas fundamental for a secure and rewarding life in the twenty-first century?
People of goodwill can answer these questions in very different ways, depending largely on what they think caused the startling inequality between congressional districts in the first place. Some observers give greater weight to the choices and behaviors of individuals; others think that our political and economic systems create express lanes for some groups of Americans and dead-ends for others. Some privilege economic explanations like globalization and the decline in U.S. manufacturing, while others point to the revolutionary social changes of the last decades, such as the decline in marriage and the rise in single parenthood. These contrasting understandings of why such divergent outcomes have come to pass too often lead to shouting matches and stalemates. Yet in truth, our individual choices and the institutions around us, as well as how they interact, are important in determining how our lives unfold. In addition, regardless of their position on the political spectrum, most Americans would agree that the areas the American Human Development Index measures are fundamental to people’s quality of life, opportunities, and even happiness.
The criteria we used in developing the recommendations below was thus straightforward: Which areas hold the greatest promise for increasing American HD Index scores, both for the country as a whole and for the districts at the bottom of the scale? For health, what are the chief issues we must tackle for Americans to live longer lives? For education, what will it take for more American young people not just to enroll in school but also to complete, at a bare minimum, high school, and ideally a postsecondary degree as well? And how can we boost earnings—not for the 1 percent, who have captured the lion’s share of gains from the postrecession recovery—but for those in the middle, whose wages have gone nowhere for five decades, and those at the bottom, many of whom lost their already tenuous grip on economic security during the Great Recession.
Which areas hold the greatest promise for increasing American HD Index scores, both for the country as a whole and for the districts at the bottom of the scale?
GEOGRAPHIES OF OPPORTUNITY | Ranking Well-Being by Congressional District 44
The proxy for a long and healthy life in the American Human Development Index is life expectancy at birth. The surest route to addressing critical health threats and improving longevity is expanding our attention beyond a singular focus on health coverage and medical solutions to encompass a broad range of factors that shape people’s living environments and everyday decisions. One concrete action we can take is to tackle the “fatal four” health risks that are the biggest contributors to preventable death in the United States today—smoking, poor diet, physical inactivity, and excessive drinking.
For the country as a whole to make life expectancy progress, smoking must be our number-one target. Many readers may find this recommendation surprising given the tremendous progress the country as a whole has made over the last fifty years: the smoking rate today is less than half what it was in 1965. Yet an astonishing one in five Americans still smoke. Even among people in the 18- to 24-year-old age bracket, who grew up knowing smoking’s risks, the smoking rate is 19 percent.38 Smoking causes 25 percent of all deaths among women and men between the ages of 35 and 69 in the United States,39 and an alarming one in five deaths overall.40 No other preventable cause of premature death even comes close to the destructive power of cigarette smoking. And smoking is a particular concern in the congressional districts that fall to the bottom of the health scale. West Virginia, Kentucky, Arkansas, Mississippi, Tennessee, Oklahoma, and Louisiana have the highest smoking rates in the country (24 percent to 27 percent), and these seven states are home to half the districts in the bottom twenty in terms of life expectancy.41
Nearly all smokers pick up the highly addictive habit in their teens, so joined-up efforts by peers, parents, schools, and policymakers to stop kids from ever starting should be our main focus. Schools and public officials should look critically at what research evidence shows actually works in changing teen behavior. Teens are very sensitive to price, so increasing the cost of cigarettes through taxes has been shown to be tremendously effective in reducing teen smoking rates, especially when neighboring places have similar taxes. Prohibiting cigarette advertising has likewise proven effective, and more vigorous regulation and enforcement around e-cigarettes, which evidence suggests can be a gateway to regular cigarettes for young people, offers promise. In addition, helping people quit can pay huge dividends; quitting smoking by
A long and Healthy life
Even among people in the 18- to 24-year-old age bracket, who grew up knowing smoking’s risks, the smoking rate is 19 percent.
GEOGRAPHIES OF OPPORTUNITY | Ranking Well-Being by Congressional District 45
age 40 gives back nine years of life expectancy, and quitting between the ages of 45 and 54 years, six years.42 Other proven strategies are banning smoking in public places, public education efforts like the 2012 Tips from Former Smokers campaign, and access to insurance coverage to help smokers quit.43
Poor diet and physical inactivity, which together contribute to obesity, high blood pressure, diabetes, cardiovascular disease, cancer, and stroke, are two other very clear priorities for longer lives. These national challenges are particularly pronounced in the districts with the lowest life expectancies; a majority of the twenty bottom-ranking districts are in the nine states with the highest overweight and obesity rates.44 These challenges are also greater among people with low education levels and people living in poverty, who tend to experience high levels of stress, to have less control over their time, and to live in environments that do not support good health outcomes.
Society as a whole does little to help people trying to make better choices in this area. Stigma toward the overweight has been called America’s “last acceptable prejudice,”45 and feeling stigmatized and judged simply does not motivate people to exercise more or eat differently. In addition, most Americans work in fairly sedentary jobs, live in car-centric “obesogenic” environments where junk food and sugary drinks are constantly available, and find themselves bombarded by food advertising at every turn. Fortunately, a number of public health actions are proving successful in helping make the healthier choice an easier choice. They include greater regulation of food advertising, nutritional information, and serving sizes; more effective public information campaigns; healthier food choices in schools and workplaces; and greater investment by municipalities in recreation facilities, walkable neighborhoods (with sidewalks, safe street crossings, and streetlights), bike paths, and farmers’ markets.
Drinking to excess also contributes to obesity, high blood pressure, some cancers, and liver disease, and it is often an underlying factor in trauma deaths: car crashes and other forms of unintentional injury, homicide, and suicide. Helping people recognize and address problem drinking is an important priority.
For some populations, death by firearm is a “fatal fifth,” and completely preventable, contributor to premature death. Of the twenty bottom-ranking health districts, thirteen are in the ten states with the highest rates of gun deaths.46 The problem is most serious for African Americans, who die by firearms at twice the rate of whites in the country as a whole.47
Poor diet and physical inactivity are national challenges that are particularly pronounced in the districts with the lowest life expectancies.
GEOGRAPHIES OF OPPORTUNITY | Ranking Well-Being by Congressional District 46
Only four districts outside the South have life expectancies of less than 76 years, and gun violence may play a role. All are located in the states with the second (Michigan), third (Missouri), and ninth (Pennsylvania) highest rates of firearm deaths for blacks.48
Access to Knowledge
The proxies for access to knowledge are school enrollment for all children and young adults ages 3 to 24 years and the highest degree attained for adults ages 25 years and older. Thus, increasing the Index score requires boosting the share of young people in school and increasing the level of educational attainment for adults.
Education matters for better jobs and bigger paychecks; the economic returns to education are discussed below. But education’s payoff can be measured in much more than dollars. People with higher levels of education have better health and longer lives than people with less education: they smoke less, exercise more, eat healthier diets, are better informed about health topics, are more likely to comply with doctors’ instructions, and have a wider range of effective coping strategies for dealing with stress.49 People with higher levels of education also have more stable relationships and higher levels of positive civic engagement; for instance, they are more likely to marry and less likely to divorce,50 less likely to have a child outside marriage,51 more likely to vote,52 and less likely to go to jail.53
Educational investments at every age level are important, but efforts to boost school enrollment should start with our youngest children. By helping very young children, particularly those from low-income families, develop social and emotional skills and expand their vocabularies, high-quality preschool programs build capacities for success in school and life.54 Fortunately, recent years have seen a growing consensus among not just educational experts but also policymakers and the public that investing in our youngest children makes sense, and the majority of states now have some form of publicly financed preschool. Yet we as a country still have far to go; only 46 percent of 3- and 4-year-olds are enrolled in preschool. Particularly concerted efforts must be made in the states and districts that fall behind. In Idaho and Nevada, fewer than one-third of 3- and 4-year-olds are enrolled in preschool; in Arizona, Indiana, Montana, New Mexico, North Dakota, South Dakota, Tennessee, Washington, and West Virginia, fewer than four in ten young children are.
Education’s payoff can be measured in much more than dollars.
GEOGRAPHIES OF OPPORTUNITY | Ranking Well-Being by Congressional District 47
For states like California, which has a preschool enrollment rate slightly higher than the national average but nonetheless has four districts where only one-third of 3- and 4-year-olds are enrolled, targeted action at the county level is called for. Texas, too, has four districts where fewer than one-third of eligible children are enrolled; in addition, the state preschool enrollment rate is an unimpressive 40.8 percent.
Keeping teens in high school until they complete their diploma is a priority for both the school enrollment and educational attainment metrics in the Index. A large and growing body of research has identified why some high school students drop out of high school—often for nonacademic reasons like familial instability or traumatic experiences55—as well as the early-warning red flags that begin to go up as early as middle school, such as grade repetition and frequent absences. Schools, but also other institutions like municipal and county social services agencies, need to act on these warning signs in concert to identify vulnerable young people and help them complete high school and navigate the transition to an independent, productive adulthood. For populations at risk of dropping out, addressing out-of-school challenges, improving early-warning systems and acting on problems before they snowball, cultivating supportive relationships between students and school staff, and making high school instruction better and more obviously relevant—for instance, through high school courses and apprenticeship programs tied more explicitly to workplace needs and postsecondary certificate programs—all offer promise.56
Creating more robust pathways to higher education and, perhaps even more importantly, supporting young people in completing their degrees, are priorities. College is simply too expensive for many low-income young people, especially when they have to direct a share of their available college funds to noncredit remedial courses to make up for inadequate high school educations. Community colleges, which offer a range of applied technical certificate programs as well as opportunities to transfer to bachelor’s degree programs, all at a comparatively low cost, offer promise as a route to a stable adult career. Policymakers are paying renewed attention to community colleges, but much greater emphasis needs to be placed on helping students actually complete their degrees for this promise to be realized. Only four in ten students who start their postsecondary educations at community colleges earn their associate or bachelor’s degrees within six years.57
Creating more robust pathways to higher education and supporting young people in completing their degrees are human development priorities.
GEOGRAPHIES OF OPPORTUNITY | Ranking Well-Being by Congressional District 48
Improving the Income Index score requires that people’s wages rise alongside economic growth. The last half-century has seen little progress on that score: since 1967, U.S. GDP has gone up 261 percent, but the income of the typical U.S. household has gone up only 19 percent in inflation-adjusted dollars (see FIGURE 6).
The tried-and-true approach for increasing prosperity is for society and people themselves to invest heavily in education. This route has certainly paid handsome rewards for those at the top of the income scale, who typically hold bachelor’s and graduate degrees. For people living in congressional districts that are part of economically thriving metro areas where demand for skilled labor is high, more education continues to be a sound strategy for bigger paychecks. In such areas, creating new pathways to economic security for those without four-year degrees requires partnerships between industry, high schools, community colleges, and the government to provide in-demand skills training via certificate and degree programs and expanded apprenticeship programs.
In many districts, however, such as those in the lagging East South Central region and parts of the rural South Atlantic region, both the supply of and demand for skilled workers for the knowledge economy are low. A long-term strategy to invest in developing a skilled workforce
A decent Standard of living
Gross domestic ProductFrom $4.65 trillion to $16.77 trillion
Median Household IncomeFrom $43,558 to $51,939
300
250
200
150
100
50
0
PE
RC
EN
T C
HA
NG
E S
INC
E 1
967
Sources: U.S. Census Bureau Historical Income Table H-10. Age of Householder: All Races by Median and Mean Income 1967 to 2013 and Bureau of Economic Analysis, National Income and Product Accounts, Table 1.1.6. Real GDP Chained Dollars. Figures are inflation-adjusted 2013 dollars.
FIGURE 6 Comparing GdP to Household Income since 1967
+261%
+19%
GEOGRAPHIES OF OPPORTUNITY | Ranking Well-Being by Congressional District 49
while simultaneously seeking to attract employers with jobs that offer secure livelihoods could change the economic landscape and thus have a profound impact on human development for generations to come. In the short term, however, the potential economic payoff to increased education is smaller than in the more diverse and dynamic labor markets of leading metro areas. Thus, education is only part of the solution to higher earnings.
Another part is to directly tackle wages themselves. Minimum-wage workers need a raise—and the good news is that the fast-food workers’ Fight for Fifteen campaign and other successful efforts are bringing the issue of raising the wage floor forcefully to the top of the economic agenda. They are also getting results, not just in the fast-food sector but in retail more broadly; several large retail chains have recently announced wage increases for their lowest-paid workers. But the story does not end here. Only 4.3 percent of workers earn the federal minimum wage;58 addressing low wages more broadly is also critical. Median salaries in six out of the ten most common occupational categories in the United States are lower than the poverty threshold for a family of four.
Only one of these occupations—registered nurse—offers a median salary considerably higher than the salary of the typical worker. Most of the rest—retail salespeople, fast-food workers, laborers, cashiers, cleaners, and people who wait tables—are at the bottom of the U.S. wage scale. The pay of low-wage workers in these and other jobs is not a marginal concern, affecting only a small number of Americans; in 222 U.S. congressional districts, median personal earnings fall between $20,000 and $30,000 per year.
STANdARd OCCUPATIONAl TYPETOTAl NUMBER
OF WORKERS
U.S. WORKFORCE
(%)
MEdIAN ANNUAl WAGES (2013 dOllARS)
1 Retail Salesperson 4,485,180 3.4 21,140
2 Secretary and Administrative Assistant 3,647,870 2.8 35,660
3 Fast Food and Counter Worker 3,474,600 2.6 18,370
4 Hand Laborers and Material Mover 3,374,770 2.5 22,940
5 Cashier 3,363,530 2.5 18,970
6 Building Cleaning Worker 3,035,070 2.3 21,710
7 Office Clerk 2,832,010 2.1 28,050
8 Driver/Sales Worker and Truck Driver 2,758,700 2.1 34,770
9 Registered Nurse 2,661,890 2.0 66,220
10 Waiter/Waitress 2,403,960 1.8 18,590
Source: Bureau of Labor Statistics, Occupational Employment Statistics, Broad Occupational Categories, May 2013. This includes full- and part-time workers.
TABlE 8 Ten Most Common Occupations
Only 4.3 percent of workers earn the federal minimum wage, so addressing low wages more broadly is critical.
GEOGRAPHIES OF OPPORTUNITY | Ranking Well-Being by Congressional District 50
One area the push for higher wages has bypassed is the agricultural sector. Two of the lowest-earning U.S. districts are in California’s Central Valley, the country’s leading agricultural region. The crop workers who plant, cultivate, and harvest the region’s bounty of fruits and vegetables are literally feeding America—yet they struggle to put food on the table for their own families. The state’s crop workers, over 90 percent of whom are Mexican immigrants, typically earn between $15,000 and $17,500 per year.59
So what are other actions necessary to build the capabilities of and expand the opportunities of workers toward the bottom of the wage scale? Helping people exit low-paying jobs for more secure livelihoods is an important strategy for boosting wages. But, as discussed above, not everyone will be able to choose this path. Plenty of people live in areas where low-wage service-sector jobs predominate, and nationwide the number of jobs at both ends of the pay spectrum is increasing, but middle-class, middle-wage jobs are not. In fact, legions of such jobs were lost in the Great Recession, and they haven’t returned to the labor market. In addition, some people don’t have the aptitude for or interest in higher education, or attended schools that did not prepare them to succeed in higher education. Thus, as important as preparing people for high-skills jobs is ensuring that all jobs, including those that don’t require bachelor’s degrees, are good jobs. Good jobs pay living wages, provide predictable and sufficient work hours, and offer fundamental benefits like paid sick leave, paid parental leave, and health insurance.
When families earn too little to make ends meet, a host of well-being outcomes suffer. The impact on children is particularly pronounced: research shows that deep poverty in early childhood has both immediate and lifelong adverse effects.60 Two pathways for greater economic security for all American families are thus critical: helping more people bypass or exit low-paying sectors by getting more education, and ensuring that all jobs pay wages that afford workers the dignity of self-sufficiency and the peace of mind of economic security.
One area the push for higher wages has bypassed is the agricultural sector.
GEOGRAPHIES OF OPPORTUNITY | Ranking Well-Being by Congressional District 51
1 Lewis and Burd-Sharps, Measure of America 2013–2014.
2 NationalMortgageProfessional.com, “U.S. Foreclosure Starts Rise to 17-Month High in December.”
3 U.S. Bureau of Economic Analysis, “Percent Change from Preceding Period in Real Gross Domestic Product.”
4 Jessica Menton, “Dow Jones Industrial Average, S&P 500 Index, and Russell 2000 Index Smash Record Highs.”
5 Searcey and Gebeloff, “Middle Class Shrinks Further as More Fall Out Instead of Climbing Up.”
6 “More Jobs, Flat Incomes.”
7 Parilla et al., Global Metro Monitor 2014.
8 Sen, Development as Freedom.
9 Meara, Richards, and Cutler, “The Gap Gets Bigger.”
10 Ingraham, “America’s Most Gerrymandered Congressional Districts.”
11 The correlation between the percentage of a district’s population that is foreign-born and life expectancy is a positive and moderately strong one. Assuming a logarithmic relationship and controlling for nothing else, the population share that is foreign-born can explain about 52 percent of the variation in life expectancy across all congressional districts.
12 Lewis and Burd-Sharps, Portrait of California, 2014–2015.
13 Virginia Community Profile: Congressional District 8.
14 “Virginia 9th District.”
15 Virginia Community Profile: Congressional District 9.
16 “World Bank Open Data: Indicators.”
Notes
17 Kochanek, Arias, and Anderson, How Did Cause of Death Contribute to Racial Differences in Life Expectancy in the United States in 2010?
18 Ibid.
19 “Features: African American History.”
20 Lewis and Burd-Sharps, Measure of America 2013–2014.
21 Murder/Shooting Analysis 2013: Philadelphia.
22 This finding is based on a linear regression model in which life expectancy at birth was the dependent variable and the poverty rates, uninsurance rates, and indicators summarizing important aspects of the age, race, and ethnic compositions of district populations, were the independent variables. All predictors were significant to .05, and the adjusted R-squared for the model as a whole was .585.
23 Lewis and Burd-Sharps, Measure of America 2013–2014.
24 Ibid.
25 Measure of America analysis of U.S. Census Bureau, American Community Survey 2013, tables B27001H and B27001I.
26 “Adults Having Five or More Alcoholic Beverages in 1 Day”; “Cigarette Smoking in the United States.”
27 Abraído-Lanza et al., “Latino Mortality Paradox.”
28 Klinenberg, Heat Wave.
29 Lewis and Burd-Sharps, Measure of America 2010–2011: Mapping Risks and Resilience.
30 Lewis and Burd-Sharps, Portrait of California, 2014–2015; Burd-Sharps and Lewis, Portrait of Sonoma County; Lewis and Burd-Sharps, Measure of America 2010–2011: Mapping Risks and Resilience.
31 Lewis and Burd-Sharps, Halve the Gap by 2030: Youth Disconnection in America’s Cities.
32 “Compulsory School Attendance Laws.”
33 Lewis and Burd-Sharps, Halve the Gap by 2030: Youth Disconnection in America’s Cities.
34 Campbell et al., “Early Childhood Investments Substantially Boost Adult Health”; Heckman, “Economics of Inequality: The Value of Early Childhood Education.”
35 Hernández, “Lessons for de Blasio in New Jersey’s Free Pre-K.”
36 Heckman and Masterov, “Productivity Argument for Investing in Young Children.”
37 Urban Institute. http://datatools .urban.org.Features/wealth-inequality-charts.
38 The Health Consequences of Smoking—50 Years of Progress; “Current Cigarette Smoking Among Adults in the United States.”
39 Jha et al., “21st-Century Hazards of Smoking and Benefits of Cessation in the United States.”
40 “Current Cigarette Smoking among Adults in the United States.”
41 “Percent of Adults Who Smoke.”
42 Jha et al., “21st-Century Hazards of Smoking and Benefits of Cessation in the United States.”
43 “Frequently Asked Questions about the Tips Campaign” for the Tips from Former Smokers campaign; Jha et al., “21st-Century Hazards of Smoking and Benefits of Cessation in the United States” for the overall list.
44 They are, in order, Arkansas, Mississippi, West Virginia, Tennessee, Alabama, Oklahoma, North Dakota, Louisiana, and
GEOGRAPHIES OF OPPORTUNITY | Ranking Well-Being by Congressional District 52
Kentucky. “Percent of Adults Who Are Overweight or Obese.”
45 Neporent, “Prejudice Against Fat People Ignored”; Schvey et al., “The Influence of a Defendant’s Body Weight on Perceptions of Guilt.”
46 “Number of Deaths Due to Injury by Firearms per 100,000 Population.”
47 Kalesan et al., “State-Specific, Racial and Ethnic Heterogeneity in Trends of Firearm-Related Fatality Rates in the USA from 2000 to 2010.”
48 “Number of Deaths Due to Injury by Firearms per 100,000 Population.”
49 Burd-Sharps and Lewis, A Portrait of Sonoma County.
50 Aughinbaugh, Robles, and Sun, Marriage and Divorce.
51 Sum, Khatiwada, and McLaughlin, “The Consequences of Dropping out of High School.”
52 Milligan, Moretti, and Oreopoulos, “Does Education Improve Citizenship?”
53 Sum, Khatiwada, and McLaughlin, “The Consequences of Dropping out of High School.”
54 “Major Findings.”
55 Don’t Call Them Dropouts: Understanding the Experiences of Young People Who Leave High School before Graduation.
56 Burd-Sharps and Lewis, One in Seven.
57 Shapiro et al., Completing College: A National View of Student Attainment Rates—Fall 2008 Cohort.
58 “Minimum Wage Workers Account for 4.3 Percent of Hourly Paid Workers in 2013.”
59 Measure of America calculations from U.S. Department of Labor National Agricultural Workers Survey, 2009–2012, and Lewis and Burd-Sharps, A Portrait of California 2014–2015.
60 Harper, Marcus, and Moore, “Enduring Poverty and the Conditions of Childhood”; Duncan and Brooks-Gunn, “Family Poverty, Welfare Reform, and Child Development.”
GEOGRAPHIES OF OPPORTUNITY | Ranking Well-Being by Congressional District 53
Abraído-Lanza, Ana F., Bruce P. Dohrenwend, Daisy S. Ng-Mak, and J. Blake Turner. “The Latino Mortality Paradox: A Test of the ‘Salmon Bias’ and Healthy Migrant Hypotheses.” American Journal of Public Health 89, no. 10 (October 1999): 1543–48.
“Adults Having Five or More Alcoholic Beverages in 1 Day.” Centers for Disease Control and Prevention. Accessed March 26, 2014. http://www.cdc.gov/features/ds5drinks1day.
Aughinbaugh, Alison, Omar Robles, and Hugette Sun. Marriage and Divorce: Patterns by Gender, Race, and Educational Attainment. Bureau of Labor Statistics, October 2013.
Burd-Sharps, Sarah, and Kristen Lewis. A Portrait of Sonoma County. New York: Social Science Research Council, 2014.
Campbell, Frances, Gabriella Conti, James J. Heckman, Seong Hyeok Moon, Rodrigo Pinto, Elizabeth Pungello, and Yi Pan. “Early Childhood Investments Substantially Boost Adult Health.” Science 343, no. 6178 (March 28, 2014): 1478–85.
Centers for Disease Control and Prevention, National Center for Health Statistics 2011.
“Cigarette Smoking in the United States.” Centers for Disease Control and Prevention. Accessed September 17, 2014. http://www.cdc.gov/tobacco/campaign/tips/resources/data/cigarette-smoking-in-united-states.html.
“Compulsory School Attendance Laws.” National Center for Education Statistics. Accessed February 24, 2015. http://nces.ed.gov/programs/statereform/tab5_1.asp.
“Current Cigarette Smoking among Adults in the United States.” Centers for Disease Control and
Prevention. Accessed March 31, 2015. http://www.cdc.gov/tobacco/data_statistics/fact_sheets/adult_data/cig_smoking/.
Don’t Call Them Dropouts: Understanding the Experiences of Young People Who Leave High School before Graduation. America’s Promise Alliance, 2014.
Duncan, Greg J., and Jeanne Brooks-Gunn. “Family Poverty, Welfare Reform, and Child Development.” Child Development 71, no. 1 (January 1, 2000): 188–96.
“Features: African American History.” Centers for Disease Control and Prevention. Accessed February 24, 2015. http://www.cdc.gov/features/africanamericanhistory.
“Frequently Asked Questions About the Tips Campaign.” Centers for Disease Control and Prevention. Accessed March 31, 2015. http://www.cdc .gov/tobacco/campaign/tips/about/faq.html.
Harper, Caroline, Rachel Marcus, and Karen Moore. “Enduring Poverty and the Conditions of Childhood: Lifecourse and Intergenerational Poverty Transmissions.” World Development, Chronic Poverty and Development Policy, 31, no. 3 (March 2003): 535–54.
Heckman, James J. “The Economics of Inequality: The Value of Early Childhood Education.” American Educator 35, no. 1 (2011): 31.
Heckman, James J., and Dimitriy V. Masterov. “The Productivity Argument for Investing in Young Children.” Applied Economic Perspectives and Policy 29, no. 3 (September 21, 2007): 446–93.
Hernández, Javier C. “Lessons for de Blasio in New Jersey’s Free Pre-K.” New York Times, January 26, 2014.
Bibliography
Ingraham, Christopher. “America’s Most Gerrymandered Congressional Districts.” Washington Post, May 15, 2014.
Jha, Prabhat, Chinthanie Ramasundarahettige, Victoria Landsman, Brian Rostron, Michael Thun, Robert N. Anderson, Tim McAfee, and Richard Peto. “21st-Century Hazards of Smoking and Benefits of Cessation in the United States.” New England Journal of Medicine 368, no. 4 (January 24, 2013): 341–50.
Kalesan, Bindu, Sowmya Vasan, Matthew E. Mobily, Marcos D. Villarreal, Patrick Hlavacek, Sheldon Teperman, Jeffrey A. Fagan, and Sandro Galea. “State-Specific, Racial and Ethnic Heterogeneity in Trends of Firearm-Related Fatality Rates in the USA from 2000 to 2010.” BMJ Open 4, no. 9 (September 1, 2014).
Klinenberg, Eric. Heat Wave: A Social Autopsy of Disaster in Chicago. Chicago: University of Chicago Press, 2003.
Kochanek, Kenneth D., Elizabeth Arias, and Robert N. Anderson. How Did Cause of Death Contribute to Racial Differences in Life Expectancy in the United States in 2010? NCHS Data Brief. Centers for Disease Control and Prevention, 2013.
Lewis, Kristen, and Sarah Burd-Sharps. Halve the Gap by 2030: Youth Disconnection in America’s Cities. Social Science Research Council, 2013.
———. The Measure of America 2010–2011: Mapping Risks and Resilience. New York: New York University Press, 2010.
———. The Measure of America 2013–2014. New York: Social Science Research Council, 2013.
GEOGRAPHIES OF OPPORTUNITY | Ranking Well-Being by Congressional District 54
———. One in Seven: Ranking Youth Disconnection in the 25 Largest Metro Areas. Social Science Research Council, September 2012.
———. A Portrait of California 2014–2015. New York: Social Science Research Council, 2014.
“Major Findings.” The Carolina Abecedarian Project. Accessed March 31, 2015. http://abc.fpg.unc.edu/major-findings.
Meara, Ellen, Seth Richards, and David Cutler. “The Gap Gets Bigger: Changes in Mortality and Life Expectancy by Education, 1981–2000.” Health Affairs 27, no. 2 (2008): 350–60.
Menton, Jessica. “Dow Jones Industrial Average, S&P 500 Index, and Russell 2000 Index Smash Record Highs.” International Business Times, December 26, 2014.
Milligan, Kevin, Enrico Moretti, and Philip Oreopoulos. “Does Education Improve Citizenship? Evidence from the United States and the United Kingdom.” Journal of Public Economics 88, no. 9–10 (2004): 1667–95.
“Minimum Wage Workers Account for 4.3 Percent of Hourly Paid Workers in 2013.” Bureau of Labor Statistics, April 3, 2014. http://www.bls.gov/opub/ted/2014/ted_20140403.htm.
“More Jobs, Flat Incomes.” Wall Street Journal, October 3, 2014.
Murder/Shooting Analysis 2013: Philadelphia. Philadelphia: Philadelphia Police Department, 2013.
NationalMortgageProfessional.com. “U.S. Foreclosure Starts Rise to 17-Month High in December.” National Mortgage Professional Magazine, January 20, 2015.
Neporent, Liz. “Prejudice Against Fat People Ignored.” ABC News, January 22, 2013.
“Number of Deaths Due to Injury by Firearms per 100,000 Population.” Kaiser Family Foundation, 2013. http://kff.org/other/state-indicator/firearms-death-rate-per-100000/.
Parilla, Joseph, Jesus Leal Trujillo, Alan Berube, and Tao Ran. Global Metro Monitor 2014. Washington, DC: Brookings Institution, January 2015.
“Percent of Adults Who Are Overweight or Obese.” Kaiser Family Foundation, 2013. http://kff.org/other/state-indicator/adult-overweightobesity-rate/.
“Percent of Adults Who Smoke.” Kaiser Family Foundation, 2013. http://kff.org/other/state-indicator/smoking-adults/.
Searcey, Dionne, and Robert Gebeloff. “Middle Class Shrinks Further as More Fall Out Instead of Climbing Up.” New York Times, January 25, 2015.
Schvey, N. A., R. M. Puhl, K. A. Levandoski, and K. D. Brownell. “The Influence of a Defendant’s Body Weight on Perceptions of Guilt.” International Journal of Obesity 37, no. 9 (September 2013): 1275–81.
Sen, Amartya. Development as Freedom. Reprint ed. New York: Anchor, 2000.
Shapiro, D. A. Dundar, X. Yuan, A. Harrell, and P.K . Wakhungu. Completing College: A National View of Student Attainment Rates—Fall 2008 Cohort. National Student Clearinghouse Research Center, November 2014.
Shore, Rima, and Barbara Shore. Reducing the High School Dropout Rate. The Annie E. Casey Foundation, July 2009.
Sum, Andrew, Ishwar Khatiwada, and Joseph McLaughlin. “The Consequences of Dropping Out of High School: Joblessness and Jailing for High School Dropouts and the High Cost for Taxpayers.” Center for Labor Market Studies Publications, October 1, 2009.
The Health Consequences of Smoking—50 Years of Progress. A Report of the Surgeon General. Rockville, MD: U.S. Department of Health and Human Services, 2014.
U.S. Bureau of Economic Analysis. “Percent Change from Preceding Period in Real Gross Domestic Product.” 2015, analysis from 2007 to 2015.
U.S. Census Bureau. American Community Survey 2013, 1 year-estimates.
———. Population Estimates Program, Estimates of the July 1, 2011, resident population. Vintage 2013.
Virginia Community Profile: Congressional District 8. Richmond: Virginia Employment Commission, 2015.
Virginia Community Profile: Congressional District 9. Richmond: Virginia Employment Commission, 2015.
“Virginia 9th District.” National Journal.
“World Bank Open Data: Indicators.” World Bank. Accessed September 17, 2014. http://data.worldbank.org/indicator.
GEOGRAPHIES OF OPPORTUNITY | Ranking Well-Being by Congressional District 55
RANK CONGRESSIONAl dISTRICTHd INdEx
lIFE ExPECTANCY
AT BIRTH (YEARS)
lESS THAN HIGH
SCHOOl (%)
AT lEAST HIGH
SCHOOl dIPlOMA
(%)
AT lEAST BACHElOR'S
dEGREE (%)
GRAdUATE OR PROFESSIONAl
dEGREE (%)
SCHOOl ENROllMENT
(%)
MEdIAN EARNINGS
(2013 dOllARS)
HEAlTH INdEx
EdUCATION INdEx
INCOME INdEx
UNITED STATES 5.06 79.1 13.4 86.6 29.6 11.2 77.0 30,454 5.44 5.06 4.68
1 California District 18 8.18 83.7 6.8 93.2 60.0 30.1 85.6 55,215 7.38 8.36 8.80
2 New York District 12 8.05 82.9 7.3 92.7 69.2 30.4 73.5 60,953 7.04 7.61 9.49
3 California District 33 7.82 81.7 4.5 95.5 61.6 26.6 88.3 51,271 6.54 8.64 8.29
4 California District 17 7.75 83.4 8.9 91.1 54.3 25.3 82.9 52,493 7.26 7.55 8.45
5 Virginia District 8 7.75 83.5 9.0 91.0 61.4 31.1 77.0 52,003 7.31 7.55 8.39
6 New York District 10 7.64 82.2 11.5 88.5 60.6 29.2 80.6 52,857 6.76 7.67 8.50
7 New York District 3 7.50 81.9 7.4 92.6 52.2 24.5 85.5 50,160 6.63 7.73 8.14
8 Virginia District 10 7.47 82.5 7.6 92.4 53.8 22.2 82.7 50,003 6.89 7.42 8.11
9 New Jersey District 7 7.46 81.9 6.5 93.5 50.3 21.0 85.2 51,168 6.61 7.50 8.27
436 California District 21 3.04 78.4 41.0 59.0 8.3 2.4 73.5 20,101 5.16 2.16 1.80
Sources: Measure of America life expectancy calculations use mortality data from the Centers for Disease Control and Prevention’s National Center for Health Statistics, 2011 and population data from the U.S. Census Bureau, 2011. Education and earnings indicators come from the U.S. Census Bureau’s American Community Survey 2013.