100% Occupied, 82 Unit \ MULTIFAMILY INVESTMENT OFFERING
OFFERING MEMORANDUM | THE BARGAIN MOTEL 200 S. 8th Street | Las Vegas, Nevada 89101
CONFIDENTIALITY & DISCLOSURESUN COMMERCIAL REAL ESTATE, INC. (the “Broker”) has been retained on an exclusive basis to market the property described here in (the “Property”). Broker has been authorized by the Seller of the Property (the “Seller”) to prepare and distribute the enclosed informa-tion (the “Material”) for the purpose of soliciting offers to purchase from interested parties. More detailed financial, title and tenant lease information may be made available upon request following the mutual execution of a letter of intent or contract to purchase between the Seller and a prospective purchaser. You are invited to review this opportunity and make an offer to purchase based upon your analysis. If your offer results in the Seller choosing to open negotiations with you, you will be asked to provide financial references. The eventual purchaser will be chosen based upon an assessment of price, terms, ability to close the transaction and such other matters as the Seller deems appropriate.
The Material is intended solely for the purpose of soliciting expressions of interest from qualified investors for the acquisition of the Prop-erty. The Material is not to be copied and/or used for any other purpose or made available to any other person without the express written consent of Broker or Seller. The Material does not purport to be all-inclusive or to contain all of the information that a prospective buyer may require. The information contained in the Material has been obtained from the Seller and other sources and has not been verified by the Seller or its affiliates. The pro forma is delivered only as an accommodation and neither the Seller, Broker , nor any of their respective affiliates, agents, representatives, employees, parents, subsidiaries, members, managers, partners, shareholders, directors, or officers, makes any representation or warranty regarding such pro forma. Purchaser must make its own investigation of the Property and any existing or available financing, and must independently confirm the accuracy of the projections contained in the pro forma.
Seller reserves the right, for any reason, to withdraw the Property from the market. Seller has no obligation, express or implied, to accept any offer. Further, Seller has no obligation to sell the Property unless and until the Seller executes and delivers a signed agreement of purchase and sale on terms acceptable to the Seller, in its sole discretion. By submitting an offer, a purchaser will be deemed to have acknowledged the foregoing and agreed to release Seller and Broker from any liability with respect thereto.
Property walk-throughs are to be conducted by appointment only. Contact Broker for additional information.
OFFERING MEMORANDUM | THE BARGAIN MOTEL 200 S. 8th Street | Las Vegas, Nevada 89101
OFFERING HIGHLIGHTSTHE OFFERINGA 3-story, multi-family, 82 unit extended stay, in the heart of Downtown Las Vegas and located with-in a Qualified Opportunity Zone. The property is located at 200 S. 8th Street and is 100% occupied, the majority of which are long term tenants and a waiting list of eager tenants standing by to fill vacancies as they occur.
PROPERTY LOCATIONThis subject property is located on the southwest corner of S. 8th Street and E. Carson Avenue, within walking distance to a diverse selection of Las Vegas hotspots including the world famous Fremont Street Experience, Downtown Las Vegas, Downtown Container Park, a multitude of restaurants and bars that are recommended by top travel authorities and directly across the street from the Fremont Stage of the Life is Beautiful Music and Arts Festival. The subject is surrounded by popular multi-family projects such as the City Center Apartments, 8th Street Apartments, Park Avenue Apartments, the brand new Fremont 9 and is within close proximity to the Federal and Municipal Courthouses, Profes-sional Offices, World Class Entertainment, Shopping and major Medical Facilities. The location is well supported and highly suited to the popular urban living environment that continues to grow thanks to the excitement created by the recent revitalization and development of the area. Located just 1 mile away from the U.S. 95, this project provides fantastic access for visitors and locals alike.
PROPERTY DESCRIPTIONBuilt in 1974 with recent renovations. The water chiller A/C system has been completely rebuilt, which includes a new compressor, a new KVAR electrical cleanup system that covers the water tower and all lines going to all the rooms. The system has been chemically treated to clean out all pipes and is work-ing beautifully with a maintenance contract in place with the people who rebuilt the entire system. The project’s units have been recently renovated along with the building exterior and parking surfaces.
Located just 2 blocks off Las Vegas Boulevard, this valuable location within a Qualified Opportunity Zone boasts a current occupancy rate of 100% with a waiting list of eager Tenant’s standing by for po-tential vacancies. The property is professionally staffed by a team with decades of experience in the extended stay industry operating a current business model which generates their revenue by renting weekly and monthly rooms to local tenants, 80% of whom are retired and have social security checks coming in every month to pay the rent which has proven to be a successful model but also presents an excellent upside by providing an opportunity to shift the current model from a short term to a long term multi-family project with minor renovations and revitalization efforts. The current configuration features 10 one bedroom units with kitchens, 7 small junior studio units, and 65 regular studio units—all fully furnished.
OFFERING HIGHLIGHTS• Prime Location in Downtown Las Vegas
• Project units recently renovated
• Existing waiting list to fill potential vacancies
• 100% Occupied
• Fully Furnished
• Located within a Qualified Opportunity Zone
SUMMARY
Asking Price: $8,475,000
Cap Rate: 5.15%
Building Size: ±35,751 SF
Zoning: C-2 (General Commercial District)
OFFERING MEMORANDUM | THE BARGAIN MOTEL 200 S. 8th Street | Las Vegas, Nevada 89101
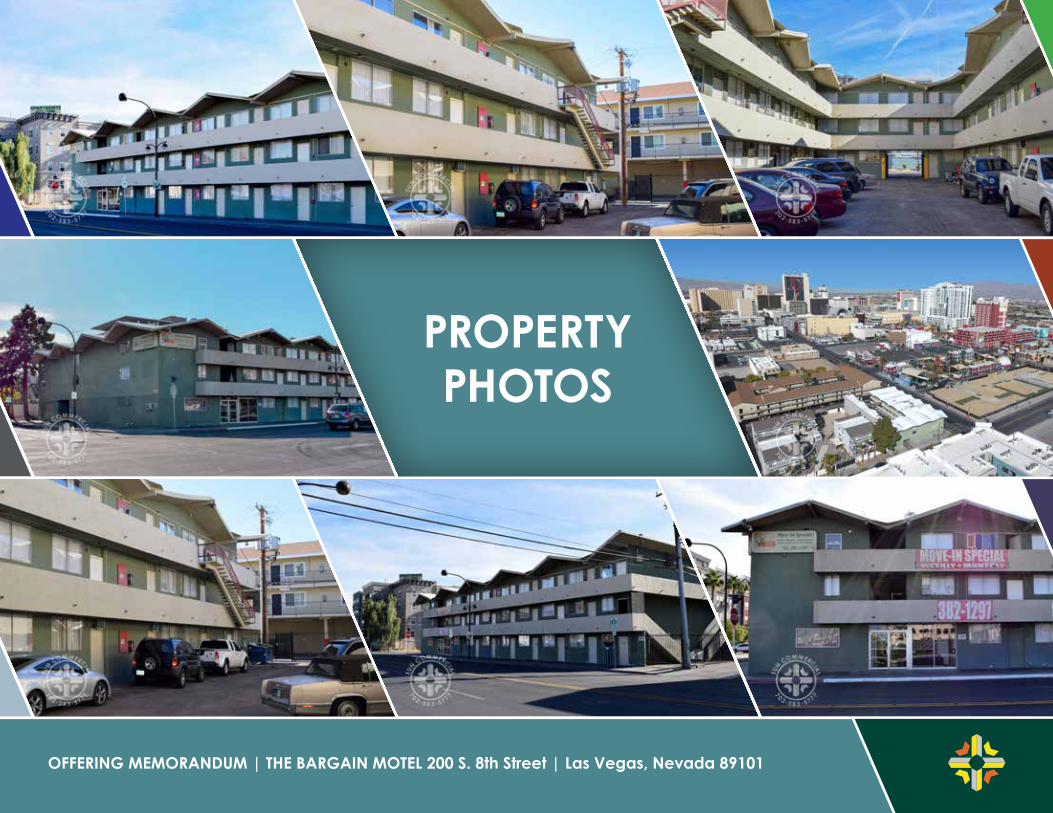
PROPERTY PHOTOS
OFFERING MEMORANDUM | THE BARGAIN MOTEL 200 S. 8th Street | Las Vegas, Nevada 89101
Silverado Ranch
Enterprise
Green ValleySouth
WhitneyRanch
MacDonaldRanch
SpringValley
SunriseManor
Downtown
BoulderCity
Seven Hills
Anthem
SouthernHighlands
RhodesRanch
MountainsEdge
Summerlin
CentennialHills
NorthLas Vegas
Winchester
Paradise
Henderson
Silverado Ranch
Enterprise
Green ValleySouth
WhitneyRanch
MacDonaldRanch
SpringValley
SunriseManor
Downtown
BoulderCity
Seven Hills
Anthem
SouthernHighlands
RhodesRanch
MountainsEdge
Summerlin
CentennialHills
NorthLas Vegas
Winchester
Paradise
Henderson
93
95
95
95
93
LAS VEGAS VALLEY LOCATION MAP
OFFERING MEMORANDUM | THE BARGAIN MOTEL 200 S. 8th Street | Las Vegas, Nevada 89101
ASSESSOR PARCEL MAP
E5
E5
E5
E5
E5
022
50
50
18
11
140
SOUT
H
25
6 990
827:
495
130
22
8
16
14
140
25
OGDEN AVE
29
27
110
6
140
3
19
726
1
9
20
023
29
5
26
40
SUB
16
140.29
611
VAC 1249:120817732
23
130
1614
5
16028
VAC
2016
0419
:225
5
12
10
140
80
16
R=25
139.89
7
28
715
6
1
8
6
80
4
5
H
22
45
140
009
18
19
27
PB 1-13
5
3
19
12
140
035
32
140
2
082
15
50
80
PT
CLARKS L V TOWNSITE
11
8
16
4
135
50
613
25
PT 139-34-715-001
21
VAC
7
27
5R=10
25
VAC
9605
15:1
394
12
2
99.3
5
16
3102.72
70
8
25
22
32
32
24
13
6
11
140
25
R=10
11
24
14
31
25
5
17
29
2
4
21
601
NINT
H ST
1
30
8
6
11
130
12
10
21
2
036
NEONOPOLIS
9
140
10
240
1-15
6
012
25
130
68.91 SUBDIVISION
12
6
1925
9
4
7
7
130
31
4
17
140
130
024
2
300
030
2928
50
PB 1-7
20
67.5
7
(PARKING GARAGE)
25
17
13
1
17
36
2
24
035
019
7
40
9
SUBD
25
VAC
2016
0419
:225
5
134.6
25
25
I
7
31
130
13
25
5
19
0261
135
50
HAWKINS
005
15
10
R=10
FREMONT ST
4
LEASE
D2
140
3
15
9
8
3750
PT 139-34-701-001
2
82.3
15
19
15
8
9
TOWER
29
80
12
1
4
30
13
11 16
50
16
16
27
175
20
12
14
7512
23
SEVE
NTH
ST
140
22
7
50
14
140
601
10
2
601
PB 1-15
013
VAC
2004
1216
:485
5129.59
VAC
2016
0419
:225
5
16
3
601
PB87-35
26
5
1350
PB
16
PB 1-13
30
11
R=10
150
30
2
15
61.2
3
400
140
35
7
7
20
5
4
20
130
140.14
PT 139-34-111-064
PB 1-7
23
2
TENT
H ST
3
3
020
12
25
1
70
140
WARDIE ADD
23VAC
8809
15:1
024
9
20
20
9
2
50
133.5
14
10
140
6
(RETAIL AIR SPACE 2.75AC)
13
339.
93
19
17
4
7
9
022
R=10
11
25
12
NINT
H ST
30
28
25
19
31
150
27
10
STREET
23
140
37
9
7
80
8
3
3
FOUR
TH S
T
130
CARMEL
9
25
25
17
32
13
31
1139
15
17
80
BUCKS SUB8
034
80
033
16
016
PB 1-40
PM 119-72
ELEV
ENTH
ST
7
50
240
6
11
25
(RETAIL AIR SPACE)45
25
032
19
13
20
140
37
4
8
2
BLA
S VE
GAS
BLV
D
PB 1-7
8
5
13
19
400
084
9
50
70
PIONEER
3
PB 1-7
7
140
7
23
12
034300
601
5
80
8
25
17
289.93
039
13
17
25
35
2012
1
140
"A"
12
PT 139-34
80
1
-064
20
R=10
PT
601
8
17
25 514
5
12
80
50
9
PT 139-34-
14
70
7
300
25
701 32
210
9
125.
13
14025
126.2
31
PT 1
6
13
15
9
701
FREMONT ST
029
TENT
H ST
7
580
EXPERIENCE
31
9
6
"A"
GRANDVIEW ADD
6
2
C
11
4
1
9
80
10
1
FAIRVIEW
1
50
19
22
60
14
11
100
25
130
VAC
853:
6850
94
PB 1-13
PB 1-35
12
50
140
120
3
8
32
50
008
601
32
2812
4.97
017
75
140
PB 1-7
140
224.
83
18
18
085
3
(PARKING GARAGE)
9
25
5
4
73.46
HGTS
379.
98
5
22
PB 139-45
22
PB 1-2
014
143.3
106
50
80
I
32
18
8
50
49.9
9
3
14
CARSON AVE
80
30
R=10
10
PT 139-
11
70
29
4
140
-612-010
1
R=10
20
1
29
4
130
BRIDGER AVE
140
18
25
16
VAC
9806
10:0
1045
16
15
27
70
15LEASE
12
7
16
140
400
80
100
140
25
4
510
25
17
29
150
15
28
12
21
100
1
4
PT 139-34-512-027
175
7
3
15
PT 12
PB 1-15
15
5
15
10
015
25
6
2005
0802
:710
37
140
140.49
610006
140
195
50
4
062
140
R=10
PB 1-40
BUCKS
12
29
5
11
20
ADD
8
4
4
3
189.
75
1
3
20
6
4
10
18
20
50
1
4
414
140
140.14
25
601
10
3
187.71
20
4
018
1
3
12
25
22
10
28
26
25
24
10
PT 139-34-601-001
15
25
85
132.04
"A"
23
70
22
VAC *
25
023
13
80
22
027
2
13
2024
390
STEWART AVE
10
30
25
29
75
EIG
HTH
ST
13
5
601R=10
FREMONT
28 1
200
25
8
PT 12
025
20
6
16
63.86
30
25
PB 1-37
24
8
17
50
6018
280
50
R=10
CONDOMINIUM
18
004
30
130
80
I
16
7
TRACT
5
037
10
NEONOPOLIS
17
250
11
50
036
130
11
50
3
14
031
14
26
12
3
14
25
9
24
601
083
6
625
4
140
EIG
HTH
ST
VAC
19
99.9
6
20
7
10
21
20
50
23
2
140
101
PT 1
140
26
23
9
140
25
R=10
12
8
27
601
50
8
STREAMLINE
10
4
601-001
400
1414
25
18
10
10
THE BUNKHOUSE
18
VAC 048:038243
14
8
6
10
15
038
PB 1-40
9
3
11
13
25
8
26
2
8
SIXT
H ST
3
32
1-15
VAC
2016
0419
:225
5
501
17
8
HAWKINS ADD
612
13
VAC
2003
0602
:195
2
50
50
PB 1-15
200
99.9
6
11
18
80
15
200
27
7
400
VAC 1249:1208178
PB 87-35
13
140
380
LAS
VEG
AS B
LVD
4
140
50
260.02
2
7
12
29
17
11
6
1
155
1
11
22
139.
99
5
8
1
21
034
31
PB 1-35
6
20
125.72
24
34-11113
0
80
49.9
9
127
R=106
70
295
17
11
FOUR
TH S
T
25
PB
21
3
140140
7
136
19
VAC
9806
10:0
1045
140
25
20
26
140
18
25
16
31
1
10
140
006
10
021
701140
1
VAC
2018
0814
:301
1
200
150
2
5
400
400 VA
C 20
1808
14:3
011
1
VAC 20160419:2255
200
003
001
007011
005
002
057
007
027
025
0110.8
0060.3
0061.42
0140.69
0220.15
0150.52
0140.23
0130.69
0121.75
0101.51
0090.64
0082.75
0071.29
0040.48
0050.32
See Condo List Page
See Condo List Page
080
081
024
022
057064
063040 006
052
062
047048
085
026
056
084
055
031
015016
010
041040
036
028
051
023
022
027
026
036
034
033
032
031029
028
030041
040039
006007
008009
010
078
079
067
066
003
002
010
007008
016
053
052
044
043
042
049
047
048
050
022 055
023
045
061073
019
004
069002
036
046
049
122
027023 084028 006024
088085005
059 025060087
026 086061
011001038
062 001039
002063
037
007012003062 068
004
013 003042014
006043
044
009 045
046
017 064071063
035017 072
018034
081
018
033 050051
019 032 074
031 020020
021080 053
030030
021 054029
024
042 028024
027045
038046
037 025035
025
053
052
See Detail Pages for Air Pcls
026
NO
TES
This map is for assessment use only and does NOT represent a survey.
No liability is assumed for the accuracy of the data deliniated herein. Information on roads and other non-assessed parcels may be obtained from the Road Document Listing in the Assessor's Office.
This map is compiled from official records, including surveys and deeds, but only contains the information required for assessment. See the recorded documents for more detailed legal information.
MA
P LE
GE
ND
USE THIS SCALE(FEET) WHEN MAP REDUCED FROM 11X17 ORIGINAL
ASSESSOR'S PARCELS - CLARK CO., NV.
Scale: 1" = 200' 9/4/2018
T20S R61E 34 S 2 NE 4 139-34-6
31
30
19
1
1314
121110987
6 5 4 3 2
3635343332
29 28 27 26
24
25
23222120
18 17 16 15
BO
OK
SEC
.
MA
P
2
3
4
5
6
7
8
1
2
3
4
51
8
7
5
6
4 8
203
PARCEL BOUNDARYSUB BOUNDARY
ROAD EASEMENTPM/LD BOUNDARY
HISTORIC LOT LINEMATCH / LEADER LINE
ROAD PARCEL NUMBERPARCEL NUMERACREAGE
PARCEL SUB/SEQ NUMBER
PLAT RECORDING NUMBERBLOCK NUMBERLOT NUMBERGOV. LOT NUMBER
10010011.00
202PB 24-45
55
GL5
HISTORIC SUB BOUNDARYHISTORIC PM/LD BOUNDARY
15
8 4
Rev:
TAX DIST
0 200 400 600 800100 SECTION LINE
CONDOMINIUM UNITAIR SPACE PCLRIGHT OF WAY PCLSUB-SURFACE PCL
139
162 161
140138
163
124 123125
177 178176
Michele W. Shafe - Assessor
E5
E5
E5
E5
E5
022
50
50
18
11
140
SOUT
H
25
6 990
827:
495
130
22
8
16
14
140
25
OGDEN AVE
29
27
110
6
140
3
19
726
1
9
20
023
29
5
26
40
SUB
16
140.29
611
VAC 1249:120817732
23
130
1614
5
16028
VAC
2016
0419
:225
5
12
10
140
80
16
R=25
139.89
7
28
715
6
1
8
6
80
4
5
H
22
45
140
009
18
19
27
PB 1-13
5
3
19
12
140
035
32
140
2
082
15
50
80
PT
CLARKS L V TOWNSITE
11
8
16
4
135
50
613
25
PT 139-34-715-001
21
VAC
7
27
5R=10
25
VAC
9605
15:1
394
12
2
99.3
5
16
3102.72
70
8
25
22
32
32
24
13
6
11
140
25
R=10
11
24
14
31
25
5
17
29
2
4
21
601
NINT
H ST
1
30
8
6
11
130
12
10
21
2
036
NEONOPOLIS
9
140
10
240
1-15
6
012
25
130
68.91 SUBDIVISION
12
6
19
25
9
4
7
7
130
31
4
17
140
130
024
2
300
030
2928
50
PB 1-7
20
67.5
7
(PARKING GARAGE)
25
17
13
1
17
36
2
24
035
019
7
40
9
SUBD
25
VAC
2016
0419
:225
5
134.6
25
25
I
7
31
130
13
25
5
19
0261
135
50
HAWKINS
005
15
10
R=10
FREMONT ST
4
LEASE
D2
140
3
15
9
8
3750
PT 139-34-701-001
2
82.3
15
19
15
8
9
TOWER
29
80
12
1
4
30
13
11 1650
16
16
27
175
20
12
14
7512
23
SEVE
NTH
ST
140
22
7
50
14
140
601
10
2
601
PB 1-15
013
VAC
2004
1216
:485
5
129.59
VAC
2016
0419
:225
5
16
3
601
PB87-35
26
5
1350
PB
16
PB 1-13
30
11
R=10
150
30
2
15
61.2
3
400
140
35
7
7
20
5
4
20
130
140.14
PT 139-34-111-064
PB 1-7
23
2
TENT
H ST
3
3
020
12
25
1
70
140
WARDIE ADD
23VAC
8809
15:1
024
9
20
20
9
2
50
133.5
14
10
140
6
(RETAIL AIR SPACE 2.75AC)
13
339.
93
19
17
4
7
9
022
R=10
11
25
12
NINT
H ST
30
28
25
19
31
150
27
10
STREET
23
140
37
9
7
80
8
3
3
FOUR
TH S
T
130
CARMEL
9
25
25
17
32
13
31
1139
15
17
80
BUCKS SUB8
034
80
033
16
016
PB 1-40
PM 119-72
ELEV
ENTH
ST
7
50
240
6
11
25
(RETAIL AIR SPACE)45
25
032
19
13
20
140
37
4
8
2
BLA
S VE
GAS
BLV
D
PB 1-7
8
5
13
19
400
084
9
50
70
PIONEER
3
PB 1-7
7
140
7
23
12
034300
601
5
80
8
25
17
289.93
039
13
17
25
35
2012
1
140
"A"
12
PT 139-34
80
1
-064
20
R=10
PT
601
8
17
25 514
5
12
80
50
9
PT 139-34-
14
70
7
300
25
701 32
210
9
125.
13
140
25
126.2
31
PT 1
6
13
15
9
701
FREMONT ST
029
TENT
H ST
7
5
80
EXPERIENCE
31
9
6
"A"
GRANDVIEW ADD
6
2
C
11
4
1
9
80
10
1
FAIRVIEW
1
50
19
22
60
14
11
100
25
130
VAC
853:
6850
94
PB 1-13
PB 1-35
12
50
140
120
3
8
32
50
008
601
32
2812
4.97
017
75
140
PB 1-7
140
224.
83
18
18
085
3
(PARKING GARAGE)
9
25
5
4
73.46
HGTS
379.
98
5
22
PB 139-45
22
PB 1-2
014
143.3
106
50
80
I
32
18
8
50
49.9
9
3
14
CARSON AVE
80
30
R=10
10
PT 139-
11
70
29
4
140
-612-010
1
R=10
20
1
29
4
130
BRIDGER AVE
140
18
25
16
VAC
9806
10:0
1045
16
15
27
70
15LEASE
12
7
16
140
400
80
100
140
25
4
510
25
17
29
150
15
28
12
21
100
1
4
PT 139-34-512-027
175
7
3
15
PT 12
PB 1-15
15
5
15
10
015
25
6
2005
0802
:710
37
140
140.49
610006
140
195
50
4
062
140
R=10
PB 1-40
BUCKS
12
29
5
11
20
ADD
8
4
4
3
189.
75
1
3
20
6
4
10
18
20
50
1
4
414
140
140.14
25
601
10
3
187.71
20
4
018
1
3
12
25
22
10
28
26
25
24
10
PT 139-34-601-001
15
25
85
132.04
"A"
23
70
22
VAC *
25
023
13
80
22
027
2
13
2024
390
STEWART AVE
10
30
25
29
75
EIG
HTH
ST
13
5
601R=10
FREMONT
28 1
200
25
8
PT 12
025
20
6
16
63.86
30
25
PB 1-37
24
8
17
50
6018
280
50
R=10
CONDOMINIUM
18
004
30
130
80
I
16
7
TRACT
5
037
10
NEONOPOLIS
17
250
11
50
036
130
11
50
3
14
031
14
26
12
3
14
25
9
24
601
083
6
625
4
140
EIG
HTH
ST
VAC
19
99.9
6
20
7
10
21
20
50
23
2
140
101
PT 1
140
26
23
9
140
25
R=10
12
8
27
601
50
8
STREAMLINE
10
4
601-001
400
1414
25
18
10
10
THE BUNKHOUSE
18
VAC 048:038243
14
8
6
10
15
038
PB 1-40
9
3
11
13
25
8
26
2
8
SIXT
H ST
3
32
1-15
VAC
2016
0419
:225
5
501
17
8
HAWKINS ADD
612
13
VAC
2003
0602
:195
2
50
50
PB 1-15
200
99.9
6
11
18
80
15
200
27
7
400
VAC 1249:1208178
PB 87-35
13
140
380
LAS
VEG
AS B
LVD
4
140
50
260.02
2
7
12
29
17
11
6
1
155
1
11
22
139.
99
5
8
1
21
034
31
PB 1-35
6
20
125.72
24
34-111
130
80
49.9
9
127
R=106
70
295
17
11
FOUR
TH S
T
25
PB
21
3
140140
7
136
19
VAC
9806
10:0
1045
140
25
20
26
140
18
25
16
31
1
10
140
006
10
021
701140
1
VAC
2018
0814
:301
1
200
150
2
5
400
400 VA
C 20
1808
14:3
011
1
VAC 20160419:2255
200
003
001
007011
005
002
057
007
027
025
0110.8
0060.3
0061.42
0140.69
0220.15
0150.52
0140.23
0130.69
0121.75
0101.51
0090.64
0082.75
0071.29
0040.48
0050.32
See Condo List Page
See Condo List Page
080
081
024
022
057064
063040 006
052
062
047048
085
026
056
084
055
031
015016
010
041040
036
028
051
023
022
027
026
036
034
033
032
031029
028
030041
040039
006007
008009
010
078
079
067
066
003
002
010
007008
016
053
052
044
043
042
049
047
048
050
022 055
023
045
061073
019
004
069002
036
046
049
122
027023 084028 006024
088085005
059 025060087
026 086061
011001038
062 001039
002063
037
007012003062 068
004
013 003042014
006043
044
009 045
046
017 064071063
035017 072
018034
081
018
033 050051
019 032 074
031 020020
021080 053
030030
021 054029
024
042 028024
027045
038046
037 025035
025
053
052
See Detail Pages for Air Pcls
026
NO
TES
This map is for assessment use only and does NOT represent a survey.
No liability is assumed for the accuracy of the data deliniated herein. Information on roads and other non-assessed parcels may be obtained from the Road Document Listing in the Assessor's Office.
This map is compiled from official records, including surveys and deeds, but only contains the information required for assessment. See the recorded documents for more detailed legal information.
MA
P LE
GE
ND
USE THIS SCALE(FEET) WHEN MAP REDUCED FROM 11X17 ORIGINAL
ASSESSOR'S PARCELS - CLARK CO., NV.
Scale: 1" = 200' 9/4/2018
T20S R61E 34 S 2 NE 4 139-34-6
31
30
19
1
1314
121110987
6 5 4 3 2
3635343332
29 28 27 26
24
25
23222120
18 17 16 15
BO
OK
SEC
.
MA
P
2
3
4
5
6
7
8
1
2
3
4
51
8
7
5
6
4 8
203
PARCEL BOUNDARYSUB BOUNDARY
ROAD EASEMENTPM/LD BOUNDARY
HISTORIC LOT LINEMATCH / LEADER LINE
ROAD PARCEL NUMBERPARCEL NUMERACREAGE
PARCEL SUB/SEQ NUMBER
PLAT RECORDING NUMBERBLOCK NUMBERLOT NUMBERGOV. LOT NUMBER
10010011.00
202PB 24-45
55
GL5
HISTORIC SUB BOUNDARYHISTORIC PM/LD BOUNDARY
15
8 4
Rev:
TAX DIST
0 200 400 600 800100 SECTION LINE
CONDOMINIUM UNITAIR SPACE PCLRIGHT OF WAY PCLSUB-SURFACE PCL
139
162 161
140138
163
124 123125
177 178176
Michele W. Shafe - Assessor
OFFERING MEMORANDUM | THE BARGAIN MOTEL 200 S. 8th Street | Las Vegas, Nevada 89101
AERIAL MAP - FACING WEST
Las Vegas Academy of the Arts Performing Arts
Center
Federal Justice Tower
Federal Courthouse/U.S. Law Library
Regional Justice Center
Clark County Courthouse
Tesla Supercharger
Virtus Residential
Golden Nugget
U.S. Bankruptcy Court,District of Nevada
Park Avenue Apartments
Container Park
S. 6TH ST.
E. CAR
SON
AVE.
S. 8TH ST.
OFFERING MEMORANDUM | THE BARGAIN MOTEL 200 S. 8th Street | Las Vegas, Nevada 89101
AERIAL MAP - FACING NORTHWEST
Downtown Las VegasEvents Center
U.S. Postal Service City Center MotelEl CortezThe Ogden
The Market (Grocery Store)
City Center Apartments
Container Park
Park Avenue Apartments
Southern Nevada Museum of Fine Art
Freemont Street Experience
Virtus Residential
E. CARSON AVE. Life is Beautiful SiteMusic & Arts Festival
S. 8TH ST.
OFFERING MEMORANDUM | THE BARGAIN MOTEL 200 S. 8th Street | Las Vegas, Nevada 89101
AREA DEMOGRAPHICS (1 MILE RADIUS)Demographic and Income Profile200 S 8th St, Las Vegas, Nevada, 89101 Prepared by EsriRing: 1 mile radius Latitude: 36.16636
Longitude: -115.13814
Summary Census 2010 2018 2023Population 24,147 25,409 26,950Households 9,007 9,569 10,384Families 3,539 3,618 3,820Average Household Size 2.20 2.18 2.16Owner Occupied Housing Units 1,707 1,579 1,771Renter Occupied Housing Units 7,300 7,991 8,612Median Age 39.1 40.7 41.4
Trends: 2018 - 2023 Annual Rate Area State NationalPopulation 1.18% 1.59% 0.83%Households 1.65% 1.48% 0.79%Families 1.09% 1.44% 0.71%Owner HHs 2.32% 2.06% 1.16%Median Household Income 2.48% 2.45% 2.50%
2018 2023 Households by Income Number Percent Number Percent
OFFERING MEMORANDUM | THE BARGAIN MOTEL 200 S. 8th Street | Las Vegas, Nevada 89101
AREA DEMOGRAPHICS (3 MILE RADIUS)Demographic and Income Profile200 S 8th St, Las Vegas, Nevada, 89101 Prepared by EsriRing: 3 mile radius Latitude: 36.16636
Longitude: -115.13814
Summary Census 2010 2018 2023Population 186,861 196,409 207,155Households 62,848 64,985 68,571Families 36,548 37,157 38,875Average Household Size 2.84 2.88 2.88Owner Occupied Housing Units 23,175 21,740 23,705Renter Occupied Housing Units 39,673 43,246 44,866Median Age 33.5 34.5 35.2
Trends: 2018 - 2023 Annual Rate Area State NationalPopulation 1.07% 1.59% 0.83%Households 1.08% 1.48% 0.79%Families 0.91% 1.44% 0.71%Owner HHs 1.75% 2.06% 1.16%Median Household Income 2.47% 2.45% 2.50%
2018 2023 Households by Income Number Percent Number Percent
OFFERING MEMORANDUM | THE BARGAIN MOTEL 200 S. 8th Street | Las Vegas, Nevada 89101
AREA DEMOGRAPHICS (5 MILE RADIUS)Demographic and Income Profile200 S 8th St, Las Vegas, Nevada, 89101 Prepared by EsriRing: 5 mile radius Latitude: 36.16636
Longitude: -115.13814
Summary Census 2010 2018 2023Population 509,154 541,040 574,471Households 174,320 181,503 192,040Families 106,401 109,644 115,486Average Household Size 2.86 2.92 2.93Owner Occupied Housing Units 69,331 65,642 71,882Renter Occupied Housing Units 104,989 115,861 120,158Median Age 32.8 33.7 34.3
Trends: 2018 - 2023 Annual Rate Area State NationalPopulation 1.21% 1.59% 0.83%Households 1.14% 1.48% 0.79%Families 1.04% 1.44% 0.71%Owner HHs 1.83% 2.06% 1.16%Median Household Income 2.23% 2.45% 2.50%
2018 2023 Households by Income Number Percent Number Percent