36
665 E OLIVE AVE Sunnyvale, CA Offering Memorandum
| Date post: | 24-Apr-2018 |
| Category: |
Documents |
| Upload: | hoangtuyen |
| View: | 214 times |
| Download: | 1 times |

665 E OLIVE AVESunnyvale, CA
Offering Memorandum

N O N - E N D O R S E M E N T A N D D I S C L A I M E R N O T I C E
Confidentiality and DisclaimerThe information contained in the following Marketing Brochure is proprietary and strictly confidential. It is intended to be reviewed only by the party receiving it from Marcus & Millichap and should not be made available to any other person or entity without the written consent of Marcus & Millichap. This Marketing Brochure has been prepared to provide summary, unverified information to prospective purchasers, and to establish only a preliminary level of interest in the subject property. The information contained herein is not a substitute for a thorough due diligence investigation. Marcus & Millichap has not made any investigation, and makes no warranty or representation, with respect to the income or expenses for the subject property, the future projected financial performance of the property, the size and square footage of the property and improvements, the presence or absence of contaminating substances, PCB's or asbestos, the compliance with State and Federal regulations, the physical condition of the improvements thereon, or the financial condition or business prospects of any tenant, or any tenant's plans or intentions to continue its occupancy of the subject property. The information contained in this Marketing Brochure has been obtained from sources we believe to be reliable; however, Marcus & Millichap has not verified, and will not verify, any of the information contained herein, nor has Marcus & Millichap conducted any investigation regarding these matters and makes no warranty or representation whatsoever regarding the accuracy or completeness of the information provided. All potential buyers must take appropriate measures to verify all of the information set forth herein. Marcus & Millichap is a service mark of Marcus & Millichap Real Estate Investment Services, Inc. © 2016 Marcus & Millichap. All rights reserved.
Non-Endorsement NoticeMarcus & Millichap is not affiliated with, sponsored by, or endorsed by any commercial tenant or lessee identified in this marketing package. The presence of any corporation's logo or name is not intended to indicate or imply affiliation with, or sponsorship or endorsement by, said corporation of Marcus & Millichap, its affiliates or subsidiaries, or any agent, product, service, or commercial listing of Marcus & Millichap, and is solely included for the purpose of providing tenant lessee information about this listing to prospective customers.
ALL PROPERTY SHOWINGS ARE BY APPOINTMENT ONLY.PLEASE CONSULT YOUR MARCUS & MILLICHAP AGENT FOR MORE DETAILS.
665 E OLIVE AVESunnyvale, CAACT ID X0010598

P R E S E N T E D B Y
Nathan Gustavson
Associate Vice President InvestmentsDirector, National Multi Housing GroupPalo Alto OfficeTel: (650) 391-1700Fax: (650) [email protected]: CA 01898316

TABLE OF CONTENTS
SECTION
INVESTMENT OVERVIEW 01 Offering Summary Regional Map Local Map
Aerial Photo
FINANCIAL ANALYSIS 02 Rent Roll Summary
Rent Roll Detail
Operating Statement
Notes
Pricing Detail
Acquisition Financing
Growth Rate Projections
Cash Flow
MARKET OVERVIEW 03 Market Analysis
Demographic Analysis
665 E OLIVE AVE

665 E OLIVE AVE
5
INVESTMENT
OVERVIEW

665 E OLIVE AVE
#
EXECUTIVE SUMMARY
OFFERING SUMMARY
MAJOR EMPLOYERS
EMPLOYER # OF EMPLOYEES
Juniper Networks (us) Inc 9,000
Cisco Systems 8,741
Brep IV Hotels Holding LLC 7,186
McAfee Security LLC 6,210
Cypress Semiconductor Intl 5,000
General Dynamics Adv Info Sys 4,000
Agilent Technologies Inc 3,552
HP 3,016
Lockheed Martin Corporation 3,001
Seagate 3,000
Juniper Networks Inc 2,300
Apple 2,134
DEMOGRAPHICS
1-Miles 3-Miles 5-Miles
2015 Estimate Pop 32,522 222,058 482,011
2010 Census Pop 28,613 205,780 448,656
2015 Estimate HH 13,531 85,261 183,781
2010 Census HH 11,790 78,350 169,567
Median HH Income $97,891 $101,028 $102,860
Per Capita Income $53,997 $51,416 $53,449
Average HH Income $129,549 $133,692 $139,795
UNIT MIX
NUMBEROF UNITS UNIT TYPE APPROX.
SQUARE FEET
1 3 Bedroom 2 Bathroom 1,200
1 3 Bedroom 2 Bathroom 1,250
1 2 Bedroom 1 Bathroom 700
1 1 Bedroom 1 Bathroom 600
4 Total 3,750
VITAL DATA
Price $1,990,000 CURRENT
Down Payment 100% / $1,990,000 CAP Rate 4.60%
Loan Type All Cash GRM 16.34
Price/Unit $497,500 Net Operating Income $91,623
Price/SF $530.67
Number of Units 4
Rentable Square Feet 3,750
Year Built 1967
Lot Size 0.18 acre(s)
6

665 E OLIVE AVE
#
OFFERING SUMMARY
§ Desirable Unit Mix
§ Close proximity to downtown Sunnyvale
§ Easy access to highways 280, 101, 237 and 85
INVESTMENT HIGHLIGHTS
The subject property is located on 665 East Olive Avenue, Sunnyvale, CA
INVESTMENT OVERVIEW
7

665 E OLIVE AVE
PROPERTY SUMMARY
OFFERING SUMMARY
THE OFFERING
Price $1,990,000
Property Address 665 E Olive Ave,Sunnyvale,CA
8
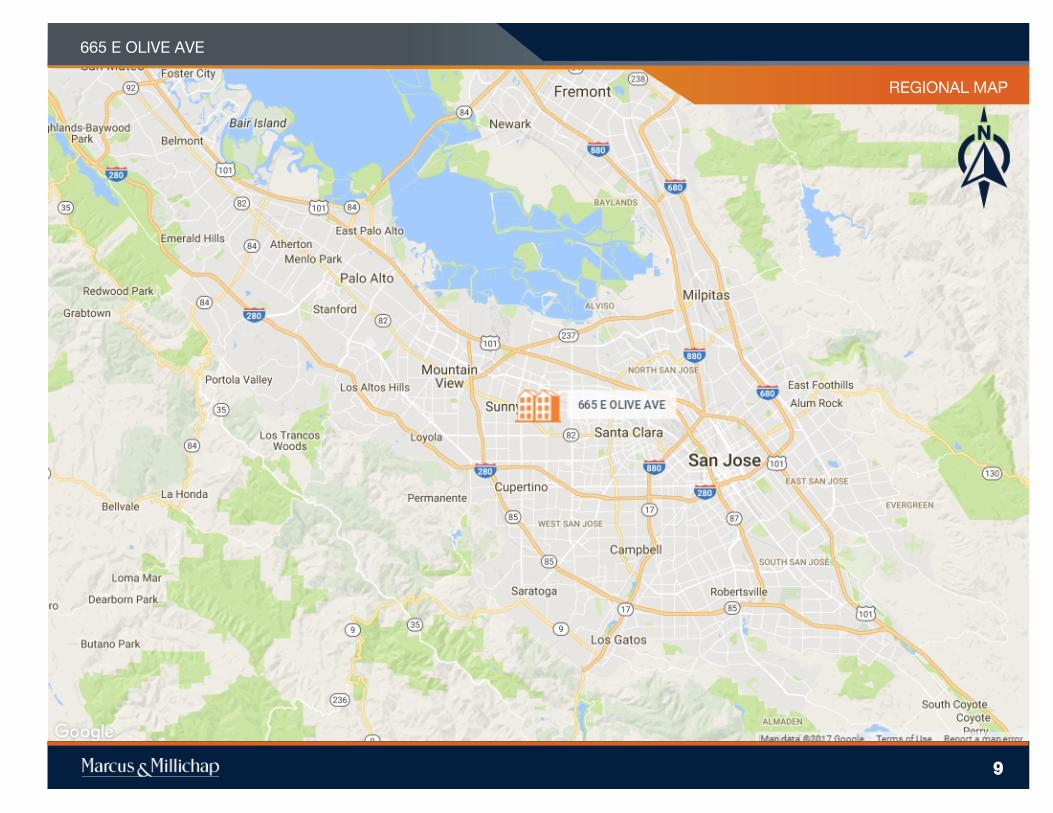
REGIONAL MAP
665 E OLIVE AVE
9

LOCAL MAP
665 E OLIVE AVE
10

AERIAL PHOTO
665 E OLIVE AVE
11

665 E OLIVE AVE
12
FINANCIAL
ANALYSIS

FINANCIAL ANALYSIS
665 E OLIVE AVE
RENT ROLL SUMMARY
13

FINANCIAL ANALYSIS
665 E OLIVE AVE
14
RENT ROLL DETAIL

FINANCIAL ANALYSIS
665 E OLIVE AVE
OPERATING STATEMENT
15

FINANCIAL ANALYSIS
665 E OLIVE AVE
NOTES
16

FINANCIAL ANALYSIS
665 E OLIVE AVE
PRICING DETAIL
17

MARCUS & MILLICHAP CAPITAL CORPORATION CAPABILITIESMMCC—our fully integrated, dedicated financing arm—is committed to providing superior capital market expertise, precisely managed execution, and unparalleled access to capital sources providing the most competitive rates and terms.
We leverage our prominent capital market relationships with commercial banks, life insurance companies, CMBS, private and public debt/equity funds, Fannie Mae, Freddie Mac and HUD to provide our clients with the greatest range of financing options.
Our dedicated, knowledgeable experts understand the challenges of financingand work tirelessly to resolve all potential issues to the benefit of our clients.
National platform operating
within the firm’s brokerage offices
$4.9 billion total national
volume in 2015
Access to more capital sources than any other firm in the industry
Optimum financing solutions to enhance value
Our ability to enhance buyer pool by expanding finance options
Our ability to enhance seller control
• Through buyer qualification support
• Our ability to manage buyers finance expectations
• Ability to monitor and manage buyer/lender progress, insuring timely, predictable closings
• By relying on a world class set of debt/equity sources and presenting a tightly underwritten credit file
WHY MMCC?
Closed 1,601 debt and equity
financings in 2015
ACQUISITION FINANCING
665 E OLIVE AVE
18

FINANCIAL ANALYSIS
665 E OLIVE AVE
GROWTH RATE PROJECTIONS
19

FINANCIAL ANALYSIS
665 E OLIVE AVE
CASH FLOW
20

665 E OLIVE AVE
21
MARKET
OVERVIEW

MARKET OVERVIEW
665 E OLIVE AVE
San Jose-Sunnyvale-Santa Clara Metro
Market Highlights
Premier high-tech center
§ Silicon Valley’s dense concentration of high-tech jobs is world renowned.
High incomes
§ San Jose’s 2015 median yearly household income was nearly $50,000 higher than the U.S. median.
Highly educated workforce
§ More than 45 percent of residents have at least a bachelor's degree, well above the U.S. average.
SAN JOSE
The San Jose-Sunnyvale-Santa Clara metro is located at the southern end of the San Francisco Bay and
encompasses Santa Clara County. The Santa Clara Valley runs the entire length of the county, flanked by
the rolling hills of the Diablo Range on the east and the Santa Cruz Mountains on the west. Salt marshes
and wetlands lie to the northwest, adjacent to the San Francisco Bay. A large portion of the county’s
1,315 square miles is unincorporated ranch and farmland.
Geography
22

MARKET OVERVIEW
San Jose is serviced by extensive freeway, expressway and rail systems. Amtrak and Caltrain offer passenger and
commuter rail service to San Francisco and Sacramento. The Altamont Commuter Express operates commuter rail
to Pleasanton and Stockton, while the Santa Clara Valley Transit Authority (VTA) runs local light rail. There are
more than 50 light-rail stations through which passengers can connect to VTA bus service or Caltrain.
The area is directly served by the Norman Y. Mineta San Jose International Airport and three general aviation
facilities: Reid-Hillview, Palo Alto and South County. Additional air service is available at San Francisco
International and Oakland International airports, each fewer than 40 miles away.
Infrastructure
The San Jose Metro is:§ 45 miles from San Francisco§ 120 miles from Sacramento§ 340 miles from Los Angeles§ 690 miles from Portland
Airports§ Norman Y. Mineta San Jose International§ General Aviation – Reid-Hillview, Palo Alto and
South County
Major Roadways§ Interstates 280, 680 and 880§ San Tomas, Montague and Capitol expressways§ State Routes 17, 82, 85, 87, 130 and 237
Rail§ Passenger – Amtrak§ Commuter – Caltrain and ACE§ Light rail – VTA
The San Jose metro contains more than 1.9 million inhabitants in 15 cities. More than half of the county’s
residents are in the city of San Jose. It is the metro’s largest city with 1,005,300 residents, followed by Sunnyvale
and Santa Clara. An annual population growth rate of 0.9 percent is projected over the next five years for the
county.
Metro
Largest Cities in Metro by PopulationSan Jose 1,005,300
Sunnyvale 148,900
Santa Clara 124,000
Mountain View 79,600
Milpitas 70,700
Palo Alto 69,100
* ForecastSources: Marcus & Millichap Research Services; U.S. Census Bureau; Experian
SAN JOSE
665 E OLIVE AVE
23

MARKET OVERVIEW
After six years of strong gains, the San Jose Gross Metro Product (GMP) is
estimated to grow by approximately 2 percent this year, slightly below the
national rate. Retail sales are expected to increase by nearly 3.9 percent during
this period, also below the U.S. level.
Silicon Valley, the world’s premier high-technology hub, was fueled by venture
capital funds received in the 1990s. Today, there are 14 Fortune 500 companies
headquartered in San Jose. These include Intel, Cisco Systems, Apple Inc. and
Google Inc. The health of the high-tech industry remains crucial to San Jose’s
economic landscape. Future growth in this industry will bode well for the local
economy.
The number of businesses that support the high-tech industry has increased,
driving professional and business services to become the largest local
employment sector. The area’s many colleges and universities, including
Stanford, San Jose State and Santa Clara, support these companies by
graduating thousands of engineering and computer science students into the
local workforce.
Economy
* ForecastSources: Marcus & Millichap Research Services; Bureau of Economic Analysis; Moody's Analytics; U.S. Census Bureau; Fortune
SAN JOSE
665 E OLIVE AVE
24
MARKET OVERVIEW
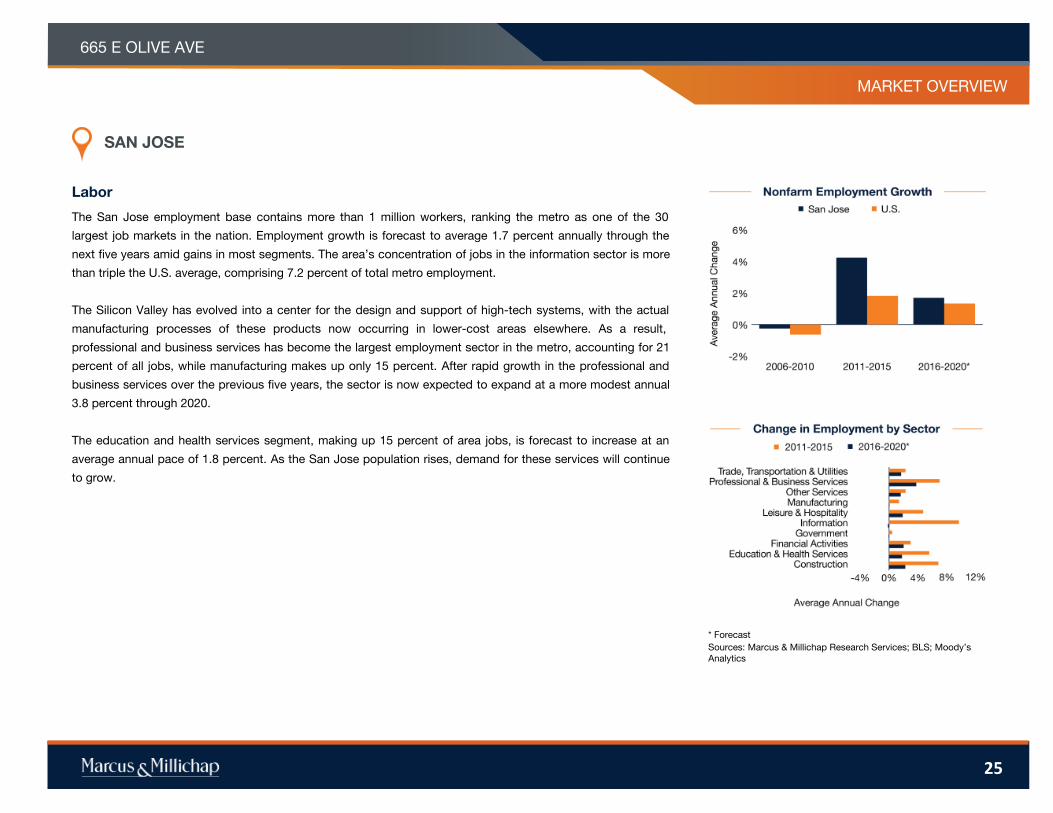
The San Jose employment base contains more than 1 million workers, ranking the metro as one of the 30
largest job markets in the nation. Employment growth is forecast to average 1.7 percent annually through the
next five years amid gains in most segments. The area’s concentration of jobs in the information sector is more
than triple the U.S. average, comprising 7.2 percent of total metro employment.
The Silicon Valley has evolved into a center for the design and support of high-tech systems, with the actual
manufacturing processes of these products now occurring in lower-cost areas elsewhere. As a result,
professional and business services has become the largest employment sector in the metro, accounting for 21
percent of all jobs, while manufacturing makes up only 15 percent. After rapid growth in the professional and
business services over the previous five years, the sector is now expected to expand at a more modest annual
3.8 percent through 2020.
The education and health services segment, making up 15 percent of area jobs, is forecast to increase at an
average annual pace of 1.8 percent. As the San Jose population rises, demand for these services will continue
to grow.
Labor
* ForecastSources: Marcus & Millichap Research Services; BLS; Moody’s Analytics
SAN JOSE
665 E OLIVE AVE
25

MARKET OVERVIEW
Large employers in the San Jose metro include high-tech industry giants Cisco Systems, Apple, eBay, Google and Hewlett-Packard. Many of these large-scale employers
are among the top places to work.
Not all of the area’s job providers are large corporations. More than 60 percent of companies in San Jose have fewer than five workers. Many of these are small startups or
businesses that provide support services to the growing tech industry.
With the return of venture capital flowing into the metro economy, San Jose offers some of the most exciting employment opportunities that the tech world has to offer.
Some of today’s startups will likely become tomorrow’s key players in the industry, a trend that has fostered a lively enterprise culture.
Other major employers are the numerous institutions of higher education that are located in Santa Clara County, including San Jose State University, Stanford and Santa
Clara State University. Tens of thousands of jobs are created by these academic institutions.
Employers
Major EmployersCisco Systems
County of Santa Clara
Kaiser Permanente Northern California
Hewlett-Packard Co.
City of San Jose
IBM
eBay
Xilinx
San Jose State University
Apple
* ForecastSources: Marcus & Millichap Research Services; BLS; Moody's Analytics; Experian
SAN JOSE
665 E OLIVE AVE
26

MARKET OVERVIEW
The San Jose metro has more than 1.9 million residents. Population growth is expected to be 0.9 percent annually through the coming five years, slightly outpacing national
growth projections.
The residents of the metro are highly educated, with more than 45 percent of adults 25 and older having obtained at least a bachelor’s degree. This level of education
attainment is drastically higher than the U.S. average of 28.8 percent. Furthermore, more than 20 percent of all residents have completed a degree at the graduate or
professional level. These figures hold positive implications for the local economy, as college-educated workers typically earn more than their non-college-educated
counterparts.
Growth in the share of affluent households in the metro provides striking evidence of the advantages of higher education. In 2015, 27 percent of households earned at least
$150,000; this rate will continue to expand over the next five years.
The median household income remains high at $102,800 annually, far above the U.S. median of $56,100 per year. The local median household income will increase at an
annual pace of 5 percent through 2020. Even though incomes are above the national average, high home prices make housing affordability difficult for many residents,
sustaining demand for rental housing.
Demographics
SAN JOSE
* ForecastSources: Marcus & Millichap Research Services; AGS; Experian; Moody's Analytics; U.S. Census Bureau
665 E OLIVE AVE
27

MARKET OVERVIEW
The San Jose metro has an enviable combination of major universities that produce a highly educated workforce, cutting-edge firms and exceptional affluence. The metro
enjoys a Mediterranean climate and a lifestyle considered fast-paced yet “California casual.”
Residents can visit a plethora of museums including the San Jose Museum of Art, Children’s Discovery Museum of San Jose, Rosicrucian Egyptian Museum and the Tech
Museum of Innovation.
Santa Clara County is home to many performing arts companies, such as the Symphony Silicon Valley, Ballet San Jose Silicon Valley, Opera San Jose and the Children’s
Musical Theater of San Jose. The city also hosts the annual Cinequest Film Festival and the San Jose Jazz Festival.
The San Francisco 49ers play their home games at Levi’s Stadium and the San Jose Sharks hockey team plays at the SAP Center. Other sports venues include the San
Jose Municipal Stadium and Buck Shaw Stadium.
Santa Clara County has an extensive park system that includes Henry W. Coe State Park, Almaden Quicksilver County Park and Vasona Park. San Jose’s ideal location is
only minutes away from San Francisco and some of the world’s finest wine-producing regions, notably the Napa, Sonoma and Alexander valleys.
* ForecastSources: Marcus & Millichap Research Services; National Association of Realtors®; Moody's Analytics; U.S. Census Bureau
Quality of Life
SAN JOSE
665 E OLIVE AVE
28

MARKET OVERVIEW
2016 Multifamily Forecast
Construction: Developers will increase the pace of completions this year, finishing 5,900 apartments with a primary emphasis on the South San Jose and North San Jose/Milpitas submarkets. Last year, construction firms placed 3,470 units in service.
Vacancy: The metrowide vacancy rate will rise 60 basis points this year to 4 percent as development outpaces demand for apartments. The vacancy rate dipped 10 basis points in the prior year as supply and demand were roughly in balance.
Rents: Rent growth will slow in 2016 as development surges, prompting a 0.2 percent climb in the average asking rent to $2,478 per month. This follows a 7.9 percent growth rate in the prior yearlong period.
Employment: In 2016, San Jose organizations will hire 35,000 new workers, expanding payrolls by 3.3 percent as office-using firms add to staffs. Last year, 42,500 people found work, a 4.2 percent expansion driven by education and professional services.
665 E OLIVE AVE
29
Investors Show Long-Term Optimism as Development Rises
3.3%increasein total employment
unitswill be completed
5,900
basis pointincrease in vacancy
60
0.2%increasein effective rents
SAN JOSE METRO AREA
Expanding labor market supporting household formation; robust deliveries beginning to
affect operations. San Jose is experiencing tremendous growth well in excess of the national
average. A vibrant startup scene, combined with multiple large corporations, is supporting outsize
growth in both payrolls and wages, creating demand for local housing. In an effort to meet this
housing need, developers have ramped up the pace of construction to a multidecade high. The
quick pace of supply growth has had a broad impact on operations, particularly in the Class A
segment, which has seen vacancy tick up in key submarkets as tenant optionality improved.
However, more affordable alternatives have remained tremendously resilient. While vacancy will
continue to trend higher through 2017 as supply comes online, the longer-term supply and
demand picture remains incredibly supportive. The rise in vacancy will cause a slowdown in the
growth rate of rents, which will remain largely unchanged metrowide in 2016.
Supply growth not halting price appreciation; investors stay focused on quality assets near
corporate campuses. Bolstered by the low interest rate environment, investors of all sizes are
deploying capital for San Jose metro assets. Although the pace of supply injections is beginning
to push vacancy rates higher, the level remains extremely tight, supporting a long-term view of
multifamily assets in the market. The majority of metro participants have transitioned their outlays
toward Class C properties, which remain insulated from supply pressures at the higher end of the
market. Cap rates remain in the mid- to high-4 percent range, with an additional 50 basis points in
either direction possible based on quality and location. Offerings near corporate campuses and
transportation routes will remain well sought after, while properties in need of significant
improvement have seen a widening spread between buyers and sellers as operations have
become less certain. The resulting environment will create opportunities for buyers wishing to
purchase assets for the long term and current holders wishing to exit.

MARKET OVERVIEW
Economy
Housing and Demographics
** Trailing 12 months through 3QSources: Marcus & Millichap Research Services; Economy.com; NAR
* ForecastSources: Marcus & Millichap Research Services; Bureau of Labor Statistics; Economy.com
665 E OLIVE AVE
30
SAN JOSE METRO AREA
§ The planning pipeline is shrinking as the pace of deliveries has accelerated. Multifamily permitting is
down nearly 30 percent over the past year. Meanwhile, single-family home permits rose by roughly the
same amount, indicating that builders are ramping up construction.
§ During the last 12 months, the median household income rose 4.5 percent to more than $105,000 per
year. Over the same period, single-family home prices surged 7.7 percent to more than $1.03 million
on average.
§ After accounting for a down payment, taxes and insurance, the average mortgage payment is more than
$5,000 per month. Meanwhile, the average apartment rent is $2,477 per month, indicating a substantial
gap in affordability. The minimum qualifying income for a mortgage is above $223,000 per year, more
than double the metro average.
§ Outlook: The lack of ability among most residents to purchase a single-family home will prompt
significant absorption of apartments, particularly in well-located neighborhoods near
corporate campuses.
§ During the first three quarters of 2016, local organizations created 35,300 positions, bringing job growth
over the past year to 3.4 percent. This represents a modest slowdown from the prior year, when 39,800
workers were hired, a 3.9 percent climb.
§ Although the pace of job creation is slowing, the composition of new staffers has remained excellent,
with high-paying office-using companies making up the bulk of recent additions. The professional and
business services sector provided 17,500 jobs over the past year, while 3,200 information sector
workers were hired.
§ Labor market improvement has had a substantial effect on the unemployment rate, which fell to 3.9
percent at the end of the second quarter, down 20 basis points from the prior year.
§ Outlook: A broad employment base will foster the creation of 35,000 jobs this year, a 3.3 percent rise
in employment.

MARKET OVERVIEW
Construction
Vacancy
* ForecastSources: Marcus & Millichap Research Services; MPF Research
* ForecastSources: Marcus & Millichap Research Services; MPF Research
665 E OLIVE AVE
SAN JOSE METRO AREA
31
§ Over the past year ending in September, the metro vacancy rate rose 120 basis points to 3.7 percent as
deliveries far exceeded net absorption. In the prior four quarters, vacancy ticked up 20 basis points.
§ Significant development in the South San Jose submarket did little to overall vacancy trends as tenants
sought affordability, with vacancy advancing 30 basis points to 2.6 percent by the end of the third quarter.
Central San Jose, despite receiving less than 250 new units, posted a 230-basis-point rise in vacancy to
4.7 percent.
§ Limited development in East San Jose contributed to the tightest vacancy rate of any metro submarket. The
area registered a 60-basis-point rise in vacancy to 1.4 percent. Class C vacancy ended the third quarter at
1.0 percent, while the highest vacancy was 3.6 percent in Class A properties.
§ Outlook: One of the largest supply increases of the current cycle will trigger a 60-basis-point rise in the metro
vacancy rate to 4 percent. This follows a 10-basis-point decline in the previous year.
§ Developers have completed nearly 3,200 apartments during the first three quarters of 2016, bringing
deliveries over the past year to 4,700 units. The bulk of new supply has come online in the South San
Jose submarket, with more than 1,350 brought to market already this year.
§ Multifamily development will remain robust in 2017, with more than 3,500 units slated for delivery
targeting a wide array of submarkets. The Irvine Co.’s Monticello, a 825-unit project in Santa Clara, will
highlight deliveries.
§ Planned completions for the remainder of the year will target the Central San Jose and North San
Jose/Milpitas submarkets, with deliveries reaching 716 units and 958 apartments, respectively.
§ Outlook: Developers will complete 5,900 rentals this year, focusing primarily on neighborhoods in Santa
Clara. In 2015, builders delivered 3,500 new units.

MARKET OVERVIEW
Rents
Sales Trends
** Trailing 12 months through 3QSources: Marcus & Millichap Research Services; CoStar Group, Inc.; Real Capital Analytics
* ForecastSources: Marcus & Millichap Research Services; MPF Research
665 E OLIVE AVE
SAN JOSE METRO AREA
32
§ Investors are showing little sign of slowing allocations to the metro as development rises due to the lack
of available land. Trading volume was roughly in line with the prior year, while dollar volume soared past
$2 billion in closed transactions.
§ The average price per unit paid over the past four quarters was in the high-$200,000 to low-$300,000
range. Properties in Palo Alto, Sunnyvale and Mountain View exchanged ownership well above
average prices.
§ The average first-year return has remained in the mid-4 percent band, extending into the low-4 percent
range for institutional trades. The majority of closed sales will price in the mid- to high-4 percent
return spectrum.
§ Outlook: While investors will continually monitor planned completions in the metro, the dynamic labor
market and lack of affordable single-family homes is likely to drive long-term apartment investors to
deploy capital in the metro. Well-located properties near transportation routes remain in high demand.
§ During the last four quarters, the average effective rent declined 1.4 percent to $2,477 per month as the
robust pace of construction overwhelmed still-strong demand for rentals. An incredible 10.7 percent
surge was recorded in the prior year.
§ Bucking the broader slowdown in rent growth, the Central San Jose submarket posted a 4.9 percent
advancement in marketed pricing to $2,462 per month. Class A rent increases, more than 20 percent
over the past year, offset relative declines in Class B and C product.
§ The South Sunnyvale/Cupertino and Mountain View/Palo Alto/Los Altos recorded the biggest drop in
effective rents, which slid 3.3 percent to $2,826 per month and 2.6 percent to $2,916 per month. Class
C apartments, however, recorded gains, as Class B and A product declined or remained unchanged.
§ Outlook: The average effective rent will tread water in 2016, rising 0.2 percent to $2,478 per month. Last
year, the average effective rent soared 7.9 percent over the course of the four-quarter period.

MARKET OVERVIEW
Capital Markets
Local Highlights
665 E OLIVE AVE
33
§ The initial reading of third quarter GDP of 2.9 percent and consistent growth in employment are fanning expectations that the Federal Reserve will raise its
benchmark short-term lending rate at its December meeting. Other economic data showing steady improvement in the housing market and the stabilization of oil
prices around $50 per barrel offer signals that the U.S. economy is growing at a sustainable pace.
§ Increasing rental housing demand underpinned a decline in the U.S. apartment vacancy rate of 60 basis points to 3.5 percent year to date through the third quarter,
the lowest level this cycle. Apartment builders have responded to growing demand and favorable demographic trends by ramping up construction. Completions will
rise to 320,000 units this year and peak in 2017.
§ Capital markets remain highly competitive, offering an assortment of fixed-rate products available through commercial banks, life-insurance companies, CMBS and
agency lenders. Fannie Mae and Freddie Mac are underwriting loans of 10 years at maximum leverage of 80 percent. Rates will typically reside in the high-3 to low-4
percent range, depending on underwriting criteria. Portfolio lenders will also price in this vicinity but will typically require loan-to-value ratios in the 65 to 75 percent
band. Floating-rate bridge loans and financing for asset repositioning are typically underwritten with LTVs 70 to 75 percent of stabilized value (80 to 85 percent of
cost) and price 300 basis points above Libor for recourse deals and extending to 450 basis points above Libor for non-recourse transactions.
§ Related Cos. has received approval for a $6.5 billion project that will be known as City Place in Santa Clara. The 9.7 million-square-foot City Place is the largest
private construction deal ever in Silicon Valley, with plans calling for between 200 and 1,680 apartments, 5.7 million square feet of offices, 1.1 million square feet of
retail space and 700 hotel rooms surrounding a 35-acre park.
§ The Irvine Co. has acquired several buildings in the Peery Park neighborhood as it seeks to revamp the area into a mixed-use project. Filed plans would see the
current industrial buildings razed to make room for roughly 2 million square feet of office space, 200,000 square feet of retail floor plates and 215 residential units.
§ The Irvine Co. is also constructing the largest expected apartment completion for 2016, with River View II slated for a fourth-quarter delivery of 958 units at 250
Brandon St. in San Jose. The site will contain a clubroom, five Junior Olympic-size pools, a wine room with kitchen and dining area, and two resort-style
fitness centers.
SAN JOSE METRO AREA

PROPERTY NAME
MARKETING TEAM
665 E OLIVE AVE
DEMOGRAPHICS
Source: © 2016 Experian
Created on January 2017
POPULATION 1 Miles 3 Miles 5 Miles§ 2020 Projection
Total Population 33,556 226,319 493,926
§ 2015 Estimate
Total Population 32,522 222,058 482,011
§ 2010 Census
Total Population 28,613 205,780 448,656
§ 2000 Census
Total Population 25,980 192,141 415,907
§ Daytime Population
2015 Estimate 25,184 213,623 627,744
HOUSEHOLDS 1 Miles 3 Miles 5 Miles§ 2020 Projection
Total Households 13,870 86,637 187,823
§ 2015 Estimate
Total Households 13,531 85,261 183,781
Average (Mean) Household Size 2.42 2.58 2.58
§ 2010 Census
Total Households 11,790 78,350 169,567
§ 2000 Census
Total Households 11,545 76,384 162,552
Growth 2015-2020 2.51% 1.61% 2.20%
HOUSING UNITS 1 Miles 3 Miles 5 Miles§ Occupied Units
2020 Projection 13,870 86,637 187,823
2015 Estimate 13,679 85,832 184,959
Owner Occupied 4,301 39,585 89,703
Renter Occupied 9,230 45,676 94,078
Vacant 147 571 1,178
§ Persons In Units
2015 Estimate Total Occupied Units 13,531 85,261 183,781
1 Person Units 29.46% 25.71% 25.95%
2 Person Units 31.39% 30.81% 30.48%
3 Person Units 18.96% 19.03% 18.40%
4 Person Units 13.07% 15.43% 16.15%
5 Person Units 4.21% 5.22% 5.38%
6+ Person Units 2.91% 3.80% 3.65%
HOUSEHOLDS BY INCOME 1 Miles 3 Miles 5 Miles§ 2015 Estimate
$200,000 or More 13.67% 14.78% 16.62%
$150,000 - $199,000 11.92% 11.86% 12.31%
$100,000 - $149,000 23.21% 23.92% 22.58%
$75,000 - $99,999 13.87% 12.57% 11.46%
$50,000 - $74,999 11.17% 12.42% 12.31%
$35,000 - $49,999 7.58% 7.95% 7.93%
$25,000 - $34,999 5.92% 5.36% 5.16%
$15,000 - $24,999 5.47% 5.32% 5.52%
Under $15,000 7.20% 5.79% 6.11%
Average Household Income $129,549 $133,692 $139,795
Median Household Income $97,891 $101,028 $102,860
Per Capita Income $53,997 $51,416 $53,449
POPULATION PROFILE 1 Miles 3 Miles 5 Miles§ Population By Age
2015 Estimate Total Population 32,522 222,058 482,011
Under 20 22.75% 24.31% 24.64%
20 to 34 Years 28.50% 22.90% 21.72%
35 to 39 Years 10.89% 9.45% 8.68%
40 to 49 Years 13.75% 14.96% 15.54%
50 to 64 Years 14.00% 16.83% 17.53%
Age 65+ 10.10% 11.55% 11.92%
Median Age 34.52 36.42 37.07
§ Population 25+ by Education Level
2015 Estimate Population Age 25+ 23,494 157,275 337,768
Elementary (0-8) 3.03% 3.17% 2.62%
Some High School (9-11) 2.56% 3.31% 3.25%
High School Graduate (12) 9.26% 12.21% 11.88%
Some College (13-15) 14.29% 15.24% 15.00%
Associate Degree Only 4.66% 6.24% 6.10%
Bachelors Degree Only 32.74% 30.45% 30.42%
Graduate Degree 32.50% 28.56% 29.84%
§ Population by Gender
2015 Estimate Total Population 32,522 222,058 482,011
Male Population 51.63% 50.38% 50.26%
Female Population 48.37% 49.62% 49.74%
34

IncomeIn 2016, the median household income for your selected geography is $97,891, compare this to the US average which is currently . The median household income for your area has changed by 33.31% since 2000. It is estimated that the median household income in your area will be $118,743 five years from now, which represents a change of 21.30% from the current year. The current year per capita income in your area is $53,997, compare this to the US average, which is . The current year average household income in your area is $129,549, compare this to the US average which is .
PopulationIn 2016, the population in your selected geography is 32,522. The population has changed by 25.18% since 2000. It is estimated that the population in your area will be 33,556.00 five years from now, which represents a change of 3.18% from the current year. The current population is 51.63% male and 48.37% female. The median age of the population in your area is 34.52, compare this to the US average which is . The population density in your area is 10,342.92 people per square mile.
HouseholdsThere are currently 13,531 households in your selected geography. The number of households has changed by 17.20% since 2000. It is estimated that the number of households in your area will be 13,870 five years from now, which represents a change of 2.51% from the current year. The average household size in your area is 2.42 persons.
EmploymentIn 2016, there are 11,754 employees in your selected area, this is also known as the daytime population. The 2000 Census revealed that 83.45% of employees are employed in white-collar occupations in this geography, and 16.77% are employed in blue-collar occupations. In 2016, unemployment in this area is 4.94%. In 2000, the average time traveled to work was 25.00 minutes.
Race and EthnicityThe current year racial makeup of your selected area is as follows: 35.39% White, 2.20% Black, 0.41% Native American and 48.30% Asian/Pacific Islander. Compare these to US averages which are: White, Black, Native American and Asian/Pacific Islander. People of Hispanic origin are counted independently of race. People of Hispanic origin make up 17.51% of the current year population in your selected area. Compare this to the US average of .
PROPERTY NAME
MARKETING TEAM
665 E OLIVE AVE
HousingThe median housing value in your area was $714,885 in 2016, compare this to the US average of . In 2000, there were 3,547 owner occupied housing units in your area and there were 7,999 renter occupied housing units in your area. The median rent at the time was $1,229.
Source: © 2016 Experian
DEMOGRAPHICS
35

www.MarcusMillichap.com
Nathan Gustavson
Associate Vice President Investments
Director, National Multi Housing GroupPalo Alto OfficeTel: (650) 391-1700
Fax: (650) 391-1710
License: CA 01898316
P R E S E N T E D B Y


