62
SAHARA PAVILION SOUTH LAS VEGAS | NEVAD A OFFERING MEMORANDUM

SAHARA PAVILION SOUTH
LAS VEGAS | NEVADA
OFFERING MEMORANDUM
i
D I S C L A I M E REastdil Secured has been engaged as exclusive financial advisor to Seller (the "Company") in connection with the Company’s solicitation of offers for the purchase of the property known locally as Sahara
Pavilion South, an approximately 160,800 square-foot shopping center located in Las Vegas, Nevada. (the “Property”). The solicitation and potential sale of the Property shall be governed by this Confidential
Offering Memorandum, as it may be modified or supplemented (the “Offering Memorandum”) and the purchase agreement governing the sale of the Property (the “Purchase Agreement”). Prospective
purchasers are advised that as part of the solicitation process, the Company will be evaluating a number of factors including the current financial qualifications of the prospective purchaser. Prospective
purchasers are further advised that the Company expressly reserves the right in its sole and absolute discretion to evaluate the terms and conditions of any offer and to reject any offer without providing a
reason therefore. Further, the Company reserves the right to terminate the solicitation process at any time prior to final execution of the Purchase Agreement.
The information contained in this Offering Memorandum, including, without limitation, all photographs, maps and artwork contained herein, as well as any other information (whether written, electronic or
verbal) furnished by the Company or Eastdil Secured or their affiliates, or any of their respective officers, directors, shareholders, owners, employees, contractors or agents (collectively, the “Information”) is
confidential, and is furnished solely for the purpose of a review by a prospective purchaser of the Property, and is not to be used for any other purpose or made available to any other person without the
express written consent of the Company or Eastdil Secured. The Information is based in part upon information supplied by the Company and in part upon financial information obtained by Eastdil Secured
from sources it deems reasonably reliable. Summaries of any documents are not intended to be comprehensive or all-inclusive, but rather only outline some of the provisions contained therein and are qualified
in their entirety by the actual document to which they relate.
While the Company and Eastdil Secured have no reason to believe that the Information provided herein, or in any other marketing or due diligence materials provided, contains any material inaccuracies,
neither the Company, Eastdil Secured, nor their affiliates, nor any of their respective officers, directors, shareholders, owners, employees, contractors or agents make any representations or warranties,
expressed or implied, as to the accuracy or completeness of the Information, including, without limitation, any financial projections and Information as to engineering or environmental matters or as to the
future performance of the Property. Without limiting the foregoing, prospective purchasers should realize that any financial projections are estimates only, and are based on factors that may change in the
future. Accordingly, any such projections should not be relied upon. Prospective purchasers should make their own projections and form their own conclusions without reliance upon the material contained
herein and should conduct their own due diligence, including engineering and environmental inspections, to determine the condition of the Property and the existence of any potentially hazardous material
located at the Property site or used in the construction or maintenance of the building(s) at the Property site.
A prospective purchaser's sole and exclusive rights with respect to this prospective transaction, the Property, or the Information shall be limited to those expressly provided in an executed Purchase Agreement
and shall be subject to the terms thereof. In no event shall a prospective purchaser have any other claims against the Company or Eastdil Secured or any of their affiliates or any of their respective officers,
directors, shareholders, owners, employees, contractors or agents, for any damages, liability, or causes of action relating to this solicitation process or the marketing or sale of the Property.
Prospective purchasers are not to construe the contents of this Offering Memorandum or any prior or subsequent communications from Eastdil Secured or the Company or their affiliates or any of their
respective officers, directors, shareholders, owners, employees, contractors or agents as legal, tax or other advice. Prior to submitting an offer, prospective purchasers should consult with their own legal
counsel, as well as tax and other advisors, to determine the consequences of an investment in the Property and arrive at an independent evaluation of such investment. No brokerage commission or finder's
fee shall be payable to any party by the Company or Eastdil Secured or any affiliates or agents thereof in connection with the sale of the Property unless otherwise agreed to by the Company or Eastdil
Secured in writing. Seller hereby advises receiving party that Seller is not currently the owner of the property, and receiving party expressly acknowledges and understands that any transaction contemplated
herein is expressly subject to and conditioned upon Seller becoming the owner of the property pursuant to successful completion of the pending merger between Seller and Pan Pacific Retail Properties, Inc.
ES:SPS6
ii
S E C T I O N O N E E X E C U T I V E S U M M A R Y
The Offering 1
Aerial Photograph 2
Investment Highlights 4
Site Plan 6
Regional Map 7
Local Map 8
Aerial Photograph 10
Offering Terms 11
S E C T I O N T W O P R O P E R T Y D E S C R I P T I O N
Property Information 13
Site Description 13
Construction Detail 17
Mechanical Detail 19
S E C T I O N T H R E E M A R K E T A N A L Y S I S
Las Vegas Overview 21
Las Vegas Retail Market Overview 22
Aerial Photograph 23
Trade Area Overview 24
Sarah Pavilion South Demographic Profile 25
Trade Area Incomes Map 26
Competitive Shopping Centers to Sahara Pavilion 28
Competitive Set Map 30
Competitive Shopping Centers Description 31
T A B L E O F C O N T E N T S
S E C T I O N F O U R A R E A D E S C R I P T I O N
Las Vegas Area Overview 33
S E C T I O N F I V E F I N A N C I A L A N A L Y S I S
Financial Summary 39
Projected Cash Flow Statement 40
Income In-Place and Projected NOI Pro Forma 41
Cash Flow Assumptions 42
Cash Flow Assumptions Schedule 45
Market Rents Site Plan 46
Rent Roll 47
Tenant Summary 51
Detailed Lease Expiration Schedule and Graph 52
Major Tenant Profiles 53
S E C T I O N S I X A P P E N D I X
ARGUS CD


1
T H E O F F E R I N G
Eastdil Secured, as exclusive advisor, is pleased to present the opportunity
to acquire the 100% fee simple interest in Sahara Pavilion South (the
“Property”), a 160,842 square-foot shopping center located in the rapidly
growing city of Las Vegas, Nevada. Sahara Pavilion South is ideally
positioned in one of the city’s infill and dominant retail areas at the
intersection of Sahara Avenue and Decatur Boulevard, approximately 1.5
miles west of Interstate 15 and Las Vegas Boulevard. Frontage along
Sahara Avenue and Decatur Boulevard affords Sahara Pavilion South
tremendous visibility and tenant signage opportunities to more than
101,600 vehicles a day, as well as convenient access for shoppers to and
from the center.
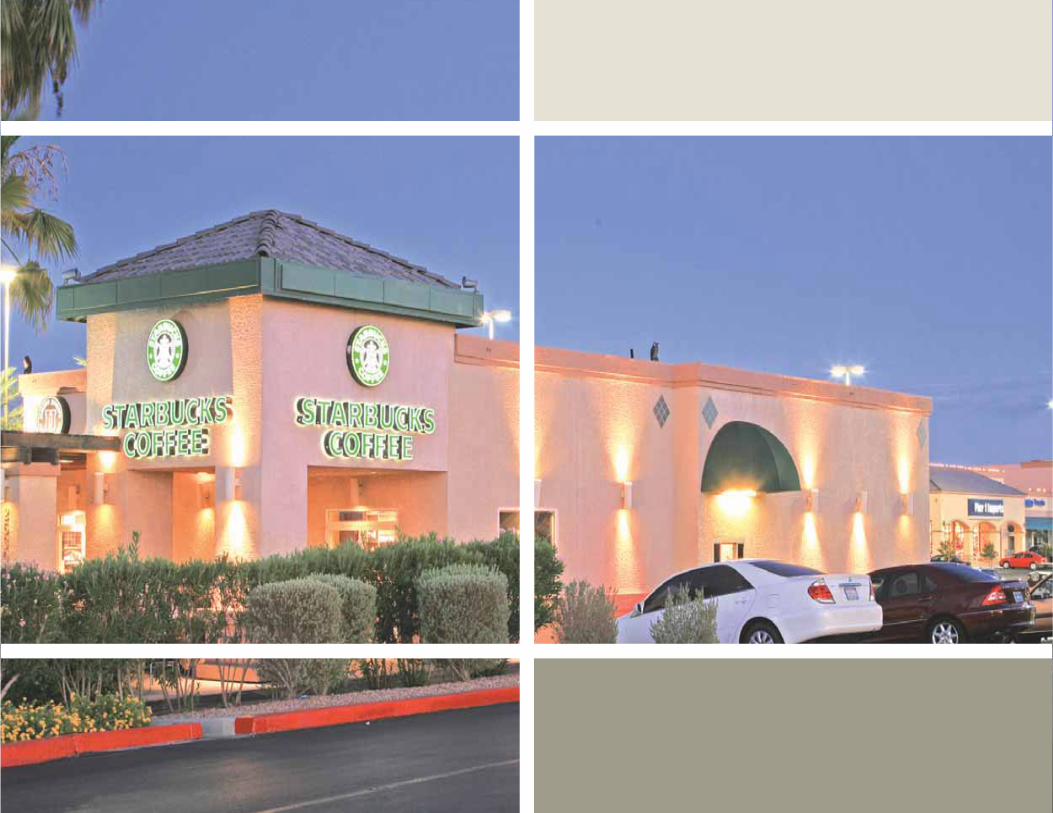
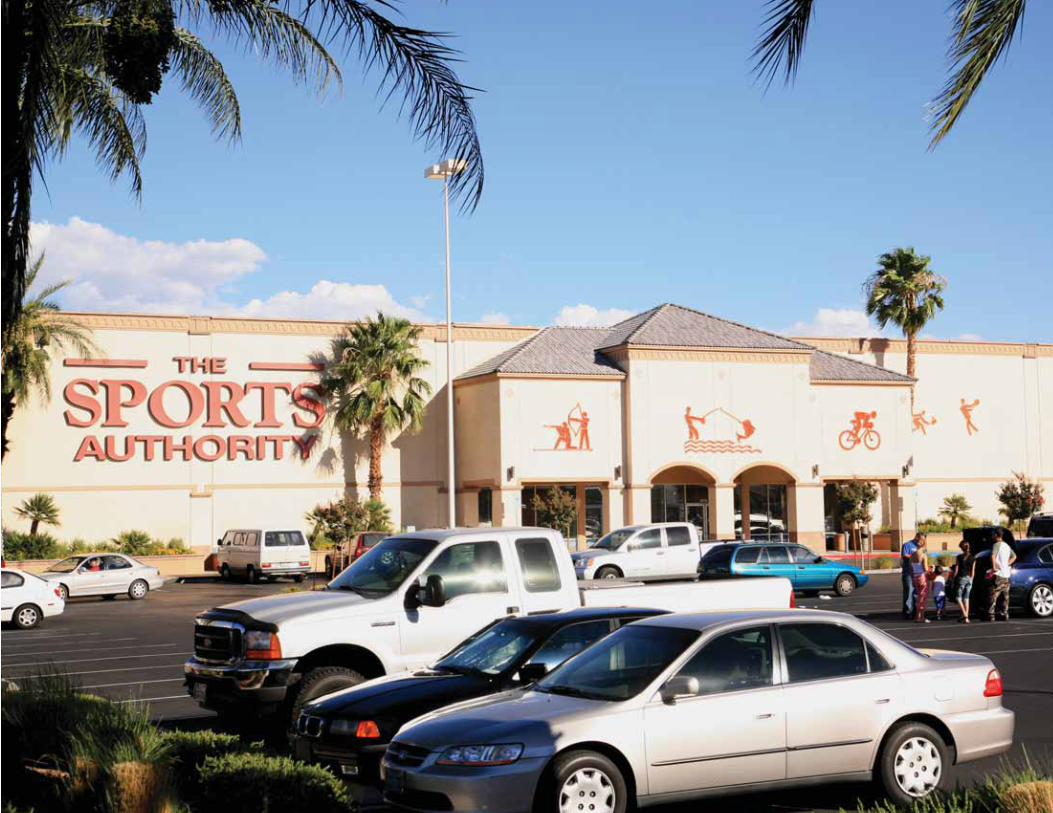
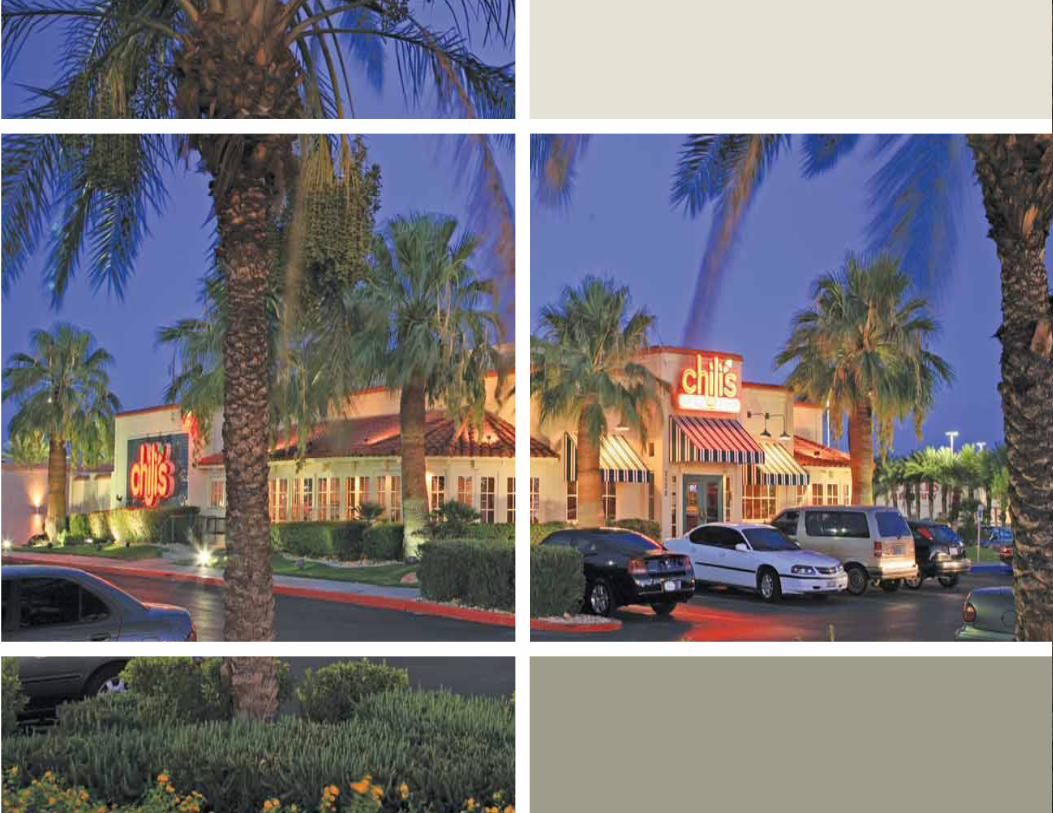
The Property is currently 91% leased to a host of nationally recognized
retailers such as The Sports Authority, Office Max, Pier 1 Imports, Chili’s
Restaurant and Starbucks, which features a drive-through window, as well
as an array of local retailers and restaurants. The Property is also well
established in a regional hub of retail activity, proximate a high
concentration of national retailers and auto dealerships, creating
tremendous retail synergies and expanding the center’s trade area draw
and customer base.
The Las Vegas area is among the fastest growing metropolitan areas in the
country experiencing more than 236% in growth since 1990 and is
projected to grow to 2.1 million residents by 2011. There are more than
150,000 residents within a 3-mile radius of Sahara Pavilion South, an
increase of more than 121% since 1990 and a figure that is expected to
grow another 4.4% by 2011.
S E C T I O N O N E
E X E C U T I V E S U M M A RY
PROPERTY OVERV IEW
Gross Leasable Area 160,842 SF
Percentage Leased 91.1%
Year Built/Renovated 1991
Site Area: 11.97 Acres
No. of Floors 1 & 2
Parking Ratio 4.8/1,000 SF
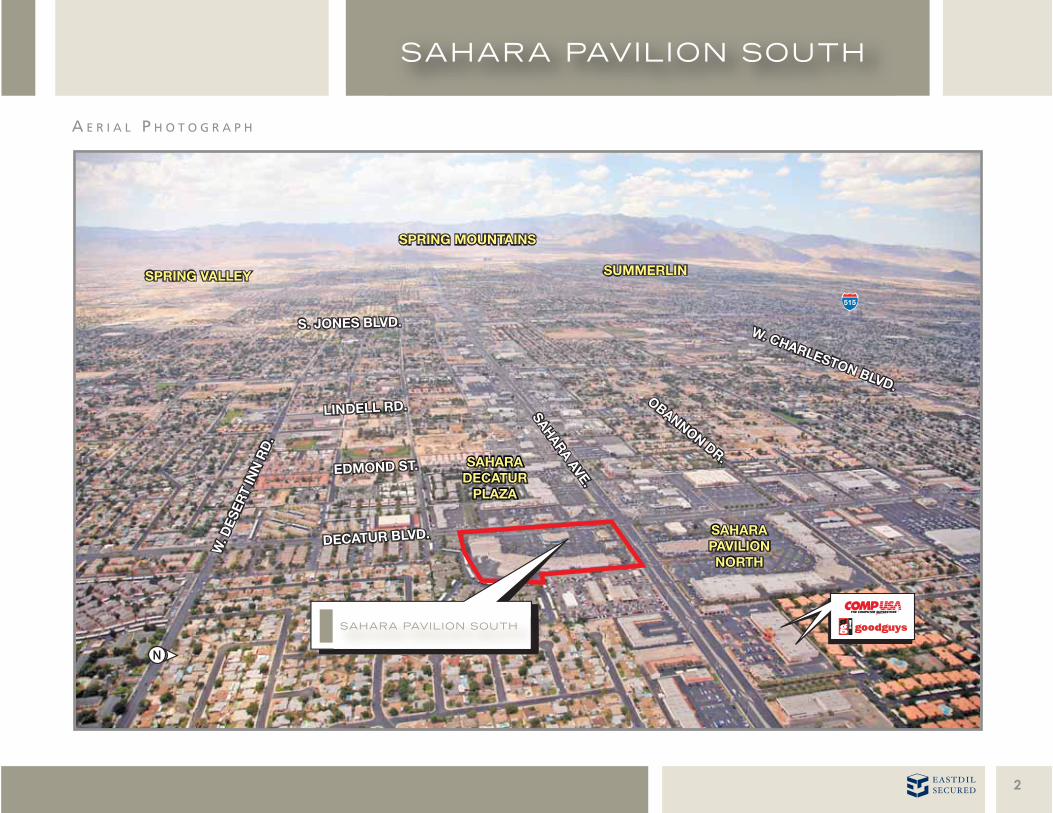
A E R I A L P H O T O G R A P H
2

4
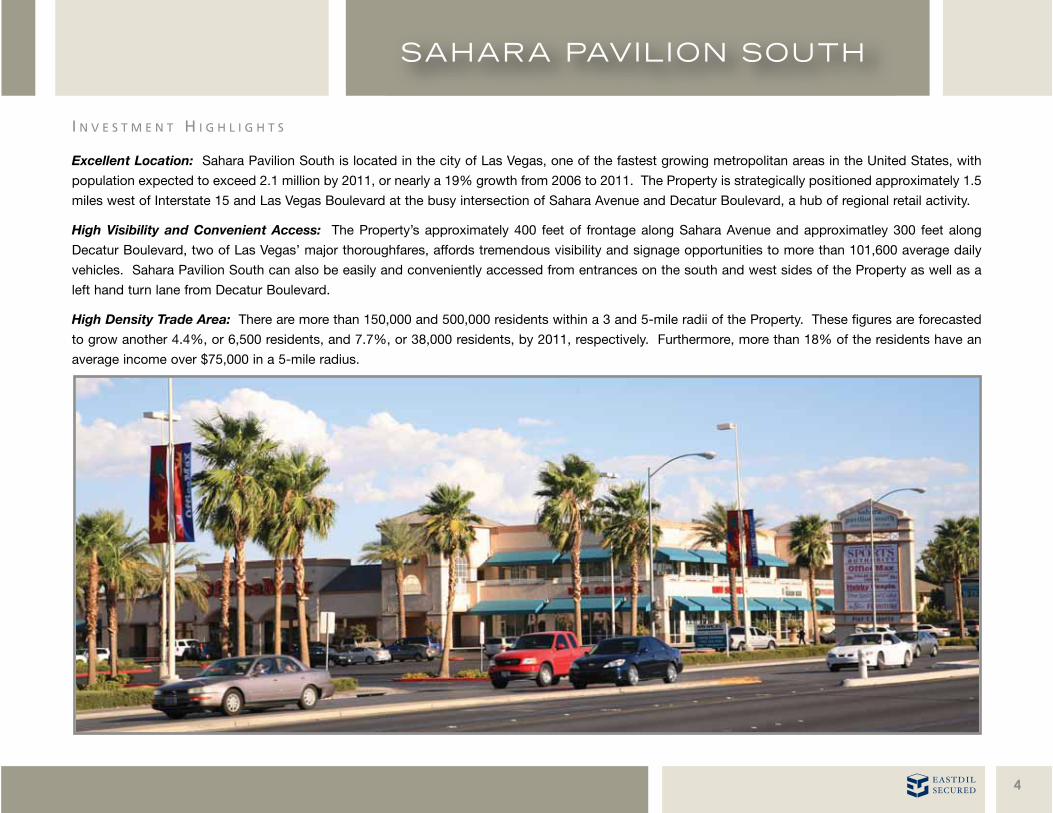
Excellent Location: Sahara Pavilion South is located in the city of Las Vegas, one of the fastest growing metropolitan areas in the United States, with
population expected to exceed 2.1 million by 2011, or nearly a 19% growth from 2006 to 2011. The Property is strategically positioned approximately 1.5
miles west of Interstate 15 and Las Vegas Boulevard at the busy intersection of Sahara Avenue and Decatur Boulevard, a hub of regional retail activity.
High Visibility and Convenient Access: The Property’s approximately 400 feet of frontage along Sahara Avenue and approximatley 300 feet along
Decatur Boulevard, two of Las Vegas’ major thoroughfares, affords tremendous visibility and signage opportunities to more than 101,600 average daily
vehicles. Sahara Pavilion South can also be easily and conveniently accessed from entrances on the south and west sides of the Property as well as a
left hand turn lane from Decatur Boulevard.
High Density Trade Area: There are more than 150,000 and 500,000 residents within a 3 and 5-mile radii of the Property. These figures are forecasted
to grow another 4.4%, or 6,500 residents, and 7.7%, or 38,000 residents, by 2011, respectively. Furthermore, more than 18% of the residents have an
average income over $75,000 in a 5-mile radius.
I N V E S T M E N T H I G H L I G H T S
5
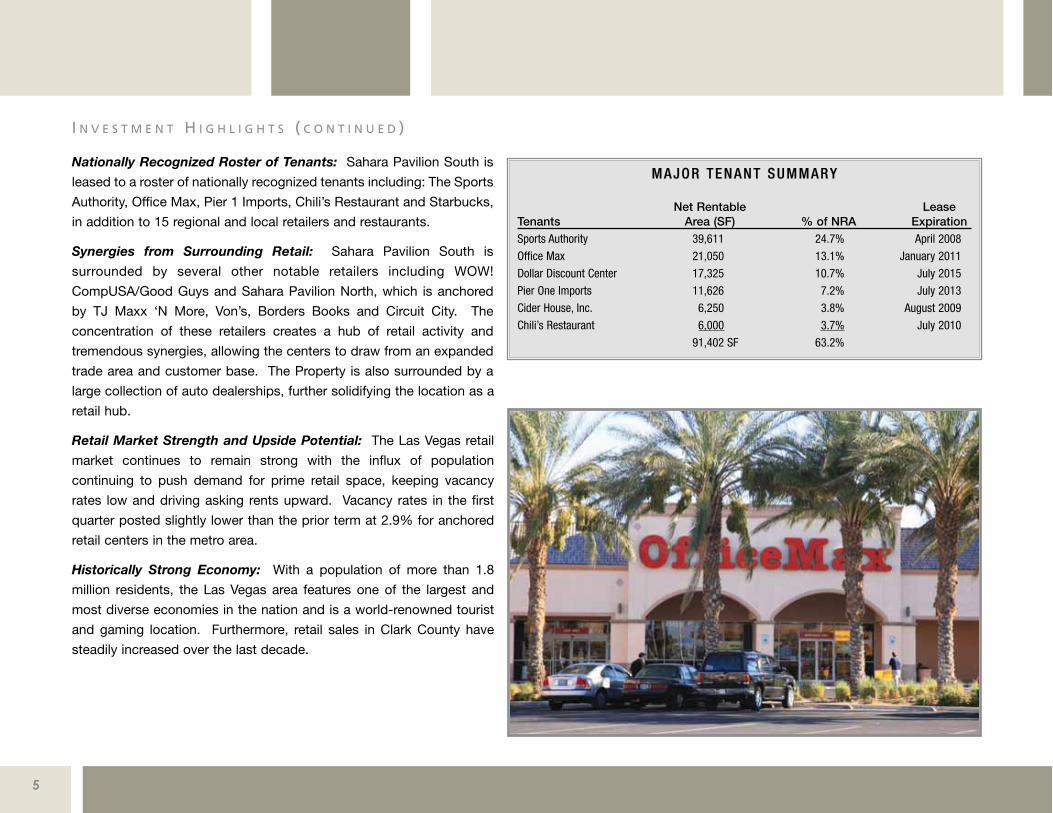
Nationally Recognized Roster of Tenants: Sahara Pavilion South is
leased to a roster of nationally recognized tenants including: The Sports
Authority, Office Max, Pier 1 Imports, Chili’s Restaurant and Starbucks,
in addition to 15 regional and local retailers and restaurants.
Synergies from Surrounding Retail: Sahara Pavilion South is
surrounded by several other notable retailers including WOW!
CompUSA/Good Guys and Sahara Pavilion North, which is anchored
by TJ Maxx ‘N More, Von’s, Borders Books and Circuit City. The
concentration of these retailers creates a hub of retail activity and
tremendous synergies, allowing the centers to draw from an expanded
trade area and customer base. The Property is also surrounded by a
large collection of auto dealerships, further solidifying the location as a
retail hub.
Retail Market Strength and Upside Potential: The Las Vegas retail
market continues to remain strong with the influx of population
continuing to push demand for prime retail space, keeping vacancy
rates low and driving asking rents upward. Vacancy rates in the first
quarter posted slightly lower than the prior term at 2.9% for anchored
retail centers in the metro area.
Historically Strong Economy: With a population of more than 1.8
million residents, the Las Vegas area features one of the largest and
most diverse economies in the nation and is a world-renowned tourist
and gaming location. Furthermore, retail sales in Clark County have
steadily increased over the last decade.
I N V E S T M E N T H I G H L I G H T S ( C O N T I N U E D )
MAJOR TENANT SUMMARY
Net Rentable LeaseTenants Area (SF) % of NRA ExpirationSports Authority 39,611 24.7% April 2008
Office Max 21,050 13.1% January 2011
Dollar Discount Center 17,325 10.7% July 2015
Pier One Imports 11,626 7.2% July 2013
Cider House, Inc. 6,250 3.8% August 2009
Chili’s Restaurant 6,000 3.7% July 2010
91,402 SF 63.2%
6
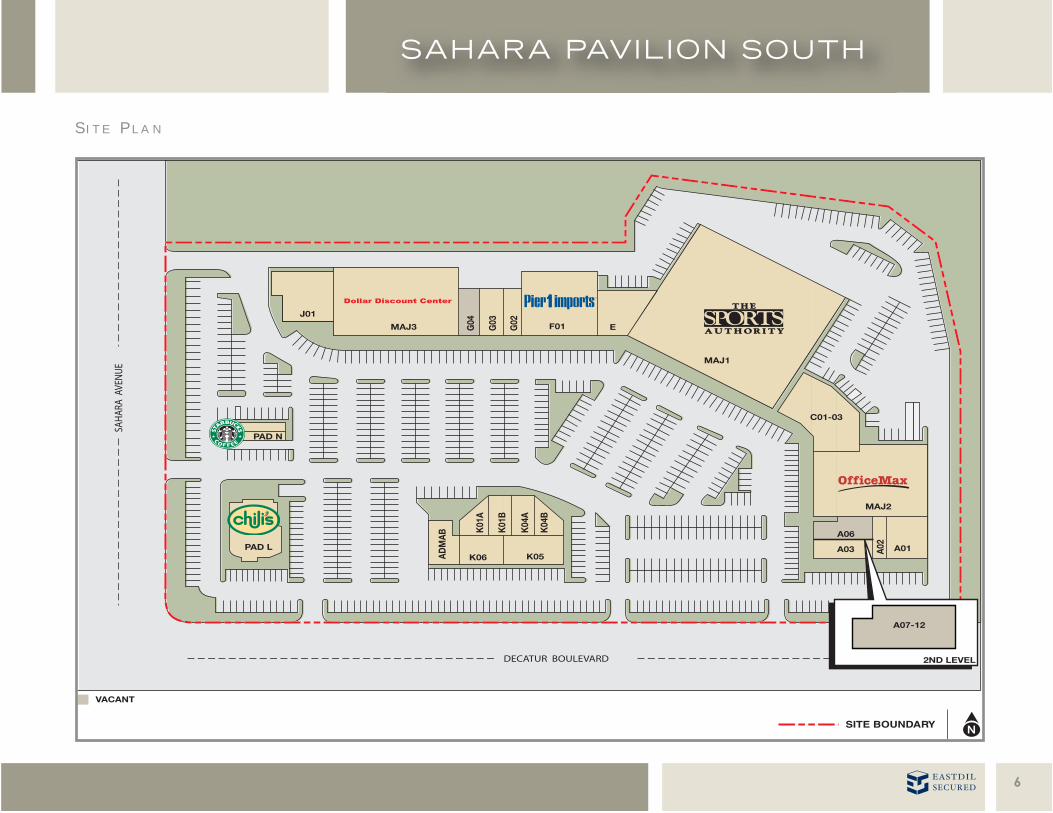
S I T E P L A N
7
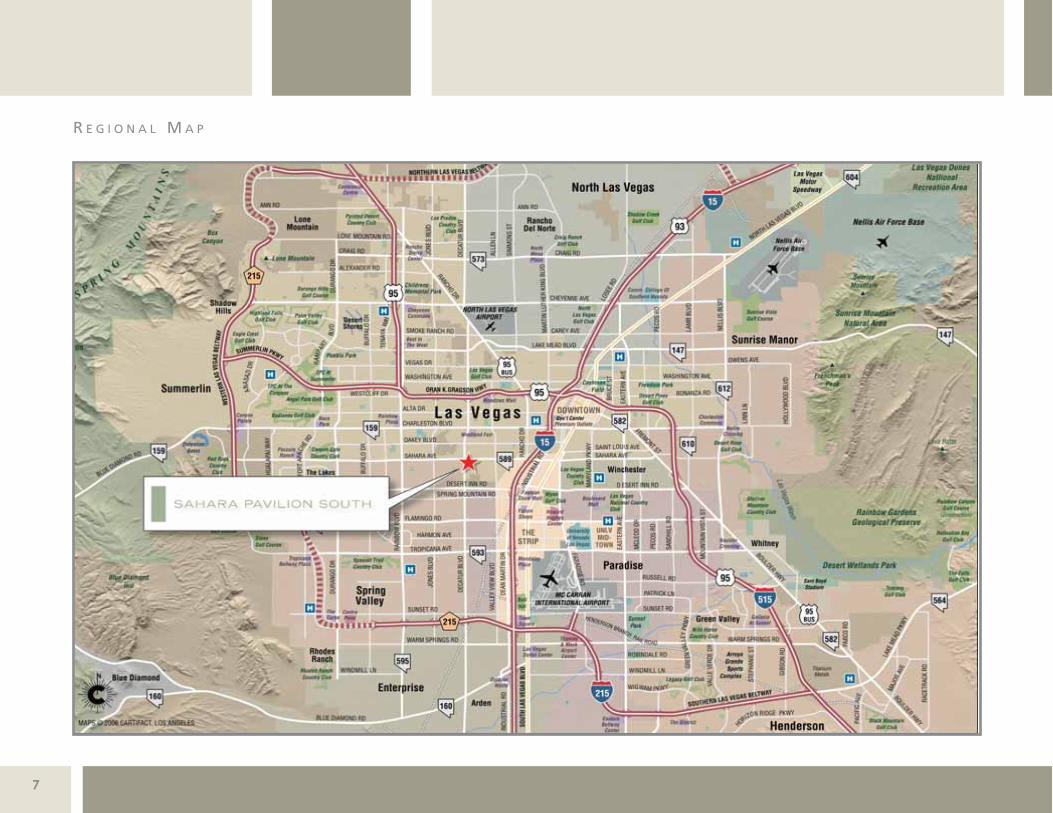
R E G I O N A L M A P
8
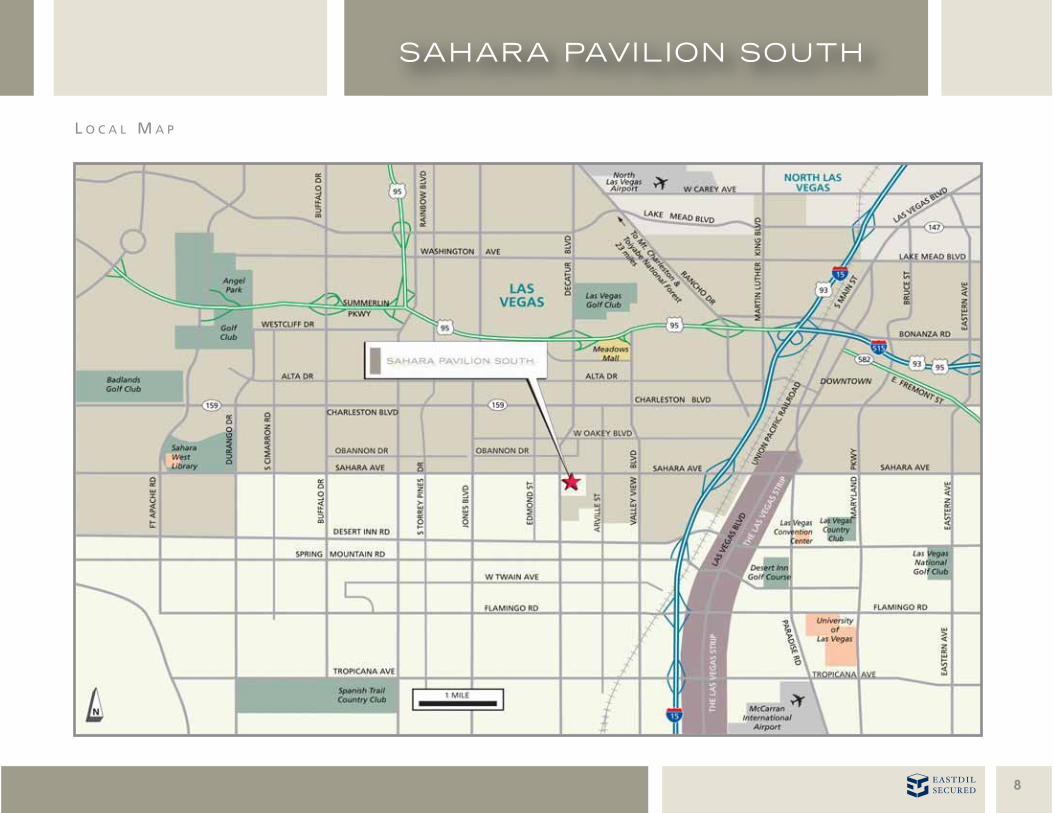
L O C A L M A P
10
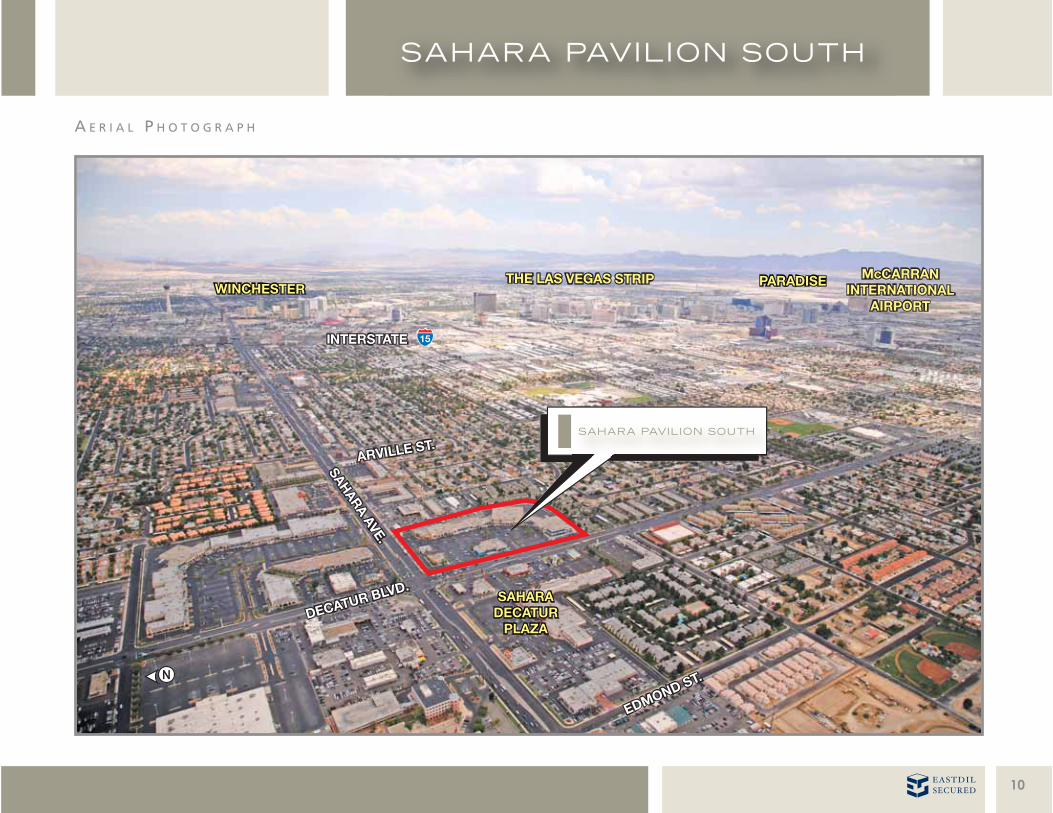
A E R I A L P H O T O G R A P H
11
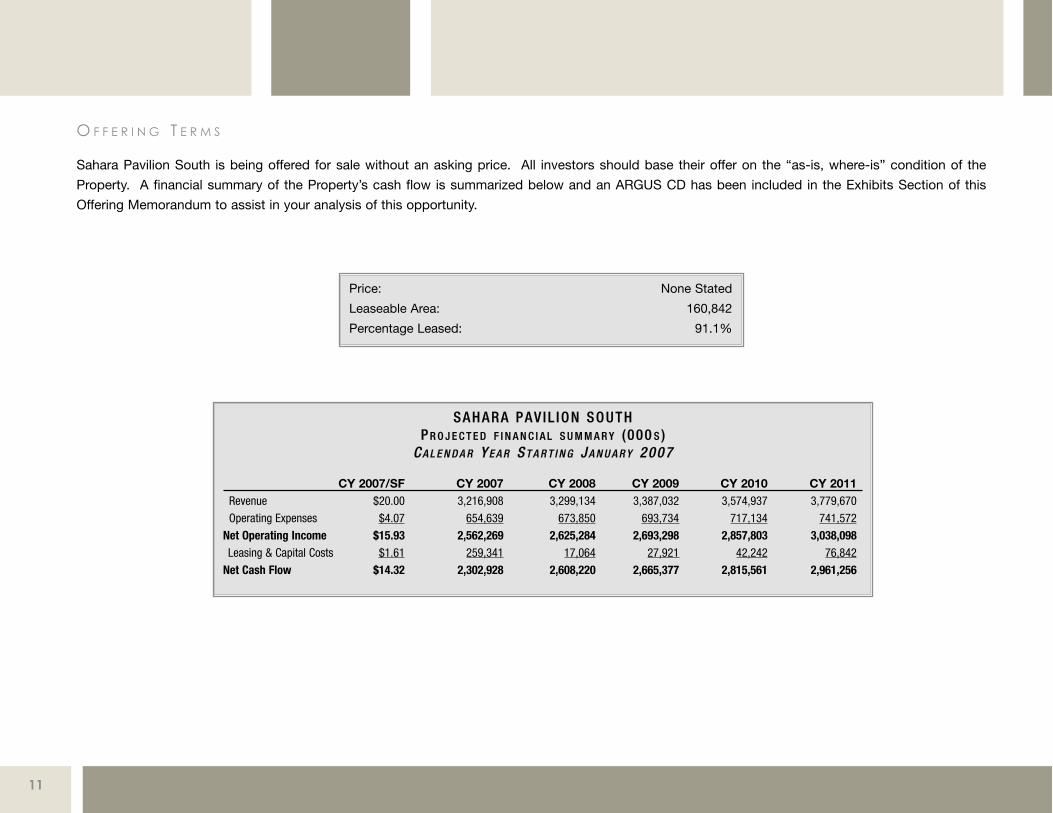
Sahara Pavilion South is being offered for sale without an asking price. All investors should base their offer on the “as-is, where-is” condition of the
Property. A financial summary of the Property’s cash flow is summarized below and an ARGUS CD has been included in the Exhibits Section of this
Offering Memorandum to assist in your analysis of this opportunity.
O F F E R I N G T E R M S
Price: None Stated
Leaseable Area: 160,842
Percentage Leased: 91.1%
SAHARA PAV IL ION SOUTHP R O J E C T E D F I N A N C I A L S U M M A R Y (000 S )
C A L E N D A R Y E A R S T A R T I N G J A N U A R Y 2007
CY 2007/SF CY 2007 CY 2008 CY 2009 CY 2010 CY 2011Revenue $20.00 3,216,908 3,299,134 3,387,032 3,574,937 3,779,670
Operating Expenses $4.07 654,639 673,850 693,734 717,134 741,572
Net Operating Income $15.93 2,562,269 2,625,284 2,693,298 2,857,803 3,038,098Leasing & Capital Costs $1.61 259,341 17,064 27,921 42,242 76,842
Net Cash Flow $14.32 2,302,928 2,608,220 2,665,377 2,815,561 2,961,256
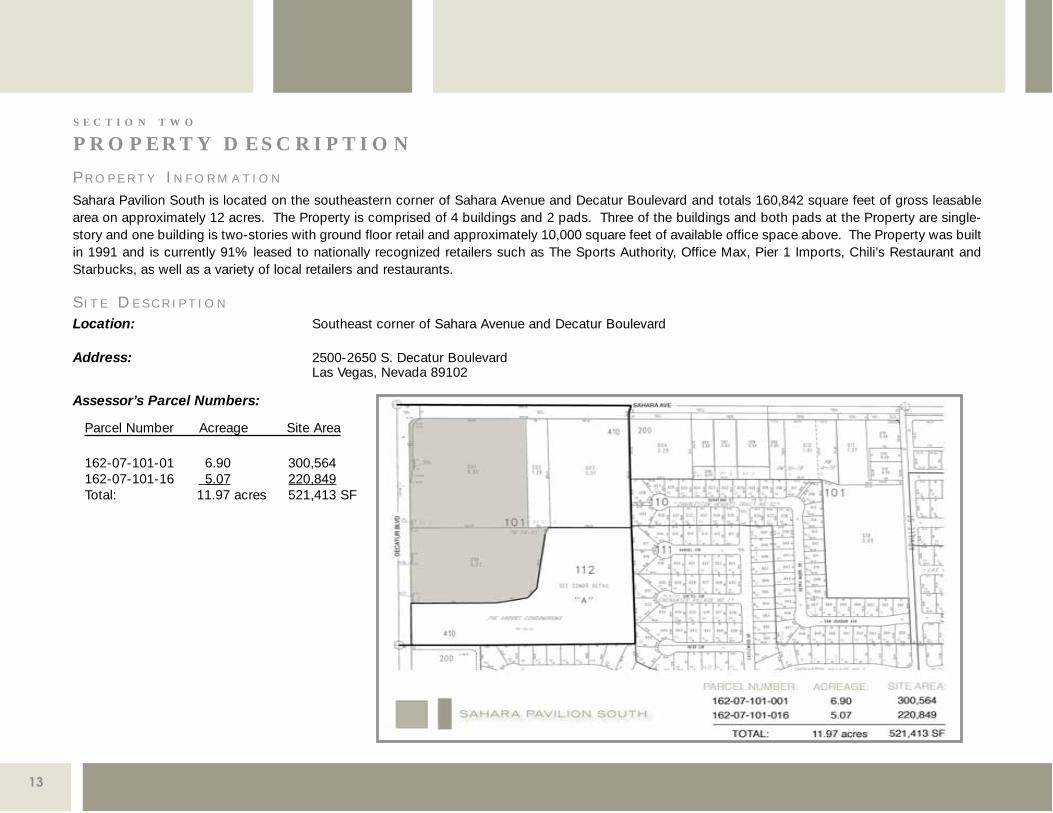
P R O P E R T Y I N F O R M A T I O N
Sahara Pavilion South is located on the southeastern corner of Sahara Avenue and Decatur Boulevard and totals 160,842 square feet of gross leasablearea on approximately 12 acres. The Property is comprised of 4 buildings and 2 pads. Three of the buildings and both pads at the Property are single-story and one building is two-stories with ground floor retail and approximately 10,000 square feet of available office space above. The Property was builtin 1991 and is currently 91% leased to nationally recognized retailers such as The Sports Authority, Office Max, Pier 1 Imports, Chili’s Restaurant andStarbucks, as well as a variety of local retailers and restaurants.
S I T E D E S C R I P T I O N
Location: Southeast corner of Sahara Avenue and Decatur Boulevard
Address: 2500-2650 S. Decatur BoulevardLas Vegas, Nevada 89102
Assessor’s Parcel Numbers:
Parcel Number Acreage Site Area
162-07-101-01 6.90 300,564162-07-101-16 5.07 220,849Total: 11.97 acres 521,413 SF
S E C T I O N T W O
P R O P E RT Y D E S C R I P T I O N
13
14
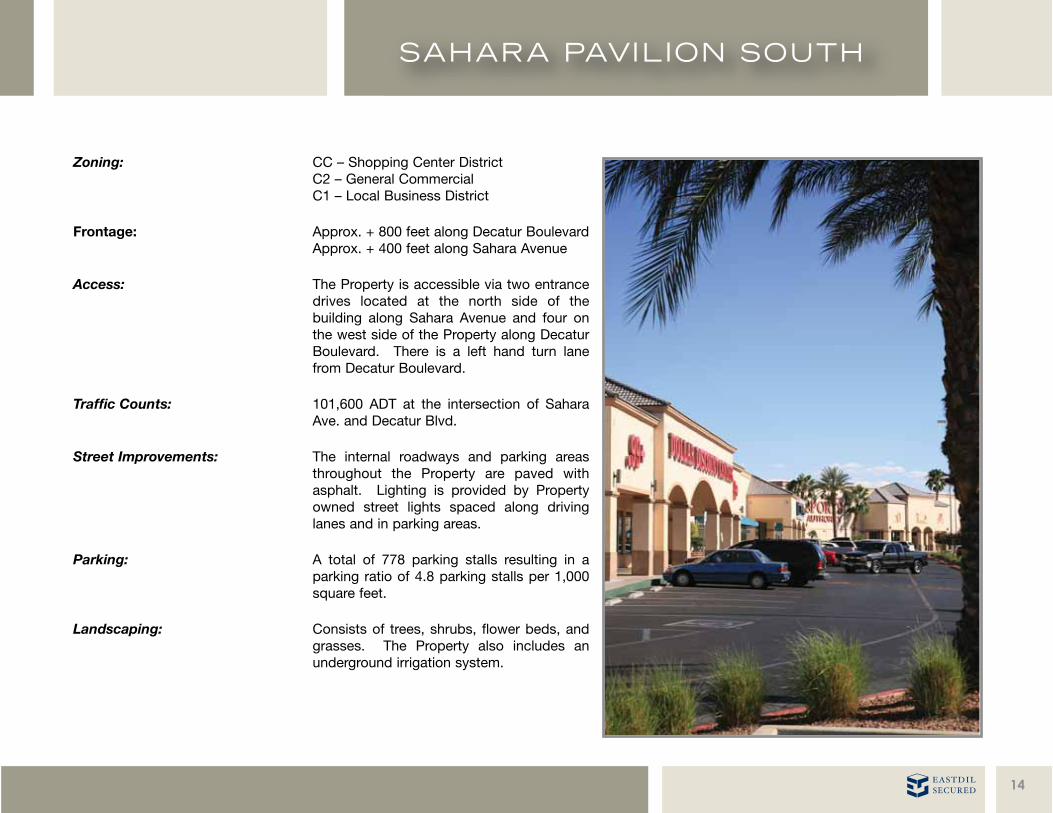
Zoning: CC – Shopping Center DistrictC2 – General CommercialC1 – Local Business District
Frontage: Approx. + 800 feet along Decatur BoulevardApprox. + 400 feet along Sahara Avenue
Access: The Property is accessible via two entrancedrives located at the north side of thebuilding along Sahara Avenue and four onthe west side of the Property along DecaturBoulevard. There is a left hand turn lanefrom Decatur Boulevard.
Traffic Counts: 101,600 ADT at the intersection of SaharaAve. and Decatur Blvd.
Street Improvements: The internal roadways and parking areasthroughout the Property are paved withasphalt. Lighting is provided by Propertyowned street lights spaced along drivinglanes and in parking areas.
Parking: A total of 778 parking stalls resulting in aparking ratio of 4.8 parking stalls per 1,000square feet.
Landscaping: Consists of trees, shrubs, flower beds, andgrasses. The Property also includes anunderground irrigation system.
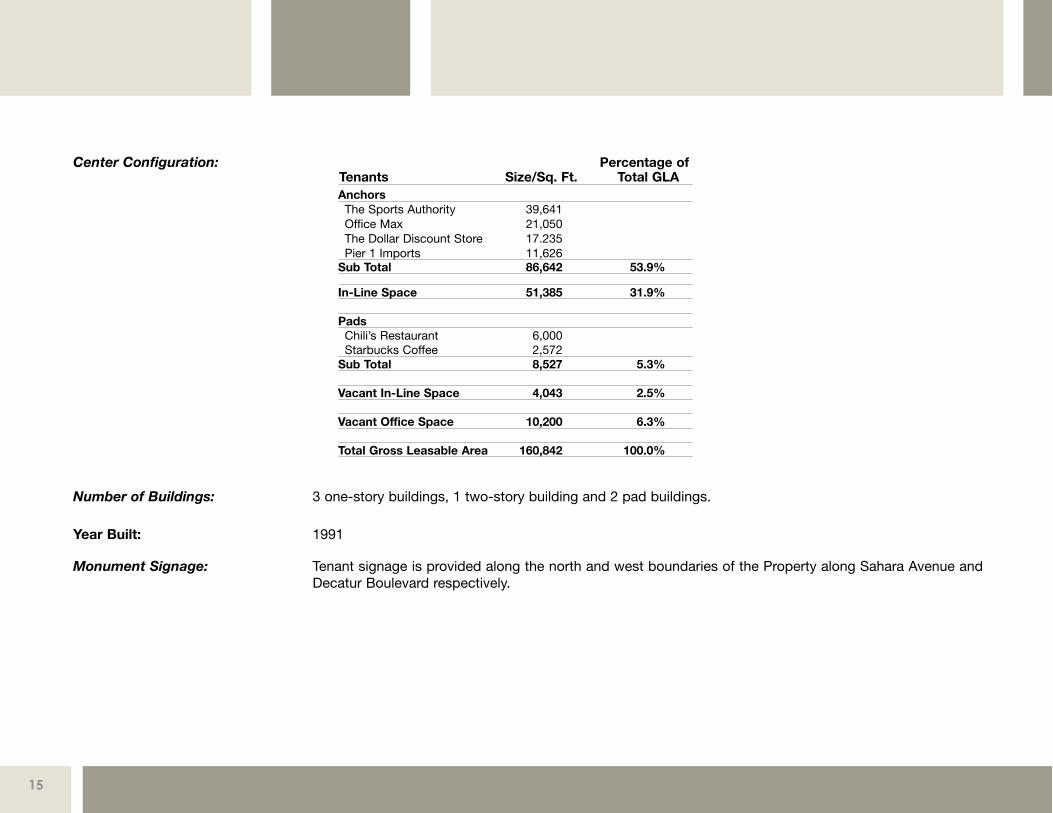
Center Configuration:
Number of Buildings: 3 one-story buildings, 1 two-story building and 2 pad buildings.
Year Built: 1991
Monument Signage: Tenant signage is provided along the north and west boundaries of the Property along Sahara Avenue andDecatur Boulevard respectively.
15
Percentage ofITenants Size/Sq. Ft. Total GLAAnchorsThe Sports Authority 39,641Office Max 21,050The Dollar Discount Store 17.235Pier 1 Imports 11,626
Sub Total 86,642 53.9%
In-Line Space 51,385 31.9%
PadsChili’s Restaurant 6,000 Starbucks Coffee 2,572
Sub Total 8,527 5.3%
Vacant In-Line Space 4,043 2.5%
Vacant Office Space 10,200 6.3%
Total Gross Leasable Area 160,842 100.0%
17
Structural Framing: Constructed with load bearing concrete exterior walls, steel columns, and open web bar joist roof framingsystem with metal decking.
Floors: The floor structures are concrete slab on grade.
Exterior Walls: The exterior walls of the buildings are constructed of poured concrete with a textured paint finish.
Roof: The slightly sloped roofs are constructed with open web steel joists, metal deck, and rigid insulation. Theroofing material is a ballasted single-ply membrane. A perimeter sloping roof forms entrance canopies tosome stores and is surfaced with concrete tiles. Generally, the pad building roofing material is rolled roofingwith a granular finish.
Storefronts: Storefronts consist of aluminum-framed windows and entrance doors.
Windows/Entrance Doors: Building windows are single glazing set in an aluminum framed storefront. The tenant unit front exteriorentrance doors are glass, aluminum frame storefront type set in aluminum framed storefront. The largertenants are provided with automatic doors. Rear exterior service doors are hollow metal set in metal frames.
Stairs: The exterior stairs to the partial second floor at the south end of the south retail building are constructed ofsteel with closed risers and concrete filled steel pan treads. The handrails are constructed of painted metal.
Patio/Terrace: The second floor in the southwest corner of the main retail building is set back from the first floor creating aterrace. The terrace has a texture finished with floor drains and a perimeter stucco wall topped with apainted metal rail.
C O N S T R U C T I O N D E T A I L
18
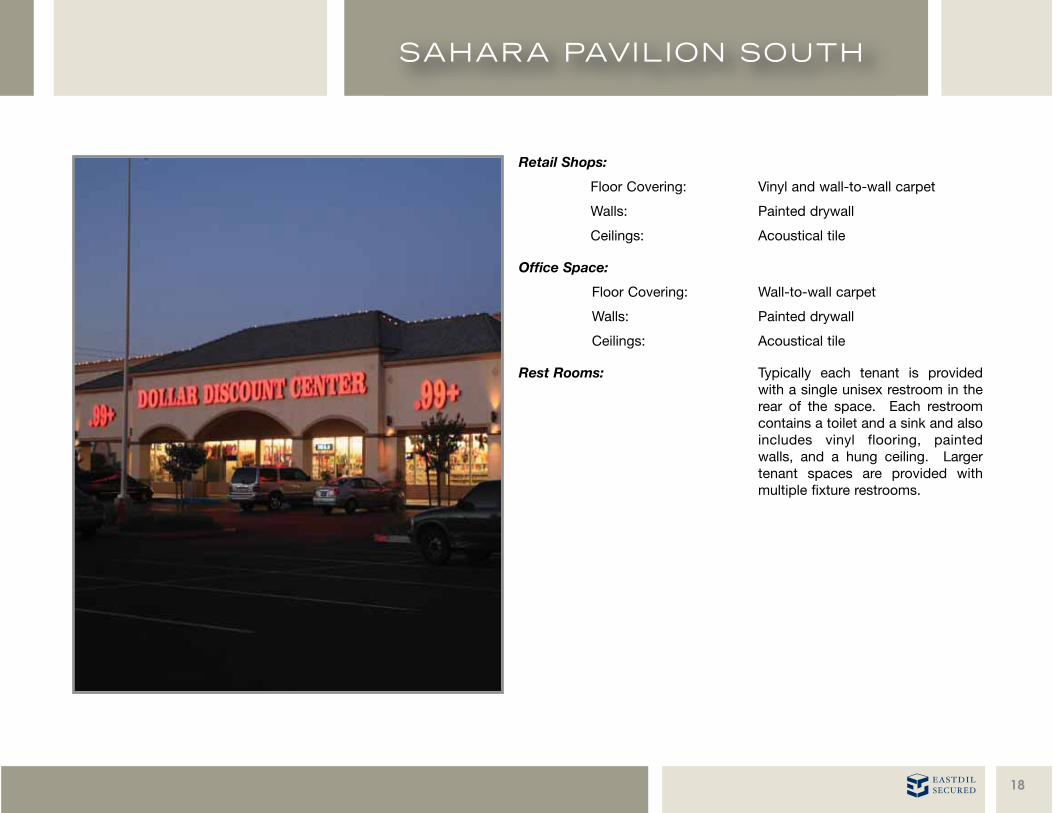
Retail Shops:
Floor Covering: Vinyl and wall-to-wall carpet
Walls: Painted drywall
Ceilings: Acoustical tile
Office Space:
Floor Covering: Wall-to-wall carpet
Walls: Painted drywall
Ceilings: Acoustical tile
Rest Rooms: Typically each tenant is providedwith a single unisex restroom in therear of the space. Each restroomcontains a toilet and a sink and alsoincludes vinyl flooring, paintedwalls, and a hung ceiling. Largertenant spaces are provided withmultiple fixture restrooms.

19
Heating and Cooling: Generally the smaller tenant spaces are heated and cooled by split system electric heat pump unitsmounted above the hung ceiling with air-cooled condensing units mounted on the roof. Some of thelarger tenant spaces are heated and cooled by gas-fired rooftop package units mounted above the roofon curbs. Air distribution is provided from the mechanical units through ductwork above the hung ceilingand control of the unit is by thermostat in the space.
Plumbing System: The plumbing systems are limited to incoming water service, the cold water piping system, and thesanitary sewer, soil, waste, and vent system. There are a number of water meters located in undergroundvaults. The cold water piping is copper.
Elevators: The Property is equipped with one Schindler hydraulic elevator with a permissible load of 2,500 pounds,which provides access to the second floor and serves only one tenant.
Utilities: Water: Las Vegas Valley Water DistrictElectricity: Nevada PowerGas: Southwest GasTelephone: Central Telephone of Nevada
Electrical Service: Electrical wiring/cabling is run underground throughout the complex. The electrical services areconnected to pad-mounted transformers which feed multiple tenant meter centers mounted in exteriorcabinets along the rear building walls. The service size varies and is 208/120 volt, three phase, wire,alternating current (AC).
Emergency Power: Each tenant is provided with battery back-up emergency lighting.
M E C H A N I C A L D E T A I L

21
L A S V E G A S O V E R V I E W
Sahara Pavilion South is located in the city of Las Vegas, Nevada, one of the fastest growing
metropolitan areas in the country. Celebrating its 101st birthday in 2006, the Las Vegas
population has grown a phenomenal 136% over the past 15 years to nearly 1.8 million residents.
Within a 3-mile radius of Sahara Pavilion South, the area has grown an incredible 121% over the
past 15 years, and is expected to grow another 4.4% by 2011. According to the city of Las
Vegas, during 2005, a new housing subdivision opened every week within the city’s boundaries.
Las Vegas is also home to the Clark County School District, the 5th largest district in the country
which currently handles more than 280,000 students annually.
As of July 2005, Las Vegas’ center of population was the intersection of Torrey Pines Drive and
Washington Avenue, approximately 2-miles south of Sahara Pavilion South. Although there has
been tremendous resident growth, the center of population has not moved much over the last
five years due to the residential development in Summerlin offset by residential development in
the northwest, such as large master-planned communities, including Iron Mountain Ranch.
Additionally, the increased residential development in the downtown area has added 1,000 new
housing units since 2000, further offsetting any change to the center of population.
The Las Vegas area has also experienced phenomenal economic growth over the past few
decades and was ranked as the third largest job producer among US metropolitans, trailing only
Washington DC and Phoenix for the year-ending November 2005. While the Leisure and Hospitality sector account for as much as 30% of the employment
in the city, the massive amount of expansion and development that has occurred in the past few decades has led to all-around economic growth.
Las Vegas is an internationally recognized destination with nearly 39 million visitors last year alone. The influx of tourists to the Las Vegas area is a huge
injection of capital to the economy. The demographic of the Las Vegas tourist is traditionally one with a high disposable income with approximately 61%
of all visitors boasting incomes greater than $60,000.
LAS VEGAS DEMOGRAPH IC PROF ILE
Las Vegas MSAPopulation2006 estimate 1,752,3852011 projection 2,083,252Est. Growth 2006 - 2011 18.9%Growth 1990 - 2006 136.6%2006 Est. Households 427,026
2006 Estimated HH Income$75,000 - $99,999 12.7% $100,000 - $149,999 11.2%$150,000 - $249,999 3.9%$250,000+ 1.7%
29.5%
Average 2006 Est. HH Inocome $66,118Median 2006 Est. HH Income $51,001Median Home Price $247,483
S E C T I O N T H R E E
M A R K E T & T R A D E A R E A A N A LY S I S

22
As of the first quarter of 2006, the Las Vegas retail market
totaled 35.3 million square feet. The influx of population in
Las Vegas continues to push demand for prime retail space,
keeping vacancy rates low and driving asking rents upward.
Vacancy rates in the first quarter posted slightly lower than
the prior term at 2.9% for anchored retail centers.
• Average annual asking rents in the Las Vegas metro
area averaged $18.50 NNN per square-foot with
annual rents for in-line spaces averaging $27.00
NNN per square-foot and $31.00 for pad locations.
• In the first part of the year, no new product entered
the market and direct net absorption decreased to
44,243 square feet from 425,541 square feet the
previous quarter. The drop in absorption is due to
the lack of new shopping centers combined with
older remaining inventory in less desirable projects
and locations.
• Due to the rapidly growing population, the market is
currently underserved by retail. Currently there are
approximately 5 million square feet of planned space
or space under construction to satisfy the
intensifying demand.
L A S V E G A S R E T A I L M A R K E T O V E R V I E W
23
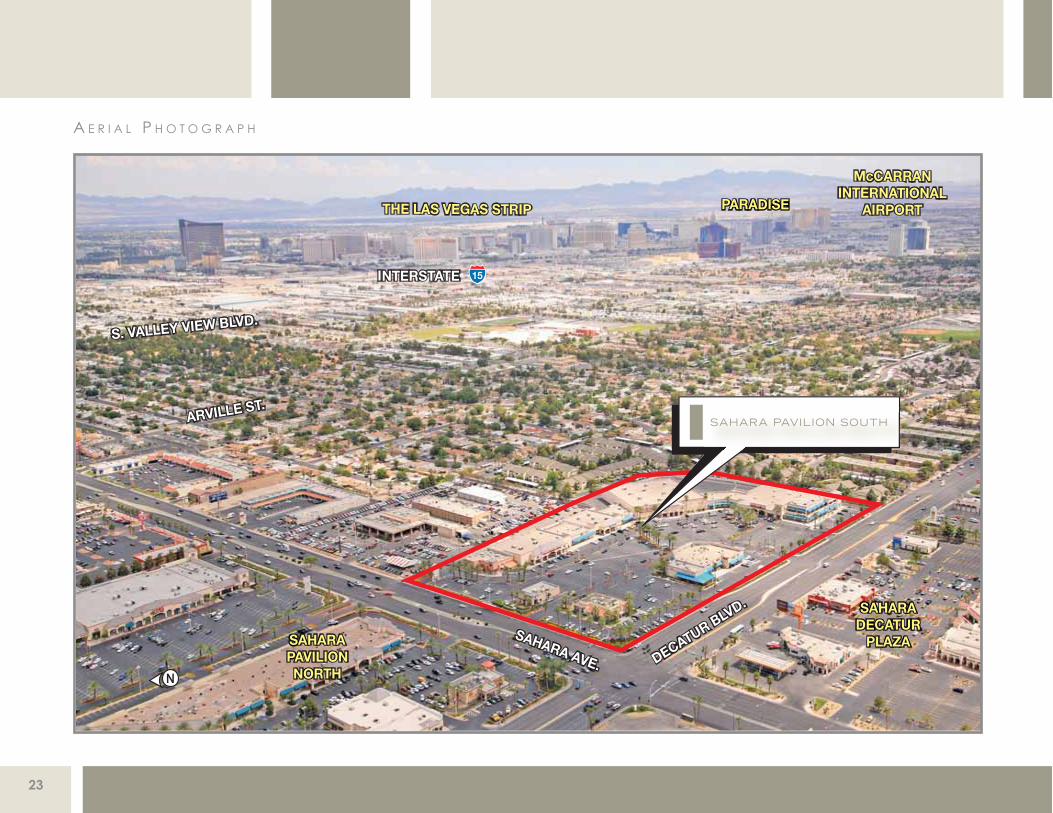
A E R I A L P H O T O G R A P H
24
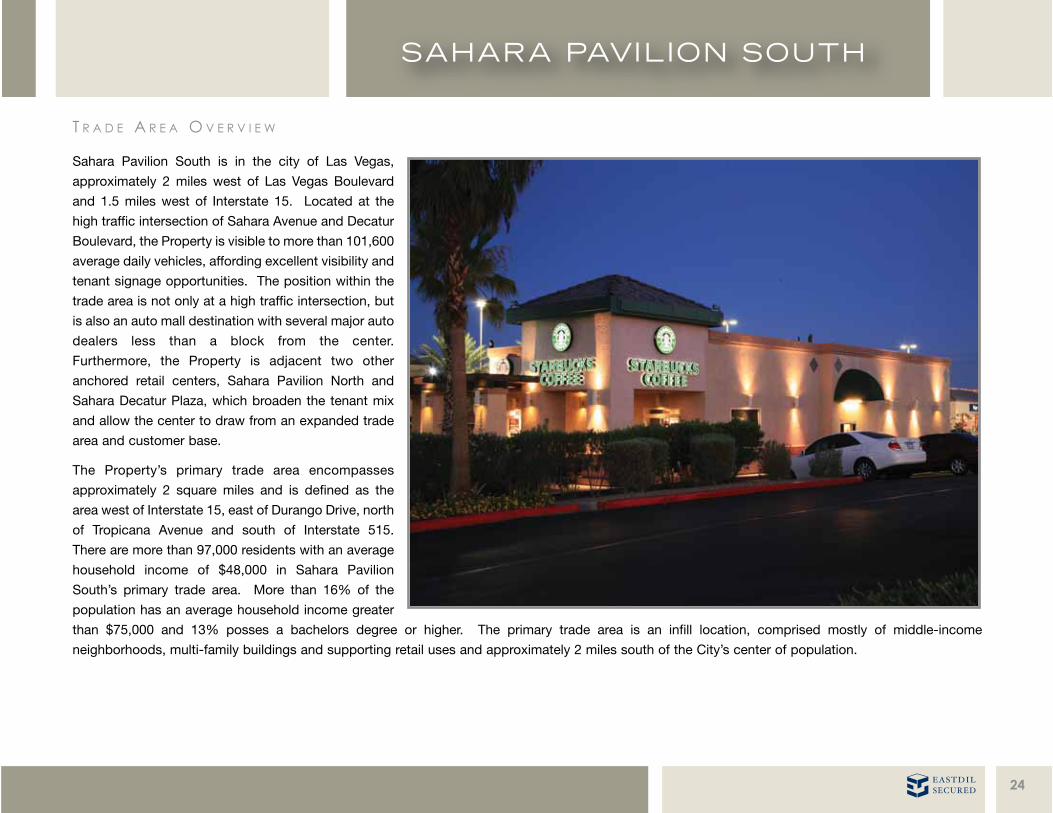
Sahara Pavilion South is in the city of Las Vegas,
approximately 2 miles west of Las Vegas Boulevard
and 1.5 miles west of Interstate 15. Located at the
high traffic intersection of Sahara Avenue and Decatur
Boulevard, the Property is visible to more than 101,600
average daily vehicles, affording excellent visibility and
tenant signage opportunities. The position within the
trade area is not only at a high traffic intersection, but
is also an auto mall destination with several major auto
dealers less than a block from the center.
Furthermore, the Property is adjacent two other
anchored retail centers, Sahara Pavilion North and
Sahara Decatur Plaza, which broaden the tenant mix
and allow the center to draw from an expanded trade
area and customer base.
The Property’s primary trade area encompasses
approximately 2 square miles and is defined as the
area west of Interstate 15, east of Durango Drive, north
of Tropicana Avenue and south of Interstate 515.
There are more than 97,000 residents with an average
household income of $48,000 in Sahara Pavilion
South’s primary trade area. More than 16% of the
population has an average household income greater
than $75,000 and 13% posses a bachelors degree or higher. The primary trade area is an infill location, comprised mostly of middle-income
neighborhoods, multi-family buildings and supporting retail uses and approximately 2 miles south of the City’s center of population.
T R A D E A R E A O V E R V I E W
25
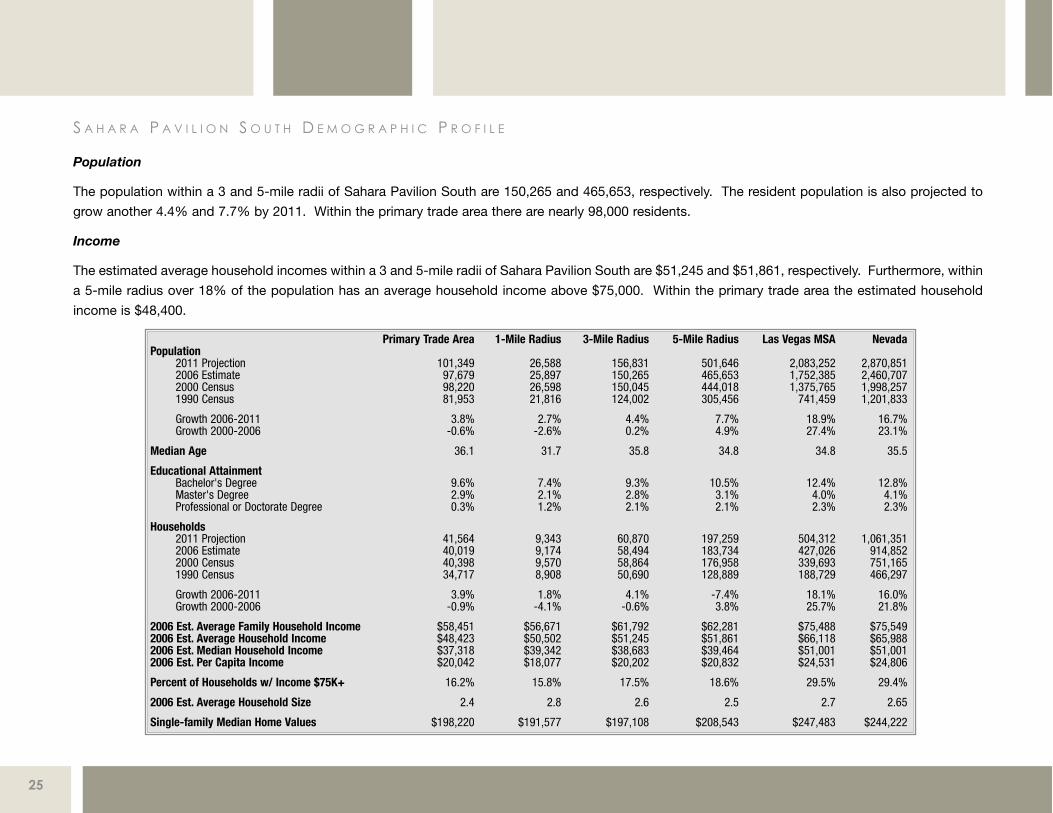
Population
The population within a 3 and 5-mile radii of Sahara Pavilion South are 150,265 and 465,653, respectively. The resident population is also projected to
grow another 4.4% and 7.7% by 2011. Within the primary trade area there are nearly 98,000 residents.
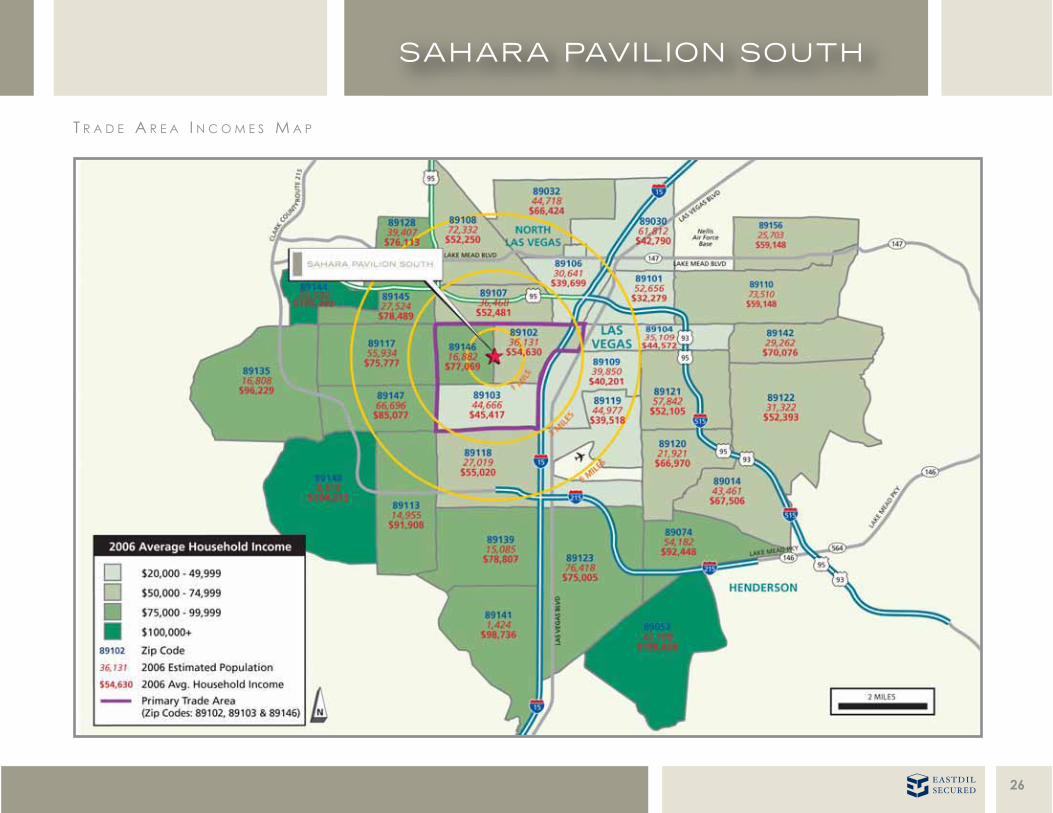
Income
The estimated average household incomes within a 3 and 5-mile radii of Sahara Pavilion South are $51,245 and $51,861, respectively. Furthermore, within
a 5-mile radius over 18% of the population has an average household income above $75,000. Within the primary trade area the estimated household
income is $48,400.
S A H A R A P A V I L I O N S O U T H D E M O G R A P H I C P R O F I L E
Primary Trade Area 1-Mile Radius 3-Mile Radius 5-Mile Radius Las Vegas MSA NevadaPopulation
2011 Projection 101,349 26,588 156,831 501,646 2,083,252 2,870,8512006 Estimate 97,679 25,897 150,265 465,653 1,752,385 2,460,7072000 Census 98,220 26,598 150,045 444,018 1,375,765 1,998,2571990 Census 81,953 21,816 124,002 305,456 741,459 1,201,833
Growth 2006-2011 3.8% 2.7% 4.4% 7.7% 18.9% 16.7%Growth 2000-2006 -0.6% -2.6% 0.2% 4.9% 27.4% 23.1%
Median Age 36.1 31.7 35.8 34.8 34.8 35.5
Educational AttainmentBachelor's Degree 9.6% 7.4% 9.3% 10.5% 12.4% 12.8%Master's Degree 2.9% 2.1% 2.8% 3.1% 4.0% 4.1%Professional or Doctorate Degree 0.3% 1.2% 2.1% 2.1% 2.3% 2.3%
Households2011 Projection 41,564 9,343 60,870 197,259 504,312 1,061,351 2006 Estimate 40,019 9,174 58,494 183,734 427,026 914,852 2000 Census 40,398 9,570 58,864 176,958 339,693 751,165 1990 Census 34,717 8,908 50,690 128,889 188,729 466,297
Growth 2006-2011 3.9% 1.8% 4.1% -7.4% 18.1% 16.0%Growth 2000-2006 -0.9% -4.1% -0.6% 3.8% 25.7% 21.8%
2006 Est. Average Family Household Income $58,451 $56,671 $61,792 $62,281 $75,488 $75,5492006 Est. Average Household Income $48,423 $50,502 $51,245 $51,861 $66,118 $65,9882006 Est. Median Household Income $37,318 $39,342 $38,683 $39,464 $51,001 $51,0012006 Est. Per Capita Income $20,042 $18,077 $20,202 $20,832 $24,531 $24,806
Percent of Households w/ Income $75K+ 16.2% 15.8% 17.5% 18.6% 29.5% 29.4%
2006 Est. Average Household Size 2.4 2.8 2.6 2.5 2.7 2.65
Single-family Median Home Values $198,220 $191,577 $197,108 $208,543 $247,483 $244,222
26
T R A D E A R E A I N C O M E S M A P

28
The Property is positioned on the southeast corner of Sahara Avenue and Decatur Boulevard, adjacent two other notable retail centers, Sahara Pavilion
North and Sahara Decatur Plaza, which in aggregate represent 616,000 square feet of retail. Sahara Pavilion North is a single-story shopping center
located on the northeast corner of the intersection and anchored by Von’s, T.J. Maxx, Borders Books, Jo Ann’s Fabrics and Gold’s Gym. Sahara Decatur
Plaza is located on the southwest corner of the intersection, is anchored by Circuit City and has two levels of retail occupied primarily by local shops and
restaurants. Both centers can be accessed via Sahara Avenue and Decatur Boulevard. The range and concentration of the anchor tenants at these three
centers create tremendous synergies and a regional center of retail activity for local residents.
The one million square-foot Meadows Mall is also proximate to the Property in the primary trade area but is not considered competitive with Sahara
Pavilion South. Meadows Mall is approximately 99.7% leased and is anchored by Dillard’s, JCPenny, Macy’s and Sears and is 2.3 miles north of the
Property along Meadows Lane. The owner, General Growth Properties, is planning a redevelopment of the mall over the next several years which will
include the creation of a “main street” atmosphere featuring upscale, lifestyle tenants.
There are several strip retail centers in the trade area, but these are not considered competitive as they are non-anchored and the locations/physical quality
are inferior to Sahara Pavillion South. A detailed description of the complete competitive landscape can be found on page 29 of this offering package.
COM P E T I T I V E S H O P P I N G C E N T E R S T O S A H A R A P A V I L I O N S O U T H
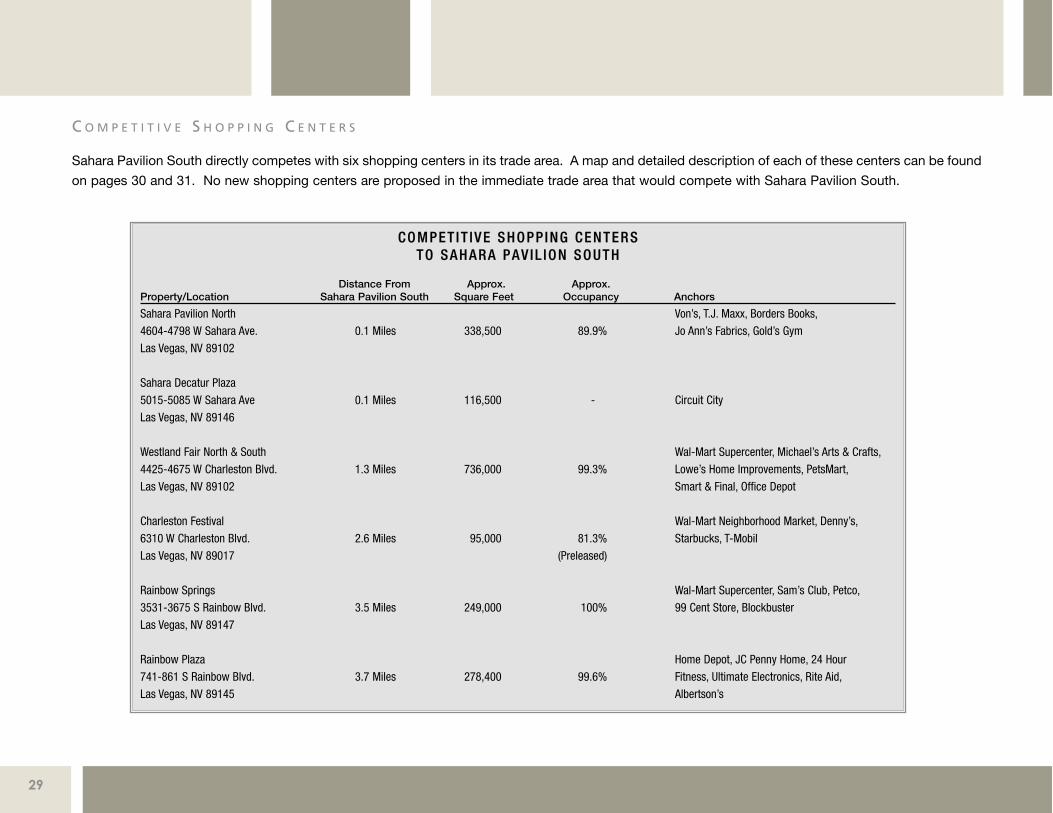
Sahara Pavilion South directly competes with six shopping centers in its trade area. A map and detailed description of each of these centers can be found
on pages 30 and 31. No new shopping centers are proposed in the immediate trade area that would compete with Sahara Pavilion South.
C O M P E T I T I V E S H O P P I N G C E N T E R S
29
COMPET IT IVE SHOPP ING CENTERSTO SAHARA PAV IL ION SOUTH
Distance From Approx. Approx.Property/Location Sahara Pavilion South Square Feet Occupancy Anchors
Sahara Pavilion North Von’s, T.J. Maxx, Borders Books,
4604-4798 W Sahara Ave. 0.1 Miles 338,500 89.9% Jo Ann’s Fabrics, Gold’s Gym
Las Vegas, NV 89102
Sahara Decatur Plaza
5015-5085 W Sahara Ave 0.1 Miles 116,500 - Circuit City
Las Vegas, NV 89146
Westland Fair North & South Wal-Mart Supercenter, Michael’s Arts & Crafts,
4425-4675 W Charleston Blvd. 1.3 Miles 736,000 99.3% Lowe’s Home Improvements, PetsMart,
Las Vegas, NV 89102 Smart & Final, Office Depot
Charleston Festival Wal-Mart Neighborhood Market, Denny’s,
6310 W Charleston Blvd. 2.6 Miles 95,000 81.3% Starbucks, T-Mobil
Las Vegas, NV 89017 (Preleased)
Rainbow Springs Wal-Mart Supercenter, Sam’s Club, Petco,
3531-3675 S Rainbow Blvd. 3.5 Miles 249,000 100% 99 Cent Store, Blockbuster
Las Vegas, NV 89147
Rainbow Plaza Home Depot, JC Penny Home, 24 Hour
741-861 S Rainbow Blvd. 3.7 Miles 278,400 99.6% Fitness, Ultimate Electronics, Rite Aid,
Las Vegas, NV 89145 Albertson’s

COM P E T I T I V E S E T M A P
30
Sahara Pavilion North
Sahara Pavilion North is a 338,500 square-foot shopping center located on the northeast corner of Sahara Avenue and Decatur Boulevard. The propertyis currently 89.8% leased and is anchored by Von’s, T.J. Maxx, Borders Books, Jo Ann’s Fabrics and Gold’s Gym. Property amenities include a dedicatedturn lane, signalized entrance and location along a bus line. The center was originally built in 1989 and is owned and operated by Kimco Realty.
Sahara Decatur Plaza
Located on the southwest corner of Sahara Avenue and Decatur Boulevard, Sahara Decatur Plaza is a 116,500 square-foot shopping center anchored byCircuit City. The property is comprised of two levels of retail occupied by a variety of local retailers and restaurants. The property was originally built in1988 and is currently owned by Becker Investment Company. The center’s features include a dedicated turn lane, signalized intersection and a locationalong a bus line.
Westland Fair North & South
Renovated and Expanded in 1995, Westland Fair totals approximately 736,000 square feet. The shopping center is 99.1% leased and anchored by Wal-Mart Supercenter, Michael’s Arts & Crafts, Lowe’s Home Improvement, PetsMart, Smart & Final, and Office Depot. Westland Fair is located in thecommunity of Spring Valley just east of Decatur Boulevard on Charleston Boulevard. The shopping center features a dedicated turn lane, signalizedentrance and is located along a bus line. The Property is owned and operated by Weingarten Realty Investors.
Charlestown Festival
Recently completed in the summer of 2006, many of the in-line shops are being turned over to tenants for their individual build-outs. Currently, the centeris 81.3% pre-leased and Wal-Mart Neighborhood Market, Denny’s and T-Mobil are open and operating with the center’s grand opening scheduled forwinter of 2006/2007. The center is located at 6310 W Charleston Boulevard and the project is being developed by Bullseye Development.
Rainbow Springs
Currently 100% leased, Rainbow Springs is a 249,000 square-foot shopping center anchored by Wal-Mart Supercenter, Sam’s Club, Petco, 99 Cent Storeand Blockbuster. Rainbow Springs is located at 3531-3675 Rainbow Boulevard and features a dedicated turn lane, signalized entrance, and is along abus line. The property was built in 1991 and is owned by W&W Partnership.
Rainbow Plaza
Owned by Weingarten Realty Investors, Rainbow Plaza totals approximately 278,400 square feet. The shopping center is anchored by Home Depot,JCPenny Home, 24 Hour Fitness Sport, Ultimate Electronics, Rite Aid and Albertsons. The center is 99.6% leased and was constructed in 1995. Locatedat the intersection of Rainbow Boulevard and Alta Drive, the property features a dedicated turn lane, signalized entrance, and is along a bus line.
COM P E T I T I V E S H O P P I N G C E N T E R S D E S C R I P T I O N
31
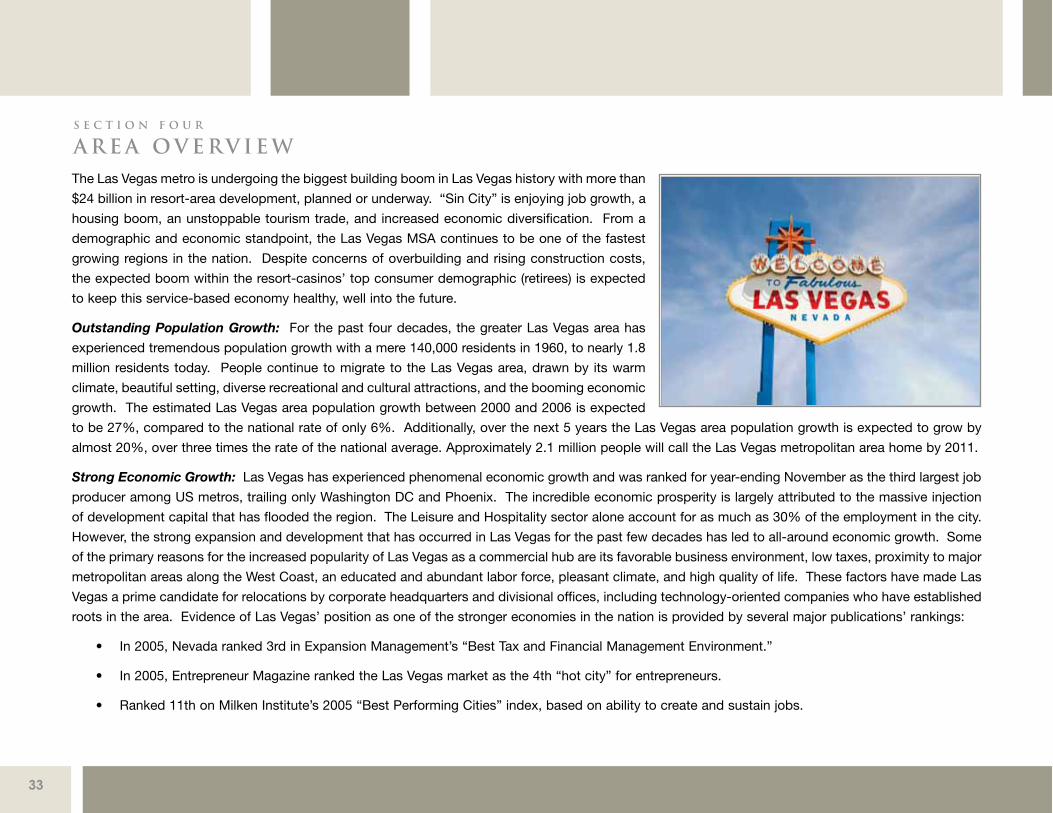
The Las Vegas metro is undergoing the biggest building boom in Las Vegas history with more than
$24 billion in resort-area development, planned or underway. “Sin City” is enjoying job growth, a
housing boom, an unstoppable tourism trade, and increased economic diversification. From a
demographic and economic standpoint, the Las Vegas MSA continues to be one of the fastest
growing regions in the nation. Despite concerns of overbuilding and rising construction costs,
the expected boom within the resort-casinos’ top consumer demographic (retirees) is expected
to keep this service-based economy healthy, well into the future.
Outstanding Population Growth: For the past four decades, the greater Las Vegas area has
experienced tremendous population growth with a mere 140,000 residents in 1960, to nearly 1.8
million residents today. People continue to migrate to the Las Vegas area, drawn by its warm
climate, beautiful setting, diverse recreational and cultural attractions, and the booming economic
growth. The estimated Las Vegas area population growth between 2000 and 2006 is expected
to be 27%, compared to the national rate of only 6%. Additionally, over the next 5 years the Las Vegas area population growth is expected to grow by
almost 20%, over three times the rate of the national average. Approximately 2.1 million people will call the Las Vegas metropolitan area home by 2011.
Strong Economic Growth: Las Vegas has experienced phenomenal economic growth and was ranked for year-ending November as the third largest job
producer among US metros, trailing only Washington DC and Phoenix. The incredible economic prosperity is largely attributed to the massive injection
of development capital that has flooded the region. The Leisure and Hospitality sector alone account for as much as 30% of the employment in the city.
However, the strong expansion and development that has occurred in Las Vegas for the past few decades has led to all-around economic growth. Some
of the primary reasons for the increased popularity of Las Vegas as a commercial hub are its favorable business environment, low taxes, proximity to major
metropolitan areas along the West Coast, an educated and abundant labor force, pleasant climate, and high quality of life. These factors have made Las
Vegas a prime candidate for relocations by corporate headquarters and divisional offices, including technology-oriented companies who have established
roots in the area. Evidence of Las Vegas’ position as one of the stronger economies in the nation is provided by several major publications’ rankings:
• In 2005, Nevada ranked 3rd in Expansion Management’s “Best Tax and Financial Management Environment.”
• In 2005, Entrepreneur Magazine ranked the Las Vegas market as the 4th “hot city” for entrepreneurs.
• Ranked 11th on Milken Institute’s 2005 “Best Performing Cities” index, based on ability to create and sustain jobs.
33
S E C T I O N F O U R
A R E A O V E RV I E W
35
The Las Vegas area enjoys a young, energetic work force, a large selection of recently developed quality housing, and a superior quality of life. The
workforce is highly skilled and educated; 81% of the population over the age of 25 have a high school diploma and19% have a bachelor’s degree or higher.
These important qualities and characteristics ensure that steady and strong growth in the area’s economy and employment will continue in the foreseeable
future.
Employment: As a result of its strong economy, the greater Las Vegas area has also experienced impressive employment growth during the past decade.
The area is exhibiting an increasingly diverse economic base, which has evolved from being a tourism and service-based economy into a center for high-
tech manufacturing industries such as electronics and aerospace. Since 1990, Las Vegas has ranked number one in high-tech job growth (primarily high-
tech services). Additionally, construction remains a major industry in the
Las Vegas area, creating over 12,000 construction jobs alone and with
the value of commercial construction exceeding $2 billion annually.
The average annual unemployment rate in 2005 for the MSA was 4.0%
compared to the national average annual rate of 5.1%. It is predicted
that this trend will continue well into the foreseeable future.
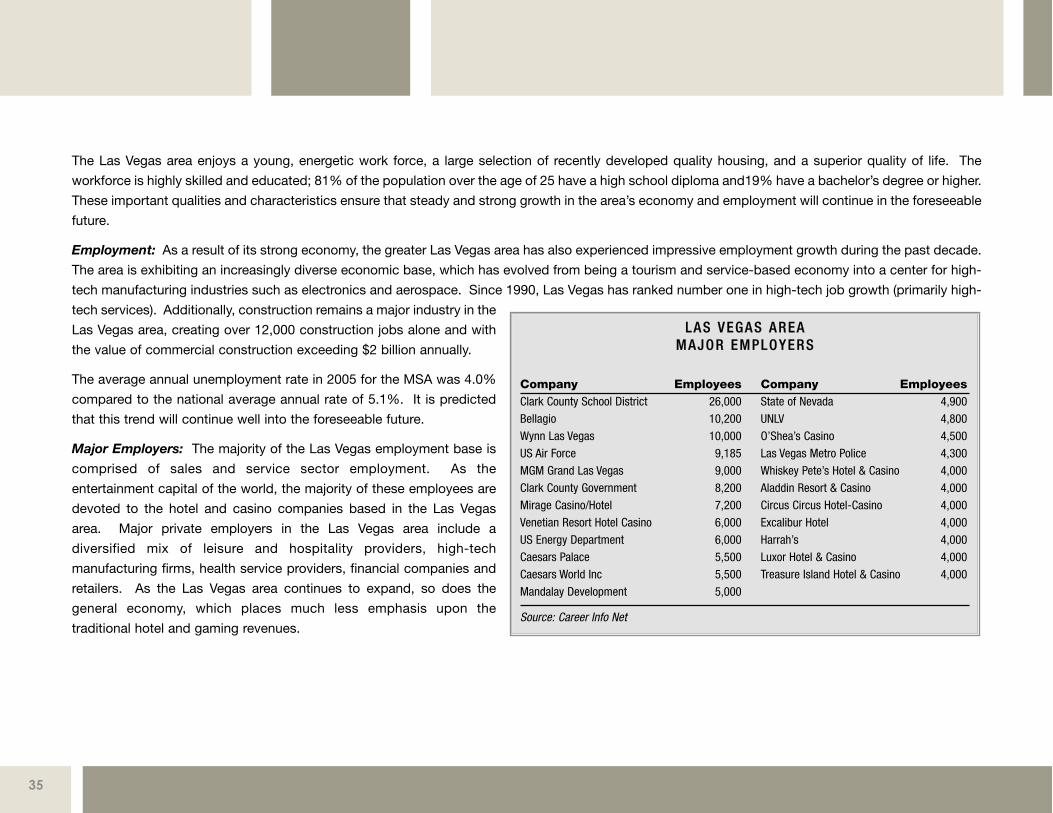
Major Employers: The majority of the Las Vegas employment base is
comprised of sales and service sector employment. As the
entertainment capital of the world, the majority of these employees are
devoted to the hotel and casino companies based in the Las Vegas
area. Major private employers in the Las Vegas area include a
diversified mix of leisure and hospitality providers, high-tech
manufacturing firms, health service providers, financial companies and
retailers. As the Las Vegas area continues to expand, so does the
general economy, which places much less emphasis upon the
traditional hotel and gaming revenues.
LAS VEGAS AREAMAJOR EMPLOYERS
Company Employees Company EmployeesClark County School District 26,000 State of Nevada 4,900
Bellagio 10,200 UNLV 4,800
Wynn Las Vegas 10,000 O’Shea’s Casino 4,500
US Air Force 9,185 Las Vegas Metro Police 4,300
MGM Grand Las Vegas 9,000 Whiskey Pete’s Hotel & Casino 4,000
Clark County Government 8,200 Aladdin Resort & Casino 4,000
Mirage Casino/Hotel 7,200 Circus Circus Hotel-Casino 4,000
Venetian Resort Hotel Casino 6,000 Excalibur Hotel 4,000
US Energy Department 6,000 Harrah’s 4,000
Caesars Palace 5,500 Luxor Hotel & Casino 4,000
Caesars World Inc 5,500 Treasure Island Hotel & Casino 4,000
Mandalay Development 5,000
Source: Career Info Net

Household Income: The estimated median household income for
the Las Vegas MSA in 2006 is $51,001, a figure higher than that
reported by the nation. Additionally, approximately 68% of the
households in the MSA have an income that is greater than $35,000,
compared to approximately 64% for the nation. Property taxes are
very low in Las Vegas and there is no state income tax, making the
area an ideal place to live.
Tourism and The Entertainment Capital of the World: Las Vegas
has evolved into one of the most popular travel destinations in the
world with nearly 39 million visitors in 2005 alone contributing over
$36.7 billion to the local economy. This world-class entertainment
destination is complete with award-winning fine dining, shopping,
nightlife, golf, spas, production shows, and concert headliners. The
attractions in Las Vegas attract people from all demographics of life
from all around the world. Hence, tourism continues to be a major
contributor to the local and regional economy. The combination of
man-made and natural amenities and excitement is unparalleled.
Las Vegas is also a premier meeting and convention destination. Las
Vegas has 9.5 million square feet of meeting and exhibition space,
including three of the nation’s largest convention centers (Las Vegas
Convention Center, Mandalay Bay Convention Center, and Sands
Expo Center). Of the 38.6 million visitors in 2005, 6.2 million people
were convention delegates that generated more than $7.6 billion in
non-gaming revenue.
36
Well-Know Resorts/ Man-Made Natural Hotels Entertainment AmenitiesBellagio Retail Malls Red rock Canyon
Caesar’s Palace Retail Outlets Mt. Charleston
Hard Rock Production Shows/Concerts Lake Mead
Mandalay Bay Fine Dining Grand Canyon National Park
MGM Grand Gaming Valley of Fire State Park
The Mirage Golf Courses Death Valley National Park
Ney York-New York Conventions (9.5 million SF) Floyd Lamb National Park
Venetian Sporting Events Hoover Dam
Wynn Dance Clubs & Lounges Spring Mountain Ranch
Education and Life Quality Infrastructure: Las Vegas contains six colleges and universities: University of Nevada – Las Vegas, Community College ofSouthern Nevada, University of Nevada School of Medicine, San Joaquin Valley College, University of Phoenix, and Webster University. There are 37 parksin the city, and two National Recreation areas in the metro area including Lake Mead and Red Rock Canyon.
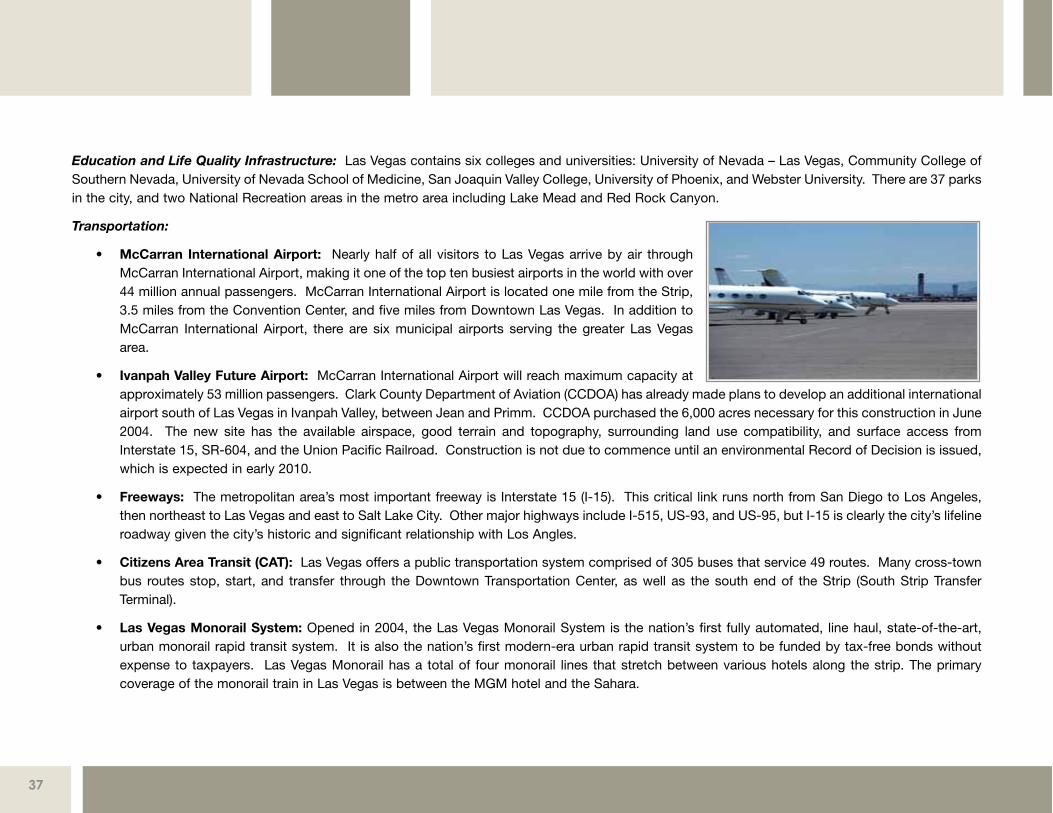
Transportation:
• McCarran International Airport: Nearly half of all visitors to Las Vegas arrive by air throughMcCarran International Airport, making it one of the top ten busiest airports in the world with over44 million annual passengers. McCarran International Airport is located one mile from the Strip,3.5 miles from the Convention Center, and five miles from Downtown Las Vegas. In addition toMcCarran International Airport, there are six municipal airports serving the greater Las Vegasarea.
• Ivanpah Valley Future Airport: McCarran International Airport will reach maximum capacity atapproximately 53 million passengers. Clark County Department of Aviation (CCDOA) has already made plans to develop an additional internationalairport south of Las Vegas in Ivanpah Valley, between Jean and Primm. CCDOA purchased the 6,000 acres necessary for this construction in June2004. The new site has the available airspace, good terrain and topography, surrounding land use compatibility, and surface access fromInterstate 15, SR-604, and the Union Pacific Railroad. Construction is not due to commence until an environmental Record of Decision is issued,which is expected in early 2010.
• Freeways: The metropolitan area’s most important freeway is Interstate 15 (I-15). This critical link runs north from San Diego to Los Angeles,then northeast to Las Vegas and east to Salt Lake City. Other major highways include I-515, US-93, and US-95, but I-15 is clearly the city’s lifelineroadway given the city’s historic and significant relationship with Los Angles.
• Citizens Area Transit (CAT): Las Vegas offers a public transportation system comprised of 305 buses that service 49 routes. Many cross-townbus routes stop, start, and transfer through the Downtown Transportation Center, as well as the south end of the Strip (South Strip TransferTerminal).
• Las Vegas Monorail System: Opened in 2004, the Las Vegas Monorail System is the nation’s first fully automated, line haul, state-of-the-art,urban monorail rapid transit system. It is also the nation’s first modern-era urban rapid transit system to be funded by tax-free bonds withoutexpense to taxpayers. Las Vegas Monorail has a total of four monorail lines that stretch between various hotels along the strip. The primarycoverage of the monorail train in Las Vegas is between the MGM hotel and the Sahara.
37

F I N A N C I A L S U M M A R Y
The cash flow projections in this Financing Summary are based on various sources including 2007 budgeted operating information, leases in-place, data
obtained from the current owner and market research. These cash flow projections were prepared to assist prospective investors in their review of the
acquisition opportunity and are only one estimate of the future cash flows. Prospective investors are encouraged to perform their own due diligence and
develop their own independent analysis.
Property cash flows were derived using ARGUS Version 12.0 software. A CD is included with this Financing Summary to assist in the further evaluation
of the Property. The projections were completed on a calendar year basis using calendar year inflation and cover the 11-year period commencing January
1, 2007 through December 31, 2017. The assumptions for the market rents, tenant improvements, leasing commissions and inflation rates are based upon
current market information.
Average Occupancy: Average occupancy approximates the overall annual occupancy of the Property throughout the projection by incorporating turnover
vacancy. The average occupancy is 95.4% over the projection period. As of January 2007, is assumed to be Sahara Pavilion South is 100% leased and
the current in-place occupancy is 91.1%.
Effective Average Occupancy: Effective average occupancy approximates the overall annual economic occupancy of the Property throughout the
projection period by incorporating rollover downtime and a vacancy/credit loss factor of 3.0% of scheduled base rental revenues. The effective average
occupancy is 98.2% over the projection period.
S E C T I O N F I V E
F I N A N C I A L A N A LY S I S
39
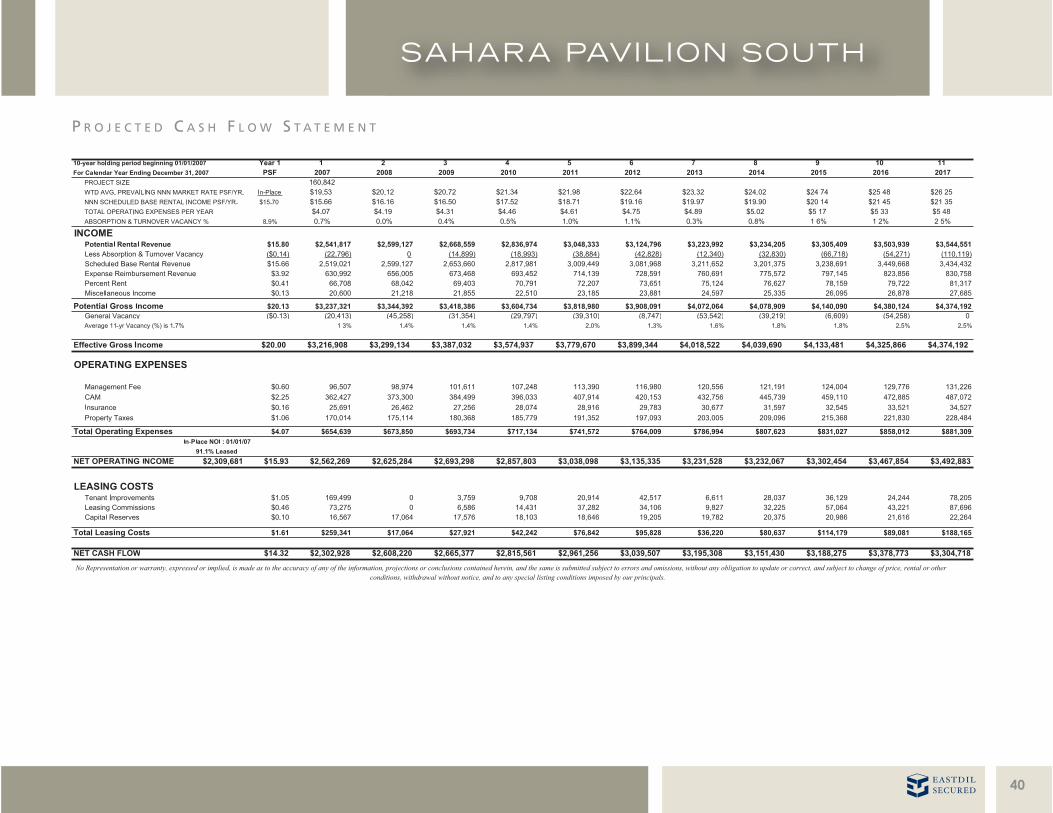
P R O J E C T E D C A S H F L O W S T A T E M E N T
40
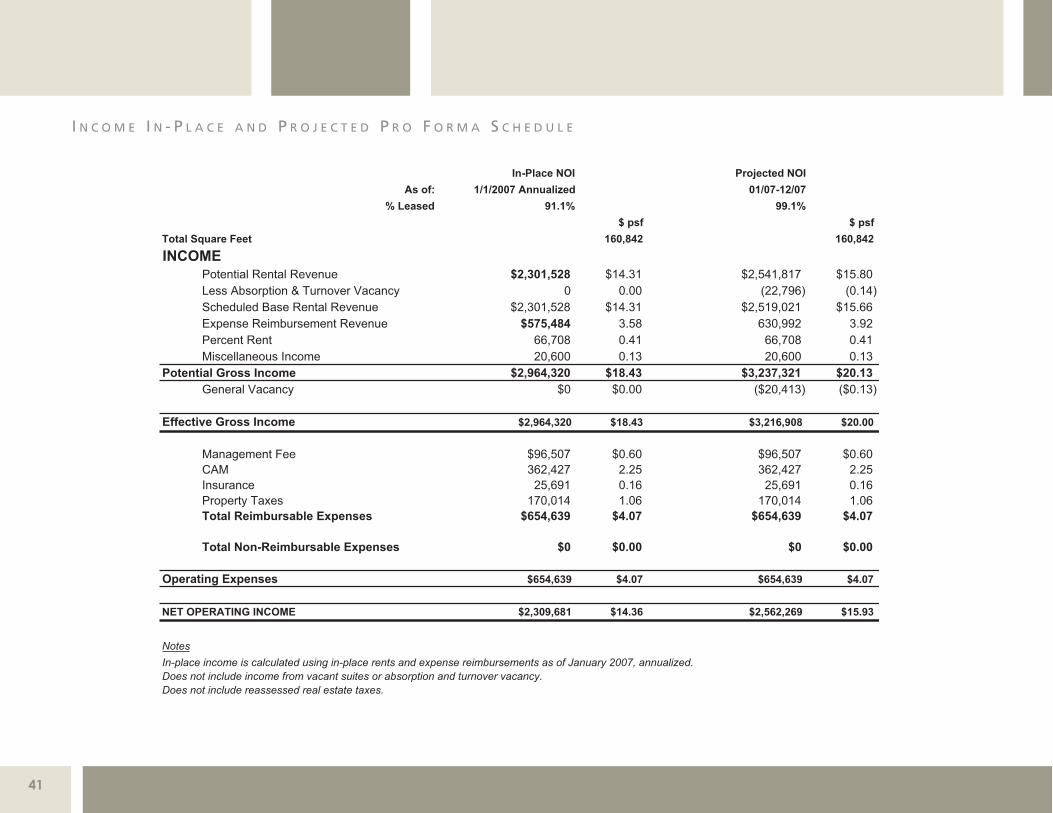
I N C O M E I N - P L A C E A N D P R O J E C T E D P R O F O R M A S C H E D U L E
41
C A S H F L O W A S S U M P T I O N S
All revenues and expenses are modeled using the assumptions outlined below:
R E V E N U E S
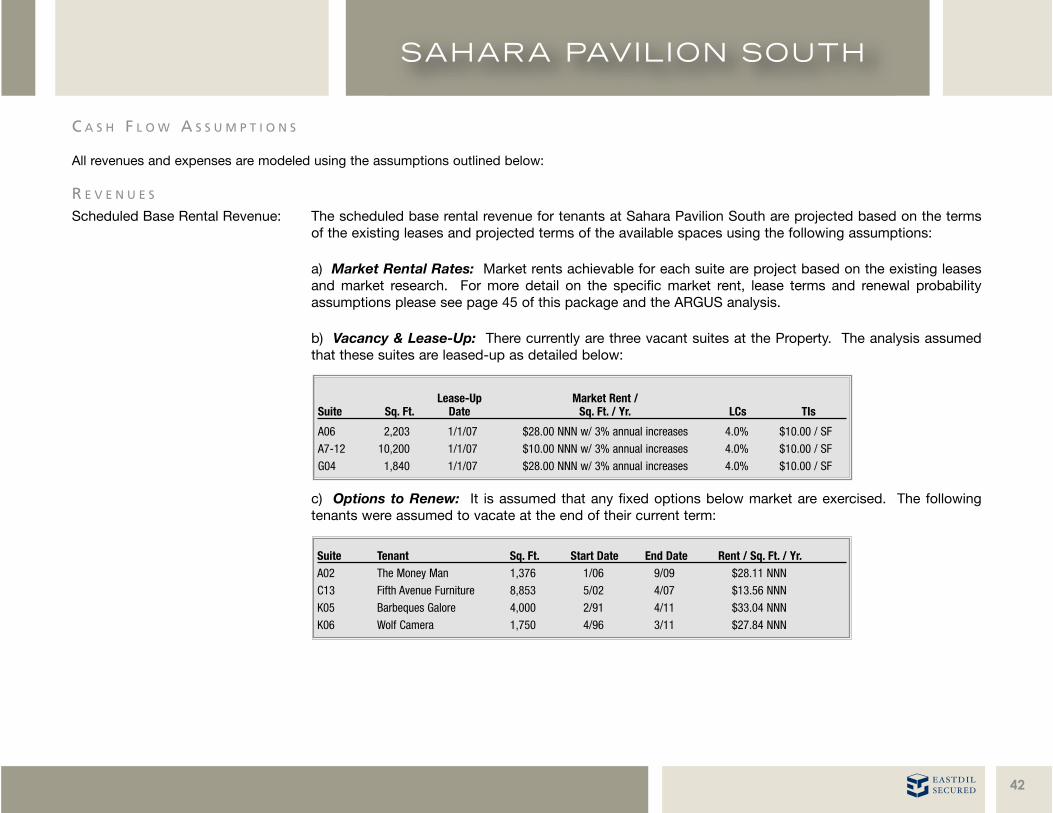
Scheduled Base Rental Revenue: The scheduled base rental revenue for tenants at Sahara Pavilion South are projected based on the termsof the existing leases and projected terms of the available spaces using the following assumptions:
a) Market Rental Rates: Market rents achievable for each suite are project based on the existing leasesand market research. For more detail on the specific market rent, lease terms and renewal probabilityassumptions please see page 45 of this package and the ARGUS analysis.
b) Vacancy & Lease-Up: There currently are three vacant suites at the Property. The analysis assumedthat these suites are leased-up as detailed below:
c) Options to Renew: It is assumed that any fixed options below market are exercised. The followingtenants were assumed to vacate at the end of their current term:
42
Lease-Up Market Rent /Suite Sq. Ft. Date Sq. Ft. / Yr. LCs TIs
A06 2,203 1/1/07 $28.00 NNN w/ 3% annual increases 4.0% $10.00 / SF
A7-12 10,200 1/1/07 $10.00 NNN w/ 3% annual increases 4.0% $10.00 / SF
G04 1,840 1/1/07 $28.00 NNN w/ 3% annual increases 4.0% $10.00 / SF
Suite Tenant Sq. Ft. Start Date End Date Rent / Sq. Ft. / Yr.A02 The Money Man 1,376 1/06 9/09 $28.11 NNN
C13 Fifth Avenue Furniture 8,853 5/02 4/07 $13.56 NNN
K05 Barbeques Galore 4,000 2/91 4/11 $33.04 NNN
K06 Wolf Camera 1,750 4/96 3/11 $27.84 NNN
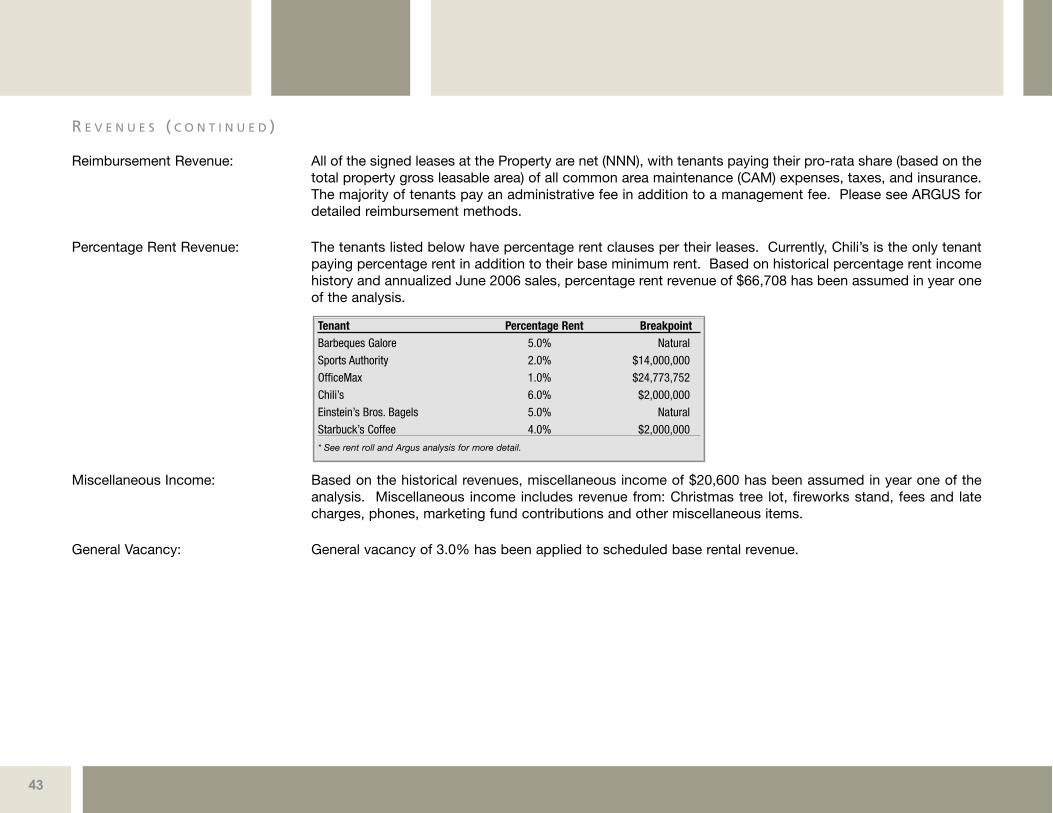
Reimbursement Revenue: All of the signed leases at the Property are net (NNN), with tenants paying their pro-rata share (based on thetotal property gross leasable area) of all common area maintenance (CAM) expenses, taxes, and insurance.The majority of tenants pay an administrative fee in addition to a management fee. Please see ARGUS fordetailed reimbursement methods.
Percentage Rent Revenue: The tenants listed below have percentage rent clauses per their leases. Currently, Chili’s is the only tenantpaying percentage rent in addition to their base minimum rent. Based on historical percentage rent incomehistory and annualized June 2006 sales, percentage rent revenue of $66,708 has been assumed in year oneof the analysis.
Miscellaneous Income: Based on the historical revenues, miscellaneous income of $20,600 has been assumed in year one of theanalysis. Miscellaneous income includes revenue from: Christmas tree lot, fireworks stand, fees and latecharges, phones, marketing fund contributions and other miscellaneous items.
General Vacancy: General vacancy of 3.0% has been applied to scheduled base rental revenue.
R E V E N U E S ( C O N T I N U E D )
43
Tenant Percentage Rent BreakpointBarbeques Galore 5.0% Natural
Sports Authority 2.0% $14,000,000
OfficeMax 1.0% $24,773,752
Chili’s 6.0% $2,000,000
Einstein’s Bros. Bagels 5.0% Natural
Starbuck’s Coffee 4.0% $2,000,000
* See rent roll and Argus analysis for more detail.
O P E R A T I N G E X P E N S E S
Year one projected operating expenses are based on the 2007 Budget, information provided by management as well as costs typical to operate similar
type properties. All expenses, except management fees, are inflated by 3.0% on an annual basis.
R E I M B U R S A B L E E X P E N S E S
Management Fee: The majority of tenants pay an administrative fee in addition to a management fee. The management fee isassumed to be 3.0% of the effective gross income.
Common Area Maintenance: CAM represents operating costs related to cleaning, electrical maintenance, HVAC, trash removal, plumbing,security, landscaping, general building maintenance, repairs and maintenance, utilities and parking .
Real Estate Taxes: Taxes are based on the 2006/2007 tax bills. Eastdil Secured has not assumed a tax reassessment upon salein the analysis.
Insurance: Insurance includes property, liability and earthquake.
L E A S I N G C O S T S
Tenant Improvements: A $10.00 per square foot tenant improvement allowances for all new leases have been assumed to for allnew leases, growing 3.0% per year, and no allowance has been assumed for renewals.
Leasing Commissions: Leasing commissions have been assumed to be 4.0% for all new and 2.0% for all renewals.
Capital Reserves: A capital reserve allowance of $0.10 per square foot has been assumed in the analysis.
44

C A S H F L O W A S S U M P T I O N S S C H E D U L E
45
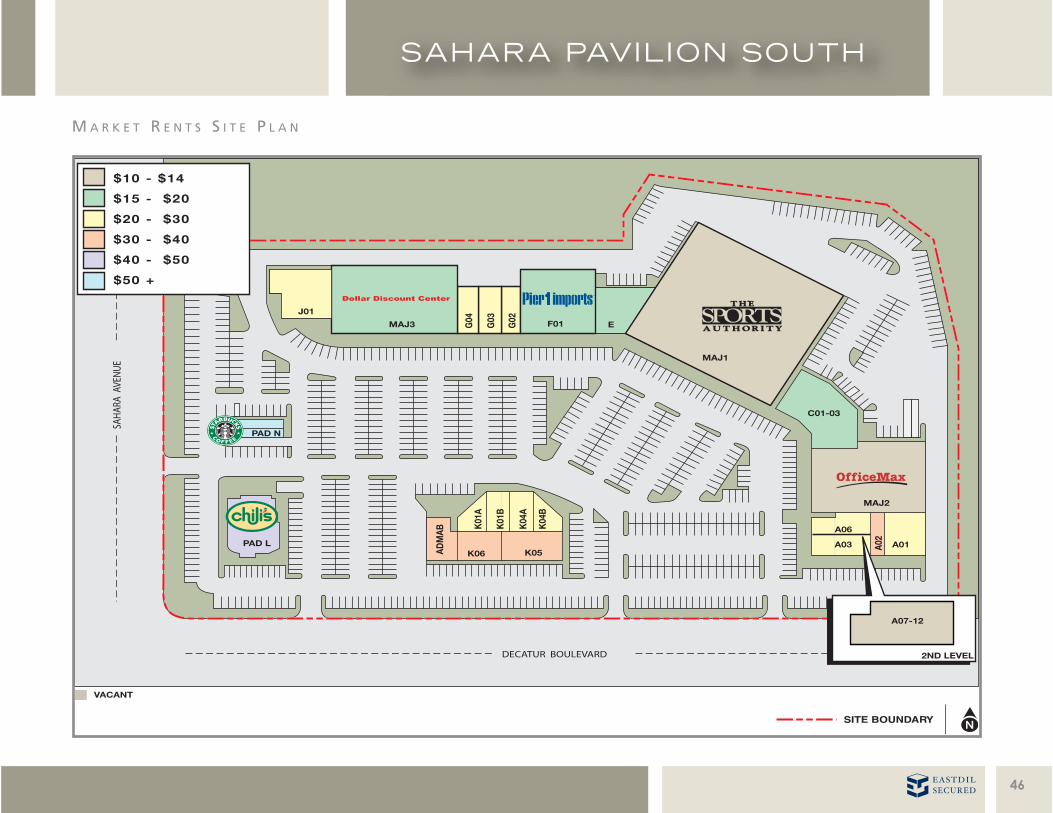
M A R K E T R E N T S S I T E P L A N
46
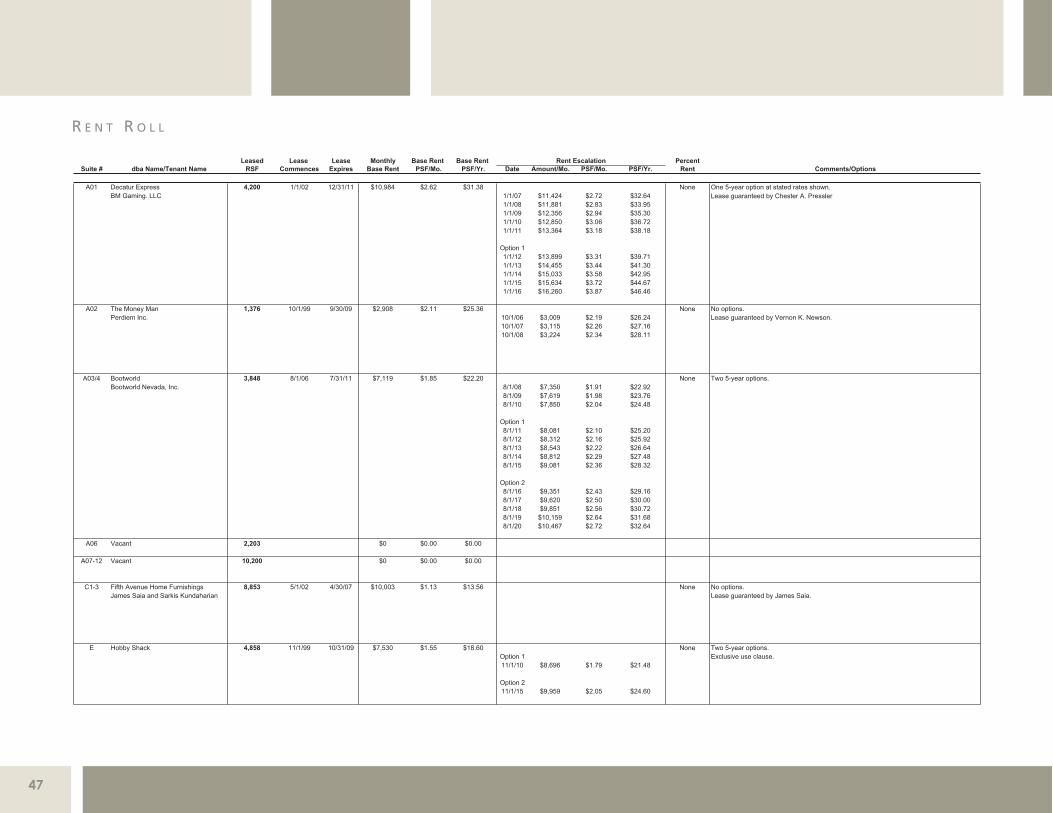
R E N T R O L L
47
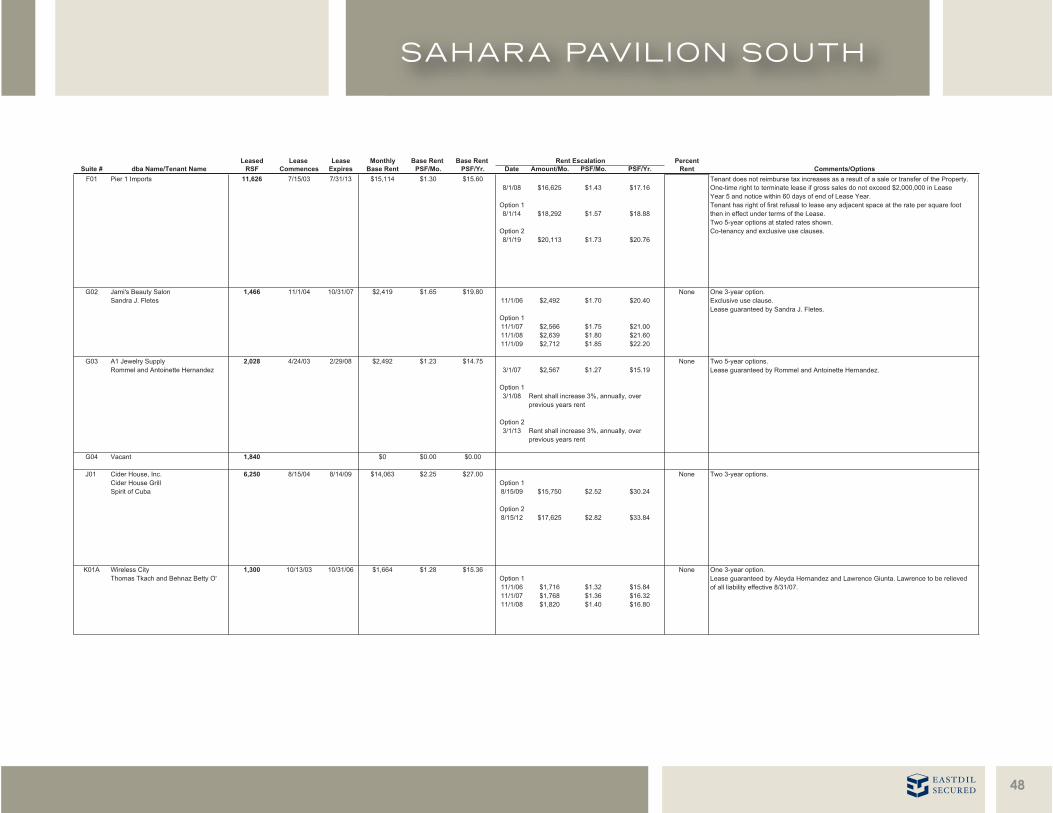
48
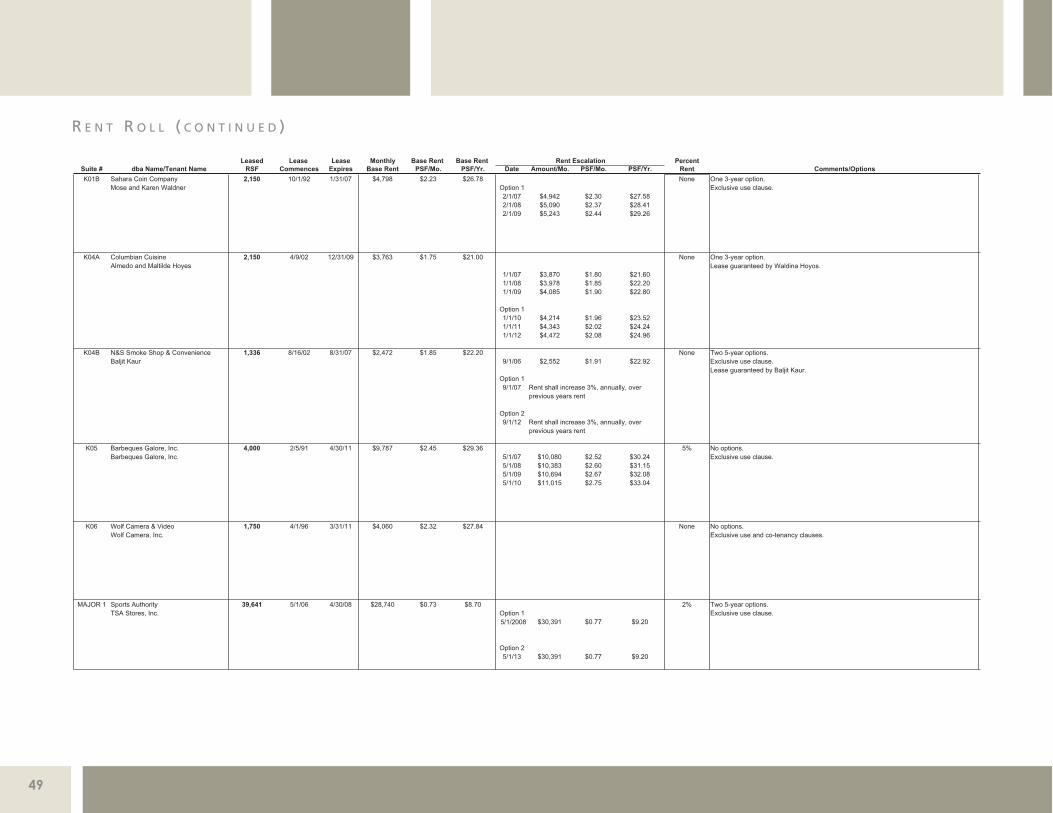
R E N T R O L L ( C O N T I N U E D )
49
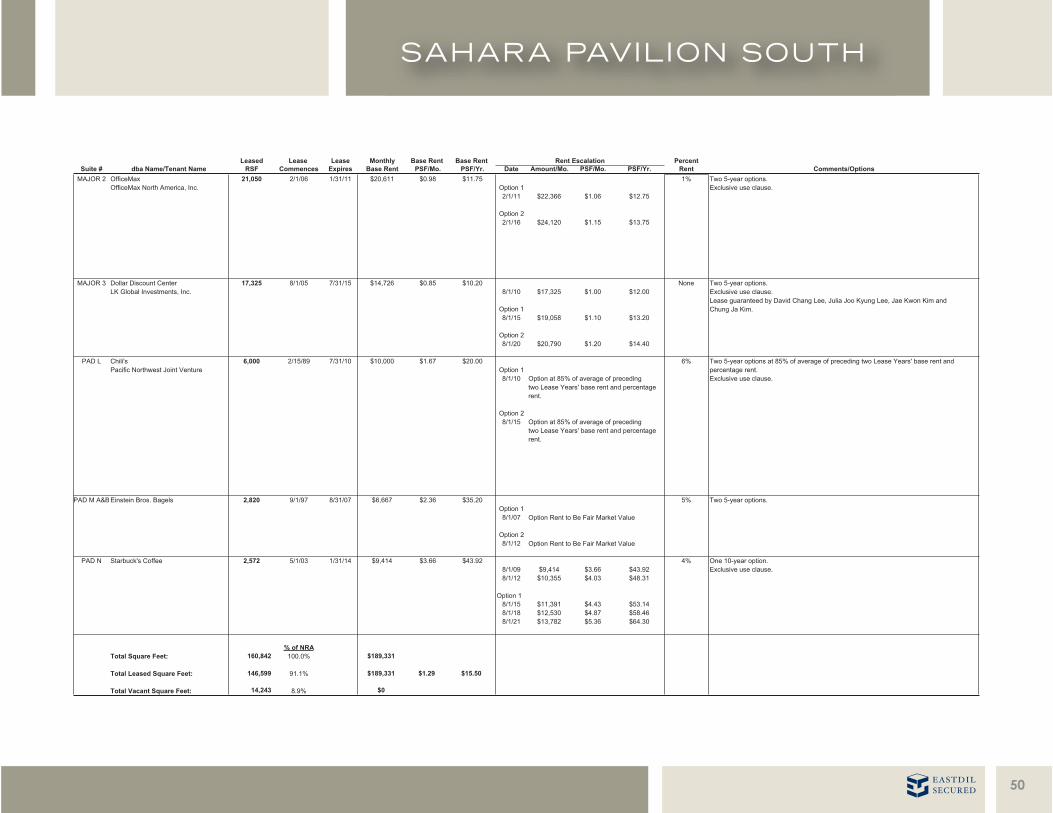
50

T E N A N T S U M M A R Y
51
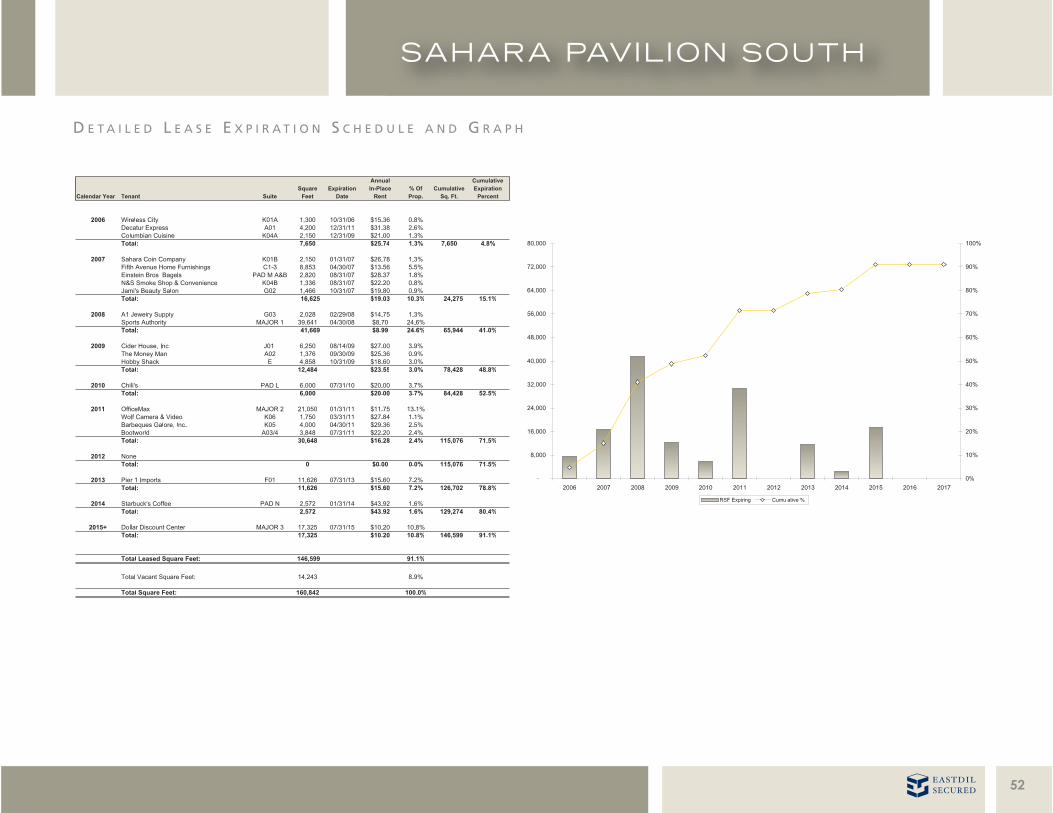
D E T A I L E D L E A S E E X P I R A T I O N S C H E D U L E A N D G R A P H
52
T E N A N T P R O F I L E S
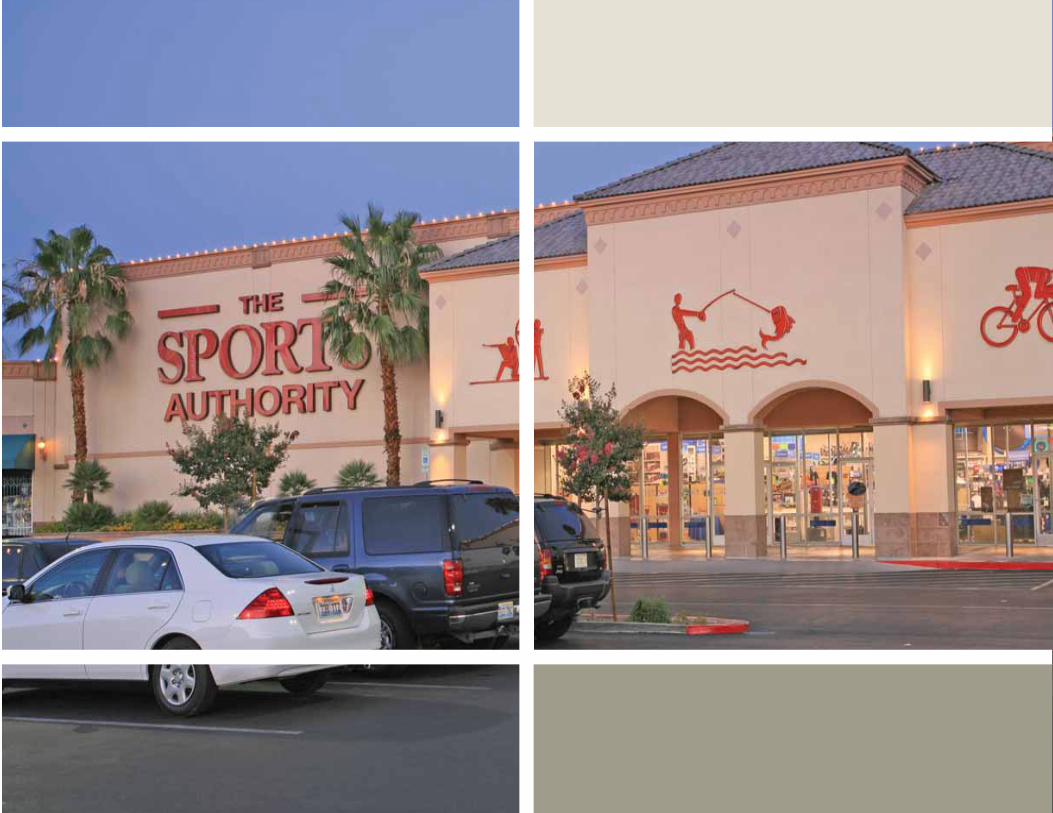
The Sports Authority is privately held (as of May 2006) and is the largest US sporting
goods chain (with nearly 400 stores in 45 states). It sells sports equipment, general
merchandise, shoes, and apparel. It also has an online store, run through an agreement
with GSI Commerce (formerly Global Sports), and sells through a joint venture (called
MegaSports) with AEON, which runs about 40 stores in Japan. (The Sports Authority owns
about 20% of MegaSports). Senior managers of The Sports Authority together with an
investor group led by Leonard Green & Partners took the company private in 2006.
After merging with #2 sporting goods retailer Gart Sports, the combined entity became
known as The Sports Authority. The company is in the midst of a major rebranding effort as a result. Currently it operates stores under three brand names:
The Sports Authority, Gart Sports, and Sportmart. (All Oshman's stores have been renamed Sports Authority.) By the end of 2006 the company plans to
operate all of its stores under The Sports Authority nameplate, up from about 75% at the end of 2005. The Sports Authority is currently redesigning its
stores to attract more team-sports fans and active families by adding fresh new brands to its merchandise roster. Its game plan is to court customers
willing to pay full price. To that end, The Sports Authority is stocking more top-quality brands in categories such as apparel, fitness, footwear, golf, and
team sports.
53
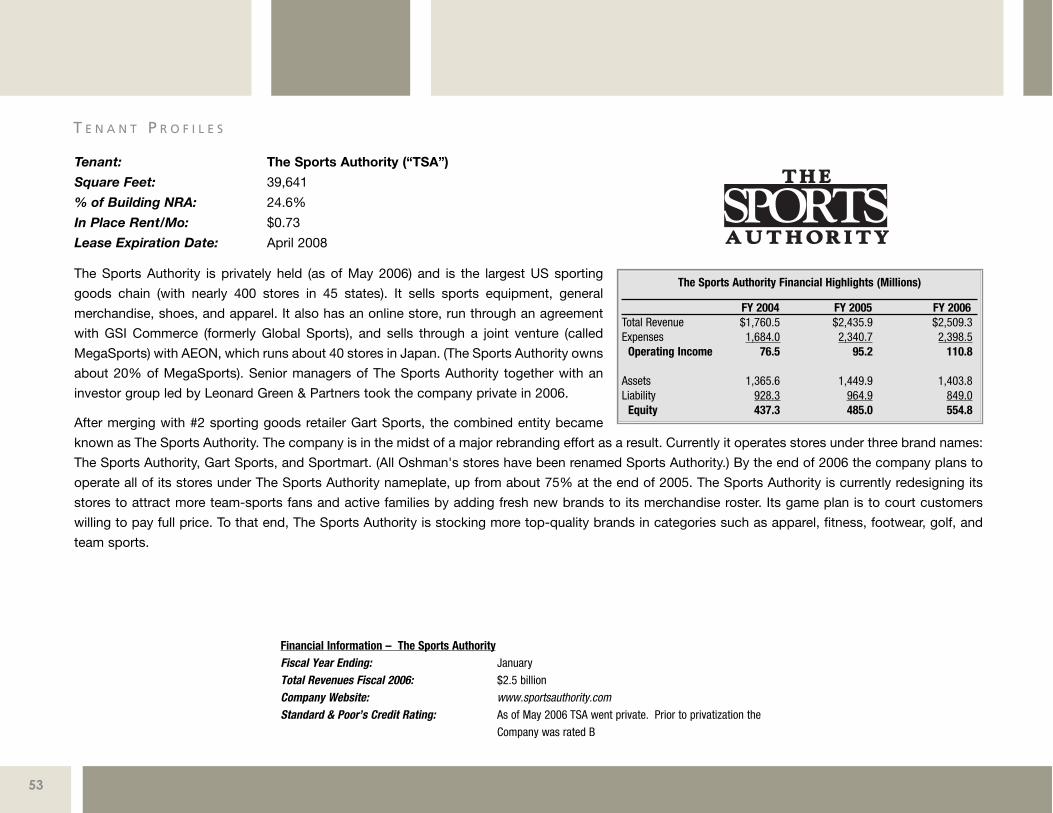
Tenant: The Sports Authority (“TSA”)
Square Feet: 39,641
% of Building NRA: 24.6%
In Place Rent/Mo: $0.73
Lease Expiration Date: April 2008
The Sports Authority Financial Highlights (Millions)
FY 2004 FY 2005 FY 2006Total Revenue $1,760.5 $2,435.9 $2,509.3Expenses 1,684.0 2,340.7 2,398.5
Operating Income 76.5 95.2 110.8
Assets 1,365.6 1,449.9 1,403.8Liability 928.3 964.9 849.0
Equity 437.3 485.0 554.8
Financial Information – The Sports AuthorityFiscal Year Ending: January
Total Revenues Fiscal 2006: $2.5 billion
Company Website: www.sportsauthority.comStandard & Poor’s Credit Rating: As of May 2006 TSA went private. Prior to privatization the
Company was rated B
54
OfficeMax (formerly Boise Cascade) is the third largest office products retailer in North
America, with nearly 900 superstores in the US, Mexico, Puerto Rico, and the US Virgin
Islands. The stores offer about 8,000 name-brand and OfficeMax-branded products,
including paper, pens, forms, and organizers, as well as office furniture and a wide range
of technology products. OfficeMax also provides printing and document services through
its CopyMax store-within-a-store. In addition to its retail outlets, the company's contract
division sells directly to business and government customers through field agents,
telesales, and catalogs.
Looking to improve its balance sheet, OfficeMax announced a major restructuring effort in 2006 that will see the company close 110 underperforming
locations in the US. Sahara Pavilion South is not one of these locations. Meanwhile, it hopes to open about 70 new locations during the year. The office
products company is also rolling out a new retail store prototype that abandons the warehouse-style format and instead highlights small- and home-office
solutions in a warmer atmosphere. Office and building products manufacturer Boise Cascade acquired OfficeMax in 2003 for $1.2 billion and changed its
name in 2004 after selling its manufacturing operations to Madison Dearborn Partners for $3.7 billion.
For the six months ended July 2006, OfficeMax Incorporated's revenues increased
1% to $4.46 billion. Net income from continuing operations & applicable to
common stock totaled $11.3M vs. a loss of $20.5M. Revenues reflect an increase
in sales due to the five additional selling days for the domestic operations of the
Contract segment and higher comparable store sales in the Retail segment. Net
income reflects the absence of debt retirement expense.
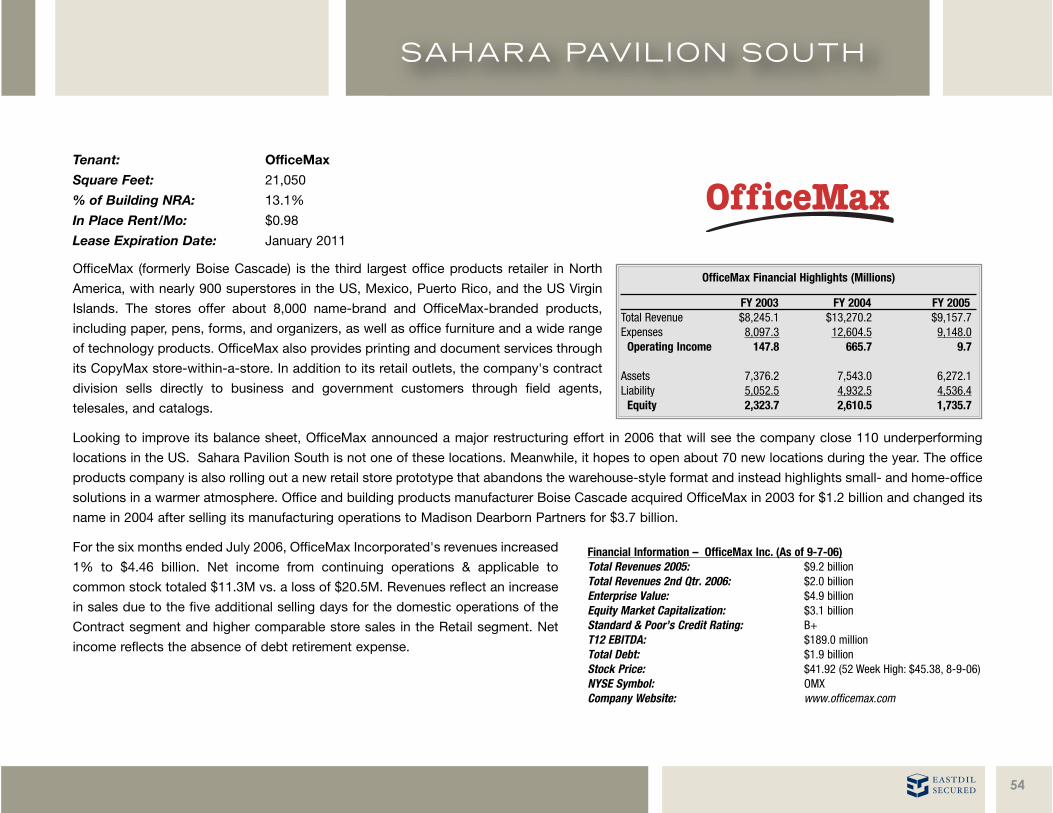
Tenant: OfficeMax
Square Feet: 21,050
% of Building NRA: 13.1%
In Place Rent/Mo: $0.98
Lease Expiration Date: January 2011
OfficeMax Financial Highlights (Millions)
FY 2003 FY 2004 FY 2005Total Revenue $8,245.1 $13,270.2 $9,157.7Expenses 8,097.3 12,604.5 9,148.0
Operating Income 147.8 665.7 9.7
Assets 7,376.2 7,543.0 6,272.1Liability 5,052.5 4,932.5 4,536.4
Equity 2,323.7 2,610.5 1,735.7
Financial Information – OfficeMax Inc. (As of 9-7-06)Total Revenues 2005: $9.2 billionTotal Revenues 2nd Qtr. 2006: $2.0 billionEnterprise Value: $4.9 billionEquity Market Capitalization: $3.1 billionStandard & Poor’s Credit Rating: B+T12 EBITDA: $189.0 millionTotal Debt: $1.9 billionStock Price: $41.92 (52 Week High: $45.38, 8-9-06)NYSE Symbol: OMXCompany Website: www.officemax.com
Pier 1 Imorts sells about 4,000 items (imported from more than 40 countries) through
about 1,260 Pier 1 Imports and Pier 1 Kids stores in the US, Puerto Rico, Canada, and
Mexico. Pier 1 stores offer a wide selection of indoor and outdoor furniture, lamps, vases,
baskets, ceramics, dinnerware, candles, and other specialty products. Many of the
products are handcrafted; the company favors natural materials such as rattan and wood.
The company has agreed to sell its proprietary credit card business to JPMorgan Chase.
Pier 1 Imports is reorganizing the products it sells. Its new look -- named "Metro Glam" on
the company's Web site -- is closer to that found in Crate & Barrel and Pottery Barn stores
than the company's traditional competitors, such as Cost Plus’s World Markets. Furniture accounts for more than a third of sales, and decorative items
(lamps, vases, baskets) account for another quarter. The stores also sell bed and bath products, housewares, and seasonal items. Pier 1 started selling
online in 2000 and has hinted that it might create or buy high-end and low-end home furnishings chains (such as The Gap's upscale Banana Republic and
lower-priced Old Navy chains). In 2005 the retailer launched its first catalog, with more planned for 2006, including the first Pier 1 Kids catalog.
The company plans to add 10 Pier 1 stores and close five Pier 1 Kids stores in North America this year. Also, five new stores are planned for Mexico and
two for Puerto Rico. Ultimately, the company's strategy is to expand its North American store base to at least 1,500 locations. (Pier 1 Imports has sold its
UK operations to focus on its business in North America.) Pier 1 Kids (formerly Cargokids), acquired in 2001 from home furnishings manufacturer
Tandycrafts, is a 40-plus store retailer of children's furniture and accessories. Pier 1
Kids has its own Web site (pier1kids.com). Over the next decade, Pier 1 plans to
expand Pier 1 Kids to 250 to 300 stores nationwide.
For the fiscal first quarter ended May 2006, Pier 1 Imports, Inc.'s revenues
decreased 4% to $376.1 million. Net loss from continuing operations totaled $22.8
million, up from $8.5 million. Revenue reflects decreased comparable store sales.
Net loss reflects decreased operating margins, an increase in selling, general &
administrative expenses and increased interest expense.
T E N A N T P R O F I L E S ( C O N T I N U E D )
55
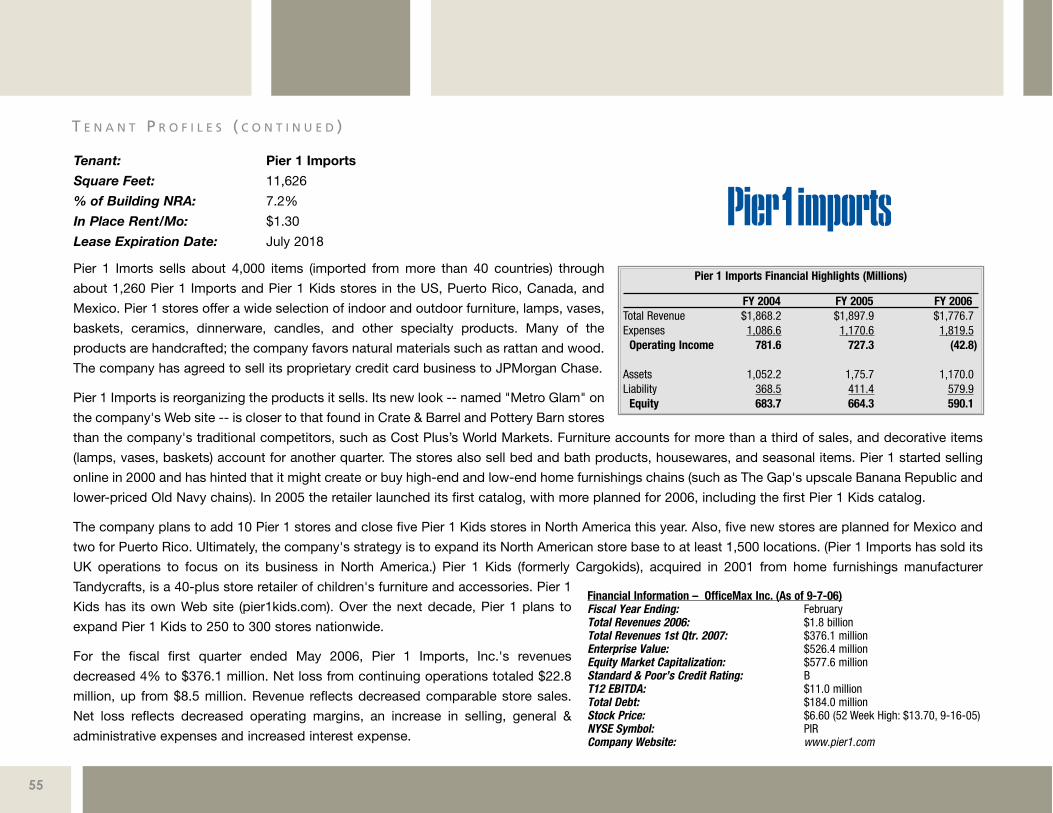
Tenant: Pier 1 Imports
Square Feet: 11,626
% of Building NRA: 7.2%
In Place Rent/Mo: $1.30
Lease Expiration Date: July 2018
Pier 1 Imports Financial Highlights (Millions)
FY 2004 FY 2005 FY 2006Total Revenue $1,868.2 $1,897.9 $1,776.7Expenses 1,086.6 1,170.6 1,819.5
Operating Income 781.6 727.3 (42.8)
Assets 1,052.2 1,75.7 1,170.0Liability 368.5 411.4 579.9
Equity 683.7 664.3 590.1
Financial Information – OfficeMax Inc. (As of 9-7-06)Fiscal Year Ending: FebruaryTotal Revenues 2006: $1.8 billionTotal Revenues 1st Qtr. 2007: $376.1 millionEnterprise Value: $526.4 millionEquity Market Capitalization: $577.6 millionStandard & Poor’s Credit Rating: BT12 EBITDA: $11.0 millionTotal Debt: $184.0 millionStock Price: $6.60 (52 Week High: $13.70, 9-16-05)NYSE Symbol: PIRCompany Website: www.pier1.com
56
Brinker International (parent company of Chili’s) is the world's second largest casual-
dining restaurant operator in terms of revenue, with more than 1,600 restaurant locations
in about 20 countries. Its flagship Chili's Grill & Bar chain has about 1,200 restaurants and
trails only Applebee's as the largest full-service chain. Specializing in southwestern-style
dishes, Chili's menu features fajitas, margarita grilled chicken, and its popular baby back
ribs. Brinker also operates the Italian-themed Romano's Macaroni Grill, with more than
240 locations, as well as such smaller chains as On The Border Mexican Grill & Cantina
and Maggiano's Little Italy. Named after founder and casual-dining pioneer Norman
Brinker, the company has successfully capitalized on America's love of ethnic and regional foods, and it continues to create eateries based around unified
themes in which the menu matches the surroundings.
Brinker's flagship Chili's and Macaroni Grill chains continue to enjoy loyal followings thanks in part to aggressive spending on advertising in an effort to
stay ahead of the competition. The company has pursued a modest expansion strategy, with plans to add about 140 Chili's locations, including about a
dozen franchised units. Brinker also intends to introduce new menu selections and more efficient service at Chili's to stay attractive to its customer base.
To achieve its expansion goals, Brinker is looking beyond its core markets in metropolitan areas and opening new restaurants in smaller towns, as well as
in non-traditional locations, such as shopping malls and airports. Internationally, it is focused on franchising to increase the size of its chains.
For the year ended June 2006, Brinker International, Inc's revenues rose 11% to
$4.15 billion. Net income from continuing operations rose 35% to $214 million.
Revenues reflect increased comparable store sales due to opening of 43 new
restaurants. Net income also reflects decreased interest expenses and decrease in
restructuring charges & other impairments.
Tenant: Chili’s
Square Feet: 6,000
% of Building NRA: 3.7%
In Place Rent/Mo: $1.67
Lease Expiration Date: July 2010
Brinker Int’l Financial Highlights (Millions)
FY 2004 FY 2005 FY 2006Total Revenue $3,707.5 $3,912.9 $4,151.3Expenses 3,461.1 3,691.6 3,824.7
Operating Income 246.4 221.3 326.6
Assets 2,207.4 2,156.1 2,221.8Liability 1,197.0 1,055.8 1,145.9
Equity 1,010.4 1,100.3 1,075.7
Financial Information – OfficeMax Inc. (As of 9-7-06)Fiscal Year Ending: JuneTotal Revenues 2006: $4.2 billionTotal Revenues 4th Qtr. 2006: $1.1 billionEnterprise Value: $3.7 billionEquity Market Capitalization: $3.2 billionStandard & Poor’s Credit Rating: BBBT12 EBITDA: $518.8 millionTotal Debt: $502.7 millionStock Price: $38.75 (52 Week High: $43.16, 3-16-06)NYSE Symbol: EATCompany Website: www.brinker.com


