64
| 1 a Berkshire Hathaway and Jefferies Financial Group company 744 SOUTH RIDGELEY DRIVE LOS ANGELES, CA 90036 OFFERING MEMORANDUM Virtual Tour: https://vimeo.com/453480802/d4c405cd7f

| 1a Berkshire Hathaway and Jefferies Financial Group company
744 SOUTH RIDGELEY DRIVELOS ANGELES, CA 90036
UNITS: 7YEAR BUILT: 1937
OFFERING MEMORANDUM
Virtual Tour: https://vimeo.com/453480802/d4c405cd7f

INVESTMENT ADVISORS
Brent SprenkleSenior Managing Director
[email protected] BRE License #01290116
SOUTH BAY OFFICE2321 Rosecrans AvenueSuite #3235El Segundo, CA 90245
PROPERTY HIGHLIGHTS
1
2
3
4
Gorgeous French Normandie Architecture
All Units Recently Remodeled to High End Specs
Prime Miracle Mile Location-95 Walk Score
Great Unit Mix of One- and Two-Bedrooms

TABLE OF CONTENTS
THE PROPERTY ..............................................4FINANCIAL ANALYSIS ................................ 12MARKET POSITIONING ............................. 16ECONOMIC AND DEMOGRAPHIC OVERVIEW .................................................. 28DEMOGRAPHICS ........................................ 46MULTIFAMILY REPORT ............................. 58

THE PROPERTY

The Property | 5
PROPERTY SUMMARYUnits 7
Year Built 1937
Parcel Number(s) 5089-005-010
Average SF 867±
Site Acreage .20±
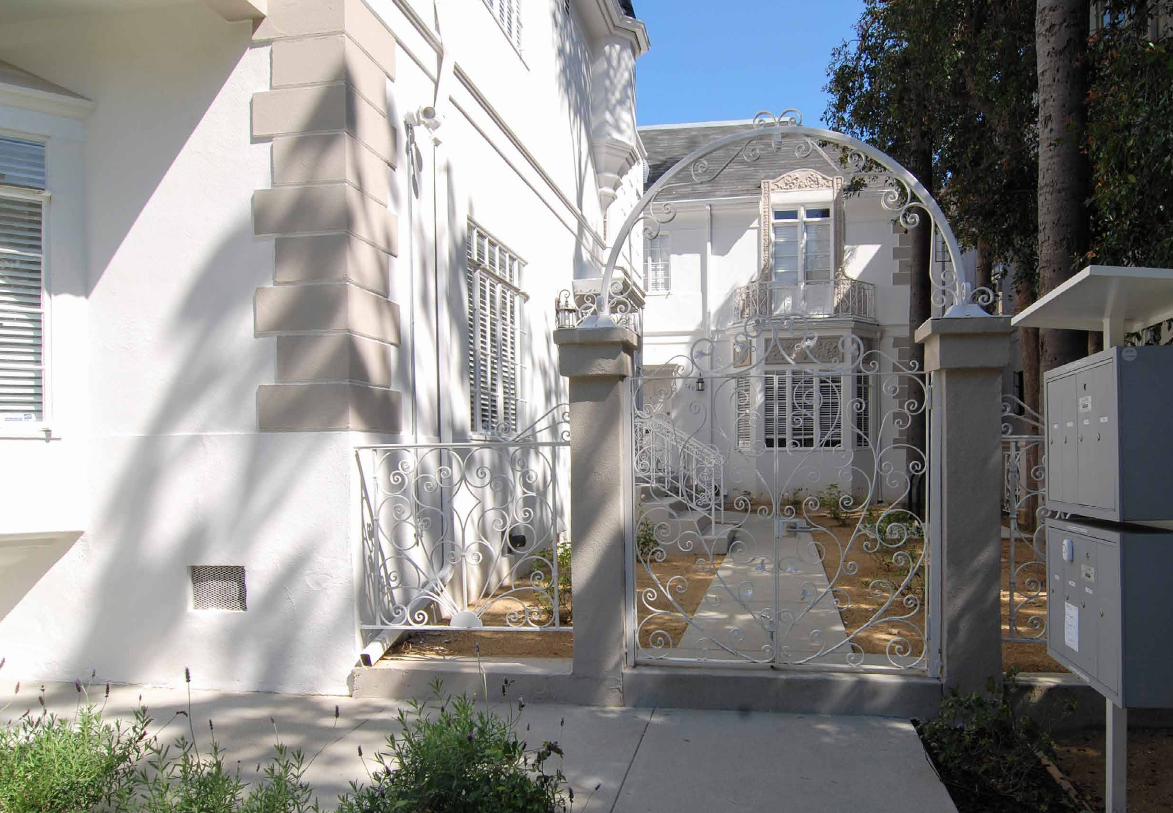
PROPERTY DESCRIPTION744 S. Ridgeley Avenue is a gorgeous French Normandie apartment building originally constructed in 1937 and extensively renovated in 2018. All units were completely remodeled in this classic Pre-WW11 construction apartment building that contains a unit mix of two large one-bedrooms with one-bathroom and five large two-bedrooms with two-bathrooms.
There is open parking in the rear of the property and there is a laundry room on-site, however, all units have laundry.
The property is steps from Wilshire Boulevard and boast a Walk Score of 94 which is considered a Walker’s Paradise. The majority of the electrical and plumbing have been replaced or upgraded.
All units boast the following features:
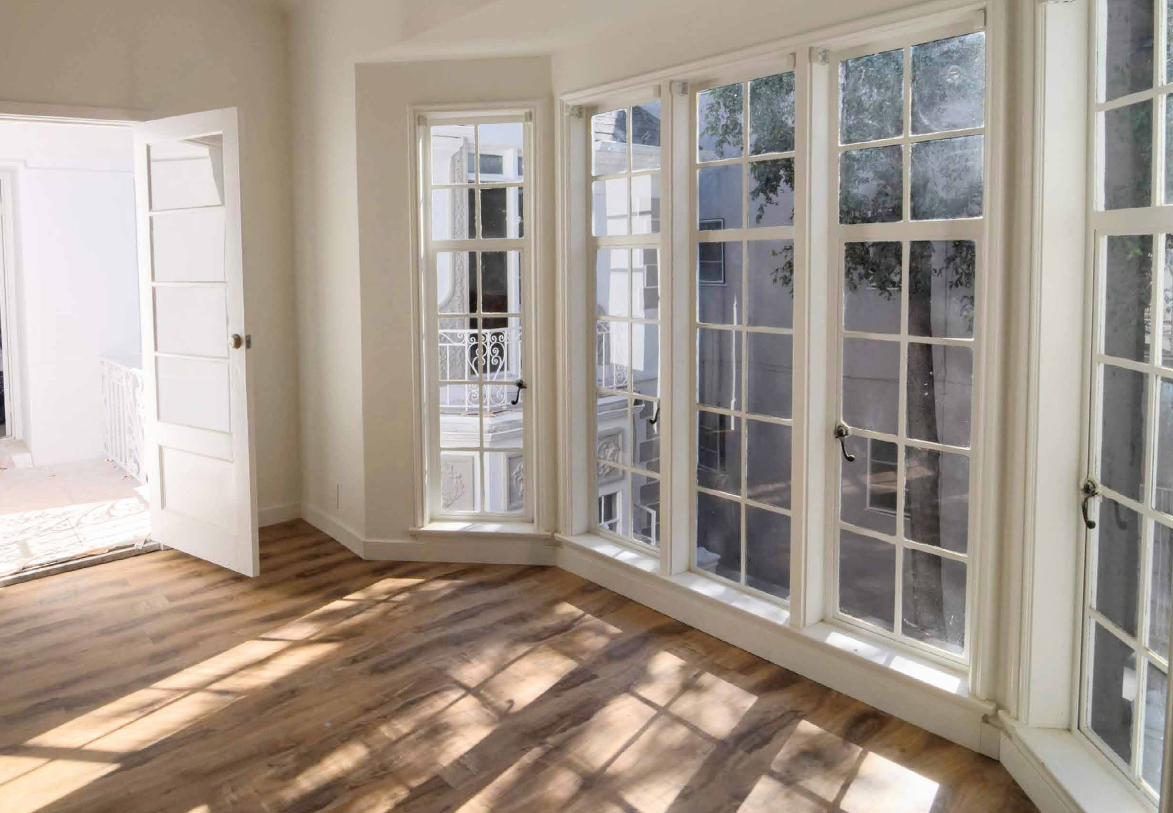
■ Hardwood and Luxury Vinyl Tile Flooring ■ Recessed Lighting ■ Central Heat and Air ■ Wi-Fi Internet ■ Mirrored Closets in Most Units ■ Craftsman Interior Doors ■ Craftsmen-Style Cabinets and Vanities ■ Quartz Countertops ■ Stainless-Steel Appliances ■ Dishwashers ■ High-End Kitchen Cabinetry ■ Upgraded Fixtures ■ Multi-Paned Windows
In addition, there is a possibility to add an additional unit through California’s ADU program. This unit could potentially be constructed in the parking area.

LOCATION DESCRIPTION
6 | The Property
Los Angeles’ Miracle Mile neighborhood was named after the community’s swift, car-driven rise to prominence in the 1920s. The neighborhood now boasts a concentration of cultural institutions known as Museum Row, home to The Los Angeles County Museum of Art (LACMA), The Petersen Automotive Museum, Craft and Folk Art Museum, George C. Page Museum and the La Brea Tar Pits and Museum among others.
Serving as the anchor of Museum Row, The Los Angeles County Museum of Art (LACMA) is the largest art museum in the western United States. LACMA consists of over 140,000 objects that highlight 6,000 years of artistic history from across the world. Attracting more than 1.5 million visitors each year, the museum collects work of art that extent both history and geography, reflecting Los Angeles’ diverse culture and population. The museum is currently undergoing a $750 million expansion project that will add 300,000 square feet of space and is expected to be completed in December 2020.
The neighborhood’s central location provides an easy commute to numerous important business / employment nodes in metro Los Angeles, including Downtown, Century City and Hollywood. Miracle Mile is also within a reasonable distance to the tech-heavy “Silicon Beach” areas of Santa Monica, Venice Beach and Playa Vista, as well as entertainment-industry hubs in Burbank and Culver City.
A Metro Purple Line subway extension, currently under construction, will fully connect the neighborhood to the city’s expanding transit network and give residents further transportation options. The Purple Line extension is scheduled to open in three phases: from Koreatown through the Miracle Mile by 2023; to Beverly Hills and Century City by 2025; and to Westwood and West Los Angeles by 2026, about two years before the city hosts the 2028 Summer Olympics. The nine-mile subway extension is expected to generate 78,000 new daily trips across the system and will run beneath Wilshire Boulevard, which has one of the highest concentrations of jobs and housing in Southern California.

The Property | 7
LOCATION DESCRIPTION
744 SOUTH RIDGELEY DRIVE NEIGHBORHOOD QUICK FACTS
LO S A N G E L E S, C ADEMAND DRIVER
Cedars Sinai Medical Center
FROM THE PROPERTY2.4mi
JOBS SUPPORTED14.1k
HOSPITAL BEDS886
NEIGHBORHOOD SHOPPING
Nordstrom | Nike | GAP | Apple | Pacific Theatres
FROM THE PROPERTY1.3mi
TOTALSTORES
600k SF SHOPPING DESTINATION
40
NEIGHBORHOOD CONVENIENCES
Within a one-mile radius of the property
JOBS SUPPORTED
SFFACILITY
5.0k
800k
DEMAND DRIVER
Paramount Pictures Studios
FROM THE PROPERTY3.3mi
PRIMARY EDUCATION
Wilshire Crest ES | John Burroughs MS | Fairfax HS
STUDENTS SERVED673.8k
SCHOOLS AND CENTERS 1.4k
JOBS SUPPORTED 66.5k
DEMAND DRIVER
Technicolor
FROM THE PROPERTY4.3mi
JOBS SUPPORTED1.6k
SFFACILITY115k
$1.1mMedian Housing Unit Value (Within Three Miles)
$64.9kMedian Household Income (Within Three Miles)
19.8%*
City Unemployment Rate(*Preliminary for June 2020)
455.6kPopulation (Within Three Miles)
69%Renter Occupied Housing Units (Within Three Miles)

8 | The Property
LOCATION MAP
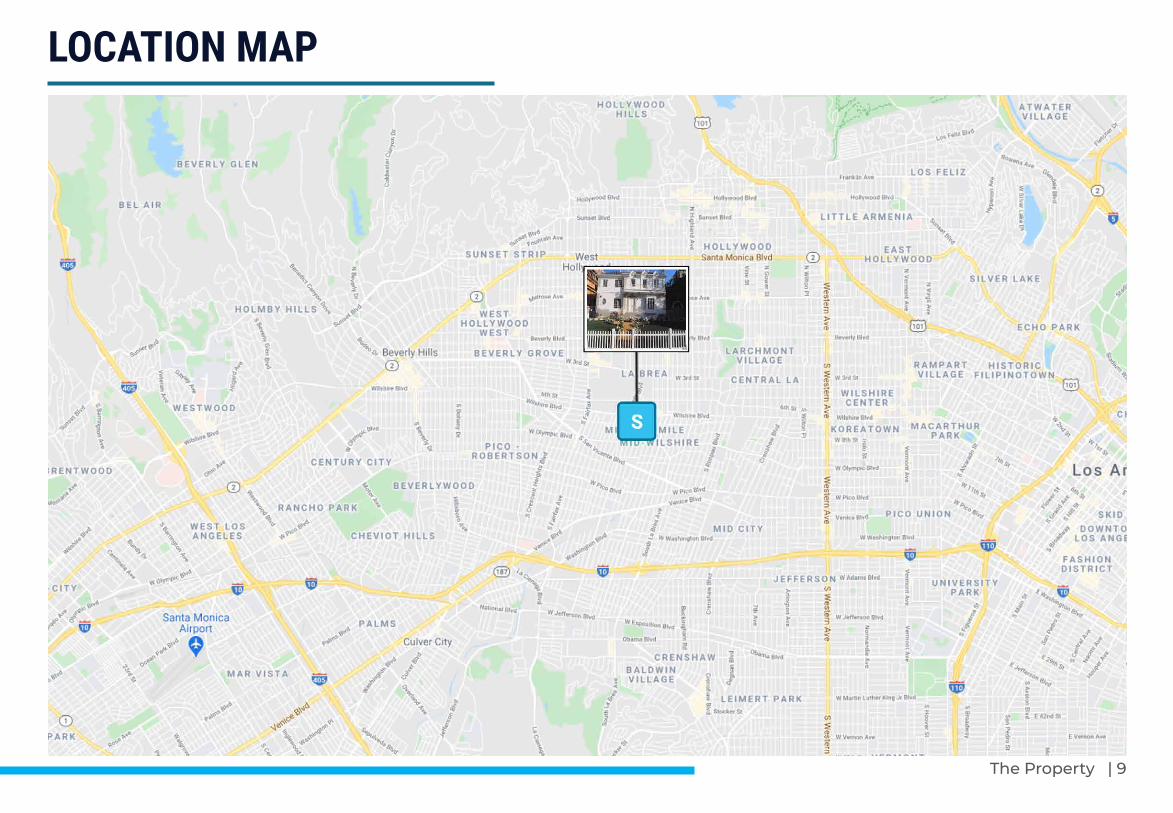
The Property | 9
LOCATION MAP
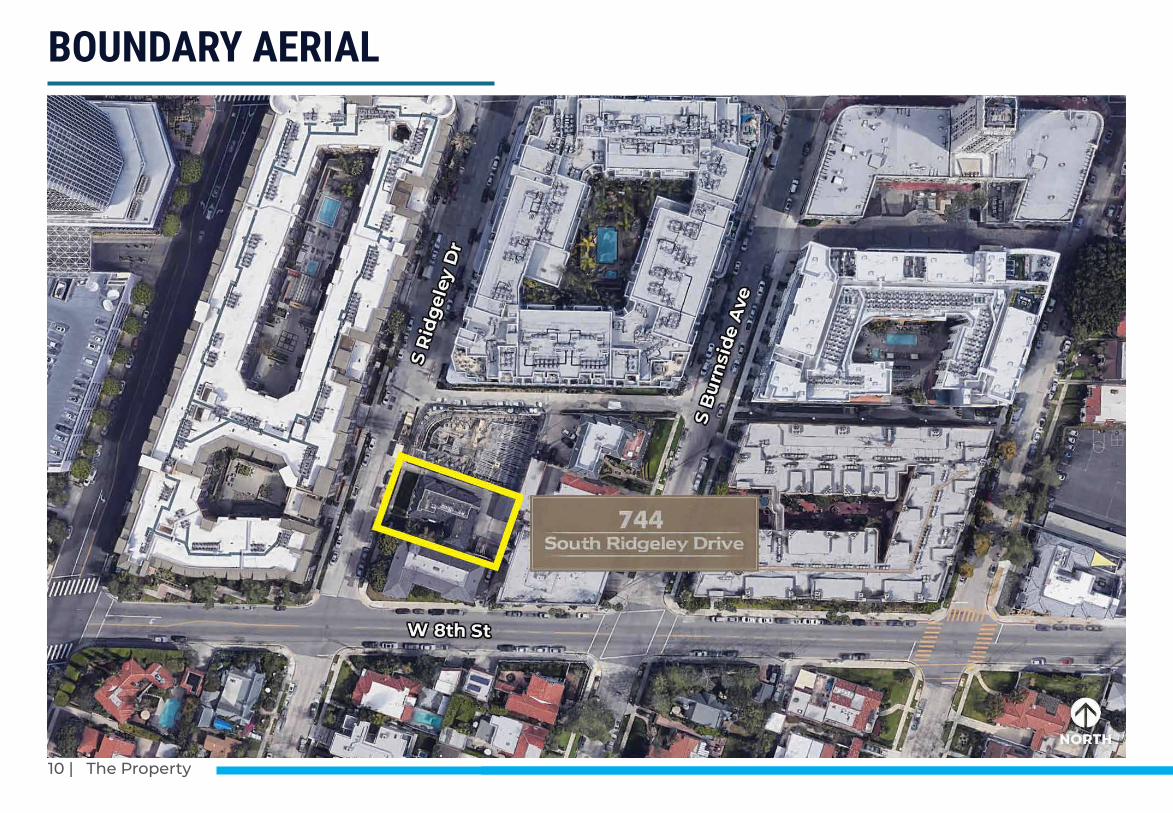
10 | The Property
BOUNDARY AERIAL

The Property | 11

FINANCIAL ANALYSIS
Financial Analysis | 13
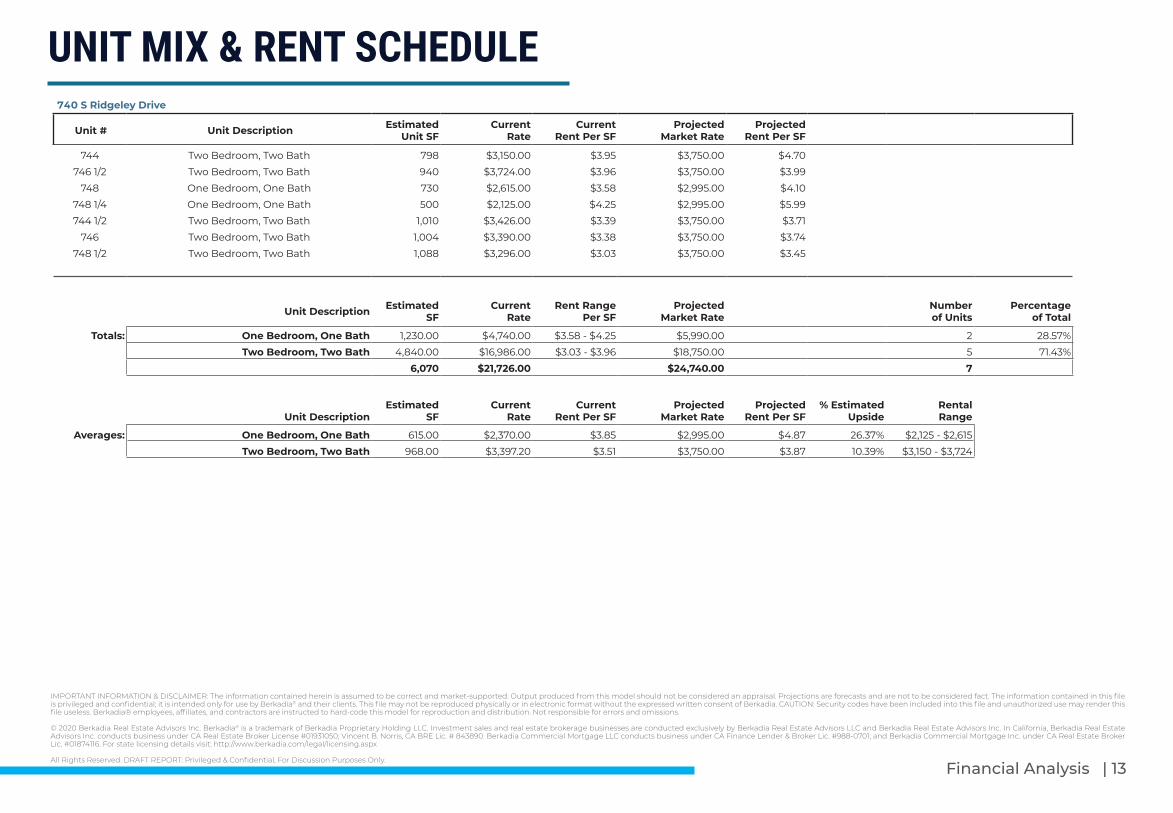
UNIT MIX & RENT SCHEDULE740 S Ridgeley Drive
Unit # Unit Description Estimated Unit SF
Current Rate
Current Rent Per SF
Projected Market Rate
Projected Rent Per SF
744 Two Bedroom, Two Bath 798 $3,150.00 $3.95 $3,750.00 $4.70
746 1/2 Two Bedroom, Two Bath 940 $3,724.00 $3.96 $3,750.00 $3.99
748 One Bedroom, One Bath 730 $2,615.00 $3.58 $2,995.00 $4.10
748 1/4 One Bedroom, One Bath 500 $2,125.00 $4.25 $2,995.00 $5.99
744 1/2 Two Bedroom, Two Bath 1,010 $3,426.00 $3.39 $3,750.00 $3.71
746 Two Bedroom, Two Bath 1,004 $3,390.00 $3.38 $3,750.00 $3.74
748 1/2 Two Bedroom, Two Bath 1,088 $3,296.00 $3.03 $3,750.00 $3.45
Unit Description Estimated SF
Current Rate
Rent Range Per SF
Projected Market Rate
Number of Units
Percentage of Total
Totals: One Bedroom, One Bath 1,230.00 $4,740.00 $3.58 - $4.25 $5,990.00 2 28.57%
Two Bedroom, Two Bath 4,840.00 $16,986.00 $3.03 - $3.96 $18,750.00 5 71.43%
6,070 $21,726.00 $24,740.00 7
Unit DescriptionEstimated
SFCurrent
RateCurrent
Rent Per SFProjected
Market RateProjected
Rent Per SF% Estimated
UpsideRental Range
Averages: One Bedroom, One Bath 615.00 $2,370.00 $3.85 $2,995.00 $4.87 26.37% $2,125 - $2,615
Two Bedroom, Two Bath 968.00 $3,397.20 $3.51 $3,750.00 $3.87 10.39% $3,150 - $3,724
IMPORTANT INFORMATION & DISCLAIMER: The information contained herein is assumed to be correct and market-supported. Output produced from this model should not be considered an appraisal. Projections are forecasts and are not to be considered fact. The information contained in this file is privileged and confidential; it is intended only for use by Berkadia® and their clients. This file may not be reproduced physically or in electronic format without the expressed written consent of Berkadia. CAUTION: Security codes have been included into this file and unauthorized use may render this file useless. Berkadia® employees, affiliates, and contractors are instructed to hard-code this model for reproduction and distribution. Not responsible for errors and omissions.
© 2020 Berkadia Real Estate Advisors Inc. Berkadia® is a trademark of Berkadia Proprietary Holding LLC. Investment sales and real estate brokerage businesses are conducted exclusively by Berkadia Real Estate Advisors LLC and Berkadia Real Estate Advisors Inc. In California, Berkadia Real Estate Advisors Inc. conducts business under CA Real Estate Broker License #01931050; Vincent B. Norris, CA BRE Lic. # 843890. Berkadia Commercial Mortgage LLC conducts business under CA Finance Lender & Broker Lic. #988-0701; and Berkadia Commercial Mortgage Inc. under CA Real Estate Broker Lic. #01874116. For state licensing details visit: http://www.berkadia.com/legal/licensing.aspx
All Rights Reserved. DRAFT REPORT: Privileged & Confidential, For Discussion Purposes Only.

14 | Financial Analysis
FINANCIAL ANALYSISINVESTMENT SUMMARY
Price $4,825,000
Price/Unit $689,286
Price/SF $801.63
Current Pro Forma Cap Rate 3.40%
Market Pro Forma Cap Rate 4.09%
ALL FINANCING
Total Loan Amount $2,413,000
Down Payment $2,436,130
LTV 50%
Mo. Payment ($10,835)
Debt Constant 5.4%
NEW FIRST MORTGAGE (to be originated at purchase)
LTV for this loan 50%
Amount $2,413,000
Interest Rate 3.50
Amortization 30
Payment ($10,835)
Fees 1.00%
I/O Term (yrs) 0
IMPORTANT INFORMATION & DISCLAIMER: The information contained herein is assumed to be correct and market-supported. Output produced from this model should not be considered an appraisal. Projections are forecasts and are not to be considered fact. The information contained in this file is privileged and confidential; it is intended only for use by Berkadia® and their clients. This file may not be reproduced physically or in electronic format without the expressed written consent of Berkadia. CAUTION: Security codes have been included into this file and unauthorized use may render this file useless. Berkadia® employees, affiliates, and contractors are instructed to hard-code this model for reproduction and distribution. Not responsible for errors and omissions.
© 2020 Berkadia Real Estate Advisors Inc. Berkadia® is a trademark of Berkadia Proprietary Holding LLC. Investment sales and real estate brokerage businesses are conducted exclusively by Berkadia Real Estate Advisors LLC and Berkadia Real Estate Advisors Inc. In California, Berkadia Real Estate Advisors Inc. conducts business under CA Real Estate Broker License #01931050; Vincent B. Norris, CA BRE Lic. # 843890. Berkadia Commercial Mortgage LLC conducts business under CA Finance Lender & Broker Lic. #988-0701; and Berkadia Commercial Mortgage Inc. under CA Real Estate Broker Lic. #01874116. For state licensing details visit: http://www.berkadia.com/legal/licensing.aspx
All Rights Reserved. DRAFT REPORT: Privileged & Confidential, For Discussion Purposes Only.
Unit Mix & Rent Schedule
Units Unit TypeEstimated
Unit SFCurrent
Rental RangeCurrent
Avg. RentMarket
RentCurrent Rent/SF
Market Rent/SF
Est. Total Net SF
2 1 Bed/1 Bath 615 $2,125 - $2,615 $2,370 $2,995 $3.85 $4.87 1,2305 2 Bed/2 Bath 968 $3,150 - $3,724 $3,397 $3,750 $3.51 $3.87 4,8407 867 $3,104 $3,534 $3.58 $4.08 6,070
Gross SF 6,019
IncomeCurrent
ProformaMarket
Pro FormaScheduled Market Rent $260,712 $296,880
Less: Vacancy 3.00% ($7,821) ($8,906)Net Rental Income $252,891 $287,974
Plus: Estimated Misc. Income $840 $840 Total Operating Income (EGI) $253,731 $288,814
Estimated Expenses Percentage Per UnitAdministrative $115 $805 $805 Repairs & Maintenance $700 $4,900 $4,900 Management Fee 4.50% $1,676 $11,732 $13,360 Utilities (DWP, Gas & Trash Removal) $1,068 $7,476 $7,476 Landscaping, Internet, Security System $463 $3,240 $3,240
Base Property Taxes 1.174% $8,094 $56,659 $56,659
Property Tax Direct Assessments $165 $1,158 $1,158 Insurance $350 $2,450 $2,450 Replacement Reserve $200 $1,400 $1,400
Total Estimated Expenses $89,820 $91,447
% of Scheduled Rent: 34.45% 30.80%Per SF: $14.92 $15.19
Per Unit: $12,831 $13,064
Net Operating Income $163,911 $197,366
Less: Debt Service ($130,025) ($130,025)Projected Net Cash Flow $33,886 $67,341 Total Economic Loss 3.0% 3.0%
Cash-on-Cash Return (Based on Asking Price) 1.39% 2.76%Debt Service Coverage 1.26 1.52
Cap Rate Analysis Price $/Unit $/SFCap Rate
CurrentCap Rate
MarketGRM
Current
GRM
Pro FormaAsking Price $4,825,000 $689,286 $801.63 3.40% 4.09% 18.45 16.21
Financial Analysis | 15

MARKET POSITIONING

Market Positioning | 17
COMPARABLE RENTAL PROPERTIES

18 | Market Positioning
COMPARABLE RENTAL PROPERTIES
SUBJECT: 744 S. RIDGELEY DRIVELOS ANGELES, CA 90036
Units: ...................................................................... 15Year Built: ....................................................... 1937
UNITS TYPE UNIT SF CURRENT RENT
RENT / SF
2 1 Bed / 1 Bath 615 $2,370 $3.85
5 2 Bed / 2 Bath 968 $3,397 $3.51
7 Weighted Average 867 $3,104 $3.58
1. 5550 WILSHIRE AT MIRACLE MILE5550 WILSHIRE BOULEVARDLOS ANGELES, CA 90036
Units: ....................................................................163Year Built: .......................................................2010
UNITS TYPE UNIT SF CURRENT RENT
RENT / SF
18 1 Bed / 1 Bath 828 $2,633 $3.18
4 2 Bed / 2 Bath 1,318 $3,610 $2.74
Weighted Average 917 $2,811 $3.10
Market Positioning | 19
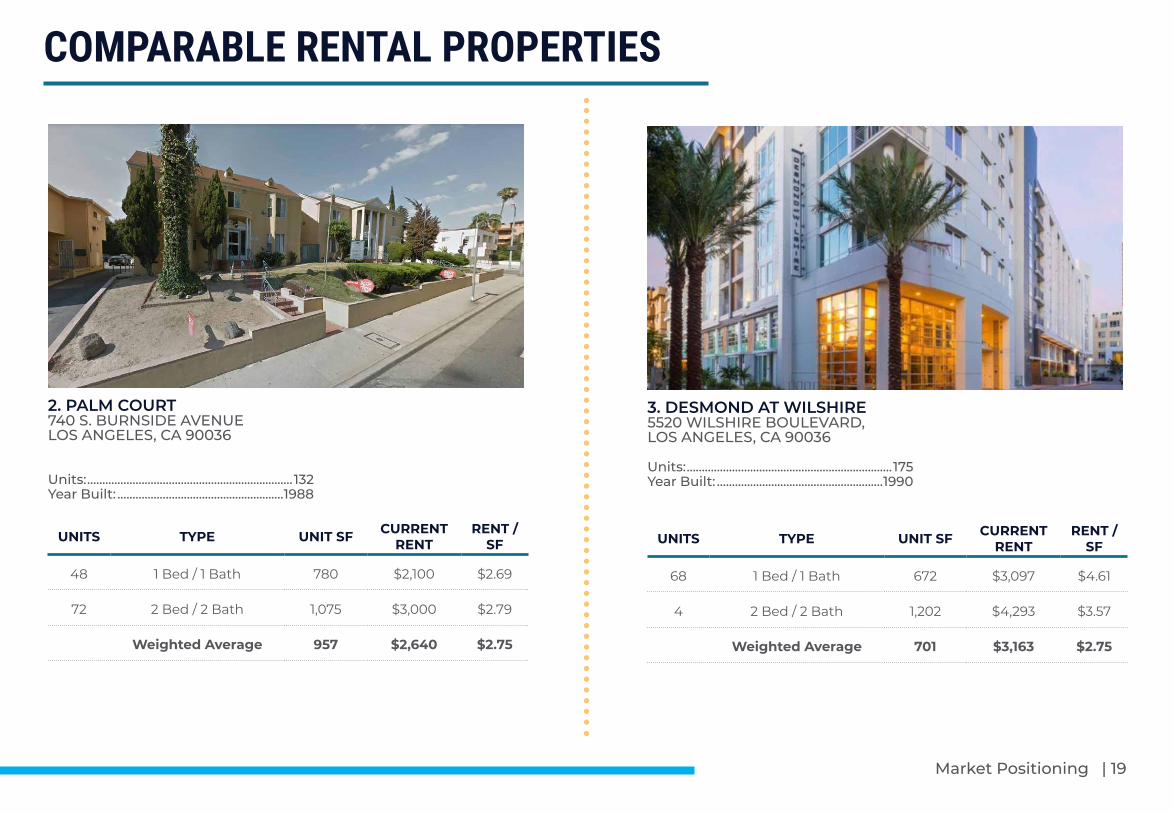
2. PALM COURT740 S. BURNSIDE AVENUELOS ANGELES, CA 90036
Units: .................................................................... 132Year Built: .......................................................1988
UNITS TYPE UNIT SF CURRENT RENT
RENT / SF
48 1 Bed / 1 Bath 780 $2,100 $2.69
72 2 Bed / 2 Bath 1,075 $3,000 $2.79
Weighted Average 957 $2,640 $2.75
COMPARABLE RENTAL PROPERTIES
3. DESMOND AT WILSHIRE5520 WILSHIRE BOULEVARD,LOS ANGELES, CA 90036
Units: ....................................................................175Year Built: .......................................................1990
UNITS TYPE UNIT SF CURRENT RENT
RENT / SF
68 1 Bed / 1 Bath 672 $3,097 $4.61
4 2 Bed / 2 Bath 1,202 $4,293 $3.57
Weighted Average 701 $3,163 $2.75
20 | Market Positioning
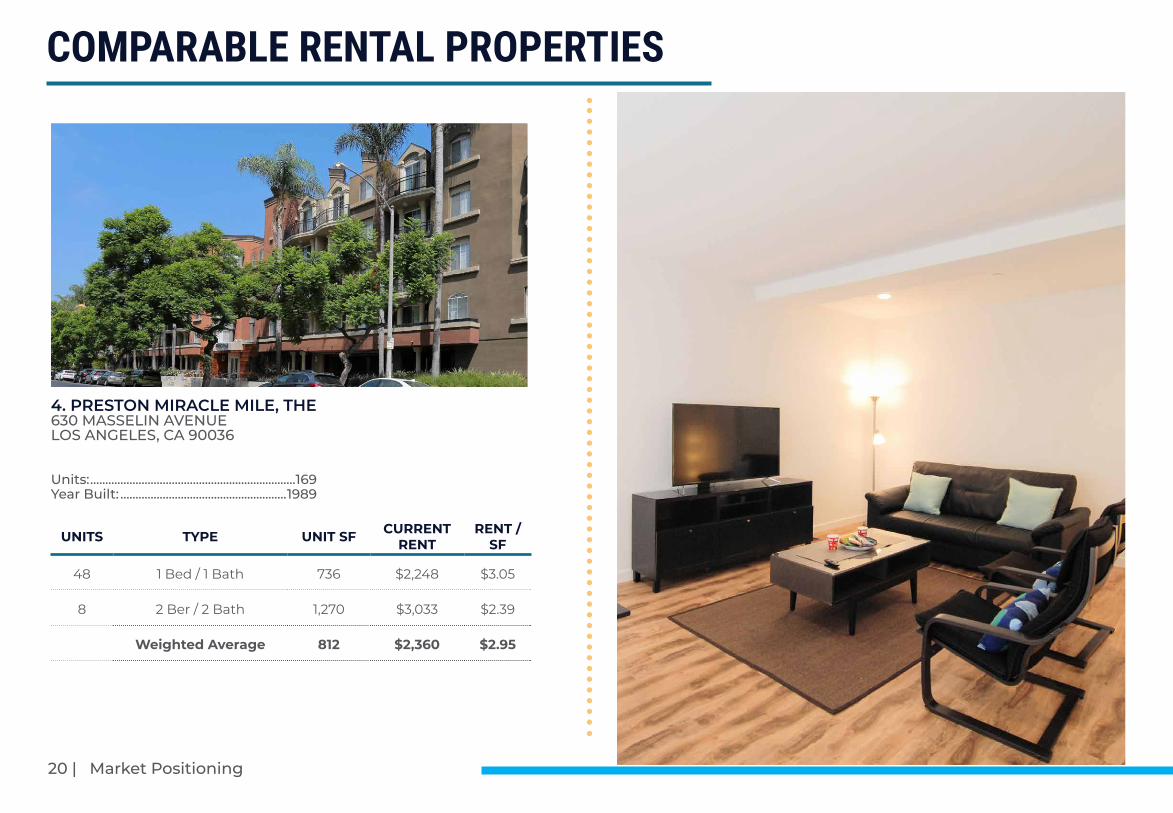
4. PRESTON MIRACLE MILE, THE630 MASSELIN AVENUELOS ANGELES, CA 90036
Units: ....................................................................169Year Built: .......................................................1989
UNITS TYPE UNIT SF CURRENT RENT
RENT / SF
48 1 Bed / 1 Bath 736 $2,248 $3.05
8 2 Ber / 2 Bath 1,270 $3,033 $2.39
Weighted Average 812 $2,360 $2.95
COMPARABLE RENTAL PROPERTIES

Market Positioning | 21
COMPARABLE RENTAL PROPERTIES
Subject: 744 S. Ridgeley Drive Los Angeles, CA 90036
1. 5550 Wilshire at Miracle Mile 5550 Wilshire Boulevard, Los Angeles, CA 90036
2. Palm Court 740 S. Burnside Avenue, Los Angeles, CA 90036
3. Desmond at Wilshire 5520 Wilshire Boulevard Los Angeles, CA 90036
4. Preston Miracle Mile, The 630 Masselin Avenue Los Angeles, CA 90036

22 | Market Positioning
COMPARABLE SALE PROPERTIES

Market Positioning | 23

24 | Market Positioning
COMPARABLE SALE PROPERTIES
SUBJECT: 744 S. RIDGELEY DRIVELOS ANGELES, CA 90036
Units: .................................................................7Year Built: ................................................ 1937Price / Unit: ...................................$689,286Price / SF: .......................................... $801.63Rentable SF:..........................................6,019Listing Price: ...........................$4,825,000Cap Rate: ..............................................3.40%GRM: ..........................................................18.45
1. 750 N. EDINBURGH AVENUELOS ANGELES, CA 90046
Units: .................................................................8Year Built: ................................................ 1923Price / Unit: ...................................$587,500Price / SF: ........................................$1,104.32Rentable SF:.........................................4,256Price: ...........................................$4,700,000Closed: ....................................... 03/23/2020Cap Rate: .................................................. N/AGRM: ............................................................ N/A
2. 1201 S. ORANGE GROVE AVENUELOS ANGELES, CA 90019
Units: .................................................................5Year Built: ................................................ 1937Price / Unit: ..................................$506,000Price / SF: ..........................................$484.21Rentable SF:......................................... 5,225Price: ............................................$2,530,000Closed: ........................................01/30/2020Cap Rate: .............................................4.00%GRM: ............................................................ N/A
3. 1123 & 1127 S. SHENANDOAH ST.LOS ANGELES, CA 90035
Units: .................................................................6Year Built: ................................................1954Price / Unit: .................................. $875,000Price / SF: .......................................... $696.10Rentable SF:......................................... 7,542Price: ............................................$5,250,000Closed: ........................................08/29/2019Cap Rate: .................................................. N/AGRM: ............................................................ N/A

Market Positioning | 25
COMPARABLE SALE PROPERTIES
4. 815 S. SHENANDOAH STREETLOS ANGELES, CA 90035
Units: ............................................................... 13Year Built: ................................................. 1971Price / Unit: ....................................$557,692Price / SF: ..........................................$339.42Rentable SF:....................................... 21,360Price: ............................................$7,250,000Closed: ........................................ 06/10/2019Cap Rate: .............................................. 3.33%GRM: ............................................................ N/A
5. 1055 S. SYCAMORE AVENUELOS ANGELES, CA 90019
Units: .................................................................5Year Built: ................................................ 1939Price / Unit: ..................................$670,000Price / SF: ....................................... $1,019.48Rentable SF:.........................................3,286Price: ............................................$3,350,000Closed: .......................................... 11/25/2019Cap Rate: .................................................. N/AGRM: ............................................................ N/A
6. 858 S. SHENANDOAH STREETLOS ANGELES, CA 90035
Units: ............................................................... 12Year Built: ................................................ 1963Price / Unit: ....................................$541,667Price / SF: ...........................................$331.60Rentable SF:....................................... 19,602Price: ...........................................$6,500,000Closed: ..........................................11/08/2018Cap Rate: ..............................................2.84%GRM: ......................................................... 18.08

26 | Market Positioning
COMPARABLE SALE PROPERTIESSubject: 748 S. Ridgeley Drive Los Angeles, CA 90036
1. 750 N. Edinburgh Avenue Los Angeles, CA 90046
2. 1201 S. Cloverdale Avenue Los Angeles, CA 90019
3. 1123 & 1127 S. Shenandoah St. Los Angeles, CA 90035
4. 815 S. Shenandoah Street Los Angeles, CA 90035
5. 1055 S. Sycamore Avenue Los Angeles, CA 90019
6. 858 S. Shenandoah Street Los Angeles, CA 90035

Market Positioning | 27

ECONOMIC AND DEMOGRAPHIC OVERVIEW

Economic and Demographic Overview | 29

30 | Economic and Demographic Overview
LOS ANGELES | MID-WILSHIRE
ECONOMIC AND DEMOGRAPHIC OVERVIEWBERKADIA
LOS ANGELES | CALIFORNIA
INTRODUCTIONAs one of the world’s most significant economic and cultural centers, Los Angeles is the second-most-populated city in the United States and the largest city in California. The city is seated in Los Angeles County and is an integral part of the Los Angeles-Long Beach-Glendale Metropolitan Division (MD). The city of Los Angeles spans over 80 different communities and neighborhoods, extending north to the San Fernando Valley, south to the port complex, east to the San Gabriel Valley border, and west to the dynamic LAX area.
The ongoing evolution of Downtown Los Angeles continues to drive a building boom of historic proportions. Anchored by world-class amenities like The Broad museum, Disney Concert Hall, and L.A. Live, developers have been constructing millions of square feet of residential, retail, and office space within downtown, enhancing an already thriving live-work-play environment. The district boasts a diverse local economy featuring some of the premier firms in the world. Notable employment centers include the headquarters of CBRE and Reliance Steel & Aluminum as well as the offices of Wells Fargo, Ernst & Young, AECOM, Gensler, and the Boston Consulting Group.
Construction Boom
Young Professionals
Manufacturing Hub
Entertainment Capital
Approximately 3.9 million square feet of office and retail space under construction downtown, with an additional 5.0 million square feet in the proposal stage- DowntownLA
Mid-Wilshire is ranked one of the “Best Neighborhoods for Young Professionals in Los Angeles”- Niche
Los Angeles ranked as the No. 1 “Manufacturing City in the Nation”- The Kyser Center for Economic Research
Los Angeles County was named the “Entertainment Capital of the United States”- The Kyser Center for Economic Research

Economic and Demographic Overview | 31ECONOMIC AND DEMOGRAPHIC OVERVIEWBERKADIA
DEMOGRAPHICS - MID-WILSHIRE SUBMARKET
13.0%INCOME GROWTH
PROJECTED FOR THE SUBMARKET (2020-25)
77% OF HOUSING UNITS ARE
RENTER OCCUPIEDCOMPARED TO 31% NATIONALLY
37.8MEDIAN AGE
IN THE SUBMARKET
LOS ANGELES | CALIFORNIA
454.0K 99.5K 172.7K $55.6KThe Mid-Wilshire submarket’s population is forecast to grow 4.8% over the next five years, exceeding 454,000 residents
Nearly 34% of the submarket’s residents age 25 or older hold a bachelor's degree or higher, compared to 31% nationally
The median home price in ZIP Code 90036 reached $1,700,000 in March 2020, up 17.2% annually
The submarket's number of households is forecast to grow 5.3% over the next five years, reaching 172,679 households
The Mid-Wilshire submarket’s median household income is projected to reach $55,577 by 2025, up 13.0% from 2020
$1.7M
LOS ANGELES | MID-WILSHIRE
32 | Economic and Demographic Overview
LOS ANGELES | MID-WILSHIRE
ECONOMIC AND DEMOGRAPHIC OVERVIEWBERKADIA
INDUSTRY BREAKDOWN
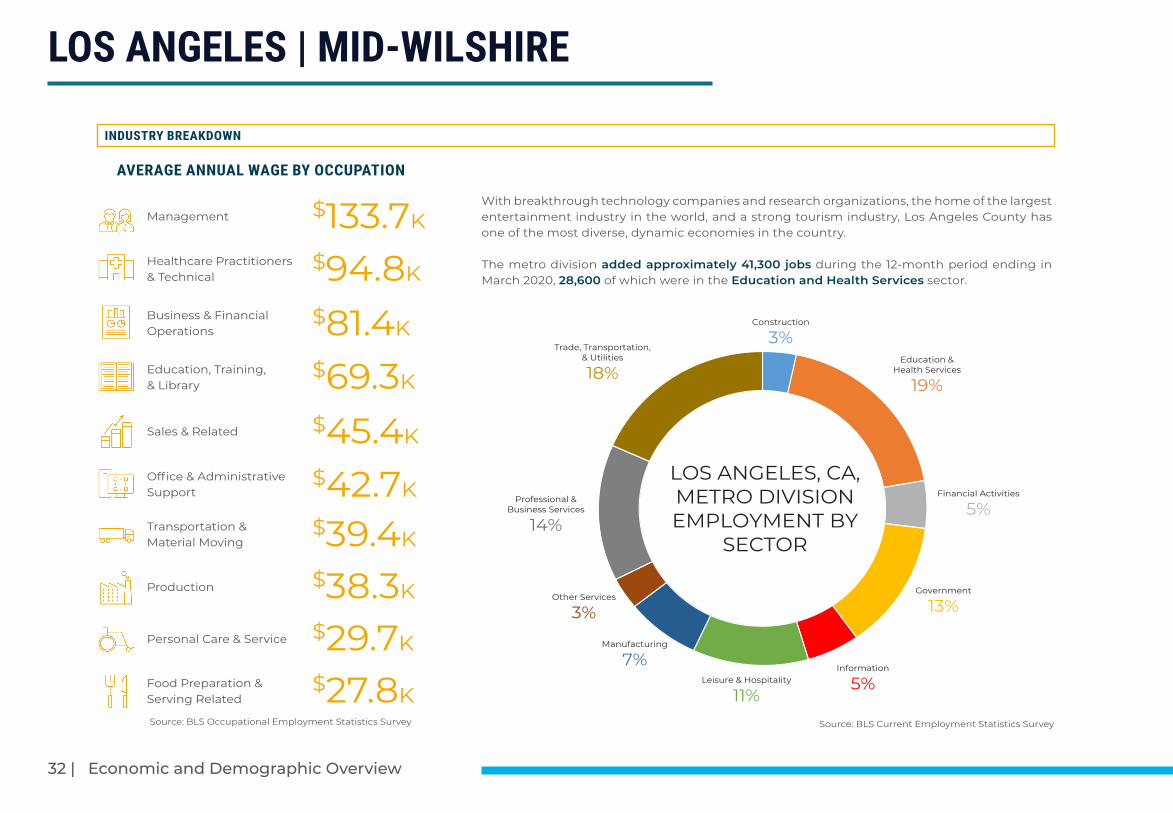
AVERAGE ANNUAL WAGE BY OCCUPATION
Source: BLS Occupational Employment Statistics Survey Source: BLS Current Employment Statistics Survey
LOS ANGELES | CALIFORNIA
Construction
3%Education &
Health Services
19%
Financial Activities
5%
Government
13%
Information
5%Leisure & Hospitality
11%
Manufacturing
7%
Other Services
3%
Professional & Business Services
14%
Trade, Transportation, & Utilities
18%
Industry Breakdown
LOS ANGELES, CA, METRO DIVISIONEMPLOYMENT BY
SECTOR
With breakthrough technology companies and research organizations, the home of the largest entertainment industry in the world, and a strong tourism industry, Los Angeles County has one of the most diverse, dynamic economies in the country.
The metro division added approximately 41,300 jobs during the 12-month period ending in March 2020, 28,600 of which were in the Education and Health Services sector.
Management
Healthcare Practitioners & Technical
Business & Financial Operations
Education, Training, & Library
Sales & Related
Office & AdministrativeSupport
Transportation & Material Moving
Production
$133.7K
$94.8K
$81.4K
$69.3K
$45.4K
$42.7K
$39.4K
$38.3K
Food Preparation & Serving Related
$27.8K
Personal Care & Service $29.7K

Economic and Demographic Overview | 33
LOS ANGELES | MID-WILSHIRE
ECONOMIC AND DEMOGRAPHIC OVERVIEWBERKADIA
27.3%
44.0%
28.7%
JOB EXPOSURELow Medium High
MARKET RESILIENCY ANALYSIS
INDUSTRY COMPOSITION JOBS EXPOSURE
MARKET RATE 28.7%
of jobs are in high-risk industries
NATIONAL RATE 22.9%
of jobs are in high-risk industries
LOS ANGELES | CALIFORNIA
Risk Level # Employees % of Market National AvgLOW
Agriculture, forestry, fishing and hunting 215 0.3% 1.1%Finance and insurance 2,655 3.6% 4.7%Health care and social assistance 8,870 11.9% 16.0%Information 3,125 4.2% 2.2%Transportation and warehousing 2,879 3.9% 4.4%Utilities 168 0.2% 0.4%Wholesale trade 2,480 3.3% 4.7%Total 20,392 27.3% 33.5%
MEDIUMAdministrative and waste services 4,180 5.6% 7.4%Educational services 3,525 4.7% 2.3%Manufacturing 4,546 6.1% 10.1%Mining, quarrying, and oil and gas extraction 54 0.1% 0.5%Other services, except public administration 6,647 8.9% 3.6%Professional and technical services 5,426 7.3% 7.5%Retail trade 8,500 11.4% 12.2%Total 32,878 44.0% 43.6%
HIGHAccommodation and food services 11,623 15.6% 11.1%Arts, entertainment, and recreation 2,606 3.5% 1.9%Construction 4,889 6.5% 6.1%Management of companies and enterprises 50 0.1% 1.9%Real estate and rental and leasing 2,238 3.0% 1.8%Unclassified 0 0.0% 0.1%
Total 21,406 28.7% 22.9%
34 | Economic and Demographic Overview
LOS ANGELES | MID-WILSHIRE
ECONOMIC AND DEMOGRAPHIC OVERVIEWBERKADIA
(100,000)
(50,000)
0
50,000
100,000
150,000
0%
3%
6%
9%
12%
15%
2010 2011 2012 2013 2014 2015 2016 2017 2018 2019 1Q20*
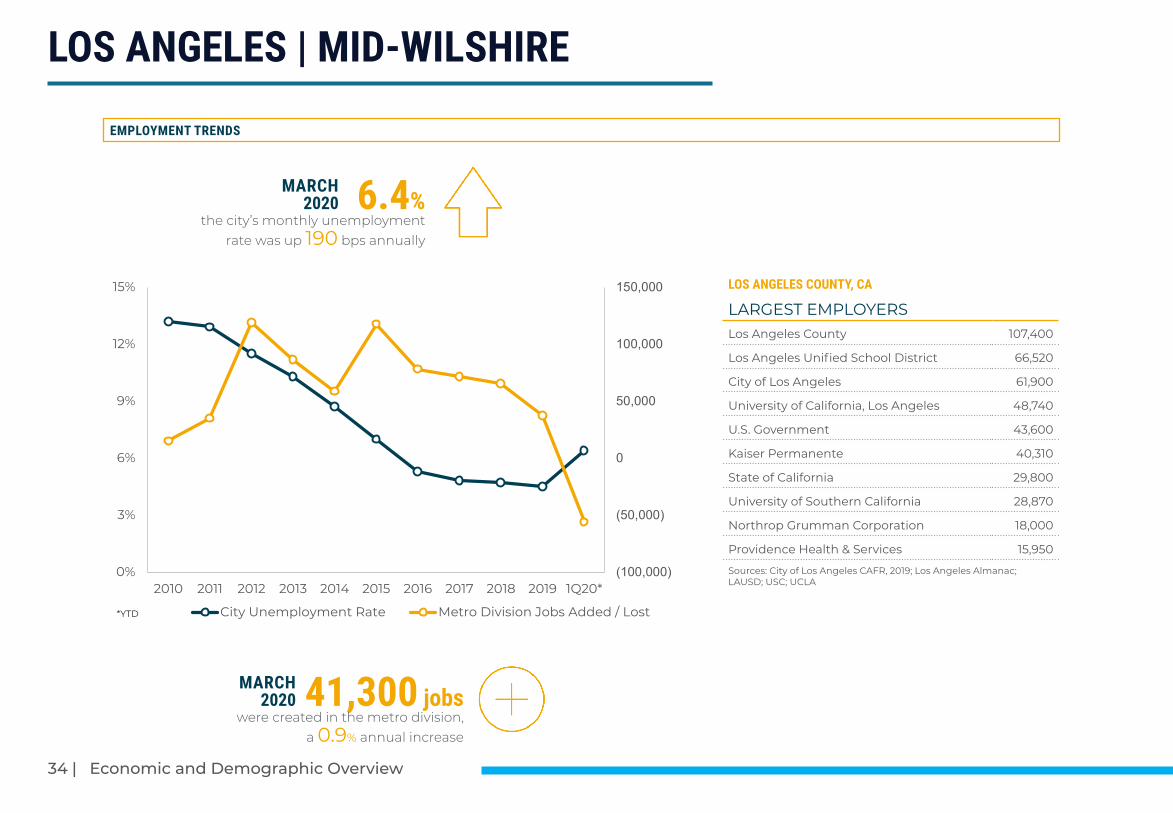
Employment Trends
City Unemployment Rate Metro Division Jobs Added / Lost*YTD
EMPLOYMENT TRENDS
MARCH2020 6.4%
the city’s monthly unemployment rate was up 190 bps annually
MARCH2020 41,300 jobs
were created in the metro division, a 0.9% annual increase
LOS ANGELES | CALIFORNIA
LOS ANGELES COUNTY, CA
LARGEST EMPLOYERSLos Angeles County 107,400
Los Angeles Unified School District 66,520
City of Los Angeles 61,900
University of California, Los Angeles 48,740
U.S. Government 43,600
Kaiser Permanente 40,310
State of California 29,800
University of Southern California 28,870
Northrop Grumman Corporation 18,000
Providence Health & Services 15,950
Sources: City of Los Angeles CAFR, 2019; Los Angeles Almanac; LAUSD; USC; UCLA

Economic and Demographic Overview | 35
LOS ANGELES | MID-WILSHIRE
ECONOMIC AND DEMOGRAPHIC OVERVIEWBERKADIA
LOS ANGELES | CALIFORNIA
TRADE & LOGISTICS
MANUFACTURING
PORT OF LOS ANGELES
NORTHROP GRUMMAN CORP.
Los Angeles County is home to the Port of Los Angeles and the Port of Long Beach, making it one of the world’s leading trade and logistics centers. The two ports provide access to major U.S. markets and the Pacific Rim. The Port of Los Angeles ranked first in the nation in terms of total value of worldwide trade handled in 2019, with 14% of all U.S. trade. Combined, the ports support more than 1.2 million direct and indirect jobs and generate over $58 billion annually in wages and tax revenues.
Los Angeles’s unique geography, strong infrastructure, and skilled workforce make it an ideal location for manufacturing companies. With approximately 335,200 jobs supported in the sector, Los Angeles serves as the top manufacturing center in the country. Approximately 65 plants are situated along the city’s I-605 Corridor, providing easy access to the growing industrial hub. Companies like Northrop Grumman Corp., Edelbrock LLC, and Belkin International Inc. help make up the industry’s strong focus on aerospace, fabricated metals, and food processing.
1.2 millionTotal Jobs Supported by the Two Ports
$371.2 billionWorldwide Trade ValueCombined in 2019
$58 billionAnnual Wages and Tax Revenues
No. 1Manufacturing Center in the Country
335,200Jobs Supported
65I-605 CorridorManufacturing Firms

36 | Economic and Demographic Overview
LOS ANGELES | MID-WILSHIRE
ECONOMIC AND DEMOGRAPHIC OVERVIEWBERKADIA
LOS ANGELES | CALIFORNIA
ARTS & ENTERTAINMENT
PROFESSIONAL & BUSINESS SERVICES
PARAMOUNT PICTURES
AVERY DENNISON
As the “Entertainment Capital of the World,” Los Angeles is home to major production studios, including Disney, Paramount, Universal, and Warner Brothers. Each year, the city boasts more than 1,500 theatrical productions throughout its 225 theaters, making arts and culture major drivers in the region. Over 792,600 jobs are supported directly and indirectly in the creative economy, helping generate an economic impact of $198 billion. There are more artists, writers, filmmakers, actors, dancers, and musicians living in Los Angeles than any other city in the world.
According to the Global Financial Centres Index, Los Angeles is home to one of the most competitive financial centers in the world, contributing to one of the most dynamic business economies. Los Angeles’s historic Financial District, referred to as the “Wall Street of the West,” is home to corporate skyscrapers, law firms, and real estate companies. Approximately 639,500 jobs are supported by major businesses, including Amgen, Avery Dennison, and Mattel. Of the more than 50 Fortune 500 companies in California, 11 are headquartered in Los Angeles County.
$198 billionEconomic Impact Metrowide
792,600Jobs Supported Metrowide
1,500Theater Productions
11Fortune 500Headquarters
639,500Jobs Supported
$212.2 billionCombined Annual Revenue

Economic and Demographic Overview | 37
LOS ANGELES | MID-WILSHIRE
ECONOMIC AND DEMOGRAPHIC OVERVIEWBERKADIA
LOS ANGELES | CALIFORNIA
CONSTRUCTION AND DEVELOPMENT
CROSSROADS HOLLYWOOD SOFI STADIUM AND ENTERTAINMENT DISTRICT AT HOLLYWOOD PARK
$1 billionRedevelopment Project
$2.6 billionInvestment
1.4 millionSF Mixed-Use Development
1.5 millionSF of Commercial Space
The site of the historic Crossroads of the World complex is set to undergo a major revitalization project. Crossroads Hollywood will be an eight-acre, 1.4 million-square-foot, mixed-use development. The project will be comprised of nine buildings, including up to 308 hotel rooms; 950 residential units, including 84 affordable units; 185,000 square feet of commercial space; 95,000 square feet of office space; and 2,494 underground parking spaces. The proposed realignment of Las Palmas Avenue and Sunset Boulevard will promote pedestrian safety and enhance connectivity. The $1 billion project has an estimated 48-month construction timeline, with expected completion in 2022.
A 70,240-seat sport stadium and the adjacent entertainment district are currently under construction at the former site of Hollywood Park in the city of Inglewood, approximately 10 miles north of Torrance. The stadium will be the new home of the NFL’s Rams and Chargers franchises. At three million square feet, it will be the largest stadium in professional football. The $2.6 billion, 300-acre, multipurpose facility will also include a 6,000-seat performance venue, more than 1.5 million square feet of retail and office space, 2,500 homes, a 300-room hotel, and 25 acres of parks. Combined team annual revenue is estimated to generate $700 million to the region. The new stadium is expected to be completed in time for the 2020 NFL season.

38 | Economic and Demographic Overview
LOS ANGELES | MID-WILSHIRE
ECONOMIC AND DEMOGRAPHIC OVERVIEWBERKADIA
LOS ANGELES | CALIFORNIA
CONSTRUCTION AND DEVELOPMENT
METRO PURPLE LINE VERMONT CORRIDOR
$6.3 billionInvestment
$270 millionOffice Tower
22,000Construction Jobs
2,990Jobs Supported
Construction on the Metro’s Purple Line continues. The project’s first phase will open to the public in 2023. In February 2018, officials broke ground on the $2.5 billion second phase, which will run 2.5 miles west from Wilshire Boulevard and La Cienega Avenue to Century City to complete in 2025. The final section from Century City to the VA campus broke ground in 2019. In total, the Purple Line extension project will cost about $6.3 billion. At build-out, the nine-mile extension will add seven more stops, generating 78,000 new daily trips. With an expected completion date in 2026, the Purple Line will be fully operational for the 2028 Summer Olympics.
Along Vermont Avenue in Los Angeles’s Koreatown, a three-site development is underway. Site one of the Vermont Corridor will include a $270 million, 21-story tower that will house government offices and nearly 2,200 employees. The second site will be converted into 172 units of residential housing. Additionally, the building will feature street-level retail and a rooftop deck. Site three includes demolishing the existing parks and recreation office and replacing it with a six-story structure with senior housing units and a 13,200-square-foot community center. In total, the sites will support more than 2,990 employees and provide over 2,100 parking spaces. All three sites are expected to be completed by 2023.
Economic and Demographic Overview | 39
LOS ANGELES | MID-WILSHIRE
ECONOMIC AND DEMOGRAPHIC OVERVIEWBERKADIA
LOS ANGELES | CALIFORNIA
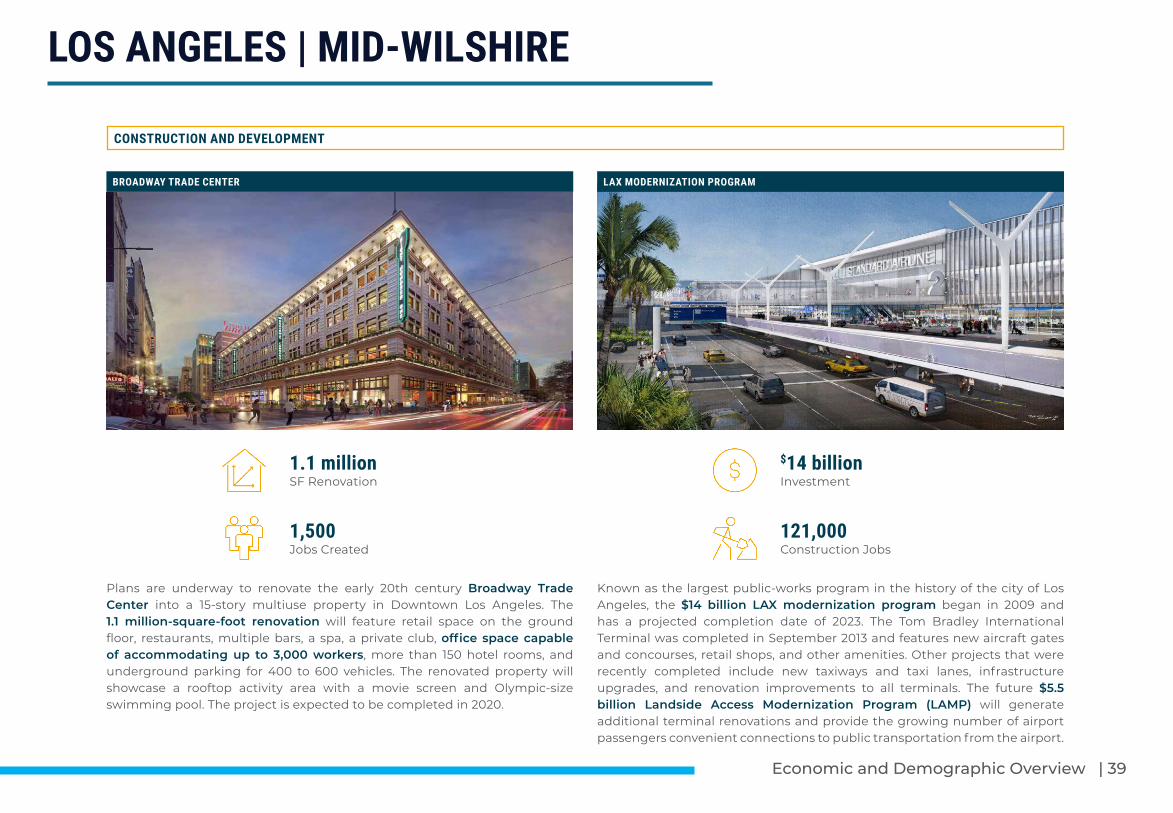
CONSTRUCTION AND DEVELOPMENT
BROADWAY TRADE CENTER LAX MODERNIZATION PROGRAM
1.1 millionSF Renovation
$14 billionInvestment
1,500Jobs Created
121,000Construction Jobs
Plans are underway to renovate the early 20th century Broadway Trade Center into a 15-story multiuse property in Downtown Los Angeles. The 1.1 million-square-foot renovation will feature retail space on the ground floor, restaurants, multiple bars, a spa, a private club, office space capable of accommodating up to 3,000 workers, more than 150 hotel rooms, and underground parking for 400 to 600 vehicles. The renovated property will showcase a rooftop activity area with a movie screen and Olympic-size swimming pool. The project is expected to be completed in 2020.
Known as the largest public-works program in the history of the city of Los Angeles, the $14 billion LAX modernization program began in 2009 and has a projected completion date of 2023. The Tom Bradley International Terminal was completed in September 2013 and features new aircraft gates and concourses, retail shops, and other amenities. Other projects that were recently completed include new taxiways and taxi lanes, infrastructure upgrades, and renovation improvements to all terminals. The future $5.5 billion Landside Access Modernization Program (LAMP) will generate additional terminal renovations and provide the growing number of airport passengers convenient connections to public transportation from the airport.

40 | Economic and Demographic Overview
LOS ANGELES | MID-WILSHIRE
ECONOMIC AND DEMOGRAPHIC OVERVIEWBERKADIA
COVID-19 is taking its toll on Los Angeles's economy, especially on its entertainment, tourism, and international trade. Fortunately, essential businesses, such as the area's large concentration of manufacturers, have remained open, and many of the area's white-collar workers have been able to work from home. Regardless, apartment demand throughout Los AngelesCounty is expected to persist due to a lack of adequate housing supply.
The Mid-Wilshire apartment submarket's desirable location at the heart of the metro has spurred development and investor interest in recent months, particularly along the submarket’s border with red-hot downtown Los Angeles. In the first quarter of 2020, 289 units were added in the submarket, over two times the number of units during the same time last year.
Demand for multifamily units tends to keep pace with new supply in Mid-Wilshire, helping maintain elevated occupancy rates. The submarket’s central location within Los Angeles provides a fairly easy commute to numerous important employment nodes in the city, including Miracle Mile, Downtown, Century City, and Hollywood. In the first three months of 2020, the Mid-Wilshire apartment submarket noted a 69-unit deficit, up from 270 net move-outs in the first three months of 2019.
With home prices approaching $1.3 million, residents wanting this central location are moving into the newly developed Class A communities in Mid-Wilshire. This is good news for operators and investors, as Mid-Wilshire competes with several other core submarkets with significant new development that boast many of the same demand drivers as Mid-Wilshire.
(500)
0
500
1,000
1,500
2,000
2014 2015 2016 2017 2018 2019 1Q20*
Construction vs. Absorption
Deliveries Absorption*YTD
ABSORPTION / DELIVERIES
MID-WILSHIRE APARTMENT SUBMARKET
NEWDELIVERIES 289 units
in the first quarter of 2020
NETABSORPTION (69 units)
through March 2020
LOS ANGELES | CALIFORNIA

Economic and Demographic Overview | 41
LOS ANGELES | MID-WILSHIRE
ECONOMIC AND DEMOGRAPHIC OVERVIEWBERKADIA
With COVID-19 wreaking havoc on the regional economy, the Mid-Wilshire apartment submarket benefits from its prestigious location in close proximity to local job hubs and abundant retail and entertainment options. Los Angeles County’s stay-at-home order through May 15, 2020, allowed operation of essential businesses, meaning the county’s upsides during this downturn are as numerous as its challenges.
The Mid-Wilshire apartment submarket location brings consistent demand and boasts some of the highest rents in Los Angeles. Rents have grown at a steady annual pace in the Mid-Wilshire apartment submarket, and elevated demand drove gains above the historical average for most of the cycle. In March 2020, average effective rent in the submarket increased 1.5% to $2,484 per month. This speaks to a submarket in transition, as new development driven by growth in adjacent submarkets pushes into what has traditionally been a low-income area.
Mid-Wilshire’s central location and strong transit links to major employment hubs continue to underpin demand. The average occupancy rate in the Mid-Wilshire apartment submarket was 96.4% in the first quarter of 2020, unchanged from one year prior and on par with the preceding five-year average. During the declared state of emergency, the California Judicial Council’s renter eviction protections prohibit eviction under a vast array of circumstances, even where renters can't pay their lease.
$2,0
76
$2,2
19
$2,3
09
$2,3
38
$2,4
13
$2,4
82
$2,4
84
$1,800
$2,000
$2,200
$2,400
$2,600
90%
92%
94%
96%
98%
2014 2015 2016 2017 2018 2019 1Q20*
Occupancy & Ask Rent
Rent Occupancy* YTD
RENT / OCCUPANCY
EFFECTIVE RENT
$2,484in 1Q20, up 1.5% year over year
OCCUPANCYRATE 96.4%
in 1Q20, unchanged from one year prior
MID-WILSHIRE APARTMENT SUBMARKET
LOS ANGELES | CALIFORNIA

42 | Economic and Demographic Overview
LOS ANGELES | MID-WILSHIRE
ECONOMIC AND DEMOGRAPHIC OVERVIEWBERKADIA
EDUCATION
HIGHER EDUCATION 625kstudents metrowide
ANNUAL GRADUATES 60kproduced by metro Los Angeles universities each year
LOS ANGELES | CALIFORNIA
With over 120 colleges and universities that provide jobs and drive economic growth, the region is a hub for higher education and generates sustained demand for off-campus housing. The universities alone produce 60,000 graduates annually, the highest number of any county in the nation.
The University of California Los Angeles (UCLA) is world-renowned for its high-quality academic, research, and athletic programs. UCLA offers over 125 undergraduate majors and 150 graduate degree programs. The university is one of the largest employers in the region, supporting approximately 65,600 jobs countywide. With an enrollment of 44,370 students, UCLA generates $284.4 million in taxes and a $5.7 billion economic impact for Southern California.
The University of Southern California (USC) has an enrollment of over 48,500 students and employs 28,870 residents. USC has the largest private-university graduate program in the nation in science, engineering, and health. In 2019, the University of Southern California was ranked No. 22 among national universities by U.S. News and World Report.
CITY OF LOS ANGELES
HIGHER EDUCATIONLos Angeles Community College District 147,630
University of Southern California 48,500
University of California Los Angeles 44,370
California State University Northridge 39,390
California State University Los Angeles 23,360
Loyola Marymount University 9,680
Mount Saint Mary’s University 2,970
Sources: listed college websites; California Community Colleges Chancellor’s Office

Economic and Demographic Overview | 43
LOS ANGELES | MID-WILSHIRE
ECONOMIC AND DEMOGRAPHIC OVERVIEWBERKADIA
LIFESTYLE AND ENTERTAINMENT
LACMA 140kpieces of art
THE GROVE 60shops & restaurants
LOS ANGELES | CALIFORNIA
Los Angeles’ Miracle Mile neighborhood was named after its swift car-driven rise to prominence in the 1920s. The neighborhood, which spans a stretch of Wilshire Boulevard between Fairfax and La Brea Avenue, was the first commercial strip designed specifically to cater to car traffic rather than foot traffic. Miracle Mile boasts a concentration of cultural institutions known as Museum Row, home to the Los Angeles County Museum of Art (LACMA), The Petersen Automotive Museum, Craft and Folk Art Museum, George C. Page Museum, and the La Brea Tar Pits and Museum as well as the future Academy Museum of Motion Pictures.
Serving as the anchor of Museum Row, The Los Angeles County Museum of Art (LACMA) is the largest art museum in the western United States. LACMA consists of 140,000 objects that highlight 6,000 years of artistic history from across the world. Attracting more than 1.5 million visitors each year, the museum collects work of art that encompass both history and geography, reflecting Los Angeles’s diverse culture and population.
Featuring an eclectic mix of shopping and dining options, The Grove is one of the premier lifestyle centers in Los Angeles. Located on the site of the historic Farmer’s Market, The Grove features over 600,000 square feet of retail space for brands like Nordstrom, Nike, Coach, and Crate & Barrel.
The neighborhood’s centrality provides a fairly easy commute to numerous important business / employment nodes in metro Los Angeles, including Downtown, Century City, and Hollywood. Also within a reasonable distance are the tech-heavy “Silicon Beach” areas of Santa Monica, Venice Beach, and Playa Vista, as well as entertainment-industry hubs in Burbank and Culver City.
THE GROVE

44 | Economic and Demographic Overview
LOS ANGELES | MID-WILSHIRE
ECONOMIC AND DEMOGRAPHIC OVERVIEWBERKADIA
Sources: Berkadia; Tetrad; U.S. Census Bureau; U.S. Bureau of Labor Statistics; Apartment Data Services; Moody’s; CoreLogic; Wikipedia; Axiometrics; California Association of Realtors; City of Los Angeles CAFR; State of California Employment Development Department Forbes; California Division of Tourism; Los Angeles County Metropolitan Transportation Authority; Los Angeles County; Los Angeles Times; Los Angeles Economic Development Corporation; Los Angeles Area Chamber of Commerce; Los Angeles World Airports; Port of Los Angeles; Los Angeles Unified School District; Los Angeles Convention and Visitors Bureau; City of Los Angeles; Los Angeles Business Journal; Los Angeles Daily News; Los Angeles Downtown News; UCLA; USC; CSU-Northridge; CSU-L.A.; Los Angeles Community College District; Mt. St. Mary’s College; Occidental College; Southern California Association of Governments; Airports Council International
TRANSPORTATION
MTAPASSENGERS 370.5m
rail and bus passengers in 2019
LAXAIRPORT 88.1m
passengers served in 2019
LOS ANGELES | CALIFORNIA
Los Angeles boasts an extensive freeway network with major routes, including the Santa Ana Freeway (I-5), San Diego Freeway (I-405), Foothills Freeway (I-210), Santa Monica and San Bernardino Freeways (I-10), Harbor Freeway (I-110), Long Beach Freeway (I-710), and San Gabriel River Freeway (I-605).
The Metropolitan Transportation Authority (MTA) provides local bus and rail service, linking communities of Long Beach, Downtown L.A., Hollywood, Pasadena, and the San Fernando Valley. MTA provided service to 370.5 million rail and bus passengers in 2019.
Los Angeles International Airport (LAX) supports 408,000 local jobs and has an annual economic impact of $60 billion. LAX served over 88.1 million passengers in 2019, making it the second-busiest airport in the nation and among the ten busiest airports in the world.
LOS ANGELES INTERNATIONAL AIRPORT (LAX)

Economic and Demographic Overview | 45
LOS ANGELES | MID-WILSHIRE
ECONOMIC AND DEMOGRAPHIC OVERVIEWBERKADIA
BY THE NUMBERS - MID-WILSHIRE SUBMARKET
*Projected**30-yr fixed; 20% down; 3.5% interest rate; 0.77% CA propertytaxes; $1,000 annual homeowner’s insurance; ZIP Code 90036
*ProjectedAnnual Rent / Median Household Income
LOS ANGELES | CALIFORNIA
TOTAL POPULATION2010 414,491
2020* 433,341
2025* 454,035
Growth Rate (2020 - 2025) 4.8%
TOTAL HOUSEHOLDS2010 156,734
2020* 164,010
2025* 172,679
Growth Rate (2020 - 2025) 5.3%
MEDIAN INCOME2010 $38,029
2020* $49,168
2025* $55,577
Growth Rate (2020 - 2025) 13.0%
MEDIAN AGE2010 34.5
2020* 37.8
2025* 39.6
MEDIAN HOME PRICEMarch - 2019 $1,450,000
March - 2020 $1,700,000
Growth Rate Y-o-Y 17.2%
ZIP Code: 90036
RENT VS. OWNAverage Mortgage Payment** $7,309
Effective Rent $2,484
Difference $4,825
EMPLOYMENT GROWTH (MD)March - 2019 4,555,900
March - 2020 4,597,200
Growth Rate Y-o-Y 0.9%
RENT SHARE OF WALLETNational - 2020* 29.0%
Mid-Wilshire Submarket - 2020* 60.6%
National - 2025* 29.4%
Mid-Wilshire Submarket - 2025* 56.6%

DEMOGRAPHICS
Demographics | 47

48 | Demographics
Site Map744 S Ridgeley Dr, Los Angeles, CA 90036
0 - 1 mi, 0 - 3 mi, 0 - 5 mi | 34.061032, -118.3507382020-Aug-19
Legend Map
Powered by Sitewise Pro

Demographics | 49
Study Area Map744 S Ridgeley Dr, Los Angeles, CA 90036
0 - 1 mi, 0 - 3 mi, 0 - 5 mi | 34.061032, -118.3507382020-Aug-19
Legend Map
Powered by Sitewise Pro

50 | Demographics
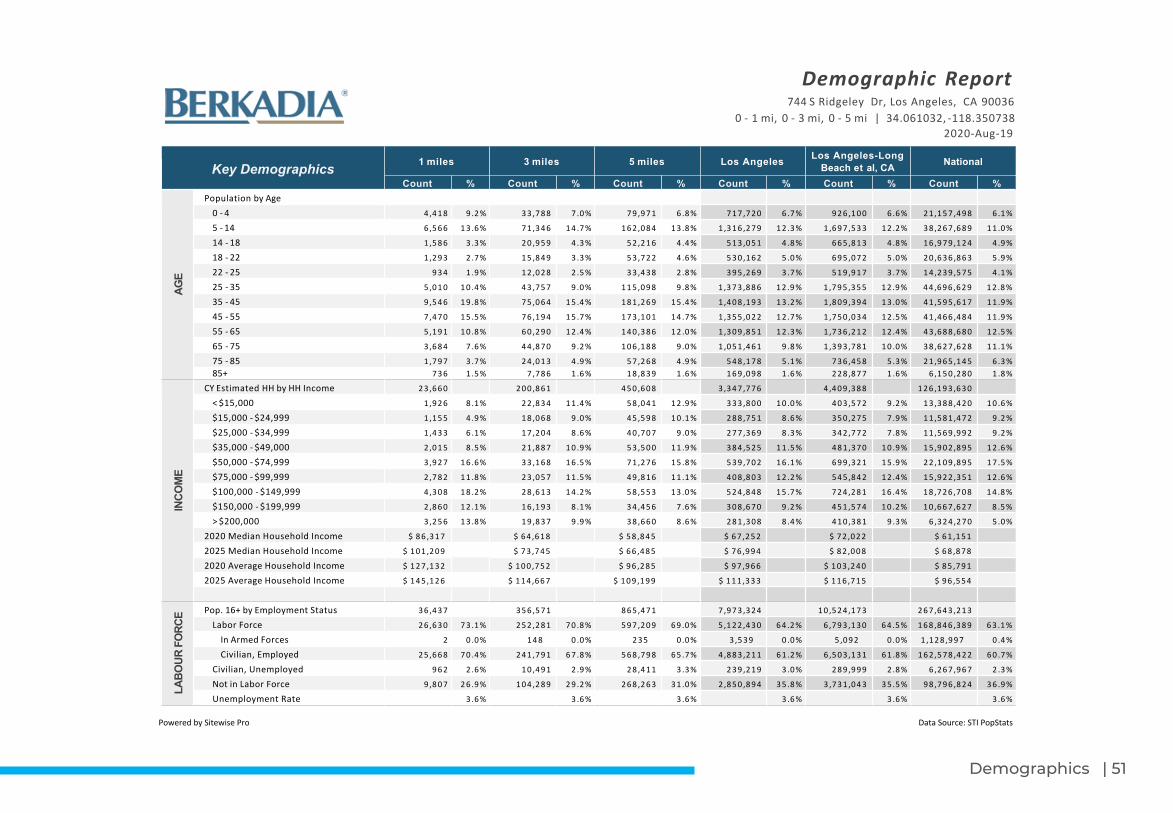
Demographic Report744 S Ridgeley Dr, Los Angeles, CA 90036
0 - 1 mi, 0 - 3 mi, 0 - 5 mi | 34.061032, -118.3507382020-Aug-19
Key Demographics 1 miles 3 miles 5 miles Los Angeles Los Angeles-LongBeach et al, CA National
Count % Count % Count % Count % Count % Count %PO
PULA
TIO
N
2000 Census 4 2 ,8 2 6 4 5 2 ,3 0 9 1 ,0 8 3 ,1 4 7 9 ,5 1 9 ,0 6 1 1 2 ,3 6 5 ,3 5 3 2 8 1 ,4 2 1 ,8 7 2
2010 Census 4 5 ,6 3 6 4 4 1 ,5 7 4 1 ,0 6 2 ,9 4 3 9 ,8 1 8 ,6 0 5 1 2 ,8 2 8 ,8 3 7 3 1 2 ,4 7 1 ,3 2 7
2020 Estimate 4 8 ,2 3 1 4 5 8 ,1 1 8 1 ,1 0 3 ,2 3 2 1 0 ,1 0 5 ,2 2 8 1 3 ,3 0 3 ,2 5 5 3 3 3 ,7 6 3 ,8 6 4
2025 Projection 5 1 ,7 3 0 4 8 5 ,9 4 3 1 ,1 7 3 ,5 7 9 1 0 ,6 8 8 ,1 7 0 1 3 ,9 5 4 ,5 4 6 3 4 9 ,4 7 1 ,2 1 2
Population Growth 2000-2010 6 .6 % 6 .6 % 6 .6 % 3 .2 % 3 .8 % 1 1 .0 %
Population Growth 2020-2010 5 .7 % 5 .7 % 5 .7 % 2 .9 % 3 .7 % 6 .8 %
Population Growth 2025-2020 7 .3 % 7 .3 % 7 .3 % 5 .8 % 4 .9 % 4 .7 %
HOUS
EHO
LDS
2000 Census 2 1 ,2 9 9 1 9 4 ,1 7 8 4 3 1 ,0 8 7 3 ,1 3 3 ,6 7 8 4 ,0 6 8 ,9 5 1 1 0 6 ,7 4 1 ,4 0 6
2010 Census 2 2 ,5 5 1 1 9 3 ,9 3 6 4 3 3 ,7 7 5 3 ,2 4 1 ,2 0 4 4 ,2 3 3 ,9 8 5 1 1 8 ,0 9 2 ,8 2 3
2020 Estimate 2 3 ,6 6 0 2 0 0 ,8 6 1 4 5 0 ,6 0 8 3 ,3 4 7 ,7 7 6 4 ,4 0 9 ,3 8 8 1 2 6 ,1 9 3 ,6 3 02025 Projection 2 5 ,3 7 0 2 1 3 ,3 6 7 4 8 0 ,0 4 9 3 ,5 5 1 ,5 1 9 4 ,6 3 9 ,4 1 7 1 3 2 ,0 0 5 ,6 3 3
Household Growth 2000-2010 5 .9 % -0 .1 % 0 .6 % 3 .4 % 4 .1 % 1 0 .6 %
Household Growth 2020-2010 4 .9 % 3 .6 % 3 .9 % 3 .3 % 4 .1 % 6 .9 %
Household Growth 2025-2020 7 .2 % 6 .2 % 6 .5 % 6 .1 % 5 .2 % 4 .6 %
Owner Occupied Housing Units 2 5 ,3 5 6 2 1 7 ,2 6 0 4 8 7 ,2 4 8 3 ,5 4 7 ,3 6 1 4 ,6 6 5 ,5 4 7 1 4 1 ,5 3 4 ,1 6 5
Vacant Housing Units 1 ,6 9 6 6 .7 % 1 6 ,4 0 0 7 .5 % 3 6 ,6 4 0 7 .5 % 1 9 9 ,5 8 5 5 .6 % 2 5 6 ,1 5 9 5 .5 % 1 5 ,3 4 0 ,5 3 5 1 0 .8 %
Occupied Housing Units 2 3 ,6 6 0 9 3 .3 % 2 0 0 ,8 6 1 9 2 .5 % 4 5 0 ,6 0 8 9 2 .5 % 3 ,3 4 7 ,7 7 6 9 4 .4 % 4 ,4 0 9 ,3 8 8 9 4 .5 % 1 2 6 ,1 9 3 ,6 3 0 8 9 .2 %
Owner-Occupied 5 ,4 6 7 2 1 .6 % 5 0 ,2 7 2 2 3 .1 % 1 1 6 ,7 0 5 2 4 .0 % 1 ,5 9 7 ,2 4 3 4 5 .0 % 2 ,2 2 7 ,2 4 6 4 7 .7 % 8 2 ,3 6 9 ,0 2 2 5 8 .2 %
Renter-Occupied 1 8 ,1 9 3 7 1 .8 % 1 5 0 ,5 8 8 6 9 .3 % 3 3 3 ,9 0 2 6 8 .5 % 1 ,7 5 0 ,5 3 3 4 9 .3 % 2 ,1 8 2 ,1 4 2 4 6 .8 % 4 3 ,8 2 4 ,6 0 8 3 1 .0 %
EDUC
ATIO
N
Est. Pop. 25+ by Educational Attainment 3 3 ,4 3 5 3 2 0 ,4 5 0 7 5 8 ,0 3 3 6 ,7 6 1 ,2 8 7 8 ,9 2 1 ,5 1 3 2 2 4 ,6 6 6 ,4 6 3
Less than 9th Grade 1 ,0 0 7 3 .0 % 3 0 ,3 1 5 9 .5 % 9 6 ,2 7 6 1 2 .7 % 8 7 3 ,8 4 5 1 2 .9 % 1 ,0 5 5 ,5 3 1 1 1 .8 % 1 2 ,1 6 2 ,1 0 0 5 .4 %
Some High School, No Diploma 8 7 5 2 .6 % 1 9 ,8 7 3 6 .2 % 5 8 ,4 5 9 7 .7 % 6 0 2 ,8 5 8 8 .9 % 7 4 8 ,8 4 1 8 .4 % 1 5 ,9 5 8 ,0 9 0 7 .1 %
High School Graduate (or GED) 3 ,0 2 8 9 .1 % 5 1 ,9 9 0 1 6 .2 % 1 3 0 ,2 7 4 1 7 .2 % 1 ,4 0 8 ,5 8 0 2 0 .8 % 1 ,7 7 9 ,0 3 9 1 9 .9 % 6 1 ,0 1 2 ,0 9 6 2 7 .2 %
Some College, No Degree 5 ,0 1 5 1 5 .0 % 5 3 ,9 2 2 1 6 .8 % 1 2 4 ,7 7 9 1 6 .5 % 1 ,2 9 6 ,8 5 5 1 9 .2 % 1 ,7 3 3 ,5 9 1 1 9 .4 % 4 6 ,2 0 7 ,4 0 2 2 0 .6 %
Associate Degree 1 ,9 5 3 5 .8 % 1 8 ,2 9 1 5 .7 % 4 1 ,3 4 4 5 .5 % 4 6 9 ,3 4 3 6 .9 % 6 3 7 ,4 4 5 7 .1 % 1 8 ,9 3 4 ,2 4 3 8 .4 %
Bachelor's Degree 1 3 ,0 6 5 3 9 .1 % 9 7 ,9 1 6 3 0 .6 % 2 0 0 ,7 5 4 2 6 .5 % 1 ,3 7 3 ,5 5 2 2 0 .3 % 1 ,9 2 5 ,0 3 5 2 1 .6 % 4 3 ,4 7 9 ,8 7 9 1 9 .4 %
Graduate/Professional Degree 8 ,4 9 1 2 5 .4 % 4 8 ,1 4 3 1 5 .0 % 1 0 6 ,1 4 7 1 4 .0 % 7 3 6 ,2 5 4 1 0 .9 % 1 ,0 4 2 ,0 3 1 1 1 .7 % 2 6 ,9 1 2 ,6 5 3 1 2 .0 %
Powered by Sitewise Pro Data Source: STI PopStats
Demographics | 51
Demographic Report744 S Ridgeley Dr, Los Angeles, CA 90036
0 - 1 mi, 0 - 3 mi, 0 - 5 mi | 34.061032, -118.3507382020-Aug-19
Key Demographics 1 miles 3 miles 5 miles Los Angeles Los Angeles-LongBeach et al, CA National
Count % Count % Count % Count % Count % Count %AG
E
Population by Age0 - 4 4 ,4 1 8 9 .2 % 3 3 ,7 8 8 7 .0 % 7 9 ,9 7 1 6 .8 % 7 1 7 ,7 2 0 6 .7 % 9 2 6 ,1 0 0 6 .6 % 2 1 ,1 5 7 ,4 9 8 6 .1 %
5 - 14 6 ,5 6 6 1 3 .6 % 7 1 ,3 4 6 1 4 .7 % 1 6 2 ,0 8 4 1 3 .8 % 1 ,3 1 6 ,2 7 9 1 2 .3 % 1 ,6 9 7 ,5 3 3 1 2 .2 % 3 8 ,2 6 7 ,6 8 9 1 1 .0 %
14 - 18 1 ,5 8 6 3 .3 % 2 0 ,9 5 9 4 .3 % 5 2 ,2 1 6 4 .4 % 5 1 3 ,0 5 1 4 .8 % 6 6 5 ,8 1 3 4 .8 % 1 6 ,9 7 9 ,1 2 4 4 .9 %
18 - 22 1 ,2 9 3 2 .7 % 1 5 ,8 4 9 3 .3 % 5 3 ,7 2 2 4 .6 % 5 3 0 ,1 6 2 5 .0 % 6 9 5 ,0 7 2 5 .0 % 2 0 ,6 3 6 ,8 6 3 5 .9 %
22 - 25 9 3 4 1 .9 % 1 2 ,0 2 8 2 .5 % 3 3 ,4 3 8 2 .8 % 3 9 5 ,2 6 9 3 .7 % 5 1 9 ,9 1 7 3 .7 % 1 4 ,2 3 9 ,5 7 5 4 .1 %
25 - 35 5 ,0 1 0 1 0 .4 % 4 3 ,7 5 7 9 .0 % 1 1 5 ,0 9 8 9 .8 % 1 ,3 7 3 ,8 8 6 1 2 .9 % 1 ,7 9 5 ,3 5 5 1 2 .9 % 4 4 ,6 9 6 ,6 2 9 1 2 .8 %
35 - 45 9 ,5 4 6 1 9 .8 % 7 5 ,0 6 4 1 5 .4 % 1 8 1 ,2 6 9 1 5 .4 % 1 ,4 0 8 ,1 9 3 1 3 .2 % 1 ,8 0 9 ,3 9 4 1 3 .0 % 4 1 ,5 9 5 ,6 1 7 1 1 .9 %
45 - 55 7 ,4 7 0 1 5 .5 % 7 6 ,1 9 4 1 5 .7 % 1 7 3 ,1 0 1 1 4 .7 % 1 ,3 5 5 ,0 2 2 1 2 .7 % 1 ,7 5 0 ,0 3 4 1 2 .5 % 4 1 ,4 6 6 ,4 8 4 1 1 .9 %
55 - 65 5 ,1 9 1 1 0 .8 % 6 0 ,2 9 0 1 2 .4 % 1 4 0 ,3 8 6 1 2 .0 % 1 ,3 0 9 ,8 5 1 1 2 .3 % 1 ,7 3 6 ,2 1 2 1 2 .4 % 4 3 ,6 8 8 ,6 8 0 1 2 .5 %
65 - 75 3 ,6 8 4 7 .6 % 4 4 ,8 7 0 9 .2 % 1 0 6 ,1 8 8 9 .0 % 1 ,0 5 1 ,4 6 1 9 .8 % 1 ,3 9 3 ,7 8 1 1 0 .0 % 3 8 ,6 2 7 ,6 2 8 1 1 .1 %
75 - 85 1 ,7 9 7 3 .7 % 2 4 ,0 1 3 4 .9 % 5 7 ,2 6 8 4 .9 % 5 4 8 ,1 7 8 5 .1 % 7 3 6 ,4 5 8 5 .3 % 2 1 ,9 6 5 ,1 4 5 6 .3 %85+ 7 3 6 1 .5 % 7 ,7 8 6 1 .6 % 1 8 ,8 3 9 1 .6 % 1 6 9 ,0 9 8 1 .6 % 2 2 8 ,8 7 7 1 .6 % 6 ,1 5 0 ,2 8 0 1 .8 %
INCO
ME
CY Estimated HH by HH Income 2 3 ,6 6 0 2 0 0 ,8 6 1 4 5 0 ,6 0 8 3 ,3 4 7 ,7 7 6 4 ,4 0 9 ,3 8 8 1 2 6 ,1 9 3 ,6 3 0
< $15,000 1 ,9 2 6 8 .1 % 2 2 ,8 3 4 1 1 .4 % 5 8 ,0 4 1 1 2 .9 % 3 3 3 ,8 0 0 1 0 .0 % 4 0 3 ,5 7 2 9 .2 % 1 3 ,3 8 8 ,4 2 0 1 0 .6 %
$15,000 - $24,999 1 ,1 5 5 4 .9 % 1 8 ,0 6 8 9 .0 % 4 5 ,5 9 8 1 0 .1 % 2 8 8 ,7 5 1 8 .6 % 3 5 0 ,2 7 5 7 .9 % 1 1 ,5 8 1 ,4 7 2 9 .2 %
$25,000 - $34,999 1 ,4 3 3 6 .1 % 1 7 ,2 0 4 8 .6 % 4 0 ,7 0 7 9 .0 % 2 7 7 ,3 6 9 8 .3 % 3 4 2 ,7 7 2 7 .8 % 1 1 ,5 6 9 ,9 9 2 9 .2 %
$35,000 - $49,000 2 ,0 1 5 8 .5 % 2 1 ,8 8 7 1 0 .9 % 5 3 ,5 0 0 1 1 .9 % 3 8 4 ,5 2 5 1 1 .5 % 4 8 1 ,3 7 0 1 0 .9 % 1 5 ,9 0 2 ,8 9 5 1 2 .6 %
$50,000 - $74,999 3 ,9 2 7 1 6 .6 % 3 3 ,1 6 8 1 6 .5 % 7 1 ,2 7 6 1 5 .8 % 5 3 9 ,7 0 2 1 6 .1 % 6 9 9 ,3 2 1 1 5 .9 % 2 2 ,1 0 9 ,8 9 5 1 7 .5 %
$75,000 - $99,999 2 ,7 8 2 1 1 .8 % 2 3 ,0 5 7 1 1 .5 % 4 9 ,8 1 6 1 1 .1 % 4 0 8 ,8 0 3 1 2 .2 % 5 4 5 ,8 4 2 1 2 .4 % 1 5 ,9 2 2 ,3 5 1 1 2 .6 %
$100,000 - $149,999 4 ,3 0 8 1 8 .2 % 2 8 ,6 1 3 1 4 .2 % 5 8 ,5 5 3 1 3 .0 % 5 2 4 ,8 4 8 1 5 .7 % 7 2 4 ,2 8 1 1 6 .4 % 1 8 ,7 2 6 ,7 0 8 1 4 .8 %
$150,000 - $199,999 2 ,8 6 0 1 2 .1 % 1 6 ,1 9 3 8 .1 % 3 4 ,4 5 6 7 .6 % 3 0 8 ,6 7 0 9 .2 % 4 5 1 ,5 7 4 1 0 .2 % 1 0 ,6 6 7 ,6 2 7 8 .5 %
> $200,000 3 ,2 5 6 1 3 .8 % 1 9 ,8 3 7 9 .9 % 3 8 ,6 6 0 8 .6 % 2 8 1 ,3 0 8 8 .4 % 4 1 0 ,3 8 1 9 .3 % 6 ,3 2 4 ,2 7 0 5 .0 %
2020 Median Household Income $ 8 6 ,3 1 7 $ 6 4 ,6 1 8 $ 5 8 ,8 4 5 $ 6 7 ,2 5 2 $ 7 2 ,0 2 2 $ 6 1 ,1 5 1
2025 Median Household Income $ 1 0 1 ,2 0 9 $ 7 3 ,7 4 5 $ 6 6 ,4 8 5 $ 7 6 ,9 9 4 $ 8 2 ,0 0 8 $ 6 8 ,8 7 8
2020 Average Household Income $ 1 2 7 ,1 3 2 $ 1 0 0 ,7 5 2 $ 9 6 ,2 8 5 $ 9 7 ,9 6 6 $ 1 0 3 ,2 4 0 $ 8 5 ,7 9 1
2025 Average Household Income $ 1 4 5 ,1 2 6 $ 1 1 4 ,6 6 7 $ 1 0 9 ,1 9 9 $ 1 1 1 ,3 3 3 $ 1 1 6 ,7 1 5 $ 9 6 ,5 5 4
LABO
UR F
ORC
E Pop. 16+ by Employment Status 3 6 ,4 3 7 3 5 6 ,5 7 1 8 6 5 ,4 7 1 7 ,9 7 3 ,3 2 4 1 0 ,5 2 4 ,1 7 3 2 6 7 ,6 4 3 ,2 1 3
Labor Force 2 6 ,6 3 0 7 3 .1 % 2 5 2 ,2 8 1 7 0 .8 % 5 9 7 ,2 0 9 6 9 .0 % 5 ,1 2 2 ,4 3 0 6 4 .2 % 6 ,7 9 3 ,1 3 0 6 4 .5 % 1 6 8 ,8 4 6 ,3 8 9 6 3 .1 %
In Armed Forces 2 0 .0 % 1 4 8 0 .0 % 2 3 5 0 .0 % 3 ,5 3 9 0 .0 % 5 ,0 9 2 0 .0 % 1 ,1 2 8 ,9 9 7 0 .4 %
Civilian, Employed 2 5 ,6 6 8 7 0 .4 % 2 4 1 ,7 9 1 6 7 .8 % 5 6 8 ,7 9 8 6 5 .7 % 4 ,8 8 3 ,2 1 1 6 1 .2 % 6 ,5 0 3 ,1 3 1 6 1 .8 % 1 6 2 ,5 7 8 ,4 2 2 6 0 .7 %
Civilian, Unemployed 9 6 2 2 .6 % 1 0 ,4 9 1 2 .9 % 2 8 ,4 1 1 3 .3 % 2 3 9 ,2 1 9 3 .0 % 2 8 9 ,9 9 9 2 .8 % 6 ,2 6 7 ,9 6 7 2 .3 %
Not in Labor Force 9 ,8 0 7 2 6 .9 % 1 0 4 ,2 8 9 2 9 .2 % 2 6 8 ,2 6 3 3 1 .0 % 2 ,8 5 0 ,8 9 4 3 5 .8 % 3 ,7 3 1 ,0 4 3 3 5 .5 % 9 8 ,7 9 6 ,8 2 4 3 6 .9 %
Unemployment Rate 3 .6 % 3 .6 % 3 .6 % 3 .6 % 3 .6 % 3 .6 %
Powered by Sitewise Pro Data Source: STI PopStats

52 | Demographics
Demographic Report744 S Ridgeley Dr, Los Angeles, CA 90036
0 - 1 mi, 0 - 3 mi, 0 - 5 mi | 34.061032, -118.3507382020-Aug-19
Key Demographics 1 miles 3 miles 5 miles Los Angeles Los Angeles-LongBeach et al, CA National
Count % Count % Count % Count % Count % Count %EM
PLO
YMEN
T
Employed Population 16+ by Industry 2 5 ,6 6 8 2 4 1 ,7 9 1 5 6 8 ,7 9 8 4 ,8 8 3 ,2 1 1 6 ,5 0 3 ,1 3 1 1 6 2 ,5 7 8 ,4 2 2
Agriculture/Mining 6 0 6 2 .4 % 1 1 ,1 5 2 4 .6 % 3 1 ,6 9 6 5 .6 % 3 1 3 ,8 3 0 6 .4 % 4 1 5 ,8 6 9 6 .4 % 1 3 ,5 8 2 ,4 0 7 8 .4 %
Manufacturing 1 ,1 5 1 4 .5 % 1 1 ,6 9 2 4 .8 % 3 6 ,0 2 3 6 .3 % 4 7 6 ,7 6 2 9 .8 % 6 8 2 ,1 6 8 1 0 .5 % 1 6 ,5 9 1 ,4 5 1 1 0 .2 %
Wholesale & Retail Trade 2 ,4 1 0 9 .4 % 2 8 ,0 9 7 1 1 .6 % 6 7 ,1 5 0 1 1 .8 % 6 7 4 ,8 0 2 1 3 .8 % 9 0 1 ,9 3 1 1 3 .9 % 2 2 ,6 5 1 ,9 2 5 1 3 .9 %
Transpotation/Utilities 6 0 2 2 .3 % 8 ,6 3 6 3 .6 % 2 1 ,9 2 9 3 .9 % 2 8 7 ,9 5 0 5 .9 % 3 4 4 ,4 9 7 5 .3 % 8 ,4 9 6 ,0 9 4 5 .2 %
Information 3 ,3 6 4 1 3 .1 % 2 1 ,8 3 1 9 .0 % 4 3 ,3 8 8 7 .6 % 2 0 9 ,1 3 7 4 .3 % 2 4 1 ,7 5 5 3 .7 % 3 ,3 1 4 ,8 9 7 2 .0 %
Finance/Insurance/Real Estate 1 ,7 3 9 6 .8 % 1 5 ,0 9 1 6 .2 % 3 4 ,0 4 8 6 .0 % 2 9 5 ,0 3 4 6 .0 % 4 3 3 ,2 8 5 6 .7 % 1 0 ,6 4 4 ,6 0 1 6 .5 %
Professional/Management/Scientific 4 ,2 7 6 1 6 .7 % 3 8 ,5 2 7 1 5 .9 % 8 4 ,9 2 6 1 4 .9 % 6 2 5 ,0 1 6 1 2 .8 % 8 6 0 ,7 6 8 1 3 .2 % 1 8 ,4 8 8 ,7 9 2 1 1 .4 %
Education/Health/Social Services 5 ,0 9 7 1 9 .9 % 4 1 ,8 0 6 1 7 .3 % 1 0 3 ,2 9 7 1 8 .2 % 1 ,0 0 7 ,6 9 3 2 0 .6 % 1 ,3 1 9 ,2 6 6 2 0 .3 % 3 7 ,5 8 0 ,9 4 9 2 3 .1 %
Arts/Ent./Accomodation/Food Services 4 ,4 3 6 1 7 .3 % 4 1 ,3 3 0 1 7 .1 % 8 9 ,8 0 8 1 5 .8 % 5 4 3 ,9 6 4 1 1 .1 % 7 2 0 ,6 6 3 1 1 .1 % 1 5 ,5 6 8 ,9 0 3 9 .6 %
Other Services 1 ,3 0 4 5 .1 % 1 9 ,1 4 6 7 .9 % 4 4 ,9 4 6 7 .9 % 2 9 1 ,2 3 1 6 .0 % 3 7 9 ,6 5 2 5 .8 % 7 ,9 3 0 ,6 0 5 4 .9 %
Public Administration 6 8 5 2 .7 % 4 ,4 8 4 1 .9 % 1 1 ,5 8 8 2 .0 % 1 5 7 ,7 9 2 3 .2 % 2 0 3 ,2 7 7 3 .1 % 7 ,7 2 7 ,7 9 8 4 .8 %
Employed Civilian Pop. 16+ by Occupation 2 5 ,6 6 8 2 4 1 ,7 9 1 5 6 8 ,7 9 8 4 ,8 8 3 ,2 1 1 6 ,5 0 3 ,1 3 1 1 6 2 ,5 7 8 ,4 2 2
White Collar 2 1 ,4 6 2 8 3 .6 % 1 6 1 ,7 6 8 6 6 .9 % 3 5 2 ,7 0 3 6 2 .0 % 2 ,8 9 1 ,3 4 0 5 9 .2 % 3 ,9 5 1 ,4 9 2 6 0 .8 % 9 7 ,5 8 4 ,7 4 3 6 0 .0 %
Services 2 ,8 0 0 1 0 .9 % 4 9 ,8 0 6 2 0 .6 % 1 2 4 ,7 2 1 2 1 .9 % 9 2 7 ,4 1 3 1 9 .0 % 1 ,2 0 6 ,6 8 8 1 8 .6 % 2 8 ,9 2 2 ,3 5 6 1 7 .8 %
Blue Collar 1 ,4 0 6 5 .5 % 3 0 ,2 1 7 1 2 .5 % 9 1 ,3 7 3 1 6 .1 % 1 ,0 6 4 ,4 5 8 2 1 .8 % 1 ,3 4 4 ,9 5 1 2 0 .7 % 3 6 ,0 7 1 ,3 2 3 2 2 .2 %
HOUS
ING
VALU
E
Owner-Occupied Housing Units by Value 5 ,4 6 7 5 0 ,2 7 2 1 1 6 ,7 0 5 1 ,5 9 7 ,2 4 3 2 ,2 2 7 ,2 4 6 8 2 ,3 6 9 ,0 2 2
Less than $50,000 3 4 0 .6 % 5 5 7 1 .1 % 1 ,6 1 4 1 .4 % 2 4 ,8 7 1 1 .6 % 3 4 ,4 5 9 1 .5 % 4 ,7 8 5 ,0 6 1 5 .8 %
$50,000 - $99,999 2 6 0 .5 % 4 1 0 0 .8 % 8 1 9 0 .7 % 1 8 ,8 1 4 1 .2 % 2 6 ,0 8 9 1 .2 % 7 ,6 0 0 ,4 3 8 9 .2 %
$100,000 - $199,999 4 3 0 .8 % 4 2 5 0 .8 % 1 ,2 3 6 1 .1 % 2 4 ,6 9 0 1 .5 % 3 5 ,1 1 6 1 .6 % 1 8 ,4 6 5 ,6 3 6 2 2 .4 %
$200,000 - $299,999 3 2 0 .6 % 3 6 8 0 .7 % 1 ,1 1 3 1 .0 % 3 2 ,9 4 3 2 .1 % 4 5 ,3 7 2 2 .0 % 1 4 ,3 9 7 ,3 4 8 1 7 .5 %
$300,000 - $399,999 5 8 1 .1 % 8 1 5 1 .6 % 2 ,3 6 0 2 .0 % 6 8 ,3 8 1 4 .3 % 8 5 ,9 9 9 3 .9 % 9 ,9 9 5 ,6 3 2 1 2 .1 %
$400,000 - $499,999 7 7 1 .4 % 1 ,3 2 6 2 .6 % 4 ,2 5 4 3 .6 % 1 2 1 ,1 5 6 7 .6 % 1 5 4 ,0 8 2 6 .9 % 7 ,2 2 6 ,8 1 3 8 .8 %
$500,000 - $749,999 2 3 8 4 .3 % 5 ,9 2 9 1 1 .8 % 1 5 ,8 7 1 1 3 .6 % 4 2 2 ,9 9 3 2 6 .5 % 5 5 1 ,2 2 4 2 4 .7 % 9 ,6 7 4 ,4 4 8 1 1 .7 %
$750,000 $1,000,000 6 2 5 1 1 .4 % 9 ,3 8 4 1 8 .7 % 2 1 ,1 5 9 1 8 .1 % 3 0 4 ,9 7 7 1 9 .1 % 4 6 6 ,3 1 2 2 0 .9 % 4 ,6 2 8 ,1 8 1 5 .6 %
$1,000,000 or more 4 ,3 3 5 7 9 .3 % 3 1 ,0 5 8 6 1 .8 % 6 8 ,2 8 0 5 8 .5 % 5 7 8 ,4 1 8 3 6 .2 % 8 2 8 ,5 9 3 3 7 .2 % 5 ,5 9 5 ,4 6 5 6 .8 %
Median Housing Unit Value $ 1 ,1 2 3 ,1 3 1 $ 1 ,0 6 3 ,5 6 0 $ 1 ,0 4 8 ,4 6 2 $ 8 1 9 ,4 9 2 $ 8 4 7 ,1 8 9 $ 2 6 8 ,8 8 7
Average Housing Unit Value $ 1 ,5 1 4 ,7 5 0 $ 1 ,3 2 3 ,2 7 5 $ 1 ,3 3 5 ,7 4 2 $ 9 5 3 ,6 3 2 $ 9 6 2 ,2 0 5 $ 3 8 6 ,8 1 8
Powered by Sitewise Pro Data Source: STI PopStats

Demographics | 53
Demographic Report744 S Ridgeley Dr, Los Angeles, CA 90036
0 - 1 mi, 0 - 3 mi, 0 - 5 mi | 34.061032, -118.3507382020-Aug-19
Key Demographics 1 miles 3 miles 5 miles Los Angeles Los Angeles-LongBeach et al, CA National
Count % Count % Count % Count % Count % Count %ET
HNIC
ITY
Estimated Population by Ethnicity 4 8 ,2 3 1 4 5 8 ,1 1 8 1 ,1 0 3 ,2 3 2 1 0 ,1 0 5 ,2 2 8 1 3 ,3 0 3 ,2 5 5 3 3 3 ,7 6 3 ,8 6 4
America 1 ,1 6 6 2 .4 % 8 ,7 8 3 1 .9 % 1 7 ,6 4 6 1 .6 % 1 5 3 ,2 8 8 1 .5 % 2 3 5 ,3 6 4 1 .8 % 2 0 ,9 6 6 ,8 5 0 6 .3 %
American 1 ,0 1 4 2 .1 % 7 ,6 2 5 1 .7 % 1 4 ,8 7 0 1 .3 % 1 1 0 ,1 5 0 1 .1 % 1 7 6 ,5 5 3 1 .3 % 1 7 ,9 8 8 ,0 1 8 5 .4 %
Native American 1 0 3 0 .2 % 7 2 6 0 .2 % 1 ,8 1 5 0 .2 % 2 0 ,1 4 3 0 .2 % 2 6 ,8 6 1 0 .2 % 2 ,4 4 5 ,1 7 4 0 .7 %
Hawaiian 4 9 0 .1 % 4 3 2 0 .1 % 9 6 1 0 .1 % 2 2 ,9 9 5 0 .2 % 3 1 ,9 5 0 0 .2 % 5 3 3 ,6 5 8 0 .2 %
Hispanic 6 ,8 0 2 1 4 .1 % 1 4 7 ,9 9 1 3 2 .3 % 4 3 7 ,2 6 7 3 9 .6 % 4 ,8 4 5 ,2 7 1 4 7 .9 % 5 ,9 1 9 ,0 6 4 4 4 .5 % 5 9 ,0 2 9 ,6 7 6 1 7 .7 %
Mexican 4 ,3 8 2 9 .1 % 7 9 ,1 5 8 1 7 .3 % 2 1 6 ,5 8 9 1 9 .6 % 3 ,6 3 5 ,9 7 3 3 6 .0 % 4 ,5 4 5 ,5 4 0 3 4 .2 % 3 4 ,8 7 4 ,5 4 8 1 0 .4 %
Puerto Rican 2 6 2 0 .5 % 2 ,0 2 7 0 .4 % 4 ,7 4 3 0 .4 % 4 4 ,5 4 8 0 .4 % 5 7 ,1 9 1 0 .4 % 8 ,4 5 2 ,9 4 8 2 .5 %
Cuban 1 8 0 0 .4 % 1 ,2 9 7 0 .3 % 3 ,7 3 8 0 .3 % 4 0 ,9 9 0 0 .4 % 4 9 ,8 0 7 0 .4 % 2 ,0 9 4 ,7 0 5 0 .6 %
Dominican 3 6 0 .1 % 4 1 3 0 .1 % 7 2 1 0 .1 % 4 ,7 8 1 0 .0 % 5 ,6 1 9 0 .0 % 1 ,7 4 5 ,2 6 3 0 .5 %
Central American 1 ,0 2 6 2 .1 % 4 6 ,9 8 3 1 0 .3 % 1 6 0 ,6 0 2 1 4 .6 % 7 1 9 ,3 2 0 7 .1 % 7 7 4 ,7 4 7 5 .8 % 4 ,7 1 1 ,2 9 3 1 .4 %
South American 2 9 1 0 .6 % 4 ,3 1 3 0 .9 % 1 1 ,4 5 7 1 .0 % 1 1 8 ,2 5 6 1 .2 % 1 5 3 ,5 6 0 1 .2 % 3 ,2 5 0 ,9 2 2 1 .0 %
Other Hispanic 6 2 4 1 .3 % 1 3 ,8 0 1 3 .0 % 3 9 ,4 1 7 3 .6 % 2 8 1 ,4 0 3 2 .8 % 3 3 2 ,6 0 0 2 .5 % 3 ,8 9 9 ,9 9 7 1 .2 %
Asian 8 ,7 6 8 1 8 .2 % 7 1 ,4 6 3 1 5 .6 % 1 6 2 ,3 1 9 1 4 .7 % 1 ,3 9 5 ,9 3 8 1 3 .8 % 1 ,9 9 2 ,5 9 9 1 5 .0 % 1 6 ,4 4 2 ,5 6 3 4 .9 %Chinese 1 ,0 8 6 2 .3 % 5 ,9 6 8 1 .3 % 1 9 ,7 4 0 1 .8 % 4 3 8 ,9 4 1 4 .3 % 5 4 2 ,6 1 7 4 .1 % 3 ,9 3 0 ,2 7 0 1 .2 %
Japanese 8 0 8 1 .7 % 3 ,8 7 9 0 .8 % 9 ,3 4 8 0 .8 % 1 0 2 ,5 7 0 1 .0 % 1 3 7 ,8 7 9 1 .0 % 8 0 7 ,4 3 6 0 .2 %
Korean 4 ,2 4 8 8 .8 % 4 0 ,5 8 8 8 .9 % 7 1 ,3 2 5 6 .5 % 2 1 4 ,2 8 2 2 .1 % 3 0 4 ,7 6 4 2 .3 % 1 ,4 4 3 ,7 3 6 0 .4 %
SC Asian 1 ,0 8 6 2 .3 % 4 ,5 2 2 1 .0 % 1 3 ,8 4 5 1 .3 % 1 0 7 ,5 1 7 1 .1 % 1 6 5 ,6 6 0 1 .2 % 4 ,0 7 1 ,7 5 5 1 .2 %
SE Asian 1 ,4 6 1 3 .0 % 1 4 ,5 0 5 3 .2 % 4 2 ,9 1 2 3 .9 % 4 8 2 ,3 7 4 4 .8 % 7 7 2 ,1 6 8 5 .8 % 5 ,3 4 5 ,8 5 5 1 .6 %
Other Asian 7 9 0 .2 % 2 ,0 0 0 0 .4 % 5 ,1 4 9 0 .5 % 5 0 ,2 5 4 0 .5 % 6 9 ,5 1 1 0 .5 % 8 4 3 ,5 1 1 0 .3 %
European 1 0 ,8 3 6 2 2 .5 % 7 6 ,3 3 2 1 6 .7 % 1 4 2 ,3 3 7 1 2 .9 % 1 ,0 5 2 ,2 3 6 1 0 .4 % 1 ,6 3 6 ,5 8 8 1 2 .3 % 1 0 9 ,4 0 9 ,6 6 6 3 2 .8 %
British 1 ,3 0 5 2 .7 % 9 ,1 0 9 2 .0 % 1 8 ,6 5 6 1 .7 % 1 6 4 ,3 8 2 1 .6 % 2 6 9 ,4 5 5 2 .0 % 1 6 ,8 9 3 ,8 5 0 5 .1 %
Dutch 1 4 5 0 .3 % 1 ,0 3 2 0 .2 % 1 ,9 5 1 0 .2 % 1 9 ,5 6 5 0 .2 % 3 3 ,1 8 4 0 .2 % 2 ,3 2 9 ,1 1 0 0 .7 %
French 5 3 3 1 .1 % 3 ,7 6 8 0 .8 % 6 ,9 9 0 0 .6 % 4 4 ,1 6 6 0 .4 % 6 8 ,0 6 2 0 .5 % 4 ,6 3 1 ,1 1 8 1 .4 %
German 1 ,5 9 8 3 .3 % 1 0 ,8 0 3 2 .4 % 2 0 ,8 3 9 1 .9 % 1 9 0 ,3 3 3 1 .9 % 3 1 4 ,2 0 0 2 .4 % 2 8 ,4 5 1 ,3 1 1 8 .5 %
Italian 1 ,0 5 8 2 .2 % 7 ,3 3 9 1 .6 % 1 3 ,6 6 3 1 .2 % 1 0 8 ,9 1 7 1 .1 % 1 6 8 ,0 0 0 1 .3 % 1 0 ,4 8 8 ,0 8 9 3 .1 %
Polish 8 5 9 1 .8 % 5 ,1 3 7 1 .1 % 9 ,1 3 5 0 .8 % 4 8 ,4 7 9 0 .5 % 6 9 ,1 5 7 0 .5 % 5 ,4 8 7 ,5 8 6 1 .6 %
Scandinavian 5 7 5 1 .2 % 3 ,6 2 3 0 .8 % 7 ,4 4 9 0 .7 % 7 0 ,4 5 6 0 .7 % 1 1 8 ,0 1 7 0 .9 % 6 ,7 8 1 ,8 0 9 2 .0 %
Scotch/Irish 1 ,6 5 4 3 .4 % 1 0 ,6 6 1 2 .3 % 2 0 ,9 5 5 1 .9 % 1 9 0 ,5 9 8 1 .9 % 3 0 7 ,0 9 7 2 .3 % 2 3 ,7 4 1 ,7 4 2 7 .1 %
Other European 3 ,1 0 9 6 .4 % 2 4 ,8 5 9 5 .4 % 4 2 ,6 9 9 3 .9 % 2 1 5 ,3 4 0 2 .1 % 2 8 9 ,4 1 6 2 .2 % 1 0 ,6 0 5 ,0 5 1 3 .2 %
Middle Eastern 1 ,3 2 7 2 .8 % 1 4 ,4 9 9 3 .2 % 3 1 ,2 0 7 2 .8 % 2 1 0 ,6 1 1 2 .1 % 2 5 7 ,1 2 3 1 .9 % 2 ,1 1 2 ,4 2 3 0 .6 %
Other Ethnicity 1 5 ,7 6 4 3 2 .7 % 1 1 1 ,7 3 4 2 4 .4 % 2 5 4 ,8 2 5 2 3 .1 % 1 ,9 8 2 ,8 9 2 1 9 .6 % 2 ,5 7 3 ,5 5 5 1 9 .3 % 7 6 ,8 5 8 ,5 2 0 2 3 .0 %
Unclassified 3 ,5 6 8 7 .4 % 2 7 ,3 1 6 6 .0 % 5 7 ,6 3 0 5 .2 % 4 6 4 ,9 9 2 4 .6 % 6 8 8 ,9 6 2 5 .2 % 4 8 ,9 4 4 ,1 6 6 1 4 .7 %
Powered by Sitewise Pro Data Source: STI PopStats

54 | Demographics
Median Household Income744 S Ridgeley Dr, Los Angeles, CA 90036
0 - 1 mi, 0 - 3 mi, 0 - 5 mi | 34.061032, -118.3507382020-Aug-19
Legend Map
Powered by Sitewise Pro Data Source: STI PopStats

Demographics | 55
Median Housing Value744 S Ridgeley Dr, Los Angeles, CA 90036
0 - 1 mi, 0 - 3 mi, 0 - 5 mi | 34.061032, -118.3507382020-Aug-19
Legend Map
Powered by Sitewise Pro Data Source: STI PopStats

56 | Demographics
Population Density744 S Ridgeley Dr, Los Angeles, CA 90036
0 - 1 mi, 0 - 3 mi, 0 - 5 mi | 34.061032, -118.3507382020-Aug-19
Legend Map
Powered by Sitewise Pro Data Source: STI PopStats

Demographics | 57
% Population Change: 2010-2020744 S Ridgeley Dr, Los Angeles, CA 90036
0 - 1 mi, 0 - 3 mi, 0 - 5 mi | 34.061032, -118.3507382020-Aug-19
Legend Map
Powered by Sitewise Pro Data Source: STI PopStats

MULTIFAMILY REPORT

Demographics | 59

60 | Multifamily Report
LOS ANGELES WEST MULTIFAMILY REPORTMARKET AT A GLANCE
OCCUPANCY AND RENT TRENDS
L.A. METRO FORBEARANCE RATE LOWER THAN U.S. PRIMARY MARKETS
Builders delivered 2,498 apartment units in the second quarter of 2020 in Los Angeles West, while operators recorded net negative absorption of 4,179 units. This supply imbalance spurred a 170-basis-point quarter-over-quarter reduction in occupancy to 94.2% in June. During that time, net absorption increased only in the Downtown Los Angeles submarket, though a wave of new apartments fueled a decrease in occupancy. Effective rent fell 3.9% from March 2020 to June in Downtown Los Angeles, which mirrored the rest of Los Angeles West. Since March 2020, monthly effective rent in Los Angeles West depreciated 4.2% to $2,708. Approximately 79% of renters paid all or part of their rent from July 1 to July 6. Metrowide, accepted applications for loan forbearance rose from 2.6% of outstanding loans in May to 2.8% in June. Even with this increase, the rate of forbearance in the metro area was lower than the 3.6% average rate among primary apartment markets in the U.S. Looking forward, 5,057 apartment units are scheduled for delivery in Los Angeles West in the last half of 2020. These additions may test occupancy and rent growth, but the county’s ongoing housing shortage will help sustain long-term demand for multifamily housing.
$2,300
$2,500
$2,700
$2,900
92%
94%
96%
98%
3Q15 1Q16 3Q16 1Q17 3Q17 1Q18 3Q18 1Q19 3Q19 1Q20
OCCUPANCY AND RENT TRENDS
Occupancy Rate Effective Rent
OCCUPANCYRATE
EFFECTIVERENT
94.2%
$2,708
79.0%
Down 190 bps since 2Q19
Down 3.9% since 2Q19
RENT PAYMENT TRACKER
(Jul 1-6)Down 320 bps since June 1-6
MARKET AT A GLANCE
OCCUPANCY AND RENT TRENDS
L.A. METRO FORBEARANCE RATE LOWER THAN U.S. PRIMARY MARKETS
Builders delivered 2,498 apartment units in the second quarter of 2020 in Los Angeles West, while operators recorded net negative absorption of 4,179 units. This supply imbalance spurred a 170-basis-point quarter-over-quarter reduction in occupancy to 94.2% in June. During that time, net absorption increased only in the Downtown Los Angeles submarket, though a wave of new apartments fueled a decrease in occupancy. Effective rent fell 3.9% from March 2020 to June in Downtown Los Angeles, which mirrored the rest of Los Angeles West. Since March 2020, monthly effective rent in Los Angeles West depreciated 4.2% to $2,708. Approximately 79% of renters paid all or part of their rent from July 1 to July 6. Metrowide, accepted applications for loan forbearance rose from 2.6% of outstanding loans in May to 2.8% in June. Even with this increase, the rate of forbearance in the metro area was lower than the 3.6% average rate among primary apartment markets in the U.S. Looking forward, 5,057 apartment units are scheduled for delivery in Los Angeles West in the last half of 2020. These additions may test occupancy and rent growth, but the county’s ongoing housing shortage will help sustain long-term demand for multifamily housing.
$2,300
$2,500
$2,700
$2,900
92%
94%
96%
98%
3Q15 1Q16 3Q16 1Q17 3Q17 1Q18 3Q18 1Q19 3Q19 1Q20
OCCUPANCY AND RENT TRENDS
Occupancy Rate Effective Rent
OCCUPANCYRATE
EFFECTIVERENT
94.2%
$2,708
79.0%
Down 190 bps since 2Q19
Down 3.9% since 2Q19
RENT PAYMENT TRACKER
(Jul 1-6)Down 320 bps since June 1-6
OCCUPANCY AND RENT TRENDS
Local apartment fundamentals continued on an upward track in the last four quarters. Builders delivered 402 apartments in the Albuquerque metro area in the four quarters ending in March of this year. More than 80% of new inventory was in the North Valley submarket among two developments: the 226-unit Broadstone Northpoint and the 232-unit Markana apartment communities. Renters occupied 677 apartments across the metro since the first quarter of 2018. The heightened demand pushed average occupancy up 50 basis points annually to 94.3% in March 2019. Meanwhile, operators taking advantage of healthy apartment demand raised rent 4.1% over the last four quarters, resulting in average effective rent of $809 per month by March. Over the next four quarters, 50 apartments are slated for delivery in the metro area, and four apartment communities comprising a total of 718 units are scheduled to break ground, though the earliest lease date expected among these developments will not be until the third quarter of 2020. Eight apartment communities are in the early planning stages and could break ground after 2019.
LOS ANGELES WEST SECOND QUARTER 2020MULTIFAMILY REPORT

Multifamily Report | 61

62 | Disclaimer
The material contained in this document is confidential, furnished solely for the purpose of considering investment in the property described therein and is not to be copied and/or used for any purpose or made available to any other person without the express written consent of Berkadia Real Estate Advisors LLC and Berkadia Real Estate Advisors Inc. In accepting this, the recipient agrees to keep all material contained herein confidential.
This information package has been prepared to provide summary information to prospective purchasers and to establish a preliminary level of interest in the property described herein. It does not, however, purport to present all material information regarding the subject property, and it is not a substitute for a thorough due diligence investigation. In particular, Berkadia Real Estate Advisors LLC, Berkadia Real Estate Advisors Inc. and Seller have not made any investigation of the actual property, the tenants, the operating history, financial reports, leases, square footage, age or any other aspect of the property, including but not limited to any potential environmental problems that may exist and make no warranty or representation whatsoever concerning these issues. The information contained in this information package has been obtained from sources we believe to be reliable; however, Berkadia Real Estate Advisors LLC, Berkadia Real Estate Advisors Inc. and Seller have not conducted any investigation regarding these matters and make no warranty or representation whatsoever regarding the accuracy or completeness of the information provided. Any pro formas, projections, opinions, assumptions or estimates used are for example only and do not necessarily represent the current or future performance of the property.
Berkadia Real Estate Advisors LLC and Berkadia Real Estate Advisors Inc. and Seller strongly recommend that prospective purchasers conduct an in-depth investigation of every physical and financial aspect of the property to determine if the property meets their needs and expectations. We also recommend that prospective purchasers consult with their tax, financial and legal advisors on any matter that may affect their decision to purchase the property and the subsequent consequences of ownership.
All parties are advised that in any property the presence of certain kinds of molds, funguses, or other organisms may adversely affect the property and the health of some individuals. Berkadia Real Estate Advisors LLC and Berkadia Real Estate Advisors Inc. recommend, if prospective buyers have questions or concerns regarding this issue, that prospective buyers conduct further inspections by a qualified professional.
The Seller retains the right to withdraw, modify or cancel this offer to sell at any time and without any notice or obligation. Any sale is subject to the sole and unrestricted approval of Seller, and Seller shall be under no obligation to any party until such time as Seller and any other necessary parties have executed a contract of sale containing terms and conditions acceptable to Seller and such obligations of Seller shall only be those in such contract of sale.
For more information on these and other Berkadia® exclusive listings, please visit our website at www.Berkadia.com
Berkadia®, a joint venture of Berkshire Hathaway and Jefferies Financial Group, is an industry leading commercial real estate company providing comprehensive capital solutions and investment sales advisory and research services for multifamily and commercial properties. Berkadia® is amongst the largest, highest rated and most respected primary, master and special servicers in the industry.
© 2020 Berkadia Proprietary Holding LLC
Berkadia® is a trademark of Berkadia Proprietary Holding LLC
Investment sales and real estate brokerage businesses are conducted exclusively by Berkadia Real Estate Advisors LLC and Berkadia Real Estate Advisors Inc. Commercial mortgage loan origination and servicing businesses are conducted exclusively by Berkadia Commercial Mortgage LLC and Berkadia Commercial Mortgage Inc. Tax credit syndication business is conducted exclusively by Berkadia Affordable Tax Credit Solutions. In California, Berkadia Real Estate Advisors Inc. conducts business under CA Real Estate Broker License #01931050; Vincent B. Norris, CA BRE Lic. # 843890. Berkadia Commercial Mortgage LLC conducts business under CA Finance Lender & Broker Lic. #988-0701; and Berkadia Commercial Mortgage Inc. under CA Real Estate Broker Lic. #01874116. This proposal is not intended to solicit commercial mortgage loan brokerage business in Nevada. For state licensing details, visit: http://
www.berkadia.com/legal/licensing.aspx
DISCLAIMER

| 63
ALBUQUERQUE, NM
AMBLER, PA
ATLANTA, GA
AUSTIN, TX
BALD HEAD ISLAND, NC
BATON ROUGE, LA
BIRMINGHAM, AL
BOCA RATON, FL
BOSTON, MA
BRENTWOOD, TN
CAMAS, WA
CHARLESTON, SC
CHATTANOOGA, TN
CHEVY CHASE, MD
CHICAGO, IL
CLEARWATER, FL
CLEVELAND, OH
COLORADO SPRINGS, CO
COLUMBUS, OH
DALLAS, TX
DENVER, CO
DETROIT, MI
EL SEGUNDO, CA
HENDERSON, NV
HOUSTON, TX
IRVINE, CA
JACKSONVILLE, FL
KANSAS CITY, MO
LENOX, MA
LEXINGTON, KY
LOS ANGELES, CA
MEMPHIS, TN
MIAMI, FL
MIDVALE, UT
MURRIETA, CA
NEW YORK, NY
NEWPORT NEWS, VA
ORLANDO, FL
PASADENA, CA
PHILADELPHIA, PA
PHOENIX, AZ
PORTLAND, OR
RALEIGH, NC
RICHMOND, VA
SALT LAKE CITY, UT
SAN ANTONIO, TX
SAN CLEMENTE, CA
SAN DIEGO, CA
SAN FRANCISCO, CA
SEATTLE, WA
SHREWSBURY, NJ
ST. LOUIS, MO
TAMPA, FL
TEMPE, AZ
TUCSON, AZ
WOODLAND HILLS, CA
HYDERABAD, INDIA
SOUTH BAY OFFICE2321 Rosecrans Avenue, Suite #3235
El Segundo, CA 90245BERKADIA.COM


![Confidential Offering Memorandum - …images2.loopnet.com/d2/WT3AIYmotF44UG9DAPiAPCQ8B321MG1LF2NyjcAZGC0/...This Confidential Offering Memorandum [“Memorandum”] contains a brief](https://static.documents.pub/doc/80x56/5b0243267f8b9ad85d8f4725/confidential-offering-memorandum-confidential-offering-memorandum-memorandum.jpg)


