44
Office Market Dashboards 2009 Colliers International | Greater Toronto Area Q2 | SECOND QUARTER
| Date post: | 14-Mar-2016 |
| Category: |
Documents |
| Upload: | chris-fyvie |
| View: | 218 times |
| Download: | 1 times |
Office Market Dashboards
2009Colliers International | Greater Toronto Area Q2 | SECOND QUARTER

Table Of Contents
1 GTA Regional
2 GTA Central 3 Downtown 4 Financial Core 5 Downtown East6 Downtown West7 Downtown South8 Downtown North
9 GTA Midtown10 Yonge & St. Clair11 Airport West12 Airport East13 Airport Corporate Centre14 Sheridan
15 GTA North16 North Yonge Corridor17 Dufferin-Finch18 Yorkdale19 Vaughan20 Richmond Hill21 Yonge & Eglinton22 Yonge & Bloor
23 GTA West24 Oakville25 Mississauga City Centre26 Meadowvale27 Hurontario & Highway 40128 Cooksville29 Burlington30 Brampton31 Highway 427 & Bloor-Islington
32 GTA East33 Woodbine-Steeles34 Toronto East35 Pickering-Oshawa36 Markham37 Highway 404 & 40738 Duncan Mill39 Don Mills & Eglington40 Consumers Road41 Scarborough Town Centre
Greater Toronto AreaOffice Market Dashboard

REGIONAL INDICATORS MAP OF REGION
Q1 2009 Q2 2009 Trend
Office Inventory* 180,142,712 180,664,489
Net Absorption (432,214) 657,589
Vacancy Rate 5.5% 5.7%
Average Asking Net Rent $17.66 $17.58
Average Additional Rent $15.86 $15.94
AVAILABLE SPACE OPTIONS
AVAILABLE SUPPLY SPLIT
0 - 4k sf 4k - 10k sf 10k - 20k sf 20 - 50k sf 50k - 100k sf 100k sf +
# of units** 1626 664 406 333 53 24
** Counting smallest divisible units in existing buildings and buildings which are under construction.
RECENT TRANSACTIONS Q2 2009
Suite Sq. Ft. Landlord
505 16,985 Cadillac Fairview
600 16,630 The Last Minute Club
301 15,00090 Eglinton Ave
Holdings
GROSS RENT & AVAILABILITY BY BUILDING CLASS Date Address Price Vendor Purchaser Size $/PSF
6/18/2009 415 Yonge Street $32,100,000 Anthem
Properties
Crown Realty
Partners 191,880 $172.00
100 Wellington Street W
150 Ferrand Drive
*Office Inventory: For the purpose of this report, buildings with less than 10,000 sf of office space and buildings owned and occupied by the
government have not been included in the office inventory. There are 2045 office buildings surveyed in the GTA office region.
Q2-09
Number of units on the regional market by size brackets
Tenant
TOP Office Sale Transactions by Price
Office Region Dashboard: Greater Toronto Area
90 Eglinton Avenue E ThinData Inc.
TOP Office Lease Transactions by Size
Address
N/A
N/A
Available Direct80%
Available Sublease20%
Total Available Office Space: 15285487 sf
80,000,000 $70
Avail. Office Space Not Avail. Office Space Gross Rent
0%
5%
10%
15%
20%
25%
30%
35%
40%
45%
50%
0
2,000,000
4,000,000
6,000,000
8,000,000
10,000,000
12,000,000
14,000,000
16,000,000
18,000,000
Q1 2008 Q2 2008 Q3 2008 Q4 2008 Q1 2009 Q2 2009
Sq
ua
re F
ee
t
Sublease Direct Sublease as % of Total Available
6/18/2009 415 Yonge Street $32,100,000 Properties Partners
191,880 $172.00
5/27/20096700 Century
Avenue$7,000,000
A Private
Individual Sanyo Co. 56,607 $124.00
6/15/200921 Randolph
Avenue$5,765,000
Don Valley
Storage Inc Canadian Red Cross 59,000 $98.00
OCCUPIED SPACE BY MAJOR BUSINESS CATEGORIES
18 MONTH TREND
TOP PROJECTS UNDER CONSTRUCTION BY SIZE
Address Sq. Ft. Est. Com.
155 Wellington
Street West1,223,891 Q2 2009
333 Bay Street 1,127,986 Q3 2009
25 York Street 780,000 Q3 2009
REGIONAL CHARACTERISTICS
Source: Colliers International, Q2 2009
RBC Dexia, Fairmont
Menkes
Brookfield Properties
Developer Anchor Tenant
Telus, Kinross,
Cadillac Fairview
KPMG, Goodmans,
Available Direct80%
Available Sublease20%
Total Available Office Space: 15285487 sf
$63.22
$34.55
$29.27
$23.43
-
10,000,000
20,000,000
30,000,000
40,000,000
50,000,000
60,000,000
70,000,000
80,000,000
$-
$10
$20
$30
$40
$50
$60
$70
Class AAA Class A Class B Class C
Sq. Ft.
Gross Rent $/Sq. Ft.
Avail. Office Space Not Avail. Office Space Gross Rent
Note: Not available office space (blue) and available office space (yellow) add up to the total inventory of office space in the respective building class.
$17.58
5.7%
0.0%
1.0%
2.0%
3.0%
4.0%
5.0%
6.0%
7.0%
8.0%
9.0%
(5)
(3)
(1)
1
3
5
7
9
11
13
15
17
19
Q1 2008 Q2 2008 Q3 2008 Q4 2008 Q1 2009 Q2 2009
Vacancy Rate
Net Rent $/sf. / Absorption (100,000's)
Absorption Asking Net Rent Vacancy Rate
Manufacturing & Distribution
17%
Data,Publishing, Broadcasting Services 11%
Finance 27%
Professional Services 22%
Public Service & Private Sector
Services20%
Others3%
* The GTA is Canada's largest urban economic region in terms of size in population, economy andoffice space.* Built on strong foundations that include world-renowned educational and health institutions, adiversity of internationally competitive sectors and clusters, and a highly-skilled, well-educated andgrowing population.* GTA includes the City of Toronto plus & surrounding regional municipalities, which are comprised of25 local municipalities of which 11 have populations greater than 100,000 (as of 2008).* Over time Toronto has maintained its position as Canada's financial and industrial center.* Economic strength and dominance of the area is reflected in its concentration of corporateheadquarters.
0%
5%
10%
15%
20%
25%
30%
35%
40%
45%
50%
0
2,000,000
4,000,000
6,000,000
8,000,000
10,000,000
12,000,000
14,000,000
16,000,000
18,000,000
Q1 2008 Q2 2008 Q3 2008 Q4 2008 Q1 2009 Q2 2009
Sq
ua
re F
ee
t
Sublease Direct Sublease as % of Total Available
Information contained herein has been obtained from the owners or other sources deemed reliable. We have no reason to doubt its accuracy but regret we
Available Direct80%
Available Sublease20%
Total Available Office Space: 15285487 sf
$63.22
$34.55
$29.27
$23.43
-
10,000,000
20,000,000
30,000,000
40,000,000
50,000,000
60,000,000
70,000,000
80,000,000
$-
$10
$20
$30
$40
$50
$60
$70
Class AAA Class A Class B Class C
Sq. Ft.
Gross Rent $/Sq. Ft.
Avail. Office Space Not Avail. Office Space Gross Rent
Note: Not available office space (blue) and available office space (yellow) add up to the total inventory of office space in the respective building class.
$17.58
5.7%
0.0%
1.0%
2.0%
3.0%
4.0%
5.0%
6.0%
7.0%
8.0%
9.0%
(5)
(3)
(1)
1
3
5
7
9
11
13
15
17
19
Q1 2008 Q2 2008 Q3 2008 Q4 2008 Q1 2009 Q2 2009
Vacancy Rate
Net Rent $/sf. / Absorption (100,000's)
Absorption Asking Net Rent Vacancy Rate
Manufacturing & Distribution
17%
Data,Publishing, Broadcasting Services 11%
Finance 27%
Professional Services 22%
Public Service & Private Sector
Services20%
Others3%
* The GTA is Canada's largest urban economic region in terms of size in population, economy andoffice space.* Built on strong foundations that include world-renowned educational and health institutions, adiversity of internationally competitive sectors and clusters, and a highly-skilled, well-educated andgrowing population.* GTA includes the City of Toronto plus & surrounding regional municipalities, which are comprised of25 local municipalities of which 11 have populations greater than 100,000 (as of 2008).* Over time Toronto has maintained its position as Canada's financial and industrial center.* Economic strength and dominance of the area is reflected in its concentration of corporateheadquarters.
0%
5%
10%
15%
20%
25%
30%
35%
40%
45%
50%
0
2,000,000
4,000,000
6,000,000
8,000,000
10,000,000
12,000,000
14,000,000
16,000,000
18,000,000
Q1 2008 Q2 2008 Q3 2008 Q4 2008 Q1 2009 Q2 2009
Sq
ua
re F
ee
t
Sublease Direct Sublease as % of Total Available
Information contained herein has been obtained from the owners or other sources deemed reliable. We have no reason to doubt its accuracy but regret we cannot guarantee it. All properties subject to change or withdrawal without notice. All numbers reported use the most accurate information available at the time of publishing, however we acknowledge that there may be marginal changes over time as more accurate information becomes available. Colliers Macaulay Nicolls (Ontario) Inc., Brokerage.

MARKET INDICATORS MAP OF MARKET
Q1 2009 Q2 2009 Trend
Office Inventory* 84,971,884 84,997,879
Net Absorption 196,322 85,909
Vacancy Rate 4.6% 4.7%
Average Asking Net Rent $22.99 $22.49
Average Additional Rent $21.40 $21.17
AVAILABLE SUPPLY SPLIT AVAILABLE SPACE OPTIONS
0 - 4k sf 4k - 10k sf 10k - 20k sf 20 - 50k sf 50k - 100k sf 100k sf +
# of units** 717 317 144 127 0 1
** Counting smallest divisible units in existing buildings and buildings which are under construction.
RECENT TRANSACTIONS Q2 2009
Suite Sq. Ft. Landlord Tenant
505 16,985 Cadillac Fairview
301 15,000 90 Eglinton Ave
Holdings
500 13,091 N/A
GROSS RENT & AVAILABILITY BY BUILDING CLASS
Date Address Price Vendor Purchaser Size $/PSF
6/18/2009415 Yonge
$32,100,000 Anthem
Crown Realty Partners 191,880 $172
Q2-09
Number of units on the market by size brackets
ThinData Inc.
N/A 100 Wellington Street W
90 Eglinton Avenue E
TOP Office Sale Transactions by Price
Office Market Dashboard: GTA Central
85 Richmond Street W N/A
*Office Inventory: For the purpose of this report, buildings with less than 10,000 sf of office space and buildings owned and occupied by the
government have not been included in the office inventory. There are 724 office buildings surveyed in this market.
TOP Office Lease Transactions by Size
Address
35,000,000
40,000,000
$60
$70
Avail. Office Space Not Avail. Office Space Gross Rent
0%
5%
10%
15%
20%
25%
30%
35%
40%
45%
50%
0
1,000,000
2,000,000
3,000,000
4,000,000
5,000,000
6,000,000
7,000,000
8,000,000
Q1 2008 Q2 2008 Q3 2008 Q4 2008 Q1 2009 Q2 2009
Sq
uare
Feet
Direct Sublease Sublease as % of Total Available
6/18/2009415 Yonge
Street$32,100,000
Anthem
Properties Crown Realty Partners 191,880 $172
6/15/200921 Randolph
Avenue$5,765,000
Don Valley
Storage Inc Canadian Red Cross 59,000 $98
5/6/2009860 - 862
Richmond St W$4,356,000
City of
Toronto Allied Properties REIT 27,317 $159
OCCUPIED SPACE BY MAJOR BUSINESS CATEGORIES
18 MONTH TREND
TOP PROJECTS UNDER CONSTRUCTION BY SIZE
Address Sq. Ft. Est. Com.155 Wellington
Street West1,223,891 Q2 2009
333 Bay Street 1,127,986 Q3 2009
25 York Street 780,000 Q3 2009
MARKET CHARACTERISTICS
Source: Colliers International, Q2 2009
RBC Dexia, Fairmont
Menkes
Brookfield Properties
Anchor TenantDeveloper
Telus, Kinross,
Cadillac Fairview
KPMG, Goodmans,
$63.22
$36.54
$28.66
-
5,000,000
10,000,000
15,000,000
20,000,000
25,000,000
30,000,000
35,000,000
40,000,000
$-
$10
$20
$30
$40
$50
$60
$70
Class A Class B Class C
Sq. Ft.
Gross Rent $/Sq. Ft.
Avail. Office Space Not Avail. Office Space Gross Rent
Note: Not available office space (blue) and available office space (yellow) add up to the total inventory of office space in the respective building class.
$22.49
4.7%
-2.0%
0.0%
2.0%
4.0%
6.0%
8.0%
(3)
(1)
1
3
5
7
9
11
13
15
17
19
21
23
25
Q1 2008 Q2 2008 Q3 2008 Q4 2008 Q1 2009 Q2 2009
Vacancy Rate
Net Rent $/sf. / Absorption (100,000's)
Absorption Asking Net Rent Vacancy Rate
Manufacturing & Distribution
7%
Data,Publishing, Broadcasting Services 11%
Finance 33%
Professional Services 25%
Public Service & Private Sector
Services21%
Others3%
* Largest office market in the GTA with the lowest vacancy rate* GTA top annual rental rates of $70.39 are asked for at the Royal Bank Plaza* Market is in high demand by users looking for a prestige urban location and modern, state-of-the-art architecture* Limited parking, but great access to public transit and the PATH system, Toronto's underground walkway* Proximity to multiple amenities and services add convenience for employees and customers* Vacancy rates are fairly stable at a low value as this market is in high demand by companies looking to locate in this well located office market* Abundance of amenities are in walking distance in all three submarkets
0%
5%
10%
15%
20%
25%
30%
35%
40%
45%
50%
0
1,000,000
2,000,000
3,000,000
4,000,000
5,000,000
6,000,000
7,000,000
8,000,000
Q1 2008 Q2 2008 Q3 2008 Q4 2008 Q1 2009 Q2 2009
Sq
uare
Feet
Direct Sublease Sublease as % of Total Available
Information contained herein has been obtained from the owners or other sources deemed reliable. We have no reason to doubt its accuracy but regret we cannot guarantee it. All properties subject to change or withdrawal without notice. All numbers reported use the most accurate information available at the time of publishing, however we acknowledge that there may be marginal changes over time as more accurate information becomes available. Colliers Macaulay Nicolls (Ontario) Inc., Brokerage.

MARKET INDICATORS MAP OF MARKET
Q1 2009 Q2 2009 Trend
Office Inventory* 67,957,121 67,983,116
Net Absorption 86,529 (49,185)
Vacancy Rate 4.2% 4.4%
Average Asking Net Rent $24.83 $24.26
Average Additional Rent $22.30 $22.02
AVAILABLE SUPPLY SPLIT
AVAILABLE SPACE OPTIONS
0 - 4k sf 4k - 10k sf 10k - 20k sf 20 - 50k sf 50k - 100k sf 100k sf +
# of units** 506 255 101 119 0 1
** Counting smallest divisible units in existing buildings and buildings which are under construction.
RECENT TRANSACTIONS Q2 2009
Suite Sq. Ft. Landlord
505 16,985 Cadillac Fairview
GROSS RENT & AVAILABILITY BY BUILDING CLASS 500 13,091 N/A
1000 11,908 N/A
Q2-09
Number of units on the market by size brackets
Tenant
Office Market Dashboard: Downtown
401 Bay Street N/A
*Office Inventory: For the purpose of this report, buildings with less than 10,000 sf of office space and buildings owned and occupied by the
government have not been included in the office inventory. There are 559 office buildings surveyed in this market.
TOP Office Lease Transactions by Size
Address
N/A
N/A100 Wellington Street W
85 Richmond Street W
30,000,000 $70
Avail. Office Space Not Avail. Office Space Gross Rent
0%
5%
10%
15%
20%
25%
30%
35%
40%
45%
50%
0
1,000,000
2,000,000
3,000,000
4,000,000
5,000,000
6,000,000
7,000,000
8,000,000
Q1 2008 Q2 2008 Q3 2008 Q4 2008 Q1 2009 Q2 2009
Sq
uare
Feet
Sublease Direct Sublease as % of Total Available
1000 11,908 N/A
Date Address Price Vendor Purchaser Size $/PSF
6/18/2009 415 Yonge Street $32,100,000 Anthem
Properties
Crown Realty
Partners 191,880 $172
6/15/200921 Randolph
Avenue$5,765,000
Don Valley
Storage Inc
Canadian Red
Cross 59,000 $98
5/6/2009860 - 862
Richmond St W$4,356,000 City of Toronto
Allied Properties
REIT 27,317 $159
OCCUPIED SPACE BY MAJOR BUSINESS CATEGORIES
18 MONTH TREND
TOP PROJECTS UNDER CONSTRUCTION BY SIZE
Address Sq. Ft. Est. Com.155 Wellington
Street West1,223,891 Q2 2009
333 Bay Street 1,127,986 Q3 2009
25 York Street 780,000 Q3 2009
MARKET CHARACTERISTICS
Source: Colliers International, Q2 2009
KPMG, Goodmans,
RBC Dexia, Fairmont
Menkes
Brookfield Properties
Developer Anchor Tenant
Telus, Kinross,
401 Bay Street N/A
TOP Office Sale Transactions by Price
Cadillac Fairview
$63.22 $45.54
$37.78
$28.20
-
5,000,000
10,000,000
15,000,000
20,000,000
25,000,000
30,000,000
$-
$10
$20
$30
$40
$50
$60
$70
Class AAA Class A Class B Class C
Sq. Ft.
Gross Rent $/Sq. Ft.
Avail. Office Space Not Avail. Office Space Gross Rent
Note: Not available office space (blue) and available office space (yellow) add up to the total inventory of office space in the respective building class.
$24.26
4.4%
0.0%
1.0%
2.0%
3.0%
4.0%
5.0%
6.0%
7.0%
8.0%
9.0%
10.0%
(3)
1
5
9
13
17
21
25
29
Q1 2008 Q2 2008 Q3 2008 Q4 2008 Q1 2009 Q2 2009
Vacancy Rate
Net Rent $/sf. / Absorption (100,000's)
Absorption Asking Net Rent Vacancy Rate Manufacturing & Distribution
6%
Data,Publishing, Broadcasting Services 12%
Finance 34% Professional
Services 24%
Public Service & Private Sector
Services21%
Others3%
* Largest office market in the GTA with the lowest vacancy rate* GTA top annual rental rates are achieved in buildings located in this market* Market is in high demand by users looking for a prestige urban location and modern, state-of-the-artarchitecture* Limited parking, but great access to public transit and the PATH system, Toronto's undergroundwalkway* Proximity to multiple amenities and services add convenience for employees and customers
0%
5%
10%
15%
20%
25%
30%
35%
40%
45%
50%
0
1,000,000
2,000,000
3,000,000
4,000,000
5,000,000
6,000,000
7,000,000
8,000,000
Q1 2008 Q2 2008 Q3 2008 Q4 2008 Q1 2009 Q2 2009
Sq
uare
Feet
Sublease Direct Sublease as % of Total Available
Information contained herein has been obtained from the owners or other sources deemed reliable. We have no reason to doubt its accuracy but regret we
$63.22 $45.54
$37.78
$28.20
-
5,000,000
10,000,000
15,000,000
20,000,000
25,000,000
30,000,000
$-
$10
$20
$30
$40
$50
$60
$70
Class AAA Class A Class B Class C
Sq. Ft.
Gross Rent $/Sq. Ft.
Avail. Office Space Not Avail. Office Space Gross Rent
Note: Not available office space (blue) and available office space (yellow) add up to the total inventory of office space in the respective building class.
$24.26
4.4%
0.0%
1.0%
2.0%
3.0%
4.0%
5.0%
6.0%
7.0%
8.0%
9.0%
10.0%
(3)
1
5
9
13
17
21
25
29
Q1 2008 Q2 2008 Q3 2008 Q4 2008 Q1 2009 Q2 2009
Vacancy Rate
Net Rent $/sf. / Absorption (100,000's)
Absorption Asking Net Rent Vacancy Rate Manufacturing & Distribution
6%
Data,Publishing, Broadcasting Services 12%
Finance 34% Professional
Services 24%
Public Service & Private Sector
Services21%
Others3%
* Largest office market in the GTA with the lowest vacancy rate* GTA top annual rental rates are achieved in buildings located in this market* Market is in high demand by users looking for a prestige urban location and modern, state-of-the-artarchitecture* Limited parking, but great access to public transit and the PATH system, Toronto's undergroundwalkway* Proximity to multiple amenities and services add convenience for employees and customers
0%
5%
10%
15%
20%
25%
30%
35%
40%
45%
50%
0
1,000,000
2,000,000
3,000,000
4,000,000
5,000,000
6,000,000
7,000,000
8,000,000
Q1 2008 Q2 2008 Q3 2008 Q4 2008 Q1 2009 Q2 2009
Sq
uare
Feet
Sublease Direct Sublease as % of Total Available
Information contained herein has been obtained from the owners or other sources deemed reliable. We have no reason to doubt its accuracy but regret we cannot guarantee it. All properties subject to change or withdrawal without notice. All numbers reported use the most accurate information available at the time of publishing, however we acknowledge that there may be marginal changes over time as more accurate information becomes available. Colliers Macaulay Nicolls (Ontario) Inc., Brokerage.

SUBMARKET INDICATORS MAP OF SUBMARKET
Q1 2009 Q2 2009 Trend AVAILABLE SPACE OPTIONS
Office Inventory* 30,410,745 30,411,232
Net Absorption (11,549) (55,215)
Vacancy Rate 3.4% 3.5%
Average Asking Net Rent $27.82 $27.66 0 - 4k sf
Average Additional Rent $27.29 $27.31 4k - 10k sf
10k - 20k sf
AVAILABLE SUPPLY SPLIT 20 - 50k sf
50k - 100k sf
100k sf +
RECENT TRANSACTIONS Q2 2009
Suite Sq. Ft. Landlord
505 16,985 Cadillac Fairview
Corporation
500 13,091 N/A
1000 11,908 N/A
Date Address Price Vendor Purchaser Size $/PSF
** Counting smallest divisible units in existing
buildings and buildings under construction.
TenantAddress
N/A
N/A
No transactions took place during this period.
0
TOP Office Sale Transactions by Price
N/A
*Office Inventory: For the purpose of this report, buildings with less than 10,000 sf of office space and buildings owned and occupied by the
government have not been included in the office inventory. There are 105 office buildings surveyed in this submarket. 70
128
Number of units
on the
submarket by
size brackets
100 Wellington Street W
85 Richmond Street W
Office Submarket Dashboard: Financial Core
401 Bay Street
# of units**
TOP Office Lease Transactions by Size
85
Q2-09
0
166
0%
5%
10%
15%
20%
25%
30%
35%
40%
45%
50%
0
500,000
1,000,000
1,500,000
2,000,000
2,500,000
3,000,000
3,500,000
4,000,000
Q1 2008 Q2 2008 Q3 2008 Q4 2008 Q1 2009 Q2 2009
Sq
uare
Feet
Direct Sublease Sublease as % of Total Available
GROSS RENT & AVAILABILITY BY BUILDING CLASS OCCUPIED SPACE BY MAJOR BUSINESS CATEGORIES
18 MONTH TREND TOP PROJECTS UNDER CONSTRUCTION BY SIZE
Address Sq. Ft. Est. Com.
155 Wellington
Street West1,223,891 Q2 2009
333 Bay Street 1,127,986 Q3 2009
SUBMARKET CHARACTERISTICS
Source: Colliers International, Q2 2009
Developer Anchor Tenant
No transactions took place during this period.
Cadillac Fairview
KPMG, Goodmans,
RBC Dexia, Fairmont
Brookfield Properties
$63.22
$55.51
$44.94
$35.92
-
2,000,000
4,000,000
6,000,000
8,000,000
10,000,000
12,000,000
14,000,000
$-
$10
$20
$30
$40
$50
$60
$70
Class AAA Class A Class B Class C
Sq. Ft.
Gross Rent $/Sq. Ft.
Avail. Office Space Not Avail. Office Space Gross Rent
Note: Not available office space (blue) and available office space (yellow) add up to the total inventory of office space in the respective building class.
$27.66
3.5%
0.0%
0.5%
1.0%
1.5%
2.0%
2.5%
3.0%
3.5%
4.0%
(20)
(16)
(12)
(8)
(4)
-
4
8
12
16
20
24
28
32
Q1 2008 Q2 2008 Q3 2008 Q4 2008 Q1 2009 Q2 2009
Vacancy Rate
Net Rent $/sf. / Absorption (10,000's)
Absorption Asking Net Rent Vacancy Rate
Manufacturing & Distribution
5%
Data,Publishing, Broadcasting Services
5%
Finance 47%
Professional Services 25%
Public Service & Private Sector
Services16%
Others2%
* Most dense office submarket in the GTA with one of the lowest vacancy rates* GTA top annual rental rates are achieved in buildings located in this market* Majority of tenants occupy 4,000 sf or less* Prestige urban location and modern, state-of-the-art architecture* Limited parking, but great access to public transit and the PATH system, Toronto's underground walkway* Proximity to multiple amenities and services add convenience for employees and customers
0%
5%
10%
15%
20%
25%
30%
35%
40%
45%
50%
0
500,000
1,000,000
1,500,000
2,000,000
2,500,000
3,000,000
3,500,000
4,000,000
Q1 2008 Q2 2008 Q3 2008 Q4 2008 Q1 2009 Q2 2009
Sq
uare
Feet
Direct Sublease Sublease as % of Total Available
Information contained herein has been obtained from the owners or other sources deemed reliable. We have no reason to doubt its accuracy but regret we
$63.22
$55.51
$44.94
$35.92
-
2,000,000
4,000,000
6,000,000
8,000,000
10,000,000
12,000,000
14,000,000
$-
$10
$20
$30
$40
$50
$60
$70
Class AAA Class A Class B Class C
Sq. Ft.
Gross Rent $/Sq. Ft.
Avail. Office Space Not Avail. Office Space Gross Rent
Note: Not available office space (blue) and available office space (yellow) add up to the total inventory of office space in the respective building class.
$27.66
3.5%
0.0%
0.5%
1.0%
1.5%
2.0%
2.5%
3.0%
3.5%
4.0%
(20)
(16)
(12)
(8)
(4)
-
4
8
12
16
20
24
28
32
Q1 2008 Q2 2008 Q3 2008 Q4 2008 Q1 2009 Q2 2009
Vacancy Rate
Net Rent $/sf. / Absorption (10,000's)
Absorption Asking Net Rent Vacancy Rate
Manufacturing & Distribution
5%
Data,Publishing, Broadcasting Services
5%
Finance 47%
Professional Services 25%
Public Service & Private Sector
Services16%
Others2%
* Most dense office submarket in the GTA with one of the lowest vacancy rates* GTA top annual rental rates are achieved in buildings located in this market* Majority of tenants occupy 4,000 sf or less* Prestige urban location and modern, state-of-the-art architecture* Limited parking, but great access to public transit and the PATH system, Toronto's underground walkway* Proximity to multiple amenities and services add convenience for employees and customers
0%
5%
10%
15%
20%
25%
30%
35%
40%
45%
50%
0
500,000
1,000,000
1,500,000
2,000,000
2,500,000
3,000,000
3,500,000
4,000,000
Q1 2008 Q2 2008 Q3 2008 Q4 2008 Q1 2009 Q2 2009
Sq
uare
Feet
Direct Sublease Sublease as % of Total Available
Information contained herein has been obtained from the owners or other sources deemed reliable. We have no reason to doubt its accuracy but regret we cannot guarantee it. All properties subject to change or withdrawal without notice. All numbers reported use the most accurate information available at the time of publishing, however we acknowledge that there may be marginal changes over time as more accurate information becomes available. Colliers Macaulay Nicolls (Ontario) Inc., Brokerage.

SUBMARKET INDICATORS MAP OF SUBMARKET
Q1 2009 Q2 2009 Trend
Office Inventory* 4,512,403 4,527,403
Net Absorption 31,082 23,683
Vacancy Rate 3.7% 3.8%
Average Asking Net Rent $15.83 $17.27
Average Additional Rent $4.71 $7.90
AVAILABLE SUPPLY SPLIT
AVAILABLE SPACE OPTIONS
0 - 4k sf 4k - 10k sf 10k - 20k sf 20 - 50k sf 50k - 100k sf 100k sf +
# of units** 69 26 4 14 0 1
** Counting smallest divisible units in existing buildings and buildings which are under construction.
RECENT TRANSACTIONS Q2 2009
Suite Sq. Ft. Landlord
GROSS RENT & AVAILABILITY BY BUILDING CLASS 200 9,174 Alliance Entertainment
300 3,245 Tippin Capital
200 2,555 Tippin Capital
145 King Street E
N/A
Office Submarket Dashboard: Downtown East
105-109 King Street E
Q2-09
Address
N/A
N/A
*Office Inventory: For the purpose of this report, buildings with less than 10,000 sf of office space and buildings owned and occupied by the
government have not been included in the office inventory. There are 107 office buildings surveyed in this submarket.
105-109 King Street E
Number of units on the submarket by size brackets
TOP Office Sale Transactions by Price
TOP Office Lease Transactions by Size
Tenant
$32.50
$32.62
2,500,000
3,000,000
$30
$35
Avail. Office Space Not Avail. Office Space Gross Rent
0%
5%
10%
15%
20%
25%
30%
35%
40%
45%
50%
0
50,000
100,000
150,000
200,000
250,000
300,000
350,000
Q1 2008 Q2 2008 Q3 2008 Q4 2008 Q1 2009 Q2 2009
Sq
uare
Feet
Direct Sublease Sublease as % of Total Available
Date Address Price Vendor Purchaser Size $/PSF
4/14/200971 Front Street
East$4,940,000
Front
Esplanade
Holdings
Pajelle Investments
Ltd. N/A N/A
OCCUPIED SPACE BY MAJOR BUSINESS CATEGORIES
18 MONTH TREND
TOP PROJECTS UNDER CONSTRUCTION BY SIZE
Address Sq. Ft. Est. Com.
125 Queen's
Quay East550,000 Q1 2010
SUBMARKET CHARACTERISTICS
Source: Colliers International, Q2 2009
TEDCO, Corus
Developer Anchor Tenant
Aecon
TOP Office Sale Transactions by Price$32.50
$32.62
$1.84
-
500,000
1,000,000
1,500,000
2,000,000
2,500,000
3,000,000
$-
$5
$10
$15
$20
$25
$30
$35
Class A Class B Class C
Sq. Ft.
Gross Rent $/Sq. Ft.
Avail. Office Space Not Avail. Office Space Gross Rent
Note: Not available office space (blue) and available office space (yellow) add up to the total inventory of office space in the respective building class.
$17.27
3.8%
0.0%
1.0%
2.0%
3.0%
4.0%
5.0%
6.0%
7.0%
(2)
-
2
4
6
8
10
12
14
16
18
20
Q1 2008 Q2 2008 Q3 2008 Q4 2008 Q1 2009 Q2 2009
Vacancy Rate
Net Rent $/sf. / Absorption (10,000's)
Absorption Asking Net Rent Vacancy Rate
Manufacturing & Distribution
9%
Data,Publishing, Broadcasting Services 38%
Finance 7%
Professional Services 22%
Public Service & Private Sector
Services14%
Others10%
* Includes original 10 blocks of Toronto and historic buildings allow for remarkable office space features (Brick&Beam)* Northern part of submarket well connected to downtown & rest of the GTA through public transportation and Gardiner Expressway & Don Valley Parkway* With new residential high-rise developments (e.g. Corktown, Distillery District), the labour pool will increase, expand and diversify* George Brown College's third main Toronto campus will support growth of up to 4,000 new students per year and energize the new East Bay lakefront development by Fall 2011
0%
5%
10%
15%
20%
25%
30%
35%
40%
45%
50%
0
50,000
100,000
150,000
200,000
250,000
300,000
350,000
Q1 2008 Q2 2008 Q3 2008 Q4 2008 Q1 2009 Q2 2009
Sq
uare
Feet
Direct Sublease Sublease as % of Total Available
Information contained herein has been obtained from the owners or other sources deemed reliable. We have no reason to doubt its accuracy but regret we cannot guarantee it. All properties subject to change or withdrawal without notice. All numbers reported use the most accurate information available at the time of publishing, however we acknowledge that there may be marginal changes over time as more accurate information becomes available. Colliers Macaulay Nicolls (Ontario) Inc., Brokerage.
$32.50
$32.62
$1.84
-
500,000
1,000,000
1,500,000
2,000,000
2,500,000
3,000,000
$-
$5
$10
$15
$20
$25
$30
$35
Class A Class B Class C
Sq. Ft.
Gross Rent $/Sq. Ft.
Avail. Office Space Not Avail. Office Space Gross Rent
Note: Not available office space (blue) and available office space (yellow) add up to the total inventory of office space in the respective building class.
$17.27
3.8%
0.0%
1.0%
2.0%
3.0%
4.0%
5.0%
6.0%
7.0%
(2)
-
2
4
6
8
10
12
14
16
18
20
Q1 2008 Q2 2008 Q3 2008 Q4 2008 Q1 2009 Q2 2009
Vacancy Rate
Net Rent $/sf. / Absorption (10,000's)
Absorption Asking Net Rent Vacancy Rate
Manufacturing & Distribution
9%
Data,Publishing, Broadcasting Services 38%
Finance 7%
Professional Services 22%
Public Service & Private Sector
Services14%
Others10%
* Includes original 10 blocks of Toronto and historic buildings allow for remarkable office space features (Brick&Beam)* Northern part of submarket well connected to downtown & rest of the GTA through public transportation and Gardiner Expressway & Don Valley Parkway* With new residential high-rise developments (e.g. Corktown, Distillery District), the labour pool will increase, expand and diversify* George Brown College's third main Toronto campus will support growth of up to 4,000 new students per year and energize the new East Bay lakefront development by Fall 2011
0%
5%
10%
15%
20%
25%
30%
35%
40%
45%
50%
0
50,000
100,000
150,000
200,000
250,000
300,000
350,000
Q1 2008 Q2 2008 Q3 2008 Q4 2008 Q1 2009 Q2 2009
Sq
uare
Feet
Direct Sublease Sublease as % of Total Available
Information contained herein has been obtained from the owners or other sources deemed reliable. We have no reason to doubt its accuracy but regret we cannot guarantee it. All properties subject to change or withdrawal without notice. All numbers reported use the most accurate information available at the time of publishing, however we acknowledge that there may be marginal changes over time as more accurate information becomes available. Colliers Macaulay Nicolls (Ontario) Inc., Brokerage.
SUBMARKET INDICATORS MAP OF SUBMARKET
Q1 2009 Q2 2009 Trend
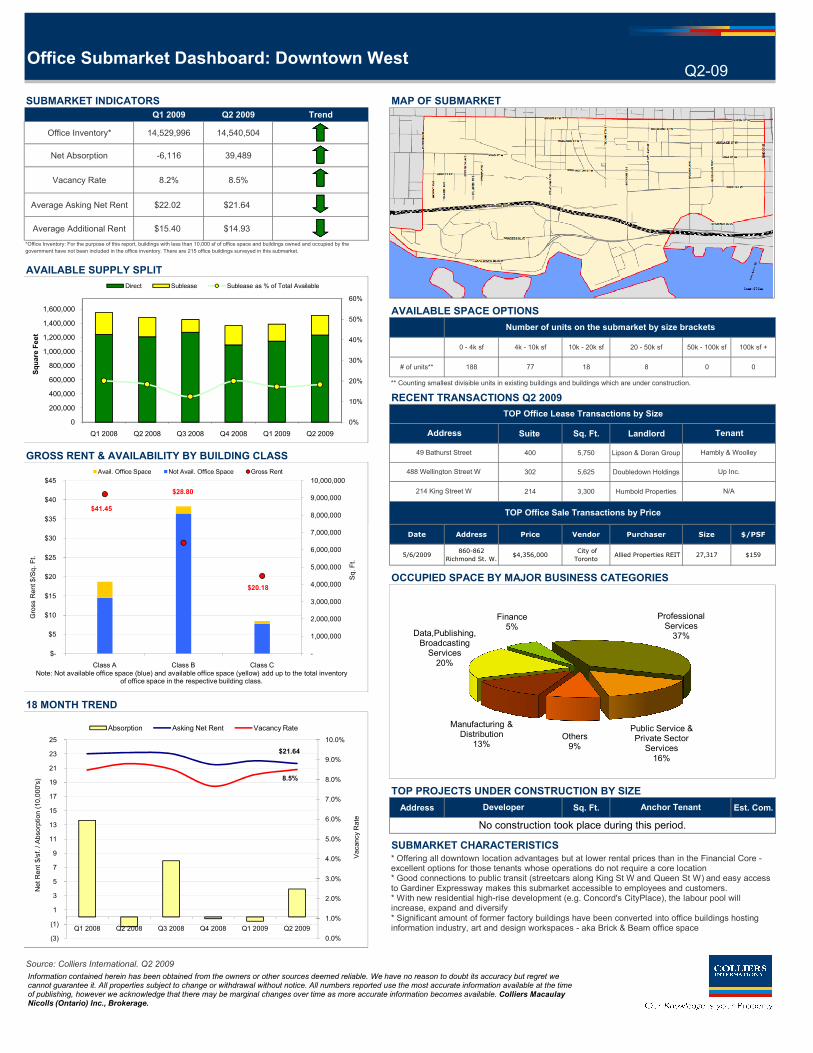
Office Inventory* 14,529,996 14,540,504
Net Absorption -6,116 39,489
Vacancy Rate 8.2% 8.5%
Average Asking Net Rent $22.02 $21.64
Average Additional Rent $15.40 $14.93
AVAILABLE SUPPLY SPLIT
AVAILABLE SPACE OPTIONS
0 - 4k sf 4k - 10k sf 10k - 20k sf 20 - 50k sf 50k - 100k sf 100k sf +
# of units** 188 77 18 8 0 0
** Counting smallest divisible units in existing buildings and buildings which are under construction.
RECENT TRANSACTIONS Q2 2009
Suite Sq. Ft. Landlord
GROSS RENT & AVAILABILITY BY BUILDING CLASS 400 5,750 Lipson & Doran Group
302 5,625 Doubledown Holdings
214 3,300 Humbold Properties
Number of units on the submarket by size brackets
Tenant
TOP Office Lease Transactions by Size
Address
Up Inc.
Hambly & Woolley49 Bathurst Street
Office Submarket Dashboard: Downtown West
214 King Street W N/A
*Office Inventory: For the purpose of this report, buildings with less than 10,000 sf of office space and buildings owned and occupied by the
government have not been included in the office inventory. There are 215 office buildings surveyed in this submarket.
Q2-09
488 Wellington Street W
$41.45
$28.80
8,000,000
9,000,000
10,000,000
$35
$40
$45
Avail. Office Space Not Avail. Office Space Gross Rent
0%
10%
20%
30%
40%
50%
60%
0
200,000
400,000
600,000
800,000
1,000,000
1,200,000
1,400,000
1,600,000
Q1 2008 Q2 2008 Q3 2008 Q4 2008 Q1 2009 Q2 2009
Sq
uare
Feet
Direct Sublease Sublease as % of Total Available
Date Address Price Vendor Purchaser Size $/PSF
5/6/2009860-862
Richmond St. W.$4,356,000
City of
Toronto Allied Properties REIT 27,317 $159
OCCUPIED SPACE BY MAJOR BUSINESS CATEGORIES
18 MONTH TREND
TOP PROJECTS UNDER CONSTRUCTION BY SIZE
Address Sq. Ft. Est. Com.
SUBMARKET CHARACTERISTICS
Source: Colliers International, Q2 2009
No construction took place during this period.
Developer Anchor Tenant
TOP Office Sale Transactions by Price$41.45
$28.80
$20.18
-
1,000,000
2,000,000
3,000,000
4,000,000
5,000,000
6,000,000
7,000,000
8,000,000
9,000,000
10,000,000
$-
$5
$10
$15
$20
$25
$30
$35
$40
$45
Class A Class B Class C
Sq. Ft.
Gross Rent $/Sq. Ft.
Avail. Office Space Not Avail. Office Space Gross Rent
Note: Not available office space (blue) and available office space (yellow) add up to the total inventory of office space in the respective building class.
$21.64
8.5%
0.0%
1.0%
2.0%
3.0%
4.0%
5.0%
6.0%
7.0%
8.0%
9.0%
10.0%
(3)
(1)
1
3
5
7
9
11
13
15
17
19
21
23
25
Q1 2008 Q2 2008 Q3 2008 Q4 2008 Q1 2009 Q2 2009
Vacancy Rate
Net Rent $/sf. / Absorption (10,000's)
Absorption Asking Net Rent Vacancy Rate Manufacturing & Distribution
13%
Data,Publishing, Broadcasting Services 20%
Finance 5%
Professional Services 37%
Public Service & Private Sector
Services16%
Others9%
* Offering all downtown location advantages but at lower rental prices than in the Financial Core -excellent options for those tenants whose operations do not require a core location* Good connections to public transit (streetcars along King St W and Queen St W) and easy access to Gardiner Expressway makes this submarket accessible to employees and customers.* With new residential high-rise development (e.g. Concord's CityPlace), the labour pool will increase, expand and diversify* Significant amount of former factory buildings have been converted into office buildings hosting information industry, art and design workspaces - aka Brick & Beam office space
0%
10%
20%
30%
40%
50%
60%
0
200,000
400,000
600,000
800,000
1,000,000
1,200,000
1,400,000
1,600,000
Q1 2008 Q2 2008 Q3 2008 Q4 2008 Q1 2009 Q2 2009
Sq
uare
Feet
Direct Sublease Sublease as % of Total Available
Information contained herein has been obtained from the owners or other sources deemed reliable. We have no reason to doubt its accuracy but regret we cannot guarantee it. All properties subject to change or withdrawal without notice. All numbers reported use the most accurate information available at the time of publishing, however we acknowledge that there may be marginal changes over time as more accurate information becomes available. Colliers Macaulay Nicolls (Ontario) Inc., Brokerage.
$41.45
$28.80
$20.18
-
1,000,000
2,000,000
3,000,000
4,000,000
5,000,000
6,000,000
7,000,000
8,000,000
9,000,000
10,000,000
$-
$5
$10
$15
$20
$25
$30
$35
$40
$45
Class A Class B Class C
Sq. Ft.
Gross Rent $/Sq. Ft.
Avail. Office Space Not Avail. Office Space Gross Rent
Note: Not available office space (blue) and available office space (yellow) add up to the total inventory of office space in the respective building class.
$21.64
8.5%
0.0%
1.0%
2.0%
3.0%
4.0%
5.0%
6.0%
7.0%
8.0%
9.0%
10.0%
(3)
(1)
1
3
5
7
9
11
13
15
17
19
21
23
25
Q1 2008 Q2 2008 Q3 2008 Q4 2008 Q1 2009 Q2 2009
Vacancy Rate
Net Rent $/sf. / Absorption (10,000's)
Absorption Asking Net Rent Vacancy Rate Manufacturing & Distribution
13%
Data,Publishing, Broadcasting Services 20%
Finance 5%
Professional Services 37%
Public Service & Private Sector
Services16%
Others9%
* Offering all downtown location advantages but at lower rental prices than in the Financial Core -excellent options for those tenants whose operations do not require a core location* Good connections to public transit (streetcars along King St W and Queen St W) and easy access to Gardiner Expressway makes this submarket accessible to employees and customers.* With new residential high-rise development (e.g. Concord's CityPlace), the labour pool will increase, expand and diversify* Significant amount of former factory buildings have been converted into office buildings hosting information industry, art and design workspaces - aka Brick & Beam office space
0%
10%
20%
30%
40%
50%
60%
0
200,000
400,000
600,000
800,000
1,000,000
1,200,000
1,400,000
1,600,000
Q1 2008 Q2 2008 Q3 2008 Q4 2008 Q1 2009 Q2 2009
Sq
uare
Feet
Direct Sublease Sublease as % of Total Available
Information contained herein has been obtained from the owners or other sources deemed reliable. We have no reason to doubt its accuracy but regret we cannot guarantee it. All properties subject to change or withdrawal without notice. All numbers reported use the most accurate information available at the time of publishing, however we acknowledge that there may be marginal changes over time as more accurate information becomes available. Colliers Macaulay Nicolls (Ontario) Inc., Brokerage.

SUBMARKET INDICATORS MAP OF SUBMARKET
Q1 2009 Q2 2009 Trend
Office Inventory* 2,453,525 2,453,525
Net Absorption (2,065) (11,467)
Vacancy Rate 2.9% 3.2%
Average Asking Net Rent $22.06 $22.28
Average Additional Rent $17.94 $17.99
AVAILABLE SUPPLY SPLIT
AVAILABLE SPACE OPTIONS
0 - 4k sf 4k - 10k sf 10k - 20k sf 20 - 50k sf 50k - 100k sf 100k sf +
# of units** 12 9 5 27 0 0
** Counting smallest divisible units in existing buildings and buildings which are under construction.
RECENT TRANSACTIONS Q2 2009
Suite Sq. Ft. Landlord
GROSS RENT & AVAILABILITY BY BUILDING CLASS Date Address Price Vendor Purchaser Size $/PSF
Address
No transactions were recorded during this period.
Number of units on the submarket by size brackets
Office Submarket Dashboard: Downtown South
*Office Inventory: For the purpose of this report, buildings with less than 10,000 sf of office space and buildings owned and occupied by the
government have not been included in the office inventory. There are 15 office buildings surveyed in this submarket.
TOP Office Lease Transactions by Size
Tenant
TOP Office Sale Transactions by Price
Q2-09
0%
10%
20%
30%
40%
50%
60%
0
20,000
40,000
60,000
80,000
100,000
120,000
140,000
160,000
180,000
200,000
Q1 2008 Q2 2008 Q3 2008 Q4 2008 Q1 2009 Q2 2009
Sq
ua
re F
ee
t
Direct Sublease Sublease as % of Total Available
GROSS RENT & AVAILABILITY BY BUILDING CLASS Date Address Price Vendor Purchaser Size $/PSF
OCCUPIED SPACE BY MAJOR BUSINESS CATEGORIES
18 MONTH TREND
TOP PROJECTS UNDER CONSTRUCTION BY SIZE
Address Sq. Ft. Est. Com.
25 York Street 780,000 Q3 2009
18 York Street 650,000 Q1 2011
15 York Street 207,000 Q1 2010
SUBMARKET CHARACTERISTICS
Source: Colliers International, Q2 2009
N/A TBD
Menkes
PricewaterhouseCoopers
Cadillac Fairview
Great West Life
No transactions were recorded during this period.
Developer
Telus, Kinross,
Anchor Tenant
$49.38
$31.88
$-
-
200,000
400,000
600,000
800,000
1,000,000
1,200,000
$-
$10
$20
$30
$40
$50
$60
Class A Class B Class C
Sq. Ft.
Gross Rent $/Sq. Ft.
Avail. Office Space Not Avail. Office Space Gross Rent
Note: Not available office space (blue) and available office space (yellow) add up to the total inventory of office space in the respective building class.
$22.28
3.2%
0.0%
0.5%
1.0%
1.5%
2.0%
2.5%
3.0%
3.5%
4.0%
4.5%
5.0%
(3)
(1)
1
3
5
7
9
11
13
15
17
19
21
23
25
Q1 2008 Q2 2008 Q3 2008 Q4 2008 Q1 2009 Q2 2009
Vacancy Rate
Net Rent $/sf. / Absorption (10,000's)
Absorption Asking Net Rent Vacancy Rate
Manufacturing & Distribution
19%
Data,Publishing, Broadcasting Services 32% Finance
13%
Professional Services 23%Public Service &
Private Sector Services10%
Others3%
* Offering many downtown location advantages but at lower rental prices than in the Financial Core along the city's waters' edge* Good connections to public transit and easy access to Gardiner Expressway & DVP makes this submarket accessible to employees and customers.* Submarket is part of the Waterfront Revitalization project will continue to change the area into a more urban community in the years to come* With new residential high-rise development (e.g. Pier 27/Quay West), the labour pool will increase, expand and diversify
0%
10%
20%
30%
40%
50%
60%
0
20,000
40,000
60,000
80,000
100,000
120,000
140,000
160,000
180,000
200,000
Q1 2008 Q2 2008 Q3 2008 Q4 2008 Q1 2009 Q2 2009
Sq
ua
re F
ee
t
Direct Sublease Sublease as % of Total Available
Information contained herein has been obtained from the owners or other sources deemed reliable. We have no reason to doubt its accuracy but regret we cannot guarantee it. All properties subject to change or withdrawal without notice. All numbers reported use the most accurate information available at the time of publishing, however we acknowledge that there may be marginal changes over time as more accurate information becomes available. Colliers Macaulay
$49.38
$31.88
$-
-
200,000
400,000
600,000
800,000
1,000,000
1,200,000
$-
$10
$20
$30
$40
$50
$60
Class A Class B Class C
Sq. Ft.
Gross Rent $/Sq. Ft.
Avail. Office Space Not Avail. Office Space Gross Rent
Note: Not available office space (blue) and available office space (yellow) add up to the total inventory of office space in the respective building class.
$22.28
3.2%
0.0%
0.5%
1.0%
1.5%
2.0%
2.5%
3.0%
3.5%
4.0%
4.5%
5.0%
(3)
(1)
1
3
5
7
9
11
13
15
17
19
21
23
25
Q1 2008 Q2 2008 Q3 2008 Q4 2008 Q1 2009 Q2 2009
Vacancy Rate
Net Rent $/sf. / Absorption (10,000's)
Absorption Asking Net Rent Vacancy Rate
Manufacturing & Distribution
19%
Data,Publishing, Broadcasting Services 32% Finance
13%
Professional Services 23%Public Service &
Private Sector Services10%
Others3%
* Offering many downtown location advantages but at lower rental prices than in the Financial Core along the city's waters' edge* Good connections to public transit and easy access to Gardiner Expressway & DVP makes this submarket accessible to employees and customers.* Submarket is part of the Waterfront Revitalization project will continue to change the area into a more urban community in the years to come* With new residential high-rise development (e.g. Pier 27/Quay West), the labour pool will increase, expand and diversify
0%
10%
20%
30%
40%
50%
60%
0
20,000
40,000
60,000
80,000
100,000
120,000
140,000
160,000
180,000
200,000
Q1 2008 Q2 2008 Q3 2008 Q4 2008 Q1 2009 Q2 2009
Sq
ua
re F
ee
t
Direct Sublease Sublease as % of Total Available
Information contained herein has been obtained from the owners or other sources deemed reliable. We have no reason to doubt its accuracy but regret we cannot guarantee it. All properties subject to change or withdrawal without notice. All numbers reported use the most accurate information available at the time of publishing, however we acknowledge that there may be marginal changes over time as more accurate information becomes available. Colliers Macaulay Nicolls (Ontario) Inc., Brokerage.

SUBMARKET INDICATORS MAP OF SUBMARKET
Q1 2009 Q2 2009 Trend
Office Inventory* 14,740,192 14,740,192
Net Absorption 105,869 (43,109)
Vacancy Rate 1.8% 2.4%
Average Asking Net Rent $18.14 $18.71
Average Additional Rent $18.49 $20.34
AVAILABLE SUPPLY SPLIT
AVAILABLE SPACE OPTIONS
0 - 4k sf 4k - 10k sf 10k - 20k sf 20 - 50k sf 50k - 100k sf 100k sf +
# of units** 70 19 8 9 0 0
** Counting smallest divisible units in existing buildings and buildings which are under construction.
RECENT TRANSACTIONS Q2 2009
Suite Sq. Ft. Landlord
400 9,223 Milcan Enterprises
GROSS RENT & AVAILABILITY BY BUILDING CLASS 1422 626 Northam Realty
Q2-09Office Submarket Dashboard: Downtown North
*Office Inventory: For the purpose of this report, buildings with less than 10,000 sf of office space and buildings owned and occupied by the
government have not been included in the office inventory. There are 73 office buildings surveyed in this submarket.
TOP Office Lease Transactions by Size
Number of units on the submarket by size brackets
229 Yonge Street
2 Carlton Street
TenantAddress
St Michael's Hospital
N/A
0%
10%
20%
30%
40%
50%
60%
0
100,000
200,000
300,000
400,000
500,000
600,000
700,000
800,000
900,000
1,000,000
Q1 2008 Q2 2008 Q3 2008 Q4 2008 Q1 2009 Q2 2009
Sq
uare
Feet
Direct Sublease Sublease as % of Total Available
GROSS RENT & AVAILABILITY BY BUILDING CLASS
Date Address Price Vendor Purchaser Size $/PSF
6/18/2009415 Yonge
Street$32,100,000
Anthem
Properties Crown Realty 191,880 $172
OCCUPIED SPACE BY MAJOR BUSINESS CATEGORIES
18 MONTH TREND
TOP PROJECTS UNDER CONSTRUCTION BY SIZE
Address Sq. Ft. Est. Com.
SUBMARKET CHARACTERISTICS
Source: Colliers International, Q2 2009
TOP Office Sale Transactions by Price
No Construction took place during this period
Developer Anchor Tenant
$42.87 $36.55
$33.66
-
1,000,000
2,000,000
3,000,000
4,000,000
5,000,000
6,000,000
7,000,000
$-
$5
$10
$15
$20
$25
$30
$35
$40
$45
$50
Class A Class B Class C
Sq. Ft.
Gross Rent $/Sq. Ft.
Avail. Office Space Not Avail. Office Space Gross Rent
Note: Not available office space (blue) and available office space (yellow) add up to the total inventory of office space in the respective building class.
$18.71
2.4%
0.0%
0.5%
1.0%
1.5%
2.0%
2.5%
3.0%
3.5%
4.0%
(5)
-
5
10
15
20
25
Q1 2008 Q2 2008 Q3 2008 Q4 2008 Q1 2009 Q2 2009
Vacancy Rate
Net Rent $/sf. / Absorption (10,000's)
Absorption Asking Net Rent Vacancy Rate
Manufacturing & Distribution
1%
Data,Publishing, Broadcasting Services
2%
Finance 17%
Professional Services
9%
Public Service & Private Sector
Services69%
Others2%
* Offering all downtown location advantages but at lower rental prices than in the Financial Core* Great connections to public transit and road system makes this submarket accessible toemployees and clients/customers.* Great proximity to an educated and productive labour force* With new residential high-rise development, residential development will increase and expand anddiversify labour pool* Incorporates Toronto Discovery District a 2.5 square km research park with a highly concentratedmix of research, bio-medical companies, finance and business support services
0%
10%
20%
30%
40%
50%
60%
0
100,000
200,000
300,000
400,000
500,000
600,000
700,000
800,000
900,000
1,000,000
Q1 2008 Q2 2008 Q3 2008 Q4 2008 Q1 2009 Q2 2009
Sq
uare
Feet
Direct Sublease Sublease as % of Total Available
Information contained herein has been obtained from the owners or other sources deemed reliable. We have no reason to doubt its accuracy but regret we
$42.87 $36.55
$33.66
-
1,000,000
2,000,000
3,000,000
4,000,000
5,000,000
6,000,000
7,000,000
$-
$5
$10
$15
$20
$25
$30
$35
$40
$45
$50
Class A Class B Class C
Sq. Ft.
Gross Rent $/Sq. Ft.
Avail. Office Space Not Avail. Office Space Gross Rent
Note: Not available office space (blue) and available office space (yellow) add up to the total inventory of office space in the respective building class.
$18.71
2.4%
0.0%
0.5%
1.0%
1.5%
2.0%
2.5%
3.0%
3.5%
4.0%
(5)
-
5
10
15
20
25
Q1 2008 Q2 2008 Q3 2008 Q4 2008 Q1 2009 Q2 2009
Vacancy Rate
Net Rent $/sf. / Absorption (10,000's)
Absorption Asking Net Rent Vacancy Rate
Manufacturing & Distribution
1%
Data,Publishing, Broadcasting Services
2%
Finance 17%
Professional Services
9%
Public Service & Private Sector
Services69%
Others2%
* Offering all downtown location advantages but at lower rental prices than in the Financial Core* Great connections to public transit and road system makes this submarket accessible toemployees and clients/customers.* Great proximity to an educated and productive labour force* With new residential high-rise development, residential development will increase and expand anddiversify labour pool* Incorporates Toronto Discovery District a 2.5 square km research park with a highly concentratedmix of research, bio-medical companies, finance and business support services
0%
10%
20%
30%
40%
50%
60%
0
100,000
200,000
300,000
400,000
500,000
600,000
700,000
800,000
900,000
1,000,000
Q1 2008 Q2 2008 Q3 2008 Q4 2008 Q1 2009 Q2 2009
Sq
uare
Feet
Direct Sublease Sublease as % of Total Available
Information contained herein has been obtained from the owners or other sources deemed reliable. We have no reason to doubt its accuracy but regret we cannot guarantee it. All properties subject to change or withdrawal without notice. All numbers reported use the most accurate information available at the time of publishing, however we acknowledge that there may be marginal changes over time as more accurate information becomes available. Colliers Macaulay Nicolls (Ontario) Inc., Brokerage.

MARKET INDICATORS MAP OF MARKET
Q1 2009 Q2 2009 Trend
Office Inventory* 17,014,763 17,014,763 AVAILABLE SPACE OPTIONS
Net Absorption 109,794 135,095
Vacancy Rate 6.1% 5.5%
Average Asking Net Rent $16.45 $16.40 0 - 4k sf
Average Additional Rent $18.17 $18.25 4k - 10k sf
10k - 20k sf
AVAILABLE SUPPLY SPLIT20 - 50k sf
50k - 100k sf
100k sf +
RECENT TRANSACTIONS Q2 2009
Suite Sq. Ft. Landlord
301 15,000 Madison Group
1100 4,588 Manulife Financial
2601 3,141 Oxford Properties
GROSS RENT & AVAILABILITY BY BUILDING CLASS
62
211
** Counting smallest divisible units in existing
buildings and buildings under construction.
0
0
8
43
45 St Clair Avenue W
Tenant
TOP Office Sale Transactions by Price
N/A
ThinData Inc.90 Eglinton Avenue E
Q2-09Office Market Dashboard: GTA Midtown
2 Bloor Street W N/A
*Office Inventory: For the purpose of this report, buildings with less than 10,000 sf of office space and buildings owned and occupied by the
government have not been included in the office inventory. There are 165 office buildings surveyed in this market.
TOP Office Lease Transactions by Size
Address
Number of units
on the market by
size brackets
# of units**
0%
5%
10%
15%
20%
25%
30%
35%
40%
45%
50%
0
200,000
400,000
600,000
800,000
1,000,000
1,200,000
1,400,000
1,600,000
Q1 2008 Q2 2008 Q3 2008 Q4 2008 Q1 2009 Q2 2009
Sq
uare
Feet
Sublease Direct Sublease as % of Total Available
GROSS RENT & AVAILABILITY BY BUILDING CLASS
Date Address Price Vendor Purchaser Size $/PSF
4/15/2009327 Eglinton
Avenue East$1,200,000
A Private
Individual
The Cosmetic Surgery
Institute 2,329 $515
OCCUPIED SPACE BY MAJOR BUSINESS CATEGORIES
18 MONTH TREND
TOP PROJECTS UNDER CONSTRUCTION BY SIZE
Address Sq. Ft. Est. Com.
MARKET CHARACTERISTICS
Source: Colliers International, Q2 2009
Anchor TenantDeveloper
No construction occurred during this period
$38.70
$33.73
$29.42
-
2,000,000
4,000,000
6,000,000
8,000,000
10,000,000
12,000,000
$-
$5
$10
$15
$20
$25
$30
$35
$40
$45
Class A Class B Class C
Sq. Ft.
Gross Rent $/Sq. Ft.
Avail. Office Space Not Avail. Office Space Gross Rent
Note: Not available office space (blue) and available office space (yellow) add up to the total inventory of office space in the respective building class.
$16.40
5.5%
0.0%
1.0%
2.0%
3.0%
4.0%
5.0%
6.0%
7.0%
8.0%
9.0%
(11)
(7)
(3)
1
5
9
13
17
Q1 2008 Q2 2008 Q3 2008 Q4 2008 Q1 2009 Q2 2009
Vacancy Rate
Net Rent $/sf. / Absorption (10,000's)
Absorption Asking Net Rent Vacancy Rate
Manufacturing & Distribution
9%
Data,Publishing, Broadcasting Services 14%
Finance 23% Professional
Services 24%
Public Service & Private Sector
Services28%
Others2%
* Well established office market in a continuously densifying urban area consitsting of three office submarkets: Yonge-Bloor, Yonge-St.Clair and Yonge-Eglinton* Lower real estate costs than in Downtown Toronto* Vacancy rates are fairly stable at a low value as this market is in high demand by companies looking to locate in this well located office market* Great access to public transit and highly educated labour force* Abundance of amenities are in walking distance in all three submarkets
0%
5%
10%
15%
20%
25%
30%
35%
40%
45%
50%
0
200,000
400,000
600,000
800,000
1,000,000
1,200,000
1,400,000
1,600,000
Q1 2008 Q2 2008 Q3 2008 Q4 2008 Q1 2009 Q2 2009
Sq
uare
Feet
Sublease Direct Sublease as % of Total Available
Information contained herein has been obtained from the owners or other sources deemed reliable. We have no reason to doubt its accuracy but regret we cannot guarantee it. All properties subject to change or withdrawal without notice. All numbers reported use the most accurate information available at the time of publishing, however we acknowledge that there may be marginal changes over time as more accurate information becomes available. Colliers Macaulay
$38.70
$33.73
$29.42
-
2,000,000
4,000,000
6,000,000
8,000,000
10,000,000
12,000,000
$-
$5
$10
$15
$20
$25
$30
$35
$40
$45
Class A Class B Class C
Sq. Ft.
Gross Rent $/Sq. Ft.
Avail. Office Space Not Avail. Office Space Gross Rent
Note: Not available office space (blue) and available office space (yellow) add up to the total inventory of office space in the respective building class.
$16.40
5.5%
0.0%
1.0%
2.0%
3.0%
4.0%
5.0%
6.0%
7.0%
8.0%
9.0%
(11)
(7)
(3)
1
5
9
13
17
Q1 2008 Q2 2008 Q3 2008 Q4 2008 Q1 2009 Q2 2009
Vacancy Rate
Net Rent $/sf. / Absorption (10,000's)
Absorption Asking Net Rent Vacancy Rate
Manufacturing & Distribution
9%
Data,Publishing, Broadcasting Services 14%
Finance 23% Professional
Services 24%
Public Service & Private Sector
Services28%
Others2%
* Well established office market in a continuously densifying urban area consitsting of three office submarkets: Yonge-Bloor, Yonge-St.Clair and Yonge-Eglinton* Lower real estate costs than in Downtown Toronto* Vacancy rates are fairly stable at a low value as this market is in high demand by companies looking to locate in this well located office market* Great access to public transit and highly educated labour force* Abundance of amenities are in walking distance in all three submarkets
0%
5%
10%
15%
20%
25%
30%
35%
40%
45%
50%
0
200,000
400,000
600,000
800,000
1,000,000
1,200,000
1,400,000
1,600,000
Q1 2008 Q2 2008 Q3 2008 Q4 2008 Q1 2009 Q2 2009
Sq
uare
Feet
Sublease Direct Sublease as % of Total Available
Information contained herein has been obtained from the owners or other sources deemed reliable. We have no reason to doubt its accuracy but regret we cannot guarantee it. All properties subject to change or withdrawal without notice. All numbers reported use the most accurate information available at the time of publishing, however we acknowledge that there may be marginal changes over time as more accurate information becomes available. Colliers Macaulay Nicolls (Ontario) Inc., Brokerage.

SUBMARKET INDICATORS MAP OF SUBMARKET
Q1 2009 Q2 2009 Trend
Office Inventory* 2,851,688 2,851,688
Net Absorption 21,583 20,397
Vacancy Rate 1.6% 1.4%
Average Asking Net Rent $15.96 $16.83
Average Additional Rent $18.57 $18.67
AVAILABLE SUPPLY SPLIT
AVAILABLE SPACE OPTIONS
0 - 4k sf 4k - 10k sf 10k - 20k sf 20 - 50k sf 50k - 100k sf 100k sf +
# of units** 33 10 2 2 0 0
** Counting smallest divisible units in existing buildings and buildings which are under construction.
RECENT TRANSACTIONS Q2 2009
Suite Sq. Ft. Landlord Tenant
1100 2,879 Manulife Financial
GROSS RENT & AVAILABILITY BY BUILDING CLASS
Date Address Price Vendor Purchaser Size $/PSF
Address
TOP Office Sale Transactions by Price
No transactions took place during this period.
Q2-09
Number of units on the submarket by size brackets
N/A45 St. Clair Avenue W
Office Submarket Dashboard: Yonge & St. Clair
*Office Inventory: For the purpose of this report, buildings with less than 10,000 sf of office space and buildings owned and occupied by the
government have not been included in the office inventory. There are 37 office buildings surveyed in this submarket.
TOP Office Lease Transactions by Size
1,800,000
2,000,000
$40
$45
Avail. Office Space Not Avail. Office Space Gross Rent
-5%
5%
15%
25%
35%
45%
55%
65%
75%
0
50,000
100,000
150,000
200,000
250,000
Q1 2008 Q2 2008 Q3 2008 Q4 2008 Q1 2009 Q2 2009
Sq
uare
Feet
Sublease Direct Sublease as % of Total Available
OCCUPIED SPACE BY MAJOR BUSINESS CATEGORIES
18 MONTH TREND
TOP PROJECTS UNDER CONSTRUCTION BY SIZE
Address Sq. Ft. Est. Com.
SUBMARKET CHARACTERISTICS
Source: Colliers International, Q2 2009
No transactions took place during this period.
Developer Anchor Tenant
No construction took place during this period.
$39.87 $33.67
$31.79
-
200,000
400,000
600,000
800,000
1,000,000
1,200,000
1,400,000
1,600,000
1,800,000
2,000,000
$-
$5
$10
$15
$20
$25
$30
$35
$40
$45
Class A Class B Class C
Sq. Ft.
Gross Rent $/Sq. Ft.
Avail. Office Space Not Avail. Office Space Gross Rent
Note: Not available office space (blue) and available office space (yellow) add up to the total inventory of office space in the respective building class.
$16.83
1.4%
-5.0%
-3.0%
-1.0%
1.0%
3.0%
5.0%
7.0%
9.0%
(1)
1
3
5
7
9
11
13
15
17
Q1 2008 Q2 2008 Q3 2008 Q4 2008 Q1 2009 Q2 2009
Vacancy Rate
Net Rent $/sf. / Absorption (10,000's)
Absorption Asking Net Rent Vacancy Rate
Manufacturing & Distribution
10%
Data,Publishing, Broadcasting Services
8%
Finance 15%
Professional Services 24%
Public Service & Private Sector
Services41%
Others2%
* Smallest office submarket of the Midtown office market* Due to small total inventory submarket usually doesn’t have many space options available* Vacancy Rate remains below the 9% threshold and Rental costs are fairly stable due to this fact* Great access to public transit and proximity to local labour force* Most buildings in this submarket have been built between 1960-1990 with some of them being renovated in the 1990s
-5%
5%
15%
25%
35%
45%
55%
65%
75%
0
50,000
100,000
150,000
200,000
250,000
Q1 2008 Q2 2008 Q3 2008 Q4 2008 Q1 2009 Q2 2009
Sq
uare
Feet
Sublease Direct Sublease as % of Total Available
Information contained herein has been obtained from the owners or other sources deemed reliable. We have no reason to doubt its accuracy but regret we
$39.87 $33.67
$31.79
-
200,000
400,000
600,000
800,000
1,000,000
1,200,000
1,400,000
1,600,000
1,800,000
2,000,000
$-
$5
$10
$15
$20
$25
$30
$35
$40
$45
Class A Class B Class C
Sq. Ft.
Gross Rent $/Sq. Ft.
Avail. Office Space Not Avail. Office Space Gross Rent
Note: Not available office space (blue) and available office space (yellow) add up to the total inventory of office space in the respective building class.
$16.83
1.4%
-5.0%
-3.0%
-1.0%
1.0%
3.0%
5.0%
7.0%
9.0%
(1)
1
3
5
7
9
11
13
15
17
Q1 2008 Q2 2008 Q3 2008 Q4 2008 Q1 2009 Q2 2009
Vacancy Rate
Net Rent $/sf. / Absorption (10,000's)
Absorption Asking Net Rent Vacancy Rate
Manufacturing & Distribution
10%
Data,Publishing, Broadcasting Services
8%
Finance 15%
Professional Services 24%
Public Service & Private Sector
Services41%
Others2%
* Smallest office submarket of the Midtown office market* Due to small total inventory submarket usually doesn’t have many space options available* Vacancy Rate remains below the 9% threshold and Rental costs are fairly stable due to this fact* Great access to public transit and proximity to local labour force* Most buildings in this submarket have been built between 1960-1990 with some of them being renovated in the 1990s
-5%
5%
15%
25%
35%
45%
55%
65%
75%
0
50,000
100,000
150,000
200,000
250,000
Q1 2008 Q2 2008 Q3 2008 Q4 2008 Q1 2009 Q2 2009
Sq
uare
Feet
Sublease Direct Sublease as % of Total Available
Information contained herein has been obtained from the owners or other sources deemed reliable. We have no reason to doubt its accuracy but regret we cannot guarantee it. All properties subject to change or withdrawal without notice. All numbers reported use the most accurate information available at the time of publishing, however we acknowledge that there may be marginal changes over time as more accurate information becomes available. Colliers Macaulay Nicolls (Ontario) Inc., Brokerage.

SUBMARKET INDICATORS MAP OF SUBMARKET
Q1 2009 Q2 2009 Trend
Office Inventory* 4,108,253 4,456,253
Net Absorption (21,457) 315,860
Vacancy Rate 3.7% 4.6%
Average Asking Net Rent $14.40 $14.68 0 - 4k sf
Average Additional Rent $10.59 $10.29 4k - 10k sf
10k - 20k sf
AVAILABLE SUPPLY SPLIT 20 - 50k sf
50k - 100k sf
100k sf +
RECENT TRANSACTIONS Q2 2009
Suite Sq. Ft. Landlord
Date Address Price Vendor Purchaser Size $/PSF
GROSS RENT & AVAILABILITY BY BUILDING CLASS
OCCUPIED SPACE BY MAJOR BUSINESS CATEGORIES
TOP Office Lease Transactions by Size
Address
** Counting smallest divisible units in existing
buildings and buildings under construction.
0
0
Tenant
31
8
2
0
TOP Office Sale Transactions by Price
No transactions were recorded during this period.
*Office Inventory: For the purpose of this report, buildings with less than 10,000 sf of office space and buildings owned and occupied by the
government have not been included in the office inventory. There are 56 office buildings surveyed in this submarket.
Q2-09
AVAILABLE SPACE OPTIONSNumber of units
on the
submarket by
size brackets
# of units**
No transactions were recorded during this period.
Office Submarket Dashboard: Airport West
Not Avail. Office Space Avail. Office Space Gross Rent
0%
5%
10%
15%
20%
25%
30%
35%
40%
45%
50%
0
50,000
100,000
150,000
200,000
250,000
300,000
350,000
Q1 2008 Q2 2008 Q3 2008 Q4 2008 Q1 2009 Q2 2009
Square Feet
Sublease Direct Sublease as % of Total Available
OCCUPIED SPACE BY MAJOR BUSINESS CATEGORIES
18 MONTH TREND
TOP PROJECTS UNDER CONSTRUCTION BY SIZE
Address Sq. Ft. Est. Com.
75 Courtneypark
West70,721 Q3 2009
SUBMARKET CHARACTERISTICS
Source: Colliers International, Q2 2009
Anchor Tenant
Higgens Development N/A
Developer
$30.22 $25.27
$16.42
-
500,000
1,000,000
1,500,000
2,000,000
2,500,000
$-
$5
$10
$15
$20
$25
$30
Class A Class B Class C
Sq. Ft.
Gross Rent $/Sq. Ft.
Not Avail. Office Space Avail. Office Space Gross Rent
Note: Not available office space (blue) and available office space (yellow) add up to the total inventory of office space in the respective building class.
$14.68
4.6%
0.0%
1.0%
2.0%
3.0%
4.0%
5.0%
6.0%
7.0%
8.0%
9.0%
10.0%
(5)
-
5
10
15
20
25
30
35
Q1 2008 Q2 2008 Q3 2008 Q4 2008 Q1 2009 Q2 2009
Vacancy Rate
Net Rent $/sf. / Absorption (10,000's)
Absorption Asking Net Rent Vacancy Rate
Manufacturing & Distribution
38%
Data,Publishing, Broadcasting Services 10%
Finance 24%
Professional Services 12%Public Service &
Private Sector Services15%
Others1%
* Submarket contains Lester B. Pearson International Airport and an abundance of close-by hotels allowfor easy corporate travelling* Highly industrial area with great highway accessibility and exposure allowing great signageopportunities* Provides state-of-the-art facilities to businesses seeking to locate near Pearson International Airport* Lower real estate costs than in the core with just a 15 minute drive from downtownToronto.* Employess have access to 10 major universities and 11 technical colleges within commuting distance* Quick highway access to the North and West sides of the GTA* Close to large supply of affordable labour markets
0%
5%
10%
15%
20%
25%
30%
35%
40%
45%
50%
0
50,000
100,000
150,000
200,000
250,000
300,000
350,000
Q1 2008 Q2 2008 Q3 2008 Q4 2008 Q1 2009 Q2 2009
Square Feet
Sublease Direct Sublease as % of Total Available
Information contained herein has been obtained from the owners or other sources deemed reliable. We have no reason to doubt its accuracy but regret we
$30.22 $25.27
$16.42
-
500,000
1,000,000
1,500,000
2,000,000
2,500,000
$-
$5
$10
$15
$20
$25
$30
Class A Class B Class C
Sq. Ft.
Gross Rent $/Sq. Ft.
Not Avail. Office Space Avail. Office Space Gross Rent
Note: Not available office space (blue) and available office space (yellow) add up to the total inventory of office space in the respective building class.
$14.68
4.6%
0.0%
1.0%
2.0%
3.0%
4.0%
5.0%
6.0%
7.0%
8.0%
9.0%
10.0%
(5)
-
5
10
15
20
25
30
35
Q1 2008 Q2 2008 Q3 2008 Q4 2008 Q1 2009 Q2 2009
Vacancy Rate
Net Rent $/sf. / Absorption (10,000's)
Absorption Asking Net Rent Vacancy Rate
Manufacturing & Distribution
38%
Data,Publishing, Broadcasting Services 10%
Finance 24%
Professional Services 12%Public Service &
Private Sector Services15%
Others1%
* Submarket contains Lester B. Pearson International Airport and an abundance of close-by hotels allowfor easy corporate travelling* Highly industrial area with great highway accessibility and exposure allowing great signageopportunities* Provides state-of-the-art facilities to businesses seeking to locate near Pearson International Airport* Lower real estate costs than in the core with just a 15 minute drive from downtownToronto.* Employess have access to 10 major universities and 11 technical colleges within commuting distance* Quick highway access to the North and West sides of the GTA* Close to large supply of affordable labour markets
0%
5%
10%
15%
20%
25%
30%
35%
40%
45%
50%
0
50,000
100,000
150,000
200,000
250,000
300,000
350,000
Q1 2008 Q2 2008 Q3 2008 Q4 2008 Q1 2009 Q2 2009
Square Feet
Sublease Direct Sublease as % of Total Available
Information contained herein has been obtained from the owners or other sources deemed reliable. We have no reason to doubt its accuracy but regret we cannot guarantee it. All properties subject to change or withdrawal without notice. All numbers reported use the most accurate information available at the time of publishing, however we acknowledge that there may be marginal changes over time as more accurate information becomes available. Colliers Macaulay Nicolls (Ontario) Inc., Brokerage.

SUBMARKET INDICATORS MAP OF SUBMARKET
Q1 2009 Q2 2009 Trend
Office Inventory* 4,099,907 4,099,907
Net Absorption (253,929) (85,422)
Vacancy Rate 12.0% 15.5%
Average Asking Net Rent $13.65 $13.62
Average Additional Rent $11.21 $11.36
AVAILABLE SUPPLY SPLIT AVAILABLE SPACE OPTIONS
0 - 4k sf 4k - 10k sf 10k - 20k sf 20 - 50k sf 50k - 100k sf 100k sf +
# of units** 45 71 35 10 2 1
** Counting smallest divisible units in existing buildings and buildings which are under construction.
RECENT TRANSACTIONS Q2 2009
Suite Sq. Ft. Landlord
202 2,841 A. Mantella & Sons
Limited
515 & 525 2,353 The Arcadia Group
21 2,100 N/A
GROSS RENT & AVAILABILITY BY BUILDING CLASS
Date Address Price Vendor Purchaser Size $/PSF
Number of units on the submarket by size brackets
TOP Office Sale Transactions by Price
Office Submarket Dashboard: Airport East
*Office Inventory: For the purpose of this report, buildings with less than 10,000 sf of office space and buildings owned and occupied by the
government have not been included in the office inventory. There are 69 office buildings surveyed in this submarket.
TOP Office Lease Transactions by Size
Address
Q2-09
Tenant
N/A
Igor Estrah
Penncorp Life Insurance
1 Greensboro Drive
135 Queen's Plate Drive
89 Galaxy Boulevard
Available Direct85%
Available Sublease15%
Total Available Office Space: 15285487 sf
2,500,000 $30
Avail. Office Space Not Avail. Office Space Gross Rent
0%
10%
20%
30%
40%
50%
60%
70%
0
100,000
200,000
300,000
400,000
500,000
600,000
700,000
800,000
900,000
1,000,000
Q1 2008 Q2 2008 Q3 2008 Q4 2008 Q1 2009 Q2 2009
Square Feet
Sublease Direct Sublease as % of Total Available
Date Address Price Vendor Purchaser Size $/PSF
OCCUPIED SPACE BY MAJOR BUSINESS CATEGORIES
18 MONTH TREND
TOP PROJECTS UNDER CONSTRUCTION BY SIZE
Address Sq. Ft. Est. Com.
SUBMARKET CHARACTERISTICS
Source: Colliers International, Q2 2009
No construction took place during this period.
No transactions were recorded during this period.
Anchor TenantDeveloper
Available Direct85%
Available Sublease15%
Total Available Office Space: 15285487 sf
$27.59 $24.66
$21.15
-
500,000
1,000,000
1,500,000
2,000,000
2,500,000
$-
$5
$10
$15
$20
$25
$30
Class A Class B Class C
Sq. Ft.
Gross Rent $/Sq. Ft.
Avail. Office Space Not Avail. Office Space Gross Rent
Note: Not available office space (blue) and available office space (yellow) add up to the total inventory of office space in the respective building class.
$13.62
15.5%
-20.0%
-15.0%
-10.0%
-5.0%
0.0%
5.0%
10.0%
15.0%
20.0%
(35)
(30)
(25)
(20)
(15)
(10)
(5)
-
5
10
15
Q1 2008 Q2 2008 Q3 2008 Q4 2008 Q1 2009 Q2 2009
Vacancy Rate
Net Rent $/sf. / Absorption (10,000's)
Absorption Asking Net Rent Vacancy Rate
Manufacturing & Distribution
39%
Data,Publishing, Broadcasting Services 12%
Finance 7%
Professional Services 22%
Public Service & Private Sector
Services17%
Others3%
*Highly industrial area with great highway accessibility and exposure allowing great signage opportunities* Provides state-of-the-art facilities to businesses seeking to locate near Pearson International Airport - proximity to Lester B. Pearson International Airport and an abundance of close-by hotels allow for easy corporate travelling* Lower real estate costs than in the core with just a 15 minute drive from downtown Toronto. * Employess have access to 10 major universities and 11 technical colleges within commuting distance* Quick highway access to the North and West sides of the GTA* Close to large supply of affordable labour markets
0%
10%
20%
30%
40%
50%
60%
70%
0
100,000
200,000
300,000
400,000
500,000
600,000
700,000
800,000
900,000
1,000,000
Q1 2008 Q2 2008 Q3 2008 Q4 2008 Q1 2009 Q2 2009
Square Feet
Sublease Direct Sublease as % of Total Available
Information contained herein has been obtained from the owners or other sources deemed reliable. We have no reason to doubt its accuracy but regret we
Available Direct85%
Available Sublease15%
Total Available Office Space: 15285487 sf
$27.59 $24.66
$21.15
-
500,000
1,000,000
1,500,000
2,000,000
2,500,000
$-
$5
$10
$15
$20
$25
$30
Class A Class B Class C
Sq. Ft.
Gross Rent $/Sq. Ft.
Avail. Office Space Not Avail. Office Space Gross Rent
Note: Not available office space (blue) and available office space (yellow) add up to the total inventory of office space in the respective building class.
$13.62
15.5%
-20.0%
-15.0%
-10.0%
-5.0%
0.0%
5.0%
10.0%
15.0%
20.0%
(35)
(30)
(25)
(20)
(15)
(10)
(5)
-
5
10
15
Q1 2008 Q2 2008 Q3 2008 Q4 2008 Q1 2009 Q2 2009
Vacancy Rate
Net Rent $/sf. / Absorption (10,000's)
Absorption Asking Net Rent Vacancy Rate
Manufacturing & Distribution
39%
Data,Publishing, Broadcasting Services 12%
Finance 7%
Professional Services 22%
Public Service & Private Sector
Services17%
Others3%
*Highly industrial area with great highway accessibility and exposure allowing great signage opportunities* Provides state-of-the-art facilities to businesses seeking to locate near Pearson International Airport - proximity to Lester B. Pearson International Airport and an abundance of close-by hotels allow for easy corporate travelling* Lower real estate costs than in the core with just a 15 minute drive from downtown Toronto. * Employess have access to 10 major universities and 11 technical colleges within commuting distance* Quick highway access to the North and West sides of the GTA* Close to large supply of affordable labour markets
0%
10%
20%
30%
40%
50%
60%
70%
0
100,000
200,000
300,000
400,000
500,000
600,000
700,000
800,000
900,000
1,000,000
Q1 2008 Q2 2008 Q3 2008 Q4 2008 Q1 2009 Q2 2009
Square Feet
Sublease Direct Sublease as % of Total Available
Information contained herein has been obtained from the owners or other sources deemed reliable. We have no reason to doubt its accuracy but regret we cannot guarantee it. All properties subject to change or withdrawal without notice. All numbers reported use the most accurate information available at the time of publishing, however we acknowledge that there may be marginal changes over time as more accurate information becomes available. Colliers Macaulay Nicolls (Ontario) Inc., Brokerage.

SUBMARKET INDICATORS MAP OF SUBMARKET
Q1 2009 Q2 2009 Trend
Office Inventory* 5,444,321 5,444,321
Net Absorption 19,769 (24,719)
Vacancy Rate 6.7% 8.0%
Average Asking Net Rent $16.30 $15.95
Average Additional Rent $11.17 $11.10
AVAILABLE SUPPLY SPLIT AVAILABLE SPACE OPTIONS
0 - 4k sf 4k - 10k sf 10k - 20k sf 20 - 50k sf 50k - 100k sf 100k sf +
# of units** 64 32 35 29 5 3
** Counting smallest divisible units in existing buildings and buildings which are under construction.
RECENT TRANSACTIONS Q2 2009
Suite Sq. Ft. Landlord
410 6,787 H & R REIT
2-400 757 N/A
GROSS RENT & AVAILABILITY BY BUILDING CLASS Date Address Price Vendor Purchaser Size $/PSF
5025 Orbitor Drive
TOP Office Sale Transactions by Price
No transactions were recorded during this period
Q2-09
Office Submarket Dashboard: Airport Corporate
Centre
*Office Inventory: For the purpose of this report, buildings with less than 10,000 sf of office space and buildings owned and occupied by the
government have not been included in the office inventory. There are 77 office buildings surveyed in this submarket.
TOP Office Lease Transactions by Size
Number of units on the submarket by size brackets
Tenant
N/A2810 Matheson Boulevard E
Address
N/A
Available Direct73%
Available Sublease27%
Total Available Office Space: 15285487 sf
2,500,000 $35
Avail. Office Space Not Avail. Office Space Gross Rent
0%
10%
20%
30%
40%
50%
60%
70%
0
200,000
400,000
600,000
800,000
1,000,000
1,200,000
1,400,000
Q1 2008 Q2 2008 Q3 2008 Q4 2008 Q1 2009 Q2 2009
Square Feet
Sublease Direct Sublease as % of Total Available
OCCUPIED SPACE BY MAJOR BUSINESS CATEGORIES
18 MONTH TREND
TOP PROJECTS UNDER CONSTRUCTION BY SIZE
Address Sq. Ft. Est. Com.
5550 Explorer
Drive227,000 Q4 2010
SUBMARKET CHARACTERISTICS
Source: Colliers International, Q2 2009
N/A
Anchor TenantDeveloper
No transactions were recorded during this period
HOOPP
Available Direct73%
Available Sublease27%
Total Available Office Space: 15285487 sf
$31.33 $27.14
$23.19
-
500,000
1,000,000
1,500,000
2,000,000
2,500,000
$-
$5
$10
$15
$20
$25
$30
$35
Class A Class B Class C
Sq. Ft.
Gross Rent $/Sq. Ft.
Avail. Office Space Not Avail. Office Space Gross Rent
Note: Not available office space (blue) and available office space (yellow) add up to the total inventory of office space in the respective building class.
$15.95
8.0%
0.0%
1.0%
2.0%
3.0%
4.0%
5.0%
6.0%
7.0%
8.0%
9.0%
10.0%
(7)
(5)
(3)
(1)
1
3
5
7
9
11
13
15
17
Q1 2008 Q2 2008 Q3 2008 Q4 2008 Q1 2009 Q2 2009
Vacancy Rate
Net Rent $/sf. / Absorption (10,000's)
Absorption Asking Net Rent Vacancy Rate
Manufacturing & Distribution
40%
Data,Publishing, Broadcasting Services 12% Finance
16%
Professional Services 22%Public Service &
Private Sector Services10%
Others0%
* Office Business Park with great highway accessibility and exposure allowing great signage opportunities* Provides state-of-the-art facilities to businesses seeking to locate near Pearson International Airport - proximity to Lester B. Pearson International Airport and an abundance of close-by hotels allow for easy corporate travelling* Lower real estate costs than in the core with just a 15 minute drive from downtown Toronto. * Top five employers are Accenture Inc., Baylis Medical Co., Carlson Marketing Group Canada, Chubb Security Systems, Citigroup* Employess have access to 10 major universities and 11 technical colleges within commuting distance* Centennial Park south of Eglington Ave W offers close-by golfing at Centennial Park Golf Centre
0%
10%
20%
30%
40%
50%
60%
70%
0
200,000
400,000
600,000
800,000
1,000,000
1,200,000
1,400,000
Q1 2008 Q2 2008 Q3 2008 Q4 2008 Q1 2009 Q2 2009
Square Feet
Sublease Direct Sublease as % of Total Available
Information contained herein has been obtained from the owners or other sources deemed reliable. We have no reason to doubt its accuracy but regret we cannot guarantee it. All properties subject to change or withdrawal without notice. All numbers reported use the most accurate information available at the time
Available Direct73%
Available Sublease27%
Total Available Office Space: 15285487 sf
$31.33 $27.14
$23.19
-
500,000
1,000,000
1,500,000
2,000,000
2,500,000
$-
$5
$10
$15
$20
$25
$30
$35
Class A Class B Class C
Sq. Ft.
Gross Rent $/Sq. Ft.
Avail. Office Space Not Avail. Office Space Gross Rent
Note: Not available office space (blue) and available office space (yellow) add up to the total inventory of office space in the respective building class.
$15.95
8.0%
0.0%
1.0%
2.0%
3.0%
4.0%
5.0%
6.0%
7.0%
8.0%
9.0%
10.0%
(7)
(5)
(3)
(1)
1
3
5
7
9
11
13
15
17
Q1 2008 Q2 2008 Q3 2008 Q4 2008 Q1 2009 Q2 2009
Vacancy Rate
Net Rent $/sf. / Absorption (10,000's)
Absorption Asking Net Rent Vacancy Rate
Manufacturing & Distribution
40%
Data,Publishing, Broadcasting Services 12% Finance
16%
Professional Services 22%Public Service &
Private Sector Services10%
Others0%
* Office Business Park with great highway accessibility and exposure allowing great signage opportunities* Provides state-of-the-art facilities to businesses seeking to locate near Pearson International Airport - proximity to Lester B. Pearson International Airport and an abundance of close-by hotels allow for easy corporate travelling* Lower real estate costs than in the core with just a 15 minute drive from downtown Toronto. * Top five employers are Accenture Inc., Baylis Medical Co., Carlson Marketing Group Canada, Chubb Security Systems, Citigroup* Employess have access to 10 major universities and 11 technical colleges within commuting distance* Centennial Park south of Eglington Ave W offers close-by golfing at Centennial Park Golf Centre
0%
10%
20%
30%
40%
50%
60%
70%
0
200,000
400,000
600,000
800,000
1,000,000
1,200,000
1,400,000
Q1 2008 Q2 2008 Q3 2008 Q4 2008 Q1 2009 Q2 2009
Square Feet
Sublease Direct Sublease as % of Total Available
Information contained herein has been obtained from the owners or other sources deemed reliable. We have no reason to doubt its accuracy but regret we cannot guarantee it. All properties subject to change or withdrawal without notice. All numbers reported use the most accurate information available at the time of publishing, however we acknowledge that there may be marginal changes over time as more accurate information becomes available. Colliers Macaulay Nicolls (Ontario) Inc., Brokerage.

SUBMARKET INDICATORS MAP OF SUBMARKET
Q1 2009 Q2 2009 Trend AVAILABLE SPACE OPTIONS
Office Inventory* 2,179,058 2,204,202
Net Absorption (21,684) 10,414
Vacancy Rate 3.7% 4.8%
Average Asking Net Rent $16.89 $16.55 0 - 4k sf
Average Additional Rent $4.17 $7.46 4k - 10k sf
10k - 20k sf
AVAILABLE SUPPLY SPLIT 20 - 50k sf
50k - 100k sf
100k sf +
RECENT TRANSACTIONS Q2 2009
Suite Sq. Ft. Landlord
100 15,000 N/A
201 1,645 N/A
Date Address Price Vendor Purchaser Size $/PSF
GROSS RENT & AVAILABILITY BY BUILDING CLASS
OCCUPIED SPACE BY MAJOR BUSINESS CATEGORIES
Q2-09
No transactions took place during this period.
Tenant
Office Submarket Dashboard: Sheridan
*Office Inventory: For the purpose of this report, buildings with less than 10,000 sf of office space and buildings owned and occupied by the
government have not been included in the office inventory. There are 41 office buildings surveyed in this submarket.
TOP Office Lease Transactions by Size
Address
N/A2381 Bristol Circle
TOP Office Sale Transactions by Price
2381 Bristol Circle Viridian Automation
Number of units
on the
submarket by
size brackets
# of units**
11
6
** Counting smallest divisible units in existing
buildings and buildings under construction.
5
12
0
0
1,800,000
2,000,000 $35
Avail. Office Space Not Avail. Office Space Gross Rent
0%
5%
10%
15%
20%
25%
30%
35%
40%
45%
50%
0
20,000
40,000
60,000
80,000
100,000
120,000
140,000
Q1 2008 Q2 2008 Q3 2008 Q4 2008 Q1 2009 Q2 2009
Square Feet
Sublease Direct Sublease as % of Total Available
18 MONTH TREND
TOP PROJECTS UNDER CONSTRUCTION BY SIZE
Address Sq. Ft. Est. Com.
2699 Speakman
Drive99,478 4/1/2009
SUBMARKET CHARACTERISTICS
Source: Colliers International, Q2 2009
Anchor Tenant
GE Real Estate Atomic Energy Canada
Developer
$30.84 $17.03
$16.96
-
200,000
400,000
600,000
800,000
1,000,000
1,200,000
1,400,000
1,600,000
1,800,000
2,000,000
$-
$5
$10
$15
$20
$25
$30
$35
Class A Class B Class C
Sq. Ft.
Gross Rent $/Sq. Ft.
Avail. Office Space Not Avail. Office Space Gross Rent
Note: Not available office space (blue) and available office space (yellow) add up to the total inventory of office space in the respective building class.
$16.55
4.8%
0.0%
1.0%
2.0%
3.0%
4.0%
5.0%
6.0%
(4)
(2)
-
2
4
6
8
10
12
14
16
18
20
Q1 2008 Q2 2008 Q3 2008 Q4 2008 Q1 2009 Q2 2009
Vacancy Rate
Net Rent $/sf. / Absorption (10,000's)
Absorption Asking Net Rent Vacancy Rate
Manufacturing & Distribution
30%
Data,Publishing, Broadcasting Services
4%
Finance 11%
Professional Services 46%
Public Service & Private Sector
Services7%
Others2%
* Well connected to several 400 series highways (401, 427, 410, 409, 407) and Lester B. Pearson International Airport; close commute to Hamilton's John C. Munro International Airport which is Canada's #1 freight airport.
* Availability of highway exposure sites with excellent signage opportunities.
* Lower real estate costs than in the core (City of Toronto)
* Great proximity to diversified suburban labour pool which is educated with 10 universities and 11 colleges within commuting distance, with Sheridan College located within the submarket.
0%
5%
10%
15%
20%
25%
30%
35%
40%
45%
50%
0
20,000
40,000
60,000
80,000
100,000
120,000
140,000
Q1 2008 Q2 2008 Q3 2008 Q4 2008 Q1 2009 Q2 2009
Square Feet
Sublease Direct Sublease as % of Total Available
Information contained herein has been obtained from the owners or other sources deemed reliable. We have no reason to doubt its accuracy but regret we cannot guarantee it. All properties subject to change or
withdrawal without notice. All numbers reported use the most accurate information available at the time of publishing, however we acknowledge that there may be marginal changes over time as more accurate
information becomes available.
Colliers Macaulay Nicolls (Ontario) Inc., Brokerage.

MARKET INDICATORS MAP OF MARKET
Q1 2009 Q2 2009 Trend
Office Inventory* 15,372,154 15,372,154 AVAILABLE SPACE OPTIONS
Net Absorption (152,573) (3,630)
Vacancy Rate 4.1% 4.6%
Average Asking Net Rent $16.23 $16.92 0 - 4k sf
Average Additional Rent $17.12 $17.00 4k - 10k sf
10k - 20k sf
AVAILABLE SUPPLY SPLIT20 - 50k sf
50k - 100k sf
100k sf +
RECENT TRANSACTIONS Q2 2009
Suite Sq. Ft. Landlord
402 10,997Ontario Teachers
Pension Plan Board
326 16,630 RioCan REIT
GROSS RENT & AVAILABILITY BY BUILDING CLASS Date Address Price Vendor Purchaser Size $/PSF
4792 Highway
Office Market Dashboard: GTA North
*Office Inventory: For the purpose of this report, buildings with less than 10,000 sf of office space and buildings owned and occupied by the
government have not been included in the office inventory. There are 197 office buildings surveyed in this market.
TOP Office Lease Transactions by Size
Address
** Counting smallest divisible units in existing
buildings and buildings under construction.
Number of units on
the regional market
by size brackets
# of units**
3
N/A4100 Yonge Street
700 Lawrence Avenue W
Q2-09
Tenant
29
19
18
37
122
New Heights Community
Health Centre
TOP Office Sale Transactions by Price
$36.57 9,000,000 $40
Not Avail. Office Space Avail. Office Space Gross Rent
0%
5%
10%
15%
20%
25%
30%
35%
40%
45%
50%
0
200,000
400,000
600,000
800,000
1,000,000
1,200,000
Q1 2008 Q2 2008 Q3 2008 Q4 2008 Q1 2009 Q2 2009
Sq
uare
Feet
Sublease Direct Sublease as % of Total Available
5/5/20094792 Highway
No. 7 East$1,700,000 N/A Sanmayhia Inc 8,118 $209.00
4/30/2009292 Sheppard
Avenue West$1,100,000
Fair Group
Corporation
Aloris Precious Metals
Inc 3,499 $314.00
OCCUPIED SPACE BY MAJOR BUSINESS CATEGORIES
18 MONTH TREND
TOP PROJECTS UNDER CONSTRUCTION BY SIZE
Address Sq. Ft. Est. Com.
MARKET CHARACTERISTICS
Source: Colliers International, Q2 2009
No construction took place during this quarer.
Anchor TenantDeveloper
$36.57
$30.27
$21.37
-
1,000,000
2,000,000
3,000,000
4,000,000
5,000,000
6,000,000
7,000,000
8,000,000
9,000,000
$-
$5
$10
$15
$20
$25
$30
$35
$40
Class A Class B Class C
Sq. Ft.
Gross Rent $/Sq. Ft.
Not Avail. Office Space Avail. Office Space Gross Rent
Note: Not available office space (blue) and available office space (yellow) add up to the total inventory of office space in the respective building class.
$16.92
4.6%
0.0%
0.5%
1.0%
1.5%
2.0%
2.5%
3.0%
3.5%
4.0%
4.5%
5.0%
(17)
(13)
(9)
(5)
(1)
3
7
11
15
19
23
27
Q1 2008 Q2 2008 Q3 2008 Q4 2008 Q1 2009 Q2 2009
Vacancy Rate
Net Rent $/sf. / Absorption (10,000's)
Absorption Asking Net Rent Vacancy Rate
Manufacturing & Distribution
10%
Data,Publishing, Broadcasting Services
3%
Finance 15%
Professional Services 10%
Public Service & Private Sector
Services17%
Others45%
* Smallest office market in the GTA with lowest vacancy and highest sublease rates, and highest net asking rates on average of suburban markets.* Strategically located in the GTA with easy access to the areas east, west, north and south of the GTA. * Market is surrounded by highways (including Highways 427, 407, and 400) and residents and local businesses are linked by a network of public transit operated by York Region Transit, GO Train and VIVA* Located adjacent to Buttonville Airport and a short drive to Pearson International Airport* Close to well-educated labour force
0%
5%
10%
15%
20%
25%
30%
35%
40%
45%
50%
0
200,000
400,000
600,000
800,000
1,000,000
1,200,000
Q1 2008 Q2 2008 Q3 2008 Q4 2008 Q1 2009 Q2 2009
Sq
uare
Feet
Sublease Direct Sublease as % of Total Available
Information contained herein has been obtained from the owners or other sources deemed reliable. We have no reason to doubt its accuracy but regret we
$36.57
$30.27
$21.37
-
1,000,000
2,000,000
3,000,000
4,000,000
5,000,000
6,000,000
7,000,000
8,000,000
9,000,000
$-
$5
$10
$15
$20
$25
$30
$35
$40
Class A Class B Class C
Sq. Ft.
Gross Rent $/Sq. Ft.
Not Avail. Office Space Avail. Office Space Gross Rent
Note: Not available office space (blue) and available office space (yellow) add up to the total inventory of office space in the respective building class.
$16.92
4.6%
0.0%
0.5%
1.0%
1.5%
2.0%
2.5%
3.0%
3.5%
4.0%
4.5%
5.0%
(17)
(13)
(9)
(5)
(1)
3
7
11
15
19
23
27
Q1 2008 Q2 2008 Q3 2008 Q4 2008 Q1 2009 Q2 2009
Vacancy Rate
Net Rent $/sf. / Absorption (10,000's)
Absorption Asking Net Rent Vacancy Rate
Manufacturing & Distribution
10%
Data,Publishing, Broadcasting Services
3%
Finance 15%
Professional Services 10%
Public Service & Private Sector
Services17%
Others45%
* Smallest office market in the GTA with lowest vacancy and highest sublease rates, and highest net asking rates on average of suburban markets.* Strategically located in the GTA with easy access to the areas east, west, north and south of the GTA. * Market is surrounded by highways (including Highways 427, 407, and 400) and residents and local businesses are linked by a network of public transit operated by York Region Transit, GO Train and VIVA* Located adjacent to Buttonville Airport and a short drive to Pearson International Airport* Close to well-educated labour force
0%
5%
10%
15%
20%
25%
30%
35%
40%
45%
50%
0
200,000
400,000
600,000
800,000
1,000,000
1,200,000
Q1 2008 Q2 2008 Q3 2008 Q4 2008 Q1 2009 Q2 2009
Sq
uare
Feet
Sublease Direct Sublease as % of Total Available
Information contained herein has been obtained from the owners or other sources deemed reliable. We have no reason to doubt its accuracy but regret we cannot guarantee it. All properties subject to change or withdrawal without notice. All numbers reported use the most accurate information available at the time of publishing, however we acknowledge that there may be marginal changes over time as more accurate information becomes available. Colliers Macaulay Nicolls (Ontario) Inc., Brokerage.

SUBMARKET INDICATORS MAP OF SUBMARKET
Q1 2009 Q2 2009 Trend
Office Inventory* 8,906,079 8,906,079
Net Absorption (127,351) 14,140
Vacancy Rate 5.1% 5.8%
Average Asking Net Rent $16.97 $17.69 0 - 4k sf
Average Additional Rent $18.83 $18.86 4k - 10k sf
10k - 20k sf
AVAILABLE SUPPLY SPLIT 20 - 50k sf
50k - 100k sf
100k sf +
RECENT TRANSACTIONS Q2 2009
Suite Sq. Ft. Landlord
402 10,997 Ontario Teachers
Pension Plan Board
Date Address Price Vendor Purchaser Size $/PSF
4/30/2009292 Sheppard
Avenue West$1,100,000
Fair Group
Corporation
Aloris Precious Metals
Inc 3,499 $314
GROSS RENT & AVAILABILITY BY BUILDING CLASS OCCUPIED SPACE BY MAJOR BUSINESS CATEGORIES
Q2-09
Office Submarket Dashboard:
North Yonge Corridor
*Office Inventory: For the purpose of this report, buildings with less than 10,000 sf of office space and buildings owned and occupied by the
government have not been included in the office inventory. There are 66 office buildings surveyed in this submarket.
TOP Office Lease Transactions by Size
14
** Counting smallest divisible units in existing
buildings and buildings under construction.
AVAILABLE SPACE OPTIONS
72
TOP Office Sale Transactions by Price
21
4100 Yonge Street
Address
N/A
8
0
Number of units
on the
submarket by
size brackets
# of units**
Tenant
3
Available Direct68%
Available Sublease32%
Total Available Office Space: 15285487 sf
Not Avail. Office Space Avail. Office Space Gross Rent
0%
10%
20%
30%
40%
50%
60%
0
100,000
200,000
300,000
400,000
500,000
600,000
700,000
800,000
900,000
1,000,000
Q1 2008 Q2 2008 Q3 2008 Q4 2008 Q1 2009 Q2 2009
Square Feet
Sublease Direct Sublease as % of Total Available
18 MONTH TREND TOP PROJECTS UNDER CONSTRUCTION BY SIZE
Address Sq. Ft. Est. Com.
SUBMARKET CHARACTERISTICS
Source: Colliers International, Q2 2009
No construction took place during this period.
Anchor TenantDeveloper
Available Direct68%
Available Sublease32%
Total Available Office Space: 15285487 sf
$38.01
$33.16 $33.00
-
1,000,000
2,000,000
3,000,000
4,000,000
5,000,000
6,000,000
$30
$31
$32
$33
$34
$35
$36
$37
$38
$39
Class A Class B Class C
Sq. Ft.
Gross Rent $/Sq. Ft.
Not Avail. Office Space Avail. Office Space Gross Rent
Note: Not available office space (blue) and available office space (yellow) add up to the total inventory of office space in the respective building class.
$17.69
5.8%
0.0%
1.0%
2.0%
3.0%
4.0%
5.0%
6.0%
7.0%
(14)
(10)
(6)
(2)
2
6
10
14
18
Q1 2008 Q2 2008 Q3 2008 Q4 2008 Q1 2009 Q2 2009 Vacancy Rate
Net Rent $/sf. / Absorption (10,000's)
Absorption Asking Net Rent Vacancy Rate
Manufacturing & Distribution
13%
Data,Publishing, Broadcasting Services
6%
Finance 26%
Professional Services 18%
Public Service & Private Sector
Services33%
Others4%
* Traditionally tighter submarket with limited larger office space availabilities
* Yonge Subway and other public transit, great proximity to Hwy 401 makes this submarket in the North of the City of Toronto very accessible to employees and customers
* Continuing development of residential high-rise condominiums will increase and diversify local labour pool
0%
10%
20%
30%
40%
50%
60%
0
100,000
200,000
300,000
400,000
500,000
600,000
700,000
800,000
900,000
1,000,000
Q1 2008 Q2 2008 Q3 2008 Q4 2008 Q1 2009 Q2 2009
Square Feet
Sublease Direct Sublease as % of Total Available
Information contained herein has been obtained from the owners or other sources deemed reliable. We have no reason to doubt its accuracy but regret we
Available Direct68%
Available Sublease32%
Total Available Office Space: 15285487 sf
$38.01
$33.16 $33.00
-
1,000,000
2,000,000
3,000,000
4,000,000
5,000,000
6,000,000
$30
$31
$32
$33
$34
$35
$36
$37
$38
$39
Class A Class B Class C
Sq. Ft.
Gross Rent $/Sq. Ft.
Not Avail. Office Space Avail. Office Space Gross Rent
Note: Not available office space (blue) and available office space (yellow) add up to the total inventory of office space in the respective building class.
$17.69
5.8%
0.0%
1.0%
2.0%
3.0%
4.0%
5.0%
6.0%
7.0%
(14)
(10)
(6)
(2)
2
6
10
14
18
Q1 2008 Q2 2008 Q3 2008 Q4 2008 Q1 2009 Q2 2009 Vacancy Rate
Net Rent $/sf. / Absorption (10,000's)
Absorption Asking Net Rent Vacancy Rate
Manufacturing & Distribution
13%
Data,Publishing, Broadcasting Services
6%
Finance 26%
Professional Services 18%
Public Service & Private Sector
Services33%
Others4%
* Traditionally tighter submarket with limited larger office space availabilities
* Yonge Subway and other public transit, great proximity to Hwy 401 makes this submarket in the North of the City of Toronto very accessible to employees and customers
* Continuing development of residential high-rise condominiums will increase and diversify local labour pool
0%
10%
20%
30%
40%
50%
60%
0
100,000
200,000
300,000
400,000
500,000
600,000
700,000
800,000
900,000
1,000,000
Q1 2008 Q2 2008 Q3 2008 Q4 2008 Q1 2009 Q2 2009
Square Feet
Sublease Direct Sublease as % of Total Available
Information contained herein has been obtained from the owners or other sources deemed reliable. We have no reason to doubt its accuracy but regret we cannot guarantee it. All properties subject to change or withdrawal without notice. All numbers reported use the most accurate information available at the time of publishing, however we acknowledge that there may be marginal changes over time as more accurate information becomes available. Colliers Macaulay Nicolls (Ontario) Inc., Brokerage.

SUBMARKET INDICATORS MAP OF SUBMARKET
Q1 2009 Q2 2009 Trend
Office Inventory* 1,216,160 1,216,160
Net Absorption (250) (780)
Vacancy Rate 2.9% 1.9%
Average Asking Net Rent $8.61 $9.23
Average Additional Rent $14.69 $14.80
AVAILABLE SUPPLY SPLIT AVAILABLE SPACE OPTIONS
0 - 4k sf 4k - 10k sf 10k - 20k sf 20 - 50k sf 50k - 100k sf 100k sf +
# of units** 12 2 1 1 0 0
** Counting smallest divisible units in existing buildings and buildings which are under construction.
RECENT TRANSACTIONS Q2 2009
Suite Sq. Ft. Landlord
Date Address Price Vendor Purchaser Size $/PSF
GROSS RENT & AVAILABILITY BY BUILDING CLASS
OCCUPIED SPACE BY MAJOR BUSINESS CATEGORIES
Office Submarket Dashboard: Dufferin-Finch
*Office Inventory: For the purpose of this report, buildings with less than 10,000 sf of office space and buildings owned and occupied by the
government have not been included in the office inventory. There are 29 office buildings surveyed in this submarket.
TOP Office Lease Transactions by Size
Address
Q2-09
Tenant
Number of units on the submarket by size brackets
TOP Office Sale Transactions by Price
No transactions were recorded during this period.
No transactions were recorded during this period.
$30
Avail. Office Space Not Avail. Office Space Gross Rent
0%
5%
10%
15%
20%
25%
30%
35%
40%
45%
50%
0
10,000
20,000
30,000
40,000
50,000
60,000
70,000
80,000
90,000
100,000
Q1 2008 Q2 2008 Q3 2008 Q4 2008 Q1 2009 Q2 2009
Sq
uare
Feet
Sublease Direct Sublease as % of Total Available
OCCUPIED SPACE BY MAJOR BUSINESS CATEGORIES
18 MONTH TREND TOP PROJECTS UNDER CONSTRUCTION BY SIZE
Address Sq. Ft. Est. Com.
SUBMARKET CHARACTERISTICS
Source: Colliers International, Q2 2009
Anchor Tenant
No construction took place during this period.
Developer
$-
$24.89
$17.11
-
200,000
400,000
600,000
800,000
1,000,000
1,200,000
$-
$5
$10
$15
$20
$25
$30
Class A Class B Class C
Sq. Ft.
Gross Rent $/Sq. Ft.
Avail. Office Space Not Avail. Office Space Gross Rent
Note: Not available office space (blue) and available office space (yellow) add up to the total inventory of office space in the respective building class.
$9.23
1.9%
0.0%
1.0%
2.0%
3.0%
4.0%
5.0%
6.0%
(9)
(4)
1
6
11
16
Q1 2008 Q2 2008 Q3 2008 Q4 2008 Q1 2009 Q2 2009
Vacancy Rate
Net Rent $/sf. / Absorption (1,000s)f
Absorption Asking Net Rent Vacancy Rate
Manufacturing & Distribution
4%
Data,Publishing, Broadcasting Services
7%
Finance 13%
Professional Services
9% Public Service & Private Sector
Services64%
Others3%
*Residential-Industrial submarket with easy access to large diverse labour pool.* Well serviced by both the TTC (Downsview Subway), Viva, York Region Transportation and the 400 series highways (400 & 407, minutes from the 401)*Submarket is adjacent to Downsview Airport, and 15 minutes from Lester B. Pearson International Airport.*York University is situated in this submarket, bringing over 60,000 students and staff into the submarket everyday (second largest single-day destination in the GTA after Pearson Airport).
0%
5%
10%
15%
20%
25%
30%
35%
40%
45%
50%
0
10,000
20,000
30,000
40,000
50,000
60,000
70,000
80,000
90,000
100,000
Q1 2008 Q2 2008 Q3 2008 Q4 2008 Q1 2009 Q2 2009
Sq
uare
Feet
Sublease Direct Sublease as % of Total Available
Information contained herein has been obtained from the owners or other sources deemed reliable. We have no reason to doubt its accuracy but regret we
$-
$24.89
$17.11
-
200,000
400,000
600,000
800,000
1,000,000
1,200,000
$-
$5
$10
$15
$20
$25
$30
Class A Class B Class C
Sq. Ft.
Gross Rent $/Sq. Ft.
Avail. Office Space Not Avail. Office Space Gross Rent
Note: Not available office space (blue) and available office space (yellow) add up to the total inventory of office space in the respective building class.
$9.23
1.9%
0.0%
1.0%
2.0%
3.0%
4.0%
5.0%
6.0%
(9)
(4)
1
6
11
16
Q1 2008 Q2 2008 Q3 2008 Q4 2008 Q1 2009 Q2 2009
Vacancy Rate
Net Rent $/sf. / Absorption (1,000s)f
Absorption Asking Net Rent Vacancy Rate
Manufacturing & Distribution
4%
Data,Publishing, Broadcasting Services
7%
Finance 13%
Professional Services
9% Public Service & Private Sector
Services64%
Others3%
*Residential-Industrial submarket with easy access to large diverse labour pool.* Well serviced by both the TTC (Downsview Subway), Viva, York Region Transportation and the 400 series highways (400 & 407, minutes from the 401)*Submarket is adjacent to Downsview Airport, and 15 minutes from Lester B. Pearson International Airport.*York University is situated in this submarket, bringing over 60,000 students and staff into the submarket everyday (second largest single-day destination in the GTA after Pearson Airport).
0%
5%
10%
15%
20%
25%
30%
35%
40%
45%
50%
0
10,000
20,000
30,000
40,000
50,000
60,000
70,000
80,000
90,000
100,000
Q1 2008 Q2 2008 Q3 2008 Q4 2008 Q1 2009 Q2 2009
Sq
uare
Feet
Sublease Direct Sublease as % of Total Available
Information contained herein has been obtained from the owners or other sources deemed reliable. We have no reason to doubt its accuracy but regret we cannot guarantee it. All properties subject to change or withdrawal without notice. All numbers reported use the most accurate information available at the time of publishing, however we acknowledge that there may be marginal changes over time as more accurate information becomes available. Colliers Macaulay Nicolls (Ontario) Inc., Brokerage.

SUBMARKET INDICATORS MAP OF SUBMARKET
Q1 2009 Q2 2009 Trend AVAILABLE SPACE OPTIONS
Office Inventory* 1,956,079 1,956,079
Net Absorption (22,868) (3,807)
Vacancy Rate 2.3% 2.8%
Average Asking Net Rent $11.68 $11.67 0 - 4k sf
Average Additional Rent $15.72 $11.75 4k - 10k sf
10k - 20k sf
AVAILABLE SUPPLY SPLIT 20 - 50k sf
50k - 100k sf
100k sf +
RECENT TRANSACTIONS Q2 2009
Suite Sq. Ft. Landlord
326 1,788 RioCan REIT
Date Address Price Vendor Purchaser Size $/PSF
OCCUPIED SPACE BY MAJOR BUSINESS CATEGORIES
GROSS RENT & AVAILABILITY BY BUILDING CLASS
*Office Inventory: For the purpose of this report, buildings with less than 10,000 sf of office space and buildings owned and occupied by the
government have not been included in the office inventory. There are 32 office buildings surveyed in this submarket.
TOP Office Lease Transactions by Size
Address
TOP Office Sale Transactions by Price
0
0
1
Q2-09
9
5
Office Submarket Dashboard: Yorkdale
Number of units
on the
submarket by
size brackets
# of units**
0
No transactions were recorded during this period.
Tenant
** Counting smallest divisible units in existing
buildings and buildings under construction.
700 Lawrence Avenue W New Heights Community
Health Centre
0%
5%
10%
15%
20%
25%
0
10,000
20,000
30,000
40,000
50,000
60,000
70,000
80,000
Q1 2008 Q2 2008 Q3 2008 Q4 2008 Q1 2009 Q2 2009
Square Feet
Sublease Direct Sublease as % of Total Available
GROSS RENT & AVAILABILITY BY BUILDING CLASS
TOP PROJECTS UNDER CONSTRUCTION BY SIZE
18 MONTH TREND Address Sq. Ft. Est. Com.
SUBMARKET CHARACTERISTICS
Source: Colliers International, Q2 2009
No construction took place during this period.
Developer Anchor Tenant
$24.95
$27.00
$18.39
-
200,000
400,000
600,000
800,000
1,000,000
1,200,000
1,400,000
$-
$5
$10
$15
$20
$25
$30
$35
$40
Class A Class B Class C
Sq. Ft.
Gross Rent $/Sq. Ft.
Avail. Office Space Not Avail. Office Space Gross Rent
Note: Not available office space (blue) and available office space (yellow) add up to the total inventory of office space in the respective building class.
$11.67
2.8%
0.0%
0.5%
1.0%
1.5%
2.0%
2.5%
3.0%
3.5%
4.0%
(3)
(1)
1
3
5
7
9
11
13
Q1 2008 Q2 2008 Q3 2008 Q4 2008 Q1 2009 Q2 2009
Vacancy Rate
Net Rent $/sf. / Absorption (10,000's)
Absorption Asking Net Rent Vacancy Rate
Manufacturing & Distribution
18%
Data,Publishing, Broadcasting Services
5%
Finance 27%
Professional Services
8%
Public Service & Private Sector
Services40%
Others2%
*Residential-Industrial submarket with easy access to large diverse labour pool.* Well serviced by both the TTC (Downsview Subway), Viva, York Region Transportation and the 400 series highways (400 & 407, minutes from the 401)*Submarket is adjacent to Downsview Airport, and 15 minutes from Lester B. Pearson International Airport.* Submarket contains Oxford Properties' Yorkdale Shopping Centre: The 5th largest mall in Canada (1.4 million GLA), it attracts 400,000 customers per week with over $1,000/sf of sales (highest in Canada).
0%
5%
10%
15%
20%
25%
0
10,000
20,000
30,000
40,000
50,000
60,000
70,000
80,000
Q1 2008 Q2 2008 Q3 2008 Q4 2008 Q1 2009 Q2 2009
Square Feet
Sublease Direct Sublease as % of Total Available
Information contained herein has been obtained from the owners or other sources deemed reliable. We have no reason to doubt its accuracy but regret we
$24.95
$27.00
$18.39
-
200,000
400,000
600,000
800,000
1,000,000
1,200,000
1,400,000
$-
$5
$10
$15
$20
$25
$30
$35
$40
Class A Class B Class C
Sq. Ft.
Gross Rent $/Sq. Ft.
Avail. Office Space Not Avail. Office Space Gross Rent
Note: Not available office space (blue) and available office space (yellow) add up to the total inventory of office space in the respective building class.
$11.67
2.8%
0.0%
0.5%
1.0%
1.5%
2.0%
2.5%
3.0%
3.5%
4.0%
(3)
(1)
1
3
5
7
9
11
13
Q1 2008 Q2 2008 Q3 2008 Q4 2008 Q1 2009 Q2 2009
Vacancy Rate
Net Rent $/sf. / Absorption (10,000's)
Absorption Asking Net Rent Vacancy Rate
Manufacturing & Distribution
18%
Data,Publishing, Broadcasting Services
5%
Finance 27%
Professional Services
8%
Public Service & Private Sector
Services40%
Others2%
*Residential-Industrial submarket with easy access to large diverse labour pool.* Well serviced by both the TTC (Downsview Subway), Viva, York Region Transportation and the 400 series highways (400 & 407, minutes from the 401)*Submarket is adjacent to Downsview Airport, and 15 minutes from Lester B. Pearson International Airport.* Submarket contains Oxford Properties' Yorkdale Shopping Centre: The 5th largest mall in Canada (1.4 million GLA), it attracts 400,000 customers per week with over $1,000/sf of sales (highest in Canada).
0%
5%
10%
15%
20%
25%
0
10,000
20,000
30,000
40,000
50,000
60,000
70,000
80,000
Q1 2008 Q2 2008 Q3 2008 Q4 2008 Q1 2009 Q2 2009
Square Feet
Sublease Direct Sublease as % of Total Available
Information contained herein has been obtained from the owners or other sources deemed reliable. We have no reason to doubt its accuracy but regret we cannot guarantee it. All properties subject to change or withdrawal without notice. All numbers reported use the most accurate information available at the time of publishing, however we acknowledge that there may be marginal changes over time as more accurate information becomes available. Colliers Macaulay Nicolls (Ontario) Inc., Brokerage.
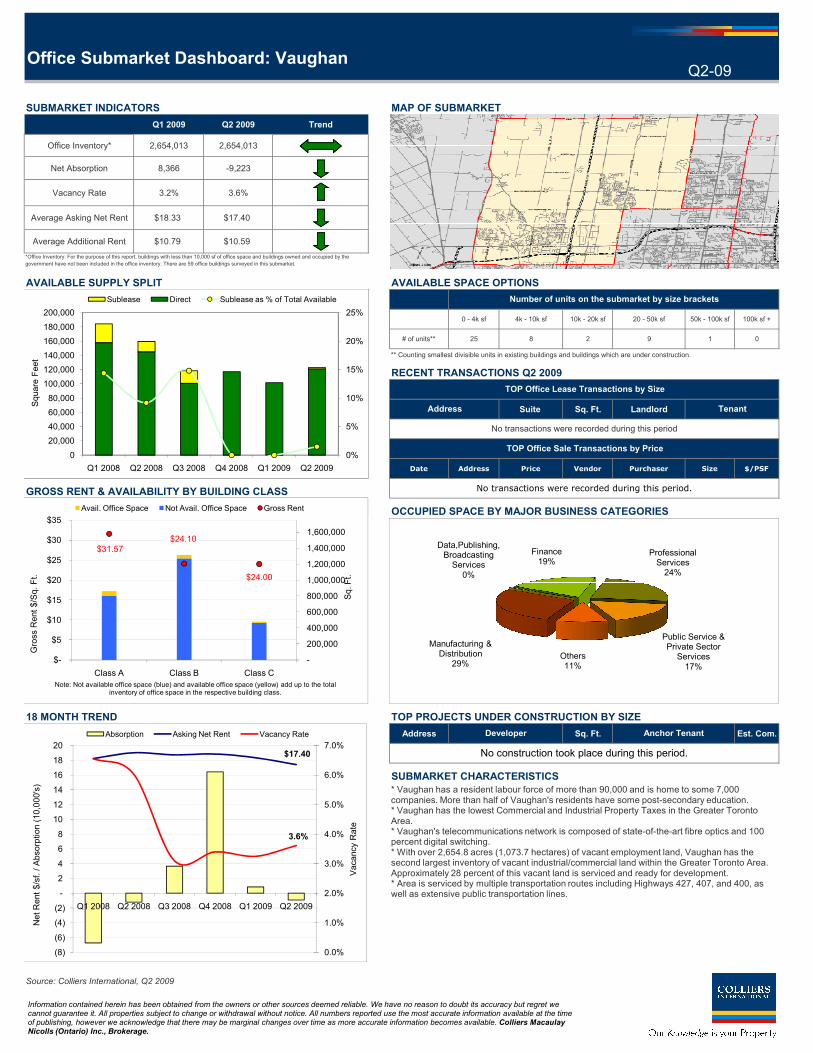
SUBMARKET INDICATORS MAP OF SUBMARKET
Q1 2009 Q2 2009 Trend
Office Inventory* 2,654,013 2,654,013
Net Absorption 8,366 -9,223
Vacancy Rate 3.2% 3.6%
Average Asking Net Rent $18.33 $17.40
Average Additional Rent $10.79 $10.59
AVAILABLE SUPPLY SPLIT AVAILABLE SPACE OPTIONS
0 - 4k sf 4k - 10k sf 10k - 20k sf 20 - 50k sf 50k - 100k sf 100k sf +
# of units** 25 8 2 9 1 0
** Counting smallest divisible units in existing buildings and buildings which are under construction.
RECENT TRANSACTIONS Q2 2009
Suite Sq. Ft. Landlord
Date Address Price Vendor Purchaser Size $/PSF
GROSS RENT & AVAILABILITY BY BUILDING CLASS
Q2-09
Number of units on the submarket by size brackets
Office Submarket Dashboard: Vaughan
*Office Inventory: For the purpose of this report, buildings with less than 10,000 sf of office space and buildings owned and occupied by the
government have not been included in the office inventory. There are 59 office buildings surveyed in this submarket.
TOP Office Lease Transactions by Size
No transactions were recorded during this period
Address
TOP Office Sale Transactions by Price
No transactions were recorded during this period.
Tenant
$35
Avail. Office Space Not Avail. Office Space Gross Rent
0%
5%
10%
15%
20%
25%
0
20,000
40,000
60,000
80,000
100,000
120,000
140,000
160,000
180,000
200,000
Q1 2008 Q2 2008 Q3 2008 Q4 2008 Q1 2009 Q2 2009
Square Feet
Sublease Direct Sublease as % of Total Available
OCCUPIED SPACE BY MAJOR BUSINESS CATEGORIES
18 MONTH TREND TOP PROJECTS UNDER CONSTRUCTION BY SIZE
Address Sq. Ft. Est. Com.
SUBMARKET CHARACTERISTICS
Source: Colliers International, Q2 2009
No construction took place during this period.
Anchor TenantDeveloper
$31.57 $24.10
$24.00
-
200,000
400,000
600,000
800,000
1,000,000
1,200,000
1,400,000
1,600,000
$-
$5
$10
$15
$20
$25
$30
$35
Class A Class B Class C
Sq. Ft.
Gross Rent $/Sq. Ft.
Avail. Office Space Not Avail. Office Space Gross Rent
Note: Not available office space (blue) and available office space (yellow) add up to the total inventory of office space in the respective building class.
$17.40
3.6%
0.0%
1.0%
2.0%
3.0%
4.0%
5.0%
6.0%
7.0%
(8)
(6)
(4)
(2)
-
2
4
6
8
10
12
14
16
18
20
Q1 2008 Q2 2008 Q3 2008 Q4 2008 Q1 2009 Q2 2009
Vacancy Rate
Net Rent $/sf. / Absorption (10,000's)
Absorption Asking Net Rent Vacancy Rate
Manufacturing & Distribution
29%
Data,Publishing, Broadcasting Services
0%
Finance 19%
Professional Services 24%
Public Service & Private Sector
Services17%
Others11%
* Vaughan has a resident labour force of more than 90,000 and is home to some 7,000 companies. More than half of Vaughan's residents have some post-secondary education.* Vaughan has the lowest Commercial and Industrial Property Taxes in the Greater Toronto Area.* Vaughan's telecommunications network is composed of state-of-the-art fibre optics and 100 percent digital switching.* With over 2,654.8 acres (1,073.7 hectares) of vacant employment land, Vaughan has the second largest inventory of vacant industrial/commercial land within the Greater Toronto Area. Approximately 28 percent of this vacant land is serviced and ready for development.* Area is serviced by multiple transportation routes including Highways 427, 407, and 400, as well as extensive public transportation lines.
0%
5%
10%
15%
20%
25%
0
20,000
40,000
60,000
80,000
100,000
120,000
140,000
160,000
180,000
200,000
Q1 2008 Q2 2008 Q3 2008 Q4 2008 Q1 2009 Q2 2009
Square Feet
Sublease Direct Sublease as % of Total Available
Information contained herein has been obtained from the owners or other sources deemed reliable. We have no reason to doubt its accuracy but regret we
$31.57 $24.10
$24.00
-
200,000
400,000
600,000
800,000
1,000,000
1,200,000
1,400,000
1,600,000
$-
$5
$10
$15
$20
$25
$30
$35
Class A Class B Class C
Sq. Ft.
Gross Rent $/Sq. Ft.
Avail. Office Space Not Avail. Office Space Gross Rent
Note: Not available office space (blue) and available office space (yellow) add up to the total inventory of office space in the respective building class.
$17.40
3.6%
0.0%
1.0%
2.0%
3.0%
4.0%
5.0%
6.0%
7.0%
(8)
(6)
(4)
(2)
-
2
4
6
8
10
12
14
16
18
20
Q1 2008 Q2 2008 Q3 2008 Q4 2008 Q1 2009 Q2 2009
Vacancy Rate
Net Rent $/sf. / Absorption (10,000's)
Absorption Asking Net Rent Vacancy Rate
Manufacturing & Distribution
29%
Data,Publishing, Broadcasting Services
0%
Finance 19%
Professional Services 24%
Public Service & Private Sector
Services17%
Others11%
* Vaughan has a resident labour force of more than 90,000 and is home to some 7,000 companies. More than half of Vaughan's residents have some post-secondary education.* Vaughan has the lowest Commercial and Industrial Property Taxes in the Greater Toronto Area.* Vaughan's telecommunications network is composed of state-of-the-art fibre optics and 100 percent digital switching.* With over 2,654.8 acres (1,073.7 hectares) of vacant employment land, Vaughan has the second largest inventory of vacant industrial/commercial land within the Greater Toronto Area. Approximately 28 percent of this vacant land is serviced and ready for development.* Area is serviced by multiple transportation routes including Highways 427, 407, and 400, as well as extensive public transportation lines.
0%
5%
10%
15%
20%
25%
0
20,000
40,000
60,000
80,000
100,000
120,000
140,000
160,000
180,000
200,000
Q1 2008 Q2 2008 Q3 2008 Q4 2008 Q1 2009 Q2 2009
Square Feet
Sublease Direct Sublease as % of Total Available
Information contained herein has been obtained from the owners or other sources deemed reliable. We have no reason to doubt its accuracy but regret we cannot guarantee it. All properties subject to change or withdrawal without notice. All numbers reported use the most accurate information available at the time of publishing, however we acknowledge that there may be marginal changes over time as more accurate information becomes available. Colliers Macaulay Nicolls (Ontario) Inc., Brokerage.

SUBMARKET INDICATORS MAP OF SUBMARKET
Q1 2009 Q2 2009 Trend AVAILABLE SPACE OPTIONS
Office Inventory* 639,823 639,823
Net Absorption (10,470) (3,960)
Vacancy Rate 1.3% 1.9%
Average Asking Net Rent $15.47 $15.34 0 - 4k sf
Average Additional Rent $11.59 $10.97 4k - 10k sf
10k - 20k sf
AVAILABLE SUPPLY SPLIT 20 - 50k sf
50k - 100k sf
100k sf +
RECENT TRANSACTIONS Q2 2009
Suite Sq. Ft. Landlord
Date Address Price Vendor Purchaser Size $/PSF
GROSS RENT & AVAILABILITY BY BUILDING CLASS OCCUPIED SPACE BY MAJOR BUSINESS CATEGORIES
Office Submarket Dashboard: Richmond Hill
*Office Inventory: For the purpose of this report, buildings with less than 10,000 sf of office space and buildings owned and occupied by the
government have not been included in the office inventory. There are 11 office buildings surveyed in this submarket.
TOP Office Lease Transactions by Size
Address
Q2-09
# of units**
1
28
Number of units
on the
submarket by
size brackets
4
1
0
0
** Counting smallest divisible units in existing
buildings and buildings under construction.
TOP Office Sale Transactions by Price
No transactions took place during this period.
Tenant
No transactions were recorded during this period.
600,000 $35
Avail. Office Space Not Avail. Office Space Gross Rent
0%
10%
20%
30%
40%
50%
60%
70%
0
5,000
10,000
15,000
20,000
25,000
30,000
35,000
Q1 2008 Q2 2008 Q3 2008 Q4 2008 Q1 2009 Q2 2009
Square Feet
Sublease Direct Sublease as % of Total Available
18 MONTH TREND Address Sq. Ft. Est. Com.
SUBMARKET CHARACTERISTICS
Source: Colliers International, Q2 2009
No construction took place during this period.
Developer Anchor Tenant
$29.00 $22.50
$-
-
100,000
200,000
300,000
400,000
500,000
600,000
$-
$5
$10
$15
$20
$25
$30
$35
Class A Class B Class C
Sq. Ft.
Gross Rent $/Sq. Ft.
Avail. Office Space Not Avail. Office Space Gross Rent
Note: Not available office space (blue) and available office space (yellow) add up to the total inventory of office space in the respective building class.
$15.34
1.9%
-5.0%
-4.0%
-3.0%
-2.0%
-1.0%
0.0%
1.0%
2.0%
3.0%
4.0%
(11)
(9)
(7)
(5)
(3)
(1)
1
3
5
7
9
11
13
15
Q1 2008 Q2 2008 Q3 2008 Q4 2008 Q1 2009 Q2 2009
Vacancy Rate
Net Rent $/sf. / Absorption (1,000's)
Absorption Asking Net Rent Vacancy Rate
Manufacturing & Distribution
5%
Data,Publishing, Broadcasting Services
1%
Finance 62%
Professional Services
6%
Public Service & Private Sector
Services14%Others
12%
* Smallest office submarket in the GTA
* Strategically located in the GTA with easy access to the areas east, west, north and south of the GTA.
* Submarket is surrounded by highways and residents and local businesses are linked by a network of public transit operated by York Region Transit, GO Train and VIVA
* Located adjacent to Buttonville Airport and a short drive to Pearson International Airport
* Close to well-educated labour force
0%
10%
20%
30%
40%
50%
60%
70%
0
5,000
10,000
15,000
20,000
25,000
30,000
35,000
Q1 2008 Q2 2008 Q3 2008 Q4 2008 Q1 2009 Q2 2009
Square Feet
Sublease Direct Sublease as % of Total Available
Information contained herein has been obtained from the owners or other sources deemed reliable. We have no reason to doubt its accuracy but regret we
$29.00 $22.50
$-
-
100,000
200,000
300,000
400,000
500,000
600,000
$-
$5
$10
$15
$20
$25
$30
$35
Class A Class B Class C
Sq. Ft.
Gross Rent $/Sq. Ft.
Avail. Office Space Not Avail. Office Space Gross Rent
Note: Not available office space (blue) and available office space (yellow) add up to the total inventory of office space in the respective building class.
$15.34
1.9%
-5.0%
-4.0%
-3.0%
-2.0%
-1.0%
0.0%
1.0%
2.0%
3.0%
4.0%
(11)
(9)
(7)
(5)
(3)
(1)
1
3
5
7
9
11
13
15
Q1 2008 Q2 2008 Q3 2008 Q4 2008 Q1 2009 Q2 2009
Vacancy Rate
Net Rent $/sf. / Absorption (1,000's)
Absorption Asking Net Rent Vacancy Rate
Manufacturing & Distribution
5%
Data,Publishing, Broadcasting Services
1%
Finance 62%
Professional Services
6%
Public Service & Private Sector
Services14%Others
12%
* Smallest office submarket in the GTA
* Strategically located in the GTA with easy access to the areas east, west, north and south of the GTA.
* Submarket is surrounded by highways and residents and local businesses are linked by a network of public transit operated by York Region Transit, GO Train and VIVA
* Located adjacent to Buttonville Airport and a short drive to Pearson International Airport
* Close to well-educated labour force
0%
10%
20%
30%
40%
50%
60%
70%
0
5,000
10,000
15,000
20,000
25,000
30,000
35,000
Q1 2008 Q2 2008 Q3 2008 Q4 2008 Q1 2009 Q2 2009
Square Feet
Sublease Direct Sublease as % of Total Available
Information contained herein has been obtained from the owners or other sources deemed reliable. We have no reason to doubt its accuracy but regret we cannot guarantee it. All properties subject to change or withdrawal without notice. All numbers reported use the most accurate information available at the time of publishing, however we acknowledge that there may be marginal changes over time as more accurate information becomes available. Colliers Macaulay Nicolls (Ontario) Inc., Brokerage.

SUBMARKET INDICATORS MAP OF SUBMARKET
Q1 2009 Q2 2009 Trend
Office Inventory* 4,628,878 4,628,878
Net Absorption 31,037 81,767
Vacancy Rate 8.8% 7.0%
Average Asking Net Rent $14.76 $15.01 0 - 4k sf
Average Additional Rent $17.49 $17.52 4k - 10k sf
10k - 20k sf
AVAILABLE SUPPLY SPLIT 20 - 50k sf
50k - 100k sf
100k sf +
RECENT TRANSACTIONS Q2 2009
Suite Sq. Ft. Landlord
301 15,00090 Eglinton Ave
Holdings
502 2,343 Davpart
504 1,5611881 Yonge Street
Holdings
GROSS RENT & AVAILABILITY BY BUILDING CLASS
Date Address Price Vendor Purchaser Size $/PSF
88
21
18
1
0
0
** Counting smallest divisible units in existing
buildings and buildings under construction.
Office Submarket Dashboard: Yonge & Eglinton
*Office Inventory: For the purpose of this report, buildings with less than 10,000 sf of office space and buildings owned and occupied by the
government have not been included in the office inventory. There are 55 office buildings surveyed in this submarket.
TOP Office Lease Transactions by Size
Address
Q2-09
AVAILABLE SPACE OPTIONS
Number of units
on the
submarket by
size brackets
# of units**
Tenant
Adgar Investments and
Development Inc.
Madison Group90 Eglinton Avenue E
TOP Office Sale Transactions by Price
1 Eglinton Avenue E
1881 Yonge Street
N/A
2,500,000 $40
Avail. Office Space Not Avail. Office Space Gross Rent
0%
10%
20%
30%
40%
50%
60%
0
100,000
200,000
300,000
400,000
500,000
600,000
Q1 2008 Q2 2008 Q3 2008 Q4 2008 Q1 2009 Q2 2009
Sq
uare
Feet
Direct Sublease Sublease as % of Total Available
Date Address Price Vendor Purchaser Size $/PSF
4/15/2009327 Eglinton
Avenue East$1,200,000
Private
Individual
The Cosmetic Surgery
Institute 2,329 $515
OCCUPIED SPACE BY MAJOR BUSINESS CATEGORIES
18 MONTH TREND
TOP PROJECTS UNDER CONSTRUCTION BY SIZE
Address Sq. Ft. Est. Com.
SUBMARKET CHARACTERISTICS
Source: Colliers International, Q2 2009
No construction took place during this period.
Developer Anchor Tenant
$35.65 $31.03
$29.35
-
500,000
1,000,000
1,500,000
2,000,000
2,500,000
$-
$5
$10
$15
$20
$25
$30
$35
$40
Class A Class B Class C
Sq. Ft.
Gross Rent $/Sq. Ft.
Avail. Office Space Not Avail. Office Space Gross Rent
Note: Not available office space (blue) and available office space (yellow) add up to the total inventory of office space in the respective building class.
$15.01
7.0%
-3.0%
-1.0%
1.0%
3.0%
5.0%
7.0%
9.0%
(15)
(11)
(7)
(3)
1
5
9
13
17
Q1 2008 Q2 2008 Q3 2008 Q4 2008 Q1 2009 Q2 2009
Vacancy Rate
Net Rent $/sf. / Absorption (10,000's)
Absorption Asking Net Rent Vacancy Rate
Manufacturing & Distribution
16%
Data,Publishing, Broadcasting Services
8%
Finance 14%
Professional Services 29%
Public Service & Private Sector
Services29%
Others4%
* Lively urban area with a great mix of uses with lower real estate costs than in the core.* Several recent residential densification projects e.g. Minto Towers on Yonge Street will re-enforce great proximity to diversified labour pool.* Easy access to public transit (subway and buses).* Multiple amenities and services add convenience for employees and customers.* Node has been identified as an “Urban Growth Centre” by theProvincial Government’s Growth Plan for the Greater Golden Horseshoe - activities along those lines will re-energize this area so it will remain a vibrant and successful area of the city.
0%
10%
20%
30%
40%
50%
60%
0
100,000
200,000
300,000
400,000
500,000
600,000
Q1 2008 Q2 2008 Q3 2008 Q4 2008 Q1 2009 Q2 2009
Sq
uare
Feet
Direct Sublease Sublease as % of Total Available
Information contained herein has been obtained from the owners or other sources deemed reliable. We have no reason to doubt its accuracy but regret we cannot guarantee it. All properties subject to change or withdrawal without notice. All numbers reported use the most accurate information available at the time of publishing, however we acknowledge that there may be marginal changes over time as more accurate information becomes available. Colliers Macaulay
$35.65 $31.03
$29.35
-
500,000
1,000,000
1,500,000
2,000,000
2,500,000
$-
$5
$10
$15
$20
$25
$30
$35
$40
Class A Class B Class C
Sq. Ft.
Gross Rent $/Sq. Ft.
Avail. Office Space Not Avail. Office Space Gross Rent
Note: Not available office space (blue) and available office space (yellow) add up to the total inventory of office space in the respective building class.
$15.01
7.0%
-3.0%
-1.0%
1.0%
3.0%
5.0%
7.0%
9.0%
(15)
(11)
(7)
(3)
1
5
9
13
17
Q1 2008 Q2 2008 Q3 2008 Q4 2008 Q1 2009 Q2 2009
Vacancy Rate
Net Rent $/sf. / Absorption (10,000's)
Absorption Asking Net Rent Vacancy Rate
Manufacturing & Distribution
16%
Data,Publishing, Broadcasting Services
8%
Finance 14%
Professional Services 29%
Public Service & Private Sector
Services29%
Others4%
* Lively urban area with a great mix of uses with lower real estate costs than in the core.* Several recent residential densification projects e.g. Minto Towers on Yonge Street will re-enforce great proximity to diversified labour pool.* Easy access to public transit (subway and buses).* Multiple amenities and services add convenience for employees and customers.* Node has been identified as an “Urban Growth Centre” by theProvincial Government’s Growth Plan for the Greater Golden Horseshoe - activities along those lines will re-energize this area so it will remain a vibrant and successful area of the city.
0%
10%
20%
30%
40%
50%
60%
0
100,000
200,000
300,000
400,000
500,000
600,000
Q1 2008 Q2 2008 Q3 2008 Q4 2008 Q1 2009 Q2 2009
Sq
uare
Feet
Direct Sublease Sublease as % of Total Available
Information contained herein has been obtained from the owners or other sources deemed reliable. We have no reason to doubt its accuracy but regret we cannot guarantee it. All properties subject to change or withdrawal without notice. All numbers reported use the most accurate information available at the time of publishing, however we acknowledge that there may be marginal changes over time as more accurate information becomes available. Colliers Macaulay Nicolls (Ontario) Inc., Brokerage.

SUBMARKET INDICATORS MAP OF SUBMARKET
Q1 2009 Q2 2009 Trend
Office Inventory* 9,534,197 9,534,197
Net Absorption 57,175 32,930
Vacancy Rate 6.1% 6.1%
Average Asking Net Rent $18.31 $17.70
Average Additional Rent $18.80 $18.86
AVAILABLE SUPPLY SPLIT
AVAILABLE SPACE OPTIONS
0 - 4k sf 4k - 10k sf 10k - 20k sf 20 - 50k sf 50k - 100k sf 100k sf +
# of units** 90 31 23 5 0 0
** Counting smallest divisible units in existing buildings and buildings which are under construction.
RECENT TRANSACTIONS Q2 2009
Suite Sq. Ft. Landlord
GROSS RENT & AVAILABILITY BY BUILDING CLASS 2601 3,141 Oxford Properties
Q2-09Office Submarket Dashboard: Yonge & Bloor
Tenant
*Office Inventory: For the purpose of this report, buildings with less than 10,000 sf of office space and buildings owned and occupied by the
government have not been included in the office inventory. There are 73 office buildings surveyed in this submarket.
TOP Office Lease Transactions by Size
Address
Number of units on the submarket by size brackets
TOP Office Sale Transactions by Price
N/A2 Bloor Street W
6,000,000 $45
Avail. Office Space Not Avail. Office Space Gross Rent
-5%
5%
15%
25%
35%
45%
55%
65%
0
100,000
200,000
300,000
400,000
500,000
600,000
700,000
800,000
900,000
Q1 2008 Q2 2008 Q3 2008 Q4 2008 Q1 2009 Q2 2009
Sq
uare
Feet
Direct Sublease Sublease as % of Total Available
Date Address Price Vendor Purchaser Size $/PSF
OCCUPIED SPACE BY MAJOR BUSINESS CATEGORIES
18 MONTH TREND
TOP PROJECTS UNDER CONSTRUCTION BY SIZE
Address Sq. Ft. Est. Com.
SUBMARKET CHARACTERISTICS
Source: Colliers International, Q2 2009
Anchor Tenant
No transactions took place during this period.
No construction took place during this period.
Developer
$41.69
$38.16
$29.42
-
1,000,000
2,000,000
3,000,000
4,000,000
5,000,000
6,000,000
$-
$5
$10
$15
$20
$25
$30
$35
$40
$45
Class A Class B Class C
Sq. Ft.
Gross Rent $/Sq. Ft.
Avail. Office Space Not Avail. Office Space Gross Rent
Note: Not available office space (blue) and available office space (yellow) add up to the total inventory of office space in the respective building class.
$17.70
6.1%
0.0%
1.0%
2.0%
3.0%
4.0%
5.0%
6.0%
7.0%
8.0%
9.0%
(15)
(11)
(7)
(3)
1
5
9
13
17
21
Q1 2008 Q2 2008 Q3 2008 Q4 2008 Q1 2009 Q2 2009
Vacancy Rate
Net Rent $/sf. / Absorption (10,000's)
Absorption Asking Net Rent Vacancy Rate
Manufacturing & Distribution
6%
Data,Publishing, Broadcasting Services 20%
Finance 31%
Professional Services 20%
Public Service & Private Sector
Services22%
Others1%
* Largest Midtown office submarket in terms of total inventory and most occupied space* Highest real estate costs on average in the Midtown market but still less than in the core* Multiple residential condominium developments will increase and diversify labour force* Limited parking, but great access to public transit and the northern part of the PATH system, Toronto's underground walkway* Proximity to multiple amenities and services add convenience for employees and customers
-5%
5%
15%
25%
35%
45%
55%
65%
0
100,000
200,000
300,000
400,000
500,000
600,000
700,000
800,000
900,000
Q1 2008 Q2 2008 Q3 2008 Q4 2008 Q1 2009 Q2 2009
Sq
uare
Feet
Direct Sublease Sublease as % of Total Available
Information contained herein has been obtained from the owners or other sources deemed reliable. We have no reason to doubt its accuracy but regret we
$41.69
$38.16
$29.42
-
1,000,000
2,000,000
3,000,000
4,000,000
5,000,000
6,000,000
$-
$5
$10
$15
$20
$25
$30
$35
$40
$45
Class A Class B Class C
Sq. Ft.
Gross Rent $/Sq. Ft.
Avail. Office Space Not Avail. Office Space Gross Rent
Note: Not available office space (blue) and available office space (yellow) add up to the total inventory of office space in the respective building class.
$17.70
6.1%
0.0%
1.0%
2.0%
3.0%
4.0%
5.0%
6.0%
7.0%
8.0%
9.0%
(15)
(11)
(7)
(3)
1
5
9
13
17
21
Q1 2008 Q2 2008 Q3 2008 Q4 2008 Q1 2009 Q2 2009
Vacancy Rate
Net Rent $/sf. / Absorption (10,000's)
Absorption Asking Net Rent Vacancy Rate
Manufacturing & Distribution
6%
Data,Publishing, Broadcasting Services 20%
Finance 31%
Professional Services 20%
Public Service & Private Sector
Services22%
Others1%
* Largest Midtown office submarket in terms of total inventory and most occupied space* Highest real estate costs on average in the Midtown market but still less than in the core* Multiple residential condominium developments will increase and diversify labour force* Limited parking, but great access to public transit and the northern part of the PATH system, Toronto's underground walkway* Proximity to multiple amenities and services add convenience for employees and customers
-5%
5%
15%
25%
35%
45%
55%
65%
0
100,000
200,000
300,000
400,000
500,000
600,000
700,000
800,000
900,000
Q1 2008 Q2 2008 Q3 2008 Q4 2008 Q1 2009 Q2 2009
Sq
uare
Feet
Direct Sublease Sublease as % of Total Available
Information contained herein has been obtained from the owners or other sources deemed reliable. We have no reason to doubt its accuracy but regret we cannot guarantee it. All properties subject to change or withdrawal without notice. All numbers reported use the most accurate information available at the time of publishing, however we acknowledge that there may be marginal changes over time as more accurate information becomes available. Colliers Macaulay Nicolls (Ontario) Inc., Brokerage.

MARKET INDICATORS MAP OF MARKET
Q1 2009 Q2 2009 Trend
Office Inventory* 44,829,290 45,307,826
Net Absorption (196,364) 319,955
Vacancy Rate 5.4% 6.2%
Average Asking Net Rent $15.10 $14.91
Average Additional Rent $10.94 $11.07
AVAILABLE SUPPLY SPLIT AVAILABLE SPACE OPTIONS
0 - 4k sf 4k - 10k sf 10k - 20k sf 20 - 50k sf 50k - 100k sf 100k sf +
# of units** 379 160 140 104 17 12
** Counting smallest divisible units in existing buildings and buildings which are under construction.
RECENT TRANSACTIONS Q2 2009
Suite Sq. Ft. Landlord
100 15,000 N/A
441 8,058 Investors Group
121 7,741 Euromart Realty
GROSS RENT & AVAILABILITY BY BUILDING CLASS
Date Address Price Vendor Purchaser Size $/PSF
5/27/20096700 Century
Avenue$7,000,000
A Private
Individual Sanyo Co. 56,607 $124
Regional Municipality Of Peel
TOP Office Sale Transactions by Price
Office Market Dashboard: GTA West
2550 Argentia Road N/A
*Office Inventory: For the purpose of this report, buildings with less than 10,000 sf of office space and buildings owned and occupied by the
government have not been included in the office inventory. There are 667 office buildings surveyed in this market.
TOP Office Lease Transactions by Size
Number of units on the regional market by size brackets
Q2-09
2 County Court Boulevard
Tenant
N/A
Address
2381 Bristol Circle
Available Direct79%
Available Sublease21%
Total Available Office Space: 15285487 sf
$28.77
$25.13 20,000,000
25,000,000
$30
$35
Not Avail. Office Space Avail. Office Space Gross Rent
0%
5%
10%
15%
20%
25%
30%
35%
40%
45%
50%
0
500,000
1,000,000
1,500,000
2,000,000
2,500,000
3,000,000
3,500,000
4,000,000
4,500,000
5,000,000
Q1 2008 Q2 2008 Q3 2008 Q4 2008 Q1 2009 Q2 2009
Sq
uare
Feet
Direct Sublease Sublease as % of Total Available
6/3/20092444 Hurontario
Street$3,500,000
CCSM
Incorporated P & S Ramlochan 13,300 $263
OCCUPIED SPACE BY MAJOR BUSINESS CATEGORIES
18 MONTH TREND
TOP PROJECTS UNDER CONSTRUCTION BY SIZE
Address Sq. Ft. Est. Com.
2465 Argentia
Road 250,000 Q1 2010
5550 Explorer 227,000 Q4 2010
2050 Derry Road
West125,700 Q1 2010
MARKET CHARACTERISTICS
Source: Colliers International, Q2 2009
N/A
BMO
Great West Life
HOOPP
Anchor TenantDeveloper
Shaw Communications Inc.
First Gulf Corporation & Sun Life
Available Direct79%
Available Sublease21%
Total Available Office Space: 15285487 sf
$28.77
$25.13
$20.75
-
5,000,000
10,000,000
15,000,000
20,000,000
25,000,000
$-
$5
$10
$15
$20
$25
$30
$35
Class A Class B Class C
Sq. Ft.
Gross Rent $/Sq. Ft.
Not Avail. Office Space Avail. Office Space Gross Rent
Note: Not available office space (blue) and available office space (yellow) add up to the total inventory of office space in the respective building class.
$14.91
6.2%
0.0%
1.0%
2.0%
3.0%
4.0%
5.0%
6.0%
7.0%
8.0%
9.0%
(3)
(1)
1
3
5
7
9
11
13
15
Q1 2008 Q2 2008 Q3 2008 Q4 2008 Q1 2009 Q2 2009
Vacancy Rate
Net Rent $/sf. / Absorption (100,000's)
Absorption Asking Net Rent Vacancy Rate
Manufacturing & Distribution
35%
Data,Publishing, Broadcasting Services 10%
Finance 19%
Professional Services 19%
Public Service & Private Sector
Services14%
Others3%
* Well connected to several 400 series highways (401, 427, 410, 409, 407) and Lester B. Pearson International Airport; close commute to Hamilton's John C. Munro International Airport which is Canada's #1 freight airport.* Lower real estate costs than in the core (City of Toronto)* Great proximity to diversified suburban labour pool which is educated with 10 universities and 11 colleges within commuting distance.* Market area is home to 24.6% of the GTA office space and 43.5% of industrial inventory supported by a population of approximately 1.463 million.* Area is home to many top 100 companies, including: Deloitte & Touche LLP, Morguard Investments, and the Canadian headquarters of the Ford Motor Company.
0%
5%
10%
15%
20%
25%
30%
35%
40%
45%
50%
0
500,000
1,000,000
1,500,000
2,000,000
2,500,000
3,000,000
3,500,000
4,000,000
4,500,000
5,000,000
Q1 2008 Q2 2008 Q3 2008 Q4 2008 Q1 2009 Q2 2009
Sq
uare
Feet
Direct Sublease Sublease as % of Total Available
Information contained herein has been obtained from the owners or other sources deemed reliable. We have no reason to doubt its accuracy but regret we cannot guarantee it. All properties subject to change or withdrawal without notice. All numbers reported use the most accurate information available at the time of publishing, however we acknowledge that there may be marginal changes over time as more accurate information becomes available. Colliers Macaulay
Available Direct79%
Available Sublease21%
Total Available Office Space: 15285487 sf
$28.77
$25.13
$20.75
-
5,000,000
10,000,000
15,000,000
20,000,000
25,000,000
$-
$5
$10
$15
$20
$25
$30
$35
Class A Class B Class C
Sq. Ft.
Gross Rent $/Sq. Ft.
Not Avail. Office Space Avail. Office Space Gross Rent
Note: Not available office space (blue) and available office space (yellow) add up to the total inventory of office space in the respective building class.
$14.91
6.2%
0.0%
1.0%
2.0%
3.0%
4.0%
5.0%
6.0%
7.0%
8.0%
9.0%
(3)
(1)
1
3
5
7
9
11
13
15
Q1 2008 Q2 2008 Q3 2008 Q4 2008 Q1 2009 Q2 2009
Vacancy Rate
Net Rent $/sf. / Absorption (100,000's)
Absorption Asking Net Rent Vacancy Rate
Manufacturing & Distribution
35%
Data,Publishing, Broadcasting Services 10%
Finance 19%
Professional Services 19%
Public Service & Private Sector
Services14%
Others3%
* Well connected to several 400 series highways (401, 427, 410, 409, 407) and Lester B. Pearson International Airport; close commute to Hamilton's John C. Munro International Airport which is Canada's #1 freight airport.* Lower real estate costs than in the core (City of Toronto)* Great proximity to diversified suburban labour pool which is educated with 10 universities and 11 colleges within commuting distance.* Market area is home to 24.6% of the GTA office space and 43.5% of industrial inventory supported by a population of approximately 1.463 million.* Area is home to many top 100 companies, including: Deloitte & Touche LLP, Morguard Investments, and the Canadian headquarters of the Ford Motor Company.
0%
5%
10%
15%
20%
25%
30%
35%
40%
45%
50%
0
500,000
1,000,000
1,500,000
2,000,000
2,500,000
3,000,000
3,500,000
4,000,000
4,500,000
5,000,000
Q1 2008 Q2 2008 Q3 2008 Q4 2008 Q1 2009 Q2 2009
Sq
uare
Feet
Direct Sublease Sublease as % of Total Available
Information contained herein has been obtained from the owners or other sources deemed reliable. We have no reason to doubt its accuracy but regret we cannot guarantee it. All properties subject to change or withdrawal without notice. All numbers reported use the most accurate information available at the time of publishing, however we acknowledge that there may be marginal changes over time as more accurate information becomes available. Colliers Macaulay Nicolls (Ontario) Inc., Brokerage.
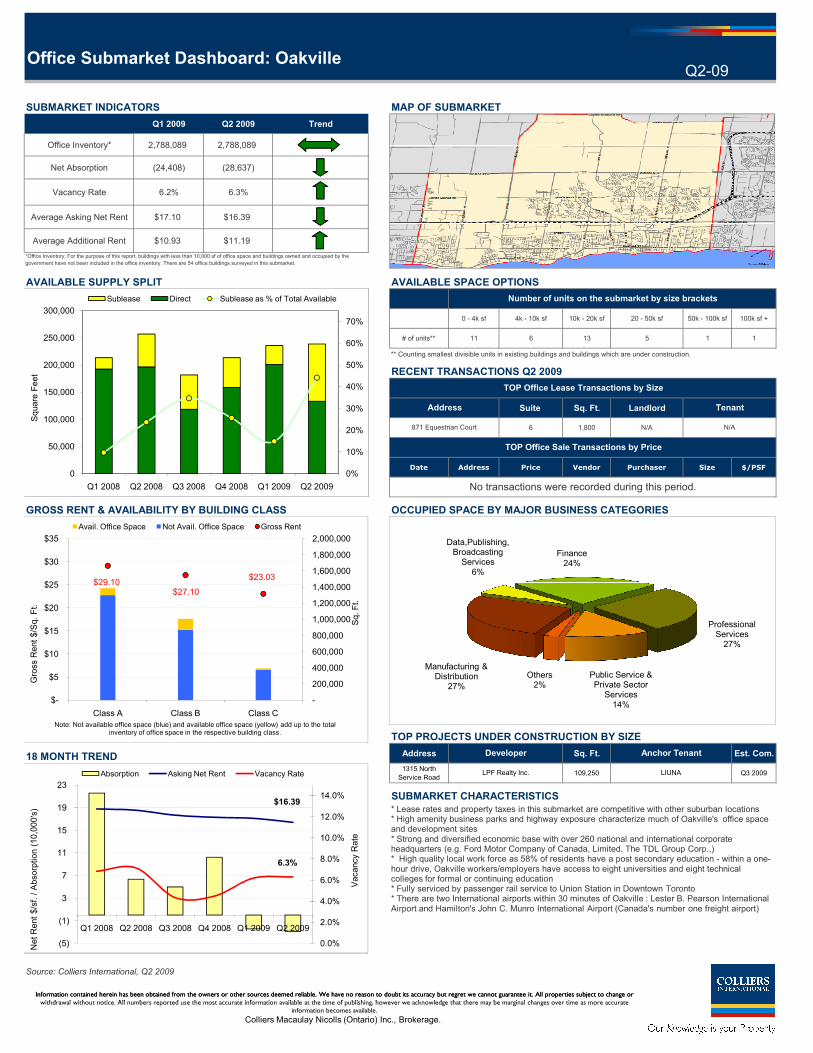
SUBMARKET INDICATORS MAP OF SUBMARKET
Q1 2009 Q2 2009 Trend
Office Inventory* 2,788,089 2,788,089
Net Absorption (24,408) (28,637)
Vacancy Rate 6.2% 6.3%
Average Asking Net Rent $17.10 $16.39
Average Additional Rent $10.93 $11.19
AVAILABLE SUPPLY SPLIT AVAILABLE SPACE OPTIONS
0 - 4k sf 4k - 10k sf 10k - 20k sf 20 - 50k sf 50k - 100k sf 100k sf +
# of units** 11 6 13 5 1 1
** Counting smallest divisible units in existing buildings and buildings which are under construction.
RECENT TRANSACTIONS Q2 2009
Suite Sq. Ft. Landlord
6 1,800 N/A
Date Address Price Vendor Purchaser Size $/PSF
GROSS RENT & AVAILABILITY BY BUILDING CLASS OCCUPIED SPACE BY MAJOR BUSINESS CATEGORIES
TOP Office Sale Transactions by Price
N/A871 Equestrian Court
No transactions were recorded during this period.
Q2-09
Tenant
Number of units on the submarket by size brackets
Address
Office Submarket Dashboard: Oakville
*Office Inventory: For the purpose of this report, buildings with less than 10,000 sf of office space and buildings owned and occupied by the
government have not been included in the office inventory. There are 54 office buildings surveyed in this submarket.
TOP Office Lease Transactions by Size
0%
10%
20%
30%
40%
50%
60%
70%
0
50,000
100,000
150,000
200,000
250,000
300,000
Q1 2008 Q2 2008 Q3 2008 Q4 2008 Q1 2009 Q2 2009
Square Feet
Sublease Direct Sublease as % of Total Available
GROSS RENT & AVAILABILITY BY BUILDING CLASS OCCUPIED SPACE BY MAJOR BUSINESS CATEGORIES
TOP PROJECTS UNDER CONSTRUCTION BY SIZE
18 MONTH TREND Address Sq. Ft. Est. Com.
1315 North
Service Road109,250 Q3 2009
SUBMARKET CHARACTERISTICS
Source: Colliers International, Q2 2009
Anchor TenantDeveloper
LPF Realty Inc. LIUNA
$29.10 $27.10
$23.03
-
200,000
400,000
600,000
800,000
1,000,000
1,200,000
1,400,000
1,600,000
1,800,000
2,000,000
$-
$5
$10
$15
$20
$25
$30
$35
Class A Class B Class C
Sq. Ft.
Gross Rent $/Sq. Ft.
Avail. Office Space Not Avail. Office Space Gross Rent
Note: Not available office space (blue) and available office space (yellow) add up to the total inventory of office space in the respective building class.
$16.39
6.3%
0.0%
2.0%
4.0%
6.0%
8.0%
10.0%
12.0%
14.0%
(5)
(1)
3
7
11
15
19
23
Q1 2008 Q2 2008 Q3 2008 Q4 2008 Q1 2009 Q2 2009
Vacancy Rate
Net Rent $/sf. / Absorption (10,000's)
Absorption Asking Net Rent Vacancy Rate
Manufacturing & Distribution
27%
Data,Publishing, Broadcasting Services
6%
Finance 24%
Professional Services 27%
Public Service & Private Sector
Services14%
Others2%
* Lease rates and property taxes in this submarket are competitive with other suburban locations* High amenity business parks and highway exposure characterize much of Oakville's office space and development sites* Strong and diversified economic base with over 260 national and international corporate headquarters (e.g. Ford Motor Company of Canada, Limited, The TDL Group Corp.,)* High quality local work force as 58% of residents have a post secondary education - within a one-hour drive, Oakville workers/employers have access to eight universities and eight technical colleges for formal or continuing education* Fully serviced by passenger rail service to Union Station in Downtown Toronto* There are two International airports within 30 minutes of Oakville : Lester B. Pearson International Airport and Hamilton's John C. Munro International Airport (Canada's number one freight airport)
0%
10%
20%
30%
40%
50%
60%
70%
0
50,000
100,000
150,000
200,000
250,000
300,000
Q1 2008 Q2 2008 Q3 2008 Q4 2008 Q1 2009 Q2 2009
Square Feet
Sublease Direct Sublease as % of Total Available
Information contained herein has been obtained from the owners or other sources deemed reliable. We have no reason to doubt its accuracy but regret we cannot guarantee it. All properties subject to change or
withdrawal without notice. All numbers reported use the most accurate information available at the time of publishing, however we acknowledge that there may be marginal changes over time as more accurate
information becomes available.
Colliers Macaulay Nicolls (Ontario) Inc., Brokerage.

SUBMARKET INDICATORS MAP OF SUBMARKET
Q1 2009 Q2 2009 Trend
Office Inventory* 3,728,208 3,728,208
Net Absorption 47,409 35,184
Vacancy Rate 6.5% 6.8%
Average Asking Net Rent $17.00 $17.07
Average Additional Rent $15.32 $15.20
AVAILABLE SUPPLY SPLIT
AVAILABLE SPACE OPTIONS
0 - 4k sf 4k - 10k sf 10k - 20k sf 20 - 50k sf 50k - 100k sf 100k sf +
# of units** 46 19 5 3 0 1
** Counting smallest divisible units in existing buildings and buildings which are under construction.
RECENT TRANSACTIONS Q2 2009
Suite Sq. Ft. Landlord Tenant
507 2,364 N/A
GROSS RENT & AVAILABILITY BY BUILDING CLASS
Calian Technology Services
Ltd.55 City Centre Drive
TOP Office Sale Transactions by Price
Q2-09
Number of units on the submarket by size brackets
Office Submarket Dashboard: Mississauga City
Centre
*Office Inventory: For the purpose of this report, buildings with less than 10,000 sf of office space and buildings owned and occupied by the
government have not been included in the office inventory. There are 36 office buildings surveyed in this submarket.
TOP Office Lease Transactions by Size
Address0%
2%
4%
6%
8%
10%
12%
14%
16%
18%
20%
0
50,000
100,000
150,000
200,000
250,000
300,000
350,000
400,000
450,000
500,000
Q1 2008 Q2 2008 Q3 2008 Q4 2008 Q1 2009 Q2 2009
Square Feet
Sublease Direct Sublease as % of Total Available
GROSS RENT & AVAILABILITY BY BUILDING CLASS
Date Address Price Vendor Purchaser Size $/PSF
OCCUPIED SPACE BY MAJOR BUSINESS CATEGORIES
18 MONTH TREND
TOP PROJECTS UNDER CONSTRUCTION BY SIZE
Address Sq. Ft. Est. Com.
SUBMARKET CHARACTERISTICS
Source: Colliers International, Q2 2009
Anchor TenantDeveloper
No transactions were recorded during this period
No construction took place during this period
$32.42
$29.36
$-
-
500,000
1,000,000
1,500,000
2,000,000
2,500,000
3,000,000
3,500,000
$-
$5
$10
$15
$20
$25
$30
$35
Class A Class B Class C
Sq. Ft.
Gross Rent $/Sq. Ft.
Avail. Office Space Not Avail. Office Space Gross Rent
Note: Not available office space (blue) and available office space (yellow) add up to the total inventory of office space in the respective building class.
$17.07
6.8%
0.0%
2.0%
4.0%
6.0%
8.0%
10.0%
(2)
-
2
4
6
8
10
12
14
16
18
20
Q1 2008 Q2 2008 Q3 2008 Q4 2008 Q1 2009 Q2 2009
Vacancy Rate
Net Rent $/sf. / Absorption (10,000's)
Absorption Asking Net Rent Vacancy Rate
Manufacturing & Distribution
15%
Data,Publishing, Broadcasting Services
4%
Finance 35%
Professional Services 27%
Public Service & Private Sector
Services18%
Others1%
* This submarket represents the centre of the City of Mississauga where high urban density isencouraged* Well connected to Highway 400 series and Lester B. Pearson International Airport* Availability of highway exposure sites* Lower real estate costs than in the core (City of Toronto)* Great proximity to diversified labour pool which is fueled by multiple residential condominumdevelopments e.g. Parkside Village by Amacon Developments* Top 10 Employers are Baxter Corporation, Deloitte & Touche LLP, E D S Canada, EdulinxCanada Corporation, Morguard Investments, Personal Insurance Company of Canada/CertasDirect Insurance Company, Praxair Canada Inc., PricewaterhouseCoopers LLP, QuantumManagement Services Ltd. and Symcor Inc.
0%
2%
4%
6%
8%
10%
12%
14%
16%
18%
20%
0
50,000
100,000
150,000
200,000
250,000
300,000
350,000
400,000
450,000
500,000
Q1 2008 Q2 2008 Q3 2008 Q4 2008 Q1 2009 Q2 2009
Square Feet
Sublease Direct Sublease as % of Total Available
Information contained herein has been obtained from the owners or other sources deemed reliable. We have no reason to doubt its accuracy but regret we
$32.42
$29.36
$-
-
500,000
1,000,000
1,500,000
2,000,000
2,500,000
3,000,000
3,500,000
$-
$5
$10
$15
$20
$25
$30
$35
Class A Class B Class C
Sq. Ft.
Gross Rent $/Sq. Ft.
Avail. Office Space Not Avail. Office Space Gross Rent
Note: Not available office space (blue) and available office space (yellow) add up to the total inventory of office space in the respective building class.
$17.07
6.8%
0.0%
2.0%
4.0%
6.0%
8.0%
10.0%
(2)
-
2
4
6
8
10
12
14
16
18
20
Q1 2008 Q2 2008 Q3 2008 Q4 2008 Q1 2009 Q2 2009
Vacancy Rate
Net Rent $/sf. / Absorption (10,000's)
Absorption Asking Net Rent Vacancy Rate
Manufacturing & Distribution
15%
Data,Publishing, Broadcasting Services
4%
Finance 35%
Professional Services 27%
Public Service & Private Sector
Services18%
Others1%
* This submarket represents the centre of the City of Mississauga where high urban density isencouraged* Well connected to Highway 400 series and Lester B. Pearson International Airport* Availability of highway exposure sites* Lower real estate costs than in the core (City of Toronto)* Great proximity to diversified labour pool which is fueled by multiple residential condominumdevelopments e.g. Parkside Village by Amacon Developments* Top 10 Employers are Baxter Corporation, Deloitte & Touche LLP, E D S Canada, EdulinxCanada Corporation, Morguard Investments, Personal Insurance Company of Canada/CertasDirect Insurance Company, Praxair Canada Inc., PricewaterhouseCoopers LLP, QuantumManagement Services Ltd. and Symcor Inc.
0%
2%
4%
6%
8%
10%
12%
14%
16%
18%
20%
0
50,000
100,000
150,000
200,000
250,000
300,000
350,000
400,000
450,000
500,000
Q1 2008 Q2 2008 Q3 2008 Q4 2008 Q1 2009 Q2 2009
Square Feet
Sublease Direct Sublease as % of Total Available
Information contained herein has been obtained from the owners or other sources deemed reliable. We have no reason to doubt its accuracy but regret we cannot guarantee it. All properties subject to change or withdrawal without notice. All numbers reported use the most accurate information available at the time of publishing, however we acknowledge that there may be marginal changes over time as more accurate information becomes available. Colliers Macaulay Nicolls (Ontario) Inc., Brokerage.

SUBMARKET INDICATORS MAP OF SUBMARKET
Q1 2009 Q2 2009 Trend AVAILABLE SPACE OPTIONS
Office Inventory* 6,417,363 6,522,755
Net Absorption 102,116 60,606
Vacancy Rate 3.2% 3.6%
Average Asking Net Rent $16.25 $15.50 0 - 4k sf
Average Additional Rent $10.99 $10.99 4k - 10k sf
10k - 20k sf
AVAILABLE SUPPLY SPLIT 20 - 50k sf
50k - 100k sf
100k sf +
RECENT TRANSACTIONS Q2 2009
Suite Sq. Ft. Landlord
121 7,741 Euromart Realty
101 3,086 N/A
Date Address Price Vendor Purchaser Size $/PSF
5/27/20096700 Century
Avenue$7,000,000
A Private
Individual Sanyo Co. 56,607 $124
GROSS RENT & AVAILABILITY BY BUILDING CLASS OCCUPIED SPACE BY MAJOR BUSINESS CATEGORIES
TOP Office Sale Transactions by Price
Office Submarket Dashboard: Meadowvale
*Office Inventory: For the purpose of this report, buildings with less than 10,000 sf of office space and buildings owned and occupied by the
government have not been included in the office inventory. There are 90 office buildings surveyed in this submarket.
TOP Office Lease Transactions by Size
Q2-09
** Counting smallest divisible units in existing
buildings and buildings under construction.
Address Tenant
Number of units
on the
submarket by
size brackets
N/A
6790 Century Avenue
27
23
13
44
2550 Argentia Road
# of units**
3
5
N/A
3,500,000 $35
Avail. Office Space Not Avail. Office Space Gross Rent
0%
10%
20%
30%
40%
50%
60%
70%
0
50,000
100,000
150,000
200,000
250,000
300,000
350,000
400,000
450,000
500,000
Q1 2008 Q2 2008 Q3 2008 Q4 2008 Q1 2009 Q2 2009
Square Feet
Sublease Direct Sublease as % of Total Available
18 MONTH TREND
TOP PROJECTS UNDER CONSTRUCTION BY SIZE
Address Developer Sq. Ft. Anchor Tenant Est. Com.2465 Argentia
Road 250,000 Q1 2010
2050 Derry Road
West125,700 Q1 2010
2100 Derry Road
West107,445 Q2 2009
SUBMARKET CHARACTERISTICS
Source: Colliers International, Q2 2009
Volvo
First Gulf Corporation & Sun Life
Shaw Communications Inc.
Great West Life
Great West Life
BMO
$24.85 $27.58
$29.91
-
500,000
1,000,000
1,500,000
2,000,000
2,500,000
3,000,000
3,500,000
$-
$5
$10
$15
$20
$25
$30
$35
Class A Class B Class C
Sq. Ft.
Gross Rent $/Sq. Ft.
Avail. Office Space Not Avail. Office Space Gross Rent
Note: Not available office space (blue) and available office space (yellow) add up to the total inventory of office space in the respective building class.
$15.50
3.6%
-5.0%
-3.0%
-1.0%
1.0%
3.0%
5.0%
7.0%
(3)
(1)
1
3
5
7
9
11
13
15
17
19
Q1 2008 Q2 2008 Q3 2008 Q4 2008 Q1 2009 Q2 2009
Vacancy Rate
Net Rent $/sf. / Absorption (10,000's)
Absorption Asking Net Rent Vacancy Rate
Manufacturing & Distribution
55%
Data,Publishing, Broadcasting Services
5%
Finance 20%
Professional Services 13%
Public Service & Private Sector
Services6%
Others1%
* Well connected to Highway 400 series and close to international airport* Great proximity to labour pool* Numerous major corporations have recently located their offices, factories and research & development facilities into this submarket (e.g. GE Canada Inc., Microsoft, RBC Financial Group)* Lower commercial tax rates than in the core (City of Toronto)
0%
10%
20%
30%
40%
50%
60%
70%
0
50,000
100,000
150,000
200,000
250,000
300,000
350,000
400,000
450,000
500,000
Q1 2008 Q2 2008 Q3 2008 Q4 2008 Q1 2009 Q2 2009
Square Feet
Sublease Direct Sublease as % of Total Available
Information contained herein has been obtained from the owners or other sources deemed reliable. We have no reason to doubt its accuracy but regret we
$24.85 $27.58
$29.91
-
500,000
1,000,000
1,500,000
2,000,000
2,500,000
3,000,000
3,500,000
$-
$5
$10
$15
$20
$25
$30
$35
Class A Class B Class C
Sq. Ft.
Gross Rent $/Sq. Ft.
Avail. Office Space Not Avail. Office Space Gross Rent
Note: Not available office space (blue) and available office space (yellow) add up to the total inventory of office space in the respective building class.
$15.50
3.6%
-5.0%
-3.0%
-1.0%
1.0%
3.0%
5.0%
7.0%
(3)
(1)
1
3
5
7
9
11
13
15
17
19
Q1 2008 Q2 2008 Q3 2008 Q4 2008 Q1 2009 Q2 2009
Vacancy Rate
Net Rent $/sf. / Absorption (10,000's)
Absorption Asking Net Rent Vacancy Rate
Manufacturing & Distribution
55%
Data,Publishing, Broadcasting Services
5%
Finance 20%
Professional Services 13%
Public Service & Private Sector
Services6%
Others1%
* Well connected to Highway 400 series and close to international airport* Great proximity to labour pool* Numerous major corporations have recently located their offices, factories and research & development facilities into this submarket (e.g. GE Canada Inc., Microsoft, RBC Financial Group)* Lower commercial tax rates than in the core (City of Toronto)
0%
10%
20%
30%
40%
50%
60%
70%
0
50,000
100,000
150,000
200,000
250,000
300,000
350,000
400,000
450,000
500,000
Q1 2008 Q2 2008 Q3 2008 Q4 2008 Q1 2009 Q2 2009
Square Feet
Sublease Direct Sublease as % of Total Available
Information contained herein has been obtained from the owners or other sources deemed reliable. We have no reason to doubt its accuracy but regret we cannot guarantee it. All properties subject to change or withdrawal without notice. All numbers reported use the most accurate information available at the time of publishing, however we acknowledge that there may be marginal changes over time as more accurate information becomes available. Colliers Macaulay Nicolls (Ontario) Inc., Brokerage.

SUBMARKET INDICATORS MAP OF SUBMARKET
Q1 2009 Q2 2009 Trend AVAILABLE SPACE OPTIONS
Office Inventory* 3,191,959 3,191,959
Net Absorption 65,166 (19,539)
Vacancy Rate 1.8% 2.3%
Average Asking Net Rent $13.79 $13.91 0 - 4k sf
Average Additional Rent $10.69 $11.41 4k - 10k sf
10k - 20k sf
AVAILABLE SUPPLY SPLIT 20 - 50k sf
50k - 100k sf
100k sf +
RECENT TRANSACTIONS Q2 2009
Suite Sq. Ft. Landlord
101 4,540 Crown Realty Partners
0 3,154 N/A
B 2,950 Atlantis Realty
GROSS RENT & AVAILABILITY BY BUILDING CLASS Date Address Price Vendor Purchaser Size $/PSF
Q2-09
Tenant
Reliance Electric
Mitel Corporation135 Matheson Boulevard W
Office Submarket Dashboard:
Hurontario & Hwy 401
Number of units
on the
submarket by
size brackets
# of units**
2
5
19
5
13
18
TOP Office Sale Transactions by Price
N/A
No transactions were recorded during this period.
*Office Inventory: For the purpose of this report, buildings with less than 10,000 sf of office space and buildings owned and occupied by the
government have not been included in the office inventory. There are 36 office buildings surveyed in this submarket.
TOP Office Lease Transactions by Size
Address
** Counting smallest divisible units in existing
buildings and buildings under construction.
244 Britannia Road E
440 Britannia Road E Available Direct
42%
Available Sublease58%
Total Available Office Space: 15285487 sf
$25.52 2,500,000 $30
Avail. Office Space Not Avail. Office Space Gross Rent
0%
10%
20%
30%
40%
50%
60%
70%
0
50,000
100,000
150,000
200,000
250,000
Q1 2008 Q2 2008 Q3 2008 Q4 2008 Q1 2009 Q2 2009
Square Feet
Sublease Direct Sublease as % of Total Available
OCCUPIED SPACE BY MAJOR BUSINESS CATEGORIES
18 MONTH TREND
TOP PROJECTS UNDER CONSTRUCTION BY SIZE
Address Sq. Ft. Est. Com.
430 Courtneypark
Dr E48,439 TBD
SUBMARKET CHARACTERISTICS
Source: Colliers International, Q2 2009
Hallmark Design-Build Typhon Group Ltd
Developer Anchor Tenant
Available Direct42%
Available Sublease58%
Total Available Office Space: 15285487 sf
$25.52
$25.24
$20.00
-
500,000
1,000,000
1,500,000
2,000,000
2,500,000
$-
$5
$10
$15
$20
$25
$30
Class A Class B Class C
Sq. Ft.
Gross Rent $/Sq. Ft.
Avail. Office Space Not Avail. Office Space Gross Rent
Note: Not available office space (blue) and available office space (yellow) add up to the total inventory of office space in the respective building class.
$13.91
2.3%
-5.0%
-3.0%
-1.0%
1.0%
3.0%
5.0%
7.0%
(4)
(2)
-
2
4
6
8
10
12
14
Q1 2008 Q2 2008 Q3 2008 Q4 2008 Q1 2009 Q2 2009
Vacancy Rate
Net Rent $/sf. / Absorption (10,000's)
Absorption Asking Net Rent Vacancy Rate
Manufacturing & Distribution
44%
Data,Publishing, Broadcasting Services
3% Finance 30%
Professional Services
7%Public Service & Private Sector
Services12%
Others4%
* Submarket is part of a diverse business community which includes many Fortune 500 headquarters and leading clusters in aerospace, automotive, biomedical, financial services, and information & communications technologies.* Provides companies with solid infrastructure in the heart of a major air, road and rail network.* Well educated talent pool, there are 10 universities and 11 colleges within commuting distance.
* Lower commercial tax rates than in the core (City of Toronto), competitive lease rates and land prices contribute to a business-friendly environment.
0%
10%
20%
30%
40%
50%
60%
70%
0
50,000
100,000
150,000
200,000
250,000
Q1 2008 Q2 2008 Q3 2008 Q4 2008 Q1 2009 Q2 2009
Square Feet
Sublease Direct Sublease as % of Total Available
Information contained herein has been obtained from the owners or other sources deemed reliable. We have no reason to doubt its accuracy but regret we cannot guarantee it. All properties subject to change or withdrawal without notice. All numbers reported use the most accurate information available at the time of publishing, however we acknowledge that there may be marginal changes over time as more accurate information becomes available. Colliers Macaulay Nicolls (Ontario) Inc., Brokerage.

SUBMARKET INDICATORS MAP OF SUBMARKET
Q1 2009 Q2 2009 Trend
Office Inventory* 1,747,724 1,747,724
Net Absorption 7,979 4,402
Vacancy Rate 6.2% 5.9%
Average Asking Net Rent $10.99 $12.41
Average Additional Rent $11.67 $12.06
AVAILABLE SUPPLY SPLIT AVAILABLE SPACE OPTIONS
0 - 4k sf 4k - 10k sf 10k - 20k sf 20 - 50k sf 50k - 100k sf 100k sf +
# of units** 23 7 5 0 0 0
** Counting smallest divisible units in existing buildings and buildings which are under construction.
RECENT TRANSACTIONS Q2 2009
Suite Sq. Ft. Landlord
Date Address Price Vendor Purchaser Size $/PSF
GROSS RENT & AVAILABILITY BY BUILDING CLASS 6/3/20092444
Hurontario St $3,500,000
CCSM
Incorporated P & S Ramlochan 13,300 $263
OCCUPIED SPACE BY MAJOR BUSINESS CATEGORIES
Office Submarket Dashboard: Cooksville
*Office Inventory: For the purpose of this report, buildings with less than 10,000 sf of office space and buildings owned and occupied by the
government have not been included in the office inventory. There are 33 office buildings surveyed in this submarket.
TOP Office Lease Transactions by Size
Address Tenant
TOP Office Sale Transactions by Price
Q2-09
No transactions were recorded during this period.
Number of units on the submarket by size brackets
1,000,000 $35
Avail. Office Space Not Avail. Office Space Gross Rent
0%
1%
2%
3%
4%
5%
6%
7%
8%
9%
10%
0
50,000
100,000
150,000
200,000
250,000
Q1 2008 Q2 2008 Q3 2008 Q4 2008 Q1 2009 Q2 2009
Square Feet
Sublease Direct Sublease as % of Total Available
OCCUPIED SPACE BY MAJOR BUSINESS CATEGORIES
18 MONTH TREND TOP PROJECTS UNDER CONSTRUCTION BY SIZE
Address Sq. Ft. Est. Com.
SUBMARKET CHARACTERISTICS
Source: Colliers International, Q2 2009
Developer Anchor Tenant
No construction took place during this period.
$29.14 $24.52
$18.00
-
100,000
200,000
300,000
400,000
500,000
600,000
700,000
800,000
900,000
1,000,000
$-
$5
$10
$15
$20
$25
$30
$35
Class A Class B Class C
Sq. Ft.
Gross Rent $/Sq. Ft.
Avail. Office Space Not Avail. Office Space Gross Rent
Note: Not available office space (blue) and available office space (yellow) add up to the total inventory of office space in the respective building class.
$12.41
5.9%
-5.0%
-3.0%
-1.0%
1.0%
3.0%
5.0%
7.0%
9.0%
11.0%
13.0%
15.0%
(3)
(1)
1
3
5
7
9
11
13
Q1 2008 Q2 2008 Q3 2008 Q4 2008 Q1 2009 Q2 2009
Vacancy Rate
Net Rent $/sf. / Absorption (10,000's)
Absorption Asking Net Rent Vacancy Rate
Manufacturing & Distribution
42%
Data,Publishing, Broadcasting Services
2%
Finance 9%
Professional Services 16%
Public Service & Private Sector
Services23%
Others8%
* This submarket represents the southern portion centre of the City of Mississauga where high urban density is encouraged
* Largely residential area with extensive park and golf course networks
* Well connected to Highway 400 series and Lester B. Pearson International Airport
* Availability of highway exposure sites
* Lower real estate costs than in the core (City of Toronto)
* Great proximity to diversified labour pool which is fueled by multiple residential condominum developments
0%
1%
2%
3%
4%
5%
6%
7%
8%
9%
10%
0
50,000
100,000
150,000
200,000
250,000
Q1 2008 Q2 2008 Q3 2008 Q4 2008 Q1 2009 Q2 2009
Square Feet
Sublease Direct Sublease as % of Total Available
Information contained herein has been obtained from the owners or other sources deemed reliable. We have no reason to doubt its accuracy but regret we
$29.14 $24.52
$18.00
-
100,000
200,000
300,000
400,000
500,000
600,000
700,000
800,000
900,000
1,000,000
$-
$5
$10
$15
$20
$25
$30
$35
Class A Class B Class C
Sq. Ft.
Gross Rent $/Sq. Ft.
Avail. Office Space Not Avail. Office Space Gross Rent
Note: Not available office space (blue) and available office space (yellow) add up to the total inventory of office space in the respective building class.
$12.41
5.9%
-5.0%
-3.0%
-1.0%
1.0%
3.0%
5.0%
7.0%
9.0%
11.0%
13.0%
15.0%
(3)
(1)
1
3
5
7
9
11
13
Q1 2008 Q2 2008 Q3 2008 Q4 2008 Q1 2009 Q2 2009
Vacancy Rate
Net Rent $/sf. / Absorption (10,000's)
Absorption Asking Net Rent Vacancy Rate
Manufacturing & Distribution
42%
Data,Publishing, Broadcasting Services
2%
Finance 9%
Professional Services 16%
Public Service & Private Sector
Services23%
Others8%
* This submarket represents the southern portion centre of the City of Mississauga where high urban density is encouraged
* Largely residential area with extensive park and golf course networks
* Well connected to Highway 400 series and Lester B. Pearson International Airport
* Availability of highway exposure sites
* Lower real estate costs than in the core (City of Toronto)
* Great proximity to diversified labour pool which is fueled by multiple residential condominum developments
0%
1%
2%
3%
4%
5%
6%
7%
8%
9%
10%
0
50,000
100,000
150,000
200,000
250,000
Q1 2008 Q2 2008 Q3 2008 Q4 2008 Q1 2009 Q2 2009
Square Feet
Sublease Direct Sublease as % of Total Available
Information contained herein has been obtained from the owners or other sources deemed reliable. We have no reason to doubt its accuracy but regret we cannot guarantee it. All properties subject to change or withdrawal without notice. All numbers reported use the most accurate information available at the time of publishing, however we acknowledge that there may be marginal changes over time as more accurate information becomes available. Colliers Macaulay Nicolls (Ontario) Inc., Brokerage.

SUBMARKET INDICATORS MAP OF SUBMARKET
Q1 2009 Q2 2009 Trend
Office Inventory* 4,263,537 4,263,537
Net Absorption (82,610) 9,986
Vacancy Rate 7.5% 8.5%
Average Asking Net Rent $15.18 $14.64
Average Additional Rent $9.57 $9.36
AVAILABLE SUPPLY SPLIT
AVAILABLE SPACE OPTIONS
0 - 4k sf 4k - 10k sf 10k - 20k sf 20 - 50k sf 50k - 100k sf 100k sf +
# of units** 61 28 20 7 1 0
** Counting smallest divisible units in existing buildings and buildings which are under construction.
RECENT TRANSACTIONS Q2 2009
Suite Sq. Ft. Landlord Tenant
GROSS RENT & AVAILABILITY BY BUILDING CLASS
Date Address Price Vendor Purchaser Size $/PSF
*Office Inventory: For the purpose of this report, buildings with less than 10,000 sf of office space and buildings owned and occupied by the
government have not been included in the office inventory. There are 79 office buildings surveyed in this submarket.
TOP Office Lease Transactions by Size
Address
Number of units on the submarket by size brackets
No transactions were recorded during this period
Q2-09
TOP Office Sale Transactions by Price
Office Submarket Dashboard: Burlington
Not Avail. Office Space Avail. Office Space Gross Rent
0%
5%
10%
15%
20%
25%
30%
35%
40%
0
100,000
200,000
300,000
400,000
500,000
600,000
Q1 2008 Q2 2008 Q3 2008 Q4 2008 Q1 2009 Q2 2009
Square Feet
Sublease Direct Sublease as % of Total Available
Date Address Price Vendor Purchaser Size $/PSF
OCCUPIED SPACE BY MAJOR BUSINESS CATEGORIES
18 MONTH TREND TOP PROJECTS UNDER CONSTRUCTION BY SIZE
Address Sq. Ft. Est. Com.
SUBMARKET CHARACTERISTICS
Source: Colliers International, Q2 2009
No construction occurred during this period.
Developer Anchor Tenant
No transactions were recorded during this period$27.06
$20.76
$17.86
-
200,000
400,000
600,000
800,000
1,000,000
1,200,000
1,400,000
1,600,000
1,800,000
2,000,000
$-
$5
$10
$15
$20
$25
$30
Class A Class B Class C
Sq. Ft.
Gross Rent $/Sq. Ft.
Not Avail. Office Space Avail. Office Space Gross Rent
Note: Not available office space (blue) and available office space (yellow) add up to the total inventory of office space in the respective building class.
$14.64
8.5%
-5.0%
-3.0%
-1.0%
1.0%
3.0%
5.0%
7.0%
9.0%
(9)
(4)
1
6
11
16
Q1 2008 Q2 2008 Q3 2008 Q4 2008 Q1 2009 Q2 2009
Vacancy Rate
Net Rent $/sf. / Absorption (10,000's)
Absorption Asking Net Rent Vacancy Rate
Manufacturing & Distribution
31%
Data,Publishing, Broadcasting Services
6%Finance 20%
Professional Services 24%
Public Service & Private Sector
Services14%
Others5%
* Located at the hub of the Golden Horseshoe with easy major highway access and close proximity to Hamilton's John C. Munro International Airport (Canada's number one freight airport)* Burlington's economy is largely driven by both the financial and the automotive sector* Resilient local economy that employs a variety of talent* Local post secondary college and university resources (e.g. McMaster University) are within commuting distance* Many head office operations, but also a competitive location for back office operations
0%
5%
10%
15%
20%
25%
30%
35%
40%
0
100,000
200,000
300,000
400,000
500,000
600,000
Q1 2008 Q2 2008 Q3 2008 Q4 2008 Q1 2009 Q2 2009
Square Feet
Sublease Direct Sublease as % of Total Available
$27.06
$20.76
$17.86
-
200,000
400,000
600,000
800,000
1,000,000
1,200,000
1,400,000
1,600,000
1,800,000
2,000,000
$-
$5
$10
$15
$20
$25
$30
Class A Class B Class C
Sq. Ft.
Gross Rent $/Sq. Ft.
Not Avail. Office Space Avail. Office Space Gross Rent
Note: Not available office space (blue) and available office space (yellow) add up to the total inventory of office space in the respective building class.
$14.64
8.5%
-5.0%
-3.0%
-1.0%
1.0%
3.0%
5.0%
7.0%
9.0%
(9)
(4)
1
6
11
16
Q1 2008 Q2 2008 Q3 2008 Q4 2008 Q1 2009 Q2 2009
Vacancy Rate
Net Rent $/sf. / Absorption (10,000's)
Absorption Asking Net Rent Vacancy Rate
Manufacturing & Distribution
31%
Data,Publishing, Broadcasting Services
6%Finance 20%
Professional Services 24%
Public Service & Private Sector
Services14%
Others5%
* Located at the hub of the Golden Horseshoe with easy major highway access and close proximity to Hamilton's John C. Munro International Airport (Canada's number one freight airport)* Burlington's economy is largely driven by both the financial and the automotive sector* Resilient local economy that employs a variety of talent* Local post secondary college and university resources (e.g. McMaster University) are within commuting distance* Many head office operations, but also a competitive location for back office operations
0%
5%
10%
15%
20%
25%
30%
35%
40%
0
100,000
200,000
300,000
400,000
500,000
600,000
Q1 2008 Q2 2008 Q3 2008 Q4 2008 Q1 2009 Q2 2009
Square Feet
Sublease Direct Sublease as % of Total Available
Information contained herein has been obtained from the owners or other sources deemed reliable. We have no reason to doubt its accuracy but regret we cannot guarantee it. All properties subject to change or withdrawal without notice. All numbers reported use the most accurate information available at the time of publishing, however we acknowledge that there may be marginal changes over time as more accurate information becomes available. Colliers Macaulay Nicolls (Ontario) Inc., Brokerage.

SUBMARKET INDICATORS MAP OF SUBMARKET
Q1 2009 Q2 2009 Trend
Office Inventory* 2,299,507 2,299,507
Net Absorption 4,449 0
Vacancy Rate 0.8% 1.0%
Average Asking Net Rent $12.71 $11.96
Average Additional Rent $9.89 $10.12
AVAILABLE SUPPLY SPLIT AVAILABLE SPACE OPTIONS
0 - 4k sf 4k - 10k sf 10k - 20k sf 20 - 50k sf 50k - 100k sf 100k sf +
# of units** 17 10 1 2 1 1
** Counting smallest divisible units in existing buildings and buildings which are under construction.
RECENT TRANSACTIONS Q2 2009
Suite Sq. Ft. Landlord
441 8,058 N/A
601 2,486 N/A
405 1,067 Investors Group
GROSS RENT & AVAILABILITY BY BUILDING CLASS
Date Address Price Vendor Purchaser Size $/PSF
TOP Office Sale Transactions by Price
2 County Court Boulevard
201 County Court Boulevard
Office Submarket Dashboard: Brampton
Address Tenant
Number of units on the submarket by size brackets
*Office Inventory: For the purpose of this report, buildings with less than 10,000 sf of office space and buildings owned and occupied by the
government have not been included in the office inventory. There are 26 office buildings surveyed in this submarket.
TOP Office Lease Transactions by Size
Ontario Realty Corporation
Q2-09
TQS Logistics
Regional Municipality Of Peel2 County Court Boulevard
Available Direct69%
Available Sublease31%
Total Available Office Space: 15285487 sf
1,600,000 $30
Avail. Office Space Not Avail. Office Space Gross Rent
0%
10%
20%
30%
40%
50%
60%
70%
80%
90%
100%
0
10,000
20,000
30,000
40,000
50,000
60,000
70,000
Q1 2008 Q2 2008 Q3 2008 Q4 2008 Q1 2009 Q2 2009
Square Feet
Sublease Direct Sublease as % of Total Available
Date Address Price Vendor Purchaser Size $/PSF
OCCUPIED SPACE BY MAJOR BUSINESS CATEGORIES
18 MONTH TREND
TOP PROJECTS UNDER CONSTRUCTION BY SIZE
Address Sq. Ft. Est. Com.
7900 Hurontario
Street40,000 Q2 2009
SUBMARKET CHARACTERISTICS
Source: Colliers International, Q2 2009
Developer Anchor Tenant
No transactions were recorded during this period.
Private Company N/A
Available Direct69%
Available Sublease31%
Total Available Office Space: 15285487 sf
$27.26
$18.14
$19.21
-
200,000
400,000
600,000
800,000
1,000,000
1,200,000
1,400,000
1,600,000
$-
$5
$10
$15
$20
$25
$30
Class A Class B Class C
Sq. Ft.
Gross Rent $/Sq. Ft.
Avail. Office Space Not Avail. Office Space Gross Rent
Note: Not available office space (blue) and available office space (yellow) add up to the total inventory of office space in the respective building class.
$11.96
1.0%
-5.0%
-4.0%
-3.0%
-2.0%
-1.0%
0.0%
1.0%
2.0%
3.0%
4.0%
5.0%
(3)
(1)
1
3
5
7
9
11
13
15
Q1 2008 Q2 2008 Q3 2008 Q4 2008 Q1 2009 Q2 2009
Vacancy Rate
Net Rent $/sf. / Absorption (10,000's)
Absorption Asking Net Rent Vacancy Rate
Manufacturing & Distribution
19%
Data,Publishing, Broadcasting Services 51%
Finance 3%
Professional Services
4%Public Service & Private Sector
Services23%
Others0%
* Small office submarket in size with a traditionally low vacancy rate.* 3rd largest population agglomeration in the Greater Toronto Area.* Sectors of strength inlcude automotive, food&beverage, telecommunications, advanced machinery & equipment and consumer packaging.* This submarket offers immediate highway access (Hwy 400-series) and proximity to airport.* Brampton Transit's new project AcceleRide will bring rapid transit services to the community and connect with surrounding urban centres and commuter links.* Local post secondary college: Sheridan Institute of Technology and Advanced Learning - 17 colleges and universities within a 80km radius.* Lower commercial tax rates than in the core (City of Toronto), competitive lease rates and land prices contribute to a business-friendly environment.* There is a fair amount of room for growth - many opportunities for design-build projects.
0%
10%
20%
30%
40%
50%
60%
70%
80%
90%
100%
0
10,000
20,000
30,000
40,000
50,000
60,000
70,000
Q1 2008 Q2 2008 Q3 2008 Q4 2008 Q1 2009 Q2 2009
Square Feet
Sublease Direct Sublease as % of Total Available
Information contained herein has been obtained from the owners or other sources deemed reliable. We have no reason to doubt its accuracy but regret we
Available Direct69%
Available Sublease31%
Total Available Office Space: 15285487 sf
$27.26
$18.14
$19.21
-
200,000
400,000
600,000
800,000
1,000,000
1,200,000
1,400,000
1,600,000
$-
$5
$10
$15
$20
$25
$30
Class A Class B Class C
Sq. Ft.
Gross Rent $/Sq. Ft.
Avail. Office Space Not Avail. Office Space Gross Rent
Note: Not available office space (blue) and available office space (yellow) add up to the total inventory of office space in the respective building class.
$11.96
1.0%
-5.0%
-4.0%
-3.0%
-2.0%
-1.0%
0.0%
1.0%
2.0%
3.0%
4.0%
5.0%
(3)
(1)
1
3
5
7
9
11
13
15
Q1 2008 Q2 2008 Q3 2008 Q4 2008 Q1 2009 Q2 2009
Vacancy Rate
Net Rent $/sf. / Absorption (10,000's)
Absorption Asking Net Rent Vacancy Rate
Manufacturing & Distribution
19%
Data,Publishing, Broadcasting Services 51%
Finance 3%
Professional Services
4%Public Service & Private Sector
Services23%
Others0%
* Small office submarket in size with a traditionally low vacancy rate.* 3rd largest population agglomeration in the Greater Toronto Area.* Sectors of strength inlcude automotive, food&beverage, telecommunications, advanced machinery & equipment and consumer packaging.* This submarket offers immediate highway access (Hwy 400-series) and proximity to airport.* Brampton Transit's new project AcceleRide will bring rapid transit services to the community and connect with surrounding urban centres and commuter links.* Local post secondary college: Sheridan Institute of Technology and Advanced Learning - 17 colleges and universities within a 80km radius.* Lower commercial tax rates than in the core (City of Toronto), competitive lease rates and land prices contribute to a business-friendly environment.* There is a fair amount of room for growth - many opportunities for design-build projects.
0%
10%
20%
30%
40%
50%
60%
70%
80%
90%
100%
0
10,000
20,000
30,000
40,000
50,000
60,000
70,000
Q1 2008 Q2 2008 Q3 2008 Q4 2008 Q1 2009 Q2 2009
Square Feet
Sublease Direct Sublease as % of Total Available
Information contained herein has been obtained from the owners or other sources deemed reliable. We have no reason to doubt its accuracy but regret we cannot guarantee it. All properties subject to change or withdrawal without notice. All numbers reported use the most accurate information available at the time of publishing, however we acknowledge that there may be marginal changes over time as more accurate information becomes available. Colliers Macaulay Nicolls (Ontario) Inc., Brokerage.

SUBMARKET INDICATORS MAP OF SUBMARKET
Q1 2009 Q2 2009 Trend AVAILABLE SPACE OPTIONS
Office Inventory* 4,561,364 4,561,364
Net Absorption (39,165) 41,821
Vacancy Rate 4.9% 4.7%
Average Asking Net Rent $12.24 $12.50 0 - 4k sf
Average Additional Rent $9.99 $10.53 4k - 10k sf
10k - 20k sf
AVAILABLE SUPPLY SPLIT 20 - 50k sf
50k - 100k sf
100k sf +
RECENT TRANSACTIONS Q2 2009
Suite Sq. Ft. Landlord
612 1,241 Oxford Properties
Date Address Price Vendor Purchaser Size $/PSF
OCCUPIED SPACE BY MAJOR BUSINESS CATEGORIES
GROSS RENT & AVAILABILITY BY BUILDING CLASS
Address
** Counting smallest divisible units in existing
buildings and buildings under construction.
N/A3300 Bloor Street W
Q2-09
Tenant
TOP Office Sale Transactions by Price
No transactions were recorded during this period.
Office Submarket Dashboard:
Highway 427/Bloor-Islington
*Office Inventory: For the purpose of this report, buildings with less than 10,000 sf of office space and buildings owned and occupied by the
government have not been included in the office inventory. There are 70 office buildings surveyed in this submarket.
TOP Office Lease Transactions by Size
Number of units
on the
submarket by
size brackets
# of units**
1
0
2
27
28
70
Available Direct72%
Available Sublease28%
Total Available Office Space: 15285487 sf
2,500,000 $35
Avail. Office Space Not Avail. Office Space Gross RentData,Publishing,
Finance
0%
5%
10%
15%
20%
25%
30%
35%
40%
45%
50%
0
50,000
100,000
150,000
200,000
250,000
300,000
350,000
400,000
Q1 2008 Q2 2008 Q3 2008 Q4 2008 Q1 2009 Q2 2009
Square Feet
Sublease Direct Sublease as % of Total Available
18 MONTH TREND Address Sq. Ft. Est. Com.
SUBMARKET CHARACTERISTICS
Source: Colliers International, Q2 2009
TOP PROJECTS UNDER CONSTRUCTION BY SIZE
No construction took place during this period.
Developer Anchor Tenant
Available Direct72%
Available Sublease28%
Total Available Office Space: 15285487 sf
$30.15
$27.09
$6.60
-
500,000
1,000,000
1,500,000
2,000,000
2,500,000
$-
$5
$10
$15
$20
$25
$30
$35
Class A Class B Class C
Sq. Ft.
Gross Rent $/Sq. Ft.
Avail. Office Space Not Avail. Office Space Gross Rent
Note: Not available office space (blue) and available office space (yellow) add up to the total inventory of office space in the respective building class.
$12.50
4.7%
-2.0%
-1.0%
0.0%
1.0%
2.0%
3.0%
4.0%
5.0%
6.0%
7.0%
8.0%
(4)
(2)
-
2
4
6
8
10
12
14
Q1 2008 Q2 2008 Q3 2008 Q4 2008 Q1 2009 Q2 2009
Vacancy Rate
Net Rent $/sf. / Absorption (10,000's)
Absorption Asking Net Rent Vacancy Rate
Manufacturing & Distribution
23%
Data,Publishing, Broadcasting Services 12%
Finance 25%
Professional Services 16%
Public Service & Private Sector
Services20%
Others4%
* Less dense submarket between the Central Area of the GTA and the Suburbanmunicipalities of Mississauga and Brampton.
* Proximity to those denser areas, public transit lines (subway, GO Train, busroutes), access to several major highways routed through the submarket andproximity to the airport allows for easy in-and-out of the office and acceptablecommutes for employees and customers.
* Majority of the office building are located along Bloor Street and the Hwy 427corridor and were built prior 1992.
* Lower parking rates than in more dense office submarkets in the GTA.
0%
5%
10%
15%
20%
25%
30%
35%
40%
45%
50%
0
50,000
100,000
150,000
200,000
250,000
300,000
350,000
400,000
Q1 2008 Q2 2008 Q3 2008 Q4 2008 Q1 2009 Q2 2009
Square Feet
Sublease Direct Sublease as % of Total Available
Information contained herein has been obtained from the owners or other sources deemed reliable. We have no reason to doubt its accuracy but regret we
Available Direct72%
Available Sublease28%
Total Available Office Space: 15285487 sf
$30.15
$27.09
$6.60
-
500,000
1,000,000
1,500,000
2,000,000
2,500,000
$-
$5
$10
$15
$20
$25
$30
$35
Class A Class B Class C
Sq. Ft.
Gross Rent $/Sq. Ft.
Avail. Office Space Not Avail. Office Space Gross Rent
Note: Not available office space (blue) and available office space (yellow) add up to the total inventory of office space in the respective building class.
$12.50
4.7%
-2.0%
-1.0%
0.0%
1.0%
2.0%
3.0%
4.0%
5.0%
6.0%
7.0%
8.0%
(4)
(2)
-
2
4
6
8
10
12
14
Q1 2008 Q2 2008 Q3 2008 Q4 2008 Q1 2009 Q2 2009
Vacancy Rate
Net Rent $/sf. / Absorption (10,000's)
Absorption Asking Net Rent Vacancy Rate
Manufacturing & Distribution
23%
Data,Publishing, Broadcasting Services 12%
Finance 25%
Professional Services 16%
Public Service & Private Sector
Services20%
Others4%
* Less dense submarket between the Central Area of the GTA and the Suburbanmunicipalities of Mississauga and Brampton.
* Proximity to those denser areas, public transit lines (subway, GO Train, busroutes), access to several major highways routed through the submarket andproximity to the airport allows for easy in-and-out of the office and acceptablecommutes for employees and customers.
* Majority of the office building are located along Bloor Street and the Hwy 427corridor and were built prior 1992.
* Lower parking rates than in more dense office submarkets in the GTA.
0%
5%
10%
15%
20%
25%
30%
35%
40%
45%
50%
0
50,000
100,000
150,000
200,000
250,000
300,000
350,000
400,000
Q1 2008 Q2 2008 Q3 2008 Q4 2008 Q1 2009 Q2 2009
Square Feet
Sublease Direct Sublease as % of Total Available
Information contained herein has been obtained from the owners or other sources deemed reliable. We have no reason to doubt its accuracy but regret we cannot guarantee it. All properties subject to change or withdrawal without notice. All numbers reported use the most accurate information available at the time of publishing, however we acknowledge that there may be marginal changes over time as more accurate information becomes available. Colliers Macaulay Nicolls (Ontario) Inc., Brokerage.

MARKET INDICATORS MAP OF MARKET
Q1 2009 Q2 2009 Trend
Office Inventory* 34,969,384 34,986,630
Net Absorption (279,599) 255,355
Vacancy Rate 8.2% 8.2%
Average Asking Net Rent $13.04 $12.96
Average Additional Rent $12.74 $12.77
AVAILABLE SUPPLY SPLIT AVAILABLE SPACE OPTIONS
0 - 4k sf 4k - 10k sf 10k - 20k sf 20 - 50k sf 50k - 100k sf 100k sf +
# of units** 408 150 104 83 7 8
** Counting smallest divisible units in existing buildings and buildings which are under construction.
RECENT TRANSACTIONS Q2 2009
Suite Sq. Ft. Landlord
600 16,630 The Last Minute Club
123A 6,610 Acura Technology
800 5,200 2034631 Ontario Inc.
GROSS RENT & AVAILABILITY BY BUILDING CLASS
Date Address Price Vendor Purchaser Size $/PSF
Office Market Dashboard: GTA East
200 Consumers Road
*Office Inventory: For the purpose of this report, buildings with less than 10,000 sf of office space and buildings owned and occupied by the
government have not been included in the office inventory. There are 457 office buildings surveyed in this market.
TOP Office Lease Transactions by Size
Address
250 West Beaver Creek Road
150 Ferrand Drive
InCharge Debt Solutions
Canada
TOP Office Sale Transactions by Price
Q2-09
Number of units on the regional market by size brackets
Tenant
Neo Post Canada Ltd
N/A
18,000,000 $30
Not Avail. Office Space Avail. Office Space Gross Rent
0%
5%
10%
15%
20%
25%
30%
35%
40%
45%
50%
0
500,000
1,000,000
1,500,000
2,000,000
2,500,000
3,000,000
3,500,000
4,000,000
4,500,000
5,000,000
Q1 2008 Q2 2008 Q3 2008 Q4 2008 Q1 2009 Q2 2009
Sq
uare
Feet
Direct Sublease Sublease as % of Total Available
Date Address Price Vendor Purchaser Size $/PSF
OCCUPIED SPACE BY MAJOR BUSINESS CATEGORIES
18 MONTH TREND
TOP PROJECTS UNDER CONSTRUCTION BY SIZE
Address Sq. Ft. Est. Com.
11258 Woodbine
Avenue138,425 8/1/2009
220 Commerce
Valley Drive 103,256 Fall 2009
MARKET CHARACTERISTICS
Source: Colliers International, Q2 2009
N/A
TD BANK
No transactions took place during this period.
Honda Canada Inc
Metrus Properties
Anchor TenantDeveloper
$28.40
$24.82
$18.96
-
2,000,000
4,000,000
6,000,000
8,000,000
10,000,000
12,000,000
14,000,000
16,000,000
18,000,000
$-
$5
$10
$15
$20
$25
$30
Class A Class B Class C
Sq. Ft.
Gross Rent $/Sq. Ft.
Not Avail. Office Space Avail. Office Space Gross Rent
Note: Not available office space (blue) and available office space (yellow) add up to the total inventory of office space in the respective building class.
$12.96
8.2%
0.0%
1.0%
2.0%
3.0%
4.0%
5.0%
6.0%
7.0%
8.0%
9.0%
(3)
(1)
1
3
5
7
9
11
13
15
Q1 2008 Q2 2008 Q3 2008 Q4 2008 Q1 2009 Q2 2009
Vacancy Rate
Net Rent $/sf. / Absorption (100,000's)
Absorption Asking Net Rent Vacancy Rate
Manufacturing & Distribution
21%
Data,Publishing, Broadcasting Services 11%
Finance 24%
Professional Services 23%
Public Service & Private Sector
Services17%
Others4%
*GTA East Market includes submarkets of Don Mills/Eglinton, Duncan Mills, Consumers Road, Scarborough Town Centre, Markham Town Centre, Pickering/Oshawa, Hwy 404/Hwy 407, Woodbine/Steeles, and Toronto East.*Serviced by multiple high-density transportation routes (401, 407, 404, DVP) and several public transit services (TTC, Go, Ajax Pickering TA, Oshawa Transit, Whitby Transit, York Region Transit)*Close proximity to suburban labour pool*Post-Secondary education campuses include University of Toronto - Scarborough, Seneca College - Newham, Durham College.*Major companies in this area inlude Celestica, IBM, Wrigley's Canada, Nestlé Canada, Mony Life, McDonald's Canada, Alcatel Canada Wire.
0%
5%
10%
15%
20%
25%
30%
35%
40%
45%
50%
0
500,000
1,000,000
1,500,000
2,000,000
2,500,000
3,000,000
3,500,000
4,000,000
4,500,000
5,000,000
Q1 2008 Q2 2008 Q3 2008 Q4 2008 Q1 2009 Q2 2009
Sq
uare
Feet
Direct Sublease Sublease as % of Total Available
Information contained herein has been obtained from the owners or other sources deemed reliable. We have no reason to doubt its accuracy but regret we
$28.40
$24.82
$18.96
-
2,000,000
4,000,000
6,000,000
8,000,000
10,000,000
12,000,000
14,000,000
16,000,000
18,000,000
$-
$5
$10
$15
$20
$25
$30
Class A Class B Class C
Sq. Ft.
Gross Rent $/Sq. Ft.
Not Avail. Office Space Avail. Office Space Gross Rent
Note: Not available office space (blue) and available office space (yellow) add up to the total inventory of office space in the respective building class.
$12.96
8.2%
0.0%
1.0%
2.0%
3.0%
4.0%
5.0%
6.0%
7.0%
8.0%
9.0%
(3)
(1)
1
3
5
7
9
11
13
15
Q1 2008 Q2 2008 Q3 2008 Q4 2008 Q1 2009 Q2 2009
Vacancy Rate
Net Rent $/sf. / Absorption (100,000's)
Absorption Asking Net Rent Vacancy Rate
Manufacturing & Distribution
21%
Data,Publishing, Broadcasting Services 11%
Finance 24%
Professional Services 23%
Public Service & Private Sector
Services17%
Others4%
*GTA East Market includes submarkets of Don Mills/Eglinton, Duncan Mills, Consumers Road, Scarborough Town Centre, Markham Town Centre, Pickering/Oshawa, Hwy 404/Hwy 407, Woodbine/Steeles, and Toronto East.*Serviced by multiple high-density transportation routes (401, 407, 404, DVP) and several public transit services (TTC, Go, Ajax Pickering TA, Oshawa Transit, Whitby Transit, York Region Transit)*Close proximity to suburban labour pool*Post-Secondary education campuses include University of Toronto - Scarborough, Seneca College - Newham, Durham College.*Major companies in this area inlude Celestica, IBM, Wrigley's Canada, Nestlé Canada, Mony Life, McDonald's Canada, Alcatel Canada Wire.
0%
5%
10%
15%
20%
25%
30%
35%
40%
45%
50%
0
500,000
1,000,000
1,500,000
2,000,000
2,500,000
3,000,000
3,500,000
4,000,000
4,500,000
5,000,000
Q1 2008 Q2 2008 Q3 2008 Q4 2008 Q1 2009 Q2 2009
Sq
uare
Feet
Direct Sublease Sublease as % of Total Available
Information contained herein has been obtained from the owners or other sources deemed reliable. We have no reason to doubt its accuracy but regret we cannot guarantee it. All properties subject to change or withdrawal without notice. All numbers reported use the most accurate information available at the time of publishing, however we acknowledge that there may be marginal changes over time as more accurate information becomes available. Colliers Macaulay Nicolls (Ontario) Inc., Brokerage.
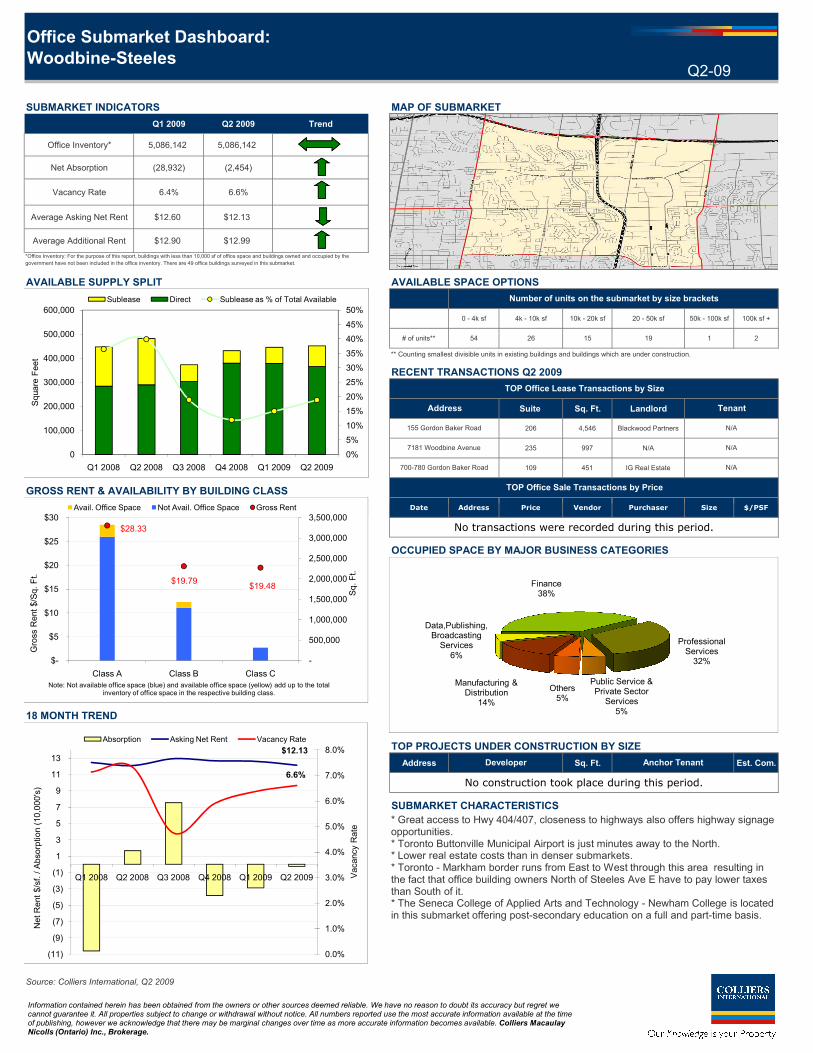
SUBMARKET INDICATORS MAP OF SUBMARKET
Q1 2009 Q2 2009 Trend
Office Inventory* 5,086,142 5,086,142
Net Absorption (28,932) (2,454)
Vacancy Rate 6.4% 6.6%
Average Asking Net Rent $12.60 $12.13
Average Additional Rent $12.90 $12.99
AVAILABLE SUPPLY SPLIT AVAILABLE SPACE OPTIONS
0 - 4k sf 4k - 10k sf 10k - 20k sf 20 - 50k sf 50k - 100k sf 100k sf +
# of units** 54 26 15 19 1 2
** Counting smallest divisible units in existing buildings and buildings which are under construction.
RECENT TRANSACTIONS Q2 2009
Suite Sq. Ft. Landlord
206 4,546 Blackwood Partners
235 997 N/A
109 451 IG Real Estate
GROSS RENT & AVAILABILITY BY BUILDING CLASS
Date Address Price Vendor Purchaser Size $/PSF
Tenant
TOP Office Lease Transactions by Size
Number of units on the submarket by size brackets
N/A
N/A
TOP Office Sale Transactions by Price
Address
Q2-09
155 Gordon Baker Road
7181 Woodbine Avenue
Office Submarket Dashboard:
Woodbine-Steeles
700-780 Gordon Baker Road N/A
*Office Inventory: For the purpose of this report, buildings with less than 10,000 sf of office space and buildings owned and occupied by the
government have not been included in the office inventory. There are 49 office buildings surveyed in this submarket.
3,500,000 $30 Avail. Office Space Not Avail. Office Space Gross Rent
0%
5%
10%
15%
20%
25%
30%
35%
40%
45%
50%
0
100,000
200,000
300,000
400,000
500,000
600,000
Q1 2008 Q2 2008 Q3 2008 Q4 2008 Q1 2009 Q2 2009
Square Feet
Sublease Direct Sublease as % of Total Available
Date Address Price Vendor Purchaser Size $/PSF
OCCUPIED SPACE BY MAJOR BUSINESS CATEGORIES
18 MONTH TREND
TOP PROJECTS UNDER CONSTRUCTION BY SIZE
Address Sq. Ft. Est. Com.
SUBMARKET CHARACTERISTICS
Source: Colliers International, Q2 2009
No construction took place during this period.
Anchor TenantDeveloper
No transactions were recorded during this period.$28.33
$19.79 $19.48
-
500,000
1,000,000
1,500,000
2,000,000
2,500,000
3,000,000
3,500,000
$-
$5
$10
$15
$20
$25
$30
Class A Class B Class C
Sq. Ft.
Gross Rent $/Sq. Ft.
Avail. Office Space Not Avail. Office Space Gross Rent
Note: Not available office space (blue) and available office space (yellow) add up to the total inventory of office space in the respective building class.
$12.13
6.6%
0.0%
1.0%
2.0%
3.0%
4.0%
5.0%
6.0%
7.0%
8.0%
(11)
(9)
(7)
(5)
(3)
(1)
1
3
5
7
9
11
13
Q1 2008 Q2 2008 Q3 2008 Q4 2008 Q1 2009 Q2 2009 Vacancy Rate
Net Rent $/sf. / Absorption (10,000's)
Absorption Asking Net Rent Vacancy Rate
Manufacturing & Distribution
14%
Data,Publishing, Broadcasting Services
6%
Finance 38%
Professional Services 32%
Public Service & Private Sector
Services5%
Others5%
* Great access to Hwy 404/407, closeness to highways also offers highway signage opportunities.* Toronto Buttonville Municipal Airport is just minutes away to the North.* Lower real estate costs than in denser submarkets.* Toronto - Markham border runs from East to West through this area resulting in the fact that office building owners North of Steeles Ave E have to pay lower taxes than South of it.* The Seneca College of Applied Arts and Technology - Newham College is located in this submarket offering post-secondary education on a full and part-time basis.
0%
5%
10%
15%
20%
25%
30%
35%
40%
45%
50%
0
100,000
200,000
300,000
400,000
500,000
600,000
Q1 2008 Q2 2008 Q3 2008 Q4 2008 Q1 2009 Q2 2009
Square Feet
Sublease Direct Sublease as % of Total Available
$28.33
$19.79 $19.48
-
500,000
1,000,000
1,500,000
2,000,000
2,500,000
3,000,000
3,500,000
$-
$5
$10
$15
$20
$25
$30
Class A Class B Class C
Sq. Ft.
Gross Rent $/Sq. Ft.
Avail. Office Space Not Avail. Office Space Gross Rent
Note: Not available office space (blue) and available office space (yellow) add up to the total inventory of office space in the respective building class.
$12.13
6.6%
0.0%
1.0%
2.0%
3.0%
4.0%
5.0%
6.0%
7.0%
8.0%
(11)
(9)
(7)
(5)
(3)
(1)
1
3
5
7
9
11
13
Q1 2008 Q2 2008 Q3 2008 Q4 2008 Q1 2009 Q2 2009 Vacancy Rate
Net Rent $/sf. / Absorption (10,000's)
Absorption Asking Net Rent Vacancy Rate
Manufacturing & Distribution
14%
Data,Publishing, Broadcasting Services
6%
Finance 38%
Professional Services 32%
Public Service & Private Sector
Services5%
Others5%
* Great access to Hwy 404/407, closeness to highways also offers highway signage opportunities.* Toronto Buttonville Municipal Airport is just minutes away to the North.* Lower real estate costs than in denser submarkets.* Toronto - Markham border runs from East to West through this area resulting in the fact that office building owners North of Steeles Ave E have to pay lower taxes than South of it.* The Seneca College of Applied Arts and Technology - Newham College is located in this submarket offering post-secondary education on a full and part-time basis.
0%
5%
10%
15%
20%
25%
30%
35%
40%
45%
50%
0
100,000
200,000
300,000
400,000
500,000
600,000
Q1 2008 Q2 2008 Q3 2008 Q4 2008 Q1 2009 Q2 2009
Square Feet
Sublease Direct Sublease as % of Total Available
Information contained herein has been obtained from the owners or other sources deemed reliable. We have no reason to doubt its accuracy but regret we cannot guarantee it. All properties subject to change or withdrawal without notice. All numbers reported use the most accurate information available at the time of publishing, however we acknowledge that there may be marginal changes over time as more accurate information becomes available. Colliers Macaulay Nicolls (Ontario) Inc., Brokerage.

SUBMARKET INDICATORS MAP OF SUBMARKET
Q1 2009 Q2 2009 Trend
Office Inventory* 1,390,916 1,390,916
Net Absorption (14,970) (6,628)
Vacancy Rate 1.6% 1.6%
Average Asking Net Rent $8.83 $8.77
Average Additional Rent $15.13 $15.03
AVAILABLE SUPPLY SPLIT AVAILABLE SPACE OPTIONS
0 - 4k sf 4k - 10k sf 10k - 20k sf 20 - 50k sf 50k - 100k sf 100k sf +
# of units** 20 5 0 4 0 0
** Counting smallest divisible units in existing buildings and buildings which are under construction.
RECENT TRANSACTIONS Q2 2009
Suite Sq. Ft. Landlord
Date Address Price Vendor Purchaser Size $/PSF
GROSS RENT & AVAILABILITY BY BUILDING CLASS
OCCUPIED SPACE BY MAJOR BUSINESS CATEGORIES
Office Submarket Dashboard: Toronto East
*Office Inventory: For the purpose of this report, buildings with less than 10,000 sf of office space and buildings owned and occupied by the
government have not been included in the office inventory. There are 22 office buildings surveyed in this submarket.
TOP Office Lease Transactions by Size
Address
Q2-09
Tenant
Number of units on the submarket by size brackets
TOP Office Sale Transactions by Price
No transactions were recorded during this period
No transactions were recorded during this period
2,000,000 $30
Avail. Office Space Not Avail. Office Space Gross Rent
0%
1%
2%
3%
4%
5%
6%
7%
8%
9%
10%
0
10,000
20,000
30,000
40,000
50,000
60,000
70,000
80,000
90,000
100,000
Q1 2008 Q2 2008 Q3 2008 Q4 2008 Q1 2009 Q2 2009
Square Feet
Sublease Direct Sublease as % of Total Available
OCCUPIED SPACE BY MAJOR BUSINESS CATEGORIES
18 MONTH TREND TOP PROJECTS UNDER CONSTRUCTION BY SIZEAddress Sq. Ft. Est. Com.
SUBMARKET CHARACTERISTICS
Source: Colliers International, Q2 2009
Developer Anchor Tenant
No construction took place during this period
$-
$25.48
$20.43
-
200,000
400,000
600,000
800,000
1,000,000
1,200,000
1,400,000
1,600,000
1,800,000
2,000,000
$-
$5
$10
$15
$20
$25
$30
Class A Class B Class C
Sq. Ft.
Gross Rent $/Sq. Ft.
Avail. Office Space Not Avail. Office Space Gross Rent
Note: Not available office space (blue) and available office space (yellow) add up to the total inventory of office space in the respective building class.
$8.77
1.6%
-5.0%
-3.0%
-1.0%
1.0%
3.0%
5.0%
7.0%
(3)
(1)
1
3
5
7
9
11
13
15
Q1 2008 Q2 2008 Q3 2008 Q4 2008 Q1 2009 Q2 2009
Vacancy Rate
Net Rent $/sf. / Absorption (10,000's)
Absorption Asking Net Rent Vacancy Rate
Manufacturing & Distribution
4%
Data,Publishing, Broadcasting Services
1%
Finance 74%
Professional Services
3%Public Service & Private Sector
Services17%
Others1%
*Submarket is primarily residential with extremely diverse areas such as GreekTown (Danforth), The Beaches, The Scarborough Bluffs, Chinatown East, Little India and The Portlands.*Area serviced by the Gardiner Expressway and the Don Valley Parkway on the Eastern border. Area is also serviced by the Bloor-Danforth Subway line, as well as multiple bus and streetcar routes allowing easy access to the Downtown and Financial Core.*Area will experience near-term economic benefits from Toronto's Waterfront redevelopment initiative, attracting new labour.*Construction of new Filmport facility will establish a film industry concentration on Toronto's waterfront.
0%
1%
2%
3%
4%
5%
6%
7%
8%
9%
10%
0
10,000
20,000
30,000
40,000
50,000
60,000
70,000
80,000
90,000
100,000
Q1 2008 Q2 2008 Q3 2008 Q4 2008 Q1 2009 Q2 2009
Square Feet
Sublease Direct Sublease as % of Total Available
Information contained herein has been obtained from the owners or other sources deemed reliable. We have no reason to doubt its accuracy but regret we cannot guarantee it. All properties subject to change or withdrawal without notice. All numbers reported use the most accurate information available at the time of publishing, however we acknowledge that there may be marginal changes over time as more accurate information becomes available. Colliers Macaulay
$-
$25.48
$20.43
-
200,000
400,000
600,000
800,000
1,000,000
1,200,000
1,400,000
1,600,000
1,800,000
2,000,000
$-
$5
$10
$15
$20
$25
$30
Class A Class B Class C
Sq. Ft.
Gross Rent $/Sq. Ft.
Avail. Office Space Not Avail. Office Space Gross Rent
Note: Not available office space (blue) and available office space (yellow) add up to the total inventory of office space in the respective building class.
$8.77
1.6%
-5.0%
-3.0%
-1.0%
1.0%
3.0%
5.0%
7.0%
(3)
(1)
1
3
5
7
9
11
13
15
Q1 2008 Q2 2008 Q3 2008 Q4 2008 Q1 2009 Q2 2009
Vacancy Rate
Net Rent $/sf. / Absorption (10,000's)
Absorption Asking Net Rent Vacancy Rate
Manufacturing & Distribution
4%
Data,Publishing, Broadcasting Services
1%
Finance 74%
Professional Services
3%Public Service & Private Sector
Services17%
Others1%
*Submarket is primarily residential with extremely diverse areas such as GreekTown (Danforth), The Beaches, The Scarborough Bluffs, Chinatown East, Little India and The Portlands.*Area serviced by the Gardiner Expressway and the Don Valley Parkway on the Eastern border. Area is also serviced by the Bloor-Danforth Subway line, as well as multiple bus and streetcar routes allowing easy access to the Downtown and Financial Core.*Area will experience near-term economic benefits from Toronto's Waterfront redevelopment initiative, attracting new labour.*Construction of new Filmport facility will establish a film industry concentration on Toronto's waterfront.
0%
1%
2%
3%
4%
5%
6%
7%
8%
9%
10%
0
10,000
20,000
30,000
40,000
50,000
60,000
70,000
80,000
90,000
100,000
Q1 2008 Q2 2008 Q3 2008 Q4 2008 Q1 2009 Q2 2009
Square Feet
Sublease Direct Sublease as % of Total Available
Information contained herein has been obtained from the owners or other sources deemed reliable. We have no reason to doubt its accuracy but regret we cannot guarantee it. All properties subject to change or withdrawal without notice. All numbers reported use the most accurate information available at the time of publishing, however we acknowledge that there may be marginal changes over time as more accurate information becomes available. Colliers Macaulay Nicolls (Ontario) Inc., Brokerage.

SUBMARKET INDICATORS MAP OF SUBMARKET
Q1 2009 Q2 2009 Trend
Office Inventory* 1,624,240 1,624,240
Net Absorption 0 0
Vacancy Rate 2.1% 2.1%
Average Asking Net Rent $11.33 $11.84
Average Additional Rent $8.06 $9.13
AVAILABLE SUPPLY SPLIT AVAILABLE SPACE OPTIONS
0 - 4k sf 4k - 10k sf 10k - 20k sf 20 - 50k sf 50k - 100k sf 100k sf +
# of units** 7 1 2 1 1 0
** Counting smallest divisible units in existing buildings and buildings which are under construction.
RECENT TRANSACTIONS Q2 2009
Suite Sq. Ft. Landlord
Date Address Price Vendor Purchaser Size $/PSF
GROSS RENT & AVAILABILITY BY BUILDING CLASS
OCCUPIED SPACE BY MAJOR BUSINESS CATEGORIES
Tenant
Office Submarket Dashboard: Pickering-Oshawa
*Office Inventory: For the purpose of this report, buildings with less than 10,000 sf of office space and buildings owned and occupied by the
government have not been included in the office inventory. There are 32 office buildings surveyed in this submarket.
TOP Office Lease Transactions by Size
Address
Q2-09
Number of units on the submarket by size brackets
No transactions were recorded during this period
TOP Office Sale Transactions by Price
No transactions were recorded during this period.
1,000,000 $25 Avail. Office Space Not Avail. Office Space Gross Rent
0%
10%
20%
30%
40%
50%
60%
70%
0
10,000
20,000
30,000
40,000
50,000
60,000
70,000
80,000
90,000
100,000
Q1 2008 Q2 2008 Q3 2008 Q4 2008 Q1 2009 Q2 2009
Square Feet
Sublease Direct Sublease as % of Total Available
OCCUPIED SPACE BY MAJOR BUSINESS CATEGORIES
18 MONTH TREND TOP PROJECTS UNDER CONSTRUCTION BY SIZE
Address Sq. Ft. Est. Com.
SUBMARKET CHARACTERISTICS
Source: Colliers International, Q2 2009
No construction took place during this period
Developer Anchor Tenant
$20.95
$20.98
$-
-
100,000
200,000
300,000
400,000
500,000
600,000
700,000
800,000
900,000
1,000,000
$-
$5
$10
$15
$20
$25
Class A Class B Class C
Sq. Ft.
Gross Rent $/Sq. Ft.
Avail. Office Space Not Avail. Office Space Gross Rent
Note: Not available office space (blue) and available office space (yellow) add up to the total inventory of office space in the respective building class.
$11.84
2.1%
0.0%
1.0%
2.0%
3.0%
4.0%
5.0%
6.0%
(3)
(1)
1
3
5
7
9
11
13
15
Q1 2008 Q2 2008 Q3 2008 Q4 2008 Q1 2009 Q2 2009
Vacancy Rate
Net Rent $/sf. / Absorption (10,000's)
Absorption Asking Net Rent Vacancy Rate
Manufacturing & Distribution
15%
Data,Publishing, Broadcasting Services 11%
Finance 4%
Professional Services
6%
Public Service & Private Sector
Services63%
Others1%
* This submarket is part of Durham Region and therefore the most eastern office submarket of the GTA with considerably lower real estate costs than in more central areas in the GTA.
* One of the smallest office submarkets with a very limited amount of space options for traditional office space users as key sectors in this area are advanced manufacturing, agri-business, energy and tourism.
* Area is home to large amount of skilled labour force.
* Large supply of land resources offers up design-build opportunities.
0%
10%
20%
30%
40%
50%
60%
70%
0
10,000
20,000
30,000
40,000
50,000
60,000
70,000
80,000
90,000
100,000
Q1 2008 Q2 2008 Q3 2008 Q4 2008 Q1 2009 Q2 2009
Square Feet
Sublease Direct Sublease as % of Total Available
Information contained herein has been obtained from the owners or other sources deemed reliable. We have no reason to doubt its accuracy but regret we
$20.95
$20.98
$-
-
100,000
200,000
300,000
400,000
500,000
600,000
700,000
800,000
900,000
1,000,000
$-
$5
$10
$15
$20
$25
Class A Class B Class C
Sq. Ft.
Gross Rent $/Sq. Ft.
Avail. Office Space Not Avail. Office Space Gross Rent
Note: Not available office space (blue) and available office space (yellow) add up to the total inventory of office space in the respective building class.
$11.84
2.1%
0.0%
1.0%
2.0%
3.0%
4.0%
5.0%
6.0%
(3)
(1)
1
3
5
7
9
11
13
15
Q1 2008 Q2 2008 Q3 2008 Q4 2008 Q1 2009 Q2 2009
Vacancy Rate
Net Rent $/sf. / Absorption (10,000's)
Absorption Asking Net Rent Vacancy Rate
Manufacturing & Distribution
15%
Data,Publishing, Broadcasting Services 11%
Finance 4%
Professional Services
6%
Public Service & Private Sector
Services63%
Others1%
* This submarket is part of Durham Region and therefore the most eastern office submarket of the GTA with considerably lower real estate costs than in more central areas in the GTA.
* One of the smallest office submarkets with a very limited amount of space options for traditional office space users as key sectors in this area are advanced manufacturing, agri-business, energy and tourism.
* Area is home to large amount of skilled labour force.
* Large supply of land resources offers up design-build opportunities.
0%
10%
20%
30%
40%
50%
60%
70%
0
10,000
20,000
30,000
40,000
50,000
60,000
70,000
80,000
90,000
100,000
Q1 2008 Q2 2008 Q3 2008 Q4 2008 Q1 2009 Q2 2009
Square Feet
Sublease Direct Sublease as % of Total Available
Information contained herein has been obtained from the owners or other sources deemed reliable. We have no reason to doubt its accuracy but regret we cannot guarantee it. All properties subject to change or withdrawal without notice. All numbers reported use the most accurate information available at the time of publishing, however we acknowledge that there may be marginal changes over time as more accurate information becomes available. Colliers Macaulay Nicolls (Ontario) Inc., Brokerage.

SUBMARKET INDICATORS MAP OF SUBMARKET
Q1 2009 Q2 2009 Trend AVAILABLE SPACE OPTIONS
Office Inventory* 3,136,084 3,136,084
Net Absorption 40,333 62,363
Vacancy Rate 4.9% 4.5%
Average Asking Net Rent $14.43 $14.17 0 - 4k sf
Average Additional Rent $10.45 $10.70 4k - 10k sf
10k - 20k sf
AVAILABLE SUPPLY SPLIT 20 - 50k sf
50k - 100k sf
100k sf +
RECENT TRANSACTIONS Q2 2009
Suite Sq. Ft. Landlord
Date Address Price Vendor Purchaser Size $/PSF
GROSS RENT & AVAILABILITY BY BUILDING CLASS 5/5/20094792 Highway
No. 7 East$1,700,000 N/A Sanmayhia Inc 8,118 $209
OCCUPIED SPACE BY MAJOR BUSINESS CATEGORIES
Number of units
on the
submarket by
size brackets
# of units**
0
TOP Office Sale Transactions by Price
2
Address
21
Q2-09Office Submarket Dashboard: Markham
*Office Inventory: For the purpose of this report, buildings with less than 10,000 sf of office space and buildings owned and occupied by the
government have not been included in the office inventory. There are 42 office buildings surveyed in this submarket.
TOP Office Lease Transactions by Size
No transactions were recorded during this period.
** Counting smallest divisible units in existing
buildings and buildings under construction.
5
12
3
Tenant
$25.14 1,800,000
2,000,000 $30
Avail. Office Space Not Avail. Office Space Gross Rent
0%
10%
20%
30%
40%
50%
60%
70%
0
50,000
100,000
150,000
200,000
250,000
300,000
Q1 2008 Q2 2008 Q3 2008 Q4 2008 Q1 2009 Q2 2009
Square Feet
Sublease Direct Sublease as % of Total Available
18 MONTH TREND
TOP PROJECTS UNDER CONSTRUCTION BY SIZE
Address Sq. Ft. Est. Com.
11258 Woodbine
Avenue138,425 8/1/2009
SUBMARKET CHARACTERISTICS
Source: Colliers International, Q2 2009
Honda Canada IncN/A
Developer Anchor Tenant
$25.44
$25.14
$18.40
-
200,000
400,000
600,000
800,000
1,000,000
1,200,000
1,400,000
1,600,000
1,800,000
2,000,000
$-
$5
$10
$15
$20
$25
$30
Class A Class B Class C
Sq. Ft.
Gross Rent $/Sq. Ft.
Avail. Office Space Not Avail. Office Space Gross Rent
Note: Not available office space (blue) and available office space (yellow) add up to the total inventory of office space in the respective building class.
$14.17
4.5%
0.0%
1.0%
2.0%
3.0%
4.0%
5.0%
6.0%
7.0%
8.0%
9.0%
10.0%
-
2
4
6
8
10
12
14
16
18
20
22
Q1 2008 Q2 2008 Q3 2008 Q4 2008 Q1 2009 Q2 2009
Vacancy Rate
Net Rent $/sf. / Absorption (10,000's)
Absorption Asking Net Rent Vacancy Rate
Manufacturing & Distribution
14%
Data,Publishing, Broadcasting Services
6%
Finance 38%
Professional Services 32%
Public Service & Private Sector
Services5%
Others5%
* Close to Hwy 400 series and a well developed road infrastructure make this submarket very accessible by car
* Lower real estate costs that in the City of Toronto
* Proximity to labour pool in suburban municipalities
* Buttonville airport is easily accessable
* High-Technology and Life Sciences are the two key business clusters in this area
* Seneca College recently opened their Markham campus, the first post-secondary educational research and training facility in Markham.
0%
10%
20%
30%
40%
50%
60%
70%
0
50,000
100,000
150,000
200,000
250,000
300,000
Q1 2008 Q2 2008 Q3 2008 Q4 2008 Q1 2009 Q2 2009
Square Feet
Sublease Direct Sublease as % of Total Available
Information contained herein has been obtained from the owners or other sources deemed reliable. We have no reason to doubt its accuracy but regret we cannot guarantee it. All properties subject to change or withdrawal without notice. All numbers reported use the most accurate information available at the time of publishing, however we acknowledge that there may be marginal changes over time as more accurate information becomes available. Colliers Macaulay
$25.44
$25.14
$18.40
-
200,000
400,000
600,000
800,000
1,000,000
1,200,000
1,400,000
1,600,000
1,800,000
2,000,000
$-
$5
$10
$15
$20
$25
$30
Class A Class B Class C
Sq. Ft.
Gross Rent $/Sq. Ft.
Avail. Office Space Not Avail. Office Space Gross Rent
Note: Not available office space (blue) and available office space (yellow) add up to the total inventory of office space in the respective building class.
$14.17
4.5%
0.0%
1.0%
2.0%
3.0%
4.0%
5.0%
6.0%
7.0%
8.0%
9.0%
10.0%
-
2
4
6
8
10
12
14
16
18
20
22
Q1 2008 Q2 2008 Q3 2008 Q4 2008 Q1 2009 Q2 2009
Vacancy Rate
Net Rent $/sf. / Absorption (10,000's)
Absorption Asking Net Rent Vacancy Rate
Manufacturing & Distribution
14%
Data,Publishing, Broadcasting Services
6%
Finance 38%
Professional Services 32%
Public Service & Private Sector
Services5%
Others5%
* Close to Hwy 400 series and a well developed road infrastructure make this submarket very accessible by car
* Lower real estate costs that in the City of Toronto
* Proximity to labour pool in suburban municipalities
* Buttonville airport is easily accessable
* High-Technology and Life Sciences are the two key business clusters in this area
* Seneca College recently opened their Markham campus, the first post-secondary educational research and training facility in Markham.
0%
10%
20%
30%
40%
50%
60%
70%
0
50,000
100,000
150,000
200,000
250,000
300,000
Q1 2008 Q2 2008 Q3 2008 Q4 2008 Q1 2009 Q2 2009
Square Feet
Sublease Direct Sublease as % of Total Available
Information contained herein has been obtained from the owners or other sources deemed reliable. We have no reason to doubt its accuracy but regret we cannot guarantee it. All properties subject to change or withdrawal without notice. All numbers reported use the most accurate information available at the time of publishing, however we acknowledge that there may be marginal changes over time as more accurate information becomes available. Colliers Macaulay Nicolls (Ontario) Inc., Brokerage.

SUBMARKET INDICATORS MAP OF SUBMARKET
Q1 2009 Q2 2009 Trend AVAILABLE SPACE OPTIONS
Office Inventory* 8,325,872 8,325,872
Net Absorption -199,588 83,982
Vacancy Rate 7.6% 7.4%
Average Asking Net Rent $13.70 $13.70 0 - 4k sf
Average Additional Rent $10.21 $10.09 4k - 10k sf
10k - 20k sf
AVAILABLE SUPPLY SPLIT 20 - 50k sf
50k - 100k sf
100k sf +
RECENT TRANSACTIONS Q2 2009
Suite Sq. Ft. Landlord
123A 6,610 Acura Technology
202 3,056 View Sonic Corp
Date Address Price Vendor Purchaser Size $/PSF
GROSS RENT & AVAILABILITY BY BUILDING CLASS
OCCUPIED SPACE BY MAJOR BUSINESS CATEGORIES
Q2-09
Number of units
on the
submarket by
size brackets
# of units**
3
83
Tenant
Office Submarket Dashboard: Hwy 404 & Hwy 407
*Office Inventory: For the purpose of this report, buildings with less than 10,000 sf of office space and buildings owned and occupied by the
government have not been included in the office inventory. There are 123 office buildings surveyed in this submarket.
TOP Office Lease Transactions by Size
Address
44
0
32
33
** Counting smallest divisible units in existing
buildings and buildings under construction.
250 West Beaver Creek Road Neo Post Canada Ltd
TOP Office Sale Transactions by Price
No transactions took place during this period.
N/A100 Mural Street
$26.76 4,000,000
4,500,000 $30
Avail. Office Space Not Avail. Office Space Gross Rent
Data,Publishing,
0%
10%
20%
30%
40%
50%
60%
70%
0
200,000
400,000
600,000
800,000
1,000,000
1,200,000
Q1 2008 Q2 2008 Q3 2008 Q4 2008 Q1 2009 Q2 2009
Square Feet
Sublease Direct Sublease as % of Total Available
18 MONTH TREND TOP PROJECTS UNDER CONSTRUCTION BY SIZE
Address Sq. Ft. Est. Com.
220 Commerce
Valley Drive 103,256 Fall 2009
SUBMARKET CHARACTERISTICS
Source: Colliers International, Q2 2009
Metrus Properties TD BANK
Developer Anchor Tenant
$26.76
$24.70
$14.98
-
500,000
1,000,000
1,500,000
2,000,000
2,500,000
3,000,000
3,500,000
4,000,000
4,500,000
$-
$5
$10
$15
$20
$25
$30
Class A Class B Class C
Sq. Ft.
Gross Rent $/Sq. Ft.
Avail. Office Space Not Avail. Office Space Gross Rent
Note: Not available office space (blue) and available office space (yellow) add up to the total inventory of office space in the respective building class.
$13.70
7.4%
0.0%
1.0%
2.0%
3.0%
4.0%
5.0%
6.0%
7.0%
8.0%
9.0%
(20)
(16)
(12)
(8)
(4)
-
4
8
12
16
20
24
Q1 2008 Q2 2008 Q3 2008 Q4 2008 Q1 2009 Q2 2009 Vacancy Rate
Net Rent $/sf. / Absorption (10,000's)
Absorption Asking Net Rent Vacancy Rate
Manufacturing & Distribution
31%
Data,Publishing, Broadcasting Services
9%
Finance 16%
Professional Services 32%
Public Service & Private Sector
Services9%
Others3%
* Convenient access to Hwy 400 series and a well developed road infrastructure make this submarket very accessible by car
* Lower real estate costs that in the City of Toronto
* Proximity to labour pool in suburban municipalities
* Buttonville airport is located in the center of this submarket
* Most office space is concentrated in business parks located along Hwy 404 (e.g. Beaver Creak and Headford Business Park)
0%
10%
20%
30%
40%
50%
60%
70%
0
200,000
400,000
600,000
800,000
1,000,000
1,200,000
Q1 2008 Q2 2008 Q3 2008 Q4 2008 Q1 2009 Q2 2009
Square Feet
Sublease Direct Sublease as % of Total Available
Information contained herein has been obtained from the owners or other sources deemed reliable. We have no reason to doubt its accuracy but regret we cannot guarantee it. All properties subject to change or withdrawal without notice. All numbers reported use the most accurate information available at the time of publishing, however we acknowledge that there may be marginal changes over time as more accurate information becomes available. Colliers Macaulay
$26.76
$24.70
$14.98
-
500,000
1,000,000
1,500,000
2,000,000
2,500,000
3,000,000
3,500,000
4,000,000
4,500,000
$-
$5
$10
$15
$20
$25
$30
Class A Class B Class C
Sq. Ft.
Gross Rent $/Sq. Ft.
Avail. Office Space Not Avail. Office Space Gross Rent
Note: Not available office space (blue) and available office space (yellow) add up to the total inventory of office space in the respective building class.
$13.70
7.4%
0.0%
1.0%
2.0%
3.0%
4.0%
5.0%
6.0%
7.0%
8.0%
9.0%
(20)
(16)
(12)
(8)
(4)
-
4
8
12
16
20
24
Q1 2008 Q2 2008 Q3 2008 Q4 2008 Q1 2009 Q2 2009 Vacancy Rate
Net Rent $/sf. / Absorption (10,000's)
Absorption Asking Net Rent Vacancy Rate
Manufacturing & Distribution
31%
Data,Publishing, Broadcasting Services
9%
Finance 16%
Professional Services 32%
Public Service & Private Sector
Services9%
Others3%
* Convenient access to Hwy 400 series and a well developed road infrastructure make this submarket very accessible by car
* Lower real estate costs that in the City of Toronto
* Proximity to labour pool in suburban municipalities
* Buttonville airport is located in the center of this submarket
* Most office space is concentrated in business parks located along Hwy 404 (e.g. Beaver Creak and Headford Business Park)
0%
10%
20%
30%
40%
50%
60%
70%
0
200,000
400,000
600,000
800,000
1,000,000
1,200,000
Q1 2008 Q2 2008 Q3 2008 Q4 2008 Q1 2009 Q2 2009
Square Feet
Sublease Direct Sublease as % of Total Available
Information contained herein has been obtained from the owners or other sources deemed reliable. We have no reason to doubt its accuracy but regret we cannot guarantee it. All properties subject to change or withdrawal without notice. All numbers reported use the most accurate information available at the time of publishing, however we acknowledge that there may be marginal changes over time as more accurate information becomes available. Colliers Macaulay Nicolls (Ontario) Inc., Brokerage.

SUBMARKET INDICATORS MAP OF SUBMARKET
Q1 2009 Q2 2009 Trend
Office Inventory* 2,240,003 2,240,003
Net Absorption (13,020) 47,974
Vacancy Rate 11.2% 11.3%
Average Asking Net Rent $13.98 $13.91
Average Additional Rent $14.72 $14.67
AVAILABLE SUPPLY SPLIT AVAILABLE SPACE OPTIONS
0 - 4k sf 4k - 10k sf 10k - 20k sf 20 - 50k sf 50k - 100k sf 100k sf +
# of units** 12 5 1 10 0 0
** Counting smallest divisible units in existing buildings and buildings which are under construction.
RECENT TRANSACTIONS Q2 2009
Suite Sq. Ft. Landlord
Date Address Price Vendor Purchaser Size $/PSF
GROSS RENT & AVAILABILITY BY BUILDING CLASS
OCCUPIED SPACE BY MAJOR BUSINESS CATEGORIES
Q2-09
Tenant
No transactions were recorded during this period.
No transactions were recorded during this period.
Office Submarket Dashboard: Duncan Mill
*Office Inventory: For the purpose of this report, buildings with less than 10,000 sf of office space and buildings owned and occupied by the
government have not been included in the office inventory. There are 39 office buildings surveyed in this submarket.
Number of units on the submarket by size brackets
TOP Office Sale Transactions by Price
TOP Office Lease Transactions by Size
Address
2,000,000 $35
Avail. Office Space Not Avail. Office Space Gross Rent
0%
5%
10%
15%
20%
25%
0
50,000
100,000
150,000
200,000
250,000
300,000
350,000
400,000
Q1 2008 Q2 2008 Q3 2008 Q4 2008 Q1 2009 Q2 2009
Square Feet
Sublease Direct Sublease as % of Total Available
OCCUPIED SPACE BY MAJOR BUSINESS CATEGORIES
18 MONTH TREND TOP PROJECTS UNDER CONSTRUCTION BY SIZE
Address Sq. Ft. Est. Com.
SUBMARKET CHARACTERISTICS
Source: Colliers International, Q2 2009
No construction took place during this period.
Developer Anchor Tenant
$29.16 $24.74
$-
-
200,000
400,000
600,000
800,000
1,000,000
1,200,000
1,400,000
1,600,000
1,800,000
2,000,000
$-
$5
$10
$15
$20
$25
$30
$35
Class A Class B Class C
Sq. Ft.
Gross Rent $/Sq. Ft.
Avail. Office Space Not Avail. Office Space Gross Rent
Note: Not available office space (blue) and available office space (yellow) add up to the total inventory of office space in the respective building class.
$13.91
11.3%
0.0%
2.0%
4.0%
6.0%
8.0%
10.0%
12.0%
14.0%
(3)
(1)
1
3
5
7
9
11
13
15
Q1 2008 Q2 2008 Q3 2008 Q4 2008 Q1 2009 Q2 2009
Vacancy Rate
Net Rent $/sf. / Absorption (10,000s)f
Absorption Asking Net Rent Vacancy Rate
Manufacturing & Distribution
23%
Data,Publishing, Broadcasting Services 13%
Finance 12%
Professional Services 17%
Public Service & Private Sector
Services28%
Others7%
* Submarket has second highest vacancy rate in the entire GTA next to Scarborough Town Centre at 13.8%* Great access to Don Valley Parkway which runs North-South through the submarket and Hwy 401 which represents the northern most border of this submarket* Extensive public transit coverage via bus connecting to TTC Subway along York Mills Road and Lawrence Avenue* Signage opportunities along the highway* Real Estate costs lower than in denser areas* Contains most expensive residential neighbourhood in Canada - The Bridle Path
0%
5%
10%
15%
20%
25%
0
50,000
100,000
150,000
200,000
250,000
300,000
350,000
400,000
Q1 2008 Q2 2008 Q3 2008 Q4 2008 Q1 2009 Q2 2009
Square Feet
Sublease Direct Sublease as % of Total Available
Information contained herein has been obtained from the owners or other sources deemed reliable. We have no reason to doubt its accuracy but regret we cannot guarantee it. All properties subject to change or withdrawal without notice. All numbers reported use the most accurate information available at the time of publishing, however we acknowledge that there may be marginal changes over time as more accurate information becomes available. Colliers Macaulay Nicolls (Ontario) Inc., Brokerage.

SUBMARKET INDICATORS MAP OF SUBMARKET
Q1 2009 Q2 2009 Trend
Office Inventory* 5,533,530 5,550,776
Net Absorption (29,355) 21,101
Vacancy Rate 12.1% 12.1%
Average Asking Net Rent $12.17 $12.15
Average Additional Rent $14.18 $14.19
AVAILABLE SUPPLY SPLIT AVAILABLE SPACE OPTIONS
0 - 4k sf 4k - 10k sf 10k - 20k sf 20 - 50k sf 50k - 100k sf 100k sf +
# of units** 68 24 22 2 3 3
** Counting smallest divisible units in existing buildings and buildings which are under construction.
RECENT TRANSACTIONS Q2 2009
Suite Sq. Ft. Landlord
600 16,630 The Last Minute Club
605 3,957 Cadillac Fairview
GROSS RENT & AVAILABILITY BY BUILDING CLASS Date Address Price Vendor Purchaser Size $/PSF
75 The Donway W
Q2-09
Tenant
Office Submarket Dashboard: Don Mills-Eglinton
*Office Inventory: For the purpose of this report, buildings with less than 10,000 sf of office space and buildings owned and occupied by the
government have not been included in the office inventory. There are 62 office buildings surveyed in this submarket.
TOP Office Lease Transactions by Size
Address
Number of units on the submarket by size brackets
TOP Office Sale Transactions by Price
No transactions were recorded during this period.
N/A
N/A150 Ferrand Drive
Available Direct79%
Available Sublease21%
Total Available Office Space: 15285487 sf
4,500,000 $30
Avail. Office Space Not Avail. Office Space Gross Rent
0%
10%
20%
30%
40%
50%
60%
70%
0
100,000
200,000
300,000
400,000
500,000
600,000
700,000
800,000
900,000
1,000,000
Q1 2008 Q2 2008 Q3 2008 Q4 2008 Q1 2009 Q2 2009
Square Feet
Sublease Direct Sublease as % of Total Available
OCCUPIED SPACE BY MAJOR BUSINESS CATEGORIES
18 MONTH TREND
TOP PROJECTS UNDER CONSTRUCTION BY SIZE
Address Sq. Ft. Est. Com.
SUBMARKET CHARACTERISTICS
Source: Colliers International, Q2 2009
Anchor TenantDeveloper
No construction took place during this period.
No transactions were recorded during this period.
Available Direct79%
Available Sublease21%
Total Available Office Space: 15285487 sf
$28.10
$26.44
$21.02
-
500,000
1,000,000
1,500,000
2,000,000
2,500,000
3,000,000
3,500,000
4,000,000
4,500,000
$-
$5
$10
$15
$20
$25
$30
Class A Class B Class C
Sq. Ft.
Gross Rent $/Sq. Ft.
Avail. Office Space Not Avail. Office Space Gross Rent
Note: Not available office space (blue) and available office space (yellow) add up to the total inventory of office space in the respective building class.
$12.15
12.1%
0.0%
2.0%
4.0%
6.0%
8.0%
10.0%
12.0%
14.0%
(10)
(8)
(6)
(4)
(2)
-
2
4
6
8
10
12
14
Q1 2008 Q2 2008 Q3 2008 Q4 2008 Q1 2009 Q2 2009
Vacancy Rate
Net Rent $/sf. / Absorption (10,000's)
Absorption Asking Net Rent Vacancy Rate
Manufacturing & Distribution
30%
Data,Publishing, Broadcasting Services 16%
Finance 17%
Professional Services 13%
Public Service & Private Sector
Services23%
Others1%
* Great access to Don Valley Parkway which runs North-South through the submarket.* Convenient public transport to the TTC Subway along Eglinton and Don Mills Roads.* Major companies in this area inlude Celestica, IBM, Wrigley's Canada, McDonald's Canada, and Home Depot Head Office.* Real Estate costs lower than in denser areas.* Cadillac Fairview is developing Shops at Don Mills, a 450,000-sq.ft. community-based lifestyle centre on the SW corner of Lawrence Ave and Eglinton Ave E with 1,300 mid-rise residential units, retail and office space.
0%
10%
20%
30%
40%
50%
60%
70%
0
100,000
200,000
300,000
400,000
500,000
600,000
700,000
800,000
900,000
1,000,000
Q1 2008 Q2 2008 Q3 2008 Q4 2008 Q1 2009 Q2 2009
Square Feet
Sublease Direct Sublease as % of Total Available
Information contained herein has been obtained from the owners or other sources deemed reliable. We have no reason to doubt its accuracy but regret we
Available Direct79%
Available Sublease21%
Total Available Office Space: 15285487 sf
$28.10
$26.44
$21.02
-
500,000
1,000,000
1,500,000
2,000,000
2,500,000
3,000,000
3,500,000
4,000,000
4,500,000
$-
$5
$10
$15
$20
$25
$30
Class A Class B Class C
Sq. Ft.
Gross Rent $/Sq. Ft.
Avail. Office Space Not Avail. Office Space Gross Rent
Note: Not available office space (blue) and available office space (yellow) add up to the total inventory of office space in the respective building class.
$12.15
12.1%
0.0%
2.0%
4.0%
6.0%
8.0%
10.0%
12.0%
14.0%
(10)
(8)
(6)
(4)
(2)
-
2
4
6
8
10
12
14
Q1 2008 Q2 2008 Q3 2008 Q4 2008 Q1 2009 Q2 2009
Vacancy Rate
Net Rent $/sf. / Absorption (10,000's)
Absorption Asking Net Rent Vacancy Rate
Manufacturing & Distribution
30%
Data,Publishing, Broadcasting Services 16%
Finance 17%
Professional Services 13%
Public Service & Private Sector
Services23%
Others1%
* Great access to Don Valley Parkway which runs North-South through the submarket.* Convenient public transport to the TTC Subway along Eglinton and Don Mills Roads.* Major companies in this area inlude Celestica, IBM, Wrigley's Canada, McDonald's Canada, and Home Depot Head Office.* Real Estate costs lower than in denser areas.* Cadillac Fairview is developing Shops at Don Mills, a 450,000-sq.ft. community-based lifestyle centre on the SW corner of Lawrence Ave and Eglinton Ave E with 1,300 mid-rise residential units, retail and office space.
0%
10%
20%
30%
40%
50%
60%
70%
0
100,000
200,000
300,000
400,000
500,000
600,000
700,000
800,000
900,000
1,000,000
Q1 2008 Q2 2008 Q3 2008 Q4 2008 Q1 2009 Q2 2009
Square Feet
Sublease Direct Sublease as % of Total Available
Information contained herein has been obtained from the owners or other sources deemed reliable. We have no reason to doubt its accuracy but regret we cannot guarantee it. All properties subject to change or withdrawal without notice. All numbers reported use the most accurate information available at the time of publishing, however we acknowledge that there may be marginal changes over time as more accurate information becomes available. Colliers Macaulay Nicolls (Ontario) Inc., Brokerage.

SUBMARKET INDICATORS MAP OF SUBMARKET
Q1 2009 Q2 2009 Trend
Office Inventory* 3,717,206 3,717,206
Net Absorption (36,320) 41,234
Vacancy Rate 8.3% 8.2%
Average Asking Net Rent $12.27 $12.30
Average Additional Rent $13.14 $12.87
AVAILABLE SUPPLY SPLIT AVAILABLE SPACE OPTIONS
0 - 4k sf 4k - 10k sf 10k - 20k sf 20 - 50k sf 50k - 100k sf 100k sf +
# of units** 74 25 9 2 0 0
** Counting smallest divisible units in existing buildings and buildings which are under construction.
RECENT TRANSACTIONS Q2 2009
Suite Sq. Ft. Landlord
800 5,200 2034631 Ontario Inc.
514 4,262 Amexon
GROSS RENT & AVAILABILITY BY BUILDING CLASS Date Address Price Vendor Purchaser Size $/PSF
TOP Office Sale Transactions by Price
Q2-09
No transactions were recorded during this period.
Number of units on the submarket by size brackets
200 Consumers Road InCharge Debt Solutions
1200 Sheppard Avenue E Edisoft Inc.
Office Submarket Dashboard: Consumers Road
*Office Inventory: For the purpose of this report, buildings with less than 10,000 sf of office space and buildings owned and occupied by the
government have not been included in the office inventory. There are 30 office buildings surveyed in this submarket.
TOP Office Lease Transactions by Size
Address Tenant
2,500,000 $35
Avail. Office Space Not Avail. Office Space Gross Rent
0%
2%
4%
6%
8%
10%
12%
14%
0
100,000
200,000
300,000
400,000
500,000
600,000
Q1 2008 Q2 2008 Q3 2008 Q4 2008 Q1 2009 Q2 2009
Square Feet
Sublease Direct Sublease as % of Total Available
OCCUPIED SPACE BY MAJOR BUSINESS CATEGORIES
18 MONTH TREND
TOP PROJECTS UNDER CONSTRUCTION BY SIZE
Address Sq. Ft. Est. Com.
SUBMARKET CHARACTERISTICS
Source: Colliers International, Q2 2009
No transactions were recorded during this period.
No construction took place during this period.
Developer Anchor Tenant
$29.95
$23.28
$19.51
-
500,000
1,000,000
1,500,000
2,000,000
2,500,000
$-
$5
$10
$15
$20
$25
$30
$35
Class A Class B Class C
Sq. Ft.
Gross Rent $/Sq. Ft.
Avail. Office Space Not Avail. Office Space Gross Rent
Note: Not available office space (blue) and available office space (yellow) add up to the total inventory of office space in the respective building class.
$12.30
8.2%
0.0%
1.0%
2.0%
3.0%
4.0%
5.0%
6.0%
7.0%
8.0%
9.0%
10.0%
(10)
(8)
(6)
(4)
(2)
-
2
4
6
8
10
12
14
Q1 2008 Q2 2008 Q3 2008 Q4 2008 Q1 2009 Q2 2009
Vacancy Rate
Net Rent $/sf. / Absorption (10,000's)
Absorption Asking Net Rent Vacancy Rate
Manufacturing & Distribution
27%
Data,Publishing, Broadcasting Services
9%
Finance 21%
Professional Services 29%
Public Service & Private Sector
Services9%
Others5%
* Comparably small submarket with budget-friendly real estate costs.* Excellent access to Hwy 400 series allows for easy in-and-out of the office by employees and customers.* Well served by TTC buses and the Sheppard Subway.* High profile location visible from Highway 401 and Highway 404.* With new residential development at the Concord Park Place and the Don Mills Centre labour pool will expand and diversify.* Fairview Mall offers a sufficient selection of amenities to employees.
0%
2%
4%
6%
8%
10%
12%
14%
0
100,000
200,000
300,000
400,000
500,000
600,000
Q1 2008 Q2 2008 Q3 2008 Q4 2008 Q1 2009 Q2 2009
Square Feet
Sublease Direct Sublease as % of Total Available
Information contained herein has been obtained from the owners or other sources deemed reliable. We have no reason to doubt its accuracy but regret we
$29.95
$23.28
$19.51
-
500,000
1,000,000
1,500,000
2,000,000
2,500,000
$-
$5
$10
$15
$20
$25
$30
$35
Class A Class B Class C
Sq. Ft.
Gross Rent $/Sq. Ft.
Avail. Office Space Not Avail. Office Space Gross Rent
Note: Not available office space (blue) and available office space (yellow) add up to the total inventory of office space in the respective building class.
$12.30
8.2%
0.0%
1.0%
2.0%
3.0%
4.0%
5.0%
6.0%
7.0%
8.0%
9.0%
10.0%
(10)
(8)
(6)
(4)
(2)
-
2
4
6
8
10
12
14
Q1 2008 Q2 2008 Q3 2008 Q4 2008 Q1 2009 Q2 2009
Vacancy Rate
Net Rent $/sf. / Absorption (10,000's)
Absorption Asking Net Rent Vacancy Rate
Manufacturing & Distribution
27%
Data,Publishing, Broadcasting Services
9%
Finance 21%
Professional Services 29%
Public Service & Private Sector
Services9%
Others5%
* Comparably small submarket with budget-friendly real estate costs.* Excellent access to Hwy 400 series allows for easy in-and-out of the office by employees and customers.* Well served by TTC buses and the Sheppard Subway.* High profile location visible from Highway 401 and Highway 404.* With new residential development at the Concord Park Place and the Don Mills Centre labour pool will expand and diversify.* Fairview Mall offers a sufficient selection of amenities to employees.
0%
2%
4%
6%
8%
10%
12%
14%
0
100,000
200,000
300,000
400,000
500,000
600,000
Q1 2008 Q2 2008 Q3 2008 Q4 2008 Q1 2009 Q2 2009
Square Feet
Sublease Direct Sublease as % of Total Available
Information contained herein has been obtained from the owners or other sources deemed reliable. We have no reason to doubt its accuracy but regret we cannot guarantee it. All properties subject to change or withdrawal without notice. All numbers reported use the most accurate information available at the time of publishing, however we acknowledge that there may be marginal changes over time as more accurate information becomes available. Colliers Macaulay Nicolls (Ontario) Inc., Brokerage.

SUBMARKET INDICATORS MAP OF SUBMARKET
Q1 2009 Q2 2009 Trend
Office Inventory* 3,915,391 3,915,391
Net Absorption 2,253 7,783
Vacancy Rate 12.4% 12.5%
Average Asking Net Rent $14.14 $14.13
Average Additional Rent $14.01 $14.05
AVAILABLE SUPPLY SPLIT
AVAILABLE SPACE OPTIONS
0 - 4k sf 4k - 10k sf 10k - 20k sf 20 - 50k sf 50k - 100k sf 100k sf +
# of units** 69 15 10 10 0 0
** Counting smallest divisible units in existing buildings and buildings which are under construction.
RECENT TRANSACTIONS Q2 2009
Suite Sq. Ft. Landlord
209 1,290305 Milner Avenue
Inc.
GROSS RENT & AVAILABILITY BY BUILDING CLASS 518 956 Skyline International
Q2-09
Office Submarket Dashboard:
Scarborough Town Centre
*Office Inventory: For the purpose of this report, buildings with less than 10,000 sf of office space and buildings owned and occupied by the
government have not been included in the office inventory. There are 58 office buildings surveyed in this submarket.
TOP Office Lease Transactions by Size
Address
Number of units on the submarket by size brackets
Tenant
305 Milner Avenue Ashkar & Associates Inc.
55 Town Centre Court OM Mortgage Financial
Group
0%
1%
2%
3%
4%
5%
6%
7%
8%
9%
10%
0
100,000
200,000
300,000
400,000
500,000
600,000
700,000
Q1 2008 Q2 2008 Q3 2008 Q4 2008 Q1 2009 Q2 2009
Square Feet
Sublease Direct Sublease as % of Total Available
GROSS RENT & AVAILABILITY BY BUILDING CLASS 518 956 Skyline International
Date Address Price Vendor Purchaser Size $/PSF
OCCUPIED SPACE BY MAJOR BUSINESS CATEGORIES
18 MONTH TREND
TOP PROJECTS UNDER CONSTRUCTION BY SIZE
Address Sq. Ft. Est. Com.
SUBMARKET CHARACTERISTICS
Source: Colliers International, Q2 2009
No construction took place during this period
TOP Office Sale Transactions by Price
Anchor TenantDeveloper
Group
No transactions were recorded during this period.$31.35
$24.22
$24.81
-
200,000
400,000
600,000
800,000
1,000,000
1,200,000
1,400,000
1,600,000
1,800,000
2,000,000
$-
$5
$10
$15
$20
$25
$30
$35
Class A Class B Class C
Sq. Ft.
Gross Rent $/Sq. Ft.
Avail. Office Space Not Avail. Office Space Gross Rent
Note: Not available office space (blue) and available office space (yellow) add up to the total inventory of office space in the respective building class.
$14.13
12.5%
0.0%
2.0%
4.0%
6.0%
8.0%
10.0%
12.0%
14.0%
16.0%
18.0%
20.0%
(2)
-
2
4
6
8
10
12
14
Q1 2008 Q2 2008 Q3 2008 Q4 2008 Q1 2009 Q2 2009
Vacancy Rate
Net Rent $/sf. / Absorption (10,000's)
Absorption Asking Net Rent Vacancy Rate
Manufacturing & Distribution
4%
Data,Publishing, Broadcasting Services 32%
Finance 15%
Professional Services
7%
Public Service & Private Sector
Services38%
Others4%
*Compared to the City of Toronto as a whole, industry in Scarborough is similar in all labour forcecategories, save for manufacturing which is higher in Scarborough, and professional, scientific andtechnical services which are lower.*Submarket is well serviced by both public transportation and the 400 series highways.*Notable companies that have their headquarters in Scarborough include Toyota Canada Inc., Eli LillyCanada Inc., Thomson Carswell, CTVglobemedia, Novopharm, Cinram, Honda Canada Inc., RoyalDoulton, SKF, Alfa Laval, President's Choice Financial, Aviva, Yellow Pages, and Telus.* Submarket is home to the University of Toronto - Scarborough campus, as well as many other post-secondary campuses.
0%
1%
2%
3%
4%
5%
6%
7%
8%
9%
10%
0
100,000
200,000
300,000
400,000
500,000
600,000
700,000
Q1 2008 Q2 2008 Q3 2008 Q4 2008 Q1 2009 Q2 2009
Square Feet
Sublease Direct Sublease as % of Total Available
Information contained herein has been obtained from the owners or other sources deemed reliable. We have no reason to doubt its accuracy but regret we
$31.35
$24.22
$24.81
-
200,000
400,000
600,000
800,000
1,000,000
1,200,000
1,400,000
1,600,000
1,800,000
2,000,000
$-
$5
$10
$15
$20
$25
$30
$35
Class A Class B Class C
Sq. Ft.
Gross Rent $/Sq. Ft.
Avail. Office Space Not Avail. Office Space Gross Rent
Note: Not available office space (blue) and available office space (yellow) add up to the total inventory of office space in the respective building class.
$14.13
12.5%
0.0%
2.0%
4.0%
6.0%
8.0%
10.0%
12.0%
14.0%
16.0%
18.0%
20.0%
(2)
-
2
4
6
8
10
12
14
Q1 2008 Q2 2008 Q3 2008 Q4 2008 Q1 2009 Q2 2009
Vacancy Rate
Net Rent $/sf. / Absorption (10,000's)
Absorption Asking Net Rent Vacancy Rate
Manufacturing & Distribution
4%
Data,Publishing, Broadcasting Services 32%
Finance 15%
Professional Services
7%
Public Service & Private Sector
Services38%
Others4%
*Compared to the City of Toronto as a whole, industry in Scarborough is similar in all labour forcecategories, save for manufacturing which is higher in Scarborough, and professional, scientific andtechnical services which are lower.*Submarket is well serviced by both public transportation and the 400 series highways.*Notable companies that have their headquarters in Scarborough include Toyota Canada Inc., Eli LillyCanada Inc., Thomson Carswell, CTVglobemedia, Novopharm, Cinram, Honda Canada Inc., RoyalDoulton, SKF, Alfa Laval, President's Choice Financial, Aviva, Yellow Pages, and Telus.* Submarket is home to the University of Toronto - Scarborough campus, as well as many other post-secondary campuses.
0%
1%
2%
3%
4%
5%
6%
7%
8%
9%
10%
0
100,000
200,000
300,000
400,000
500,000
600,000
700,000
Q1 2008 Q2 2008 Q3 2008 Q4 2008 Q1 2009 Q2 2009
Square Feet
Sublease Direct Sublease as % of Total Available
Information contained herein has been obtained from the owners or other sources deemed reliable. We have no reason to doubt its accuracy but regret we cannot guarantee it. All properties subject to change or withdrawal without notice. All numbers reported use the most accurate information available at the time of publishing, however we acknowledge that there may be marginal changes over time as more accurate information becomes available. Colliers Macaulay Nicolls (Ontario) Inc., Brokerage.


