Government of India Ministry of Environment, Forest and Climate Change (Forest Conservation Division) Indira Paryavaran Bhawan, Aliganj, Jor Bagh Road, New Delhi: 110003 Dated: 22nd January, 2021 OFFICE MEMORANDUM Sub: Draft Note for the consideration of the Committee of Secretaries (CoS) on revision of rates of Net Present Value in compliance of Hon’ble Supreme Court Order dated 28th March 2008 - reg. The Undersigned is directed to refer to Hon'ble Supreme Court's order dated 28 th March, 2008 passed in W.P. No. 202 of 1995 in the matter of T. N. Godavarman Thirumalpad vs Union of India wherein Hon’ble Court inter-alia directed as under: “We are of the view that the NPV now fixed is more scientific and is based on all available data. We accept the recommendations and we make it clear that the NPV rate now fixed would hold good for a period of three years and subject to variation after three years” In this connection, it is to inform that MoE&CC, in compliance of directions contained in order dated 23.03.2008, has proposed to revise the rates of NPV and accordingly a draft note for the consideration of the CoS on the proposed revision of NPV rates has been prepared by the Ministry. A copy of the same is available on the PARIVESH and the same may kindly be accessed at website https://parivesh.nic.in/. In view of the above, I am directed to request that comments/considered view on the proposed draft note pertaining to your Ministry/State/UT/organization may kindly be furnished to the MoEF&CC within a period of two weeks time from the date of receipt of CoS Note. In the event of non-receipt of comments/views within the stipulated period from your Ministry/State/UT/organization, the same will be treated as nil by the sponsoring ministry. Encl: As above. Yours faithfully Sd/- (Sandeep Sharma) Assistant Inspector General of Forests Distribution to: 1. Secretary, Ministry of Coal, Government of India 2. Secretary, Ministry of Mines, Government of India 3. Secretary, Ministry of Steel, Government of India File No.5-3/2011-FC(Vol-I)
Transcript
Government of IndiaMinistry of Environment, Forest and Climate Change
Sub: Draft Note for the consideration of the Committee of Secretaries (CoS)on revision of rates of Net Present Value in compliance of Hon’ble SupremeCourt Order dated 28th March 2008 - reg.
The Undersigned is directed to refer to Hon'ble Supreme Court's order dated 28 th
March, 2008 passed in W.P. No. 202 of 1995 in the matter of T. N. GodavarmanThirumalpad vs Union of India wherein Hon’ble Court inter-alia directed as under:
“We are of the view that the NPV now fixed is more scientific and is based on allavailable data. We accept the recommendations and we make it clear that the NPVrate now fixed would hold good for a period of three years and subject to variationafter three years”
In this connection, it is to inform that MoE&CC, in compliance of directionscontained in order dated 23.03.2008, has proposed to revise the rates of NPV andaccordingly a draft note for the consideration of the CoS on the proposed revision ofNPV rates has been prepared by the Ministry. A copy of the same is available on thePARIVESH and the same may kindly be accessed at website https://parivesh.nic.in/.
In view of the above, I am directed to request that comments/considered viewon the proposed draft note pertaining to your Ministry/State/UT/organization maykindly be furnished to the MoEF&CC within a period of two weeks time from the dateof receipt of CoS Note. In the event of non-receipt of comments/views within thestipulated period from your Ministry/State/UT/organization, the same will be treatedas nil by the sponsoring ministry.
Encl: As above.
Yours faithfully
Sd/-(Sandeep Sharma)
Assistant Inspector General of Forests Distribution to:
1. Secretary, Ministry of Coal, Government of India 2. Secretary, Ministry of Mines, Government of India 3. Secretary, Ministry of Steel, Government of India
File No.5-3/2011-FC(Vol-I)
4. Secretary, Ministry of Power, Government of India 5. Secretary, Ministry of Road, Transport and Highways, Government of India 6. Secretary, Ministry of Rural Development, Government of India 7. Secretary, Ministry of Textiles, Government of India 8. Secretary, Ministry of Petroleum and Natural Gas 9. Secretary, Ministry of Jalshakti, Government of India 10.Secretary, Ministry of MNRE, Government of India 11.Secretary, Ministry of Tribal Affairs, Government of India 12.Secretary, Ministry of Railways, Government of India 13.Secretary, Ministry of DoNER, Government of India 14.Chief Secretaries, All State Governments/ Union territories Administrations 15.Director (Technical), NIC, MoEF&CC with a request to upload the draft note on the
website https://parivesh.nic.in/.
File No.5-3/2011-FC(Vol-I)
Copy No…/……
Secret No. 5-3/ 2011-FC
Government of India Ministry of Environment, Forests and Climate Change
Subject: Revision of the rates of Net Present Value (NPV) of forest land diverted for non- forest purpose
1. Background
1.1. Section-2 of the Forest (Conservation) Act, 1980 (FC Act) provides inter-alia that
notwithstanding anything contained in any other law for the time being in force in a State,
no State Government or other authority shall make, except with the prior approval of the
Central Government, any order directing that any forest land or any portion thereof may
be used for any non-forest purpose;
1.2. To mitigate/minimize impact of diversion of forest land for non-forest purpose, Central
Government while according approvals under the FC Act stipulates, among others, a
condition that the State Government shall realize certain specified amount of funds from
the user agency for creation and maintenance of compensatory afforestation.
1.3. In the year 2001, in one of the hearings the Hon'ble Supreme Court noted poor
utilization of amounts realized for creation of compensatory afforestation and issued
notice to the defaulting States.
1.4. On 9th May 2002 Supreme Court directed to constitute a Central Empowered
Committee (CEC) for monitoring the implementation of the Orders passed by them in the
Writ Petition (Civil) No. 202 of 1995 in the matter of T.N. Godavarman Thirumulpad versus
Union of India and Others. The Supreme Court in their said order further directed that all
pending Interlocutory Applications as well as the reports and affidavits filed by the States
Governments in response to the orders passed by the Supreme Court shall be examined
by the CEC and the recommendations will be placed before the Supreme Court for orders.
Secret No. 5-3/ 2011-FC
Government of India Ministry of Environment, Forests and Climate Change
(Forest Conservation Division)
Page 2 of 16
1.5 Accordingly, the CEC submitted a Report dated 05th September, 2002 regarding
Compensatory Afforestation. In the said Report, the CEC inter-alia noted as below:
To compensate for the loss of tangible as well as intangible benefits flowing
from the forest land which has been diverted for non-forest use, net present
value of such land is being recovered from the user-agency in the states of
Madhya Pradesh, Chhattisgarh and Bihar. The underlying principle is that the
plantation raised under the compensatory afforestation scheme can never
adequately compensate for the loss of natural forests as the plantations require
more time to mature and even then they are a poor substitute to natural forest.
In the States of Madhya Pradesh and Chhattisgarh, the net present value is
being recovered @ Rs. 5.80 Lakhs per hectare to Rs.9.20 lakhs per hectare of
the forest land depending upon the quality and density of the forest land diverted
for non-forestry use. The States/ UTs as well as Ministry of Environment &
Forests are of the view that in addition to the funds realized for compensatory
afforestation, the net present value of forest land being diverted for non-forestry
purposes should also be recovered from the user-agency. The fund so
recovered could be utilized for undertaking specific activities such as forest
protection and other conservation measures. It is, therefore, desirable that
norms for this purpose may be laid down for all the States."
1.6 The CEC in their report therefore; recommended that in addition to the funds realized
for compensatory afforestation, net present value of the forest land diverted for non-
forestry purposes shall be recovered from the user-agencies, while according approval
under the FC Act.
1.7 After considering the Report dated 05th September, 2002 of the CEC, the Supreme
Court in their order dated 29th -30th October 2002 inter-alia directed as under.
“ ………while according transfer under Forest Conservation Act, 1980 for change in
user from all non-forest purposes, the user agency shall also pay into the said fund
Secret No. 5-3/ 2011-FC
Government of India Ministry of Environment, Forests and Climate Change
(Forest Conservation Division)
Page 3 of 16
the net value of the forest land diverted for non-forest purposes. The net present
value is to be recovered at the rate of Rs.5.80 lakhs per hectare to Rs. 9.20 lakhs
per hectare of forest land depending upon the quantity and density of the land in
question converted for non-forest use. This will be subject to upward revision by the
Ministry of Environment in consultation with Central Empowered Committee as and
when necessary."
1.8 Supreme Court in their Judgment dated 26th September, 2005 observed that the
question as to what amount of NPV is required to be paid is to be examined by experts.
The Supreme Court accordingly directed that a Committee comprising of three experts
including Mrs. Kanchan Chopra shall be appointed to:
i. Identify and define parameters (scientific, biometric and social) on the basis of
which each of the categories of values of forest land should be estimated.
ii. Formulate a practical methodology applicable to different bio-geographical zones
of India for estimation of the values in monetary terms in respect of each of the
above categories of forest values.
iii. IIIustratively apply this methodology to obtain actual numerical values for different
forest types for each bio-geographical zone in the country.
iv. Determine on the basis of established principles of public finance, who should pay
the costs of restoration and/or compensation with respect to each category of
values of forests.
v. Identify he projects which deserve to be exempted from payment of NPV.
1.9 Accordingly, a Committee consisting of Mrs. Kanchan Chopra gave a report and the
same was examined by the CEC.
1.10 The CEC examined the report of the Committee. For the purpose of NPV, the CEC
grouped the 16 major forest types of the country into 6 ecological classes depending upon
their ecological functions. Based on crown density, forests of each eco-class were further
sub-divided into three categories viz. very dense forests, moderately dense forests and
Secret No. 5-3/ 2011-FC
Government of India Ministry of Environment, Forests and Climate Change
(Forest Conservation Division)
Page 4 of 16
open forests. For calculating the average net percent value per hectare, the CEC
considered monetary value of eight types of goods and services provided by the forest
were considered. These goods and services are- timber and fuel, fodder, eco-tourism,
bio-prospecting, ecological services, flagship species and carbon sequestration.
1.11 The CEC finally recommended the following rates of NPV:
(in rupees per hectare)
Eco- class
Very Dense Forest
Dense Forest Open Forest Class
Class I 10,43,000 9,39,000 7,30,000
Class II 10,43,000 9,39,000 7,30,000
Class III 8,87,000 8,03,000 6,26,000
Class-IV 6,26,000 5,63,000 4,38,000
Class V 9,39.000 8,45,000 6,57,000
Class VI 9,91,000 8,97,000 6,99,000
1.12 The CEC further recommended that:
i. the use of forest land falling National parks/ Wildlife Sanctuaries will be permissible
only in totally unavoidable circumstances for public interest projects and after
obtaining permission from the Hon'ble Supreme Court. Such permissions may be
considered on payment of an amount equal to ten times in the case of national
Parks and five times in the case of Sanctuaries respectively of the NPV payable
for such areas. The use of non-forest land falling within the National Parks and
Wildlife Sanctuaries may be permitted on payment of an amount equal to the NPV
payable for the adjoining forest area. In respect of non-forest land falling within
marine National Parks/Wildlife Sanctuaries, the amount may be fixed at five times
the NPV payable for the adjoining forest area; and
ii. these NPV rates may be made applicable with prospective effect except in specific
cases such as Lower Subhanshri Project, mining leases of SECL, Field Firing
Ranges, wherein pursuant to the orders passed by the Supreme Court, the
Secret No. 5-3/ 2011-FC
Government of India Ministry of Environment, Forests and Climate Change
(Forest Conservation Division)
Page 5 of 16
approvals have been accorded on lump-sum payment/no payment towards the
NPV.
1.13 The Supreme Court in their order dated 28th March 2008 accepted the afore-
mentioned recommendations of the CEC. Supreme Court in their said Order further
directed that the NPV rate now fixed would hold good for a period of three years and
subject to variation after three years.
1.14 The Supreme Court in their order dated 5th May 2008 exempted projects of certain
categories from the payment of NPV. A statement containing details of such categories
and the extent of exemption applicable to each such category is enclosed as Annexure-
I (page- 15).
1.15 Supreme Court in their order dated 9th May 2008 accepted the recommendations of
CEC that Wind Power Projects should pay 50% of the NPV at the minimum rate charged,
provided minimal tree felling is involved.
1.16 Keeping in view that more than three years had already elapsed since the revised
rates of NPV came into force, the MoEF&CC vide O.M. dated 5th March 2012 assigned a
study to the Indian Institute of Forest Management (IIFM), Bhopal to suggest revision in
NPV rates with following Terms of Reference (ToR):
(i) Critically examine the methodology adopted by the committee constituted
under the Chairmanship of Mrs. Kanchan Chopra for estimation of NPV for
different category/ classes of forests and suggests appropriate amendment
therein and recommend revised rates of NPV for different classes/ category of
forests;
(ii) Formulate objective parameters to identify the category of project(s) eligible
from payment of NPV in part or in full and prepare an exhaustive list of the
category of projects eligible from payment of NPV, in part or in full, along with
Secret No. 5-3/ 2011-FC
Government of India Ministry of Environment, Forests and Climate Change
(Forest Conservation Division)
Page 6 of 16
terms of conditions, if any, to be fulfilled by such projects to avail exemption
from payment of NPV;
(iii) Recommend the period of validity of realization of NPV;
(iv) Any other recommendations to make the realization of NPV more objective and
scientific.
A copy of the MoEF&CC's said O.M. dated 5th March 2012 is enclosed as Annexure-Il
(page- 17)
1.17 Meanwhile, Central Government constituted a Group of Minister (GoM) under the
Chairmanship of the then Union Finance Minister, to consider measures that can be taken
by the Government to tackle corruption. In pursuance to recommendations of the GoM,
an Expert Committee on Allocation of Natural Resources (CANR) headed by former
Finance Secretary Shri Ashok Chawla was constituted to recommend measures required
for enhancing transparency, effectiveness and sustainability in utilization of natural
resources. The Expert Committee was mandated to:
a) Identify key natural resources being allocated by Government;
b) Examine the efficacy and suitability of existing legal and regulatory framework and
rules being employed in the allocation process; and
c) Recommend measures for enhancing their sustainability and improving
transparency and effectiveness of the allocation process.
1.18 The CANR made 81 recommendations including the following recommendation:
"55. The committee recommends suitably re-adjusting the payments under NPV
and above schemes. Forest land has value over and above the value of the land
itself. The re-adjustment should achieve comparability with guidelines land
valuation for other purposes e.g. acquisition"
1.19 The said recommendation of the CANR has been accepted by the Central
Government. The MoEF&CC therefore; vide letter dated 12th November 2012 advised the
Secret No. 5-3/ 2011-FC
Government of India Ministry of Environment, Forests and Climate Change
(Forest Conservation Division)
Page 7 of 16
IIFM, Bhopal to consider the above recommendation while formulating revised rates of
NPV. A copy of the MoEF&CC's said O.M. dated 12th November 2012 is enclosed as
Annexure-III (page - 18).
1.20 The IIFM, Bhopal vide letter dated 28th June 2013 submitted a report entitled
"Revision of Rates of NPV applicable for different classes/ categories of forests" and on
29th July, 2013, the MoEF&CC placed a copy of the said Report on website of the Ministry
and sought comments from the stakeholders. The MoEF&CC vide O.M. dated 30th July
2015 requested the States/ UTs and the Ministries of Mines, Coal, Steel, Power, Surface
Transport and Highways, Rural Development, Agriculture, Water Resources and
Planning Commission to furnish their comments within one month.
1.21 Meanwhile, the MoEF&CC, vide O.M. dated 29th August 2014 constituted a High
Level Committee (HLC) under Chairmanship of Shri T.S.R. Subramanian to review the
five Environmental Laws, including the Forest (Conservation) Act, 1980. The HLC
recommended that NPV should be at least five times the present rates.
1.22 PMO vide their I.D. dated 28th October 2014 informed this Ministry that it is essential
to examine the comments of all Ministries/ Departments as also States/ UTs before
revision the rates of the Net Present Value (NPV) in relation on Compensatory
afforestation. Hence the recommendations of Indian Institute of Forest Management
(IIFM) report on NPV rates need to be duly deliberated based on the comments of all
Ministries/ Departments and States/ UTs. PMO in the said I.D. requested the MoEF&CC:
(a) to again circulate the IIFM report formally to Ministries and States/ UTs and to get their
comments;
(b) To place the matter before CoS for due deliberations after all such comments are
received.
A copy of the said PMO ID is enclosed as Annexure-IV (page - 19).
Secret No. 5-3/ 2011-FC
Government of India Ministry of Environment, Forests and Climate Change
(Forest Conservation Division)
Page 8 of 16
1.23 Accordingly, the MoEF&CC vide O.M. dated 13th November 2014 sent a copy of the
revised report of the IIFM Bhopal to all States & Union Territories and Ministries of Mines,
Coal, Steel, Power, Road Transport & Highways, Rural Development, Agriculture, Water
Resources and NITI Aayog and requested them to furnish their comments within 15 days.
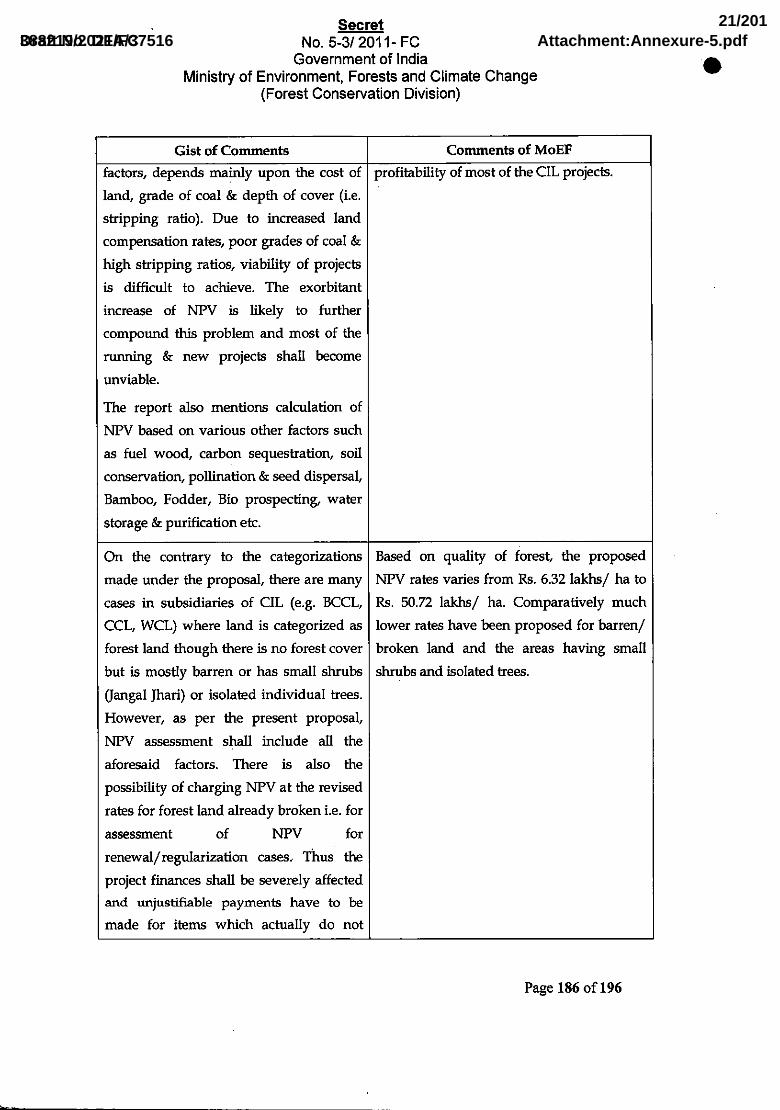
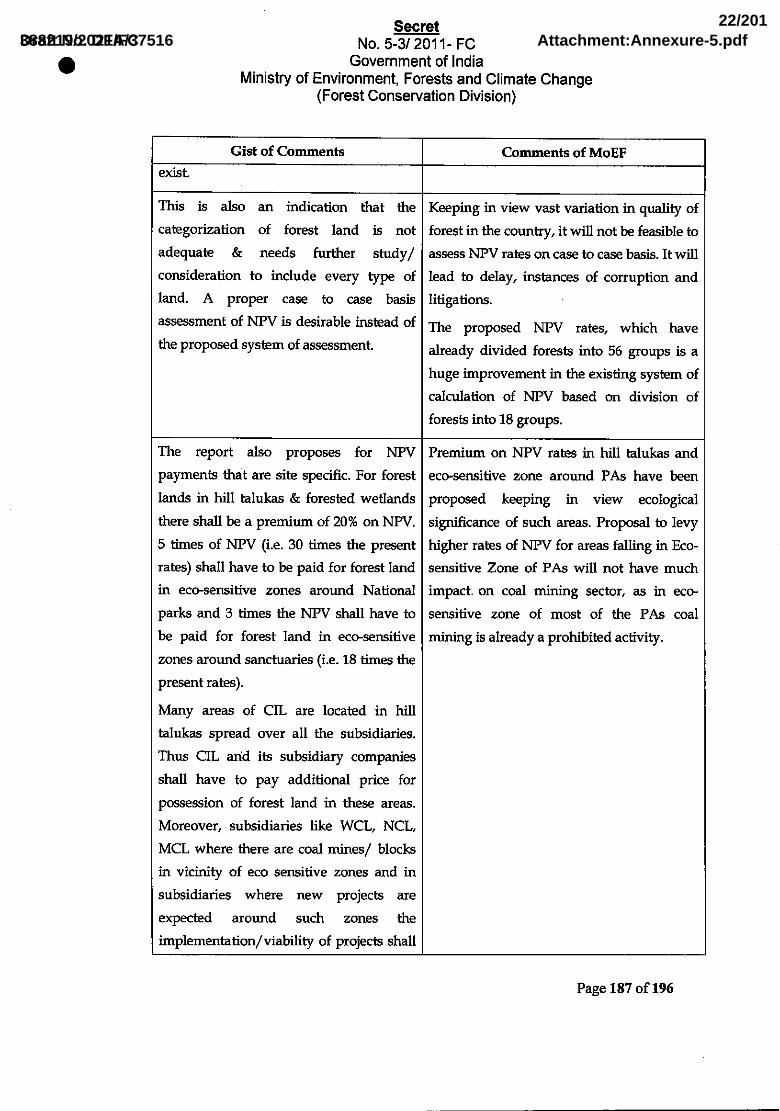
1.24 The MoEF&CC received comments from the Ministries of Water Resources, River
Development and Ganga Rejuvenation; Coal and Rural Development. The MoEF&CC
also received comments from the State Governments of Tamil Nadu, Chhattisgarh and
Goa. Details of these comments and observations of the MoEF&CC thereon are given in
Annexure-V (page – 20 to page - 31).
1.25 Based on comments received from the stakeholders and observations of the
MoEF&CC, the IIFM prepared a revised report a submitted the same to the MoEF&CC in
November, 2014. A copy of the revised report of the IIFM, Bhopal is enclosed as
Annexure-VI (page- 32 to page - 196). For the purpose of the estimation of NPV, forests
of the country were divided into 14 Forest Type Groups. Each of the 14 Forest Type
Groups were further sub-divided into four density classes viz. very dense forests (VDF),
moderately dense forests (MDF), open forests (OF) and scrubs. After, detailed
consultations and deliberations the NPV rates (rupees in lakhs per hectares) for forests
of different Forest Type Groups and density classes were proposed as below:
Forest Type Group Very dense forest
Moderately dense forest
Open forest
Areas with less than 10% crown density
Tropical Wet Evergreen Forest-North East
36.80 20.42 18.34 7.23
Tropical Wet Evergreen Forest-Western Ghats
40.76 29.94 13.46 8.62
Tropical Semi Evergreen Forest-north East
22.92 17.30 9.61 6.32
Tropical Semi Evergreen Forest-Eastern Deccan
50.77 42.59 24.72 23.28
Tropical Semi Evergreen Forest-Western Ghats
32.50 22.86 14.81 9.77
Secret No. 5-3/ 2011-FC
Government of India Ministry of Environment, Forests and Climate Change
(Forest Conservation Division)
Page 9 of 16
Tropical Moist Deciduous Forests
29.02 21.58 13.03 7.37
Littoral & Swamp Forests 46.88 33.96 21.73 16.99
Tropical Dry Deciduous Forests
23.49 17.64 10.55 7.36
Tropical Thorn Forests 13.41 12.60 9.95 7.37
Tropical & Subtropical Dry Evergreen Forests
26.76 20.48 12.57 7.20
Subtropical Pine/Broadleaved Hill Forests
22.03 17.59 6.45 6.45
Montane & Moist Temperate Forests
29.36 23.41 13.25 6.79
Sub Alpine & Dry Temperate Forest
24.89 19.87 11.16 5.54
Alpine Scrub 26.49 26.49 26.49 26.49
1.26 The MoEF&CC, vide its letter dated 17.02.2016 submitted note for the consideration
of Committee of Secretaries (CoS) titled “Revision of the rates of the Net Present Value
(NPV) of the forest land diverted for non-forestry purposes”.
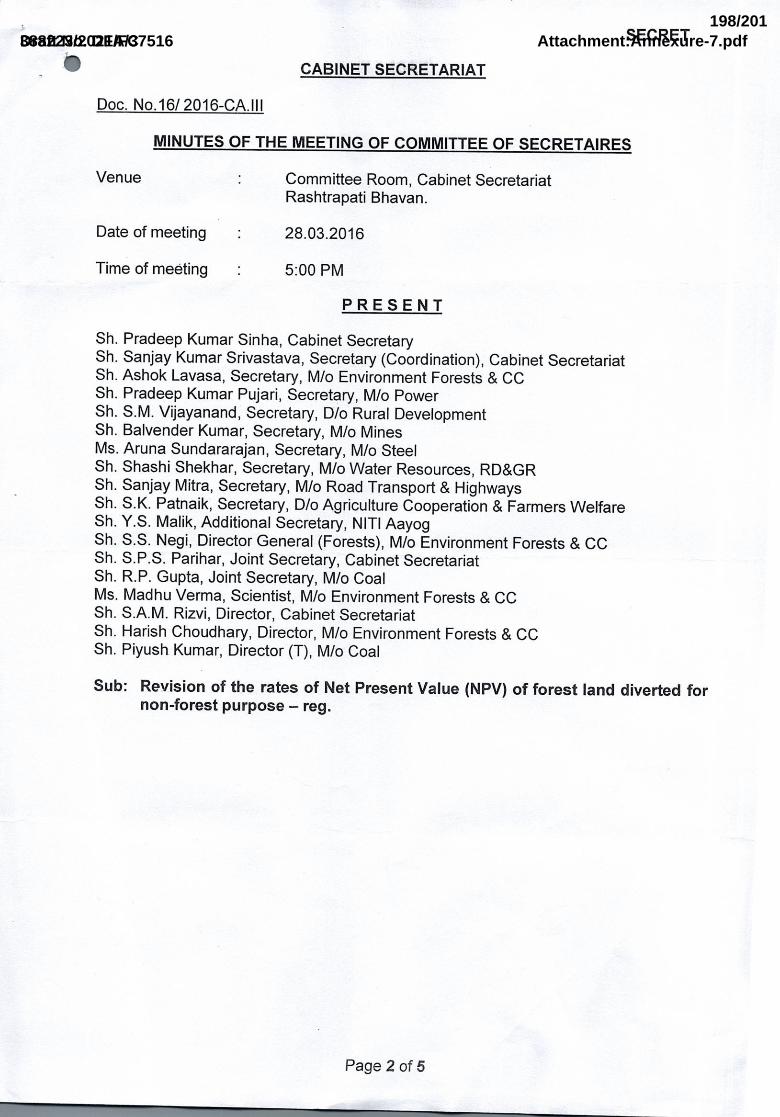
1.27 The CoS in its meeting held on 28th March, 2016 considered the proposal of the
MoEF&CC and after detailed deliberation made following decisions:
(a) MoEF&CC may prepare a combined statement showing the existing and proposed
rates of NPV for different categories of forests. The Statement should also show
the percentage of forest land diverted in the different categories in the last 10
years. The number of years of rotation adopted for different categories of forests
for calculation of NPV should also be shown in the comparative statement.
(b) Ministries may carry out an analysis of the impact of the proposed rates of NPV of
per unit cost relevant to the respective sectors and share it with MoEF&CC.
(c) MoEF&CC may examine the suggestions of different ministries including those on
categories of exempted projects.
(d) MoEF&CC may prepare a note with analysis and views on (a) to (c) above for
further consideration of the CoS at the earliest.
Secret No. 5-3/ 2011-FC
Government of India Ministry of Environment, Forests and Climate Change
(Forest Conservation Division)
Page 10 of 16
A copy of the minutes of the meeting of the CoS held on 28.03.2016 is enclosed as
Annexure-VII (page -197 - to page -201).
1.28 The MoEF&CC, in pursuance to decision of CoS, vide letter dated 7.06.2016
requested all Regional Offices of the MoEF&CC to provide the shape/kml files of all forest
areas diverted during the last 10 years to FSI to enable FSI to ascertain the NPV class of
such diverted areas.
1.29 Pending receipt of information, the matter was reviewed in the Ministry and it was
proposed that given the technical nature of information sought, it is difficult to retrieve and
compile the requisite information for the last 10 years. It was also apprehended that due
to technical nature of the report and substantial increase in NPV rates, finalization of
report may take considerable time. Accordingly, till a time the proposal of revision of NPV
is approved by the CoS, an interim arrangement for revision of NPV rates, based on the
Wholesale Price Index was proposed by the Forest Conservation Division of the
MoEF&CC.
1.30 Progress in the revision of NPV rates and compliance of decision of CoS were further
reviewed in the Ministry on 5.11.2020. It was apprehended that proposal submitted to
CoS envisages abrupt increase in the NPV rates as high as 4 times of the existing rates.
It may impact the existing projects and ultimately on national economy i.e. it may increase
the tariff rates both for power and other infrastructure sector projects, surge import bills
of Central Government and moreover, the smaller projects may be rendered unviable. It
was also deliberated that Ministry of Steel, Ministry of Coal, Ministry of Power and NITI
AYOG during the last meeting of CoS held on 28.03.2016 have also raised certain
reservation on the proposed abrupt increase in the NPV. Given this situation, it may not
be prudent to pursue the proposal already submitted to the CoS rather extant proposal
which seems to be justified and envisages gradual increase in NPV should be pursued
further for consideration of the CoS.
Secret No. 5-3/ 2011-FC
Government of India Ministry of Environment, Forests and Climate Change
(Forest Conservation Division)
Page 11 of 16
2.0 The Proposal
2.1 Keeping in view that more than three years had already elapsed since the revised
rates of NPV came into force, the MoEF&CC, proposes to revise the NPV rates based on
Wholesale Price Index (WPI).
2.2 the WPI indices (all commodities) for the period 2004-05 to 2019-20, as available on
the website of Office of Economic Adviser and estimated using linking factor prescribed
by the O/o Economic Adviser, were used estimate the fitment factor for revising NPV rates
(considering 2008-09 as base year) as under:
S. No.
Financial year
WPI for series with base year 2004-05
WPI for series with base year 2011-12
Linking factor for base year 2011-12
prescribed by OEA
WPI estimated
for last two
financial years
Estimated WPI
considering 2008-09 as base year
1 2004-05 100.00 - - 100.00 -
2 2005-06 104.47 - - 104.47 -
3 2006-07 111.35 - - 111.35 -
4 2007-08 116.63 - - 116.63 -
5 2008-09 126.02 - - 126.02 100.00
6 2009-10 130.81 - - 130.81 103.80
7 2010-11 143.32 - - 143.32 113.73
8 2011-12 156.13 100 1.561 156.13 123.89
9 2012-13 167.62 106.9 1.561 167.62 133.01
10 2013-14 177.64 112.5 1.561 177.64 140.96
11 2014-15 181.19 113.9 1.561 181.19 143.78
12 2015-16 176.67 109.7 1.561 176.67 140.19
13 2016-17 183.20 111.6 1.561 183.2 145.37
14 2017-18 - 114.9 1.561 179.36 142.33
15 2018-19 - 119.8 1.561 187.01 148.40
16 2019-20 - 121.8 1.561 190.13 150.87
2.3 A fitment factor was estimated using above WPI indices to estimate the revised rates of NPV. Fitment factor value of 1.51 (say ‘X’) has been used to estimate the corresponding revision in the rates of NPV as given under:
Revised NPV = (X)*Existing rate of NPV (where X= 1.51)
Secret No. 5-3/ 2011-FC
Government of India Ministry of Environment, Forests and Climate Change
(Forest Conservation Division)
Page 12 of 16
2.4 The matrix for revised rates of NPV, derived using the above formula is given as under
2.5 Subject to following amendments, projects of certain categories, as per details given
in a statement containing details of activity-wise current and proposed level of exemption
from applicable NPV, are proposed to be exempted from payment of NPV, in part or full,
as per details given in the said statement:
(i) To expedite relocation of villages from Protected Areas to create inviolate space
for wild animals, the present dispensation to fully exempt the forest land diverted
for relocation of villages from Protected Areas from payment of NPV for may be
retained.
(ii) In case of wind energy projects and small hydroelectric projects (up to to 25 MW
capacity) NPV may be realised at 50 % of the applicable rates of the forest land
actually diverted for setting up of such projects, provided the project involves felling
of not more than 5 trees per hectare.
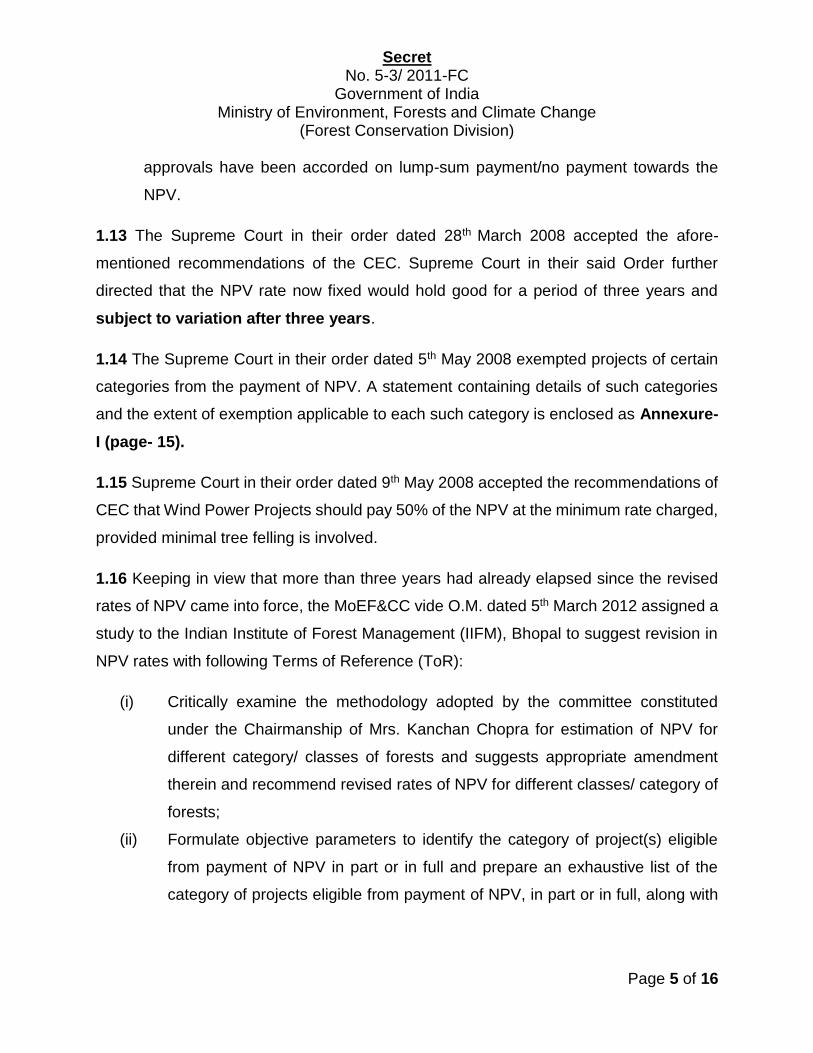
(iii) Keeping in view substantially low impact of underground mining on flora and fauna,
the present dispensation to levy NPV of forest land diverted for underground
mining projects where, as per the 3- D subsidence prediction model the surface
strain is not likely to exceed 20 mm per meter, at 50 % of the normal rates of NPV
for such forest land may be retained. In case of underground mining projects where
Secret No. 5-3/ 2011-FC
Government of India Ministry of Environment, Forests and Climate Change
(Forest Conservation Division)
Page 13 of 16
surface strain predicted by the 3- D Subsidence Prediction Model is much lower
than 20 mm per meter, NPV may be levied as given below:
S. No. Surface strain predicted by 3-D
subsidence prediction model
NPV rates
1. Upto 5mm/m Nil
2. 5 mm/m to 10 mm/m 10% of normal rates of NPV
3. 10 mm/m to 15 mm/m 25% of normal rates of NPV
4. 15mm/m to 20 mm/m 50% of normal rates of NPV
(iv) In case of Field Firing Ranges (FFRs), the NPV may be levied at the rate of 20 %
of the normal rates of NPV for the forest areas falling within the impact zone. The
forest areas falling within safety zone of FFRs shall be fully exempted from the
requirement of payment of NPV.
3.0 Justification
3.1 Wholesale Price Index (WPI) is an important measure to monitor the dynamic
movement of prices at the wholesale level. WPI is also used for the purpose of escalation
clauses in the supply of raw materials, machinery and construction work. Business firms
in search of effective methods for coping with changes in prices often employ price
adjustment (escalation) clauses in long-term sales and purchase contracts. WPI is widely
recognized among business people, economists, statisticians, and accountants as a
useful objective indexing tool in price adjustment clauses.
3.2 The Central Empowered Committee, in their report dated 2nd January, 2007, which
was accepted by Hon’ble Supreme Court on 28.03.2008, with regards to the revision of
NPV rates inter-alia recommended the following:
“…..Till then, the NPV may continue to be charged corresponding to the eco-value
class/sub-class in which the forest land is located. The value of the NPV may be revised
Secret No. 5-3/ 2011-FC
Government of India Ministry of Environment, Forests and Climate Change
(Forest Conservation Division)
Page 14 of 16
periodically, say every five years, on the basis of forest cover assessment done by the
FSI and the change in the wholesale price index”.
3.3 Substantial increase in the rates of NPV may impact the existing projects and
ultimately the national economy of the country.
4. Inter-Ministerial Consultations
5. Decision sought from the Committee of Secretaries
5.1 Keeping in view the facts stated above, the Committee of Secretaries may approve
the proposal of the MoEF&CC to revise the NPV rates as per details given in
paragraph 2.1 to 2.5 above.
(A. K. Mohanty)
Inspector General of Forests (Forest Conservation) (011-2469 5336)
New Delhi ; the ………January, 2021
Secret No. 5-3/ 2011-FC
Government of India Ministry of Environment, Forests and Climate Change
(Forest Conservation Division)
Page 15 of 16
Annexure-1
(Reference Para 1.14)
Categories of Projects Exempted from the Requirement of Payment of NPV of
Forest land Required for Such Projects
Category Conditions
(i) Schools (ii) Hospitals (iii) Children's playground of
non- commercial nature. (iv) Community centers in
rural areas. (v) Over-head tanks 3 (vi) Village tanks (vii) Laying of underground
drinking water pipeline upto 4 inch diameter and
(viii) Electricity distribution line upto 22 KV in rural areas.
Full exemption upto 1 ha. of forest land provided : (a) no felling of trees is involved; (b) alternate forest land is not available; (c) the project is of non-commercial nature and is part of the Plan/Non-Plan Scheme of Government; and (d) the area is outside National Park/Sanctuary
Relocation of villages form the National Parks/ Sanctuary to alternate forest land
Full exemption
Collection of boulders/silts from the river belts in the forest area.
Full exemption provided :- (a) area is outside National Park/
Sanctuary; (b) no mining lease is approved/
Secret No. 5-3/ 2011-FC
Government of India Ministry of Environment, Forests and Climate Change
(Forest Conservation Division)
Page 16 of 16
Secret No.5-3/ 2011- FC
Government of India Ministry of Environment, Forests and Climate Change
(Forest Conservation Division)
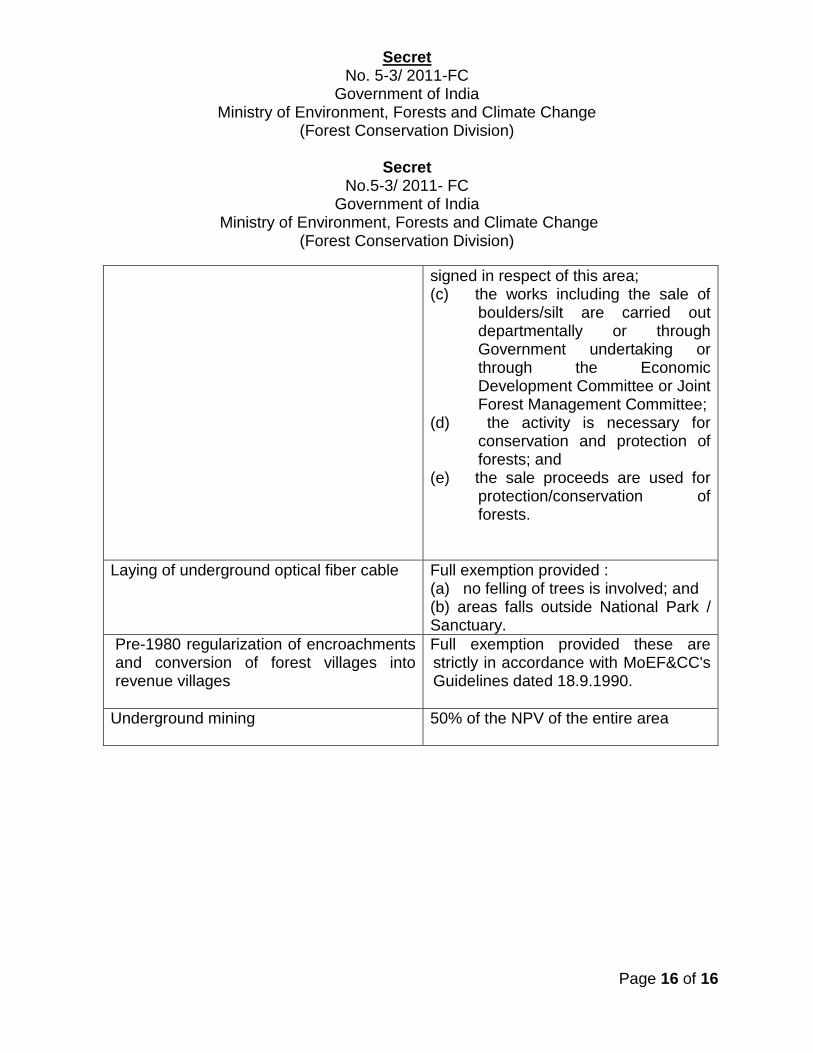
signed in respect of this area; (c) the works including the sale of
boulders/silt are carried out departmentally or through Government undertaking or through the Economic Development Committee or Joint Forest Management Committee;
(d) the activity is necessary for conservation and protection of forests; and
(e) the sale proceeds are used for protection/conservation of forests.
Laying of underground optical fiber cable
Full exemption provided : (a) no felling of trees is involved; and (b) areas falls outside National Park / Sanctuary.
Pre-1980 regularization of encroachments and conversion of forest villages into revenue villages
Full exemption provided these are strictly in accordance with MoEF&CC's Guidelines dated 18.9.1990.
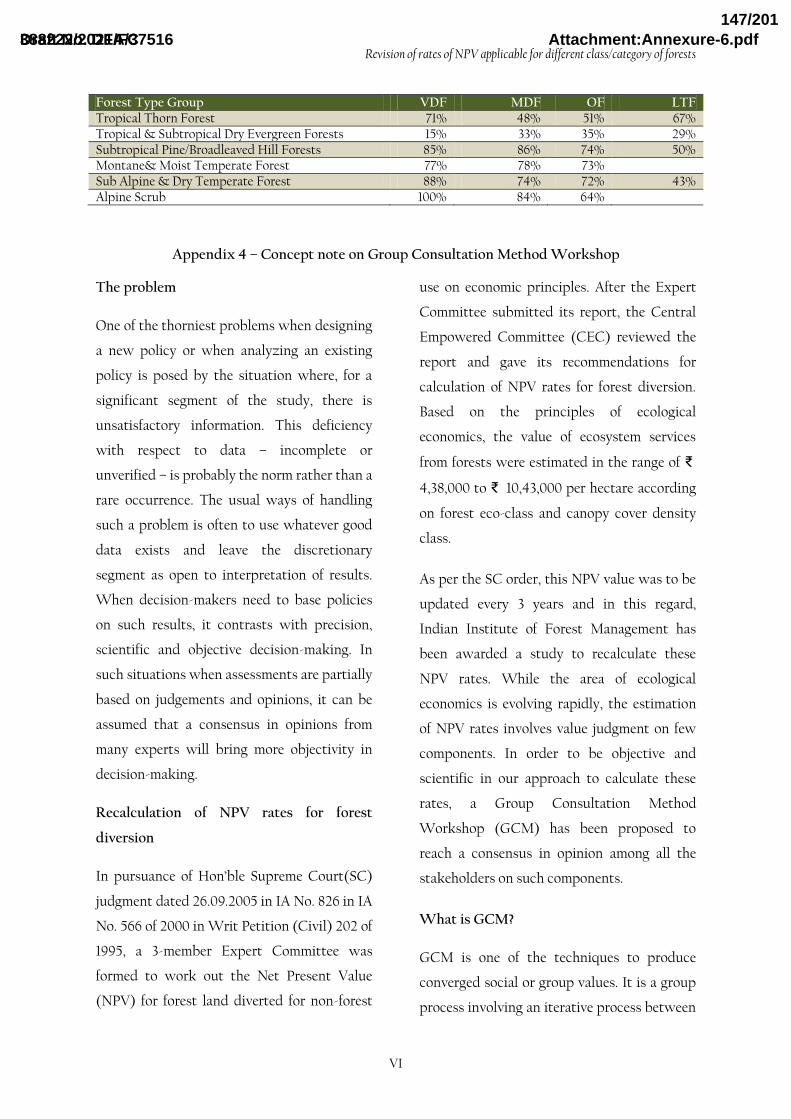
Revision of rates of NPV applicable for different class/category of forests
viii
KEY MESSAGES
The rationale for NPV collection, in addition to compensatory afforestation, is to balance the uncompensated benefits of lost forest ecosystem services till the compensatory afforestation area starts providing comparable benefits.
The current study classifies the forests into 14 Forest Type Groups on the basis of Champion and Seth Classification and 4 Forest Canopy Cover Density Class (Very Dense, Moderately Dense, Open Forest and Less than 10% Canopy). The
economic value of forest ecosystem services is estimated for these (14 x 4 = 56) classification units individually.
The study recognizes the fact that few classification units may have dominant ecosystem services in terms of their economic value which may be very different from other classification units in which some other ecosystem services may
dominate. The methodology is thus designed to objectively estimate the economic value of ecosystem services originating from different classification units by appropriately considering the specific factors rather than using a blanket value
across the country.
The array of forest goods and services valued in the report comprise of timber, bamboo, fodder, fuelwood, NWFP, gene-pool conservation, carbon sequestration, carbon storage, soil conservation, water recharge, pollination and seed
dispersal, and water purification.
Rather than taking a blanket value of 20 years as the rotation period of forest, the study also estimates the rotation period for each unit of classification based on the rotation period of dominant tree species.
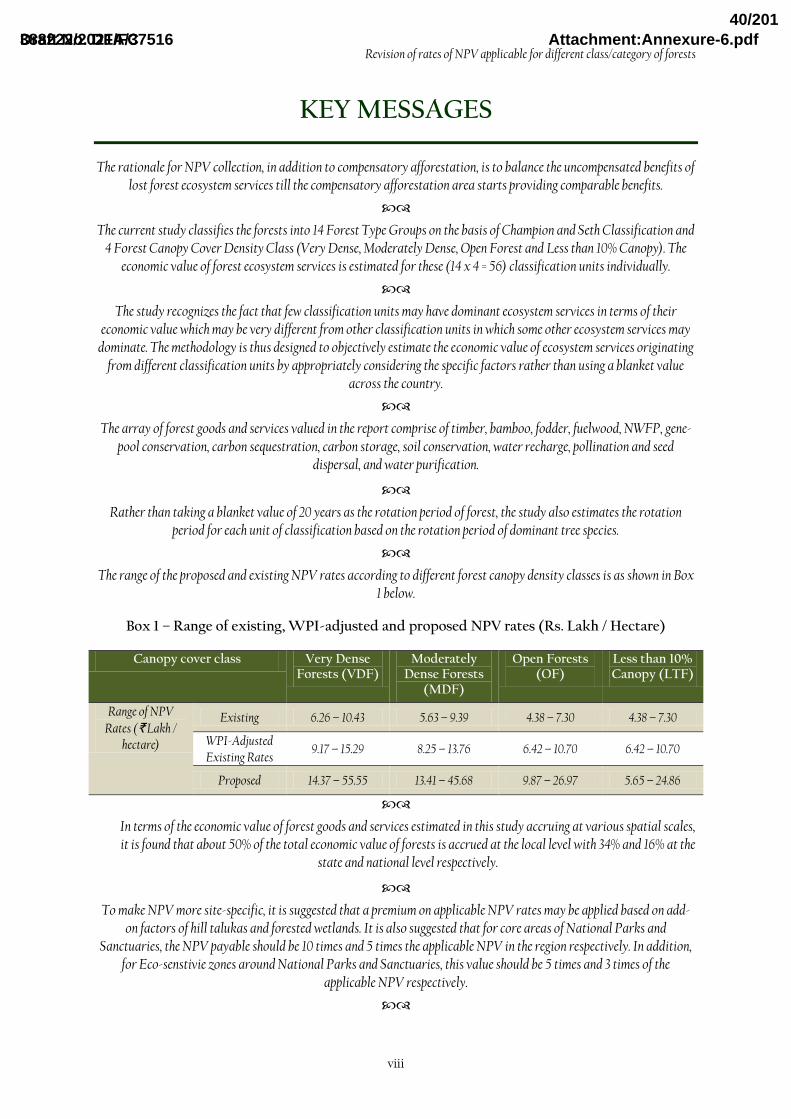
The range of the proposed and existing NPV rates according to different forest canopy density classes is as shown in Box 1 below.
Box 1 – Range of existing, WPI-adjusted and proposed NPV rates (Rs. Lakh / Hectare)
In terms of the economic value of forest goods and services estimated in this study accruing at various spatial scales, it is found that about 50% of the total economic value of forests is accrued at the local level with 34% and 16% at the
state and national level respectively.
To make NPV more site-specific, it is suggested that a premium on applicable NPV rates may be applied based on add-on factors of hill talukas and forested wetlands. It is also suggested that for core areas of National Parks and
Sanctuaries, the NPV payable should be 10 times and 5 times the applicable NPV in the region respectively. In addition, for Eco-senstivie zones around National Parks and Sanctuaries, this value should be 5 times and 3 times of the
Revision of rates of NPV applicable for different class/category of forests
ix
To incorporate the value of the using the space of forest land besides its NPV, the report also recommends adoption of “Possession Value” of forest land in urban and peri-urban areas. This one-time charge should be valued either at 50% of the collector rate of market value of land or value as assessed by the local authority in absence of the collector rate plus
the NPV or prevalent market rate for acquiring forest land (specially where NPV may be negligible),whichever is higher.
Based on the consultation carried out with wide range of stakeholders, the current levels of exemptions have been largely accepted. However, modifications are suggested in some project categories that have significant and/or permanent
impact on the ecological fabric of the land.
The study suggests that proper targeting of fund apart from compensating affected local communities is essential to realize the mandate of NPV mechanism through effective compensation & institutional mechanisms. The study also recognizes the need for establishing Incentive Based Mechanisms (IBMs) for promoting good practices among user
agencies and encouraging return of land to the forest department after appropriate treatment.
The first draft of the report uploaded on MoEFCC’s website received comments from a range of stakeholders on issues related to frequency of revision of NPV rates, exemptions from NPV, premium on NPV, classification of forests,
methodology of calculating NPV rate, and ecosystem services included as well as excluded by the study. After rigorous analysis and discussions with various officials from MoEFCC, this updated draft had made an attempt to internalize
stakeholder concerns.
In addition to paying Net Present Value rates of forest to be diverted, the user agencies are also required to pay for compensatory afforestation (CA). While natural forests can never be replaced by plantations, these measures also
compensate for a portion of ecosystem services lost as a result of forest diversion. A Standard Compensatory Afforestation Restoration Factor (SCARF) has been estimated to further adjust the applicable NPV based on the
proportion of value of ecosystem services restored due to compensatory afforestation.
In order to aid decision-making of MoEFCC in dealing with the plethora of issues related to NPV, it is proposed that a year-round data gathering and analysis hub of MoEFCC be located at the Centre for Ecological Services Management,
IIFM. The Hub is proposed to render transparency, objectivity and consistency to the decision-making process and provide information on various forest land transfer and ecosystem services related issues and queries received by
Revision of rates of NPV applicable for different class/category of forests
xi
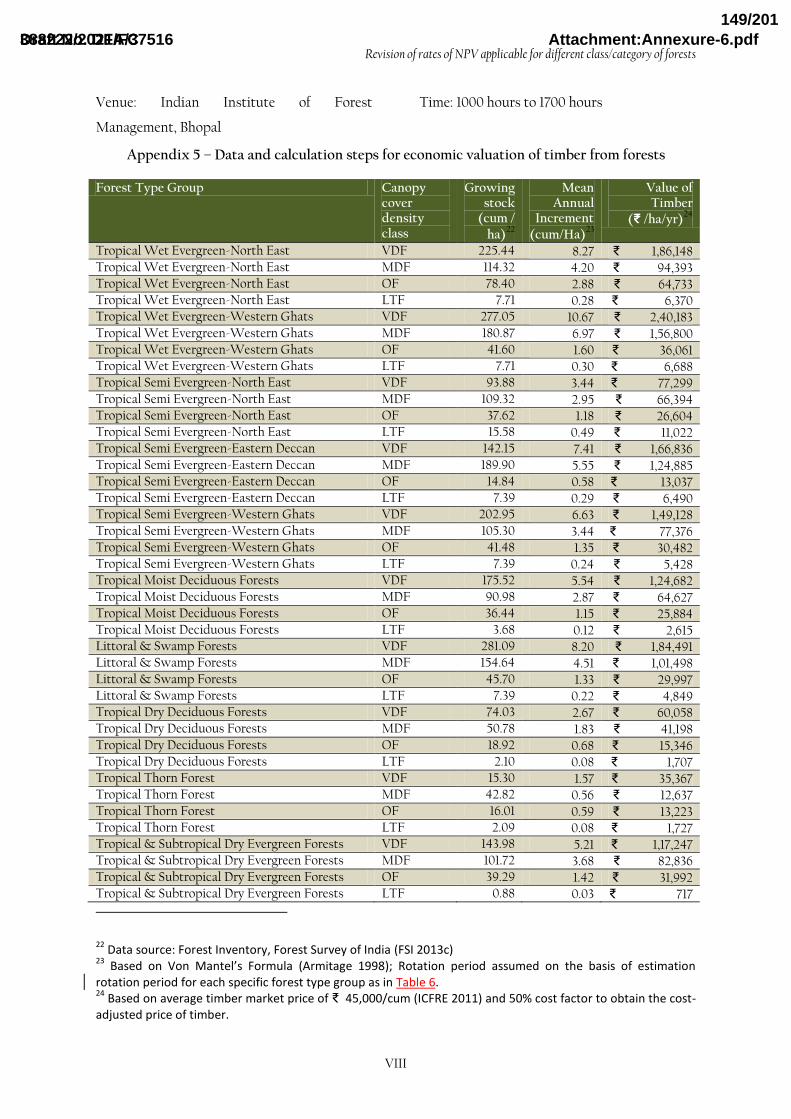
Economic value of a wide range of forest goods and services has been estimated based on recent data
and newly developed methodologies (Box 2). Add-on factors such as hill talukas and forest wetlands
are also included to reflect the site specificity of NPV rates for forest diversion. While the estimates
for Net Present Value of forest diversion are based on complex calculations to make it objective and
scientific, it has been ensured that at the local level use of applicable NPV rates is easy to understand
and unambiguous in implementation.
Box 2 – Forest goods and services valued in the current study
Timber Bamboo
Fuelwood Fodder
NWFP Gene-pool conservation
Carbon sequestration Carbon storage
Soil conservation Water recharge
Pollination & Seed Dispersal Water purification
Recognizing the fact that forests across the country differ significantly in terms of their ecological
aspects, a weighted average rotation period of proposed forest type groups has been estimated based
on the rotation period of dominant species in each forest type group. In addition to the conscious
effort of keeping the economic value estimates conservative, special care has been taken to avoid
double counting in valuation of forest goods and services. A summary of NPV rates estimated in the
study is as shown in Box 3.
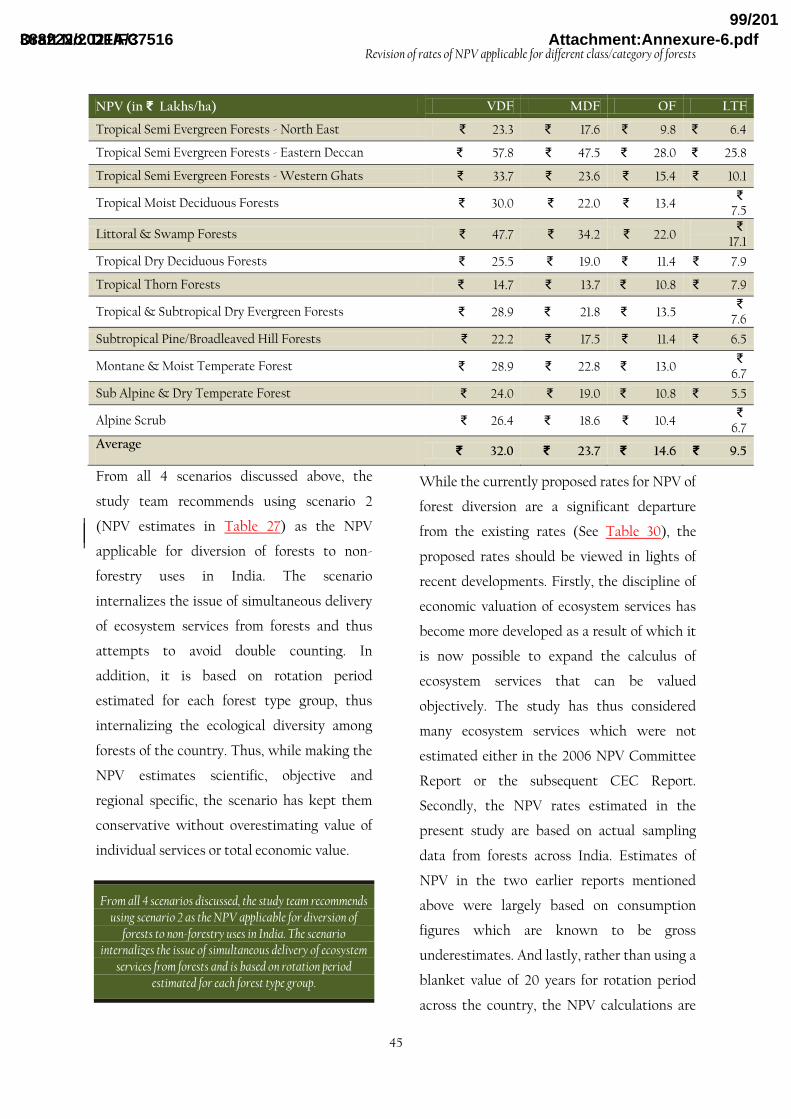
Box 3 – Average NPV rates across different scenarios and canopy cover density classes
Scenario TEV Rotation Period
Average NPV Rates (₹ Lakhs/ha)
VDF MDF OF LTF
I Complete1 FTG specific ₹ 50.9 ₹ 36.7 ₹ 20.7 ₹ 11.8
II Relevant2 FTG specific ₹ 32.0 ₹ 23.7 ₹ 14.6 ₹ 9.4
III Complete 60 years ₹ 51.4 ₹ 37.1 ₹ 20.9 ₹ 11.9
IV Relevant 60 years ₹ 32.3 ₹ 23.9 ₹ 14.7 ₹ 9.5
From all 4 scenarios above, the study team recommends using scenario 2 as the NPV applicable for
diversion of forests to non-forestry uses in India. The scenario internalizes the issue of simultaneous
1 As explained in the report, this scenario refers to complete summation of annual estimated economic value
of all forest goods and services to arrive at the total economic value. 2 To avoid double counting and internalize the fact that many forest goods and services are generated
simultenously, this scenario discounts the annual benefits appropriately to arrive at the total economic value.
Revision of rates of NPV applicable for different class/category of forests
xvi
TABLE OF CONTENTS
FOREWORD ............................................................................................................................................................ vi
TERMS OF REFERENCE OF THE STUDY .................................................................................................. vii
EXECUTIVE SUMMARY ...................................................................................................................................... x
1.2 Objectives of the current study ............................................................................................................. 5
1.3 Structure of the report ............................................................................................................................ 6
3.1 Expert Group Formation and Collaboration with FSI .................................................................. 14
3.2 Stakeholder responses through questionnaires .............................................................................. 14
3.3 Consultation process ............................................................................................................................. 14
6.4 Incentive based mechanisms ............................................................................................................... 65
6.5 Verification and monitoring ................................................................................................................ 66
6.6 Future research gaps.............................................................................................................................. 68
7 Internalization of comments and concerns of stakeholders .................................................................. 71
7.1 Comments on the First Draft Report ...................................................................................................... 71
7.2 Stepwise Methodologies for Estimating Economic Value of Ecosystem Services considered in Estimating NPV ............................................................................................................................................... 73
7.3 Accounting for ecosystem services benefits from compensatory afforestation ....................... 76
7.4 Way forward ........................................................................................................................................... 82
9 APPENDIX ........................................................................................................................................................... I
Revision of rates of NPV applicable for different class/category of forests
xvii
FIGURES
Figure 1 –Stylized description for rationale of NPV collection for forest diversion .................................... 2 Figure 2 – Ecosystem services from forests and human well-being (MA 2005) .......................................... 8 Figure 3 – Total Economic Value (TEV) Framework ....................................................................................... 11 Figure 4 – Stakeholder views on the current value of NPV charged for forest diversion (n=29) ............21 Figure 5 –Issues on which stakeholder comments were received on the first draft report and their frequency .................................................................................................................................................................... 72
TABLES
Table 1 – Goods and services estimated by the 2006 NPV Expert Committee ............................................ 3
Table 2 – Current NPV Rates Recommended by CEC (₹/ha) ......................................................................... 4 Table 3 – Major Ecosystem Services provided by Forests (Earth Economics 2013) ................................. 10 Table 4 – Proposed Forest Type Classification .................................................................................................. 16 Table 5 – Forest Density Classes used for classification .................................................................................. 18 Table 6 – Weighted average rotation period (years) .........................................................................................19 Table 7 – Major concerns among provider and user agencies with respect to NPV rates estimation .. 22 Table 8 – Comparison of forest goods and services valued in current and past studies for NPV estimation of forest diversion ................................................................................................................................ 23 Table 9 – Economic value of timber production ................................................................................................ 25 Table 10 – Economic value of bamboo production ........................................................................................... 26 Table 11 – Economic value of fodder production ............................................................................................... 27 Table 12 – Economic value of NWFP ................................................................................................................... 28 Table 13 – Economic value of fuelwood production ......................................................................................... 29 Table 14 – Social cost of carbon for India (Nordhaus 2011) ............................................................................ 30 Table 15 –Economic value of carbon sequestration services ............................................................................ 31 Table 16 – Economic value of gene-pool conservation ..................................................................................... 32 Table 17 – Economic value of pollination and seed dispersal services .......................................................... 33 Table 18 – Economic value of soil conservation ................................................................................................. 35 Table 19 – Economic value of water recharge services ..................................................................................... 36 Table 20 – Economic value of carbon storage .................................................................................................... 37 Table 21 - Studies used to estimate water purification services from forests (Van der Ploeg & R. S. de Groot 2010) ................................................................................................................................................................ 38 Table 22 – Total Economic Value of Forests (complete summation) ........................................................... 38 Table 23 – Assumptions for percentage of full value relevant for each forest goods and services ......... 39 Table 24 – Towards Total Economic Value of forests (by adjusting for double counting and simultaneous delivery of ecosystem services) .................................................................................................... 40 Table 25 – Cost factor assumed for various forest goods ................................................................................ 41 Table 26 – NPV Estimates (Scenario 1) ............................................................................................................... 42 Table 27 – NPV Estimates (Scenario 2) ............................................................................................................... 42 Table 28 – NPV Estimates (Scenario 3) ............................................................................................................... 43 Table 29 – NPV Estimates (Scenario 4) .............................................................................................................. 43 Table 30 – Current NPV rates charged for forest diversion (CEC 2007a) .................................................. 45 Table 31 – WPI Adjusted Current NPV Rates ................................................................................................... 45 Table 32 – Absolute and percentage change in proposed and current NPV rates ..................................... 46 Table 33 – Absolute and percentage change in proposed and WPI adjusted current NPV rates .......... 46 Table 34 –Conservativeness of NPV estimates .................................................................................................. 48 Table 35 – Contribution of categories of ecosystem services to estimated NPV rates ............................. 49
Revision of rates of NPV applicable for different class/category of forests
xviii
Table 36 – Assumptions of economic value of forest goods and services accruing at different spatial scales ............................................................................................................................................................................ 50 Table 37 – NPV of benefits accruing at various spatial scales ........................................................................ 50 Table 38 – Sensitivity analysis ............................................................................................................................... 53 Table 39 – Activity-wise current &proposed levels of exemption from applicable NPV payable ........ 55 Table 40 - Proposed NPV rates (Rs. Lakhs per hectare) using 4 per cent rate of discount .................... 73 Table 41 - Proposed NPV rates (Rs. Lakhs per hectare) using 6 per cent rate of discount ..................... 74 Table 42 – Step-wise methodology for economic valuation of each ecosystem service considered ...... 74 Table 43 - Assumptions for portion of ecosystem services restored by compensatory afforestation ... 78 Table 44 - SCARF using 4% rate of discount .................................................................................................... 78 Table 45 - SCARF using 6% rate of discount ..................................................................................................... 79 Table 46 – SCARF Adjustment (Rs. Lakhs per hectare) using 4% rate of discount ................................. 81 Table 47 – SCARF Adjustment (Rs. Lakhs per hectare) using 6% rate of discount ................................. 82
Revision of rates of NPV applicable for different class/category of forests
xix
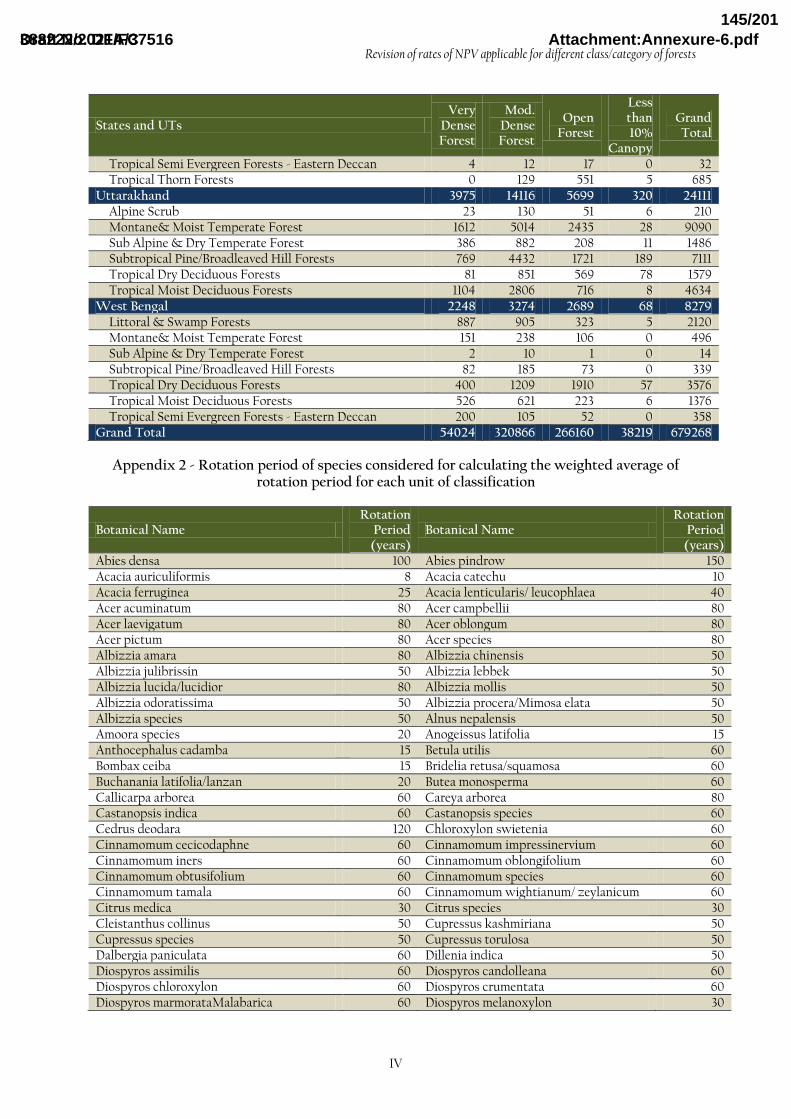
APPENDICES
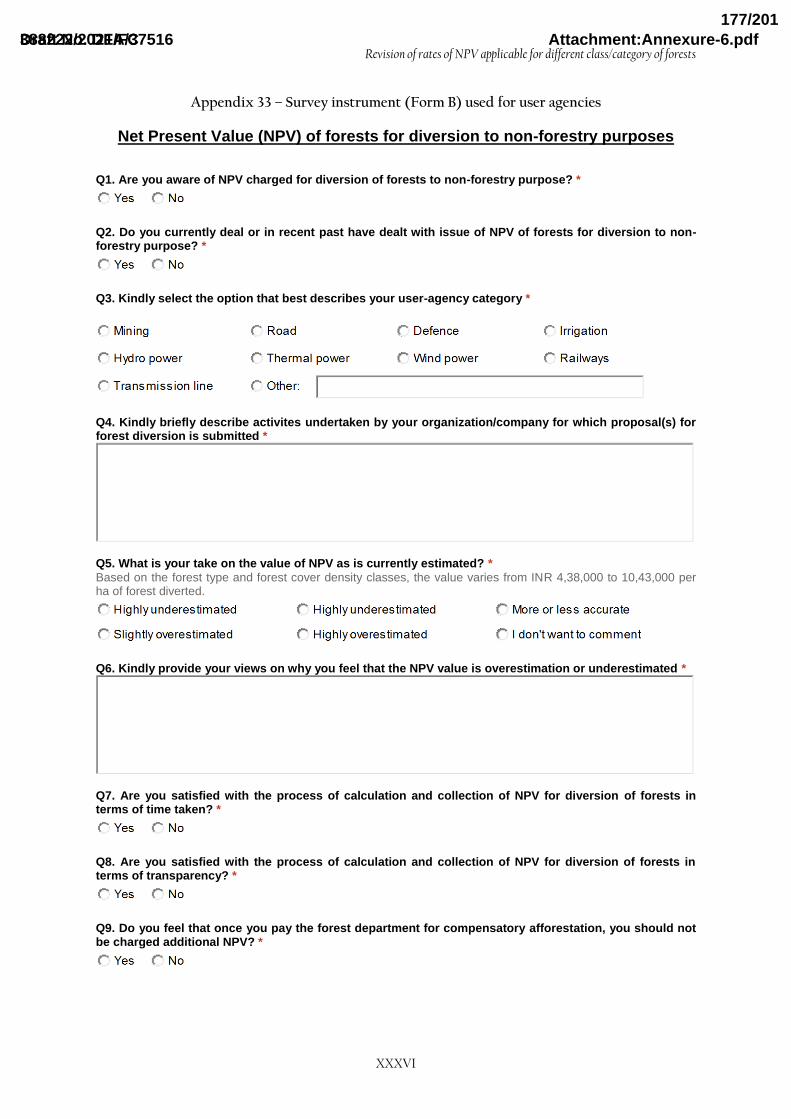
Appendix 1 - Area (km2) of proposed Forest Type Groups in different states under various forest cover density classes (FSI 2011a) .............................................................................................................................. I Appendix 2 - Rotation period of species considered for calculating the weighted average of rotation period for each unit of classification .................................................................................................................... IV Appendix 3 – Percentage of total trees per hectare for which specific rotation period was used for calculation of rotation period in each classification unit. ................................................................................ V Appendix 4 – Concept note on Group Consultation Method Workshop .................................................. VI Appendix 5 – Data and calculation steps for economic valuation of timber from forests .................... VIII Appendix 6 - Data and calculation steps for economic valuation of bamboo from forests ..................... IX Appendix 7 – State-wise data and calculation steps for economic valuation of fodder production from forests ........................................................................................................................................................................... X Appendix 8 – Forest type group wise estimates of fodder production from forests ................................. XI Appendix 9 – Data used for value of NWFP from 12 major species ............................................................ XII Appendix 10 - State-wise data and calculation steps for economic valuation of fuelwood production from forests .............................................................................................................................................................. XII Appendix 11 - Forest type group wise estimates of fuelwood production from forests ........................ XIII Appendix 12 – Data and calculation steps for valuation of carbon sequestration from forests ........... XIV Appendix 13 - State-wise data and calculation steps for economic valuation of gene-pool conservation from forests .............................................................................................................................................................. XV Appendix 14 - Forest type group wise economic value of gene-pool conservation from forests ......... XVI Appendix 15 - Data and calculation steps for valuation of pollination and seed dispersal services from forests ....................................................................................................................................................................... XVI Appendix 16 - Relative weights for canopy cover density classes compared to VDF for estimation of soil conservation from forests ........................................................................................................................... XVII Appendix 17 - Concentration of major nutrients in run-off (A. N. Pandey et al. 1984) ....................... XVII Appendix 18 - Price of fertilizers in India (DoF 2013) ................................................................................. XVII Appendix 19 - Data and calculation steps for valuation of soil conservation services from forests . XVIII Appendix 20 – Runoff rates assumed for different forest canopy cover density classes ....................... XIX Appendix 21 - Data and calculation steps for valuation of water recharge services from forests ....... XIX Appendix 22 - Data and calculation steps for valuation of carbon storage in forests............................ XXI Appendix 23 – Adjustment Factor for GDP (PPP) per capita .................................................................. XXII Appendix 24 – Adjustment Factor for currency exchange rate ................................................................ XXII Appendix 25 – Extract from a commentary by T. C. A. Anant on social rate of discount .................. XXII Appendix 26 – Net accumulation and disbursement of CAMPA funds to various states ................. XXIII Appendix 27 – List of people contacted during individual consultation meetings ............................. XXIV Appendix 28 – List of participants in the National Consultation Workshop at New Delhi ............. XXV Appendix 29 – List of participants at the Group Consultation Workshop at Bhopal ....................... XXVI Appendix 30 – A small concept note on NPV circulated before consultation meetings and workshops............................................................................................................................................................................... XXVII Appendix 31 – Minutes of NPV National Consultation Workshop held at New Delhi ................. XXVIII Appendix 32 – Survey instrument (Form A) used for provider agency ............................................... XXXII Appendix 33 – Survey instrument (Form B) used for user agencies .................................................... XXXVI Appendix 34 – Survey Instrument (Form C) used for local communities ...................................... XXXVIII Appendix 35 – List of survey respondents ................................................................................................. XXXIX Appendix 36 – Excerpts of views from few user agencies and experts ............................................... XXXIX Appendix 37 – Excerpts from discussions on charging for possession value of land .......................... XLIII Appendix 38 - Market-based instruments for incentiving communities for conservation of forest resources (Ekpe 2012) ....................................................................................................................................... XLIV Appendix 39 - SECTION-WISE COMMENTS AND RESPONSES FOR THE NPV REPORT ........ XLV
Revision of rates of NPV applicable for different class/category of forests
xxi
GLOSSARY
Benefits transfer approach: economic valuation approach in which estimates obtained in one context are used to estimate values in a different context after due adjustment.
Biodiversity: the variability among living organisms, including terrestrial, marine, and other aquatic ecosystems. Biodiversity includes diversity within species, between species, and between ecosystems.
Canopy: the cover of branches and foliage formed by the crowns of trees.
Canopy density: the relative completeness of canopy usually expressed as a decimal coefficient, taking closed canopy as unit.
Compensatory afforestation: mandated afforestation to be done by the user agency as a compensation for forest land diverted for non-forestry purpose.
Cultural services: the non-material benefits people obtain from ecosystems through spiritual enrichment, cognitive development, reflection and aesthetic experience.
Discount rate: a rate used to determine the present value of future benefits.
Direct-use value (of ecosystems): the benefits derived from the services provided by an ecosystem that are used directly by an economic agent. These include consumptive uses (e.g. harvesting goods) and non-consumptive uses (e.g. enjoyment of scenic beauty).
Double counting of services: erroneously including the same service more than once in an analysis.
Ecosystem services: the direct and indirect contributions of ecosystems to human well-being. The concept ‘ecosystem goods and services’ is synonymous with ecosystem services.
Existence value: the value that individuals place on knowing that a resource exists, even if they never use that resource (also sometimes known as conservation value or passive use value).
Forest cover: all lands, more than one hectare in area, with a tree canopy density of more than 10 percent irrespective of ownership and legal status. Such lands may not necessarily be a recorded forest area. It also includes orchards, bamboo and palm.
Forest Inventory: the measurement of certain parameters of forests to assess the growing stand and stock and other characteristics of forests.
Growing stock: the sum (by number or volume) of all the trees growing/living in the forest or a specific part of it.
Hill talukas: decided based on criteria adopted by the Planning Commission for Hill Area and Western Ghats Development Programmes.
Human well-being: concept prominently used in the Millennium Ecosystem Assessment –it describes elements largely agreed to constitute ‘a good life’, including basic material goods, freedom and choice, health and bodily well-being, good social relations, security, peace of mind, and spiritual experience.
Incentives (disincentives), economic: a material reward (or punishment) in return for acting in a particular way which is beneficial (or harmful) to a set goal.
Indirect-use value (of ecosystems): the benefits derived from the goods and services provided by an ecosystem that are used indirectly by an economic agent. For example, the purification of drinking water filtered by soils.
Less than 10% Canopy Cover Forests (LTF): degraded forest lands having canopy density less than 10 percent. These are classified as scrub forests in State of Forest Report by Forest Survey of India.
Moderately Dense Forest (MDF): all lands with forest cover having a canopy density between 40 and 70%.
Natural capital: an economic metaphor for the limited stocks of physical and biological resources found on earth, and of the limited
Revision of rates of NPV applicable for different class/category of forests
xxii
capacity of ecosystems to pro-vide ecosystem services.
Net Present Value (NPV): The NPV of a time series of cash flows, both incoming and outgoing, is defined as the sum of the present values (PVs) of the individual cash flows.
Non-use value: benefits which do not arise from direct or indirect use.
Open Forest (OF): all lands with forest cover having a canopy density between 10 and 40%.
Opportunity costs: foregone benefits of not using land/ecosystems in a different way, e.g. the potential income from agriculture when conserving a forest.
Option value: the value of preserving the option to use services in the future either by oneself (option value) or by others or heirs (bequest value). Quasi-option value represents the value of avoiding irreversible decisions until new information reveals whether certain ecosystem functions have values which society is not currently aware of.
Precautionary Principle: If an action has a suspected risk of causing harm to the environment, in the absence of scientific consensus that the action is harmful, the burden of proof that it is not harmful falls on those taking an act.
Provisioning services: the products obtained from ecosystems, including, for example, genetic resources, food and fiber and fresh water.
Public goods: a good or service in which the benefit received by any one party does not diminish the availability of the benefits to others, and where access to the good cannot be restricted.
Regulating services: the benefits obtained from the regulation of ecosystem processes, including, for example, the regulation of climate, water and some human diseases.
Resilience (of ecosystems): their ability to function and provide critical ecosystem services under changing conditions.
Social cost of carbon: estimate of the economic damages associates with increase in carbon dioxide emissions.
Supporting services: ecosystem services that are necessary for the production of all other ecosystem services such as biomass production, soil formation and retention, nutrient cycling, etc.
Threshold/tipping point: a point or level at which ecosystems change, sometimes irreversibly, to a significantly different state, seriously affecting their capacity to deliver certain ecosystem services.
Total economic value (TEV): a framework for considering various constituents of value, including direct use value, indirect use value, option value, quasi-option value, and existence value.
Trees Outside Forests (TOF): trees growing outside recorded forest areas.
Trade-offs: a choice that involves losing one quality or service (of an ecosystem) in return for gaining another quality or service. Many decisions affecting ecosystems involve trade-offs, sometimes mainly in the long term.
Valuation, economic: the process of estimating a value for a particular good or service in a certain context in monetary terms.
Very Dense Forest (VDF): all lands with forest cover having a canopy density of 70 percent and above.
Willingness-to-pay (WTP): estimate of the amount people are prepared to pay in exchange for a certain state or good for which there is normally no market price (e.g. WTP for protection of an endangered species).
Source: (MA 2005; TEEB 2010; FSI 2011b; P. Kumar et al. 2010)
Revision of rates of NPV applicable for different class/category of forests
1
1 INTRODUCTION
1.1 Background
While the Net Present Value (NPV) for forest
diversion was formally enforced across the
country in 2008 with the range of ₹ 4.38 lakhs
to ₹ 10.43 lakhs per hectare, it has been in
practiced in few states of India for over a
decade now. In 2002, a special purpose vehicle
called CLEV (Compensation for Loss of
Ecological Value) was introduced in Himachal
Pradesh based on a study on economic value of
forests in Himachal Pradesh conducted by
IIFM for Himachal Pradesh Forest Sector
Reforms (HPFSR) project in 2000. Following
this study, states of Madhya Pradesh,
Chhattisgarh and Bihar started practising
collection of NPV in addition to charging for
compensatory afforestation in early 2000s.
These states were recovering NPV at the rate
of ₹ 5.80 lakhs to ₹ 9.20 lakhs per hectare
depending on density and quality of forests.
Discussions around NPV were introduced in
the Godavarman case (Writ Petition (Civil)
No. 202/95)5 in the Hon’ble Supreme Court
through the report of the Central Empowered
Committee (CEC), an empowered body and
creation of the Hon’ble Supreme Court in
2002,which highlighted that “the States/UTs
as well as Ministry of Environment and
Forests are of the view that in addition to the
funds realized for compensatory afforestation,
the Net Present Value of forest land being
diverted for non-forestry purposes should also
5See order dated 05.05.06 I. A. No. 1337 with I. A.
Nos. 827, 1122, 1216, 1473
KEY MESSAGES
Chapters 1 to 4 of the report respond to TOR 1: Examination of the methodology adopted by 2006 NPV Expert Committee for NPV estimation, suggest appropriate amendments and recommend revised rates of NPV; TOR 2:
Recommend validity period of NPV realized for a project of the assigned study and TOR 3: Incorporate suggestion made by the Committee on Allocation of National Resources (CANR) which recommended “suitably re-adjusting
payments under NPV and above schemes. Forest land has value over and above the value of land itself. This re-adjustment should achieve comparability with guidelines of land valuation for other purposes, e.g. acquisition.”
When forests are diverted, a whole set of ecosystem goods and services from forest are lost which are not immediately accounted for by Compensatory Afforestation (CA). Benefits from CA increase slowly and the rationale for Net
Present Value (NPV) collection is to balance the uncompensated benefits till the compensatory afforestation area starts providing benefits comparable to those from the original forest area diverted.
To estimate the NPV of forest diversion on economic principles, The 2006 NPV Expert Committee demonstrated valuation of 7 key goods and ecosystem services from forests, namely timber, carbon storage, fuelwood & fodder,
NTFP, Ecotourism, watershed benefits and biodiversity. The committee also recommended site specific NPV calculation.
The Central Empowered Committee (CEC) estimated few more services than those demonstrated by the 2006 NPV Expert Committee such as carbon sequestration, bio-prospecting and value of flagship species. As opposed to site-specific value, block values were estimated for 6 eco-classes and 3 forest cover density classes which are currently
prevelant as the NPV rates for forest diversion and range from ₹ 4.38 lakhs to ₹ 10.43 lakhs per hectare.
Revision of rates of NPV applicable for different class/category of forests
2
be recovered from the user agencies. The
money so recovered could be utilized for
undertaking forest protection, other
conservation measures and related activities”.
After a prolonged debate in court hearings,
The Hon’ble Supreme Court (SC) of India
accepted that every user agency shall have to
pay NPV for forest land diverted for non-
forestry use. The NPV rates of earlier
mentioned States were accepted at the all-
India level. NPV as a concept thus evolved
from the need to take precautionary measures
in the event of diversion of forest land for non-
forestry use to balance the interests of
economic development and environmental
protection (ELDF & WWF India 2009).
The rationale for charging the compensatory
payment of NPV when forests are diverted for
non-forestry purpose, in addition to paying for
Compensatory Afforestation (CA) is subtle.
When forests are diverted, a whole set of
benefits (tangible and intangible) flowing
from forests in terms of ecosystem goods and
services are lost which are not accounted for
by CA (yellow area in Figure 1). Benefits from
CA increase slowly (orange area) and the
rationale for NPV collection is to balance the
uncompensated benefits (green area) till the
compensatory afforestation area attains
maturity and starts providing a portion of
benefits provided earlier by the forest area
diverted. Even after maturity, it is likely that a
portion of benefits lost due to forest diversion
will never be compensated by benefits from
compensatory afforestation (blue area). The
CEC in its report in 2002 further recognized
that plantations take much longer to mature
and even then can never adequately
compensate for natural forests. Hence the
NPV amount payable for forest diversion is a
conservative charge.
When forests are diverted, a whole set of ecosystem goods and services from forest are lost which are not immediately accounted for by CA. Benefits from CA increase slowly and
the rationale for NPV collection is to balance the uncompensated benefits till the compensatory afforestation area starts providing benefits comparable to those from the
original forest area diverted. Further, plantations take much longer to mature and even then can never adequately
compensate for natural forests.
Figure 1 –Stylized description for rationale of NPV collection for forest diversion
Revision of rates of NPV applicable for different class/category of forests
7
2 VALUING FOREST ECOSYSTEM SERVICES
2.1 Forest ecosystem services
The importance of forest ecosystems to human
well-being cannot be understated. These
multifunctional ecosystems provide various
services on all spatial and temporal levels. The
ecosystem services are benefits which people
derive from forests and include provisioning
services such as food, water, timber; regulating
services such as climate and water quality
regulation; cultural services such as recreation
and spiritual benefits; and supporting services
such as nutrient cycling (MA 2005). Ensuring
flow of these services from forests has
significant implications on human well-being
(See Figure 2). Many countries identify more
than 100 different kinds of services from
forests (Sheingauz & Sapozhnikov 1988;
Mather 1999). This multifunctionality of
forests has also been recognized in the Forest
Principles agreed at the United Nations
Conference on Environment and Development
held at Rio-de-Janeiro. Without the ecosystem
services emanating from forests, life on earth
would not be possible.
“forest resources and forest lands shall be managed and used sustainably to fulfil social, economic, ecological, cultural
and spiritual needs of present and future generations” (Forest Principles 1992)
Among all the ecosystem goods and services
that forests provide, timber is currently one of
the most readily marketable benefits. While
green felling is regulated in the country6 as per
the direction of Hon’ble Supreme Court, the
large stock of unharvested wood contributes
to the total economic value of forests. Wood is
also used in the house, construction, furniture
6 “The felling of trees in all forests is to remain
suspended except in accordance with the Working Plans of the State Governments, as approved by the Central Government.” – Hon’ble Supreme Court order dated 12.12.1996
KEY MESSAGES
The chapter lays the foundation for linkage between goods and services emanating from forests and human well-being. Briefly summarizing major ecosystem services derived from forests and their importance for humankind, the
chapter introduces the concept of Total Economic Value (TEV) used for valuation of forest ecosystem services as the basis for NPV.
Forests are multifunctional ecosystems which provide various services on all spatial and temporal levels. These ecosystem services are benefits which people derive from forests and include provisioning services, regulating services,
cultural services and supporting services.
Because of market and institutional failure, the economic value of such goods and services from forests is often not captured in the market prices. To better understand the importance of forests and managing trade-offs between using
land for forests or other developmental activities, it is required that a thorough economic valuation of goods and services from forests is carried out.
Estimates of the total economic value of forest ecosystems range from 1/4th of the global GNP at the global level to 7% of India’s GDP at the national level.
Revision of rates of NPV applicable for different class/category of forests
8
and agricultural implements. In addition, a
large proportion of people in rural regions
depend on forests as a source of fuelwood for
energy requirement. According to Forest
Survey of India, the annual consumption of
fuelwood from forests is estimated to be about
58 million tonnes while annual wood
consumption for house construction, furniture
and agricultural implements is estimated to be
about 33 million cum (FSI 2011b).
Figure 2 – Ecosystem services from forests and human well-being (MA 2005)
Apart from wood and fuelwood, forests
provide goods in the form of a range of non-
wood forest products (NWFPs) which are
termed as goods of biological origin other than
wood, derived from forests and, other wooded
land and trees outside the forests (FAO 1999).
These NWFPs include a tremendous diversity
of items – many of which do not enter the
formal market (UNECE 1998). However, they
play an important role in the daily life and
well-being of hundreds of millions of people
dependent on forests (Lampietti & Dixon
1995). Their importance becomes more
pronounced while considering the role of
NWFPs in providing livelihood opportunities
(Vinod Kumar Bahuguna 2000). In addition,
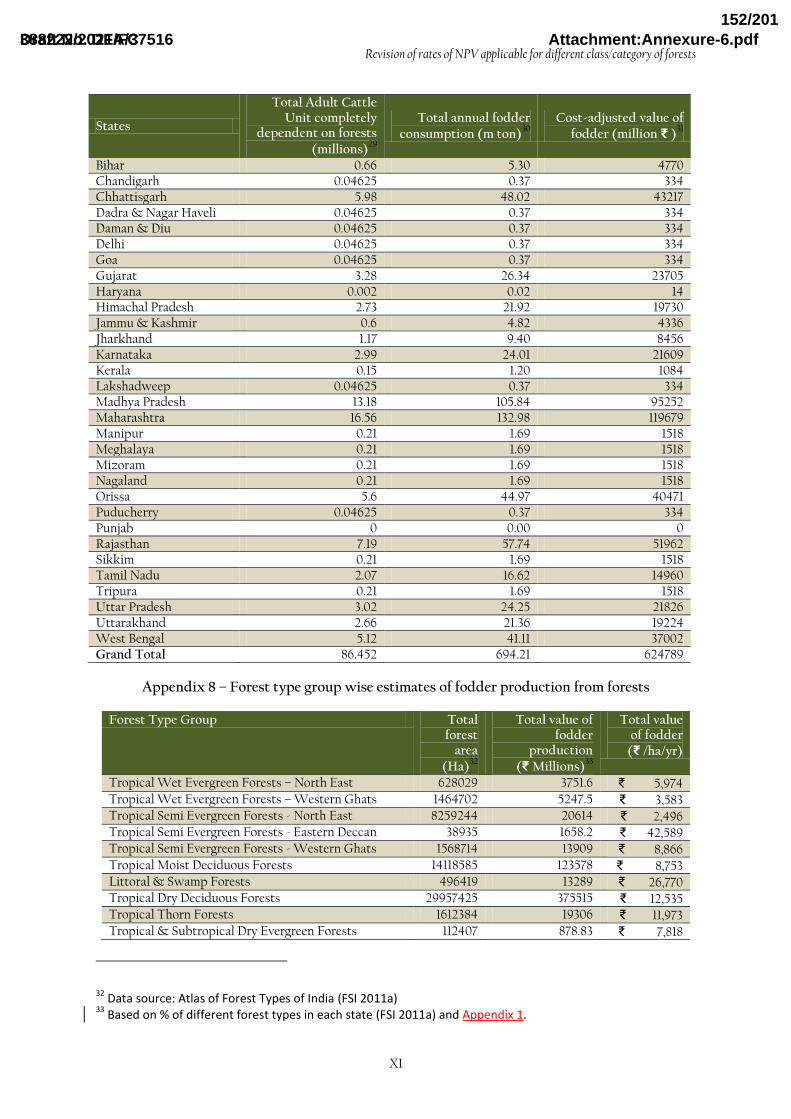
forests are a great source of fodder,
particularly where animal-based production
systems dominate the socioeconomic system.
In India roughly 1 in 4 adult cattle units
depend on forests for grazing and fodder (FSI
2011b).
Forests are multifunctional ecosystems which provide various services on all spatial and temporal levels. These ecosystem services are benefits which people derive from
Revision of rates of NPV applicable for different class/category of forests
12
Ideally, values of goods and services should
reflect the best alternative use for resources
(true opportunity cost), or the true
willingness to pay for the goods and services,
excluding external government interventions
and including all the externalities (Kadekodi
1999). However, conventional analysis, based
mostly on limited information of marketable
value, often fails to capture the benefits
completely (Verma 2008; Verma & C. V.
Kumar 2008). This is because many of these
goods and services do not enter the market,
and for those that enter only a part of the total
benefits are actually recorded by market
transactions. Many of these benefits are also
misattributed (Panayotou 1998). For example,
the water regulation services provided by
forests may appear as higher profits in water
using sectors and not as benefits provided by
the forest ecosystem.
Because of market and institutional failure, the economic value of such goods and services from forests is often not captured in the market prices. To better understand the
importance of forests and managing trade-offs between using land for forests or other developmental activities, it is
required that a thorough economic valuation of goods and services from forests is carried out.
Revision of rates of NPV applicable for different class/category of forests
14
3 METHODOLOGY
3.1 Expert Group Formation and Collaboration with FSI
An expert group was formed as a part of this
study comprising of experts in the area of
natural resource economics, forest
conservation, management information
systems for forests and related legal issues.
The expert group met on several occasions
including the consultation workshop and
GCM workshop and discussed possible
implications of key methodological
components in NPV estimation. In addition, to
make the methodology objective and scientific
and to carry out estimation of NPV on latest
data of forest resources in the country, the
current study was conducted in collaboration
with the Forest Survey of India.
3.2 Stakeholder responses through questionnaires
While attempts were made to reach out to
major stakeholders, given the time constraints
it was not possible to consult all possible
stakeholders from various regions around the
country. However to seek views of such
stakeholders, questionnaires were designed
(each for forest department, user agency and
local communities) and circulated for their
response. The questionnaires are attached in
Appendix 32, Appendix 33 and Appendix 34.
3.3 Consultation process
3.3.1 Consultation meetings
Forests in the context of this study have many
stakeholders including Ministry of
Environment, Forests & Climate Change
(MoEFCC), Govt. of India, State Forest
Departments, MoEFCC Regional Offices,
KEY MESSAGES
Apart from getting suggestions from Expert Group formed on the subject, extensive consultations were conducted with major stakeholders to internalize their views in the revised methodology for NPV recalculation. The views were
further discussed during the National Consultation Workshop in togetherness. Subjective methodological components were finalized through a Group Consultation Workshop.
The study calculates NPV rates of forest diversion for 14 Forest Type Groups of India further categorized into 4 canopy cover density classes.
The methodology recognizes the fact that few classification units may have some dominant ecosystem services in terms of their economic value which may be very different from other classification units in which some other
ecosystem services may dominate. The methodology is thus designed to objectively estimate the economic value of ecosystem services originating from different classification units by appropriately considering the specific
characteristics and hence values, rather than using a blanket value across the country.
For the purposes of NPV calculation, rather than taking a blanket period of 20 years as the rotation period of forest, the study estimates the rotation period for each unit of classification based on the dominant tree species and their
rotation periods. These have been further averaged across forest type groups to obtain the weighted average rotation period for each of the forest type groups proposed in the study.
Revision of rates of NPV applicable for different class/category of forests
15
Central Empowered Committee (CEC). The
National Green Tribunal, National Tiger
Conservation Authority (NTCA), user-
agencies seeking forest land for diversion, The
Planning Commission of India, The Finance
Commission of India constituted by the Govt.
of India, research organizations (such as
ICFRE, IGNFA, TERI, WII, WTI, and others),
data generation agencies (FSI, IIRS, CSO,
NSSO, and others), environmental
consultants, legal experts/law firms, utility
service providers (water, electricity, roads,
transmission, and others), consumers, forest
dependent industries, local communities and
citizens of India. To internalize the view of
these stakeholders, consultation meetings
were conducted with all major stakeholders
(For details, See Appendix 27). Providing
detailed information on how NPV is currently
calculated and the basis for estimation of NPV
rates; issues and concerns of stakeholders
were duly noted. These issues have been
internalized in the development of revised
methodology for recalculation of NPV rates.
3.3.2 National Consultation workshop
While individual concerns, especially those of
provider and user agencies, were recognized
through individual consultation meetings
(note circulated for reference can be found in
Appendix 30), a National Consultation
Workshop was subsequently conducted to
discuss these concerns in togetherness, each
for MoEFCC, forest departments and user
agencies. Discussions were held during the
workshop on each of the objectives. The
minutes of the workshop are attached in
Appendix 31 and have been the basis of revised
methodology for NPV rates estimation.
3.3.3 Group Consultation Workshop
While major issues in estimation of NPV rates
were identified and methodology to estimate
the economic value of forest ecosystem
services was drafted, it was realized that there
is unsatisfactory information on some of the
methodological components for which data is
either incomplete or not verified. This had
stemmed from the fact that forests in India
have multiple stakeholders and thus economic
values differ substantially among different
stakeholders. In order to recalculate the NPV
rates more objectively, a Group Consultation
Workshop was also conducted involving
various stakeholders from different regions of
India to produce a consensus in opinion on
such subjective components. The concept note
for GCM and the process followed are
attached in Appendix 4.
Extensive consultations were conducted with major stakeholders to internalize their concerns in revised
methodology for NPV recalculation. The views were further discussed during the National Consultation Workshop in togetherness. Subjective methodological components were
further finalized through a Group Consultation Workshop.
Eco-class V Subtropical Pine Forests Subtropical Pine/Broadleaved Hill Forests
Eco-class V Broadleaved Hill Forests
Eco-class VI Montane Temperature Forest Montane & Moist Temperate Forest
Eco-class VI Moist Temperature Forest
Eco-class VI Sub Alpine Temperate Forest Sub Alpine & Dry Temperate Forest
Eco-class VI Dry Temperate Forests
Eco-class VI Moist Alpine Scrub Alpine Scrub
Eco-class VI Dry Alpine Scrub
As regards the second parameter used in the
2006 NPV Expert Committee Report and the
CEC Report submitted thereon, an additional
forest canopy cover density class, namely
Lowe Density Forests, has been added8. This
class represents recorded forest areas with less
than 10% canopy cover (See Table 5).While
such areas do not have dense forest cover, they
nevertheless provide many ecosystem services.
Recent studies, for example, have found that
8 Earlier the category of open forests also covered
‘Scrub’but now on account of its unique nature, the Forest Survey of India has introduced this category in its recent State of Forest Resource Assessment and hence the same has been incorporated in the report.
grasses and bushes in these areas help in
sequestration of carbon in significant quantity
along with preventing release of soil carbon
(FAO 2010). Many such areas are also critical
habitats for biodiversity and hence are
important. In the light of these facts, the forest
Revision of rates of NPV applicable for different class/category of forests
20
4 ANALYSIS AND NPV ESTIMATION
KEY MESSAGES
In a questionnaire based survey conducted for the study, more than 3/4th of the stakeholders that responded opined that the current NPV rates for forest diversion are either highly underestimated or slightly underestimated.
The current study represents a significant departure from the earlier methodology used to estimate the NPV rates. The study estimates the economic value of many forest goods and services which were not valued earlier such as bamboo, pollination & seed dispersal, water purification, soil conservation and water recharge. Values of forest
goods and services that were considered earlier such as timber, fuelwood, and fodder among others were derived more scientifically and objectively.
The array of forest goods and services valued in the study include timber, bamboo, NTFP, fuelwood, fodder, gene-pool conservation, carbon sequestration, carbon storage, water recharge, soil conservation, water purification
and pollination & seed dispersal.
Based on the argument that many of these services are complimentary to each other and hence to avoid the possibility of double counting of the service benefits, assumptions are made on the percentage of value additions relevant for each
goods and services. NPV rates for 4 scenarios are estimated here based on the methodology for estimating the total economic value (i. complete summation or ii. relevant summation by accounting for double counting) and rotation period used (i. forest type group specific or ii. a blanket value of 60 years). The summary of estimates is as follows:
Scenario TEV Rotation
Period Average NPV Rates (₹ Lakhs/ha)
VDF MDF OF Scrub I Complete FTG specific ₹ 50.9 ₹ 36.7 ₹ 20.7 ₹ 11.8 II Relevant FTG specific ₹ 32.0 ₹ 23.7 ₹ 14.6 ₹ 9.4 III Complete 60 years ₹ 51.4 ₹ 37.1 ₹ 20.9 ₹ 11.9 IV Relevant 60 years ₹ 32.3 ₹ 23.9 ₹ 14.7 ₹ 9.5
While the NPV rates estimated in this study are at a significant departure from the existing rates, caution has been used not to overestimate the value of any of the goods and services estimated. Even though the NPV rates are higher
than the current rates, reasons are provided why even the estimated NPV rates can be considered as conservative.
While an attempt has been made to estimate the value of important goods and services from forests, the economic value of provisioning services from forests constitute a major part of estimated NPV. While regulating and
supporting services have been valued in this study, there is a need for more sophisticated valuation methodologies and appropriate datasets to truly reflect the economic value of such services from forests in future.
In terms of the economic value of forest goods and services estimated in this study accruing at various spatial scales, it is found that about 50% of the total economic value of forests is accrued at the local level with 34% and 16% at the
state and national level, respectively. The economic value accruing at the local level can also be seen as the dependence value of forest ecosystems for the local communities dependent on forests for livelihoods and subsistence.
To make NPV more site-specific, it is suggested that a 20% premium on applicable NPV rates may be applied based on add-on factors of hill talukas and forested wetlands. It is also suggested that for core areas of National Parks and
Sanctuaries, the NPV payable should be 10 times and 5 times the applicable NPV in the region respectively. In addition, for Eco-senstivie zones around National Parks and Sanctuaries, this value should be 5 times and 3 times of
the applicable NPV respectively.
In addition, it is suggested that to truly reflect the space value of forest land in urban and peri-urban areas, “possession value” of land may be charged in urban and peri-urban areas. It is suggested that the “possession value” of land may be charged in urban and peri-urban areas, as a one-time payment, either as (i) 50% of the collector rate or value as assessed by the local authority in absence of the collector rate plus the NPV or (ii) prevalent market rate
for acquiring forest land (specially where NPV may be negligible), whichever is higher.
Revision of rates of NPV applicable for different class/category of forests
23
Table 7 – Major concerns among provider and user agencies with respect to NPV rates estimation
Issues from forest department Issues from user agencies
Change of extent in land use by the proposed non-forest activity should be part of NPV
calculation
Dependency of local communities on diverted forest area needs to be accounted for
Absence of biodiversity values in NPV and issues of critical wildlife corridors and
breeding areas
Absence of Trees Outside Forests (TOF) in NPV estimation
Differential land rent based on proximity to urban area should be charged
Fragmentation of forest area at a landscape level should be an integral part of NPV
The procedure for NPV calculation should be simple
Deferred payments for NPV charge should be allowed
Positive externalities from a project should be included in NPV calculation
NPV should be project-specific based on its impact on forests9
User agencies should be involved in activities undertaken at local level through the
CAMPA fund
Land for Compensatory Afforestation should be decided by the Forest Department
Projects that change the land use permanently should be charged higher rates
Need for a single payment window for forest clearance process to avoid delay
Issues of delay and transparency in NPV calculation and collection
9 Since the enactment of Forest Conservation Act in 1980, forest area diverted till 2012, including both final approval and in-principal approvals, is about 1.15 million hectare. This does not include forest lands diverted under general approvals given by MoEF for creation of critical public utility infrastructure of specified categories in forest fringe areas and the LWE affected districts. Within this, about 5.2 lakh hectare was diverted for regularization of encroachments, delisting of PLPA lands, conversion of forest villages, etc. The forest land diverted for developmental activities such as mining, hydel, road and other infrastructure is estimated to be about 6.3 lakh hectare (Bansal 2013).
Revision of rates of NPV applicable for different class/category of forests
43
here. The rotation period used in Scenarios 1
and 2 are based on specific rotation periods
estimated for each forest type group as
referred in Section 3.4.2. For Scenarios 3 and 4,
an average rotation period of 60 years, as
estimated from the average rotation period of
all forest type groups has been used for
estimation of NPV of forest diversion.
4.2.2.14.1 Scenario 1 – NPV rates based on Forest Type Group specific rotation period, 4% rate of discount and Total Economic Value based on complete summation
Table 26 – NPV Estimates (Scenario 1)
NPV (in ₹ Lakhs/ha) VDF MDF OF LTF
Tropical Wet Evergreen Forests – North East ₹ 64.8 ₹ 34.6 ₹ 29.9 ₹ 10.1
4.2.2.14.2 Scenario 2 – NPV rates based on Forest Type Group specific rotation period, 4% rate of discount and Total Economic Value based on adjusting for double counting and simultaneous delivery of ecosystem services
Table 27 – NPV Estimates (Scenario 2)
NPV (in ₹ Lakhs/ha) VDF MDF OF LTF
Tropical Wet Evergreen Forests – North East ₹ 38.9 ₹ 21.3 ₹ 19.0 ₹
4.2.2.14.3 Scenario3 – NPV rates based on a blanket rotation period of 60 years, 4% rate of discount and Total Economic Value based on complete summation
Table 28 – NPV Estimates (Scenario 3)
NPV (in ₹ Lakhs/ha) VDF MDF OF LTF
Tropical Wet Evergreen Forests – North East ₹ 66.4 ₹ 35.4 ₹ 30.6 ₹
4.2.2.14.4 Scenario 4 – NPV rates based on a blanket rotation period of 60 years, 4% rate of discount and Total Economic Value based on adjusting for double counting and simultaneous delivery of ecosystem services
Table 29 – NPV Estimates (Scenario 4)
NPV (in ₹ Lakhs/ha) VDF MDF OF LTF
Tropical Wet Evergreen Forests – North East ₹ 39.8 ₹ 21.7 ₹ 19.5 ₹
Revision of rates of NPV applicable for different class/category of forests
49
4.2.2.15 Conservative estimates
While the estimated NPV rates differ
significantly from the current NPV rates used
for forest diversion, the difference may mainly
be attributed to the increased availability of
reliable data for estimation of goods and
services from forests and development of new
methodologies for economic valuation of the
same. While using more updated data and
sophisticated economic valuation
methodologies, there has been a conscious
effort not to overestimate the economic value
of any of the goods and services from forests.
Below are some of the major arguments to
substantiate the fact that the estimates are, at
best, conservative.
While using more updated data and sophisticated economic valuation methodologies, there has been a conscious effort not to overestimate the economic value of any of the goods and services. Reasons are provided why the estimates, even though a significant departure from the current rates, may
still be regarded as conservative.
Table 34 –Conservativeness of NPV estimates
Goods/service Reasons why estimates are conservative
Timber
A very conservative estimate for market price of timber (₹ 45,000 / cum) has been used.
Fodder Mainly based on reported figures which are gross underestimates.
Fuelwood Mainly based on reported figures which are gross underestimates.
Goods/service Reasons why estimates are conservative
Bamboo
A conservative estimate for market price of bamboo (₹ 7,500 / 100 culms) has been used.
NWFP
Economic value of only 12 major NWFPs is estimated. Does not include a range of other NWFPs due to non-availability of reliable/authentic data.
Carbon sequestration
Estimates based on default IPCC values which are conservative figures. Social Cost of Carbon in itself is an underestimate according to IPCC.
Gene-pool conservation
Relatively old estimates are used without accounting for inflation.
Pollination and seed dispersal
Only considers the economic value with regards to forest regeneration. Excludes the contribution to agricultural production.
Soil conservation
It is assumed that it will take 100 years to erode the soil in absence of forests which is a very long time period.
Water recharge
Does not include the contribution of root system to water recharge. The economic value of water used for estimation is also conservative.
Carbon storage
Estimated based Social Cost of Carbon in itself is an underestimate according to IPCC.
Water purification
Studies used for benefits transfer do not have dense population as in the case of India.
4.2.2.16 Contribution of various types of ecosystem services to estimated NPV rates
Revision of rates of NPV applicable for different class/category of forests
53
on the applicable NPV rate be charged for the
geographical area of forested wetlands.
To make NPV more site-specific, it is suggested that a 20% premium on applicable NPV rates may be applied based on
add-on factors of hill talukas and forested wetlands. It is further suggested Eco-sensitive zones outside the protected
areas should be charged higher as compared to any other forest land outside protected areas.
4.2.3.3 Protected Areas
Rate of charge: The diversion of forest land
falling in National Parks and Wildlife
Sanctuaries has currently been allowed
only in exceptional and totally
unavoidable cases with the permission of
the Hon’ble Supreme Court. Such
permissions are considered on payment of
an amount of 10 times in the case of
National Parks and 5 times in the case of
Wildlife Sanctuaries respectively of the
NPV payable and permitted only in the
cases of public interest. Such a charge is
levied for forest diversion recognizing the
Precautionary Principle. Recognizing the
importance of areas in the vicinity of
National Parks and Wildlife Sanctuaries
for ensuring flow of forest goods and
services, reducing disturbance to
movement of wildlife and biodiversity
and minimizing defragmentation of forest
landscapes near protected areas thereby
disturbing wildlife corridors, it is
suggested that 5 times the applicable
NPV should be charged for diversion of
forest areas in Eco-sensitive zones around
National Parks. In the case of Sanctuaries,
the amount to be charged for forest
diversion in the eco-sensitive zone is
recommended to be 3 times the
applicable NPV in the region. For
National Parks and Sanctuaries where
eco-sensitive zones have not been
identified as of yet, a 10 kilometre buffer
may be used as the eco-sensitive zone.
Charge for non-forest area: The use of non-
forest land falling within the National
Parks and Wildlife Sanctuaries would be
permitted on payment of an amount equal
Concentric ring model for charge of NPV in and around Protected Areas
In addition, if an agency (FESMA) such as the one flagged later in Section 6.3 is institutionalized in future, it may be possible to charge the NPV in a more logical and scientific gradation, there may also be potential for charging different NPV rates around National Parks and Sanctuaries as a function of the vicinity of forest area to be diverted to the protected area. One possible scheme which came up during the consultation process for charging NPV in the buffer areas of National Parks and Sanctuaries in the scenario of a fully operational agency such as FESMA is demonstrated below with respect to the applicable NPV rates based on forest type group and canopy cover density class.
National Parks
Sanctuaries
Inside 10 times 5 times 0-2 kms outside 8 times 4 times 2-4 kms outside 6 times 3 times 4-6 kms outside 4 times 2 times 6-8 kms outside 2 times Same
However, owing to high administrative cost of implementing distance criterion for charing diversion in and around protected areas, the study does not recomemdned such as agency as of now.
Revision of rates of NPV applicable for different class/category of forests
56
5 EXEMPTIONS
The 2006 NPV Expert Committee made
suggestions on granting full or partial
exemptions from NPV payment to a range of
development projects that need the diversion
of land with forest cover. Based on various
criteria of non-commercial nature,
contribution of activity to forest and
environment conservation, temporal nature of
impact, additional cost burden on account of
NPV, among others, Committee provided a list
of categories which may be exempted from
NPV charge along with associated exemption
levels. The CEC further analyzed the
exemptions recommended by the 2006 NPV
Expert Committee and suggested the final list
of activities which should be exempted from
NPV charge along with exemption levels.
Based on the consultation carried out with
wide range of stakeholders for the current
study, the current levels of exemptions have
largely been retained. However, modifications
are suggested in a few project categories that
have significant and/or permanent impact on
the ecological fabric of the land. These include
relocation of villages from protected areas to
alternate forest lands, underground mining,
field firing ranges and wind energy projects.
The current exemption levels for a list of
activities along with proposed exemption
levels based on consultation and analysis
carried out in this study are listed in Table 39.
.
Table 39 – Activity-wise current &proposed levels of exemption from applicable NPV payable
List of activities/projects Current Exemption levels for NPV (% of full chargeable NPV)
16
Proposed Exemption levels for NPV (% of full chargeable NPV)
Remarks for proposed exemption levels
16 See order dated 09.05.2008 in l.A. Nos. 826 in 566 with 955 in 566, 958, 985, 1001-1001A, 1013-14, 1016-
1018, 1019, 1046, 1047, 1135-1136, 1164, 1180-1181, 1182-1183 1196, 1208-1209, 1222-1223, 1224-1225, 1229, 1233 in 1135-1136, 1248-1249, 1253, 1301-1302, 1303-1304, 1312, 1313, 1314, 1318, 1319 in 1137, 1325, 1364, 1365-1366, 1370-1370A, 1371, 1384, 1385-1386, 1387, 1434, 1435-1437, 1438, 1441 with 1634, 1475-1476, 1513, 1573, 1639 in 1135-1136 in I.A. Nos. 566, 1664, 1665, 167l, 1676, 1707, 1721, 1779 in 1164 in 566, 1785-1786 in I.A. Nos. 1441, 1980-1981, 1993, 2013 2074-2076, 2077-2078 in 1441 and 2098 in 1233 in 1135-1136, 2145-2146, 2147-2148, 2149-2150 and 2153-2154 in I.A. No. 566 in W.P.(C) No. 202/1995.
KEY MESSAGES
This chapter is in response to TOR 4: Formulate objective parameter(s) to make a project eligible for exemption from NPV for the assigned study.
Based on the consultation carried out with wide range of stakeholders, the current levels of exemptions have been largely retained. However, modifications are suggested in a few project categories that have significant and/or
permanent impact on the ecological fabric of the land. These include relocation of villages from protected areas to alternate forest lands, underground mining, field firing ranges and wind energy projects.
Revision of rates of NPV applicable for different class/category of forests
57
List of activities/projects Current Exemption levels for NPV (% of full chargeable NPV)
16
Proposed Exemption levels for NPV (% of full chargeable NPV)
Remarks for proposed exemption levels
Public works:
Schools
Hospitals
Children’s playground
Community centres in rural areas
Over-head tanks
Village tanks
Police stations
Court rooms
Laying of underground drinking pipeline up to 4” diameter
Electricity distribution line in rural areas up to 22 kV
Full Exemption up to 1 ha of forest land provided:
no felling of trees in involved;
alternative forest land is not available;
the project is of non-commercial nature and is a part of the Plan/Non-Plan Scheme of Government; and
the area is outside National Park / Sanctuary.
Full exemption up to 1 ha of forest land provided:
No felling of trees in involved;
No alternative land is found suitable ;
The project is of non-commercial nature and is a part of the Plan/Non-Plan Scheme of Government; and
The area is outside National Park and Sanctuary.
It is necessary that all of the conditions are met.
Relocation of villages from the National Park / Sanctuaries to alternate forest land
Full Exemption 50% Exemption While Full Exemption was provided earlier, it has to be recognized that diversion of forests at the relocation site has implications on loss of forest goods and services in addition to the increased pressure on forests in the vicinity.
Revision of rates of NPV applicable for different class/category of forests
58
List of activities/projects Current Exemption levels for NPV (% of full chargeable NPV)
16
Proposed Exemption levels for NPV (% of full chargeable NPV)
Remarks for proposed exemption levels
Collection of boulders / silts from the river belts in the forest area
Full Exemption provided:
area is outside National Park / Sanctuary;
no mining lease is approved / signed in respect of this area;
the works including the sale of boulders / silt are carried out departmentally or through Government undertaking or through the Economic Development Committee;
the activity is necessary for conservation and protection of forests; and
the sale proceeds are used from for protection / conservation of forests;
Full Exemption provided:
The area is outside National Park and Sanctuary;
The site activity is necessary for conservation and protection of forests;
The sale proceeds are used from for protection / conservation of forests;
No mining lease is approved / signed with regards to this area; and
The works including the sale of boulders / silts are carried out departmentally or through Government undertaking or through the Economic Development Committee or Joint Forest Management Committee;
It is necessary that all of the conditions are met.
Laying of underground optical fibre
Full Exemption provided:
No felling of trees in involved; and
area falls outside National Park / Sanctuary;
Full Exemption provided:
No felling of trees in involved; and
The area is outside National Park and Sanctuary;
It is necessary that all of the conditions are met.
Revision of rates of NPV applicable for different class/category of forests
59
List of activities/projects Current Exemption levels for NPV (% of full chargeable NPV)
16
Proposed Exemption levels for NPV (% of full chargeable NPV)
Remarks for proposed exemption levels
Pre-1980 regularization of encroachments and conversion of forest villages into revenue villages
Full Exemption provided these are strictly in accordance with MoEFCC’s Guidelines dated 18.9.1990
Full Exemption
17provide
d these are strictly in accordance with the Forests Rights Act, 2006 and MoEFCC’s guidelines dated 18.9.1990
Underground mining 50% of the NPV of the entire area
20% Exemption on the applicable NPV
It has been observed that while underground mining mitigates some of the impacts of open cast mining, the damage to aquifers and hydrological systems is often irreparable. In light of this finding, the study team recommends that underground mining should not be provided any exemption from NPV payment.
Field firing range Full exemption provided:
no felling of trees in involved; and
no likelihood of destruction of forest is involved;
80% Exemption provided:
no felling of trees in involved; and
no likelihood of destruction of forest is involved;
Recognizing that although field firing ranges conserve forests, they inhibit the access of people which depend on forests. As a result, a change is recommended to account for the social cost of fencing-off the area.
17 Section 3(2) of the Forest Rights Act has to be considered accordingly which states : “Notwithstanding
anything contained in the Forest (Conservation) Act, 1980, the Central Government shall provide for diversion of forest land for the following facilities managed by the Government which involve felling of trees not exceeding seventy-five trees per hectare, namely:- (a) schools; (b) dispensary or hospital; (c) anganwadis; (d) fair price shops; (e) electric and telecommunication lines; (f) tanks and other minor water bodies; (g) drinking water supply and water pipelines; (h) water or rain water harvesting structures; (i) minor irrigation canals; (j) non-conventional source of energy; (k) skill upgradation or vocational training centres; (l) roads; and (m) community centres: Provided that such diversion of forest land shall be allowed only if,-
i. the forest land to be diverted for the purposes mentioned in this sub-section is less than one hectare in each case; and
ii. the clearance of such developmental projects shall be subject to the condition that the same is recommended by the Gram Sabha.
The conditions attached above is the law of the land and supersedes the 2002 guidelines as well as any other government order that may have been issued in this regard.
Revision of rates of NPV applicable for different class/category of forests
60
List of activities/projects Current Exemption levels for NPV (% of full chargeable NPV)
16
Proposed Exemption levels for NPV (% of full chargeable NPV)
Remarks for proposed exemption levels
Wind energy projects 50% of the minimum rate of the NPV irrespective of the eco-class in which the project lies provided mining tree felling is involved
18
50% of the applicable rate of the NPV in the area according to the Forest Type Group and Canopy Cover Density Class provided it involves felling of a maximum of 5 trees.
18 Also see order dated 24.04.2008 in I. A. Nos. 1135 and 1136, 1224 and 1225, 1233, 1385-1386 and 1438 with
1639, 1671, 2098 and CEC clarification dated 22.12.2008
Revision of rates of NPV applicable for different class/category of forests
61
6 OTHER RECOMMENDATIONS
6.1 From afforestation to forest rehabilitation
While NPV from forest diversion is currently
collected in a centralized CAMPA fund, the
use of fund in conserving or enhancing forest
ecosystem services are yet to achieve the
desired results on ground (See Appendix 26
for net accumulation and disbursement from
CAMPA fund to various states). The objective
behind NPV collection is to compensate those
who suffer on account of loss of forest goods
and services due to diversion. This finds
recognition in the CAMPA guidelines issued
by MoEFCC in 2009. However, the two major
heads for which CAMPA money is generally
used include plantation activity and
administrative & infrastructure development.
As per CEC Report dated 9.8.2002,
plantations will never be able to replace
natural forests and hence NPV amount should
be used to compensate economic loss of forest
diversion. Since the states receive funds from
CAMPA under various heads such as NPV,
CA, SZ, PCA, and PAF among others, all
meant for forest development, there are
possibilities of NPV not being directly
addressed to the needs of the locals or for
restoring ecosystem services (Kohli et al.
2011). But a good monitoring system, if and
when instituted, can address to this issue.
KEY MESSAGES
This chapter is in response to TOR 5: Suggest any other recommendation(s) in the furtherance of realization of NPV to make it more objective and scientific.
The money from NPV fund is often used by states on plantation activity and infrastructure development which defeats the very purpose of collecting NPV. There is thus a need to move from afforestation to ecological restoration
and forest rehabilitation to satisfy the objective behind NPV collection.
Over and above plantations and infrastructure development, it is recommended that CAMPA money should be utilized in a whole range of activities such as capacity building, forest reclamation, and establishing forest nurseries,
promoting green energy, and filling current research gaps among others. It is also recommended that a limit on maximum allowable expenditure under different heads may also be prescribed for utilization of CAMPA money.
To carry out activities effectively in order to compensate for the loss of forest diversion at the local level and in the light of Forest Rights Act, the study recommends a greater decentralization in the collection and management of
NPV fund.
The study also recognizes the importance of incentive based mechanisms for encouraging good practices among user agencies and promoting returning of forest land after proper treatment and reclamation.
In addition, the study team is of the view that considering the existing limitations of forest management machinery, the capacity of existing forest management institutions may be built to both – verify the NPV rates applicable and
monitor utilization of NPV money. For this purpose, it is recommended that NPV maps for the entire country may be prepared to eliminate discretion in identifying the applicable NPV rates and the permanent establishment of
CAMPA, as and when institutionalized, may be given additional monitoring responsibilities.
Revision of rates of NPV applicable for different class/category of forests
63
essential for reclaiming forest land as
discussed above.
Green energy: To reduce pressures on existing
forests – especially targeted to
communities dependent on forests for
fuelwood in vicinity to the diverted forest
area – CAMPA fund may be used to
promote use of green energy such as LPG;
Human-wildlife conflict: Recognizing the fact that
diversion of forest land leads to forest
fragmentation which is one of the major
reasons for increasing human-wildlife
conflict in recent time, CAMPA fund may
be utilized to compensate for wildlife-
inflicted economic losses and human injury
in vicinity of forest land diverted;
Over and above plantations and infrastructure development, it is recommended that CAMPA money may be utilized in a
whole range of activities such as capacity building, forest reclamation, establishing forest nurseries, promoting green energy, and filling current research gaps among others. It is
also recommended that a limit on maximum allowable expenditure under different heads may also be prescribed for
Revision of rates of NPV applicable for different class/category of forests
69
greatly in improving the overall transparency
of the system.
6.6 Future research gaps
While the study has made an attempt to
estimate as many forest ecosystem services as
possible objectively and scientifically, the field
of ecological economics is still relatively new.
The fact that methodologies for estimating
types of ecosystem services are still evolving is
further complicated by limitations of
availability of reliable data in India. In future,
more data availability in identified areas will
help not only in more objective estimation of
ecosystem services but also calculation of
uncertainty in economic value estimates. Both
these information will help decision makers
immensely in making informed choices.
One of the major limitations in the area of
economic valuation of ecosystem services
currently is in estimation of wildlife value19.
This limitation is an area of concern, especially
for India with its rich biodiversity20. On
account of no objective methodology to
estimate its value, the economic value of
wildlife could not be estimated in a more
scientific manner. However, in future, it is
recommended to invest more time and
resources to develop methodologies for
estimating economic value of wildlife in a
19According to the Wildlife Protection Act, 1972,
“wildlife” includes any animal, bees butterflies, crustacean, fish and moths; andaquatic or land vegetation which forms part of any habitat. The discussion here on limitation of current study mainly pertains to the faunal aspect. 20
Issue raised by Shri V. B. Mathur, Dean, Wildlife Institute of India during the Consultation meeting.
Revision of rates of NPV applicable for different class/category of forests
71
7 Internalization of comments and concerns of stakeholders21
7.1 Comments on the First Draft Report
Rendering to the calculations shown in preceding chapters for estimating the economic value of
various ecosystem services from forests, the report was submitted to the Ministry of Environment,
Forests & Climate Change (MoEFCC) for consideration in June 2013. As implementation of updated
rates for Net Present Value are likely to influence lives and businesses of a large number of
stakeholders across sectors in India, MoEFCC later put the report in public domain and invited
responses on it by 31st August 2013. A total of 16 organizations submitted their comments on the
report to MoEFCC. In addition, 3 other organizations submitted their comments directly to IIFM. Of
these 19, 11 organizations are related to mining, 4 organizations to wind energy and the remaining 4
organizations relate to other kind of activities. The latter includes Society for Promotion of
Wastelands Development (SPWD), Office of PCCF (Mizoram), ACC Limited and National
Hydroelectric Power Corporation (NHPC). The comments received can be broadly categorized into
those suggesting underestimation, overestimation of NPV rates, related to exemptions from paying
NPV and miscellaneous aspects.
21 The contents of this chapter were not part of the draft report submitted to MoEFCC in June 2013. Based on the comments received on the report, the chapter has been added for further updating the methodology used.
KEY MESSAGES
This chapter is in response to TOR 6: Analyze, discuss and internalize comments received from stakeholders on the first draft report
The comments received from various stakeholders on the first draft report uploaded on MoEFCC’s website were analyzed rigorously and discussed extensively with various officials of MoEFCC. This draft report, especially the
current chapter has made an attempt to internalize those concerns.
Firstly, an easy-to-comprehend and step-wise methodology used for valuation of each of the ecosystem services considered in the study has been presented. Further, in addition to paying Net Present Value rates of forest to be
diverted, the user agencies are also required to pay for compensatory afforestation (CA). It needs to be acknowledged that while natural forests can never be replaced by plantations, these measures also compensate for a proportion of
ecosystem services lost as a result of forest diversion. As user agencies are mandated to pay for compensatory afforestation, it is being suggested that the final NPV rates may be adjusted based on the proportion of value of
ecosystem services restored due to compensatory afforestation. The amount of discounting needed has been estimated as Standard Compensatory Afforestation Restoration Factor (SCARF).
In order to aid decision-making of MoEFCC in dealing with the plethora of issues related to NPV, it is proposed that a year-round data gathering and analysis hub of MoEFCC be located at the Centre for Ecological Services
Management, IIFM. The Hub is proposed to render transparency, objectivity and consistency to the decision-making process and provide information on various forest land transfer and ecosystem services related issues and queries
Revision of rates of NPV applicable for different class/category of forests
80
Box 5 - A hypothetical situation to demonstrate the methodology for SCARF
Let us consider a hypothetical situation to gain more clarity on the proposed mechanism for adjustment. Consider a Forest Division ABC with 3 Forest Blocks i.e. A, B and C. Suppose a patch of 40 hectares is proposed for diversion in Wet Evergreen Forest – Western Ghats (Very Dense Forest) category from Forest Block A (see figure overleaf). The NPV to be charged for diversion of this forest according to the proposed rates is Rs. 43.34 lakhs per hectare. The land for compensatory afforestation has also been identified in the same Forest Division, although it is a revenue land. It is safe to assume that along the ecological continuum (including forest type, soil conditions, terrain, climate, etc.), compensatory afforestation will have highest resemblance/similarity to the nearest forest land. Thus, the forest land in the vicinity (Forest Block B) is the best measure of the potential of compensatory afforestation to restore ecosystem services lost due to diversion of forest in Forest Block A. Thus, the Standard Compensatory Afforestation Restoration Factor (SCARF) should be estimated based on category of forest in Forest Block B (nearest to the compensatory afforestation land). This category, let us suppose, is Semi Evergreen Forests – Western Ghats (Open Forest) for which the estimated SCARF is 3.82% and the associated NPV rates are Rs. 15.44 lakhs per hectare. An adjustment of Rs. 0.59 lakhs per hectare (3.82% of Rs. 15.44 lakhs) should be made in the NPV charged for forest land diverted i.e. Rs. 43.34 lakhs per hectare. The adjusted NPV rate of Rs. 42.75 lakhs per hectare should thus be charged for the diverted forest land after internalizing the potential of compensatory afforestation land to restore a portion of ecosystem services lost.
Revision of rates of NPV applicable for different class/category of forests
84
8 REFERENCES
Adger, N. et al., 1994. Towards estimating total economic value of forests in Mexico.
Anielski, M. & Wilson, S., 2005. Counting Canada’s Natural Capital: assessing the real value of Canada's Boreal Ecosystems,
Armitage, I., 1998. Guidelines for forest management planning, Rome: Food and Agriculture Organization of the United Nations. Available at: http://www.fao.org/docrep/w8212e/w8212e07.htm.
Bahuguna, V. K. & Bisht, N.S., 2013. Valuation of ecosystem goods and services from forests in India. The Indian Forester, 139(1).
Bahuguna, Vinod Kumar, 2000. Forests in the economy of the rural poor: an estimation of the dependency level. Ambio, 29(3), pp.126–129.
Bansal, A.K., 2013. Forest Conservation Act - application and implications. One India One People, (March), pp.12–14.
Bansal, A.K. et al., 2012. REDD+ manual for practitioners, Bhopal.
Brenner-Guillermo, J., 2007. Valuation of ecosystem services in the Catalan coastal zone. Polytechnic University of Catalonia.
Bruijnzeel, L.A., 2004. Hydrological functions of tropical forests: not seeing the soil for the trees? Agriculture, Ecosystems & Environment, 104, pp.185–228.
CBD, 2001. The value of forest ecosystems. , p.67.
CEC, 2007a. Central Empowered Committee Supplementary Report in IA No 826 in IA No 566 regarding calculation of Net Present Value (NPV) payable on use of forest land of different types for non-forest purposes, New Delhi.
CEC, 2007b. Central Empowered Committee Supplementary Report in IA No 826 in IA No 566 regarding calculation of Net Present Value (NPV) payable on use of forest land of different types for non-forest purposes, New Delhi.
Chakravarti, R., 1985. Some observation in fuelwood forestry in India. Journal of Tropical Forestry, 1(1).
Chomitz, K.M. & Kumari, K., 1998. The domestic benefits of tropical forests: a critical review. The World Bank research observer, 13(1), pp.13–35. Available at: http://www.ncbi.nlm.nih.gov/pubmed/12295970.
Chopra, K. & Kadekodi, G.K., 1997. Natural resource accounting in the Yamuna basin: accounting for forest resources,
Costanza, R. et al., 1997. The value of the world ’ s ecosystem services and natural capital. Nature, 387(May), pp.253–260.
Croitoru, L., 2007. How much are Mediterranean forests worth? Forest Policy and Economics, 9(5), pp.536–545. Available at: http://linkinghub.elsevier.com/retrieve/pii/S1389934106000293 [Accessed April 28, 2013].
Cruz, W., Francisco, H.A. & Tapawan-Conway, Z., 1988. The on-site and downstream costs of soil erosion, Philippine Institute for Development Studies, The International Developement Research CEntre and the Centre for Policy and Development Studies.
Curz, A. de la & Benedicto, J., 2009. Assessing Socio-economic Benefits of Natura 2000 – a Case Study on the ecosystem service provided by SPA PICO DA VARA / RIBEIRA DO GUILHERME.,
Das, S. & Vincent, J.R., 2009. Mangroves protected villages and reduced death toll during Indian super cyclone. Proceedings of the National Academy of Sciences of the United States of America, 106(18), pp.7357–60. Available at: http://www.pubmedcentral.nih.gov/articlerender.fcgi?artid=2678660&tool=pmcentrez&rendertype=abstract.
Dhawan, B.D., 1993. Coping with floods in Himalayan rivers. Economic and Political Weekly, 1 May 1993, pp.849–853.
DoF, 2013. Product-wise MRP and Subsidy rates. Dept. of Fertilizers, Ministry of Chemicals and Fertilizers, Govt. of India. Available at: http://fert.nic.in/?q=product-wise-mrp-and-subsidy-rates [Accessed May 5, 2013].
Revision of rates of NPV applicable for different class/category of forests
85
Earth Economics, 2013. The Ecosystem Valuation Toolkit. Available at: http://www.esvaluation.org/ess_types.php [Accessed April 7, 2013].
Ekpe, E.K., 2012. A Review of Economic Instruments Employed for Biodiversity Conservation. Consilience, 9(1), pp.16–32.
ELDF & WWF India, 2009. India’s forests and the judiciary - the Godavarman story, New Delhi: WWF India.
Emerton, L., 2003. Tropical forest valuation: has it all been a futile exercise? In Proceedings of the 12th World Forestry Congress. Quebec, Canada, pp. 103–110.
FAO, 2010. Grassland carbon sequestration: management, policy and economics, Rome: Food and Agriculture Organization of the United Nations.
FAO, 1999. Towards a harmonized definition of non-wood forest products, Unasylva.
Forest Principles, 1992. The UN Conference on Environment and Development, Rio-de-Janeiro.
FSI, 2011a. Atlas of Forest Types of India, Dehradun.
FSI, 2013a. Carbon stock in India’s forests, Dehradun.
FSI, 2013b. Carbon stock in India’s forests, Dehradun.
FSI, 2013c. Forest Inventory Database.
FSI, 2011b. India State of Forest Report, Dehradun.
FSI, 2011c. India State of Forest Report, Dehradun.
Gundimeda, H. et al., 2006. The value of biodiversity in India’s forests.
IMF, 2012. World Economic Outlook Database. Available at: http://www.imf.org/external/pubs/ft/weo/2013/01/weodata/index.aspx [Accessed April 28, 2013].
IPCC, 2003. Good Practice Guidance for Land Use, Land Use Change and Forestry, Hayama.
Joshi, M. & Singh, P.P., 2003. Applying natural resources economics to forest degradation: lessons from India. In Proceedings of the 12th World Forestry Congress. Quebec, Canada, p. 127.
Kadekodi, G.K., 1999. Valuation and accounting for environmental resources,
Kaiser, B. & Roumasset, J., 2002. Valuing Indirect Ecosystem Services : the Case of Tropical Watersheds. Environment and Development Economics, 7, pp.701–714.
Kohli, K. et al., 2011. Pocketful of forests: legal debates on valuing and compensating forest loss in India, New Delhi: Kalpavriksh & WWF-India.
Kumar, M.D., Malla, A.K. & Tripathy, S.K., 2008. Economic value of water in agriculture: comparative analysis of a water-scarce and a water-rich region in India. Water International, 33(2), pp.214–230. Available at: http://dx.doi.org/10.1080/02508060802108750.
Kumar, P. et al., 2010. Guidance Manual for the Valuation of Regulating Services, Nairobi: UNEP.
Kumar, P. et al., 2006. Soil conservation, water augmentation, and flood prevention.
Lal, R.B. et al., 2011. Nuts and bolts for India’s REDD+ calculus. The Indian Forester, 137(2), pp.139–153.
Lampietti, J.A. & Dixon, J.A., 1995. To see the forest for the trees: a guide to non-timber forest benefits. , (July).
Lele, S. et al., 2008. The Economic Impact of Forest Hydrological Services on Local Communities : A Case Study from the Western Ghats of India. , (36).
MA, 2005. Ecosystems and Human Well-being: synthesis, Washington, DC.
Malhotra, K.C. et al., 2001. Cultural and ecological dimensions of sacred groves in India, Bhopal: Indian National Science Academy.
Mather, A., 1999. Society and the services of forests. In M. Palo & J. Uusivori, eds. World Forests, Society and Environment. Kluwer Academic Press, pp. 86–89.
Revision of rates of NPV applicable for different class/category of forests
86
Ministerie van Landbouw & Natuur en Voedselkwaliteit, 2006. Kentallen waardering natuur, water, bodem en landschap. Hulpmiddel bij MKBA’s., Deventer.
Naeem, S. et al., 1999. Biodiversity and ecosystem functioning: maintaining natural life support processes. Issues in Ecology, 4.
NAP, 2009. National Afforestation Programme Guidelines, New Delhi.
Nordhaus, W., 2011. Estimates of the social cost of carbon: background and results from the RICE-2011 Model, New Haven.
Panayotou, T., 1998. Developments of change: motivating and financing sustainable development, London: Earthscan.
Pandey, A.N., Pathak, P.C. & Singh, J.S., 1984. Water sediments and nutrient movement in forested and non-forested catchments in Kumaon Himalaya. Forest Ecology and Management, 7.
Pandey, R., 2011. Consumption and Valuation of Livestock Fodder under Different Forest Types of Himalayas, India. Silva Lusitana, 19(2), pp.195–207.
Pearce, D.W., 1990. An economic approach to saving the tropical forests.
Perrot-Maître, D. & Patsy Davis, E., 2001. Case Studies of Markets and Innovative Financial Mechanisms for Water Services from Forests,
Van der Ploeg, S. & De Groot, R.S., 2010. The TEEB Valuation Database - a searchable database of 1310 estimates of monetary values of ecosystem services.
Rausser, G.C. & Small, A. a., 2000. Valuing Research Leads: Bioprospecting and the Conservation of Genetic Resources. Journal of Political Economy, 108(1), p.173. Available at: http://www.jstor.org/stable/10.1086/262115.
Ricketts, T.H. et al., 2004. Economic value of tropical forest to coffee production. Proceedings of the National Academy of Sciences of the United States of America2, 101(34), pp.12579–12582.
Saha, S. et al., 2011. Under-mining health: environmental justice and mining in India. Health & Place, 17(1), pp.140–48.
Sheil, D. & Wunder, S., 2002. The Value of Tropical Forest to Local Communities : Complications , Caveats , and Cautions. Conservation Ecology, 6(2).
Sheingauz, A.S. & Sapozhnikov, A.P., 1988. Classification of functions of forests. Forest Science, 3, pp.7–16.
Shiva, M.P., 1998. Inventory of Forest Resources for Sustainable Management and biodiversity Conservation, New Delhi: Indus Publishing Company.
Simpson, R.D., Sedjo, R.A. & Reid, J.W., 1996. Valuing biodiversity for use in Pharmaceutical Research. The Journal of Political Economy, 104(1), pp.163–185.
TEEB, 2010. The Economics of Ecosystems and Biodiversity: Mainstreaming the economics of nature: a synthesis of the approach, conclusions and recommendations of TEEB,
Tianhong, L., Wenkai, L. & Zhenghan, Q., 2010. Variations in ecosystem service value in response to land use changes in Shenzhen. Ecological Economics, 69(7), pp.1427–1435. Available at: http://linkinghub.elsevier.com/retrieve/pii/S0921800908002206 [Accessed March 4, 2013].
UNECE, 1998. Non-wood goods and services of the forests.
UNEP, 2011. Forests in a green economy: a synthesis, Nairobi.
Verma, M. et al., 2009. Economic valuation of regulating services for decision-making and linkages with poverty reduction strategies in South Asia, Swindon.
Verma, M., 2008. Forest resource accounting: factoring in the intangibles. International Forestry Review, 10(2).
Verma, M., 2000. Himachal Pradesh Forestry Sector Review: Economic valuation of forests of Himachal Pradesh,
Revision of rates of NPV applicable for different class/category of forests
87
Verma, M., 2007. Valuation of forest ecosystem services in Uttarakhand, Himalaya. In Valuation of ecosystem services and forest governance - a scoping study for Uttarakhand. Lead India.
Verma, M. & Kumar, C.V., 2008. Valuation and accounting of forest resources in India - a suggestive methodological framework. In A. Kundu & M. von Hauff, eds. Environmental accounting - explorations in methodology. New Delhi: Manak Publications Pvt. Ltd.
Wiersum, K.F., 1984. Surface erosion under various tropical agroforestry systems. In C. L. O’Loughlin & A. J. Pearce, eds. Effects of forest
land use on erosion and slope stability. Vienna: IUFRO, pp. 231–230.
WRI, 1992. World Resources 1992-1993. A Guide to the Global Environment, New York and Oxford: Oxford University Press.
XE, 2013. Currency converter. Available at: http://www.xe.com/currencyconverter/ [Accessed April 28, 2013].
Appendix 3 – Percentage of total trees per hectare for which specific rotation period was used for calculation of rotation period in each classification unit.
Forest Type Group VDF MDF OF LTF Tropical Wet Evergreen-North East 50% 47% 72%
34 Data source: India State of Forest Report (FSI 2011b)
35 Based on the following assumptions: 1) only 50% of actual consumption of fuelwood from forests was
reported in the FSI study; 2) market price of fuelwood as ₹ 3000/tonnes (ICFRE 2011) and 3) a cost factor of 10% to obtain the cost-adjusted price of fuelwood
42 Data source: Green India States Trust, Monograph 4 (Gundimeda et al. 2006); The values for Jharkhand,
Chhattisgarh and Uttarakhand were not available in the study and are assumed to be the same as that of Bihar, Madhya Pradesh and Uttar Pradesh respectively. 43
Data source: India State of Forest Report (FSI 2011b)
48 Based on the assumption that only 50% of regeneration can be attributed to pollination and seed dispersal
services provided by wildlife including insects, birds, and other animals, accounting for seed dispersal that happens naturally due to wind and water; costs for artificial regeneration assumed on the basis of model costs of ₹ 17,100 per hectare as recommended by the National Afforestation Programme Guidelines (NAP 2009).
Revision of rates of NPV applicable for different class/category of forests
XXII
Forest Type (Carbon stock in tonnes C / ha) Density Total Carbon Stock (tC/ha)
56
Value of Carbon Stock (₹ /ha)
57
Montane & Moist Temperate Forests OF 88.86 ₹ 176,103 Sub Alpine and Dry Temperate Forests VDF 203.59 ₹ 403,475 Sub Alpine and Dry Temperate Forests MDF 125.52 ₹ 248,756 Sub Alpine and Dry Temperate Forests OF 86.78 ₹ 171,981 Alpine Scrub VDF 192.64 ₹ 381,774 Alpine Scrub MDF 117.91 ₹ 233,674 Alpine Scrub OF 69.49 ₹ 137,715
Appendix 23 – Adjustment Factor for GDP (PPP) per capita
Country GDP (PPP) per capita (Intl $)
58
Adjustment Factor for GDP (PPP) per capita
59
Australia 42640 0.089 China 9162 0.418 Costa Rica 12606 0.304 Ecuador 10056 0.381 Europe 32021 0.120 Indonesia 4977 0.770 Portugal 23385 0.164 Southern Europe 32021 0.120 Spain 30557 0.125 U.S.A. 49922 0.077 World 11975 0.320
Appendix 24 – Adjustment Factor for currency exchange rate
Appendix 27 – List of people contacted during individual consultation meetings
Title First Name Last Name Designation Organization Mr. A. K. Srivastava ADG (FC) MoEFCC Mr. M. S. Negi IG (FC) MoEFCC Mr. H. C. Choudhry AIG (FC) MoEFCC
Mr. Anirban Ganguly Convenor Forestry and Biodiversity
TERI
Dr. Rajiv Garg Advisor (E&F) Coal India Ltd. Dr. Rekha Pai IG MoEFCC Dr. Biswajit Banerjee Director (Forestry) The Planning Commission Mr. B. N. Satpathy Sr. Adviser (E&F and S&T) The Planning Commission Mr. P. S. Rao Expert Member The National Green Tribunal Mr. R. S. Sajwan Expert Member The National Green Tribunal Dr. Ranjan Chaterjee Expert Member The National Green Tribunal
Dr. Rita Pandey Professor National Institute of Public
Finance and Policy
Dr. M. S. Garbyal MoEFCC Bhopal Regional
Office Mr. A. K. Wahal Director General Forest Survey of India Mr. Rajesh Kumar Sr. Dy. Director (FI) Forest Survey of India Dr. Ruchi Badola Professor Wildlife Institute of India Dr. V. B. Mathur Dean Wildlife Institute of India Dr. Rajeev Bhartari CCF Uttarakhand Ecotourism Board Mr. Govind Rao Member The 14th Finance Commission
Dr. N. S. Bisht Professor Indian Council of Forestry
Research and Education Dr. R. B. S. Rawat PCCF Uttarakhand Forest Department Mr. D. V. S. Khati APCCF Uttarakhand Forest Department Mr. T. P. Singh India Coordinator IUCN
Dr. Alok Saxena Addl. Director Indira Gandhi National Forest
Academy
Dr. R. K. Goel Director Indira Gandhi National Forest
Academy Mr. Mohan Lal DIG MoEFCC Mr. Pyush Dogra Senior Environmentalist The World Bank Dr. B. K. Singh Director (FC) MoEFCC Dr. Padam Rastogi DG (EA) MoEFCC Mr. Naresh Kumar Joint Secretary Ministry of Mines Dr. Pramod Kant Director TERI Mr. Suresh Chauhan Fellow TERI
Mr. Alkesh Sharma Joint Secretary Ministry of Road Transport &
Revision of rates of NPV applicable for different class/category of forests
XXV
Title First Name Last Name Designation Organization
Mr. V. K. Sharma CEO National Highway Authority of
India Mr. Rajiv Gupta Director Ministry of Power (Hydro) Mr. R. M. Misra Chief Forest Officer NTPC Dr. Jagdish Kishwan Chief Advisor Wildlife Trust of India Mr. K. V. S. Chauhan Retd. Forest Survey of India Mr. Prakash Lakhchaura Deputy Director Forest Survey of India Mr. A. K. Sarkar Executive Director NHPC Mr. Vipin Kumar Chief Environment Officer NHPC Dr. T. C. A. Anant Chief Statistician of India Ministry of Statistics Mr. Shyam Divan CEC Judicial Bench Mr. M. K. Jiwrajka Member Secretary Central Empowered Committee
Hon’ble Justice P. Jyothimani Judicial Member National Green Tribunal, Bhopal
Bench
Dr. Ajay Deshpande Expert Member National Green Tribunal, Bhopal
Bench
Mr. M. P. Tiwari Deputy Registrar National Green Tribunal, Bhopal
Bench Dr. Sharad Lele Senior Fellow ATREE
Mr. R. K. Bansal Chief Executive Officer Federation of Indian Mineral
Industries
Mr. A. K. Bhandari Advisor (Environment) Federation of Indian Mineral
Industries
Mr. R. K. Sharma Secretary General Federation of Indian Mineral
Industries
Dr. Rajesh Gopal Addl. DGF (Project Tiger) National Tiger Conservation
Authority
Mr. S. P. Yadav DIG National Tiger Conservation
Authority
Mr. H. S. Negi IG National Tiger Conservation
Authority Mr. M. K. Ranjitsinh Chairman & Trustee Wildlife Trust of India Dr. Vivek Menon Executive Trustee Wildlife Trust of India Mr. K. S. Achar Consultant CAMPA Mr. N. C. Saxena Member National Advisory Council Mr. Nitin Sethi Assistant Editor Times of India Mr. Rahul Noronha Senior Correspondent The Hindustan Times
Mr. Harish Salve Ex-Solicitor General of India & Senior Lawyer, Supreme Court of India & CEC Judicial Bench Member
Mr. A. K. Dharni Professor IIFM Mr. Anil Khare Associate Professor IIFM Mr. Prashant Jadhav Associate Professor IIFM Mr. K. K. Jha Associate Professor IIFM Mr. Shahbaz Ahmed Professor IIFM Mr. Yojneshwar Sharma DGDE Ministry of Defence
Appendix 28 – List of participants in the National Consultation Workshop at New Delhi
Title First Name Last Name Designation Organization
Shri K. S. Reddy APCCF (C) MoEFCC Bangalore Regional Office
Shri P. K. Sharma APCCF (FCA) Andhra Pradesh Forest Department
Dr. Rajiv Kumar Garg Advisor (E&F) Coal India Ltd.
Revision of rates of NPV applicable for different class/category of forests
XXVII
Title FirstName LastName Designation Organization
Mr. N. S. Dungriyal CCF MP Forest Department
Dr. B. K. Tiwari Professor NEHU
Mr. Aswini Mohanty Resident Executive Tata Steel Ltd.
Dr. V. Parameswaran Deputy Director General CSO
Mr. Sandeep Rai Manager - Forestry & Regulatory Affairs
Suzlon Energy Ltd
Mr. Vinod Pandya Vice-Precident & Head - Forestry Suzlon Energy Ltd
Mr. Tejinder Singh APCCF HP Forest Department
Mr. Lakhwinder Singh APCCF MoEFCC Bhopal Regional Office
Mr. K. S. Reddy APCCF MoEFCC Bangalore Regional Office
Mr. A. K. Dharni Professor IIFM
Mr. Shahbaz Ahmed Professor IIFM
Mr. Rajesh Kumar Sr. Dy. Director Forest Survey of India
Dr. Gopal Kadekodi Hon. Professor CMDR
Dr. Rekha Singhal Dean IIFM
Mr. Anoj Choudhary Dy. Manager (Env & Forests)
Dr. R. B. Lal Ex-Director IIFM
Appendix 30 – A small concept note on NPV circulated before consultation meetings and workshops
In pursuance of SC judgment dated 26.09.2005 in IA No. 826 in IA No. 566 of 2000 in Writ Petition (Civil) 202 of 1995, a 3-member expert committee was formed to work out the Net Present Value (NPV) for forest land diverted for non-forest use on economic principles. Under the chairpersonship of Dr. Kanchan Chopra (IEG), the committee in 2006 recommended a12-step procedure at the forest range level to estimate NPV. The Kanchan Chopra committee internalized in its recommendation, the methodology suggested by the Study Commissioned by her from IEG to Dr. Madhu Verma (IIFM) in 2005 on “Estimating Economic Value of Forest Land: A Methodology”, which prescribed estimation of benefits and costs of various ecosystem services as listed below:
The NPV estimated consisted of six key goods and services from forests apart from biodiversity. These goods and services were estimated based on parameters tabulated below.NPV was calculated as present value of the net flow accruing over 20 years at 5% social rate of discount. It was further argued that simply adding up services would be incorrect as different forests yield different services. Thus percentage values were developed for each goods and services valued based on the type of dominant forest practices. Ground rent for land was also recommended to be approximated by prevailing rents in the region, subject to a minimum of INR 10,000 per hectare.
Good or service Basis of estimation Timber Long run stumpage value and stumpage price of mature timber Carbon storage Carbon content and market rate of carbon Fuel wood & fodder Total quantity collected, market price of collection, and cost of collection NWFP Total quantity collected, market price of collection, and cost of collection Ecotourism No. of people visiting forests, average expenditure per person Watershed services Value per hectare of soil conservation and hydrological services Biodiversity Based on relative weighing pattern between biodiversity and other services
The NPV amount collected was to be paid by the user agency into a centralized fund called “CAMPA”. It was also recommended that the amounts collected in lieu of NPV and other charges should be divided as per methodology described between those accruing to local, state and national level stakeholders.
Following the report submitted by the expert committee, the Central Empowered Committee (CEC) filed a supplementary report in pursuance of the SC order dated 28.11.2006 in IA No. 826 in IA No. 566 after considering technical inputs from Forest Survey of India, MoEFCC officials, Chairperson and Members of the Kanchan Chopra Committee. Based on Champion and Seth classification, the forests were categorized into 6
Revision of rates of NPV applicable for different class/category of forests
XXVIII
eco-classes. Equalization value of forests belonging to different eco-classes and forest cover density was worked out on the basis of value judgment and experience.
Eco-value class (₹ /ha)
VDF MDF OF
Class I 10,43,000 9,39,000 7,30,000 Class II 10,43,000 9,39,000 7,30,000 Class III 8,87,000 8,03,000 6,26,000 Class IV 6,26,000 5,63,000 4,38,000 Class V 9,39,000 8,45,000 6,57,000 Class VI 9,91,000 8,97,000 6,99,000
The CEC more or less borrowed the values estimated by the expert committee. In addition, it estimated the carbon sequestration value, value of flagship species and bio-prospecting on the basis of state-wise details as assessed in the Green India States Trust (GIST) report. The total value of per hectare of forest based on these goods and services was thus estimated to be INR 7,77,597 and was approximated to be INR 8 lakhs per hectare. Based on equalization value of forests, the CEC recommended the tabulated NPV rates (in INR). While keeping the time period of 20 years for NPV, the CEC reduced the social discount rate to 4% in calculating these values.
The Kanchan Chopra Committee also gave its recommendations on certain types of projects which may be given partial or full exemption from NPV. The CEC generally accepted those recommendations. Public good projects such as schools, hospitals, rural infrastructure, among others were granted full exemption. Other project categories which were also believed to result in public good benefits were given partial exemption. CEC also recommended that use of forest land falling in protected areas will be permissible only in totally unavoidable circumstances for public interest projects by obtaining permission from SC and paying up to 10 times the NPV rate. The CEC recommended that NPV rates should be revised every 3 years.
Appendix 31 – Minutes of NPV National Consultation Workshop held at New Delhi
TOR 1 – NPV Recalculation
Include soil indicators in estimation of water flow regulation and soil erosion regulation
For timber estimation, do not use royalty rates as they are gross underestimates. Biomass should be used for its estimation
The NPV rates should be specific to type of land-use change.
The rates should consider whether there are any adjoining forests available where local communities can derive their resources they current use from area to be diverted.
Disbursement of CAMPA fund should be done at the local, state and national level in a 3-tier arrangement.
Human development index of area to be diverted should form an integral part of NPV.
Alternative livelihood opportunities available in an area should also be included in NPV estimation.
Forests have a locational value also e.g. forests in the periphery of a forested area. This should be included in NPV estimation
Special characteristics of an area should be considered in calculating NPV.
Ancillary activities of a project should also form a basis of NPV calculation. For e.g. while mining has its own set of impacts, related impacts such as impact on aquifers, impact due to transportation, etc are not accounted.
Differential land rent based on proximity to population centres should be the basis of determining ground rent.
Revision of rates of NPV applicable for different class/category of forests
XXIX
Land around highways is a tricky proposition because the land has been notified as protected forests based on plantations done by highway authorities. Charge on NPV on such areas needs reconsideration.
NWFP values should be weighed according to population estimates of an area.
Effect of mining on water regime and its related downstream pollution impact should be considered in NPV.
Critical areas for wildlife outside protected areas are currently charged very less as compared to a protected area. This needs some consideration. Areas adjoining to national parks should be treated differentially.
It is all good to talk about very many services to value but we should restrict to only those services which we can value reliably. All ecosystem services have complementarity and care should be taken to avoid double counting. This is net present value and cost is to be always subtracted from the price.
A part of CAMPA fund should be specifically used to compensate local communities in real terms. For e.g. If water services are lost, then fund should be targeted to provide clean drinking water.
There should be a high ground rent for unproductive land to incentivize handing back of land. Restoration and reclamation should also be encouraged by refunding a part of NPV originally collected.
Positive externalities from any project should be considered in NPV calculation.
Costs and benefits of ecosystem services to various stakeholders should be weighed appropriated for calculation.
NPV may include costs for some goods but for services, NPV should actually be called PV.
Marginal values may be considered in estimation NPV. It would also be great if uncertainty in valuation can be quantified.
With regards to discount rate, a declining discount rate may be used. A hyperbolic declining discount rate may be used starting with 4% which declines gradually to 2% by the end of calculation period.
For carbon sequestration services, estimate only for the additional carbon.
Pricing of carbon is an important aspect in current situation when the prices are very low.
Impact of diversion on adjacent areas should be studied through some case studies. Different kind of projects (e.g. mining, hydro, cement, thermal, etc may be considered). Based on these findings, some estimate (say 20%) may be developed as an additional premium on NPV.
For projects that have permanent change in land use, 3 times NPV should be charged.
Forest land is not eligible for 0% discount rate as it produces renewable resources with some exceptions such as biodiversity loss. Only those stock which produce exhaustible resources may be eligible for 0% discount rate.
Right regime on the forest area diverted also needs greater attention.
Revision of rates of NPV applicable for different class/category of forests
XXX
NPV value should be such that it acts as a deterrent in using easily available forest land. It will encourage projects to be based on other types of land as much as possible.
An annual correction factor should be included in NPV calculation according to which the value revised is automatically updated every year. This would not mean that it will not require further revision.
TOR 2 – Exemptions from NPV payment
Profit making organizations should not be given any exemptions. Non-profit making organizations may be given some exemptions. Criteria: Sec 25 of Companies Act.
The land taken for CA should actually be linked to density class rather than type of land for doing CA. For e.g. if it is very dense forest, the area to be afforested should be 3 times the area diverted. For MDF, it should be 2 times and should be equal for OF and LTF.
The mechanism should encourage land improvement through some form of financial incentives.
With regards to defence, although ecologically that may be good, it hinders access and thus has a social cost. So at least that component should be collected in the form of NPV.
Projects for temporary diversion need careful consideration because the land often never comes back. Reclamation is mostly agreed but never happens.
Monitoring mechanism needs to be strengthened to ensure agreements are complied with.
For some projects, it is a requirement that 30% of diversion area should be kept under plantation (e.g. greenbelt). This is over and above the CA. This should be considered for refund while paying NPV.
If land is returned before the expiry of lease period, it expedites the process of eco-restoration and hence a fraction of NPV should be returned as an incentive.
TOR 3 – Validity of NPV
Can be based on the soil expectation value
It should be charged for the complete project life.
It should be charged again after 20 years.
The land rent should be collected at the district level.
If rotation period < life of the project, charge NPV for the complete rotation period. Else charge it for the complete life of the project.
Other issues
How to deal with shifting cultivation.
Give GPS coordinates to FSI and you will be able to get the Forest Type Group and Density Class.
NPV payments may be allowed in some cases to be collected through deferred payments. Scale and NPV payment as % of total project cost may be used to make eligible projects for deferred payments. For e.g. in H. P. CAT Plans are charged in instalments.
Revision of rates of NPV applicable for different class/category of forests
XXXI
It should be monitored that CAMPA fund is used mainly for restoration purposes.
Cumulative impact of projects in a region should be reflected in NPV.
NPV is not charged during renewal if the project proponent is the same. However, if the project proponent changes, NPV is charged again. This needs a relook.
Land rent is charged twice. Some states also collect the land rent. This needs to be clarified.
NPV for everything should be collected and then refunded back according to the situation. A deposit-refund mechanism will take care of the worst possible scenario along with encouraging handing back of land. This has been successfully used in EU for pollution control.
For mining, renewal is now to be applied even for unbroken areas. These should not be charged for NPV.
Revision of rates of NPV applicable for different class/category of forests
XXXII
Appendix 32 – Survey instrument (Form A) used for provider agency
Net Present Value (NPV) of forests for diversion to non-forestry purposes
Q1. Are you aware of NPV charged for diversion of forests to non-forestry purpose? *
Q2. Do you currently deal or in recent past have dealt with issue of NPV of forests for diversion to non-forestry purpose? *
Estimation of NPV This section deals with the value of NPV as is currently estimated and related issues. Q3. What is your take on the value of NPV as is currently estimated? *
Based on the forest type and forest cover density classes, the value varies from INR 4,38,000 to 10,43,000 per ha of forest diverted.
Q4. According to you which of the following issues currently not addressed by NPV needs to be urgently incorporated in its calculation? *
Change of extent in land-use by the proposed non-forest activity
Dependency of local communities on forest area diverted
Site quality of area in terms of its biodiversity
Issues of threatened or endangered species
Critical wildlife corridors and breeding habitats
Trees outside forests (TOF)
Differential land rent based on proximity to urban area
Fragmentation of forest area at a landscape level
Others
Q5. Kindly provide any other views related to estimation of NPV which you feel are important to consider.
Revision of rates of NPV applicable for different class/category of forests
XXXIV
Q8. Kindly provide your views on no exemptions given to following type of projects on NPV *
Strongly disagree
Disagree Neutral Agree Strongly
agree
Mining (other than underground)
Regularization of encroachments other than pre 1980
Thermal power projects
Temples, religious centres and associated infrastructures
State and national highways
Salt manufacture (if converted from mangroves post 30.10.2002)
Defence production units
Steel, cement and chemical industries
Special export zone projects
Q9. According to you, what has been the impact of exemptions on forest in terms of conservation? *
1 2 3 4 5
Highly negative
Highly positive
Q10. According to you, what has been the impact of exemptions on local communities in terms of their dependency on forests? *
1 2 3 4 5
Highly negative
Highly positive
Q11. According to you, what has been the impact of exemptions on user agencies in terms of getting projects approved? *
1 2 3 4 5
Highly negative
Highly positive
Q12. Kindly provide references to any situation where exemptions from NPV have had a positive or negative impact on forests, local communities or user agencies.
Other related issues Q12. Kindly provide your views on the validity of NPV. *
It is currently charged for 20 years. If you differ, kindly suggest a suitable time period in "Other"
Revision of rates of NPV applicable for different class/category of forests
XXXV
Q13. Kindly provide your views on the collection mechanism of NPV value. *
Kindly do not hesitate to suggest any other collection mechanism in "Other"
Q14. According to you, what are the difficulties faced by Forest Department in estimation and collection of NPV for forests.
Q15. Would you suggest a separate agency for estimation, verification and monitoring of NPV? *
Q16. Do you agree with the current mechanism of collection of NPV in a central fund (CAMPA) at the national level and then its redistribution at the state level? *
Q17. What according to you are strengths or limitations of collection of NPV at a central level?
Q18. Would you like your answers to be recorded as anonymous? *
Name *
Designation *
Organization *
Email *
Q19. If required, would you like to be contacted for a further discussion on issues? *
Q20. Would you be willing to attend our national level consultation workshop in New Delhi on 18 March 2013? *
If you would be unable to attend but can recommend any other official to represent your organization views, kindly provide their details in "Others"
Revision of rates of NPV applicable for different class/category of forests
XXXVII
Q10. Kindly select options from below which you feel should be incorporated in calculation of NPV? *
NPV should be charged in instalments apart from one lump sum amount at the beginning.
There should be project-specific NPV estimation based on its impact on forests.
Positive externalities of a project should be incorporated in NPV calculation.
If land is handed back to forest deparment before expiry of lease, a part of NPV collected should be
refunded back.
Local activities undertaken through CAMPA in which NPV amount is collected should involve user agencies.
The land for compensatory afforestation should be decided and finalized by the state forest department.
Projects that lead to permanent land-use change should be charged more than those cause temporary
land-use change.
NPV charged should be linked with the productivity of land diverted and expected profits.
Others
Q11. Kindly provide your views on the criteria for partial or full exemption from NPV for activities undertaken by your organization/company, if any. *
Kindly also provide your suggestions on additional criteria you would like to recommend for your project category.
Name *
Designation *
Organization *
Email *
Q12. If required, would you like to be contacted for a further discussion on issues? *
Q13. Would you be willing to attend our national level consultation workshop in New Delhi on 18 March 2013? *
If you would be unable to attend but can recommend any other official to represent your organization views, kindly provide their details in "Others"
Revision of rates of NPV applicable for different class/category of forests
XXXVIII
Appendix 34 – Survey Instrument (Form C) used for local communities
Net Present Value (NPV) of forests for diversion to non-forestry purposes
Date: ___________________
Q1. Are you aware of NPV charged for diversion of forests to non-forestry purpose? *
Q2. Was your/Gramsabha’s approval taken for diversion of forests on which you depended upon? *
Q3. According to you which of these benefits that you earlier received from forests have been lost as a result of diversion? *
Timber for household building, furniture and agriculture equipments
Fuel wood for basic energy supply
Fodder for livestock
Non-timber forest produce
Others
Q4. Is Gramsabha consulted on how money used from CAMPA is utilized for activities supposed to compensate for the loss of forests diverted that you depended upon? *
Q5. According to you, what has been the impact of NPV collection on forest in terms of conservation? *
1 2 3 4 5
Highly negative
Highly positive
Q6. According to you, what has been the impact of NPV collection on local communities in terms of their dependency on forests? *
1 2 3 4 5
Highly negative
Highly positive
Q7. According to you, what has been the impact of NPV collection on user agencies in terms of getting projects approved? *
A. K. Sarkar Executive Director (Planning) NHPC Ltd.
Dr. R. M. Misra, IFS Chief Forest Officer NTPC Ltd
Appendix 36 – Excerpts of views from few user agencies and experts
Organization Views in relation to NPV estimation and collection NHPC In NHPC’s view NPV is grossly overestimated in view of several additional payments and
double payments are being made to forest departments.Even after making payment of NPV rates, following additional compensations/ costs/ expenses are paid/ made to concerned Forest Departments by the Corporation in lieu of diversion of forest land: a. Cost of trees, poles, etc. standing within the required forest area/ land. b. Cost of any other structure of Forest Department. c. Cost of Compensatory Afforestation is paid for raising plantation over double the degraded area in lieu of diverted forest land. This includes cost of plantation, cost of soil treatment works as well as cost of infrastructure for implementation of Compensatory Afforestation. d. In addition to above, the cost of Catchment Area Treatment Plan is also being released in favour of Forest Departments which is required to be prepared and submitted alongwith the forest proposal. Under CAT plan major work carried out is afforestation, hence it should also be credited against NPV. e. Moreover, certain State Govts. are also demanding lease rent for the diverted forest land.
61 5 respondents wanted their response to be recorded as anonymous and hence are not included in the list.
Revision of rates of NPV applicable for different class/category of forests
XL
Organization Views in relation to NPV estimation and collection f. In majority of hydro projects, areas diverted for non forest use are mostly river bed, flood zone, rocky surface, etc. which are mostly devoid of any vegetation. As such there are no goods and services being provided by these areas completely devoid of vegetation, but NPV is charged for these areas also. g. NPV is paid for forest land diverted for underground structures with high cover, although the forest on surface is not getting affected at all. h. The State Govts. demand for Rights and Privileges (R&P) for forest land / community forest diverted for projects, over and above NPV payment. i. In some States areas are designated as forest land, but on the same areas tribal population is living and practicing ‘jhum’ cultivation. NPV as well as compensation towards R&P is demanded for these areas. j. In some cases, additional payments are required to be paid to State Govts. For carrying out forestry/ wildlife activities (eg. In case of Subansiri Lower HE Project 0.5% of the hard cost of Project is demanded for wildlife related activities). k. In addition, payment towards biodiversity management plan is done at projects. All such additional charges, in general, amount to double counting / taxation and may be avoided under principles of public finance. In view of this, these additional payments alongwith NPV should not be demanded. It is proposed to rationalize the issue and bring above separate items (which are applicable for most of the States) under the umbrella of NPV, with clear indication that no separate payment is required for above mentioned activities. The NPV payment rates are to be increased suitably to cover above items.
Suzlon Energy Ltd. Wind power projects, developed on diverted forest land, use forest land in a very sustainable way, without harming the natural landscape of the area. We develop wind farms on forest land based on real time land footprint. Any excess land is returned to the forest department on completion of the project. Compared to mining and other intrusive activities, our contribution to environment conservation is long lasting, as we produce green energy, avoiding greenhouse gas emissions. Request to consider giving Special Status to Wind Power Projects for forest land diversion applications. Request to consider that CA land should not be linked to density class as land is a scarce natural resource. Moreover, the principle of providing CA land states that equivalent non-forest land is to be provided by the user agency in lieu of the diverted forest area. Tree density is given consideration in the existing Eco class value. Alternatively, if one studies the compensatory afforestation scheme proposed in the FC Act proposals, it will be seen that the cost per hectare (Ha) is much higher that the plantation scheme taken by the forest department. At times it is three times costlier than the scheme of the forest department. Hence, in effect, the project proponents are actually paying three times the normal cost of plantation. It has been also noted that high wind zones, sometimes falling in notified forest area, do not have any vegetation except some bushes. Also, there is no displacement and no issue of rehabilitation in WPP’s in forest land, unlike other infrastructure projects. Request, for special status for wind power projects.
M. M. Joshi, CCF Haryana Forest Department
(1) Special characteristics of Aravallis to be considered in computing NPV A significant portion of Aravallis in Haryana falls in urban areas and these built up areas are slowly expanding at a steady pace. Aravallis being the only forested patch in these urban areas , the value of ecological services extended by these forests is very high .These hills have become prime target of real estate activity surrounding Delhi, Faridabad and Gurgaon for making windfall gains and are most sought after for diversion of forest area for non-forest activity. The legal status of these areas, which are covered under section4 and 5 of Punjab land preservation act,1900 is “ Forest” as per order of Hon’ble Supreme Court of India irrespective of ownership. The strategy employed in computing NPV in the DrKanchan Chopra committee was eco-value class based, giving thrust on the density ,quality and species composition of forests. Such an analysis can give an underestimated value for the NPV calculated for these dry tropical thorn forests which is having less species diversity. Thus Aravallis and
Revision of rates of NPV applicable for different class/category of forests
XLI
Organization Views in relation to NPV estimation and collection itsecological services should be viewed in Urban context as a special case. (2) Nature of change of land use involved in Diversion case is to be accounted while calculating NPV. The proximity to NCR and associated pressure for colonization and real estate development is a persistent problem in these hills which need to be discouraged to ensure that these hills remain intact for providing ecological services such as fresh air, greenery, hydrological regime and bio diversity to the high population density areas of national capital and NCR and also for posterity. Diversion involving colonisation /construction/commercial/residential/industrial/recreational/institutional which is a permanent land use change for meeting private interest should not be allowed except for public purpose for minimum possible area. Even in such situation, prevailing rent in the locality should also be included in addition to NPV. Thus to discourage such a trend the NPV calculation in the diversion cases involving forests in Aravalli hills should be made flexible to include the land value(as per the circle rates) in addition to the the NPV fixed for such forest. This will deter the diversion of forest lands in Aravalli hills for colonization and such other projects taken up in private interests. The inclusion of the land rent can be done away with for public utility projects. Based on the spirit of rulings of the Hon’ble supreme Court and facts regarding the Aravalli Ranges the following need to be considered regarding NPV of Aravalli hills in general and Aravallies of NCR region being in High population density zone and most sought after by real estate developers and mining agencies for making windfall gains. That the amount of water recharged as per the conservative estimates of 35% percolation rate is ₹ 2 crore a year per hectare which cannot be substantiated by any kind of NPV levied. As of now it is responsibility of the State to enact rules as per provisions in Article 48A of the Indian constitution which protect the environment and thereby protect the water regime maintained by the Arravali hills in the NCR for future generations to be read with Article 14 of Indian constitution. It also has to be considered that the areas with slow growing species have to have higher value of NPV. The natural forest cover in xeric region is very slow growing and difficult to replenish.
Sharad Lele Senior Fellow, ATREE
NPV cannot be calculated without context: The whole idea that the Supreme Court or CEC or some committee can a priori determine the economic NPV of an area of forest that is to be converted to non-forest is incorrect. Ecosystem value does not exist independent of the social, technological and economic context, and this context changes from site to site. Remote sensing only gives us (in an approximate manner) the floristic type and canopy cover of the forest. It doesnot tell us who is using the forest, to what extent, for what.“Economic impact analysis” has to be an integral of the process of the process of applying for forest clearance under FCA. Invaluable cannot be valued Economic analysis has many limitations. One of them is that certain goods or benefits are invaluable and simply cannot be monetized. Flagship species such as tigers are one such value. Religious or sacred value is another. The decision whether or not to convert a forest which is sacred or has flagship species must be left to the FAC or some other such process that has the mandate to weigh non-economic values. It is highly inadvisable to bring it into the economic calculation. Double-counting must be avoided, trade-offs must be made explicit The Chopra committee explicitly addressed the question of trade-offs (see Tables 12-13 in their report). The CEC erred grievously by ignoring this aspect of their report. They (like many other NPV studies) take the value of one benefit (say timber) and add it to the value of another benefit (carbon sequestration). This is incorrect. Recommendation: The entire goal of the process has to change from estimating NPV to estimating change in
Revision of rates of NPV applicable for different class/category of forests
XLII
Organization Views in relation to NPV estimation and collection economic flows to different stakeholders due to conversion. Ecological models that explicitly incorporate such dynamics and trade-offs, when coupled to site-specific data collection will address this problem. Economic compensation must be distributed proportionately to users and rights-holders The Chopra committee made a major recommendation that NPV amount, when paid, must be distributed between local, state and central funds. The rationale was that economic compensation must be paid to those who actually lose out from the conversion of the forest. So not only must part of the funds be released to local users, but in fact the quantum of funds they get must be proportionate to their rights, not just level of use and the rights must be factored into the process.
Federation of Indian Mining Industries
Social discount rate instead of 4% should be 10% as prevalent for developing countries like India. The value of the flagship species in respect of forest area outside the National Park and Wildlife Sanctuary were taken as a very significant part of the NPV earlier. It is submitted that such species occur only in a very limited geographical area and should be restricted to those areas rather than making them applicable for the entire country. The NPV rates should be revised every 5 years, on the basis of forest cover assessment done by the FSI and the change in the wholesale price index. Identification of land for compensatory afforestation has become the biggest stumbling block and reason for delays in forest clearances. We submit that provision for compensatory afforestation should be done away with. The user agency should be incentivized and encouraged to undertake adequate reclamation and return the land early to the forest department. In mining areas, in most of the cases, the actual breaking (tree felling) happens gradually over the life of the mine. It is thus requested that the collection of NPV should be done in instalments as per the requirements of the tree felling. Period of NPV estimation should be 20 years or life of mine, whichever is less.
Mr. Harish Salve, CEC Judicial Bench Member
The NPV amount collected should be channelized to finance activities such as construction and establishment of tribal centres and organizing vocational trainings to compensate for job loss associated with forest diversion.
Dr. Rekha Pai, IGF(EAP), MoEFCC
North-Eastern states to be looked in a different perspective and through a different lens as they are different geographically and constitutionally (as FCA is not applicable in some such states and they have been given special status under article 371. Economic opportunities are different and they have greater dependence on forests.Further forests near waterholes and foothills have to be looked differently
Mr. Nitin Sethi, The Times of India
Project activities such as those that lead to permanent change in land-use (permanent forest diversion) should be charged for land value in addition to the NPV. This may be viewed in the context of the proposed Land Acquisition Bill.
Shyam Divan, CEC Judicial Bench
To further institutionalize the system of collection and distribution of NPV amount and to bring transparency into the system, a citizen charter may be placed at District Collector’s office showing how NPV fund is being utilized in various developmental activities in the particular district.
Mr. N. C.Saxena, Member,National Advisory Council
Rather than going about doing compensatory afforestation in an ad-hoc manner, it may be useful to target compensatory afforestation on scrub land and open forest to improve the quality of degraded forests in the country.
National Tiger Conservation Authority
The areas in the periphery of protected areas are equally important for conservation of forests and wildlife as they serve as corridors for movement of wildlife. In the light of this, buffer areas around National Parks and Wildlife Sanctuaries should not be looked as any other forest area. These have special significance for conservation of wildlife with their significance increasing with their vicinity to the protected areas.
Hon’ble Justice P. Jyothimani,
Suggested that compensating affected parties as a result of forest diversion is an important aspect of environmental justice.
Revision of rates of NPV applicable for different class/category of forests
XLIII
Organization Views in relation to NPV estimation and collection Judicial Member, National Green Tribunal, Bhopal Bench Shri Rajesh Gopal, Addl. DGF (Project Tiger), National Tiger Conservation Authority
Areas in the vicinity of National Parks and Wildlife Sanctuaries are very important for ensuring flow of forest goods and services, reducing disturbance to movement of wildlife and biodiversity and minimizing defragmentation of forest landscapes near protected areas thereby disturbing wildlife corridors.
Dr. G. A. Kinhal, APCCF, MPMFP Federation
Suggested a more appropriate term “Possession Value”with regards to charging for using the space value of forest land.
High real estate rates in urban and peri-urban areas are very high compared to the NPV and hence an additional component may be added to charge fro using the space value of this forest land.
Revision of rates of NPV applicable for different class/category of forests
XLIV
Appendix 38 - Market-based instruments for incentiving communities for conservation of forest resources (Ekpe 2012)
Group of instruments Examples
Market-based Markets for carbon sequestration, markets for watershed services, biodiversity offsets and mitigation, conservation banking, markets for recreation
Non-market-based Global environment facility, debt-for-nature swaps, conservation trust funds or environmental funds, taxes, compensation to communities for opportunity costs and damages
Property rights innovations
Conservation easements, covenants and deed restrictions, stewardship exchange agreements
Market-oriented institutions
User fees, ecotourism, eco-labelling and certification, mitigation banking, conservation banking, transferable development rights, ecosystem services markets
Financial incentives Compensation programs, insurance, cost-share incentives, land and water rental leases, conservation contracts, debt forgiveness
Public tax incentives Income tax incentives, property tax incentives, estate tax incentives, capital gains tax
Revision of rates of NPV applicable for different class/category of forests
XLV
Appendix 39 - SECTION-WISE COMMENTS AND RESPONSES FOR THE NPV REPORT
SECTION Sr. No.
Comments received Response
1. FOREST CLASSIFICATION – FOREST TYPES
1. Champion and Seth classification was developed in 1960s and since then there is much greater understanding of forest ecology which should have been considered
While acknowledging that the understanding on forest ecology has advanced, Champion and Seth classification still holds good and is capable of embedding and understanding the new knowledge. Data is collected and available largely based on this classification across the country.
2.
Category for other types of forests such as DLC (Odisha), GMJJ (Jharkhand), Orange Forests (Chhattisgarh) which are not forest types as per Champion and Seth should be clarified.
Such areas have legal forest status and have different types of forests within which are already included in Champion & Seth classification.
3. No separate classification is proposed for plantations. This may discourage social forestry and discourage voluntary plantation in long run.
NPV is applicable only on legally designated forests and does not include social forestry. A separate classification for plantations will increase complexity. As plantations are generally carried out with a commercial perspective, the timber values and the associated NPV rates are likely to be higher in plantations than otherwise.
2. FOREST CLASSIFICATION – CANOPY DENSITY CLASSES
4. Category of less than 10% canopy cover should not be included
Inclusion of this category accommodates forest areas where physical and ecological conditions are not conducive for supporting large forest canopy e.g. arid regions of Rajasthan and Gujarat. The rates for this category are less than the associated rates for Open Forests.
3. ROTATION PERIOD / FELLING CYCLE
5. Tree-species based rotation period increases the complexity
These calculations are not to be performed every time. Estimated NPV rates have already internalized the rotation period calculations.
6. The proposal for changing the rotation period from 20 years to 63 years should be rejected since it assumes that the forests are in nascent stage
Natural forests have stands of different age classes and hence are dynamic characterized by regeneration.
7. It is suggested to continue with 20 years as currently used and lower if the life of the mine is less than 20 years
The rotation period relates to the time required by similar vegetation to re-establish the lost ecological and economic benefits due to diversion. It has nothing to do with the period of the project related to forest diversion.
Revision of rates of NPV applicable for different class/category of forests
XLVI
SECTION Sr. No.
Comments received Response
8. In-case a rotation period of 63 years is implemented, the forest lease period should be increased to 99 years
Same as above.
4. STAKEHOLDERS CONSULTED
9. Representation from industry was inadequate and hence the recommendations may be skewed
A large number of representatives from user agencies were invited during the consultation process. The list of people invited from various user agencies can be found in Annexure 1.
5. TIMBER 10.
The rotation period should only be considered for 20 years as the timber is taken away by the forest department. Continuation of rootstock can be considered after 20 years on plantations (compensatory afforestation)
The value of standing timber is not considered at all in NPV calculation. The economic value only relates to potential timber values and revenues foregone.
11. The calculations for potential timber production do not hold good for a mature forests
Discussed above in comment no. 6
6. BAMBOO 12. Gregarious flowering has not been considered A valid concern. The economic value of bamboo is however less than 1% of the NPV rate.
7. FODDER, FUEL WOOD AND NWFP
13. A maximum of 10 years of rotation period should be considered as these can be procured from new stock planted
Calculations for fuel wood and fodder are not based on rotation period but on actual consumption estimates. The estimates of NWFP are based on potential production.
14. VDF, MDF, OF and LTF cannot have an equal value for fuel wood and fodder
The regeneration capacity of forest land is linked to the forest type group.
15. Including fuel wood and timber both leads to double counting
The growing stock for fuel wood and timber differ. Assumptions have been used in estimation of timber to exclude the growing stock for fuel wood & foliage.
16. Several important NWFPs have not been considered Only important NWFPs for which data are available at the required scale have been estimated.
17. All local services such as fuel wood, fodder and NWFP have been underestimated
Valuation has been conducted based on accepted methodologies. There is a trade-off in suggesting values at regional scales for avoiding complexity and having site-specific values.
8. CARBON SEQUESTRATION & STORAGE
18. The market value of carbon is decreasing and going to decrease further
Many studies, including the influential Stern Review of Climate Change have suggested using social cost of carbon as against the market value of carbon.
Revision of rates of NPV applicable for different class/category of forests
XLVII
SECTION Sr. No.
Comments received Response
19. A significant portion of carbon stored in timber is locked in furniture and building materials which is ignored by the study
On account of paucity of data at state or national level, this assumption has been made.
20. The social cost of carbon should be further adjusted on the basis of purchasing power parity
A valid concern that may be incorporated.
9. WATERSHED SERVICES
21. Apart from canopy cover, slope, soil characteristics, and rainfall are important determinants of watershed functions which have been ignored
On account of paucity of data for all the mentioned characteristics for each classification unit, only canopy cover has been used as a proxy.
POLLINATION AND SEED DISPERSAL
22. No scientific data to establish pollination and seed dispersal are affected due to diversion of forests
There are several studies that have demonstrated the link between these services and forests. See Annexure 2 for an indicative list.
10. ECOSYSTEM SERVICES EXCLUDED
23. Economic value of flagship species is important and its value needs to be considered
While wildlife, not only flagship species, have enormous economic value (both instrumental as well as intrinsic), on account of lack of reliable methodologies to capture its value, this has not been considered. The flagship species considered earlier are generally found in PAs for which a premium is already suggested.
24. The religious and cultural values of the forests seem to have been ignored
The study did make an attempt to value such intangible services but on account of lack of reliable methodologies and their site-specificity, their values were not estimated.
25. Relevance of the importance of grassland and complex agricultural production also seem to have been ignored
A valid suggestion. This is included in one of the canopy density classes; however it is acknowledged that their potential values are not realized due to lack of relevant information.
26. Forests as habitats for humans, wildlife and forests as an opportunity for employment seems to be unaccounted for
A valid suggestion. However this could not be included due to lack of relevant information.
27. The eco-tourism benefits from forests have been ignored
Eco-tourism in India is limited primarily to protected areas which do not directly qualify under the ambit of NPV calculations. The report has also suggested premium for protected areas where most of the eco-tourism benefits are currently accrued.
Revision of rates of NPV applicable for different class/category of forests
XLVIII
SECTION Sr. No.
Comments received Response
11. ASSUMPTIONS FOR AVOIDING DOUBLE COUNTING
28. It prima facie appears to be subjective and the assumptions considered are not clearly listed
This has been largely borrowed from 2006 NPV Expert Committee report and minor modifications have been made based on suggestions received during the consultation process.
12. DISCOUNT RATE 29. In place of 4%, the discount rate used should be higher, ideally in the range of 8-10% which is more practical
Based on the principle of welfare economics, the social rate of discount of 4% as suggested 2006 NPV Expert Committee, and further approved by the Hon’ble Supreme Court (SC) has been retained.
13. PREMIUM ON HILL TALUKAS, FORESTED WETLANDS
30. We do not agree with any premium on such areas as they will have automatically been built in to the various factors constituting the NPV estimation
These add-on factors are not automatically built in. The rates suggested in the matrix consider general conditions and the add-on factors attempt to internalize specific local factors.
14. PROTECTED AREAS, WILDLIFE SANCTUARIES AND ESZ
31. The premium suggested for NPs, WLS and ESZs is unreasonably high and do not have substantial merits
10 times and 5 times for NPs and WLS is according to the Hon’ble SC judgment. Along the continuum, it is suggested that 5 times and 3 times the NPV rate should be charged for ESZs in PAs and WLS respectively.
32.
It will be an unnecessary burden for those developers whose projects fall within 10 kilometre radius of the PA but outside the proposed eco-sensitive zone which is under consideration. The user agency will have to make NPV payment at the enhanced rate if it cannot wait for the notification of the eco-sensitive zone
A valid concern. In such cases, a rider may be inserted to address this concern.
15. EXEMPTIONS
33. As in the case of underground optical fibres, underground transmission lines should be fully exempted from paying NPV
A valid concern. However, during the consultation workshop it was brought out that unfair advantage was being taken by some agencies in this aspect and a rider may thus be inserted for such cases.
34.
For Wind Energy Projects, the proposed change in exemption from 50% of applicable NPV rate as against the current 50% of minimum NPV rate irrespective of forest type should be rejected
More detailed matrix has been proposed for making the NPV rates reflective of losses according to local conditions. Thus, the exemption should be based on applicable NPV rates and not minimum rates.
35. The suggested tree felling limit of 5 trees should be increased to 5000 trees for availing 50% exemption for wind energy projects
For the consideration of MoEFCC. This has been suggested based on consultation with various officials of the forest department.
Revision of rates of NPV applicable for different class/category of forests
XLIX
SECTION Sr. No.
Comments received Response
36.
For underground mining, the proposed change from 50% to 20% exemption for underground mining should be rejected (3). On the contrary, the exemption should be increased to 75%
This has been suggested based on concerns over damages to underground aquifers and hydrological regime by such projects. Some exemption may still be provided as an incentive.
37. For underground tunnelling, the proposed change from 50% to 20% exemption should be rejected
38.
For open cast mining, 20% exemptions should be given as mining is possibly the only industry wherein diverted forests can be reclaimed and biodiversity and ecosystems regenerated unlike other sectors
The record of effective mine reclamation in the country is poor to say the least. Rather than providing a blanket exemption, a mechanism that incentivizes positive actions by a user-agency on case-by-case basis may be implemented.
39. A 50% exemption should be considered for low-value industrial and fertilizer mining
For the consideration of MoEFCC.
40. For hydropower projects, it needs to be clarified that what would be the basis of calculation of NPV for areas such as river beds which are devoid of any forest cover
These are legally defined forest area. Impacts of diversion of river beds are often much greater.
16. POSSESSION VALUE OF LAND
41. Should only be charged for projects that permanently divert the land-use
A charge should be levied for exclusively possessing the resource (asset) for a particular period of time and deriving value out of it.
43. Noteworthy that rental value of land has been considered for urban areas. This charge should also be considered in the rural contexts
It was envisaged that for rural areas the NPV rates would be high enough and possession value would not contribute very significantly to the final charge.
17. DISTRIBUTION OF NPV ON SPATIAL SCALE
44.
The largest chunk of benefits considered is what local communities use but the utilization pattern of the funds show that the NPV money is mostly used at state/national level and local stakeholder are deprived of their share
The study has already suggested that institutions need to be urgently put in place to compensate local losses. The study has also suggested that 50% of the NPV amount should be earmarked for compensating losses at the local level.
18. FREQUENCY OF REVISION OF NPV RATES
45. Should not be updated every 3 years. A longer time frame should be used
To accommodate evolving and improved methodologies as well as rich datasets being generated to capture benefits from forests, NPV rates should be updated every 3 years as suggested by the Hon’ble SC.
Revision of rates of NPV applicable for different class/category of forests
L
SECTION Sr. No.
Comments received Response
46. The NPV rates should be revised according to an economic index and new methodology should not be used to estimate the rates
WPI / CPI reflect commodities which are marketed but a large number of forest ecosystem services are actually never traded in the market. Hence revision of NPV rates in this manner is not recommended.
19. MISCELLANEOUS 47. The study is focused on monetizing forest resources
NPV charge is levied only once the forest clearance is given to a proposal after careful analysis of costs and benefits from forest diversion. The focus of the study has been to estimate the economic value for compensating those affected.
48. It takes millions of years for formation of minerals deposits, but forests can be rejuvenated within 10 to 15 years
As suggested by the Hon’ble SC, natural forests can never be replaced by plantations.
49. NPV rates should be correlated with the taxes and cess on the mineral sector in different states and by various agencies
Taxes & cess are unrelated to NPV.
50. Positive externalities from the project should be included in NPV calculations
A valid concern already suggested in the report for future consideration.
51. The impact of increased NPV rates on unemployment should also be considered as many projects may become unviable
For the consideration of MoEFCC.
52. Deferred payments should be considered for mining projects
Already suggested in the report for future consideration. However, feasibility as well as proper checks-and-balanced will need to be worked out.
53.
The role of a particular forest in a particular ecosystem cannot be restored by creating forests in some other location. The experience of CA across the country also needs to be taken into account. So can’t realistically expect CA to provide comparable benefits to natural forests.
It is agreed that compensatory afforestation can never provided benefits comparable to a natural forest. However, for estimation of Net Present Value of future benefits, a time period had to be assumed and this was done through rotation period of dominant species in each forest type group.
54. Enhanced NPV rates will be detrimental to young states trying to match other parts of the country towards development
Revision of rates of NPV applicable for different class/category of forests
LI
SECTION Sr. No.
Comments received Response
55. Only a portion of money collected from NPV is currently utilized and hence there is no justification for increasing the NPV rates
Absence of proper institutions, delay in execution of CAMPA and checks-and-balances have limited higher amounts of collected NPV to be used. Mechanisms and institutions are currently in development which will enable appropriate utilization of NPV funds for which they are charged for.
56.
There are several other charges apart from NPV such as safety zone charges, catchment area treatments, etc. All these charges should be clubbed under one charge and a single clearance window system should be adopted
Not all charges are applicable to all diversion projects. Based on project activity, forest area to be diverted and its characteristic, only applicable charges are levied. Thus useful as this suggestion may be, it is difficult to be implemented due to practical reasons. However, more clarity may be provided to user-agencies on specific charges.
Based on the comments received from the following:
1. Society for Promotion of Wastelands Development. 2. Federation of Indian Mineral Industries (FIMI). 3. Goa Mineral Ore Exporters Association. 4. Panduronga Timber Industries. 5. Suzlon Energy Limited. 6. Indian Wind Energy Association. 7. ACC Limited. 8. Ministry of Coal. 9. National Hydroelectric Power Corporation (NHPC). 10. Wind World.
11. NMDC Limited. 12. Indian Wind Turbine Manufacturers Association (IWTMA). 13. Wolkem India Limited. 14. Udaipur Chamber of Commerce & Industry. 15. Apex Mintech Consultants. 16. SuveeraPc Associates. 17. Gudli Chamber of Commerce & Industry (Sans.). 18. Office of the Principal Chief Conservator of Forests (Mizoram). 19. GODAWARI (Power & Ispat Limited).
Dr. Madhu Verma is a Biological Science graduate with Masters, M.Phil &Ph.D in Economics and works as a Professor of Environment & Developmental Economics and Coordinator for the Centre for Ecological Services Management, Indian Institute of Forest Management, Bhopal. She has been a Visiting Professor at the University of Massachusetts, Amherst and a Visiting Scholar at the University of California, Berkeley, USA (2001) for her Post Doctoral research work. She is a Lead International Fellow(2007) and a Fulbright Fellow (2012). She does action and policy research in the areas of valuation & environmental modelling of forest, wetland and agriculture ecosystems and biodiversity; green accounting; PES, livelihoods economics; conservation finance. In her career of 30 years she has worked with various Ministries and Commissions of Govt. of India and several national and international funding and research organisations.She has large number ofpublications to her credit and her many research recommendations have been internalised in the decision making process of the government and creation of conservation instruments.
With Post-Graduate Diploma in Forestry Management and Erasmus Mundus Master's in Environmental Science, Policy and Management from three universities across Europe, Dhaval Negandhi possesses a multi-disciplinary and macro-level understanding of environmental concerns. His research interests, publications and areas of expertise include valuation of ecosystem services (especially those from forest, wetland and agriculture ecosystems), spatial analysis, climate change, carbon accounting and statistical analysis.
With M.Sc. (Mathematics) and Post Graduate Diploma in Remote Sensing Application (ITC Netherlands), Shri. A. K. Wahal joined the Indian Forest Service in 1978. Since then he has served at many high-level positions in various forest departments including Head of State Forest Department of A&N Islands, Goa and Union Territories of Dadra Nagar Haveli and Daman & Diu. He has also worked as DDG at ICFRE and Additional Director at IGNFA. Shri Wahal currently heads the Forest Survey of India as the Director General, the premier institution of country mandated with the responsibility of forest resource assessment. His areas of interest and expertise include general forestry, wildlife conservation, remote sensing applications in forestry, participatory forest management and policy issues in forestry.
With M.Sc. (Statistics) from Allahabad University, Shri Rajesh Kumar joined the Indian Statistical Service in 1986. Since then, he has worked in various capacities at premier institutions for forest management in India including Forest Research Institute, Indian Council of Forestry Research and Education, NSSO and CSO. Shri Rajesh Kumar currently serves as the Senior Deputy Director (Forest Inventory) at the Forest Survey of India and is an expert in the area of forests and Tree Outside Forests (TOF) Inventory and Forest Statistics.
Dr. G.A. Kinhal, a 1980 batch Madhya Pradesh cadre IFS officer, has approximately 33 years work experience in managing forests of the country. After obtaining Post Graduate Degree in Agricultural Science with the specialization in Plant Breeding and Genetics, Dr. Kinhal received AIFC degree in Forestry, obtained Master of Professional Studies degree in Natural Resource Policy Analysis and Management from the State University of Environment and Forestry, Syracuse University, USA. He is a Ph.D. holder in Joint Forest Management with special reference to Participatory decision making and management with respect to medicinal plants and NTFP. Dr. Kinhal has spent substantial part of his career working with national and international organizations in the area of Natural Resource Management. He has published several papers and case studies related to bio fertilizers, rehabilitation of degraded forests, sustainable NTFP management, conservation of medicinal plants and biodiversity, human resource management in forestry sector at national and international journals. His article on 'Technical and financial evaluation of Green Equities' published in Indian Forester 1996 was awarded the Brandis Memorial Prize. The edited book on 'Adaptive Management of Medicinal Plants - NTFPs strategies, implications and policy for sustainable harvesting' is his well received academic contribution in this sector.
Dr. Anmol Kumar is an IFS Officer of 1982 batch from Maharashtra Cadre. Presently, he is working as Director General, Forest Survey of India, Dehradun. While working as Dy. Inspector General of Forests, he has been deeply involved with Wildlife Institute of India, Ministry of Environment & Forests, Govt. of India; Wildlife Action Plan and its Implementation; Wildlife (Protection) Act – Application and amendments; Management of natural resources in Protected Areas; National Board for Wildlife and Standing Committee of National Board for Wildlife; Critical examination of different proposals recd for the consideration of the Standing Committee of the National Board for Wildlife; International Co-operation and International Conventions – Convention on Migratory Species, (International) Convention on Heritage, International Union for Conservation of Nature, International Whaling Commission; Wildlife Institute of India, Central Zoo Authority and National Zoological Park at New Delhi; Eco-tourism and others. In addition to PhD in Botany from Meerut University, he successfully completed Post Graduation in Rural Social Development from the University of Reading, UK and advance professional programme in Public Administration from IIPA, New Delhi. He has published more than 20 research papers and articles in various journals and seminars.
Gopal K Kadekodi is currently an Honorary Professor, and earlier a Research Professor for five years at the Centre for Multi-Disciplinary Development Research, Dharwad. He was formerly the Director of the Institute for Social and Economic Change, Bangalore and a Professor at the Institute of Economic Growth, New Delhi for twenty five years, a Visiting Professor at Erasmus University, Rotterdam, and Technical University, Twente in the Netherlands. He holds Ph.D. in Economics `from Univeresity of South California, Los Angeles, USA and his areas of research include Common Property Resources, Energy. Ecology, Environment, and Economic Development. In the past, he was the President of the Indian Society for Ecological Economics, a Woodrow Wilson Fellow and a Fulbright Fellow, Member of NTCA and currently on several Boards and Commissions. He authored 14 books and more than 100 articles in national and international journals.
R. B. Lal holds Master’s degree in Physics and Forestry, Ph.D. in Forestry. He is a retired Indian Forest Service (IFS) officer of 1975 batch of Manipur/ Tripura cadre and has worked in various capacities under the State Government of Manipur and Government of India. Some of the important assignments he has held include Member of Faculty at Indira Gandhi National Forest Academy, Chief Conservator of Forest, Manipur, Special Secretary (Forest & Environment), Govt. of Manipur, Chief Wildlife Warden, Manipur, Director, Tropical Forest Research Institute, Dy. Director General, Indian Council of Forestry Research& Education, Inspector General of Forest, Ministry of Environment &Forest, Government of India and Director, Indian Institute of Forest Management. He had been national focal point to various international conventions. He had worked extensively on valuation of eco system services, forest conservation and wildlife management. He has about 50 research/technical papers including 2 books to his credit. Presently, he is a member in the Board of Governors of Indian Institute of Forest Management.
Arun K. Bansal is a Gold Medallist at post graduation in Physics (1974) and at graduation (1972, with 3 gold medals in Physics, Mathematics, and overall) from Rajasthan. He took an M.Sc. in Forestry / Remote Sensing in 1988 from the University of British Columbia, Canada as a Canadian Commonwealth scholar. Shri Bansal joined the Indian Forest Service in 1975 and was allotted to Odisha Cadre. He served in various posts in the rank of ACF, Dy CF, CCF, Addl. PCCF and PCCF in the State. He worked as Addl. Director General of Forests in the Ministry of Environment and Forests from January 2011 until his superannuation from government service in November 2012 and was associated with all aspects of conservation of forests, and development of forest sector in the country including evolution of forest policy and legal framework, and international collaborations. He has 70 scientific /research paper papers to his credit and has presented a number of papers at various conferences, seminars and workshops. Shri Bansal received the prestigious Brandis Prize in the field of Silviculture for the year 2004 for the paper entitled “Indian Timber Imports – an Analysis” published in Indian Forester.
Sanjay Upadhyay is the founder and managing partner of the India’s first environmental law firm, Enviro Legal Defence Firm. He also established the charitable arm of the Law firm through the Environment Law and Development Foundation. Sanjay has been practicing environment and development law since 1993. An India Visiting Fellow at the Boalt Hall School of Law, University of California, Berkeley (Fall 1996) and a legal intern to the Earth Justice Legal Defense Fund, San Francisco, he started his professional career at the World Wide Fund for Nature– India at the Centre for Environmental Law. Sanjay has served as an environmental and development law expert to most well known International, Multilateral, national and state Institutions including World Bank, IUCN, FAO of United Nations, UNDP, AFD, DFID, ILO, SDC, IC, IIED, ODI, WWF, Green Peace, HBF, TERI, WINROCK, MOEFCC, MOPR, MOTA, MNRE, IIFM, ICFRE, IEG, WII, IIPA, NIRD, University of Cambridge, Duke University to name a few. He has been part of Drafting Committees of several forest, wildlife and biodiversity Rules both at the national and state level.