42
Office of Children’s Mental Health 2014 Report to the Wisconsin Legislature Wisconsin Office of Children’s Mental Health 1 W. Wilson Street, Room 656 Madison, Wisconsin 53707 608-266-2771

Office of Children’s Mental Health
2014 Report to the Wisconsin Legislature
Wisconsin Office of Children’s Mental Health
1 W. Wilson Street, Room 656 Madison, Wisconsin 53707
608-266-2771

Wisconsin Office of Children’s Mental Health Annual Report 2014 Page 2
Office of Children’s Mental Health 2014 Report to the Legislature
Dedication: We dedicate this report, as well as all of our work, to Wisconsin’s children and
families. Their positive social and emotional development is what will keep Wisconsin
moving Forward.
Appreciation: One of our central partners in this first year has been the Wisconsin
Department of Health Services. We at the Office of Children’s Mental Health don’t have the
words to adequately express our gratitude to the DHS staff who have provided so much
patience, guidance and assistance. Our future success will be grounded in these first
months of kindness, generosity and hospitality.
Wisconsin Office of Children’s Mental Health Annual Report 2014 Page 3
Table of Contents
Executive Summary ....................................................................................... p.4
Introduction ................................................................................................... p.6
Innovate……………………………………………………………………… p.9
Integrate……………………………………………………………………... p.12
Improve………………………………………………………………………. p.13
Emerging Issues……………………………………………………………… p.32
Next Steps…………………………………………………………………… p.35
Conclusion…………………………………………………………………… p.36
Appendices …………………………………………………………………. p.37
Glossary of Terms……………………………………………………………. p.39

Wisconsin Office of Children’s Mental Health Annual Report 2014 Page 4
Executive Summary
At no time in recent history has there been the breadth and depth of Wisconsin governmental
leadership in the area of mental health as was seen in the 2013-2015 biennial budget. The creation of
the Office of Children’s Mental Health (OCMH) was approved as just one part of this larger
transformative mental health initiative outlined in 2013’s ACT 20.
When Governor Walker learned that children with mental health issues were often lost in
complicated systems, multiple agencies and disjointed services, he wanted a solution. Additional
information showing that children were going un-served or under-served fueled the need for action.
As a result, the OCMH was created to do the following:
Improve children and families’ access to services, with a focus on resources provided by the
Wisconsin Department of Health Services (DHS); the Department of Children and Families
(DCF); the Department of Public Instruction (DPI); and the Department of Corrections (DOC),
as well as other Wisconsin organizations;
Facilitate communication with all child- and family-serving state agencies, coordinate
initiatives, and monitor program performance focused on children’s mental health;
Support administrative efficiencies to reduce duplication among child- and family-serving
state agencies.
To acknowledge the urgency of our charge, OCMH established three action-based categories to
structure the OCMH work: Innovate, Integrate and Improve.
The OCMH’s commitment to innovation takes shape with activities focused on (1) meaningful family
involvement in systems’ change, (2) our perspective on children’s mental health, (3) our adoption of
a public health approach, and (4) our focus on system collaboration.
Our integration activities are grounded in Collective Impact, a change process designed to promote
collaboration and coordination of child- and family-focused activities. The OCMH’s service landscape
will help stakeholders understand the shape and scope of the current child-serving system.
Identifying and understanding the child and family service data will guide our improvement efforts.
Our initial work outlines some of the challenges we face:
a shortage of mental health providers,
high rates of children’s psychiatric hospitalizations,
high rates of sanctions for children with mental health issues,
a youth suicide rate 40% higher than the national average,
pronounced racial disparities in school discipline, juvenile detentions, and foster care
placement.

Wisconsin Office of Children’s Mental Health Annual Report 2014 Page 5
While Collective Impact activities will provide OCMH’s primary focus in 2015, several early issues have
emerged that will be included in the OCMH’s list of partnership activities: tracking the growing state-
wide interest in school-based mental health, assisting in the development of parent peer specialists,
monitoring the use of psychotropic medications in foster care and the examination of high rates of
youth hospitalization.
This report outlines many of the challenges facing Wisconsin’s child-serving systems while also
highlighting the good work already underway. By combining stakeholder commitment and passion
with the OCMH’s call to action, we anticipate great things in 2015.
Wisconsin Office of Children’s Mental Health Annual Report 2014 Page 6
Introduction
The passage of Act 20 in 2013 was a watershed moment for mental health in Wisconsin. The various
initiatives, including the creation of the Office of Children’s Mental Health (OCMH), collectively
symbolized Wisconsin’s recognition of the centrality of positive mental health to a thriving citizenry
and productive workforce.
Additionally, Governor Walker hoped to raise awareness and build momentum around trauma-
informed care and the widespread dissemination of material outlining the prevalence and impact of
adverse childhood experiences (ACEs). More personally, the governor has supported First Lady
Tonette Walker’s commitment to improving the lives of Wisconsin’s children and families through
her leadership of Fostering Futures, a public-private partnership implementing trauma-informed care
across the state. Ensuring the clear link between children’s adversity and mental health difficulties is
at the core of the OCMH operation.
MISSION, GOALS AND CONCEPTUAL FRAMEWORK
Mission: For many people, the implicit meaning of “children’s mental health” is “children’s mental
illness.” The OCMH intends to broaden the focus from mental health/mental illness to the
promotion of children’s social and emotional development. This is reflected in our mission
statement: The Office of Children’s Mental Health supports Wisconsin’s children in achieving their
optimal social and emotional wellbeing.
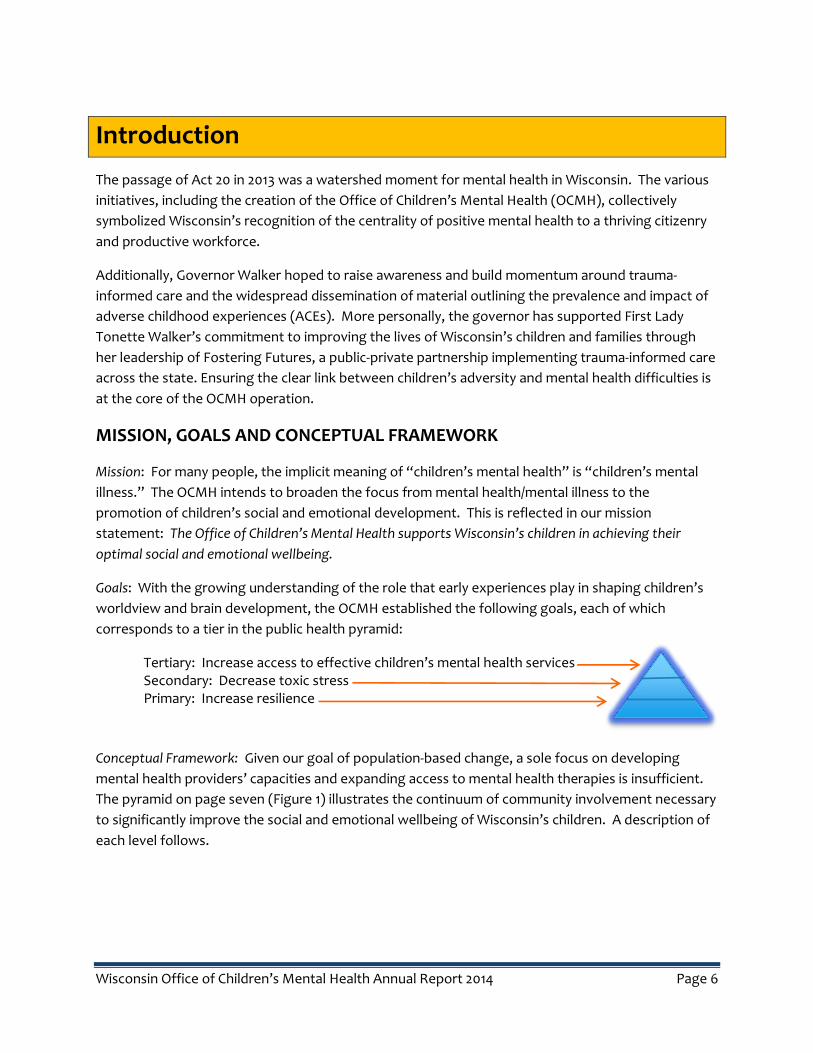
Goals: With the growing understanding of the role that early experiences play in shaping children’s
worldview and brain development, the OCMH established the following goals, each of which
corresponds to a tier in the public health pyramid:
Tertiary: Increase access to effective children’s mental health services Secondary: Decrease toxic stress Primary: Increase resilience
Conceptual Framework: Given our goal of population-based change, a sole focus on developing
mental health providers’ capacities and expanding access to mental health therapies is insufficient.
The pyramid on page seven (Figure 1) illustrates the continuum of community involvement necessary
to significantly improve the social and emotional wellbeing of Wisconsin’s children. A description of
each level follows.

Wisconsin Office of Children’s Mental Health Annual Report 2014 Page 7
Safe, Stable, Nurturing
Families and Communities:
The foundation of the
pyramid identifies the most
significant impact on the
lives of children: the
presence of safe, stable
and nurturing parents or
other caregivers. Research
shows that stressors within
the family—such as
unaddressed parental
mental illness, addiction, or
domestic violence—can
have profound and lasting
consequences on a child’s physical and mental health.1 Yet too often parents are left with insufficient
understanding of how their lives and challenges can impact their child, and subsequently what they
can do about it. Similarly, research shows that providing support for a parent is one of the best ways
to enhance the outcomes of a child.2 Therefore, any approach to bolster children’s mental health
and social development needs to consider how best to support, educate, and advocate for parents.
In addition, a complete public health approach to children’s mental health must account for where
and under what conditions children and families live. Research shows that the community a child
grows up in can affect his or her mental and physical health. 3 Ensuring that our communities are
safe, stable and nurturing is thus an important goal.
Skilled Child-Serving Workforce: The second layer of influence identifies any adults who touch the life
of a child including early child care workers, teachers, after school services, coaches, members of
civic organizations and faith communities, etc. The research on child development shows that having
even one safe, stable and sensitive adult in a child’s life can help make the difference between a child
who is resilient and one whose life trajectory is far less hopeful.4 Providing the child- and family-
serving workforce with actionable information and skill-building about how best to support
children’s social and emotional development is therefore vital to helping create stronger, healthier
children and future adults.
Youth and Parent Peer Specialists (PPSs): The third tier identifies PPSs, a relatively new resource for
families. A PPS is a parent or caregiver of a child who has mental, emotional, or behavioral issues and
1 National Scientific Council on the Developing Child. (2005/2014). Excessive Stress Disrupts the Architecture of the Developing Brain: Working Paper 3. Updated Edition. Retrieved from www.developingchild.harvard.edu. 2 Emde, R., and Robinson, J. Guiding principles for a theory of early intervention: A developmental-psychoanalytic perspective. In Handbook of early childhood intervention. 2nd ed. JP Schonkoff and S.J. Meisels, eds. 3 Selected bibliographies available through the CDC Healthy Places webpage. 4 Masten, A.S., and Reed, M. G. (2002). Resilience in Development. In S.R. Snyder & S. J. Lopez (Eds.), The Handbook of Positive Psychology. Oxford, England: Oxford University Press.
Figure 1
1
Figure 1

Wisconsin Office of Children’s Mental Health Annual Report 2014 Page 8
who is specifically trained to provide information, resources and support to other parents. This
addition to the mental health/substance use workforce offers families and young people “peer-to-
peer support” that may serve as an enhancement to traditional services or may be used as a stand-
alone service. In addition to mental health/substance use, Wisconsin may also soon see the benefits
of the PPS role in primary care, schools, child welfare and juvenile corrections.
Coaches and Consultants: Organizational leaders and service providers have discovered that a one
hour or even one day training is often a lost investment without the addition of regular, direct, on-
the-ground guidance. Implementation science identifies coaching as one of the most effective ways
to change practices in the workforce.5 Thus, OCMH sees an important role for coaches and
consultants who can help translate insights from research and evidence-based practices into
changes in the home, early educational setting, classroom and clinic.
Student Support Services: Schools are in a primary position to see the effects of students’ social and
emotional struggles; however, Wisconsin currently falls far below the recommended number of
school psychologists, counselors, social workers and nurses to meet the full extent of students’
needs. The OCMH sees student support personnel as a vital resource enabling students to reach
their full potential.
Mental Health Providers (Psychiatrists, Psychologists, Counselors, Social Workers, etc.): Mental health
providers represent the tip of the pyramid. Much like other areas across the country, Wisconsin’s
mental health workforce is largely insufficient to satisfy the need for therapies, psychological
evaluations, psychiatric services, etc. For instance, 46 of Wisconsin’s 72 counties are officially
designated (or contain) Mental Health Professional Shortage Areas and data from the Wisconsin
Department of Health Services indicates that the shortage is particularly pronounced for children.6
For those families who do access services, there is no systematic data on what types of therapies or
interventions are being used and how well they work. Given these factors, OCMH wants to both
reduce the need for scarce mental health services by building the bottom of the pyramid, while also
supporting the development of the right treatments, for the right children at the right time.
In many ways, the following report is a call to action and Wisconsin is primed to respond. The staff at
the OCMH is honored to be a part of the state’s unequivocal declaration that children’s social and
emotional wellbeing matters.
Please note: Throughout this report, the reader may find unfamiliar words or acronyms. In some cases,
we have embedded definitions; where we have not, we refer the reader to the Glossary located at the
end of the report. Additionally, demographic information on Wisconsin’s population and an
explanation for the absence of tribal data appear in Appendix A.
5 See e.g. Joyce and Showers 1996 and 2002; Rodriguez and Knuth 2000; Garet et al 2001; Russo 2004. 6 For information on shortage areas, see http://hpsafind.hrsa.gov/. For information on youth served in the public mental health system see http://media.samhsa.gov/dataoutcomes/urs/2012/Wisconsin.pdf.

Innovate
TRAUMA-INFORMED CARE: SHIFT YOUR PERSPECTIVE
The OCMH sees trauma-informed care as central to improving child and family outcomes and as
highly relevant to every level of the aforementioned pyramid. Building on Wisconsin’s trauma-
informed care and Adverse Childhood Experience (ACE) momentum, the OCMH will carry forward
the trauma-informed call to action: Shift Your Perspective.7
Shift Your Perspective: Families as
Leaders vs. Families as Receivers
In order to ensure family involvement in all
aspects of operation, OCMH hired a Family
Relations Coordinator who has personal
experience navigating multiple systems of care
for herself and her children. Her primary task is to
ensure that families are meaningfully involved in
every step of our work.
In many ways, this concept is not new to
Wisconsin. The Department of Health Services,
Division of Mental Health and Substance Abuse
Services has promoted meaningful consumer
involvement for many years. The Department of
Public Instruction has the Wisconsin Statewide
Parent Educator Initiative (WSPEI) created to
educate and support parents of students with Individual Education Plans (IEPs). Other state agencies
have ways of soliciting parent engagement at the service level. Additionally, Wisconsin has several
organizations that are focused on meaningful family involvement. These include, but are not limited
to: Family Voices of Wisconsin, National Alliance for Mental Illness (NAMI), Parent 2 Parent of
Wisconsin, Wisconsin Family Assistance Center for Education, Training and Support (Wisconsin
FACETS), Alianza Latina Aplicando Soluciones (ALAS), and Wisconsin Family Ties (WFT).
Our innovation lies in developing an infrastructure (e.g., recruitment, training and support) to ensure
meaningful parent and youth involvement across all state-level activities related to the wellbeing of
children and families. This activity is underway with the recruitment and training of ten parents and
five youth who will provide leadership to Collective Impact activities. (See section entitled
“Integrate”) Additionally, the Family Relations Coordinator provides technical assistance to state
agencies requesting assistance in increasing meaningful youth and family engagement.
7 See DHS, DMHSAS TIC website: http://www.dhs.wisconsin.gov/tic/.
“I have had a very positive experience
working with the OCMH. The Office is
working on a paradigm shift in the area of
mental health, one that is desperately
needed for our children. What is currently
out there is not working, so a new vision
and new action are needed. I feel confident
that with the experience and commitment
of the OCMH, and the continued process of
engaging families, eliminating the stigma of
mental health issues can be done, and
individuals will receive the support they
need to live enriching lives.”
Helena Heo, OCMH Collective Impact Parent
Partner
Wisconsin Office of Children’s Mental Health Annual Report 2014 Page 10
Shift Your Perspective: Adaptation vs. Mental Illness
The OCMH encourages an enhanced understanding of children’s mental health symptoms, diagnoses
and treatment, including how we interpret and assign meaning to challenging or troubling behaviors.
Specifically, we highlight research related to neurobiological adaptations resulting from early
adversity. This perspective shift is in line with many of Wisconsin ACE activities that bring to light the
following information:
Forty-six percent of Wisconsin children have experienced at least one ACE,8
Seventy percent of adult respondents with Medicaid report at least one ACE,9
Medicaid recipients are more than twice as likely as residents with private insurance to report having four or more ACEs, which is correlated with poorer physical and mental health,10
In 13 Wisconsin counties, one out of every five adults has four or more ACEs,11
Approximately one in eight Wisconsin mothers of children on Medicaid had fair or poor mental health.12
This focus is central to our work because seeing and addressing only the child’s decontextualized
symptoms of toxic stress and trauma, without understanding the source of the behaviors, often
results in negative outcomes such as re-traumatization, failed treatment, misguided sanctions,
discouraged families, and frustrated staff.
A concrete example of the need for a system-wide shift in understanding would be to consider a
single child who receives three different labels from three service systems for the same challenging
behavior. These labels might include: severe emotional disturbance (SED - mental health system),
emotional behavioral disabilities (EBD – educational system) or criminality/criminogenic thinking
(Delinquent - correctional system). Across these systems, the standard assumption is, “there’s
something wrong with this child” since his/her behaviors clash with each system’s behavioral
expectations. OCMH aims to change the conversation by rethinking our categorical understanding
and asking instead, “what might have happened to this child that would explain this behavior?” This
shift brings systems together with shared language and a shared understanding of the child’s
underlying issues. Accountability and specific interventions will still be required, however the shift in
understanding will lead to a more comprehensive understanding of what will and will not work.
8 Sacks, V., Murphey, D., & Moore, K. (2014) Adverse Childhood Experiences: National and State Level Prevalence. Child Trends Publication2014-28. 9 O’Connor, C., Finkbiner, C., & Watson, L., (2012). Adverse Childhood Experiences in Wisconsin: Findings from the 2010 Behavioral Risk Factor Survey. Madison, Wisconsin: Wisconsin Children’s Trust Fund and Child Abuse Prevention Fund of Children’s Hospital and Health System. 10 Ibid. 11 Wisconsin ACE Brief 2011 and 2012 Data. Madison, Wisconsin: Wisconsin Children’s Trust Fund and Child Abuse Prevention Fund of Children’s Hospital and Health System. 12 13.3%. From 2011-12 National Survey of Children’s Health.
Wisconsin Office of Children’s Mental Health Annual Report 2014 Page 11
Shift Your Perspective: Public Health Approach vs. Primarily Clinical Focus
With the public’s growing understanding of
the prevalence and impact of ACEs comes
the growing awareness that clinical
interventions are not enough. The skill
development and relational strength
necessary to create safe, stable and
nurturing families and communities
requires commitment from every adult who
touches the life of a child. Thus, the OCMH
has adopted a public health approach to
improve children’s mental health. This
involves encouraging policies and practices
that will build resilience for children and
families, reduce and/or mitigate toxic stress
and increase access to effective services for
those children with identified mental health
needs.
Shift Your Perspective: Systems vs. Programs
Improving children’s mental health cannot be achieved by simply enhancing one program or starting
a new initiative. Funders and change-agents now realize the importance of harnessing the synergy
of multiple programs across many systems. This entails gaining a full understanding of what works,
what areas need to be addressed, and which reform efforts are likely to be most effective. This
effort will be outlined in more detail in the next section entitled “Integrate.”
In many ways, our conventional approaches, though well intended, have not had broad and long-
lasting impact. Ultimately, OCMH believes that provided with information and support, Wisconsin
state agencies, communities and families will commit to reducing children’s adversities, increasing
protective factors, and improving services to ensure that our next generations are healthy and
productive.
‘I was positively impacted by a connection
made over 30 years ago at a job where I was
connected to a program for “at risk”
students. The positive connections made with
co-workers and managers changed my
life! One example was a human resources vice
president. He helped me believe in myself and
recognize that I wasn't stupid as I once
thought because of the struggles I experienced
in school. He recognized my gifts, strengths
and talents and brought them to light.’
Tina Buhrow, OCMH Collective Impact Parent
Partner

Integrate
COLLECTIVE IMPACT
In October of 2014, the OCMH and the Children’s Trust Fund brought together approximately one
hundred people to learn about a promising systems change strategy called Collective Impact (CI).
The CI framework brings together cross-sector perspectives and facilitates the collective
understanding of highly complex social problems involving multiple agencies and systems. The
approach has been successful in many areas of the country (and abroad) and is used in several
Wisconsin counties, nonprofits, and the University of Wisconsin to address issues such as poverty,
education, and obesity.13 Our CI project has the additional power of prioritizing youth and parent
voices (Collective Impact Partners) in leading system innovation.
In preparation, the OCMH outlined the current system landscape (e.g., initiatives, collaborations,
programs, number of children served, dollars spent)14 using a continuum format from prevention to
deep-end services. (A depiction of this landscape is located in Appendix B.) This process was
enriched by the help of more than fifty analysts and other colleagues from multiple state agencies
who attended an inter-departmental data meeting convened by the OCMH in July 2014. Having a
visual depiction of this landscape begins to build a shared understanding of “the child and family-
serving system” and promotes conversations and questions about possible gaps or duplication. Due
to a lack of shared measures and the frequent absence of data around effectiveness, it is currently
not possible to map these services in terms of outcomes. We hope that the CI process propels more
programs to move beyond outputs to include evaluation of outcomes.
With this shared understanding of the service landscape, our CI partners will begin the first step in
the CI process: the creation of a common agenda for change. (The agenda is also informed by the
baseline data in the “Improve” section of this report.) Once the CI stakeholders agree on a common
agenda, they identify shared measures for tracking progress and align efforts to ensure that different
program areas are working towards the common agenda. Continuous communication between
stakeholders helps to keep the process on track, and it is facilitated and supported by a backbone
organization. Our current interactions with stakeholders inspire confidence that Wisconsin is ready
to engage in this promising approach.
13 Kania, John and Kramer, Mark, “Embracing Emergence: How Collective Impact Addresses Complexity” Stanford Social Innovation Review, January, 2013. 14 Programs depicted here are those with an explicit link to a Wisconsin state agency. Future reports will include more information on programs that are specific to counties and tribes.

Improve
As outlined in the “Integrate” section, the Collective Impact participants will develop a common
agenda for system change based on an understanding of how systems currently work and what can
be improved. This section takes a step in that direction by outlining some of Wisconsin’s available
data related to the following: prevalence of mental health issues and other challenges, access to
treatment, service outcomes, indicators of unmet needs, and indicators of system improvement.
A Note on Data: The information that follows is drawn from individual programs. In order to create a
comprehensive understanding of the scope and impact of our services, Wisconsin needs to develop the
ability to look at data across service systems. There are currently several projects aimed at improving
data quality and accessibility; OCMH is helping to move these efforts forward where they currently exist
and encouraging them where they do not.
PREVALENCE OF MENTAL HEALTH ISSUES, SUICIDE AND RISK FACTORS
Figure 2
Mental Health Issues: National estimates indicate that as many as one in five children has a
diagnosable mental health issue.15 The Substance Abuse and Mental Health Service Administration
(SAMHSA) estimates the prevalence of childhood Serious Emotional Disturbance (SED) in Wisconsin
at nine to eleven percent (See Figure 2); in terms of Wisconsin’s population, this would be from
60,395 to 73,816 children ages nine to seventeen.16
15 CDC and Prevention, “Mental Health Surveillance Among Children—United States, 2005-2011.” May 17, 2013, 62(02): 1-35. 16 SAMHSA URS Table 1: Number of Children with SED, age 9 to 17, by state, 2013.

Data from the 2013 Wisconsin Youth Risk Behavior Risk Survey (YRBS) indicates that approximately
one in four high school students experienced symptoms of depression17 while just over half (55.6%)
of students reported experiencing poor mental health at least one day in the last month. For lesbian,
gay, or bisexual students, the numbers increase to more than one in two experiencing symptoms of
depression (57%) and more than four out of five (83%) experiencing poor mental health days in the
last month.18 One in four female students reported intentionally injuring herself, such as cutting or
burning.19 With regard to substance use, 18% of students reported binge drinking in the past 30
days.20
Suicide: In Wisconsin, approximately one in eight students reported seriously considering suicide.21
While the number of Wisconsin youth contemplating or attempting suicide is lower than the national
average,22 Wisconsin’s actual youth suicide rate is 40% higher than the national average23 (See Figure
3) and is the second leading cause of death for Wisconsin young people after accidents.24
Figure 3
17 Students in this category answered affirmatively to the question of whether at any time in the past 12 months they had felt so sad or hopeless that they had stopped engaging in their usual activities. 18 DPI, “Youth Risk Behavior Survey Executive Summary 2013,” p. 3. 19 Ibid, p. 2. 20 Ibid, p. 4. 21 Ibid, p. 3. 22 Seriously considering suicide: 13.2% in WI vs. 17.0% U.S. Attempted suicide: 6.0% in WI vs. 8.0% U.S. Source: 2013 YRBS, available at CDC Youth Online YRBS. 23 Source: Graph courtesy of Dr. Kathryn Bush of DPI. Rates calculated based on DHS Wisconsin SH Query system and CDC Wisconsin SQARS. See DPI’s 2013: YRBS Executive Summary and CDC Youth Online High School YRBS Wisconsin United States 2013 results. 24 Data query for 2013 from DHS WI SH system.

Wisconsin Office of Children’s Mental Health Annual Report 2014 Page 15
Suicide is particularly serious among lesbian, gay, bisexual or transgender youth (LGBT). In 2013, four
out of ten LGBT youth reported that they had made a plan to commit suicide, and 28% had actually
made an attempt. This is seven times higher than their heterosexual counterparts.25
Adverse Childhood Experiences (ACEs): Children with two or more ACEs are more likely to repeat
grades, to have behavioral problems, and to suffer chronic health issues, including ADHD.26 Almost
one-half of Wisconsin’s children (46%) have experienced at least one ACE and approximately one in
nine children (11%) has experienced three or more ACEs. One place where ACEs are ubiquitous is in
the area of juvenile corrections. The Wisconsin Department of Corrections (DOC), Division of
Juvenile Corrections (DJC) recently administered ACE questionnaires to youth at their two juvenile
facilities. The results revealed that trauma in general—and multiple traumas in particular—were a
near universal experience for their youth.27 Only two percent of youth at Lincoln Hills or Copper Lake
Schools reported having experienced zero ACEs (vs. 46% of Wisconsin youth in general), whereas
almost two-thirds (64%) had experienced three or more ACEs.
Lead Exposure: Research shows links between lead exposure, behavior problems and mental health
concerns including anxiety, depression, aggression, hyperactivity, and anti-social behavior.28
According to 2013 figures from the Centers for Disease Control and Prevention, Wisconsin’s
confirmed rate of lead poisoning is 45% higher than the national average (0.81% vs. 0.56%).29 Over the
last three years, 17,000 Wisconsin children have tested positive for lead exposure30 prompting the
governor to declare Oct. 19-25 Wisconsin Childhood Lead Poisoning Prevention Week.
ACCESS TO PUBLIC MENTAL HEALTH PROFESSIONALS AND SERVICES
While a wide array of child- and family-oriented programs and services exist across Wisconsin, there
is still a substantial gap when it comes to children’s mental health services. Approximately one in
three children with a mental health need went without treatment in the past year.31 When looking
only at Wisconsin youth with a major depressive episode, nearly 60% did not receive treatment within
the past year.32
25 DPI, 2013 YRBS Executive Summary, p. 3. 26 Bethell, C.D., Newacheck, P., Hawes, E., Halfon, N. Adverse Childhood Experiences: Assessing The Impact On Health And School Engagement And The Mitigating Role Of Resilience. Health Affairs, 2014; 33 (12): 2106. DOI: 10.1377/hlthaff.2014.0914. 27 ACEs scores for all Wisconsin children taken from Child Trends 2014, p. 4. DOC data is based on youth at Lincoln Hills and Copper Lake Schools from February 2013-January 2014. 28 See an annotated bibliography of the literature on this topic at DHS “Lead-Safe Wisconsin”. 29 Centers for Disease Control and Prevention National Surveillance Data on Lead. “Number of Children Tested and Confirmed EBLLs by State, Year, and BLL Group, Children < 72 Months Old”. Figures based on 2013 data and Blood Lead Levels >10 mg/dL. 30 DHS, “Lead-Safe Wisconsin.” 31 The 2011/2012 National Survey of Children’s Health reports that 65.4% of Wisconsin children ages 2-17 with problems requiring counseling received mental health care. This is also on par with the national estimate of 61% (the difference between them is not statistically significant). 32 SAMHSA, “Behavioral Health Barometer Wisconsin 2013,” p. 6.

Wisconsin Office of Children’s Mental Health Annual Report 2014 Page 16
County-based Services: Forty-six of our 72 counties include federally designated mental health
professional shortage areas.33 Looking at mental health providers (i.e., for adults and children),
Wisconsin has 1,033 providers per capita versus a national average of 790: 1. According to one
source, this places us 42nd nationally.34 There is some evidence that the shortage is particularly
pronounced for children. For instance, in 2013 six counties reported not serving any children in their
mental health system, and an additional three counties served only two or three children.35 In a
consumer satisfaction survey for parents of children served in the public mental health system,36 68%
of Wisconsin parents felt positive about accessing treatment, which is nearly 18 percentage points
below the national average.37
Medicaid: When Wisconsin children access mental health treatment, 2013 claims data indicates that
Medicaid is the primary payer, playing a greater role in paying for children’s mental health services
than other types of children’s health services.38 A recent report on mental health systems gave
Wisconsin high marks for having almost universal insurance coverage for children,39 although there is
some indication that Wisconsin might be slipping in that regard.40 While having some insurance is
undoubtedly better than having no insurance, having Medicaid can be a barrier to receiving services.
Several studies show that children with public insurance have to wait longer and have fewer
available treatment options, attributed in part to providers declining to accept Medicaid patients if
they believe the reimbursement rates are too low.41 For instance, in a small poll of Wisconsin health
care providers, 81% reported difficulty in finding a psychiatrist for their pediatric patients on Medicaid
compared to 44% who reported finding it hard to find a psychiatrist for their privately insured
patients.42
33 DHS, Division of Public Health, “Wisconsin Mental Health HPSAs: Federally Designated Health Professional Shortage Areas.” May 29, 2013. 34 Mental Health America, “Parity or Disparity: The State of Mental Health in America 2015,” p. 40. 35 Data query through DHS’s PPS Mental Health Module. 36 Milwaukee and Dane counties are under-represented in this sample. 37 SAMHSA’s 2012 URS tables. The survey only included children served by county employees or contractors. Many children with Medicaid see private providers; no surveys are currently conducted of those services. Milwaukee and Dane counties are under-represented in this sample. 38 Based on a query of children ages 0-17 from the Wisconsin Health Information Organization (WHIO) data system, which includes public and commercial claims data from 70% of Wisconsin residents. The Wisconsin findings are in line with national figures suggesting that Medicaid is the single largest payer for children’s behavioral health services. See e.g. AHRQ Statistical Brief #434: “The Five Most Costly Children’s Conditions, 2011.” April 2014. 39 Mental Health America. “Parity or Disparity: The State of Mental Health in America 2015”. The combination of near universal insurance coverage and high levels of identifying children with EBD in the schools leads to Wisconsin’s children’s mental health system being ranked third nationally, despite the fact that Wisconsin is average on most of the other measures and poor on excluded measures, such as hospitalization readmissions and workforce shortages. 40 See e.g. Alker, Joan and Alisa Chester. “Children’s Coverage at a Crossroads: Progress Slows.” Georgetown University Health Policy Institute, November 2014. 41 See e.g. Bisagaier, J. & Rhodes, K.V. (2011) Auditing access to specialty care for children with public insurance. The New England Journal of Medicine 364: 2324-33. 42 Poll conducted by the Wisconsin Statewide Medical Home Initiative, December 2014. Sixty-three physicians and pediatric nurse practitioners responded.

Wisconsin Office of Children’s Mental Health Annual Report 2014 Page 17
National data indicates
that when children do
receive professional
social and emotional
support, they are most
likely to receive it at
school through student
support services.43
Unfortunately, Wisconsin
schools’ workforce falls
short of recommended
staffing levels. For
instance, on average each
school counselor has
nearly 500 students when
the profession recommends working with 250 or fewer. Based on conservative estimates, Wisconsin
schools would need nine times as many nurses,44 five times as many social workers, twice as many
school counselors, and 50% more psychologists to be adequately staffed (See Figure 4).45 According
to the most recent estimates available, Wisconsin ranked 12th in school psychologists staffing,46 37th
for counselors,47 and 41st for school nurses.48
SERVICE OUTCOMES
The following section highlights four outcomes: functional improvement, caregiver satisfaction with
outcomes, reasons for leaving programs, and success in moving children to the least restrictive
setting. Please note that not all public programs collect data on service outcomes and when they do,
reporting is not uniform making comparisons difficult.49 In addition, there is little information on what
types of therapeutic approaches are being offered.50 Thus, what follows is a partial representation of
treatment outcomes for programs based on available data.
43 Hurwitz, Laura and Karen Weston. “Using Coordinated School Health to Promote Mental Health for All Students.” National Assembly on School-Based Health Care. July 2010, p. 6. 44 Based on a 750:1 student-to-nurse ratio from the National Association of School Nurses. This is the estimate for “well students”; the recommendation for students in Special Education is actually 225:1. 45 National Association of School Psychologists (NASP) Communique. McGraw, Kelly and Daniel A. Koonce, “Research-Based Practice: Role of the School Psychologist,” Vol. 39, Issue 8, n.d. The American School Counselor Association Student-to-Counselor Ratio 2010-2011. National Association of Social Workers Standards for School Social Work Services, 2012. 46 Charvat, Jeffrey L. “Ratio of Students Per School Psychologist by State: Data from the 2009-10 and 2004-05 NASP Membership Surveys,” April 2011. 47American School Counselor Association. “Student-to-School Counselor Ratio 2010-2011,” n.d. State-by-state data on staffing of school social workers is not available. 48 National Association of School Nurses, “Healthy Children Learn Better!” January 2009. 49 One example of an effort to examine cross-systems outcomes comes from the Birth to 6 Initiative, which brings together the Birth to 3 Program and other DHS early childhood programs and Special Education programs sponsored through DPI. 50 This problem is not unique to the public system. There is very little information on the private system’s activities and effectiveness.
0
500
1,000
1,500
2,000
2,500
3,000
3,500
384
1,766 1,523
125
2,171
3,476
2,319
1,158
Actual vs. Recommended Staffing Levels for Student Support Services, AY 2013-2014
Current Number
Total Needed
Figure 4

Wisconsin Office of Children’s Mental Health Annual Report 2014 Page 18
Functional Improvement: Both the Birth to 3 Program and Special Education Early Childhood
programming (ages 3-6) report the number of children with social emotional challenges who
improve during the course of treatment. In the Birth to 3 Program, slightly more than half the
children (56%) showed substantial improvement on social emotional functioning during the course of
treatment.51 Recent data from Special Education Early Childhood programming shows that
approximately 78% of preschoolers who entered school with a likely social emotional issue52 showed
improvement by age 6, however even with such improvement only one-third to 40% of these children
were operating at grade level by the time they turned 6 or exited the program.53 The vast majority
(85%) of youth in Wraparound Milwaukee, Milwaukee’s coordinated service approach, showed
statistically significant improvement in clinical outcomes.54 Other agencies collect data that identifies
functional improvement but appear not to have a formal reporting process.55
Caregiver Satisfaction: An important treatment outcome is whether a child’s caregiver sees
improvement. In 2012, fewer than half of parents (42%) believed that their child’s behavior and
functioning had improved with county-based services.56 Nationally, this places Wisconsin near the
bottom for parent satisfaction.57
Wraparound Milwaukee administers its own series of consumer satisfaction surveys. At six months,
the majority of families answered affirmatively to the statement, “Overall, I feel the care provided to
me/my family has been helpful so far” (score: 4.65/5). At discharge, respondents were similarly
positive about having made significant progress (4.07); meeting the child’s educational needs (3.73)
and being better able to handle challenging situations (4.33).58
In 2012, the Birth to 3 Program reported that approximately 90% of parents agreed that early
intervention services helped their child develop and learn.59 The DPI captures parental satisfaction
51Wisconsin Annual Performance Report IDEA Part C, FFY 2012. Indicator 3, Outcome A. See p. 16. 52 Defined here as children labeled as having an Emotional Behavioral Disability or Other Health Impairment. See greater descriptions of these categories in the glossary. 53 DPI: OSEP Outcome 7A Indicators for Academic Year 2012-13. 54 Based on repeat administration of the Child Behavioral Checklist Youth Self-Report. Kamradt, Bruce, “Innovative Approaches to Measuring and Monitoring Outcomes for Youth in Systems of Care: Wraparound Milwaukee’s Model.” Presentation in Albany, NY on October 8, 2014. 55 For instance, DCF’s DSP also assesses children’s needs using the Child and Adolescent Needs and Strengths (CANS) tool for children in out-of-home care. Since most children are administered multiple CANS, the assessment theoretically provides a way to track improvement. DHS’s Children’s Long-Term Support Waivers also collect data on functional improvement through the Functional Screen. DHS will begin reporting out on various improvements for enrollees in the CCS program in 2015. 56 DHS’s Youth Satisfaction Survey for Families (YSS-F) surveys parents and caregivers whose children have utilized the county mental health system. It should be noted that the survey is not offered at discharge (as is true for other states using this survey), so some children may still be undergoing treatment when parents are surveyed. 57 SAMHSA URS tables. The survey excludes those served through Wraparound Milwaukee or Dane County’s wraparound program, Children Come First. In general, Dane and Milwaukee counties are under-represented in this sample. Also, not all states deploy a rigorous sampling methodology which could affect Wisconsin’s national ranking. However, even when comparing Wisconsin to other states that do deploy such a methodology, Wisconsin ranks at or near the bottom. 58 Wraparound Milwaukee 2013 Quality Assurance/Quality Improvement Annual Report. Dane County also collects consumer satisfaction data, but it was not available at the time of this publication. 59 DHS, “Annual Performance Report: IDEA Part C,” FFY 2012-2013, p. 7.
Wisconsin Office of Children’s Mental Health Annual Report 2014 Page 19
with the special education process (i.e., family involvement in planning), but not satisfaction with
outcomes, which they instead measure directly via student improvement. 60
Other areas where satisfaction surveys would be useful include: Children’s Long-Term Support
Waivers, Home Visiting, Child Protective Services, Emergency Detentions, psychiatric
hospitalizations, crisis services, and juvenile detentions.
Reasons for Ending Services: Another indication of whether a program has met participants’ needs is
the reason for discontinuing services. Ideally, families end services because their children’s needs
have been met. Coordinated Service Teams (CSTs) report fewer than half of the youth who were
discharged did so because their treatment goals had been met (43.4%).61 Dane County’s wraparound
approach, Children Come First, reported that 56.6% disenrolled because they made “substantial
progress.”62 Several other programs collect but do not report this measure. These include the Birth
to 3 Program, Wraparound Milwaukee, Comprehensive Community Services (CCS), and general
county mental health treatment services.
Least Restrictive Services: Returning home or into the community is another indicator of program
success. While sometimes necessary, a placement in a psychiatric facility, residential care center,
juvenile detention facility, shelter care, foster home, or other out-of-home placement can be
stressful for a child and his or her family.
Wraparound Milwaukee has demonstrated success in ensuring permanent placements for children
and reducing juvenile justice contacts and hospitalizations. In 2013, 70% of the 33 children in CSTs
who were living out of home at the time of enrollment were back in the community by the time they
ended services.63
DCF’s Division of Safety and Permanence (DSP) supports children in foster care, residential care
centers (RCCs) and other out-of-home settings. In 2013, RCCs successfully transitioned two out of
three children (66.5%) to less restrictive settings, 13.5% remained at the same level and 18% were
transitioned to a more restrictive environment.64 Fewer than half of the children in group homes
(41.8%) transitioned to a less restrictive environment.65 While the concept of a less restrictive setting
is not as applicable to foster homes, DSP does capture similar measures for level Three and Four
foster homes (known as “Child Placing Agencies” and formerly called “Treatment Foster Homes”).
Just under half of those placements (45%) resulted in a child achieving permanence or being placed
with a relative caregiver.
60 DPI, “State of Wisconsin Part B. Annual Performance Report, 2012-2013.” 61 DHS Division of Mental Health and Substance Abuse Services, “Children Come First Advisory Committee 2013 Annual Report on CSTs (pre-expansion),” p. 16. 62 “Children Come First-Dane County 2013 Evaluation Indicators Report,” p. 2. 63 DHS Division of Mental Health and Substance Abuse Services, “Children Come First Advisory Committee 2013 Annual Report on Coordinated Service Team Initiatives (Pre-Expansion),” p. 11. 64 DCF Residential Care Center Dashboard, Calendar Year 2013. 65 DCF Group Home Performance Based Measures Dashboard, Calendar Year 2013.

Wisconsin Office of Children’s Mental Health Annual Report 2014 Page 20
There are many other types of outcomes that are important to capture in order to evaluate systems and
programs. In future years, we hope that there will be broader data collection, integration, and
reporting to allow for further analysis.
INDICATORS OF UNMET NEEDS Over time, when children’s social and emotional difficulties are unrecognized or inadequately addressed, there is a higher probability that families, providers and educators will become frustrated resulting in reactive, extreme and often punitive actions. With few available options, the “solutions” are generally crisis-driven, expensive, and effective only in the short-term, if at all. We examine some of these approaches below.
Psychiatric Hospitalizations: Wisconsin has higher than national average rates of psychiatric
hospitalizations for children and youth. Looking only at the state psychiatric hospitalizations,66
Wisconsin’s rate of hospitalizing children and youth is 4.5 times the national average and the highest
in the Midwest. (See Figure 5)
Figure 5
66 As per federal reporting guidelines “state hospitalizations” refers to consumers admitted to both state and county hospitals; i.e., to all hospitalizations in public facilities.

Wisconsin Office of Children’s Mental Health Annual Report 2014 Page 21
More than one in four (27%) patients in public psychiatric hospitals is under 18 years of age, in
contrast with the 1 in 14 (7%) national average.67 In general, Wisconsin children served in the public
mental health system are 2.8 times more likely to be admitted to the state psychiatric hospital than
adults.68 Wisconsin’s 30-day hospital readmission rates for children are approximately twice the
national average (14.6% versus 7.1%)69 suggesting that hospitalization is a short-term answer to more
entrenched problems.
While the aforementioned statistics are based solely on the public mental health system, the same
general pattern holds when looking across all Wisconsin hospitals, with overall psychiatric
hospitalization rates anywhere from 26% to 75% higher than the national average, depending on the
year and the age group used.70 (See Figure 6)
Figure 6
Based on available Wisconsin insurance claim data, mental health is one of the leading reasons for
children’s hospital admissions, second only to hospitalizations for newborns. Notwithstanding
neonatal admissions, mental health hospitalizations constitute 15% of commercially covered inpatient
67 See SAMHSA’s 2012 URS table for Wisconsin. “Access Domain: Persons Served in State Psychiatric Hospitals by Age and Gender, FY 2012.” As noted in the previous footnotes, this measure includes other public hospitals beyond the state facility. 68 I.e., 10.7% of kids vs. 3.8% of adults served by the county system in 2012. Calculated from SAMHSA’s 2012 URS tables based on the total number of adults vs. youth hospitalized in the state facility, out of the total number served through the county-based mental health system. 69 Ibid. See “Readmission Rates.” 70 Based on the most recent (2009) national comparison: U.S. Department of Health and Human Services, Health Resources and Services Administration, Maternal and Child Health Bureau. Child Health USA, 2011. Rates based on Wisconsin Hospital Association 2009 discharge data for all psychiatric inpatient admissions (MDC=19).
0
200
400
600
800
1000
1200
1400
10 to 14 year olds 15 to 19 year olds
Wisconsin vs. National Rates of Psychiatric Hospitalizations for Two Age Groups (per 100,000)
WI
US
WI
US

Wisconsin Office of Children’s Mental Health Annual Report 2014 Page 22
stays and 25% of Medicaid-covered admissions for those ages 0 to 17.71 This contrasts with the most
recent national data (2011), which puts mental health as the 5th leading reason for hospitalizations
among children one year or older.72 (See Figure 7)
Figure 7
DHS and DCF have recently begun investigating these high rates of hospitalization and have made
preliminary recommendations to address this issue.
Out-of-Home Care: When a caregiver is unable to keep his/her child safe, child protective service
must step in. Approximately 6,200 Wisconsin children are in out-of-home care at a given point in
time73 and approximately one of every five foster children comes back into the system after having
been reunified with her/his parents.74 This family upheaval often leaves children feeling helpless and
hopeless with few coping strategies often resulting in challenging behavior. Thus, it is not surprising
that children in foster care are more likely to be prescribed psychotropic medications.75 In
Wisconsin, more than one in four foster children (28.9%) were prescribed a psychotropic medication
in 2013, versus 8.2% of non-foster children on Medicaid.76
71 Wisconsin Health Information Organization (WHIO) data. Query of all admissions by insurance type for ages 0-17 for 2011-2013. 72 Clark, Cheryl. “Top 10 Reasons for Pediatric Hospitalizations”. August 15, 2011. Available online at http://www.healthleadersmedia.copage-2/LED-269728/Top-10-Reasons-For-Pediatric-Hospitalizations. 73 DCF, “Wisconsin Children in Out-of-Home Care” 2012 Annual Report. Dated December 31, 2013. Point-in-time estimates are based on Dec. 31 of each year. 74 DCF, “Kidstat Performance Report: January-June 2014,” p.19. 75 Office of Planning, Research and Evaluation; Administration for Children and Families. “Child Well-Being Spotlight” August 15, 2012. For preliminary research specific to Wisconsin, see Mandell, Kara and Elizabeth Feder, “County level disparities in the prescription of antipsychotic drugs among children on Medicaid in Wisconsin,” Presentation at the American Public Health Association Annual Meeting, Nov. 4, 2013. 76 Analysis conducted by DHS Office of Health Informatics. Numbers do not include children prescribed stimulants.

Wisconsin Office of Children’s Mental Health Annual Report 2014 Page 23
School Discipline: One area of particular concern to parents and educators is the use of disciplinary
action. Research indicates that this concern is validated as students who are suspended or expelled
are at an increased risk of dropping out.77
Suspensions and Expulsions: Statewide, students with any form of disability (e.g.,
emotional/behavioral disability, learning or cognitive disability, etc.) are at an increased risk
of suspensions and expulsions compared to their peers who are not in Special Education.
(See Figure 8)
Figure 8
The good news is that suspensions have been decreasing for all students. At the same time, schools
are not closing the gap between students with disabilities and their peers. On the contrary, that gap
has increased in recent years: whereas in the 2002-03 school year, students with disabilities were 2.38
times more likely to be suspended than their peers, in 2012-13 they were 3.35 times more likely to be
suspended. This is higher than the national rate which was 2.2 times in 2011-2012.78
DPI tracks the number of students with disabilities who are suspended or expelled for a total of ten
days or more. This is a severe and relatively rare discipline which threatens to disrupt a child’s
academic career. Students with an Emotional Behavioral Disability (EBD) designation are at the
highest risk of receiving these school sanctions. Students with an EBD label made up only 10.4% of
students with a disability, but represented approximately a third (32.8%) of extended suspensions
and expulsions in this group.79 (See Figure 9)
77 Balfanz, R., Byrnes, V., & Fox, J. 2013. Sent Home and Put Off-Track: The Antecedents, Disproportionalities, and Consequences of Being Suspended in the Ninth Grade. Center for Civil Rights Remedies and the Research-to-Practice Collaborative. Available at: http://civilrightsproject.ucla.edu/resources/projects/center-for-civil-rights-remedies/school-to-prison-folder/summary-reports. 78 U.S. Dept. of Education Office for Civil Rights. “Civil Rights Data Collection: Data Snapshot (School Discipline),” March 21, 2014, p. 3. 79 Source: Individual Student Enrollment System (ISES).
0.00%
2.00%
4.00%
6.00%
8.00%
10.00%
12.00%
14.00%
16.00%
18.00%
Percent of Students Suspended, by Disability Status
Students with Disabilities
Students withoutDisabilities

Wisconsin Office of Children’s Mental Health Annual Report 2014 Page 24
Figure 9
By comparison, students with an EBD designation are 4.3 times more likely to receive extended
suspensions and expulsions than children with learning disabilities and 52 times more likely than
students with autism. In addition, there is the potential for children with behavioral and mental
health issues to receive an “Other Health Impairment” (OHI) designation. This category includes
children with only medical issues but also explicitly includes children diagnosed with Post Traumatic
Stress Disorder and attention-based issues such as Attention Deficit Disorder. It is therefore notable
that the second highest suspension category also includes children with social, emotional and
behavioral challenges. (See Figure 10)
Figure 10
10.4 32.8
89.6 67.2
020
40
60
80
100
120
Breakdown of Students withDisabilities(%)
Breakdown of Expulsions forStudents with Disabilities (%)
Representation of Students with EBD in Special Ed Population vs. Among those with 10+ Days of Suspensions (2011-2012)
Other Disability
EBD
0.00%
0.50%
1.00%
1.50%
2.00%
2.50%
3.00%
3.50%
4.00%
Percentage of Students In Special Education Who Received 10 or More Days of Suspensions in 2011-2012, by Disability

Wisconsin Office of Children’s Mental Health Annual Report 2014 Page 25
Early Education Expulsions: Expulsions can and do occur before children enter elementary
school. According to national research, for every 1,000 preschoolers enrolled in state pre-
Kindergarten programs, 6.67 are expelled, compared with 2.09 per 1,000 students in K- 12
schools.80 A 2010 Wisconsin study revealed that more than half of care providers had, during
their careers, expelled infants or preschoolers from their care with the leading reason being
behavioral issues.81
Seclusion and/or Restraint: A central concern for parents and schools is the use of seclusion
and/or restraint. While educators may deploy such measures with the intention of keeping staff
and students safe, seclusion and/or restraint runs the risk of injuring the student and staff person
as well as traumatizing the affected student, staff and student witnesses. A recent report by
advocacy groups showed that such measures are used more frequently (74% of incidents) with
students with disabilities and that the same students are repeatedly subjected to these
measures. For instance, there were 21,454 reported incidents of seclusion and/or restraint during
the 2012-13 school year, involving 2,976 students. This breaks down to an average of 7.2
experiences of seclusion and/or restraint per student.82
Low Graduation Rates:
These and other difficult
school experiences may
help to explain the relatively
low graduation rate for
students labeled with
Emotional Behavioral
Disability (EBD). In recent
years, approximately 57% of
students with an EBD label
have graduated within four
years. This is comparable to
graduation rates among
students with autism and is
ten percentage points
below all students with
disabilities while landing
more than thirty percentage points below students without disabilities.83 (See Figure 11)
80 Jacobson, L. 2005. “Preschoolers Expelled From School At Rates Exceeding that of K-12,” Education Week. 81 Supporting Families Together Association, “Child Retention in Wisconsin Child Care Settings: Understanding the Attitudes, Beliefs and Behaviors that Impact Expulsion and Retention in Early Care and Education,” 2010. 82 Disability Rights Wisconsin, Wisconsin Family Ties and Wisconsin FACETS, “Seclusion & Restraint in Wisconsin Public School Districts: 2012-2013 School Year Data.” 83 DPI graduation data prepared for this report. The average graduation rate from 2009-2012 for students with EBD is 58.0%, vs. 57.1% for students with autism, 68.2% for all students with disabilities, and 90.3% for all students without disabilities.
0.0%
20.0%
40.0%
60.0%
80.0%
100.0%
EmotionalBehavioralDisability
Any Disability No Disability
59% 70%
91%
Graduation Rates for Select Student Groups, 2012-2013
Figure 11

Wisconsin Office of Children’s Mental Health Annual Report 2014 Page 26
Juvenile Detention and Juvenile Corrections: In 2013, there were 7,829 detentions of juveniles, ages
ten to sixteen.84 This includes detentions within the fifteen85 county detention centers and
commitments to the two state (DOC) juvenile correctional institutions.86 This amounts to
approximately 15 detentions per 1,000 youth. Available data suggests that many youth are detained
multiple times whether for technical violations or commission of a new offense. For instance, nearly
half (48%) of Dane County’s detentions in 2013 were readmissions of youth previously admitted that
year.87 Similarly, nearly two-thirds of young men (63.5%) and one-third of young women (32%) at the
DOC’s juvenile correctional institutions recidivated within three years of release.88 Also of note is the
fact that the majority of youth (70%) are detained for things other than crimes against people;89 the
greatest arrest category being “society” offenses, which include disorderly conduct, loitering,
vagrancy and running away.90 (See Figure 12)
Figure 12
84 Office of Detention Facilities 2013 Annual Report, p. 12. 85 Two county detention facilities closed in 2013 bringing the current number of facilities to 13. 86 DOC’s Division of Juvenile Corrections uses the term “commitment” for youth detained in the two state juvenile correction institutions. This is not to be confused with psychiatric commitments or Emergency Detentions in psychiatric hospitals. 87 Based on 2013 data supplied by Dane County Juvenile Court Program. Most of these readmissions were based on technical violations or missed court dates rather than new offenses. It is possible that other counties have either higher or lower readmission rates than Dane County; however, statewide data on the number of unduplicated youth detained was not available at the time of this report. 88 DOC, Division of Juvenile Corrections 2013 Report, p. 4. Based on the 2009 cohort. The recidivism rate reflects the commission of new offenses rather than technical violations. It should be noted that DOC calculates recidivism over a longer period of time than many other states, which might make this number appear higher than that of some other states. 89 Calculated based on data from the Juvenile Secure Detention Registry. See also Wisconsin Council on Children & Families Detention Data Report 2013. 90 Query using Wisconsin Justice Data Portal examining statewide juvenile arrests for 2012.
Person/Sexual30%
Property 32%
Public Order 24%
Other 14%
Reasons for Youth Detentions, 2013
Wisconsin Office of Children’s Mental Health Annual Report 2014 Page 27
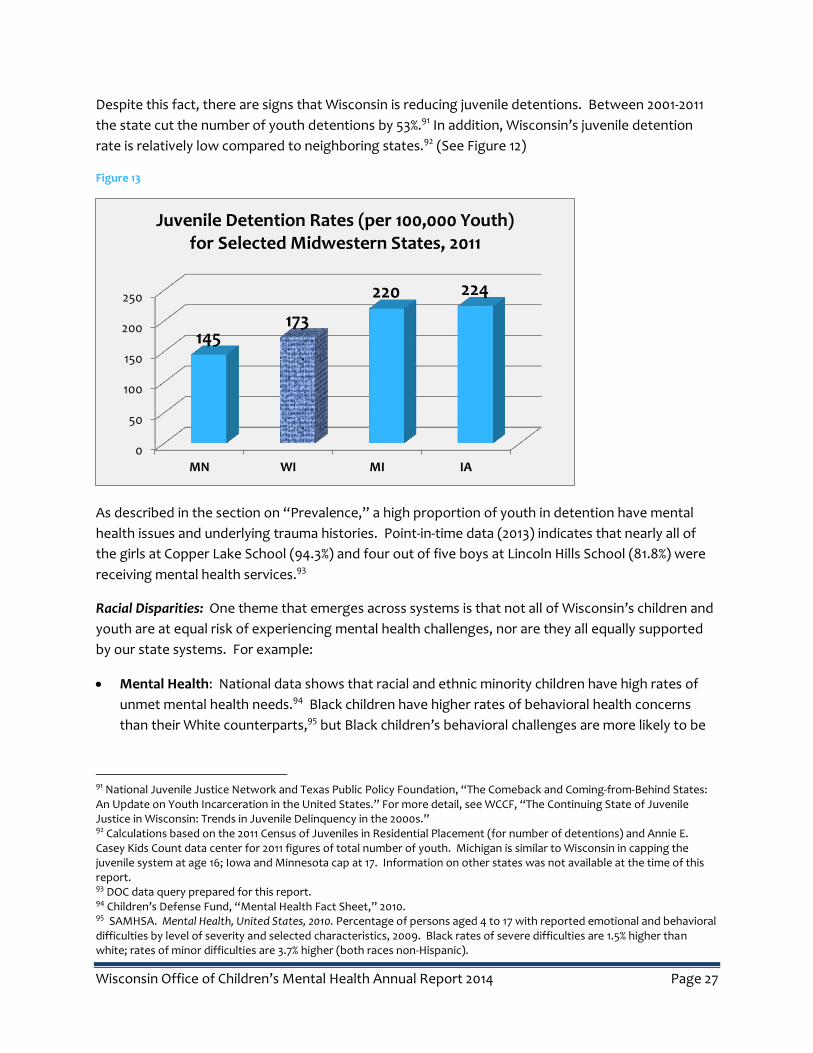
Despite this fact, there are signs that Wisconsin is reducing juvenile detentions. Between 2001-2011
the state cut the number of youth detentions by 53%.91 In addition, Wisconsin’s juvenile detention
rate is relatively low compared to neighboring states.92 (See Figure 12)
Figure 13
As described in the section on “Prevalence,” a high proportion of youth in detention have mental
health issues and underlying trauma histories. Point-in-time data (2013) indicates that nearly all of
the girls at Copper Lake School (94.3%) and four out of five boys at Lincoln Hills School (81.8%) were
receiving mental health services.93
Racial Disparities: One theme that emerges across systems is that not all of Wisconsin’s children and
youth are at equal risk of experiencing mental health challenges, nor are they all equally supported
by our state systems. For example:
Mental Health: National data shows that racial and ethnic minority children have high rates of
unmet mental health needs.94 Black children have higher rates of behavioral health concerns
than their White counterparts,95 but Black children’s behavioral challenges are more likely to be
91 National Juvenile Justice Network and Texas Public Policy Foundation, “The Comeback and Coming-from-Behind States: An Update on Youth Incarceration in the United States.” For more detail, see WCCF, “The Continuing State of Juvenile Justice in Wisconsin: Trends in Juvenile Delinquency in the 2000s.” 92 Calculations based on the 2011 Census of Juveniles in Residential Placement (for number of detentions) and Annie E. Casey Kids Count data center for 2011 figures of total number of youth. Michigan is similar to Wisconsin in capping the juvenile system at age 16; Iowa and Minnesota cap at 17. Information on other states was not available at the time of this report. 93 DOC data query prepared for this report. 94 Children’s Defense Fund, “Mental Health Fact Sheet,” 2010. 95 SAMHSA. Mental Health, United States, 2010. Percentage of persons aged 4 to 17 with reported emotional and behavioral difficulties by level of severity and selected characteristics, 2009. Black rates of severe difficulties are 1.5% higher than white; rates of minor difficulties are 3.7% higher (both races non-Hispanic).
0
50
100
150
200
250
MN WI MI IA
145 173
220 224
Juvenile Detention Rates (per 100,000 Youth) for Selected Midwestern States, 2011

Wisconsin Office of Children’s Mental Health Annual Report 2014 Page 28
routed to the juvenile justice system than the mental health system.96 Nationally nearly nine out
of ten Latina/0 youth (88%) with mental health needs do not receive services.97
Toxic Stress: Surveys of Wisconsin adults show that Black Wisconsin residents are more likely
than their White counterparts to have experienced ACEs.98 Presumably today’s children are also
experiencing differential exposure by race.
Suicidality: Students of color were at increased risk of attempting suicide. Hispanic or Latino
students were 2.6 times more likely than their white peers to report that they attempted
suicide.99 Black students were close to four times more likely than White students to attempt
suicide (16.2% versus 4.3%) and one in six Black high school respondents (16.2%) reported that
they had attempted suicide in the past year.100 This makes Wisconsin’s Black suicide attempt rate
82% higher than the national average (16.2% versus 8.8%).101
Child Welfare: Wisconsin’s minority children are over-represented in foster care and residential
facilities. While the majority of these children are White (55% in 2012), White children are under-
represented in the system relative to their proportion in the state overall. Race-specific rates of
out-of-home care show that American Indian children are at the highest risk of being placed in
foster care (24.6 per 1,000 children) and are almost seven times more likely to be in out-of-home
care than their White peers (24.6 versus 3.6 per 1,000). Black children are also placed out-of--
home at high rates; at almost 20 children/youth placed per 1,000, they are more than six times
more likely to be placed outside the home than their white peers.102 (See Figure 14)
96 The Children’s Defense Fund Mental Health Fact Sheet, March 2010. 97 Ibid. 98 Children’s Trust Fund and Children’s Hospital of Wisconsin, “Wisconsin ACE Brief: 2011 and 2012 Data”, p. 3-4. 99 11.3% vs. 4.3% in 2013 YRBS. Differences are statistically significant. Both Black and Hispanic/Latino youth were also more likely to report that their attempts led to injuries treated in the hospital. 100 CDC Youth Online High School YRBS results. 101YRBS data comparing Wisconsin to national average. 2013. Available at CDC Youth Online YRBS. The difference is statistically significant (p=0.05) as is the difference in black suicide attempts resulting in injuries (8.0% WI vs. 2.7% nationally). 102 Placement data based on unduplicated child counts, DCF’s 2012, “Annual Report on Out-of-Home Care.” Overall number of children in each racial group based on 2012 Wisconsin figures from Annie E. Casey Kids Count Data Center.
3.6
19.9 24.6
1.8 4.4
0.0
10.0
20.0
30.0
White Black American Indian Asian Latino/Hispanic
Rate of Out-of-Home Care Placement by Race (per 1,000 Children), 2012
Figure 14

Wisconsin Office of Children’s Mental Health Annual Report 2014 Page 29
Juvenile Detention and Arrest: While Wisconsin’s population remains overwhelmingly White and
non-Hispanic, the majority (60%) of juvenile detentions in 2013 were youth of color. Overall,
almost half of the juvenile detentions in 2013 (47%) were Black youth. There are more
pronounced differences when we look at the race-specific rates of detentions (i.e., number of
detentions of White youth/age-adjusted number of White youth in Wisconsin): the juvenile
detention rate for Wisconsin’s White youth is 7.0 per 1,000 youth (ages 10-16),103 whereas for
American Indians it is 33.6 per 1,000 and for Black youth it is 67.5 per 1,000.104 (See Figure 15)
Figure 15
When comparing disparities in arrests that lead to detentions, it is evident that racial disparities
become larger the farther along one moves into the juvenile corrections system. For instance,
Wisconsin Black youth are approximately four times more likely to be arrested than White
youth,105 yet the detention rates outlined above show that they are nearly ten times more likely
than White youth to be detained (67.5 vs. 7.0 per 1,000, or 9.6 times).106 At the most secure
facilities (DOC’s two juvenile institutions) almost seven out of ten young people were Black.107 It
can be assumed that once arrested, White youth are more likely to be filtered out of the juvenile
103 In Wisconsin youth can be detained or committed in the juvenile system if they are 10-16 years old. 104 These detention rates are based on the number of detentions, not the unduplicated number of youth detained which were unavailable at the time of publication. The rates were calculated based on all 10 to 16 year olds in each racial or ethnic category in 2013. Source: National Center for Health Statistics Vintage 2013 Bridged-Race Postcensal Population Estimates. Racial/ethnic categories are based on those used by the Juvenile Secure Detention Registry. All categories except “Hispanic” are presumed to be non-Hispanic in ethnicity. 105 Lecoanet et al., “Disproportionate Minority Contact in Wisconsin’s Juvenile Justice System.” UW Population Health Institute, September 2014. 106 Based on the total number of admissions to county detention centers and DJC facilities in 2013. Source: Juvenile Secure Detention Registry. 107 69% of newly committed juveniles at Lincoln Hills and Copper Lake in 2013. Source: Division of Juvenile Corrections 2013 Annual Report, p. 3.
White Black Am Indian Asian Hispanic
7.0
67.5
33.6
3.2
11.3
Rates of Juvenile Detention by Race (per 1,000 youth ages 10-16), 2013

Wisconsin Office of Children’s Mental Health Annual Report 2014 Page 30
corrections system, while Black and American Indian youth are more likely to be filtered in.108
This mirrors disparities in Wisconsin’s adult correctional system and, in line with Wisconsin’s adult
correctional population, national data shows that Wisconsin’s disparities for juvenile justice are
the worst in the nation.109 (See Figure 16)
Figure 16
School Suspensions: Looking generally at school suspensions without regard to disability status,
more than one in five Black students were suspended in 2013 (21.32%). This was more than nine
times the suspension rate for their White peers (2.26%). (Nationally the disparity is three times
higher.)110 American Indian students were suspended at just over three times the rate of White
students (7.09%) and Hispanic/Latino students were twice as likely as their non-Hispanic White
peers to be suspended (4.89%).111
108 This is in line with national inequities. See e.g. NAACP Criminal Justice Fact Sheet. One question that arises is whether this difference can be explained based on the severity of the offense. Raw data is not currently available to perform this analysis. However, a strong research literature on adult corrections consistently shows differences in sentencing across racial lines. See e.g. The Sentencing Project “Racial Disparity in Sentencing: A Review of the Literature,” January 2005. 109 The W. Haywood Burns Institute for Juvenile Justice Fairness & Equity. “Unbalanced Juvenile Justice”. Map available at http://data.burnsinstitute.org/#comparison=2&placement=1&races=2,3,4,5,6&offenses=5,2,8,1,9,11,10&year=2011&view=map. Based on 2011 data. 110 U.S. Dept. of Education Office for Civil Rights, “Data Snapshot: School Discipline.” Issue Brief No. 1, March 2014. 111 DPI WiseDash online data dashboard. “What percentage of students were suspended or expelled?” View by Race/Ethnicity.
Wisconsin
Minnesota
Ohio
Michigan
Iowa
Illinois
United States
Indiana
7.5
6.2
4.4
4.2
3.6
3
2.8
2.2
Juvenile Incarceration Disparity Rates for Midwest and U.S. Average, 2011

Wisconsin Office of Children’s Mental Health Annual Report 2014 Page 31
INDICATORS OF SYSTEM IMPROVEMENT
While this information is a clear call to action, there are also reasons for hope. Across Wisconsin,
there are many emerging positive trends that include the following:
Expansion of the number of Coordinated Service Teams (CST) and Comprehensive Community Services (CCS) available to children with mental health challenges,
Low levels of repeat maltreatment for families who come to the attention of the child welfare system,112
Declining levels of depression and suicide attempts among high school students,113
Reductions in the number of children suspended or expelled from school,114
Wisconsin’s dropout rate for students with disabilities is approximately half the rate for other states making Wisconsin the 10th lowest dropout rate of the 43 states reporting,115
Reductions in the rates of juvenile arrests and detentions.116
In addition, we see many other promising developments, such as:
DHS’s expansion of CCS will increase access to supportive services that may lead to reduced hospitalizations,
DPI’s efforts to re-shape the school environment through interventions such as Positive Behavioral Interventions and Support (PBIS) and Response to Intervention (RTI) may reduce the use of seclusion and restraint and expulsions,
DOC/DJC, along with their county partners, have been nationally recognized for enacting policies that have reduced youth detentions without prompting an increase in youth crime; 117 DOC/DJC has also created an innovative residential facility called the GROW Academy,
DCF has set performance goals to help reduce out-of-home care and improve other outcomes for children at risk,
DHS/DCF jointly established a specialized medical program, Care4Kids, to provide comprehensive physical, behavioral, and dental health services to foster children in ways that meet their unique needs and to recognize the trauma they have experienced.
Another sign of hope is the growing recognition that early childhood relationships and experiences
matter. Examples include the Family Foundations Home Visiting Program, the Pyramid Model for
Social and Emotional Competence, University of Wisconsin’s Infant Mental Health certification,
YoungStar, statewide 4K, Wisconsin Healthiest Family Initiative and the 2014 Legislative Council
Steering Committee for Supporting Healthy Early Brain Development.
112 DCF, “Kidstat Performance Report: January-June 2014,” p.12. 113 DPI, 2013 YRBS Executive Summary, p. 5. Examines trends from 1993-2013. 114 Wisconsin DPI WiseDash. 115 Wisconsin and 42 other states similarly calculated dropout rates. Wisconsin’s dropout rate for students with disabilities was 2.46%, vs. a mean of 5.7% and a median of 4.4% for states reporting this calculation. National Dropout Prevention Center for Students with Disabilities, “An Analysis of States’ FFY 2011 Annual Performance Report Data for Indicator B2 (Dropout).” Prepared for the U.S. Department of Education Office of Special Education Programs, July 2013, p.3. 116 WCCF, “The Continuing State of Juvenile Justice in Wisconsin: Trends in Juvenile Delinquency in the 2000s.” 117 The National Juvenile Justice Network and Texas Public Policy Foundation. “The Comeback and Coming-From Behind States: An Update on Youth Incarceration in the United States,” n.d.

Wisconsin Office of Children’s Mental Health Annual Report 2014 Page 32
Emerging Issues
While the Common Agenda (See Collective Impact, p. 12) will provide OCMH’s primary focus over the
next year, several issues have emerged that will be included in the OCMH’s list of partnership
activities.
SCHOOL-BASED MENTAL HEALTH
School-based mental health is viewed by many as a solution to many of the barriers facing children
and families seeking mental health services. As of July 2014, 57 school districts (out of 424) had
satellite clinics and 40 additional organizations had applied for DHS certification. Because successful
implementation of this model is contingent on the supportive qualities of the school culture,
advocates stress the need for a tandem approach by strengthening Tier One and Tier Two of Positive
Behavior Intervention and Supports118 and increasing the schools’ commitment to trauma
sensitivity.119
Currently, the Safe Schools/Healthy Students state management team and several other coalitions
are working to develop a statewide infrastructure for the promotion and support of school-based
mental health. Discussion among these groups and other interested parties include the challenges of
finding funding for crucial teacher / parent consultation to ensure that skill development is
reinforced in home and classroom environments; as well as the need for connection with community
services and other psychosocial rehabilitative services.
PARENT PEER SPECIALISTS
For years, DHS/DMHSAS has promoted using “peer specialists” an evidence-based practice and a key
piece of a recovery-oriented mental health system. More recently, DMHSAS has initiated the
development of a statewide infrastructure to certify Parent Peer Specialists (PPSs).
PPSs are parents or caregivers of children with mental, emotional, or behavioral issues specifically
trained to assist other parents by providing information, resources and support. In other states,
PPSs work in a variety of settings, including family network organizations, crisis stabilization units,
schools, social services agencies, and other mental health settings. Reported outcomes include
parents who feel less alone, are able to see hope for the future, see family strengths and experience
an increase in their ability to deal with stress.120 DHS also plans to further develop the state’s
certification and support infrastructure for youth (ages 18-26) wishing to serve as Peer Specialists.
118 http://rti.dpi.wi.gov/rti_pbis. 119 http://sspw.dpi.wi.gov/sspw_mhtrauma. 120 Centers for Medicare & Medicaid Services Memo, August 15, 2007.
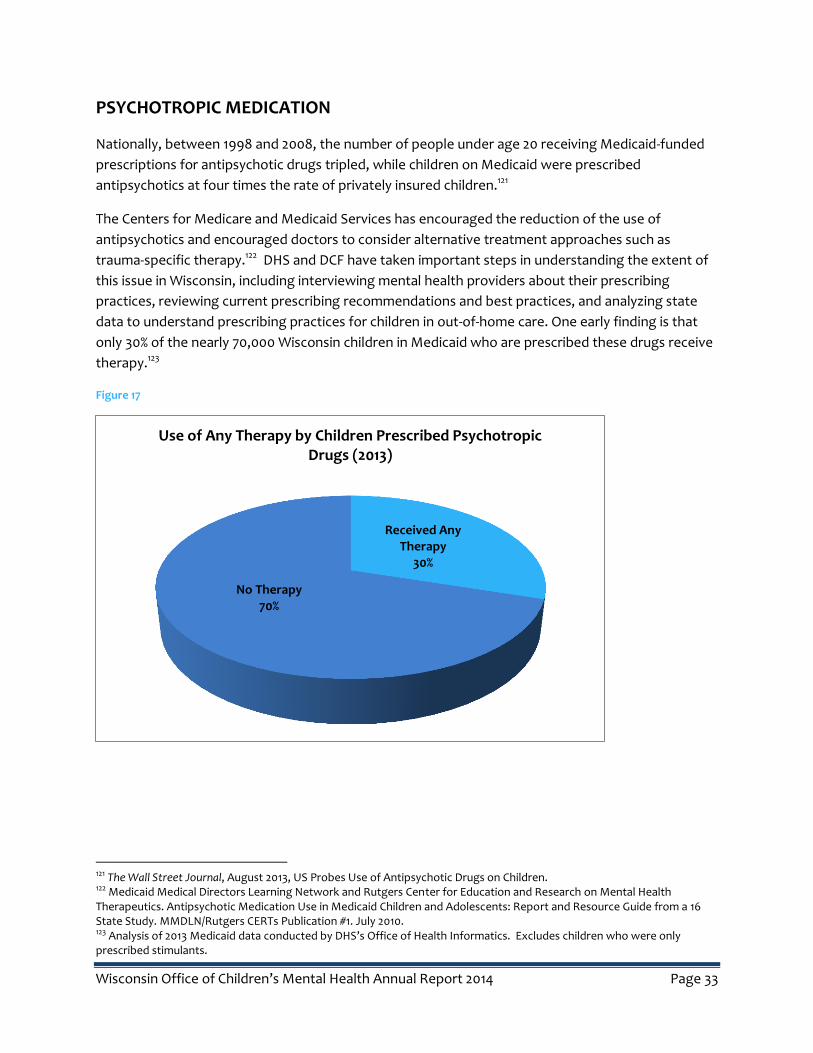
Wisconsin Office of Children’s Mental Health Annual Report 2014 Page 33
PSYCHOTROPIC MEDICATION
Nationally, between 1998 and 2008, the number of people under age 20 receiving Medicaid-funded
prescriptions for antipsychotic drugs tripled, while children on Medicaid were prescribed
antipsychotics at four times the rate of privately insured children.121
The Centers for Medicare and Medicaid Services has encouraged the reduction of the use of
antipsychotics and encouraged doctors to consider alternative treatment approaches such as
trauma-specific therapy.122 DHS and DCF have taken important steps in understanding the extent of
this issue in Wisconsin, including interviewing mental health providers about their prescribing
practices, reviewing current prescribing recommendations and best practices, and analyzing state
data to understand prescribing practices for children in out-of-home care. One early finding is that
only 30% of the nearly 70,000 Wisconsin children in Medicaid who are prescribed these drugs receive
therapy.123
Figure 17
121 The Wall Street Journal, August 2013, US Probes Use of Antipsychotic Drugs on Children. 122 Medicaid Medical Directors Learning Network and Rutgers Center for Education and Research on Mental Health Therapeutics. Antipsychotic Medication Use in Medicaid Children and Adolescents: Report and Resource Guide from a 16 State Study. MMDLN/Rutgers CERTs Publication #1. July 2010. 123 Analysis of 2013 Medicaid data conducted by DHS’s Office of Health Informatics. Excludes children who were only prescribed stimulants.
Received Any Therapy
30%
No Therapy 70%
Use of Any Therapy by Children Prescribed Psychotropic Drugs (2013)

Wisconsin Office of Children’s Mental Health Annual Report 2014 Page 34
YOUTH PSYCHIATRIC HOSPITALIZATION
While our service landscape shows that Wisconsin has a variety of programs geared towards
prevention and early intervention, there is still a need to intervene earlier to reduce the use of
hospitals, foster care, and juvenile detention. This strategy not only prevents hardship but also
promises a reduction in costs over the course of a lifetime. (See Figure 18)
DHS recently convened a workgroup including the OCMH, DCF, provider organizations and county
representatives to examine the high rate of youth psychiatric hospitalizations and make
recommendations about how best to intervene earlier to reduce admissions. Additionally, DHS
recently awarded a second set of five-year county crisis intervention grants with an emphasis on
serving youth. OCMH will work with these and other partners to continue to address this issue in
2015.
Figure 18
Adapted from the work of Bruce Perry,
Child Trauma Academy
Next Steps
The OCMH 2015 agenda includes the following:
INNOVATE
Support state agencies in incorporating the voices of lived experience in policy development and
systems’ change initiatives.
Promote greater understanding among stakeholders of the role of adversity and toxic stress in
understanding social and emotional development.
INTEGRATE
Within the context of Collective Impact…
Create a common agenda for systems change across state agencies.
Identify shared measures of system performance to track progress towards the common
agenda.
Establish plans for data standardization and integration to better understand service availability
and outcomes.
IMPROVE
Identify the factors underlying Wisconsin’s high rates of youth psychiatric hospitalizations and
bring stakeholders together who can help propose solutions.
Develop an understanding of mental health services within counties and tribes.
Begin cross-system action steps to address racial disproportionality.
Inform legislators of the strengths, weaknesses, opportunities and impediments to system
improvement.
Wisconsin Office of Children’s Mental Health Annual Report 2014 Page 36
Conclusion
Much of the information in this report is not new. NAMI last graded states in 2009, at which time
Wisconsin received a “C” overall and “D”s in both Health Promotion and Measurement and
Community Integration and Social Inclusion while doing better (“B”) in Financing and Core
Treatment and Recovery Services. The good news is that since that time, Wisconsin has established
more services for both adults and children.
In 2009, a report authored by Disability Rights Wisconsin, Wisconsin FACETS and Wisconsin Family
Ties124 exposed the problem of seclusion and/or restraint of children in schools, residential treatment
facilities, and hospitals. This joint report spurred legislation requiring the documentation of these
practices. Other recommendations made in the report, such as making schools more trauma-
informed and making greater use of Positive Behavioral Interventions and Supports, are currently
underway in much of the state.
In 2012 the Johnson Foundation brought to light the
relatively low rate of Wisconsin’s children’s public mental
health services, the high rates of suspensions and drop-outs
for children with mental health issues, and the overall social
costs of non-treatment or insufficient treatment.125 That
report recommended more emphasis on prevention and
early intervention, as well as expanded treatment options.
The OCMH believes that the collective understanding of the
challenges facing Wisconsin’s children and families has
reached a tipping point. Let this report serve as one of the
many sparks leading to a ‘wildfire’ representing our
children’s brighter future.
124 “Out of Darkness Into the Light: New Approaches to Reducing the Use of Seclusion and Restraint with Wisconsin Children,” Spring 2009. 125 The Johnson Foundation at Wingspread. “Top of Mind: Children’s Mental Health in Racine.”
“The tipping point is that
magic moment when an
idea, trend, or social
behavior crosses a threshold,
tips, and spreads like
wildfire.”
Malcolm Gladwell, author of
The Tipping Point

Wisconsin Office of Children’s Mental Health Annual Report 2014 Page 37
Appendices
APPENDIX A: 2013 WISCONSIN DEMOGRAPHICS
Race and Ethnicity: Data is based on all children or youth under age 18. Source is the Annie E. Casey
Kids Count Data Center (based on the U.S. Census). All categories are non-Hispanic in ethnicity,
unless otherwise noted.
2013 Child Population By Race
Race/Ethnicity Number Percentage
White 946,337 72%
Black 112,999 9%
American Indian 13,898 1%
Asian American 42,895 3%
Native Hawaiian and Other Pacific Islander 417 <0%
Two or more races 46,722 4%
Hispanic or Latino 144,508 11%
Total < 18 1,307,776 100%
Age: From 2013 U.S. Census Bureau Figures
22.8% of the state is under 18 (versus 23.3% nationally)
6.0% of the state is under 5 (versus 6.3% nationally)
Tribal Data: One notable absence from this report is missing data related to the social and emotional
health of American Indian children. The current report is based on data submitted to the state by
counties. Due to their status as sovereign nations, tribes have a separate reporting process. The
OCMH is aware that, due to recent and historical misuse of data, data collection and reporting is a
sensitive issue for many tribes. In the future, the OCMH will strive for ways to represent the
experiences of tribal children and youth while respecting tribes’ preferences with regard to data
reporting.

Wisconsin Office of Children’s Mental Health Annual Report 2014 Page 38
Appendix B: Wisconsin Child Service Landscape.
Larger copy available upon request: [email protected]
Note: Larger copies available upon request

Wisconsin Office of Children’s Mental Health Annual Report 2014 Page 39
Glossary
ACEs or Adverse Childhood Experiences are some of the most intensive and frequently occurring
sources of stress that children may suffer early in life. These experiences include physical, sexual and
emotional abuse; neglect; violence between parents of caregivers; alcohol and substance abuse;
mental health issues for caregivers; incarceration of a household member; divorce; and peer and
community violence.
ACE Interface is a company dedicated to disseminating educational products, providing consultation
about ACEs, developmental neurobiology, resilience and community empowerment.
Alianza Latina Aplicando Soluciones (ALAS) is a non-profit organization providing educational
workshops, parent support groups, family events, community building activities, and service referrals
for families with children and youth with diverse abilities in Wisconsin.
Behavioral Risk Factor Survey is an annual telephone survey of state residents 18 and older that
collects data on behavioral health risk factors associated with the leading causes of premature
mortality and morbidity among adults. This survey is carried out in conjunction with the U.S. Centers
for Disease Control and Prevention (CDC). Youth Risk Behavior Survey is an epidemiologic survey
system established by CDC to monitor the prevalence of youth behavior that most influences
health. Youth Risk Behavior Survey monitors six types of health risk behaviors that contribute to the
leading cause of death and disability among youth and adults. The behaviors monitored include
weapons and violence; suicide; tobacco use; alcohol and other drug use; traffic safety; sexual
behavior; diet; nutrition; and exercise. The survey is administered to high school students in the
public school system.
Children refer to individuals under the age of 18 years.
Comprehensive Community Services (CCS) is a locally administered Medicaid program for persons
with mental health and/or substance-use disorders that provide a flexible array of individualized,
community-based, psychosocial rehabilitation services.
Coordinated Services Teams (CST) are wraparound models of care for children with behavioral
health issues. The model is targeted to children and families involved in two or more systems of care
who have complex needs.
DCF is the Wisconsin Department of Children and Families.
DHS is the Wisconsin Department of Health Services.
Disproportionality is the overrepresentation of a group of people in a program or system.
DOC is the Wisconsin Department of Corrections.

Wisconsin Office of Children’s Mental Health Annual Report 2014 Page 40
DPI is the Wisconsin Department of Public Instruction (Education).
Emotional Behavioral Disability (EBD) is an official designation used by schools for children with
mental, emotional, social, and behavioral challenges.
Family Foundations Home Visiting Program is a joint effort between DCF and DHS aimed at
improving outcomes for children born into at-risk communities and reducing incidents of child
maltreatment through evidence based home visiting programs. It is currently available in 15 counties
and four tribal communities.
Fostering Futures is a project aimed at developing a statewide, interdisciplinary approach to
integrate evidence about adverse childhood experiences and the benefit of resiliency and trauma-
informed care into the state and local systems of care that impact Wisconsin children and families,
especially those involved in the child welfare system.
4 year old kindergarten (4K) is a kindergarten program for children who have reached the age of 4
by September 1. Wisconsin is a leading state in the provision of universally available four-year-old
kindergarten programs. Of the 424 school districts in the state, 386 offered 4 year old kindergarten
in the 2013- 2014 school year.
IEP is an individualized education plan. Such plans are required for children in Special Education.
Therefore, noting that a child has an IEP implies that she or he is engaged in Special Education
services.
Mental health is “a state of well-being in which the individual realizes his or her own abilities, can
cope with the normal stresses of life, can work productively and fruitfully, and is able to make a
contribution to his or her community.”126
Mental health recovery model emphasizes recovery as a personal journey rather than a set outcome.
It may involve developing hope, a secure base and sense of self, supportive relationships,
empowerment, social inclusion, coping skills and meaning.
National Alliance on Mental Illness (NAMI) is an organization dedicated to promoting recovery and
improving the quality of life of people and families affected by mental health challenges.
Neurological architecture of the human brain is constructed through an ongoing process that begins
before birth and continues into adulthood. Early experiences literally shape how the brain is built; a
strong foundation in the early years increases the probability of positive outcomes, while a weak
foundation increases the odds of later difficulties
Parent Peer Specialist (PPS) is a parent or caregiver of children with mental, emotional, or behavioral
issues specifically trained to support other parents by providing information, resources and support.
126 World Health Organization. Strengthening Mental Health Promotion. Geneva, World Health Organization (Fact sheet no. 220), 2001.

Wisconsin Office of Children’s Mental Health Annual Report 2014 Page 41
Positive Behavioral Intervention and Supports (PBIS) is a systemic approach to proactive, school-
wide behavior based on teaching what behaviors are expected, practicing those behaviors and
providing positive reinforcement when the behaviors are displayed.
Public health is the science of taking a population-based approach to preventing disease and
promoting health. This model considers human factors, characteristics of the source of harm, and
the environment, identifying causes and suggesting possible ways to intervene.
Pyramid Model for Social and Emotional Competence is a framework that promotes healthy social
and emotional development in child care settings by creating engaging environments, providing
concrete teaching strategies, and if/when needed creating individualized interventions for children.
Resilience is the ability to bounce back despite challenging or threatening circumstances.127
Severe Emotional Disturbance (SED) is a mental health challenge that severely disrupts a child’s or
adolescent’s daily life and functioning at home, at school, or in the community.
Social and emotional wellbeing are those skills, capacities, and characteristics that enable young
people to understand and navigate their world in healthy, positive ways. It includes how children
engage in relationships, cope with challenges, handle responsibilities, and manage and express
emotions.
Stakeholders are partners or collaborators that have an interest or investment in a common goal.
State agencies are Wisconsin agencies with a statewide presence. Those frequently referenced in
this report include the Department of Health Services (DHS), the Department of Children and
Families (DCF), the Department of Public Instruction (DPI) and the Department of Corrections (DOC).
Stress (Positive, Tolerable and Toxic) Positive stress is moderate and short-lived increase in heart
rate or mild changes in stress hormones that occur in the context of stable and supportive
relationships. Positive stress is regarded as an important and necessary aspect of healthy
development. Tolerable stress is severe enough to disrupt brain architecture if unchecked, but is
frequently buffered by supportive relationships that facilitate adaptive coping and mitigate the
damaging effects. Toxic stress is caused by exposure to excessive adversity such as abuse, neglect,
or exposure to violence and instability. Toxic stress leads to “strong, unrelieved activation of the
body’s stress management system” and raises the risk of a host of physical and mental health
problems.128
Substance Abuse and Mental Health Services Administration (SAMHSA) is the agency within the
U.S. Department of Health and Human Services that leads efforts to reduce the impact of substance
abuse and mental health concerns on communities.
127 The Children’s Charity, “Literature Review: Resilience in Children and Young People. June 2007. 128 Center for the Developing Child, Harvard.

Wisconsin Office of Children’s Mental Health Annual Report 2014 Page 42
Trauma-informed care is a framework which integrates knowledge about the prevalence and impact
of adversity, toxic stress and trauma in reshaping interpersonal interactions, organizational
operations and community activities.
Trauma Project is an initiative led by DCF that trains mental health therapists in Trauma Focused-
Cognitive Behavioral therapy, provides a 16 hour workshop for parents, resource parents, child
welfare workers and juvenile justice workers in caring for children who have experienced trauma and
community trainings on trauma-informed care.
University of Wisconsin’s Infant, Early Childhood, and Family Mental Health Capstone Certificate
Program is an intensive, interdisciplinary program for practicing professionals who work with
families in the prenatal and postpartum periods and with children ages birth through five years. The
program is informed by theory and current empirical knowledge from developmental, neuroscience
and attachment research.
Wisconsin Council on Children and Families is a private, non-profit, non-partisan organization
providing research, policy analysis, public education and advocacy on issues effecting children and
their families in the areas of health, economic security, safety and education.
Wisconsin Family Assistance Center for Education, Training and Support (Wisconsin FACETS) is a
statewide non-profit organization, dedicated to helping families understand the special education
laws and systems.
Wisconsin Family Ties (WFT) is a family run, statewide, non-profit organization supporting families
that include children and adolescents with social, emotional and behavioral challenges.
Wisconsin Healthiest Families Initiative (WHFI) focuses on networks of services addressing family
supports, child development, mental health and safety and injury prevention. Local public health
departments’ work with community partners to build an integrated system that promotes optimal
physical, social-emotional, and developmental health of children and their families.
Wraparound is a nationally recognized approach to mental health service delivery that seeks to bring
different systems involved in a child’s life to the table when planning and evaluating that child’s
services. In Wisconsin, the wraparound philosophy is at the heart of at least three programs:
Wraparound Milwaukee, Children Come First (Dane County), and Coordinated Service Teams.
YoungStar is Wisconsin’s child care quality rating and improvement system. YoungStar sets a rating
from one to five stars based on education, learning environment, business practices and the well-
being of children.


