Office of Geographic Information Systems Print this Page Summer 2007 - Department Spotlight: Using CarteGraph in the City of Rosemount by Mike Kasel, GIS Coordinator, City of Rosemount As a sign of major dedication to customer service, the City of Rosemount decided in 2005 to implement an asset management program. The City was looking for an affordable asset management software package that stored all the important information the City wanted to track, and had the flexibility to change with a growing city. This software solution was also required to have advanced reporting and mapping capabilities to display the data collected in a usable format for decision support. In April of 2006 the City chose CarteGraph as their asset management software. After several months of training and data transitioning, it was rolled out for use in late July 2006. Key uses of CarteGraph include: Tracking citizen calls from the time they are received to the time the issues are resolved Tracking costs for projects such as snowplowing, street sweeping, etc. Proactively scheduling recurring tasks such as building inspections, well house inspections, boulevard tree trimming, hydrant flushing, etc. Tracking the resources used on day-to-day tasks such as pothole repair, ice rink maintenance, mowing, water sampling, fleet maintenance, etc. Linking to our GIS database to create live visual representations of useful data The City of Rosemount’s sanitary sewer maintenance program is an example of using GIS and CarteGraph together to effectively manage an asset. The City cleans approximately 1/3 of its 68 miles of sanitary sewer annually. Before implementing CarteGraph’s SEWERview module, the geographic data and the annual cleaning history for the City’s sanitary sewer were maintained in two separate and incompatible databases. After linking these two databases, users can now manage data for one asset in either application. The City also took the initiative to bring the sanitary sewer maintenance program into the field by using mobile technologies. The improvements CarteGraph has brought to the sanitary sewer maintenance program have increased efficiency and reduced errors. Since its implementation, the City of Rosemount has seen significant benefits in the areas of citizen issue resolution, project scheduling and tracking, and data management and recovery. Although the City is still in the “infant” stages of use, we are confident that we will realize a significant return on our investment for years to come. Copyright 2006 Dakota County, Minnesota
Transcript
Office of Geographic Information Systems Print this Page
Summer 2007 - Department Spotlight: Using CarteGraph in the City of Rosemountby Mike Kasel, GIS Coordinator, City of Rosemount
As a sign of major dedication to customer service, the City of Rosemount decided in 2005 to implement an assetmanagement program. The City was looking for an affordable asset management software package that stored allthe important information the City wanted to track, and had the flexibility to change with a growing city. Thissoftware solution was also required to have advanced reporting and mapping capabilities to display the datacollected in a usable format for decision support.
In April of 2006 the City chose CarteGraph as their asset management software. After several months of trainingand data transitioning, it was rolled out for use in late July 2006. Key uses of CarteGraph include:
Tracking citizen calls from the time they are received to the time the issues are resolvedTracking costs for projects such as snowplowing, street sweeping, etc.Proactively scheduling recurring tasks such as building inspections, well house inspections, boulevard treetrimming, hydrant flushing, etc.Tracking the resources used on day-to-daytasks such as pothole repair, ice rinkmaintenance, mowing, water sampling, fleetmaintenance, etc.Linking to our GIS database to create live visualrepresentations of useful data
The City of Rosemount’s sanitary sewer maintenanceprogram is an example of using GIS and CarteGraphtogether to effectively manage an asset. The Citycleans approximately 1/3 of its 68 miles of sanitarysewer annually. Before implementing CarteGraph’s SEWERview module, the geographic data and the annualcleaning history for the City’s sanitary sewer were maintained in two separate and incompatible databases. After
linking these two databases, users can now manage data for one assetin either application. The City also took the initiative to bring thesanitary sewer maintenance program into the field by using mobiletechnologies. The improvements CarteGraph has brought to the sanitarysewer maintenance program have increased efficiency and reducederrors.
Since its implementation, the City of Rosemount has seen significantbenefits in the areas of citizen issue resolution, project scheduling andtracking, and data management and recovery. Although the City is stillin the “infant” stages of use, we are confident that we will realize asignificant return on our investment for years to come.
Copyright 2006 Dakota County, Minnesota
Office of Geographic Information Systems Print this Page
Summer 2007 - Desktop GIS: Announcing GeoMoose!by Randy Knippel
Web mapping applications have been around for over 10 years and are becoming commonplace for majormetropolitan areas. Citizens expect that they can see maps online with links to information about property, parks,lakes, and road construction.. However, providing this capability has required a significant investment in softwareand time making it rather exclusive to larger cities and counties. GeoMoose is changing that by making open-source web mapping software available to everyone at no cost. Any city, county, or other governmental unit cancreate interactive mapping applications for their website or simply to put basic GIS capabilities on the desktop ofanyone in their organization.
GeoMoose was created by the City of St. Paul and enhanced by the OpenMNND Project, a collaborative effortinvolving agencies in Minnesota and North Dakota funded by an FGDC grant. OpenMNND focused GeoMoose onlocal government needs and packaged it so can be easily downloaded, configured, and deployed using basic webpublishing skills. No programming is required. Based on open standards and open-source software, entireapplications can be built without having to purchase any software.
GeoMoose is designed around a services-oriented architecture, which means it can use other web servers on theInternet and distributed application components on your own servers. Map layers can come directly from webmapping services published by a variety of government agencies or by accessing your own data using MapServer.This minimizes the need to copy and process large volumes of data. Other web-based information services can beaccessed to integrate associated systems dynamically based on user interaction with the application. As aresult, GIS applications can be provided on most servers or workstations without requiring special performancecapabilities, disk space, or database software.
MapServer is a stable, open-source web mapping server engine originally developed over 10 years ago at theUniversity of Minnesota and in use worldwide today. MapServer has rich cartographic capabilities and understandsall the common GIS data formats. With GeoMoose you can use MapServer to group data as you wish into singlelayers that can be turned on and off interactively or automatically using display scale thresholds.
Applications can be created without any programming by simply changing options in 3 configuration files. Theycan be configured to link directly to other websites based on identified features, locations, or graphics drawn in themap display. Tools can be defined to capture the coordinates of the cursor in the map and send them to a URL.This allows external services to be integrated with GeoMoose, like accessing data associated with a feature onthe map or displaying bird’s eye imagery from Microsoft’s Virtual Earth. In this way, existing web-basedapplications and databases can be accessed directly without the need to copy data or duplicate their capabilitiesin a mapping application.
GeoMoose was written in JavaScript so it runs directly in a web browser and has no special web serverrequirements. It also uses standards like cascading style sheets (CSS) and extended markup language (XML) soit can be easily configured and customized. MapServer can run in multiple operating systems and supports allcommon vector and raster data formats. It also provides commonly expected cartographic capabilities likesophisticated annotation and symbolization.
Now, anyone can create web mapping applications. They don’t require sophisticated hardware or software. Thismakes them practical for smaller cities and counties that may find it difficult to justify the expense required byother options. It means that other government agencies can easily justify providing interactive mappingapplications to their constituents in support of their business. It also means that any governmental unit can usethe same techniques for creating internal applications, putting interactive GIS in the hands of anyone in theirorganization. With barriers removed, these applications will become more prevalent. As that happens, users ofthose applications will experience greater consistency between applications deployed by multiple agencies and allwill benefit by creating a thriving community to continue the collaborative model of working together to add evenmore capabilities and share application components.
Go to the GeoMoose project website at http://www.geomoose.org/moose/ to try the demonstration applicationsand learn more about how to build your own web mapping applications.
Office of Geographic Information Systems Print this Page
Summer 2007 - GIS 101: The Basics of Aerial Imageryby Todd Lusk
Few would probably argue that the old adage, “A picture is worth a thousand words,” applies not only to traditionalphotography but to aerial imagery as well. Being able to see what is actually on the ground proves to be invaluablewhen trying to explain what is going on in the “real world”. Whether planning a new street signal, planning fora development or looking at tree cover, seeing aerial images as a backdrop is extremely valuable. How is all ofthis imagery captured? Are there any differences in how the imagery is acquired, and does that affect the qualityof the imagery? This article will attempt to answer some of these questions.
Historically, airplanes have been the most common devices used to capture aerial imagery. A camera is mountedin the belly of an airplane along with a device called an inertial measurement unit (IMU). As the plane flies backand forth across an area the camera snaps pictures on photographic film at a given interval. Each time the shutteron the camera fires, the IMU simultaneously records information about the plane’s orientation in the world. Dataon altitude, yaw, pitch, roll, etc., is captured so it can be used later for image post processing.
When the plane arrives back at the airport, the film in the camera is removed and developed via traditionalmethods. The information from the IMU is also retrieved and stored. The film is then converted into prints, called“contact prints”, and sent off for scanning. A high-resolution scanner is then used to convert the prints into digitalimages. These images can then be distributed or, when combined with the information from the IMU and othersources, converted into digital orthophotos. A digital orthophoto is basically an image that has had the effects ofterrain removed from the image through post-processing. For more detailed information about this process, checkout the Desktop GIS article in the Winter 2001 issue of the GIS Newsletter.
Today, several aerial photography agencies have converted to an electronic process. Digital cameras arebecoming a more popular method for capturing aerial photographs. They can be more efficient because all of theimagery is processed and stored electronically. This in turn saves time by eliminating the need to wait fortraditional film to be developed, printed and scanned. Because the images are stored and transferredelectronically, they are also available more quickly.
Another emerging method of capturing aerial imagery is via satellite. Inthe past satellite imagery has lagged in resolution when compared totraditional aerial photography methods, but the gap is narrowing.Systems such as IKONOS, MODIS and LandSat, to name a few, havemade obtaining highly detailed imagery a reality. The IKONOS system,for instance, now offers 1-meter resolution imagery for most of the world.That level of imagery has typically only been available through traditionalaerial photography techniques. Publicly available satellite imagery,however, still cannot match the level of detail that can be acquired withphotographic techniques.
Other features make satellite imagery appealing as well, such as theability to capture more than just the “visible” portion of theelectromagnetic spectrum, also known as “bands”. Capturing this kindof data allows users to perform more detailed analysis beyond justlooking at the color of the world. Vegetation health, spectral responseand water storage are all examples of analysis that can be done withadditional satellite imagery. Satellites can also capture large areas, up to several square kilometers at time, inone “shot” with their sensing devices. Aerial photography aircraft often have to fly back and forth across an area ina semi- grid-like pattern often referred to as “scan lines”, to obtain enough imagery to cover a request.
A key difference does exist in the way satellites and cameras capture their data. Satellites use a type of sensorto snap an image, or “scene”, of the area of interest. The sensor on a satellite interprets the electromagneticenergy it receives and converts it into an image. A camera, on the other hand, is actually taking a snapshot ofwhat it “sees”. One could probably argue that satellite imagery and digital camera pictures have more in commonwith each other than either do with tradition film images. A satellite scene just captures more than the visibleportion of the spectrum.
In the past the size of satellite imagery and the time it took to process it has been a limitation to its use. Theamount of space required to store and process a “scene” is large. As computer processing speeds increase andelectronic storage gets less expensive this limitation has become less of a factor. Slowly, satellite imagery iscatching up to traditional aerial photography methods. There are places, however, where aerial photographictechniques still prevail. Newer technologies such as digital capture, processing and transmittal will only aid in thesurvival of traditional aerial imagery capture methods. Both satellite imagery and aerial photography will continueto have their place in the world of aerial imagery.
Copyright 2006 Dakota County, Minnesota
Office of Geographic Information Systems Print this Page
Summer 2007 - Tech Talk: Internet Mappingby Joe Sapletal, GISP
You cannot argue the fact that GIS and the Internet are two constantly growing technologies. In a sense, theyhave merged to produce free (or nearly free) Internet Mapping with applications from GeoMoose and MapServer toMicrosoft's Virtual Earth and Google's Google Maps and Google Earth. And don't forget one of the Internetmapping and directions originators and leaders - MapQuest. They all have one thing in common - you can usethem straight out of the box on your website or you can customize them by adding a little or a lot of your own datato them. Depending on how much data you have other than what is included with them, you can be up andrunning in a hour or two.
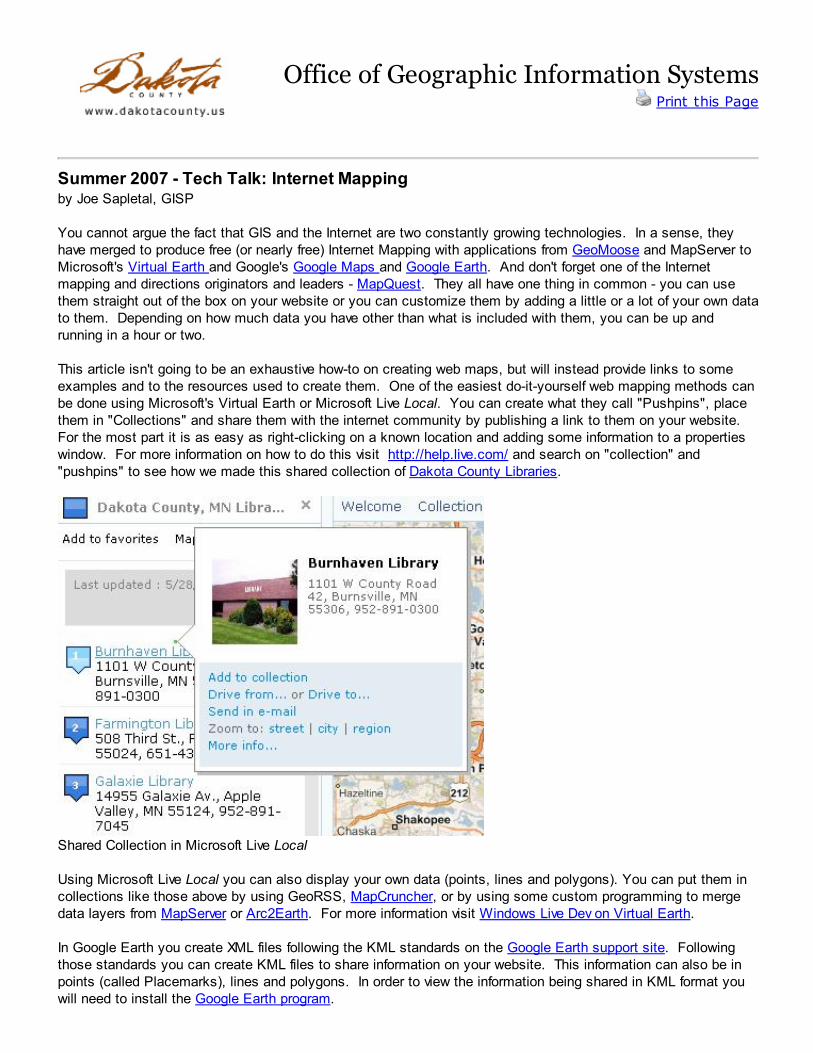
This article isn't going to be an exhaustive how-to on creating web maps, but will instead provide links to someexamples and to the resources used to create them. One of the easiest do-it-yourself web mapping methods canbe done using Microsoft's Virtual Earth or Microsoft Live Local. You can create what they call "Pushpins", placethem in "Collections" and share them with the internet community by publishing a link to them on your website. For the most part it is as easy as right-clicking on a known location and adding some information to a propertieswindow. For more information on how to do this visit http://help.live.com/ and search on "collection" and"pushpins" to see how we made this shared collection of Dakota County Libraries.
Shared Collection in Microsoft Live Local
Using Microsoft Live Local you can also display your own data (points, lines and polygons). You can put them incollections like those above by using GeoRSS, MapCruncher, or by using some custom programming to mergedata layers from MapServer or Arc2Earth. For more information visit Windows Live Dev on Virtual Earth.
In Google Earth you create XML files following the KML standards on the Google Earth support site. Followingthose standards you can create KML files to share information on your website. This information can also be inpoints (called Placemarks), lines and polygons. In order to view the information being shared in KML format youwill need to install the Google Earth program.
One last thing to say about these applications is that, in general, you can create links on your websites todirect people to a particular place on these maps, showing specific data and at a set zoom level. An example ofthat would be a recent change that we made to the Dakota County Real Estate Inquiry. Instead of the usershaving to install a small ActiveX component to view the birds eye imagery from Pictometry that was hosted on ourwebserver, x y coordinates are sent to Microsoft Live Local to return a bird's eye view of the select location. Visitthe Real Estate Inquiry, identify a property and click on the Bird's Eye button.