Nutrition Assistance Program Report Series Office of Research and Analysis Family Nutrition Programs Enhancing Supplemental Nutrition Assistance Program (SNAP) Certification: SNAP Modernization Efforts Final Report United States Food and Department of Nutrition Agriculture Service June 2010
Transcript
Nutrition Assistance Program Report Series Office of Research and Analysis
Family Nutrition Programs
Enhancing Supplemental Nutrition Assistance Program (SNAP)
Certification: SNAP Modernization Efforts
Final Report
United States Food and Department of Nutrition Agriculture Service
June 2010
Non-Discrimination Policy The U.S. Department of Agriculture (USDA) prohibits discrimination in all its programs and activities on the basis of race, color, national origin, age, disability, and where applicable, sex, marital status, familial status, parental status, religion, sexual orientation, genetic information, political beliefs, reprisal, or because all or part of a person’s income is derived from any public assistance program. (Not all prohibited bases apply to all programs.) Persons with disabilities who require alternative means for communication of program information (Braille, large print, audiotape, etc.) should contact USDA’s TARGET Center at (202) 720-2600 (voice and TDD).
To file a complaint of discrimination, write to USDA, Director, Office of Civil Rights, 1400 Independence Avenue, S.W., Washington, DC 20250-9410, or call (800) 795-3272 (voice) or (202) 720-6382 (TDD). USDA is an equal opportunity provider and employer.
Enhancing Supplemental Nutrition Assistance Program (SNAP)
Certification: SNAP Modernization Efforts
Final Report Authors: Gretchen Rowe Carolyn O’Brien Sam Hall Nancy Pindus Lauren Eyster Robin Koralek Alexandra Stanczyk Submitted by: Submitted to: The Urban Institute Office of Research and Analysis 2100 M Street, NW Food and Nutrition Service Washington, DC 20037 3101 Park Center Drive Alexandria, VA 22302-1500 Project Director: Project Officer: Carolyn O’Brien Rosemarie Downer This study was conducted under Contract number GS23F8198H with the Food and Nutrition Service. This report is available on the Food and Nutrition Service website: http://www.fns.usda.gov Suggested Citation: U.S. Department of Agriculture, Food and Nutrition Service, Office of Research and Analysis, Enhancing Supplemental Nutrition Assistance Program (SNAP) Certification: SNAP Modernization Efforts: Final Report, by Gretchen Rowe, Carolyn O’Brien, Sam Hall, Nancy Pindus, Lauren Eyster, Robin Koralek, and Alexandra Stanczyk. Project officer: Rosemarie Downer, Alexandria, VA: June 2010.
United States Food and Department of Nutrition Agriculture Service
Family ProgramsReport
June 2010
This project was funded by the United States Department of Agriculture, Food and Nutrition Service and prepared by the Urban Institute, a nonprofit, nonpartisan research and educational organization. The views expressed are those of the authors and should not be attributed to the Urban Institute, its trustees, or its funders. The authors would like to thank the many state and local SNAP administrators and staff, community and advocacy organization representatives, and focus group participants who shared their time and their experiences with us during this project. Project Officer Rosemarie Downer, Carol Olander, and Anita Singh at the Food and Nutrition Service provided guidance throughout the project and insightful, careful edits to earlier drafts of this report. The authors are also indebted to Tess Tannehill and Jessica Compton at the Urban Institute who made significant research contributions as members of the site visit team.
CONTENTS EXECUTIVE SUMMARY ......................................................................................................................................... I CHAPTER 1: INTRODUCTION............................................................................................................................... 1
A. STUDY OBJECTIVES .......................................................................................................................................... 1 B. PURPOSE AND ORGANIZATION OF THIS REPORT .............................................................................................. 2
CHAPTER 2: METHODOLOGY ............................................................................................................................. 3 A. EXPLORATORY CASE STUDIES ......................................................................................................................... 3
1. Site Selection Procedures ........................................................................................................................... 3 2. Site Visit Activities ...................................................................................................................................... 4
B. NATIONAL INVENTORY .................................................................................................................................... 4 C. FOURTEEN CASE STUDIES ................................................................................................................................ 6
1. Site Selection Process ................................................................................................................................. 6 2. Site Visit Activities ...................................................................................................................................... 7
D. COLLECTION AND ANALYSIS OF OTHER QUANTITATIVE DATA ....................................................................... 7 CHAPTER 3: BACKGROUND ................................................................................................................................. 9
A. PICTURE OF MODERNIZATION .......................................................................................................................... 9 B. NATIONAL, STATE, AND LOCAL CONTEXT FOR THE 14 CASE STUDY STATES ................................................ 11
1. Overall State Characteristics ................................................................................................................... 11 2. Service Delivery Characteristics .............................................................................................................. 19 3. Timeline and Scope/Scale of Modernization Efforts ................................................................................. 21
CHAPTER 4: CROSS-STATE DESCRIPTIVE STUDY FINDINGS .................................................................. 23 A. OVERVIEW OF STATE EFFORTS TO MODERNIZE SNAP AND TIMING OF MODERNIZATION EFFORTS .............. 23
1. Key Factors Affecting Implementation of Modernization ......................................................................... 23 2. Key Goals for Modernization ................................................................................................................... 27
B. POLICY CHANGES .......................................................................................................................................... 28 C. STATE EFFORTS TO REENGINEER ADMINISTRATIVE STRUCTURES AND ORGANIZATIONAL ROLES ................ 31
1. Organizational Changes and Process Reengineering .............................................................................. 31 2. Contracted Administrative Functions ....................................................................................................... 39
D. TECHNOLOGICAL INNOVATIONS .................................................................................................................... 41 1. Call Centers .............................................................................................................................................. 41 2. Online Application and Other Benefit Tools ............................................................................................ 46 3. Technology to Advance Paperless Systems .............................................................................................. 50 4. New or Upgraded MIS and Workflow Management Systems ................................................................... 55
E. PARTNERING ARRANGEMENTS TO SUPPORT CLIENT APPLICATIONS .............................................................. 57 1. Types of Partners ...................................................................................................................................... 57 2. Types of Agreements ................................................................................................................................. 57 3. Services Provided through Partnering Arrangements .............................................................................. 59 4. Client Experiences .................................................................................................................................... 61
F. TRAINING OF STAFF AND PARTNERS .............................................................................................................. 61 CHAPTER 5: THE BIG PICTURE: MODERNIZATION IN PRACTICE ........................................................ 64
A. STRUCTURE OF MODERNIZATION ................................................................................................................... 64 B. COMBINATIONS OF MODERNIZATION EFFORTS .............................................................................................. 65
CHAPTER 6: CHALLENGES AND SUCCESSES OF MODERNIZATION AND FUTURE PLANS ............ 68 A. MODERNIZATION CHALLENGES ..................................................................................................................... 68
1. Staff Shortages .......................................................................................................................................... 68 2. Staff Turnover ........................................................................................................................................... 69 3. Managing Staff and Client Responses to Modernization Changes ........................................................... 70 4. Program Integration ................................................................................................................................. 71 5. Training .................................................................................................................................................... 72
B. MODERNIZATION SUCCESSES ......................................................................................................................... 74 C. FUTURE PLANS ............................................................................................................................................... 75
CHAPTER 7: LESSONS LEARNED AND FUTURE POLICY CONSIDERATIONS ...................................... 78 A. LESSONS LEARNED ........................................................................................................................................ 78 B. FUTURE POLICY CONSIDERATIONS ................................................................................................................ 80
FIGURES AND TABLES
FIGURE 3.1: AVERAGE NUMBER OF PERSONS IN UNITED STATES RECEIVING SNAP BENEFITS BY YEAR .................... 12 FIGURE 3.2: AVERAGE NUMBER OF PERSONS RECEIVING SNAP BENEFITS BY CASE STUDY STATE FOR FY 2000 AND
FY 2008 .............................................................................................................................................................. 13 FIGURE 3.3: AVERAGE MONTHLY COST PER PERSON IN THE UNITED STATES TO ADMINISTER SNAP BY YEAR .......... 14 FIGURE 3.4: AVERAGE MONTHLY COST PER PERSON TO ADMINISTER SNAP BY CASE STUDY STATE FOR FY 2000
AND FY 2008 ...................................................................................................................................................... 15 FIGURE 3.5: AVERAGE COMBINED ERROR RATES FOR THE SNAP PROGRAM BY CASE STUDY STATE AND IN THE U.S.
FOR FY2000 AND FY2008 .................................................................................................................................. 16 TABLE 3.1: ADMINISTRATION AND NUMBER OF SNAP OFFICES .................................................................................. 18 STATE ........................................................................................................................................................................... 18 TABLE 3.2: PERCENTAGE OF SNAP STATE AND LOCAL AGENCIES RESPONSIBLE FOR ADMINISTERING ADDITIONAL
ASSISTANCE PROGRAMS ..................................................................................................................................... 20 TABLE 3.3: PERCENTAGE OF STATES IN WHICH SNAP CASEWORKERS ARE RESPONSIBLE FOR ADMINISTERING
ADDITIONAL ASSISTANCE PROGRAMS ................................................................................................................ 21 FIGURE 3.6: CONTINUUM OF DEGREE OF MODERNIZATION FOR CASE STUDY STATES ................................................. 22 TABLE 4.1 KEY FACTORS AFFECTING MODERNIZATION .............................................................................................. 24 TABLE 4.2: STATE POLICY OPTIONS AND WAIVERS FOR CASE STUDY STATES AS OF JUNE 2009 ................................ 29 TABLE 4.3: ORGANIZATIONAL CHANGES AND PROCESS REENGINEERING AMONG CASE STUDY STATES AS OF JUNE
2009 ................................................................................................................................................................... 32 TABLE 4.4: CASE STUDY STATE CALL CENTERS AS OF JUNE 2009 .............................................................................. 43 TABLE 4.5: USAGE PATTERNS AT THE CALL CENTERS IN CASE STUDY STATES AS OF 2009 ........................................ 45 TABLE 4.6: ONLINE APPLICATION AND BENEFIT TOOLS IN CASE STUDY STATES AS OF JUNE 2009 ............................ 47 TABLE 4.7: DOCUMENT IMAGING AND ELECTRONIC CASE FILES IN CASE STUDY STATES AS OF JUNE 2009 ............... 51 TABLE 4.8: DATA-SHARING SYSTEMS IN CASE STUDY STATES AS OF JUNE 2009 ........................................................ 54 TABLE 4.9: MIS UPGRADES AND NEW WORKER ENTRY SYSTEMS IN THE CASE STUDY STATES AS OF JUNE 2009 ..... 56 TABLE 4.10: TYPES OF PARTNERING ARRANGEMENTS IN CASE STUDY STATES AS OF JUNE 2009 ............................... 58 FIGURE 5.1: WASHINGTON’S MODERNIZATION STRUCTURE ........................................................................................ 66 TABLE 6.1: CHALLENGES TO MODERNIZATION REPORTED BY CASE STUDY STATES ................................................... 68 FIGURE 6.1: FUTURE PLANS CONTINUUM ..................................................................................................................... 76
i
EXECUTIVE SUMMARY
INTRODUCTION
The Food and Nutrition Service (FNS) contracted with the Urban Institute to conduct a comprehensive study of state efforts to modernize the Supplemental Nutrition Assistance Program (SNAP).1 The goals of this descriptive study were to develop a comprehensive, national inventory of efforts of states to modernize certification and recertification processes in SNAP, to identify successful modernization efforts and promising practices that can potentially be replicated, and to share information to help avoid implementation pitfalls and failures among states currently planning similar kinds of modernization initiatives. This study explores factors that led to implementation of modernization activities and shifts in business practices and systematically describes these changes and their effects on both client and staff experiences, although it is not possible to attribute outcomes to specific changes. It also identifies cross-cutting themes and patterns across modernization efforts.
Although states and policymakers may define modernization in many ways, this study adopted a broad, comprehensive definition of modernization—including technological innovations as well as policy and organizational changes and partnering arrangements that affect the way SNAP is delivered to clients. Modernization is described here within four very broad categories—policy changes, organizational changes and reengineering of administrative functions, technological innovations, and partnering arrangements—as follows:
Policy Changes
Includes state options, such as simplified reporting requirements, expanded vehicle exemption criteria, expanded categorical eligibility, and use of FNS policy waivers for combined application programs (CAPs) and face-to-face interviews at application or recertification
Organizational Changes and Reengineering of Administrative Functions
Includes changes such as restructuring the up-front client management process in local offices, shifting to a task-based system for managing caseloads, simplifying the application and certification process to improve access, and changing staffing configurations, as well as contracting some organizational functions to commercial business partners
Technological Innovations
Call Centers
1 Formerly known as the Food Stamp Program, this change was mandated by the Food, Conservation and Energy Act of 2008 and took effect on October 1, 2008.
ii
Refers to centralized locations where clients may call to obtain information about their case, to conduct interviews, or to submit changes to their case
Online Application and Benefit Tools
Allows clients to complete an application electronically through a secure web site, including signing and submitting the application, prescreening for benefits, applying for multiple programs, checking benefit status, or submitting changes to their case
Technology to Advance Paperless Systems
Refers to electronic case files and document imaging technology as well as data-sharing technology—which allows the electronic exchange of client data and documentation with one or more agencies—and electronic caseworker manuals and office correspondence
New Management Information Systems (MISs) and Workflow
Management Systems Includes major updates to MISs or creating new systems, often moving from mainframe systems to web-based systems that allow for worker entry interfaces and workflow monitoring
Partnering Arrangements
Includes unpaid (or not fully compensated) partnering arrangements with community organizations, other government agencies, and businesses to provide additional access points and application assistance
To document key features and outcomes associated with SNAP modernization, this study
included three data collection activities: initial site visits to four states (Phase One)2; a national survey or inventory of all states,3 including a sample of local offices and partner organizations (Phase Two); and intensive case studies in 14 states (Phase Three). Information gathered during Phase One was updated using data from the national inventory in Phase Two. This information was analyzed using several criteria—including type of SNAP administration, region, type and stage of modernization, and use of partners—to select states for Phase Three of the study. The states selected to participate in the case studies included the four states from Phase One—Utah, Washington, Massachusetts, and Wisconsin—and Colorado, D.C., Idaho, Illinois, Indiana, Kansas, Mississippi, North Carolina, Pennsylvania, and Texas.
While the focus of the final report is on findings from Phase Three of the study—the case
studies conducted in 14 states between February and June 2009—it presents a synthesis of information from all three data collection and analysis phases, where appropriate. This summary provides key background information and highlights of that report. 2 The use of the word “states” in this report refers to all 50 states and D.C. 3 The interim report for this project summarized the findings from Phase Two of the project, the national inventory, conducted from May to December 2008. (See Rowe et al., Enhancing Supplemental Nutrition Assistance Program (SNAP) Certification: SNAP Modernization Efforts, March 2010.)
iii
OVERVIEW
SNAP is the cornerstone of nutrition assistance programs in the United States, serving an average of 15.2 million households and 33.7 million individuals in fiscal year 2009. It provides, through state-operated programs, assistance for low-income individuals and households to purchase eligible food items for home consumption. Over the past decade, increased awareness of the importance of SNAP as a basic nutritional safety net, as well as a critical tool in supporting the working poor and, more recently, the newly unemployed, has led to federal and state efforts to increase program access and participation. At the same time, states are focusing on ways to increase efficiency and ensure program integrity. To meet these goals, states are modernizing their programs by making changes to policy, procedures, and organization of SNAP application processing, case management, and recertification.
Findings from all three phases of the study paint a rich and varied picture of the administration and delivery of SNAP benefits and the implementation of modernization efforts. It is clear that at both the state and local levels, the majority of offices are approaching modernization activities from a broad perspective, not limited to SNAP operations but often including Temporary Assistance for Needy Families (TANF) and other benefits programs as well. State and local modernization efforts are often seen as a natural outgrowth of activities and efforts determined by federal policies and regulations, state and local political and economic environments, the general structure and organization of benefit offices, and access to improved technology. One survey respondent put it clearly: “The Food Stamp Program [SNAP] has been an ever-evolving program with technological advances occurring all along the way .… Modernization is not just conducting telephone interviews; it is the natural evolution of the program.”
STATE MODERNIZATION EFFORTS
States have implemented numerous activities across the four modernization categories. These efforts continue to evolve and, in most cases, have been implemented over the course of several years. In addition, a growing number of factors drives states to modernize.
A. Key Factors Affecting Implementation of Modernization Efforts
Nationally, states identified the following key factors as driving the modernization of their state SNAPs: increasing caseloads in local offices, economic downturns, state legislation, and high staff turnover. Administrators and staff in the 14 case study states further described and expanded on these factors, which can be grouped into the following five categories:
The economic environment (e.g., increases in caseloads, fewer staff, budget
reductions); Intra-agency actors (e.g., involvement of key SNAP agency administrators); Extra-agency actors (e.g., involvement of governors, state legislators, FNS staff,
and advocates); Agency restructuring (e.g., consolidation of offices, reorganization of state SNAP
agency); and
iv
FNS actions (e.g., sanctions for high error rates and timeliness issues).
B. Policy Changes
While states are not required to use the policy options or apply for waivers, these options and waivers provide the flexibility to improve the efficiency of SNAP and reduce barriers to access for clients. In many states, the policy options and waivers also facilitate other modernization efforts. For example, waiving face-to-face interviews allows states to more liberally use call center staff to conduct client interviews.
The majority of the states implemented policy options that simplified or reduced the reporting requirements for SNAP clients. These options reduce the burden on clients by allowing more flexibility in when they must report changes. Households that have simplified reporting are required to report changes between certification periods only if their total countable income rises above 130 percent of the federal poverty level. In addition, even households for whom simplified reporting is not available may be required to report only certain types of changes, such as changes in work or job status, or income increases over $100.
Most states also took advantage of policy options that allowed them to better align
SNAP and TANF program rules, thus reducing administrative burdens for staff. These options included exempting the value of vehicles as they do in TANF and applying broad-based categorical eligibility for SNAP when a household receives benefits or services funded by the TANF program. Nationally, all but three states expanded the vehicle exemption policy for SNAP from one vehicle per household to all vehicles owned by the household. In most states, households that are receiving or certified as eligible to receive benefits or services that are at least 50 percent funded by TANF or maintenance of effort are categorically eligible for SNAP.
States requested and received waivers to certain federal SNAP policies to improve
program access. Most states received waivers from the federal law requiring states to conduct face-to-face interviews with clients at certification and at least once every 12 months thereafter. Nationally, about two-thirds of the states had authorization to waive face-to-face initial or recertification interviews. Waiving the face-to-face interview allowed states to conduct the interviews over the telephone. A few case study states requested “revolving door” waivers, which allow staff to reopen a case within 30 days of the closure if that closing resulted from not providing verification materials and the client subsequently provided the appropriate materials. This reduces case “churning” and work for staff and clients who would otherwise have to begin the application process over again.
In addition, almost half the case study states received a CAP waiver, a streamlined SNAP
application process for certain individuals who apply for Supplemental Security Income (SSI). This process made it easier for qualified SSI recipients to automatically receive SNAP benefits and relaxed many standard rules for these households, including eliminating the requirement to complete an application, waiving face-to-face interviews, and extending recertification periods for up to three years. For example, Massachusetts sends eligible clients a letter with an electronic benefit transfer card. To accept benefits, the client must simply activate the card, which enrolls
v
the client. This has enabled the state to enroll thousands of people (approximately 10 percent of their overall caseload) that staff feel would not have otherwise applied for SNAP.
C. State Efforts to Reengineer Administrative Structure and Organizational Roles
States made a variety of organizational changes and restructured certain administrative processes and functions. These initiatives fundamentally changed the ways SNAP agencies process applications and manage caseloads and the ways customers interact with agency staff. The overall goals of these efforts were to remove barriers to participation—increasing access—and to improve customer service and administrative efficiency by streamlining procedures.
The majority of the case study states implemented one or more changes to restructure
the up-front process in the local office to improve customer service and to increase efficiency. About half the case study states added self-service capabilities in the reception area that included touch-screen kiosks for check-in, streaming informational videos, copying machines, computers linked to online applications, or telephones with a direct line to call centers that were available for customers to use on their own or with some assistance from staff. A few states, including Kansas, Pennsylvania, and Wisconsin, implemented new staffing arrangements that included the introduction of “greeter” positions. These were usually clerical staff, who acted as the first point of contact in the reception area. Other states chose to assign higher level staff with authority to make eligibility decisions to be present in the reception area to answer specific technical questions about cases.
More than half the case study states tested new workload management or task-based systems for managing caseloads. They piloted new strategies that moved away from traditional case management models in which each worker had a caseload to task-based models that made assignments based on the type of work required. In some models, specific tasks were assigned to workers who consistently performed one type of SNAP-related task (e.g., initial interviews, recertification, or change notices) whereas in others, workers were rotated among several types of tasks. These new methods were implemented not only as cost-saving measures but also as efforts to benefit staff and customers by improving efficiency. States found that some type of automated workload management system was critical for both routing and tracking assignments and completion of work under this model.
Most states implemented some type of organizational changes that simplified processes and improved customer access. Nationally, more than half the states reported that they had outstationed workers at sites other than the local SNAP agency office. Many case study states made arrangements with community partners or other government agencies to locate SNAP workers at their sites to provide information about SNAP benefits, take applications, or conduct interviews. All study states offered a combined application that allowed customers to apply for several benefit programs at one time through one form. Nationally, only a few states reported that they made modifications that allowed workers to telecommute from home or to telework or “port” work from one area of the state to another.
Most states established contractual relationships with commercial businesses, including two states that privatized some SNAP functions. In response to budget constraints and
vi
also as part of a general movement toward privatization of government functions, Texas and Indiana launched substantial efforts to shift some administration of SNAP and other benefits programs to private contractors. Overall, these two states experienced significant challenges with these initiatives. In addition, most states hired outside contractors for more limited tasks, such as developing or upgrading technology.
D. Technological Innovations
Technological innovations encompass a range of modernization efforts that use new technologies or update and expand existing systems. Key activities included implementation of call centers, online applications, electronic case files, and document imaging.
Nationally, over half the states and most case study states implemented or planned to implement call centers, although functions vary widely by state. The various types of call centers allow clients to apply for assistance, submit changes to their case, recertify their case, check the status of their claim, ask questions about their case, or schedule appointments. Caseworkers staff call centers in most states, while some states have contractor-operated information lines.
The majority of states nationally and many case study states implemented or planned to implement online application and benefit tools. In all states that have implemented these features, state web sites include electronic applications (some with an electronic signature, or e-signature, function, some without). Many web sites also include prescreening tools providing results for which programs a client may be potentially eligible, secure account information about a client’s case, and the ability to submit changes online. Most web sites were publicly accessible through the Internet, but a few were available only through partner organizations or local offices.
Several states used technology to reduce the use of paper in case files. Document imaging and electronic case file systems allow states to transform large paper case files into electronic files. These initiatives reduce the space needed to store case-related documents, organize files for staff more efficiently, and create a more portable system that can help manage workflow across the state. In many states, document imaging and electronic case files were created as part of the same initiative; however, that is not always the case. About a third of states nationally implemented document imaging and about two-thirds implemented electronic case files. Most case study states implemented both initiatives. The extent to which a state went paperless varied widely, ranging from fully electronic case files, applications, and documentation to simply creating electronic case note files that case managers could key in electronically during an interview.
Several states implemented data-sharing systems that use technology to electronically exchange customer data and documentation with one or more agencies. A third of states nationally and most case study states created data-sharing systems that reduce the amount of verification needed and number of times a client must provide the same verification. Information accessed through such systems included birth certificates, residency verification, employment, and child support payments.
vii
Some states have updated or were in the process of updating their legacy MISs from mainframe systems to web-based systems. More than half the case study states made substantial updates to their MIS or created a new MIS. Several case study states also created a new worker data entry interface to manage the flow of work. In the new web-based systems, workers use links and drop-down boxes to move from case to case and page to page. There were often sidebar navigation panes that allowed workers to move easily between screens and functions. Many systems also included standardized correspondence to customers that were sent through the system itself, the ability to add more in-depth case notes, and sophisticated, customizable reports.
E. Partnering Arrangements
State and local offices established partnerships with community organizations, private businesses, and other government agencies, primarily to increase customer access to SNAP services.
Most states established relationships with partner organizations, typically to conduct outreach and provide information about SNAP, to serve as supplemental access points, to provide application assistance, or to conduct follow-up activities with customers who need additional assistance. Nationally, most states reported collaborations with partners, and all 14 case study states had partnering relationships—either statewide or in one or more local sites—with community organizations. About half the case study states also reported partnering arrangements with other government agencies, while Kansas and Texas had arrangements with businesses.
THE BIG PICTURE: MODERNIZATION IN PRACTICE
The case study states shared important information about the structure and form of modernization and the ways in which their efforts work together to meet the overall state goals.
A. Structure of Modernization
Some states do not view the policies and initiatives they implement as modernization but view their efforts as a means to more efficiently administer the program, decrease staff workloads, or expand client access. For many states, modernization is viewed holistically as an overall process that involves making a series of modifications across categories to effect an overall change. Other states are taking a more piecemeal approach, making one or two changes periodically. Most other case study states fall somewhere in between on this continuum.
Modernization activities in most states were not limited to SNAP but involve application and recertification procedures for multiple benefits programs, typically TANF and Medicaid. States discussed how efforts to change SNAP policies and business processes must consider and attempt to align the rules and regulations that govern other benefits programs, and noted that this can often be a time-consuming and cumbersome process.
viii
B. Combinations of Modernization Efforts
All the case study states implemented several modernization initiatives simultaneously, because very few initiatives can stand alone. For example, a state can create a call center, but it may serve as little more than a general information line if the state does not also implement policy changes, such as waiving the face-to-face interview to conduct initial or recertification interviews, or have electronic case file technology to view and update case files as customers call.
In many of the most modernized states, technology and policy changes ease and facilitate modernization, but organizational or business process changes are the central component of modernization. The states generally determine which type of business model they will use (i.e., regionalization or task-based systems) and the policy and technology are created to help the model function.
States that are more modernized have been implementing and enhancing modernization efforts for longer periods. Utah and Washington began in 2000, Pennsylvania in 2001, and Wisconsin in 2003. In addition, these states kicked off their initiatives by first implementing either document imaging or call centers. Indiana, Pennsylvania, Utah, Washington, and Wisconsin are all currently operating document imaging systems, call centers, and online applications. All five states have implemented seven or more policy changes; four of the five states have been granted a waiver of face-to-face interviews at application. All these states have made one or more modifications to the in-office up-front process to increase efficiency and improve customer service. All five states have at least piloted a task-based case management approach, although only Indiana, Pennsylvania, and Washington are currently operating this model at any local offices.
Because states often implement various modernization activities concurrently, it is difficult, if not impossible, to separate the effects of any one effort on participation, payment accuracy, and error rates. In addition, few states have conducted internal analyses of these changes and when they do, the focus is on outcomes associated with larger technological efforts. It is also difficult to determine the relative impact of state modernization versus a declining economy on the precipitous growth in caseloads. Most states reported anecdotally that the economy was driving recent increases, but the changes the state made to expand access likely allowed customers to more easily use the system. Several states reported that they would not have been able to adequately address the increased demand if they had not put some efficiencies in place that allow workers to process cases more quickly. Also, states mentioned that initiatives that helped to limit office traffic improved workflow and efficiency.
CHALLENGES AND SUCCESSES OF MODERNIZATION
Nationally, a majority of states encountered modernization challenges related to limited staff or resources, unanticipated costs, delays in schedules and deadlines, competing priorities, limited time for rollout, restructuring local staff, hiring staff, training staff, working with unions, and obtaining approval for waivers. Staff in the 14 case study states reported a similar set of challenges, including
ix
Staff shortages and turnover; Managing staff and customer responses to modernization changes; Program integration; Training; Overall caseload volume; Insufficient resources; Existing technological limitations; Previous experience; Local-office differences; and Pressures from outside the agency.
Nationally, the majority of states felt that increased participation in SNAP was the
greatest success of modernization efforts. More than half the states also thought that their modernization efforts positively affected client satisfaction. Administrators and staff in the case study states felt that modernization resulted in increased customer access, participation, and staff satisfaction. They also reported positive outcomes for customer service and overall efficiency (including timeliness, accuracy, and cost savings). However, it was hard for states to disentangle increases in participation resulting from implementation of modernization efforts from those resulting from general caseload increases occurring nationally over the past eight years. There was a substantial amount of overlap in descriptions of perceived successes related to specific goals or outcomes. For example, implementation of changes to the in-office up-front process could be viewed as a success in improving not just customer access and customer service but also efficiency and staff satisfaction.
Closer examination of the history of modernization in case study states that were on the “more modernized” end of the spectrum provided some additional insight into factors that lead to successful implementation of comprehensive modernization initiatives. These factors included strong internal leadership, available funding, a history of innovation, and collaboration with advocates.
FUTURE PLANS
Most of the 14 case study states continue to make plans for modernization efforts that will increase access and participation while making their administrative process more streamlined and efficient. Some states were actively planning new efforts, whereas others were just discussing possibilities. Two case study states had limited plans, with sparse initiatives in the planning stages. Six states had more moderate plans that included expansions of current comprehensive efforts and additional, more formal planning. Another six states had more definitive comprehensive plans to modernize their systems and, in some cases, had planning groups actively working on modernization efforts. For example, D.C. is undertaking broad system changes, expanding service delivery initiatives, consolidating local offices, reaching out to community partners, introducing document imaging and kiosks, and developing e-signatures so it can develop an electronic application that will feed directly into its MIS. All these activities are part of a broad push by a new agency director to modernize the system and increase access and efficiency. The purpose of Washington state’s service delivery redesign project is to take advantage of process improvements including current and emerging technology to improve
x
customer service, improve the working environment for staff, and create capacity by reducing complex processes. Six staff teams are examining a specific set of processes, from outreach to case management and social services delivery, using available data and information about how the client wants to change procedures. The teams present recommendations to a steering committee and initiatives approved by the steering committee are first piloted and then implemented statewide.
LESSONS LEARNED
Modernization has been a trial-and-error process for many states. State staff reported that they tested various strategies, occasionally retooled them mid-implementation, and, in some cases, abandoned efforts all together. On the basis of their experiences, states identified a number of lessons learned about the implementation of modernization initiatives including the following:
Careful planning is essential; Roll out the modernization efforts incrementally; Flexibility is key to success; Training is an integral part of the process; Actively encourage buy-in from staff and stakeholders; and Make the most of technology.
FUTURE POLICY CONSIDERATIONS
Modernization has brought sweeping changes to client access and staff productivity in the delivery of SNAP benefits. However, the trajectory has been uneven across the country and some modernization activities have been especially challenging. The convergence of increasing caseloads, state budget constraints, and improved technology make this a critical time for an informed and deliberate effort to further advance SNAP modernization. Future federal policy considerations that will support such efforts include the following topics:
Coordination among federal agencies to better align program goals and policies; Development of initiative templates for state use (e.g., electronic application template
that the state could customize); Changes to funding incentives (e.g., offer incentives focused on promoting
modernization); and Demonstration projects to evaluate how specific initiatives actually affect outcomes
in the state.
1
CHAPTER 1: INTRODUCTION
The Supplemental Nutrition Assistance Program (SNAP),4 administered by the U.S. Department of Agriculture’s (USDA) Food and Nutrition Service (FNS), is the cornerstone of nutrition assistance programs in the United States, serving an average of 15.2 million households and 33.7 million individuals per month in fiscal year (FY) 2009. In the years following the 1996 enactment of federal welfare reform5 and with the more recent economic downturn, the importance of SNAP as both a basic safety net and a critical work support has gained increased attention. With USDA encouragement, states have taken steps to increase SNAP participation and expand access to needy households. At the same time, however, states are facing budget crises and staffing shortfalls. Many states have turned to modernizing the application, recertification, and case management functions to increase access with limited resources. These efforts represent an ongoing “modernization” process that includes implementing policy changes to simplify SNAP, restructuring and reengineering administrative functions, expanding technology applications, and developing new relationships with external organizations. Collectively, these efforts are intended to enable states to more efficiently process cases and keep pace with the growing caseloads.
To document key features and perceived outcomes associated with SNAP modernization,
FNS contracted with the Urban Institute (UI) to conduct a comprehensive study. This descriptive study included three phases: In Phase One, initial site visits to four states were conducted; in Phase Two, a national survey or inventory of all states, including a sample of local offices and partner organizations, was conducted from May to December 2008; and in Phase Three intensive case studies were completed in 14 states.6 An interim report summarized the findings from Phase Two of the project. (See Rowe et al., Enhancing Supplemental Nutrition Assistance Program (SNAP) Certification: SNAP Modernization Efforts, March 2010.) Although the focus of this report is on Phase Three—case studies conducted in 14 states between February and June 2009—it synthesizes and summarizes findings from all three phases of the study.
A. Study Objectives
The goals of this study are to develop a comprehensive, national inventory of SNAP modernization efforts and to identify promising practices as well as lessons learned. Seven key objectives guided the development of research questions for all phases of the project, although it is not possible to attribute outcomes to specific changes. These objectives, which were addressed though data collected from multiple sources, are as follows:
Objective 1: Provide a national description and comparison of state efforts to modernize SNAP
4 Formerly known as the Food Stamp Program, this change was mandated by the Food, Conservation and Energy Act of 2008, which took effect on October 1, 2008. 5 The Personal Responsibility and Work Opportunity Reconciliation Act of 1996, Pub.L. 104-193, 110 Stat. 2105, was enacted August 22, 1996. 6 The use of the word “states” in this report refers to all 50 states and D.C.
2
Objective 2: Describe the factors that drive states to modernize SNAP services
Objective 3: Describe and compare the policy changes that modernize SNAP
Objective 4: Identify and compare the ways that states reengineer administrative structure and organizational roles
Objective 5: Describe and compare technology initiatives made to support SNAP
modernization
Objective 6: Describe and compare the nonprofit community organizations that states partner with to support SNAP modernization
Objective 7: Document the relationships among SNAP modernization initiatives,
stakeholder satisfaction, and program outcomes
B. Purpose and Organization of This Report
This final report presents a comprehensive synthesis of information from all three data collection and analysis phases of this study. The main focus of the report is on qualitative data collected during in-depth site visits to 14 states and selected localities in spring 2009. Whenever possible, these findings are presented in the context of findings from prior phases of the study. This report explores factors that led to implementation of modernization activities and shifts in business practices and systematically describes these changes and their effects on both client and staff experiences in the 14 case study states. This report also identifies cross-cutting themes and patterns across modernization efforts.
The following chapter describes the methodology for each of the three phases of the study, with a focus on the methods used and activities conducted for the case studies. Chapter 3 provides a discussion of the states’ definitions of modernization and the four broad modernization categories as they are used in this report. Data from the national survey, FNS administrative data, and data collected during the case studies are used to provide background on state characteristics, organizational setting, and program responsibilities of the key state and local agencies both nationally and for the 14 case study states. Chapter 4 provides a comprehensive discussion of cross-site findings from the case studies, building and expanding on the survey findings. Key goals and motivations for modernization efforts are presented, followed by a description of findings related to policy changes, reengineering of administrative functions and organizational changes, technological innovations, and partnering arrangements. Training of staff and partners for modernization efforts is also discussed. Chapter 5 presents further analysis of findings across all phases of the study, describing themes and patterns in implementation of modernization activities across efforts. Challenges and successes related to modernization activities as well as states’ plans for the future are discussed in Chapter 6. Chapter 7 draws on the preceding chapters to summarize lessons learned and provide some future policy considerations. Volume II: Final Report Appendix provides detailed descriptive profiles for all case study states as well as a summary of findings from focus groups conducted during the site visits.
3
CHAPTER 2: METHODOLOGY
To document key features and outcomes associated with SNAP modernization, this study included a three-phase data collection process: (1) initial site visits to four states; (2) a national survey of all states, including a sample of local offices and partner organizations; and (3) in-depth case studies in 14 states. The following sections provide an overview of the methodology for each phase of the study.
A. Exploratory Case Studies
In spring 2007, initial or “exploratory” site visits were conducted in four states—Massachusetts, Utah, Washington, and Wisconsin—that were early implementers of SNAP modernization. These visits were designed to provide a thorough understanding of their efforts to modernize the SNAP certification and recertification processes. The selected states offered a range of experiences with SNAP modernization and the visits provided information related to the
Types and extent of changes made and planned;
Key steps in the certification and recertification process from the client and staff
perspectives;
Factors that led to shifts in business practices; and
Reported effects of modernization on access, client satisfaction, administrative costs, payment accuracy, and any other relevant outcomes.
In addition, these case studies were used to inform the development and refinement of the
data collection and analysis plans for the national inventory and the 14 case studies (described below). Among other things, these early visits provided an opportunity to conduct a preliminary assessment of the availability and quality of outcome data, as well as other data necessary to assess the implemented modernization efforts; test data collection instruments; and reexamine the study’s overall organizing framework for data collection and analysis. These states were visited again during the third phase of the study—the 14 case studies. Information obtained from both phases for these four states is synthesized and presented collectively in this report.
1. Site Selection Procedures Prior to the initial site visits, conference calls were held with staff from FNS Regional Offices and selected national organizations. These calls solicited information about modernization issues and preliminary information on both planned and implemented modernization efforts in the states to help refine the selection of the initial site visit states.
Also considered in the selection of sites was information on state efforts that were likely
to have the most direct effect on the certification and recertification processes (e.g., waiver of face-to-face interviews, online applications, call centers). Although the focus was initially on
4
states with the most comprehensive, fully implemented modernization initiatives, it was expanded to include a breadth of approaches and stages of implementation to ensure diversity across the selected sites. For example, some states took an incremental rather than systemic, comprehensive approach to modernizing, whereas others successfully modernized only one or two key functions (e.g., document imaging), but these functions were of high interest to other state SNAP administrators. The four states were chosen to represent these various approaches.
On the basis of information from FNS and national organizations, Massachusetts, Utah, Washington, and Wisconsin were selected for the initial round of visits. These four states implemented a number of different waivers and policy changes and different types of organizational and administrative changes and launched numerous technological enhancements. Some efforts were in place for several years whereas others had been in operation for only a few months.
2. Site Visit Activities Multiday site visits were made to each state office and at least one local office in each state between late March and April 2007. Discussions were conducted with state SNAP policy, operations, and information technology staff; local office administrators and service delivery staff; representatives from local community partners participating in outreach activities; and advocacy groups. Study teams also observed operations in call centers and document imaging centers, as well as staff-client interactions in the local offices. While in the states, staff piloted the logistics for data collection methods and instruments to be used in the 14 Phase Three case studies.
B. National Inventory
A nationwide inventory of SNAP modernization efforts was conducted between May and December 2008. Three separate surveys, targeted to state agency staff, local program office staff, and partners, were designed and conducted to provide an inventory for a point in time using consistent categories and definitions of modernization initiatives. The survey provides a broad picture of activities across a large number and variety of modernization initiatives. Within each, there is opportunity for variation in the types of activities that constitute implementation of an initiative. For example, some states might report that they implemented electronic case files if staff had the ability to input information collected during an intake session directly into a computer. Other states might define electronic case files as a more comprehensive effort that eliminated the need for any paper case files.
The State Survey was sent to a state SNAP administrator in all 50 states and D.C., with a 100 percent response rate. The local office survey was administered to 150 local offices (three in each of the 50 states).7 Ninety-eight local offices (65 percent response rate) completed the survey, with at least one local office survey completed in each state. The partner survey was administered to 150 agencies, including community-based organizations (CBOs) and for-profit
7 For details on the selection of the local office and partner samples, see Rowe et al., Enhancing Supplemental Nutrition Assistance Program (SNAP) Certification: SNAP Modernization Efforts, March 2010.
5
contractors working with state or local SNAP agencies on their modernization initiatives. Fifty-three partners completed the survey, a 35 percent response rate.
Analysis of the local office survey respondents and nonrespondents showed that completed surveys provided broad representation across state and locally administered programs. Nonrespondents showed no noticeable pattern that differentiated them from those who responded (i.e., nonrespondents were not all from one region of the country, from large states, or from states with state-administered programs); therefore, the potential of nonrespondent bias appears low. In the partner survey, however, the relatively low response rate makes it difficult to determine if the data are representative of overall partner experiences, and it is not possible to discern if nonrespondents are systematically different from those that did respond. However, the partner responses do provide insight into the role that some CBOs and other agencies play in the planning and implementation of SNAP modernization initiatives at both the state and local level. The partner survey data provided general background on the types of partner organizations with which states collaborated and the roles partners played in modernization. More extensive information on partnering agencies described in the report was obtained from the interviews conducted during the case studies.
The project’s interim report, referenced in Chapter 1, relied primarily on the survey of state SNAP directors. Findings from surveys of local SNAP agencies and partner organizations were also included to provide additional context for understanding modernization initiatives and the implementation process.
Survey Limitations Although the survey responses offer a rich source of information on SNAP modernization motivations and initiatives, the following limitations are important to note:
The national inventory represents a point-in-time snapshot of SNAP modernization efforts nationwide. Information was collected during the last half of 2008, and respondents were asked follow-up questions only on those modernization efforts that were implemented after January 1, 2000. However, overview and opinion questions about modernization in general did not direct respondents to focus on a specific point in time, so this could lead respondents to think more broadly about their state’s modernization efforts, including initiatives started pre-2000.
The surveys did not capture the timing of planned initiatives—one state may be in
the very beginning stages of planning, while another may be close to implementing certain efforts. Survey responses do not make those distinctions.
In every state, the responses from state and local program respondents differed
within a single state, across various modernization efforts. In several states there was also variation among the local offices. Responses disagree on the status of implementation, when initiatives were implemented, or even if an initiative exists in the state. There were no discernible patterns to these differences. Some possible explanations for the discrepancies include differences in the point in time at which
6
the surveys were conducted, staff turnover, or perhaps differences in understanding of terminology. Without further information, it is not possible to determine which information is accurate.
In states where SNAP is locally administered, it is unclear what frame of
reference respondents used to answer specific survey questions. State agency respondents should have documented only the efforts that were implemented at the state level. The local office respondents should have included information on those efforts that they initiated and implemented, as well as the state-initiated efforts that were implemented in their local jurisdictions. However, review of the data suggests that some respondents may not have made the distinctions requested.
For more detail on the methodology, limitations, and findings from the national surveys,
see the interim report, Rowe et al., Enhancing Supplemental Nutrition Assistance Program (SNAP) Certification: SNAP Modernization Efforts, March 2010.
C. Fourteen Case Studies
On the basis of information collected through the exploratory site visits and the national surveys, 14 states were chosen for in-depth site visits. The purpose of the visits was to collect qualitative information on modernization efforts in order to
Systematically and comprehensively describe how the certification and recertification processes are carried out from the client and staff perspectives;
Explore the factors that led to shifts in how business is done; and
Describe where and to what extent changes were made and the planning process.
1. Site Selection Process The selection of the 14 case study states was conducted to maximize the diversity of modernization activities. Information gathered during Phase One was updated using data from the national inventory as well as additional information compiled by the FNS Payment Accuracy Workgroup. This information was analyzed using several criteria to select states for this phase of the study. The criteria included the
Type of SNAP administration (i.e., state versus county administered);
Geographic representation based on the seven USDA/FNS Regions;
Types of modernization efforts being implemented;
Stage of implementation (i.e., implemented since 2000, implemented as a pilot, or planned); and
7
Use of commercial or community-based partners.
The states selected to participate in the case studies included the four states from the first phase of the study—Utah, Washington, Massachusetts, and Wisconsin—and Colorado, D.C., Idaho, Illinois, Indiana, Kansas, Mississippi, North Carolina, Pennsylvania, and Texas.
2. Site Visit Activities Multiday visits were made to each of the 14 case study states between February and June 2009. Across all sites, discussions were held with approximately 300 people, including state SNAP policy, operations, and information technology (IT) staff; local office administrators and service delivery staff (from one to two offices in each state); representatives from local community partners participating in modernization activities; and advocacy groups. Local offices identified for visits were selected in consultation with state SNAP administrators and typically included offices that served large SNAP populations and those that had implemented a modernization initiative of interest. Community partners and advocacy groups were also identified in consultation with state contacts and were generally selected to represent diversity among partners, such as whether the service location or partner organization focused on a particular subgroup of the target population. Study teams also observed operations in call centers and document imaging units as well as staff-client interactions in the local offices. Staff also conducted hands-on testing of electronic tools such as state and local agency web sites and SNAP applications and reviewed documents detailing state efforts to modernize SNAP.
Team members also facilitated two focus groups in each state8—one with SNAP participants and one with individuals who were potentially eligible for SNAP but were not currently enrolled. Local office administrators helped recruit participants from their service populations, and community agencies that serve low-income populations, such as food pantries and homeless shelters, recruited nonparticipants. Generally, staff asked clients who visited their locations if they would like to participate in the focus group and later made reminder phone calls the day of the event. A total of 273 individuals participated in the focus groups, with 127 in the participant focus groups and 146 in the eligible nonparticipant focus groups. Roughly, 61 percent of all focus group participants were female and 38 percent were male. Focus group participants ranged in age from 18 to over 56 years. The largest percentage of focus group participants (slightly over 34 percent) were between 41 and 55 years old. The distributions of focus group characteristics were similar to the national SNAP caseload.9
D. Collection and Analysis of Other Quantitative Data
FNS administrative data were used to give state and national context to the examination of modernization efforts in the 14 case study states. State-level SNAP data were downloaded from documents available on the USDA web site and from requests to the FNS National DataBank.
8 In Washington state, only one focus group with SNAP participants was held. There were no attendees for the scheduled nonparticipant focus group. 9 United States Department of Agriculture (USDA). 2008. Characteristics of Food Stamp Households: Fiscal Year 2007. Nutrition Assistance Program Report Series. USDA, Food and Nutrition Service. Washington, DC. http://www.fns.usda.gov/ora/MENU/published/SNAP/FILES/Participation/2007Characteristics.pdf
8
Published FNS analysis of quality control (QC) data was used. State and federal administrative costs, derived from the SF-269 reports, were available online and through requests to FNS staff, as were QC error rates, participation levels from the FNS-388 reports, and issuance data. Data were available for FY 2000 to FY 2008.10 Changes over the past eight years are presented, including national and state trends as a backdrop for the scope and timing of each state’s modernization efforts.
To the extent available, state-level administrative data on modernization efforts were also used. These include internal return-on-investment studies, feasibility studies, call center administrative data, and various other state reports provided to UI staff during site visits. These reports are used primarily to provide context for specific modernization efforts.
10 FY2009 data were not available for all sources; therefore, FY 2008 data are reported for consistency.
9
CHAPTER 3: BACKGROUND
This section provides an overall summary of both the context in which modernization activities were implemented and the types of activities being implemented across the country. Information about the structure of the analysis and timing of modernization is discussed in the overview section. The state and local context section provides details on trends in caseload, administrative costs, and error rates, both nationally and for case study states. Variations in SNAP administration, including the extent of local discretion, and implementation timelines provide further details for understanding study findings.
A. Picture of Modernization
SNAP provides, through state-operated programs, assistance for low-income individuals and households to purchase eligible food items for home consumption. Over the past decade, increased awareness of the importance of SNAP as a basic nutritional safety net, as well as a critical tool in supporting the working poor and, more recently, the newly unemployed, has led to federal and state efforts to increase program access and participation. At the same time, states have been focusing on ways to increase operational and administrative efficiency and ensure program integrity. To meet these goals, states are modernizing their programs by making changes in policy, procedural, and organizational approaches to SNAP application processing, case management, and recertifications. For the purposes of this study, modernization is defined as the package of changes to program application and recertification processes that a state makes to improve client access and service while maintaining or reducing administrative expenses.
Findings from all three phases of the study paint a rich and varied picture of the administration and delivery of SNAP benefits and the implementation of modernization efforts. It is clear that at both the state and local level, the majority of offices are approaching modernization activities from a broad perspective, not limited to SNAP operations but often including TANF and other benefits programs as well. In addition, both states and localities come at these efforts with widely different levels of administrative flexibility and notions of what constitutes modernization efforts. For example, some states did not view partnering arrangements with CBOs to provide application assistance as modernization activities; others did not view the changes they made to improve efficiency, such as restructuring office workflow, as modernization activities. Many states view modernization as a sweeping, multicomponent initiative and may not think that implementation of one or two efforts constitutes modernization. Because it can be defined in many different ways by different entities, this study adopted the most comprehensive definition of modernization, including technological innovations as well as policy and organizational changes and partnering arrangements that affect the way SNAP is delivered to clients.
To document and describe the various modernization efforts being implemented across the country, this study focused on four broad categories of modernization—policy changes, organizational changes and reengineering of administrative functions, technological innovations, and partnering arrangements—defined as follows:
10
Policy Changes
Includes state options, such as simplified reporting requirements, expanded vehicle exemption criteria, expanded categorical eligibility, and use of FNS policy waivers for combined application programs (CAPs) and face-to-face interviews at application or recertification
Organizational Changes and Reengineering of Administrative Functions
Includes changes such as restructuring the up-front client management process in local offices, shifting to a task-based system for managing caseloads, simplifying the application and certification process to improve access, and changing staffing configurations, as well as contracting some organizational functions to commercial businesses
Technological Innovations
Call Centers Refers to centralized locations where clients may call to obtain information about their case, to conduct interviews, or to submit changes to their case
Online Application and Benefit Tools
Allows clients to complete an application electronically through a secure web site, including signing and submitting the application, prescreening for benefits, applying for multiple programs, and checking benefit status
Technology to Advance Paperless Systems
Refers to electronic case files and document imaging technology as well as data-sharing technology—which allows the electronic exchange of client data and documentation with one or more agencies—and electronic caseworker manuals and office correspondence
New Management Information Systems (MISs) and Workflow
Management Systems Includes major updates to MISs or creating new systems, often moving from mainframe systems to web-based systems that allow for new worker entry interfaces and workflow monitoring
Partnering Arrangements
Includes unpaid (or not fully compensated) partnering arrangements with community organizations, other government agencies, and businesses to provide additional access points and application assistance
In Phase Two, state, local, and partner SNAP offices were administered surveys with questions about modernization efforts implemented after January 1, 2000. Discussions conducted
11
in Phase Three as part of the case study site visits also focused generally on the same time period. By identifying a specific date, FNS hoped to focus the study, provide a reference point, and narrow the broad definition of modernization to a specific time period for the survey respondents. However, in-person discussions with program administrators and information provided in the completed surveys indicated that states view SNAP modernization, even with a specified time frame, as a fluid process over a broad range of activities that are not easily pinpointed, classified, or even separated from the modernization of other mainstream benefit programs. State and local modernization efforts are often seen as a natural outgrowth of activities and efforts determined by federal policies and regulations, state and local political and economic environments, the general structure and organization of benefit offices, and access to improved technology. One survey respondent put it clearly, “The Food Stamp Program [SNAP] has been an ever-evolving program with technological advances occurring all along the way.… Modernization is not just conducting telephone interviews; it is the natural evolution of the program.”
B. National, State, and Local Context for the 14 Case Study States
To describe the context in which SNAP operates, this section provides background information at the national level and in the 14 case study states. Information on the overall state characteristics, organizational setting, and program responsibilities of the key state and local agencies is presented. The timing and scope of modernization in the states are also discussed.
1. Overall State Characteristics The following section provides an overview of the national trends in SNAP caseload size, administrative costs, and error rates, with additional detail presented for the 14 case study states. The administration of SNAP is also described, including the degree of flexibility local offices have in administering aspects of the program.
Trends in Caseload, Administrative Costs, and Error Rates Over the past eight years, states’ SNAP caseloads have trended up, while at the same time the administrative costs per person and error rates have gone down in most states. The average caseload increased by about 65 percent nationally (figure 3.1), as compared with an average caseload increase over 75 percent for the 14 case study states (figure 3.2). About half these states were at or below the national average, while three states—North Carolina, Texas, and Washington—had increases of over 90 percent and an additional three states—Indiana, Massachusetts, and Wisconsin—had increases over 100 percent between 2000 and 2008. During the site visits, several states noted that their caseloads had increased by up to 25 percent in just one year (between 2007 and 2008) and that caseloads continued to increase dramatically into the early months of 2009.
12
Figure 3.1: Average Number of Persons in United States Receiving SNAP Benefits by Year
Source: FNS National Databank, U.S. Department of Agriculture, Food and Nutrition Service.
13
Figure 3.2: Average Number of Persons Receiving SNAP Benefits by Case Study State for FY 2000 and FY 2008
0 500,000
1,000,000
1,500,000
2,000,000
2,500,000
3,000,000
Wisconsin
Washington
Utah
Texas
Pennsylvania
North Carolina
Mississippi
Massachusetts
Kansas
Indiana
Illinois
Idaho
District of Columbia
Colorado
Caseload
FY2000
FY2008
Source: FNS National Databank, U.S. Department of Agriculture, Food and Nutrition Service.
14
Overall costs of administering SNAP have continued to increase over the years—by about 40 percent nationally. However, the costs per person to administer the program have decreased by about 16 percent nationally and 11 percent for the 14 case study states, as seen in figures 3.3 and 3.4. Much of this is driven by small increases in administrative costs and large increases in caseload. In the 14 states, the administrative cost per person increased in just four states: D.C., Colorado, Kansas, and Utah. In each state, there were larger-than-average increases in administrative costs and smaller-than-average increases in caseload size. For instance, between 2000 and 2008, D.C.’s average monthly administrative costs increased by over 100 percent, while their average monthly caseload increased by just 13 percent. Their overall administrative costs per person increased by 88 percent during the same period.
Figure 3.3: Average Monthly Cost per Person in the United States to Administer SNAP by Year
0
50
100
150
200
250
300
FY2000
FY2001
FY2002
FY2003
FY2004
FY2005
FY2006
FY2007
FY2008
Dol
lars
Per
Per
son
Source: FNS National Databank, U.S. Department of Agriculture, Food and Nutrition Service.
15
Figure 3.4: Average Monthly Cost per Person to Administer SNAP by Case Study State for FY 2000 and FY 2008
0 50 100
150
200
250
300
350
400
Wisconsin
Washington
Utah
Texas
Pennsylvania
North Carolina
Mississippi
Massachusetts
Kansas
Indiana
Illinois
Idaho
District of Columbia
Colorado
Dollars Per Person
FY2000FY2008
Source: FNS National Databank, U.S. Department of Agriculture, Food and Nutrition Service.
Between 2000 and 2008, the average combined error rate11 decreased by just over 20
percent nationally, as shown in figure 3.5. The average combined error rate for the 14 case study states was about 4.6 percent (just under the national average of 5 percent) in 2008, with the rate in all but two states—Indiana and Texas—declining over the eight-year period (see figure 3.5). Indiana’s error rate increased by about 10 percent between 2000 and 2008, while Texas’ rate increased by over 70 percent. The other 12 states decreased their error rates by much more than the national average, with eight states decreasing rates by more than 50 percent.
11 The combined error rate includes overpayment and underpayment rates. The average overpayment rates in the case study sites tend to be much higher than the underpayment rates, although the same general patterns hold across both error rates as they do for the combined rate.
16
Figure 3.5: Average Combined Error Rates for the SNAP Program by Case Study State and in the U.S. for FY2000 and FY2008
0 2 4 6 8 10 12 14 16
Wisconsin
Washington
Utah
Texas
Pennsylvania
North Carolina
Mississippi
Massachusetts
Kansas
Indiana
Illinois
Idaho
District of Columbia
Colorado
US
Percent of Caseload Cases in Error
FY2000
FY2008
Source: FNS National Databank, U.S. Department of Agriculture, Food and Nutrition Service.
Administration of the Program
States varied in their approach to program administration and in how much discretion and flexibility they gave local offices in administering SNAP. As shown in table 3.1, survey data indicated that the majority of state SNAPs (39) were administered at the state level. Twelve states reported that SNAP was locally administered: Individual county or local SNAP offices made day-to-day operational decisions. Eleven of the 14 case study states were state administered; Colorado, North Carolina, and Wisconsin were locally administered.
In state-administered programs, the state generally determines the number of local offices available to provide services, with little local discretion. In contrast, local administrators or county boards determine coverage for locally administered programs. The national survey provided data on the number of local offices in each state. The number of offices varied
17
significantly, ranging from zero offices in Vermont12 to 380 offices in California, a locally administered state. In addition, 39 percent of local office respondents reported that they had outstationed workers to take and process applications at other locations in the community. Note, however, that the number of local offices is just one indicator of coverage for service provision and does not reflect between- or within-state variation in distances to local offices or the ratio of staff to clients. Table 3.1 also presents the ratio of local SNAP offices to SNAP clients in FY 2008 and to the geographic size of each state (in square miles).13 Six of the ten states with the most local offices also had the largest caseload, while only two of those states were the largest in land mass. Overall, about half the states with below-average ratios of participants to offices and land area to offices were states with an above-average number of local SNAP offices. Therefore, these states appear to have more offices in response to the size of their caseload and geography. In general, as more states modernize their processes and eliminate the need for office visits, these disparities across states may become less important or noticeable to the client.
12 Vermont’s state survey indicated they have no local offices, but responses to subsequent survey questions do address local office flexibility. This may be a result of differences in terminology—the state’s web site lists 12 district offices for their 3SquaresVT program, which administers SNAP benefits. 13 The calculations do not attempt to determine actual number of visits to individual offices or the distance between offices. The table presents the total state caseload and overall land area compared to the total number of offices in the state.
18
Table 3.1: Administration and Number of SNAP Offices
State Entity responsible for administering SNAP
Number of SNAP offices across state
Ratio of total SNAP participants to offices
Ratio of land area (sq. miles) to offices
Alabama State 70 8,166 725Alaska State 17 3,352 33,644Arizona State 86 7,298 1,321Arkansas State 83 4,553 627California County 380 5,842 410Colorado County 90 2,810 1,152Connecticut State 12 18,782 404Delaware State 18 12,777 9D.C. State 7 4,135 109Florida State 97 14,999 556Georgia State 170 6,007 341Hawaii State 45 2,146 143Idaho State 27 3,711 3,065Illinois State 115 11,300 483Indiana State 92 6,776 390Iowa State 99 2,608 564Kansas State 45 4,168 1,818Kentucky State 120 5,277 331Louisiana State 63 12,551 691Maine State 16 10,815 1,929Maryland State 43 8,372 227Massachusetts State 26 19,453 302Michigan State 82 15,322 693Minnesota County 87 3,378 915Mississippi State 82 5,453 572Missouri State 124 7,166 556Montana State 44 1,827 3,308Nebraska State 63 1,918 1,220Nevada State 15 9,633 7,322New Hampshire State 12 5,299 747New Jersey County 32 13,683 232New Mexico County 34 7,058 3,569New York County 58 33,672 814North Carolina County 100 9,470 487North Dakota County 51 949 1,352Ohio County 108 10,657 379Oklahoma State 90 4,656 763Oregon State 147 3,193 653Pennsylvania State 101 11,761 444Rhode Island State 5 16,974 209South Carolina County 46 12,821 655South Dakota State 66 954 1,150Tennessee State 97 9,394 425Texas State 311 8,142 842Utah State 35 3,834 2,347Vermont State 0 4,654 771Virginia County 120 4,542 330Washington State 65 8,938 1,024West Virginia State 54 5,126 446Wisconsin County 79 5,352 687Wyoming State 29 780 3,348
Source: 2008 State Food Stamp Agency Survey conducted for the U.S. Department of Agriculture, Food and Nutrition Service.
Notes: N = 51. In the survey, Vermont indicated that it had no local offices; however, the state’s web site lists 12 district offices for their 3SquaresVT program, which administers SNAP benefits. Bold typeface indicates case study states.
19
Responsibility for Policy Decisions and Degree of Local Flexibility All states indicated that primary responsibility for making decisions about SNAP policies with respect to certification, recertification, and reporting rests at the state level. States, however, reported more local discretion for ongoing case management, such as determining client office flow and staff organization. About 35 percent of all states indicated that the county or local office has primary responsibility for those decisions. County-administered states tended to have more local office flexibility for all types of procedures; however, decisions about certification, recertification, and reporting still fell largely to the states.
Other Contextual Factors The economic downturn was most often discussed by states as having implications for modernization efforts. Specifically, the downturn dramatically increased caseloads, as described above, and changed the types of households accessing the system. Households that had never before been part of the assistance system are now applying for benefits. Staff generally reported that these new cases were harder to process and take more time; because these clients were new to the system, all their information had to be entered and verification collected. In addition, they generally had income and children, which increased the documentation required. They also often did not understand the application and certification process, which falls to the caseworker to explain.
While workload increased, most states faced staff reductions through hiring freezes or restrictions. Many state governments also made budget cuts or were operating at deficits, putting pressure on SNAP agencies to cut costs. Several states discussed postponing the development of additional changes or slowing the overall modernization process. For example, Wisconsin staff discussed not having the staff or funding available to implement a long-planned CAP, and Kansas reported that lack of funds prevented it from developing a new MIS. Most states are composed of both urban and rural areas, which can be a challenge for implementing new modernization activities as well. The initiatives should work for both types of populations, addressing differences in technological capacity and need as well as staff culture. For example, Utah reported some difficulties with Internet reliability in rural areas of the state. Staff in other states noted that shifting away from a traditional caseworker model could be challenging in smaller offices in rural areas where staff had built personal relationships with clients.
2. Service Delivery Characteristics This section provides an overview of the range of benefit programs that state and local offices administer, as well as caseworkers’ responsibilities. Details on the various types of models states use to deliver services to clients are also discussed.
Program and Caseworker Responsibilities Rarely do state and local offices administer only SNAP. Nationally, most state agencies responsible for administering SNAP were responsible for determining policy and administering
20
multiple social service programs. The majority of state offices administered Temporary Assistance for Needy Families (TANF), Medicaid or medical assistance, and childcare subsidies in addition to SNAP. As table 3.2 shows, most state SNAP agencies were housed in departments, bureaus, or agencies also responsible for TANF, and over 60 percent were administered together with Medicaid or medical assistance or childcare subsidies. Almost half the states administered all three programs within the same state agency as SNAP. About half the states administered child support, Supplemental Security Insurance (SSI), General Assistance, or energy assistance in addition to SNAP. Only 6 percent of state agencies administered only SNAP.
Local offices were also generally responsible for administering multiple programs. As table 3.2 shows, almost all local offices reported that they were responsible for administering TANF and 90 percent for administering Medicaid benefits in addition to SNAP. Responsibility for child care (68 percent) and General Assistance programs (54 percent) was also common. No local offices reported that they were responsible for SNAP only.
Table 3.2: Percentage of SNAP State and Local Agencies Responsible for Administering Additional Assistance Programs
Assistance programs Percentage of states Percentage of local TANF 92 97 Medicaid/Medical Assistance 69 90 Child support 47 33 SSI 45 34 State-funded food assistance for noncitizens 20 27 General Assistance 51 54 Job Service/Wagner-Peyser 6 11 Child care 63 68 Energy Assistance 47 47 Women, Infants, and Children Program 8 6 Workforce Investment Act 2 3 None (only SNAP) 6 0
Source: 2008 State Food Stamp Agency Survey conducted for the U.S. Department of Agriculture, Food and Nutrition Service.
Notes: N (state) = 51, N (local offices) = 98
A similar pattern occurs for the program responsibilities among local SNAP offices. As shown in table 3.3, in 90 percent of the states surveyed, SNAP caseworkers were also responsible for delivering TANF benefits and 82 percent for providing Medicaid/Medical Assistance. Only two states reported that their SNAP caseworkers worked solely with SNAP cases. While caseworker program responsibilities were typically the same throughout a state, 16 states reported that their caseworkers’ responsibilities varied from office to office.
21
Table 3.3: Percentage of States in Which SNAP Caseworkers Are Responsible for Administering Additional Assistance Programs
Assistance programs Percentage of states TANF 90Medicaid/Medical Assistance 82Child support 2SSI 25State-funded food assistance for noncitizens 12General Assistance 49Job Service/Wagner-Peyser 2Child care 37Energy Assistance 22Women, Infants, and Children 0Workforce Investment Act 2Varies by office 31a
None (caseload is SNAP-only) 4Source: 2008 State Food Stamp Agency Survey conducted for the U.S. Department of Agriculture, Food and Nutrition Service.
Note: N = 51 a Several states indicated both “varies by office” and that specific programs, such as TANF, were administered by caseworkers. It is likely that specific programs (e.g., TANF) are always administered by SNAP workers in each office while administration of other programs (e.g., SSI) may vary.
In the 14 case study states, all state and local agencies administered multiple programs.
Almost every state agency administered TANF, and most administered medical assistance and General Assistance programs. Caseworkers in most of these states also determined eligibility for TANF and medical programs, along with SNAP.
3. Timeline and Scope/Scale of Modernization Efforts The degree to which states modernized and the timing of modernization varied across the 14 case study states. States were in different stages of modernization, with some states modernizing for over a decade and others just beginning. States considered less modernized were those that implemented few modernization initiatives and most significant modernization was recent, whereas the more modernized states implemented most initiatives of interest and had been modernizing for several years. Figure 3.6 shows where the states fall on a continuum of scope of modernization.14 Pennsylvania, Utah, Washington, and Wisconsin are among the most modernized states. They implemented many efforts, including policy and technological changes, in addition to restructuring service delivery processes. Most activities were also implemented statewide and available to all clients. Colorado, Illinois, Kansas, and Mississippi modernized some aspects of their programs but were far less advanced, or the initiatives tended not to be statewide. The remaining states fell somewhere between these two groups.
14 States were placed on the continuum based on the number of initiatives they implemented, the length of time activities have been in place, and the scope of those initiatives (e.g., Texas has implemented several efforts but most are only in select regions of the state and do not affect a majority of the caseload; therefore, its modernization is considered moderate).
22
Figure 3.6: Continuum of Degree of Modernization for Case Study States
The most modernized states had been continually modernizing for the past 5 to 10 years, whereas the less modernized states tended to start their key modernizing efforts in the past few years. For instance, Washington implemented most of its major modernization initiatives between 2000 and 2003, and Utah has continually implemented and expanded activities since 2000 to the present. States that were less modernized, such as Mississippi and Illinois, began implementing most efforts in 2006 and 2007.15
15 The state profiles in Volume II of this report provide timelines for implementation of key modernization efforts by state.
Moderate Modernization
More Modernized
Colorado Illinois Kansas
Mississippi
D.C. Idaho
Indiana North Carolina Massachusetts
Texas
Pennsylvania
Utah Washington Wisconsin
Less Modernized
23
CHAPTER 4: CROSS-STATE DESCRIPTIVE STUDY FINDINGS
This chapter first provides a brief overview of the national findings, with detailed information for the 14 case study states, followed by a discussion of the activities states have implemented within the four broad categories: (1) policy changes, (2) reengineering of administrative structures and organizational roles, (3) technological innovation, and (4) partnering arrangements. The unique features of the initiatives, with examples from individual states and local offices visited during the case studies, are described in each section. States’ key goals for modernization and key factors affecting implementation are also discussed.
A. Overview of State Efforts to Modernize SNAP and Timing of Modernization Efforts
This overview describes states’ key goals for modernization and the motivations for modernizing.
1. Key Factors Affecting Implementation of Modernization Nationally, the decision to implement a given modernization effort was generally split between state and local offices. Policy decisions in most cases came from the state level, while decisions concerning the modernization of business processes often originated at the local level, especially in those states that are county-administered. Technological and partnering efforts were just as likely to start at the state level as they were at the local level. However, the decision to modernize was the result of a variety of factors in both the state and local offices.
The national inventory of state modernization efforts found that the majority of states identified the following key factors as driving the modernization of their state SNAPs: increasing caseloads in local offices (66 percent), economic downturns (59 percent), state legislation (51 percent), and high staff turnover (51 percent). The 14 case study states reported factors that can be grouped into five categories:
Economic Environment;
Intra-agency Actors;
Extra-agency Actors;
Agency Restructuring; and
FNS Actions.
As shown in table 4.1, these factors played a significant role in more than one case study state; they also had an effect on multiple modernization initiatives. How key factors affected specific modernization efforts will be addressed in subsequent sections; the factors themselves are discussed here, with specific examples from the case study states.
24
Table 4.1 Key Factors Affecting Modernization
State
Economic Environment
Intra-agency Actors Extra-agency Actors
Age
ncy
rest
ruct
urin
g
FNS Actions
Dec
reas
es in
st
aff
Incr
ease
s in
case
load
Hir
ing
free
zes
Dis
aste
rs
Dep
artm
ent
dire
ctor
Staf
f
Gov
erno
r
FNS
Stat
e le
gisl
atio
n
Fede
ral
legi
slat
ion
Adv
ocat
es
Exa
mpl
es in
ot
her
stat
es
Sanc
tions
sinc
e 20
00
Bon
us m
oney
si
nce
2002
Colorado D.C. Idaho Illinois Indiana Kansas Massachusetts Mississippi North Carolina Pennsylvania Texas Utah Washington Wisconsin
The Economic Environment Staff often mentioned economic factors driving the need for modernization, likely because the interviews coincided with a deep economic recession. Offices in all 14 case study states have struggled with significant increases in caseloads recently, especially in those states that also experienced decreases in staff and administrative resources. Both caseload increases and staff reductions have occurred steadily since 2000 in several states. Pennsylvania, for example, had lost approximately 100 staff members per year since 2000, while the caseload increased by more than 50 percent from FY 2000 to FY 2008. As shown in table 4.1, 5 of the 14 case study states visited were under a hiring freeze at the time of the interviews, unable to hire additional staff even as positions were vacated.
The changing composition of caseloads compounded workload problems. Staff noted that
recent increases in participation were dominated by “new” clients with more complicated and challenging cases. Staff noted that these increases and changes in caseloads, often accompanied by decreases in administrative budgets and staffing levels, led them to seek out ways to “do more with less.” Some states noted that efficiency measures were a “necessity” and simply an effort to “stay above water.” These initiatives ranged from major technology innovations, such as document imaging and call centers, to smaller business process changes at the individual staff level. Washington, for example, conducted a step-by-step examination of the work process for frontline staff, mapping out a worker’s routine to find ways to save even a few seconds per client.
25
Natural disasters affected several states, including Mississippi, Pennsylvania, Washington, Texas, Wisconsin, Idaho, and Indiana. In Washington, flooding in one region of the state caused staff to open up call centers in other regions to serve clients affected by the disaster. Staff statewide were able to step in to help deal with the affected region’s loss of electricity and workable office space and the sudden influx of clients. The success of the response contributed to Washington’s decision to restructure its call centers to form a statewide model using regional call centers connected to each other virtually. Similarly, Pennsylvania reorganized call centers to maintain continuity of operations after its experiences responding to client needs during flooding in 2006. Mississippi adopted document imaging in its state offices to deal with the increase in case records caused by the Hurricane Katrina disaster. Indiana used electronic case files to move cases from areas of disaster to functioning offices, and now considers them vital for dealing with future disasters.
Intra-agency Actors Staff needs, ideas, and philosophies at the state agency responsible for implementing SNAP also played a large role in the decision to implement modernization initiatives. Top-down support from directors of agencies and agency divisions often led a state or county to take on an effort. In D.C., significant business process changes and document imaging were reportedly the direct result of the “vision” of a new agency director. In North Carolina, one county staff member attributed recent modernization efforts directly to a change in the agency director, noting: “This was the initiative of a new director. The agency has taken on new focus and new vision; we want to be actively engaged and recognized in the community as leading the effort and charge to provide these services to a community in a needs based/solution focused way.”
County and local office administrators and staff also played a role in bringing about various modernization initiatives, although to a lesser extent. In Washington State, eligibility staff and county-level directors were included on planning committees to help identify new areas for modernization, including setting up the statewide call center and multiple business process changes. In North Carolina, state staff noted that pressure from county staff and administrators for improved technology was a major impetus for starting their statewide modernization efforts.
Extra-agency Actors Various actors from outside the SNAP agency sparked initiatives in the majority of case study states. These included state and federal players—governors, state legislators, FNS staff, and federal legislators—as well as private entities such as businesses and advocates. Within the state government, governor-led initiatives were mentioned in four states, mostly in the form of broad directives rather than specific projects. Staff in Mississippi attributed a new computer system and various technological initiatives to the governor’s push to make Mississippi more technologically driven. In Wisconsin, efforts to increase accuracy were pushed forward when the governor made it a priority, and in Pennsylvania, state staff noted that support from their governor helped bring multiple projects to fruition.
State legislation had the same effect for four states but tended to be geared to more specific initiatives. In Texas, modernization was mandated by the state legislature and included language on privatization, outsourcing work, and implementing call centers. Similarly, the D.C.
26
Council passed legislation pushing the SNAP agency to expand categorical eligibility.16 In Utah, state agency workers drafted a business plan that included a comprehensive overhaul of its eligibility model, focusing on improvements to its business process to preempt any legislative or executive efforts to privatize the system.
FNS regional staff encouraged a few states to modernize and, more generally, to increase participation, address error rates, and improve the timeliness of application processing. Staff in state offices mentioned consulting with regional FNS staff about what other states were doing and what policy options were available. For example, state staff in Texas noted that FNS staff helped the state decide to apply for the waiver and implement its CAP, along with various other policy options. Federal legislation, such as the 2002 and 2008 Farm Bills, also provided states with a host of policy options to streamline their modernization activities. State policy staff noted that they continually looked at the policy options available, deciding whether each option or waiver was a good fit at that time and whether it would simplify the program for either staff or clients.
Nongovernmental pressure to modernize was evident in a few states, with states noting significant advocacy efforts. In D.C., staff noted that advocates were key in alerting agency staff to various modernization initiatives going on around the country and to options available through FNS and other agencies. A state official in Washington explained that advocates helped give voice to client concerns, noting, “We have an advocate group we hear a lot from. They walk in our lobbies. They let us know what they don’t like.…Every time there is a new way to do things they let us know.” Staff reported that some modernization efforts were the direct result of pressure from advocacy groups, noting that they often pushed their state to catch up with other states that were more advanced with their modernization initiatives.
Staff noted that the examples of modernization in other states showed what types of initiatives were possible and provided a path to modernization in their own states. Some states learned about modernization initiatives in other states from professional associations and in-person visits to observe new programs. Initiatives in Mississippi reportedly were based on similar efforts in Alabama, Minnesota, Florida, South Carolina, and Georgia, which staff learned about at events like the National Association for Program Information and Program Management meetings. Staff from D.C., Wisconsin, and Utah traveled to Florida to learn firsthand how that state modernized their business processes, and Idaho staff noted that the progress of other states motivated their agency directors to try to keep pace. Similarly, staff in several states, including North Carolina and Utah, noted pressure to keep up with the improved technology of private businesses.
Agency Restructuring
Some states noted that agency restructuring produced an environment that brought about modernization. For example, Wisconsin staff reported that their modernization efforts were shaped significantly by the shift of SNAP to an umbrella agency, which also administered Medicaid. This reorganization allowed the agency to coordinate SNAP improvement with the
16 Staff noted that they were planning on moving forward with expanded categorical eligibility regardless of the Council’s actions.
27
state Medicaid program and focus on increasing participation in all programs, while at the same time educating families about health and nutrition through outreach. The organizational change also gave rise to a new approach addressing SNAP and Medicaid programs holistically and to developing strategies that aligned and leveraged the benefits of both programs. Staff in Washington and North Carolina mentioned that the restructuring of their county offices to include more programs under one roof led to new modernization opportunities.
FNS Actions Pressure from the federal government to modernize came in the form of sanctions for high error rates or low participation and timeliness rates. States noted that sanctions put significant pressure on already dwindling budgets and thus forced states to pursue initiatives to increase efficiency and accuracy. As of 2002, Wisconsin’s SNAP had been in sanction status for 10 years, an ongoing situation that the governor and others deemed unacceptable. Limited state resources provided further motivation to reduce sanctions by reducing the state’s SNAP error rate. This, in turn, led to various modernization initiatives and the adoption of several 2002 Farm Bill options. Similarly, in response to error rate sanctions of $2 million in FY 1999 and FY 2000, Utah used SNAP reinvestment funds to develop a web-based, data-sharing system to increase accuracy and reduce errors.
Staff in case study states also mentioned that bonus money received for increasing accuracy and application timeliness was a driving force for various efforts, making time for planning of new initiatives and increased technology possible. Staff in North Carolina, for example, attributed the continuation of their statewide modernization efforts to the availability of bonus funds for five years. Mississippi also noted that bonus money was used to purchase technological upgrades, including document imaging equipment. As shown in table 4.1, 4 of the 14 case study states noted that they used bonus money, at least in part, to modernize their program.
2. Key Goals for Modernization National inventory findings indicate that the majority of states were looking to simplify the SNAP process for clients and workers, increase client access and participation, decrease errors, and reduce administrative costs by implementing modernization activities. Few states specifically sought to decrease fraud. Most modernization initiatives were aimed at alleviating both client and administrative problems of access or expense. However, some initiatives—such as paperless systems, electronic applications, and data sharing—were specifically designed for administrative purposes, whereas others—such as CAPs and partnering—were more focused on clients.
The 14 case study states generally followed national trends with respect to modernization
goals. Across the states, there was very little variation. All 14 states mentioned increasing customer access and improving efficiency as primary goals for modernizing. Other related goals frequently cited included reducing costs, managing the workload, and maintaining or improving program performance. Some states specifically spoke of goals to “act more like businesses” in terms of efficiency and use of technology. Others focused their future planning on addressing
28
technological deficits. Each goal, however, was grounded in either increasing efficiency or improving customer service, or both.
B. Policy Changes
States are not required to use the policy options or apply for waivers; however, both provide the flexibility to improve the efficiency of the program and reduce client access barriers. In many states, the policy options and waivers also facilitate other modernization efforts. For example, waiving face-to-face interviews allows states to more liberally use call center staff to conduct client interviews. State staff in two states, Massachusetts and Pennsylvania, noted that implementation of new policy options and waivers was their most significant accomplishment. Pennsylvania staff noted that “policy drives systems” and it allowed them to simplify the eligibility process, making it easier for clients to access benefits while at the same time increasing overall efficiency. Other states, such as Utah and Wisconsin, pointed to the critical importance of policy changes—particularly waivers related to interviewing—in the success of their overall modernization process.
Most available policy options were created or expanded under the Farm Security and Rural Investment Act of 2002 and the Food, Conservation and Energy Act of 2008, but states have always had the opportunity to apply to FNS for policy waivers. Table 4.2 provides a subset of state options and waivers by state that are most pertinent to modernization.
States have an array of policy options17 available to them, including simplifying or
reducing the reporting requirements for SNAP clients. These options reduce the burden on clients by allowing more flexibility in when they must report changes. Households that have simplified reporting are required to report changes between certification periods only if their total countable income rises above 130 percent of the federal poverty level. In addition, even households for whom simplified reporting is not available may be required to report only certain types of changes. Under change reporting, only changes in work or job status or income increases over $100 need be reported. As of 2009, 48 states nationally and all 14 case study states had simplified reporting, and 36 states nationally, including 12 case study states, implemented change reporting. Staff in Washington felt that implementation of the simplified reporting policy had the most dramatic effect on the success of their program, resulting in increased participation, accuracy, and efficiency. They reported that the effect on accuracy was apparent 60 days after implementation and that their error rate continued to improve. Staff described simplified reporting as unique because it increased accuracy while encouraging participation.
States also have options to better align the SNAP and TANF program rules, including
exempting the value of vehicles as they do in TANF and using broad-based categorical eligibility for SNAP when a household receives benefits or services funded by the TANF program. All but two states nationally expanded the vehicle exemption policy for SNAP to one vehicle per household or all vehicles owned by the household. In addition, 29 states expanded categorical 17 All national data on policy options reported in this section were obtained from the “Supplemental Nutrition Assistance Program State Options Report,” Eighth Edition. U.S. Department of Agriculture, Food and Nutrition Service. June 2009.
29
eligibility for SNAP households and an additional 11 states were operating under narrow categorical eligibility for SNAP households that are receiving or certified as eligible to receive benefits or services that are at least 50 percent funded by TANF or maintenance of effort funds. Ten case study states have implemented broad-based categorical eligibility.
Several states also chose state options to simplify deductions when calculating household
net income. Most case study states implemented a mandatory simplified standard utility allowance in lieu of actual utility costs. A few states also accept self-declaration of dependent care deductions and use standard self-employment and medical deductions.
Table 4.2: State Policy Options and Waivers for Case Study States As of June 2009
Modernization effort CO DC ID IL IN KS MA MS NC PA TX UT WA WI Total
State Options Simplified reporting requirements
14
Expanded vehicle exemption
14
Broad-based categorical eligibility
10
Simplified standard utility allowance
11
Self-declaration of dependent care deductions
2
Standard self-employment deduction
5
Standard medical deductions
4
FNS Waivers Revolving-door waiver
4
Waiver of face-to-face interview at initial certification
6
Waiver of face-to-face interview at recertification
10
CAPs 6 * Indicates states that are planning to implement the policy or are applying for a waiver.
States also have the opportunity to apply to FNS for waivers to certain federal policies. Four types of waivers that aid states in meeting their goals of modernization are discussed here—revolving-door waivers, waivers of the face-to-face interview and initial certification and recertification, and CAPs. Four case study states requested revolving-door waivers, which allow staff to reopen a case within 30 days of the closure if that closing resulted from not receiving verification materials and the client subsequently provides the appropriate materials. This
30
Box 4.1: Massachusetts’ Policy Choices
Massachusetts has implemented a host of SNAP policy changes in an effort to increase participation, relieve the administrative burden on staff, and improve customer service. Massachusetts has taken advantage of many SNAP state options, including simplified reporting requirements, expanded vehicle exemptions that mirror TANF rules, maximized categorical eligibility, standard utility allowances, self-declaration of dependent care deductions, and standard self-employment and medical deductions. The state was also granted a revolving-door waiver and a waiver of the face-to-face interview at the time of recertification.
The state implemented broad-based categorical eligibility by giving all clients at the Department of Transitional Assistance (DTA) a “resource brochure” describing social services that may be available. The brochure was paid for with TANF dollars, thereby providing a TANF benefit to everybody who receives a brochure.
In addition, Massachusetts received a waiver to operate the Bay State CAP, a collaboration between DTA and the SSA. A specialized unit housed within a local DTA office processes all new applications and redeterminations for SSI recipients who are unmarried, prepare food alone, have no earned income, and are U.S. citizens. Initially, SSA provided a list of SSI recipients who are eligible for this program. DTA then sent each individual a letter and an EBT card telling that person he or she was eligible for Bay State CAP Food Assistance. To receive benefits, individuals needed only to activate the EBT card; there is no additional paperwork. A phone bank was set up to field-test questions in response to the letters; staff feel this is a key component of the program. After the initial wave of enrollments, DTA modified the certification procedure somewhat. Individuals are enrolled into the program only at application for SSI or during their SSI reevaluation, which is about every three to seven years. All CAP cases have a recertification period of three years and are error protected (because all information sent by SSA is viewed as credible).
reduces case “churning” and work for staff and clients who would otherwise have to begin the application process over again.
Most states also received waivers from the federal law requiring states to conduct face-to-
face interviews with clients at certification and at least once every 12 months thereafter. Thirty-four states nationally had authorization to waive face-to-face interviews—21 waived the interview at initial certification and 34 waived the recertification interview. Ten case study states received waivers for recertification and six received them for initial certification. Waiving the face-to-face interview allowed states to conduct the interviews over the telephone. The same information was collected during the same intervals and, if requested by the client, the state provided the opportunity for a face-to-face interview. These waivers most often facilitated states’ intentions to reduce traffic in offices and create full-service call centers.
In addition, several states received or planned to apply for a CAP waiver, a streamlined SNAP application process for certain individuals who apply for SSI. This process made it easier for qualified SSI recipients to automatically receive a standard SNAP benefit and relaxed many requirements, such as completing a separate application and waiving face-to-face interviews.
31
Participation through CAP also extends the certification period for up to three years. Twelve states nationally (six case study states) reported that they implemented CAP waivers.
States have discretion to structure their CAPs in various ways. All states waived face-to-face interviews for CAP recipients; contact was made by phone or mail. In addition, most had standardized benefit amounts. Some CAP participants receive higher benefits than they would receive under standard SNAP rules. In addition, many states automatically certified the SNAP eligibility of SSI recipients based on Social Security Administration (SSA) data; the client was not required to complete a separate SNAP application. For example, Massachusetts sends eligible clients a letter with an electronic benefit transfer (EBT) card. To accept benefits, the client must simply activate the card and they are enrolled. Massachusetts’ CAP (described in box 4.1) has enabled the state to enroll thousands of people (approximately 10 percent of its overall caseload) that staff feel would not have otherwise applied for SNAP. In other states, they send targeted letters to eligible clients asking them to enroll; Washington sent letters every month over a two-year period to clients in an effort to enroll them. In addition, CAP cases in many states are required to be recertified only every three years, and some states do not include CAP cases in their error rate calculations.
C. State Efforts to Reengineer Administrative Structures and Organizational Roles
As part of their modernization efforts, states made a variety of organizational changes and restructured certain administrative processes and functions. These initiatives fundamentally changed the ways SNAP agencies process applications and manage caseloads and the ways clients interact with agency staff. The overall goals of these efforts were to remove barriers to participation—increasing access—and to improve client service and administrative efficiency by streamlining procedures. Many modifications to the business process were facilitated by policy changes (e.g., elimination of the requirement for face-to-face interviews) while others were made possible by technological innovations, such as call centers and online applications. This description of efforts to reengineer administrative structures and functions within the agencies, though not exhaustive, describes some of the most common changes implemented in the case study states. Also included in this section is a discussion of administrative functions that private businesses performed under formal paid contractual arrangements, including the privatization of some SNAP-related activities in Texas and Indiana.
1. Organizational Changes and Process Reengineering In some states, organizational changes and process reengineering were piloted in selected local offices and then rolled out statewide but in others they were being pilot-tested in only a few offices.18 The latter was particularly true in county-administered states. See table 4.3.
18 Some states piloted certain efforts, which were later discontinued. Details about the reasons for discontinuing these efforts are included throughout the report, when available.
32
Table 4.3: Organizational Changes and Process Reengineering among Case Study States As of June 2009
Modernization effort CO DC ID IL IN KS MA MS NC PA TX UT WA WI Total
Restructuring the up-front process in local office
12
Shift to workload/task-based systems for managing caseload
9
Process Simplification and Improved Customer Access Combined or simplified application
14
Accept applications & recertification by fax
14
Multilingual language telephone lines
6
Redesigned client forms 6
Outstationed SNAP workers 9
Mobile eligibility units 3
Changes in office hours 7
Restructuring of Staffing Configurations Telecommuting 2 Changes in staff hours or work days
4
Use of workgroups in modernizing
9
* Indicates states that are planning to implement the activity.
Restructuring of the Up-front Process in Local Offices The majority (12) of the case study states implemented one or more changes to reengineer the up-front experience for clients who come into a local office to apply for benefits or conduct SNAP-related business. These changes typically involved creation of self-service areas in the reception or waiting rooms, new staffing arrangements, or adjustments to the initial service delivery procedures to reduce the need for subsequent visits. Self-service capabilities in the reception area. Indiana, Pennsylvania, Washington, and Wisconsin reorganized the physical layout of the waiting rooms to create self-service areas. Touch-screen kiosks for check-in, streaming informational videos, copying machines, computers
33
Box 4.2: Pennsylvania’s Modern Office
Pennsylvania was in the process of implementing a multiphase, multicomponent major restructuring of the service delivery system for SNAP and other benefits called Modern Office. Using the flexibility afforded by waivers and other policy changes and maximizing new technology such as electronic applications, call centers, and automated work management systems, the state was rolling out a new approach to providing services that focused on improved customer access and services and increased efficiencies. The first phase, rolled out statewide in spring 2008, focused on the “front end” or up-front services available to a client.
Restructuring in the local offices included creation of a self-service reception area with a stand-alone online application kiosk, direct phone lines to the call center, direct phone lines to the EBT contractor for card pinning, scanning/copying equipment, a drop-off box, and an instructional video and informational brochures. The biggest change under this new model was a shift from scheduled appointments to a walk-in application process, which dramatically decreased the wait time in local offices. This was accomplished with the addition of one or more customer service representatives (CSRs) in the reception area. The CSR, an eligibility worker, was available to meet immediately with new and existing clients without appointments to answer questions, take information, make address changes, verify documentation, provide application assistance, and troubleshoot as needed. In most offices, new applicants could be referred immediately to eligibility workers who reviewed the application with the client and conducted an eligibility interview. Some pilot offices were also testing a greeter position, a clerical staff member who determined the needs of clients and directed them as appropriate.
A new phase of the project (being piloted at the time of the site visit) divided the up-front team into CSRs—who interfaced with clients but could also conduct an immediate intake process with walk-ins who had their documentation —and processors—who completed the application process for the walk-ins who did not have the required documentation at the time of their initial visit.
linked to online applications, or telephones with a direct line to call centers were available for clients to use on their own or with some assistance from staff. Staff in these offices encouraged clients to use these tools to save time. New staffing arrangements. Illinois, Kansas, Pennsylvania, and Wisconsin introduced “greeter” positions, typically clerical staff, who acted as the first point of contact in the reception area to answer questions, provide information, and direct clients to other workers as needed. Idaho chose to assign higher level staff with authority to make eligibility decisions to be present in the reception area to answer specific technical questions about cases. Idaho stationed an eligibility worker at the front desk to meet with clients as they came in to determine their needs, provide them with information about documentation requirements, and, in some cases, direct them to another worker to determine eligibility that day. Staff felt that this change not only moved clients through the process more quickly but also saved staff time spent processing and denying cases by weeding out those who were unqualified earlier in the process.
Wisconsin’s Dane County office modified its up-front process to add multiple types of staff in the reception area at all times—a greeter who circulates throughout the lobby and helps and directs clients, a clerical staff member who accepts applications and answers general questions, and an eligibility worker who deals with more complicated issues.
34
Box 4.3: Task-Based Management Approach in Larimer County, Colorado
The SNAP agency in Larimer County moved to a single caseload and task-based case management approach to improve customer service and stretch limited resources in 2007. At the time, caseloads were increasing and there was a great deal of staff turnover after implementation of the new MIS. Leadership at these offices recognized the opportunity to make changes to become more efficient in managing workloads and to improve service flow and access for the customer. Another impetus for the task-based model was to ensure adequate planning of workload for family leave situations. With a single caseload for the office, an individual worker who was taking an extended leave would not have to spread his or her caseload across the other workers.
Under this model, caseworkers no longer have their own caseload; there is a single caseload for the county. Supervisors assign groups of case workers a single task (e.g., eligibility interviews) on a weekly basis. On the basis of the number of open cases or potential backlog, supervisors provide caseworkers with a list of cases that need some action taken (e.g., verification of documents, recertification) to complete for the week. Responsibilities can shift and change during the week as the caseload needs change.
Changes to the initial service delivery process. Pennsylvania, Idaho, and Kansas restructured processes so that clients can meet with an eligibility worker on the same day, rather than coming back to the office for a scheduled appointment. Pennsylvania’s “Modern Office” initiative enabled walk-in clients to meet with an eligibility worker on the same day. Staff viewed this change as a major success in improving customer service, as evidenced by decreased wait times in local offices (see Box 4.2).
Shifts to Workload Management or Task-Based Systems for Managing Caseloads As part of their efforts to reengineer the administrative process, more than half the case study states were experimenting with new and very different strategies for distributing, processing, and managing SNAP cases. These states were moving away from traditional case management models, in which one worker retains responsibility for all aspects of a case from intake through ongoing management or in which one worker handles intake tasks prior to shifting the case to a second worker for ongoing maintenance activities. Nine case study states were testing new strategies that approached these tasks with an eye toward more efficient workload management (see table 4.3). These new methods were implemented as cost-saving measures but also as efforts to benefit staff and clients by improving efficiency. Idaho and Pennsylvania were the only states that implemented shifts to new models statewide; the others were testing one or more changes in selected offices.
The types of changes made to address workload management issues varied. The Central Region in Utah, for example, implemented a system in which caseworkers, housed in call centers, were part of 10- to 12-member teams that were jointly responsible for managing a caseload of about 2,200 to 2,600 cases. Workers divide their time between taking calls (through the call center) and processing cases. While individual cases were assigned to specific workers, any team member could take action on the case when a call was received. Cases were routed back to the assigned caseworker for follow-up at the time of recertification.
35
Box 4.4: Indiana’s Task-Based Model
SNAP workers in Indiana’s five modernized regions no longer carry a caseload; rather, they work tasks that are assigned to them by a workflow management system (WFMS). This model allows cases to be worked and authorized in any modernized region of the state. The workload, which includes one-third of the state’s caseload, can be spread across the state. This task-based model is used for eligibility determination and ongoing case management.
A SNAP application flows through five distinct stages: (1) a basic review of the application; (2) data gathering; (3) eligibility interview (with SECs); (4) verification review; and (5) case certification (by SECs). Within this flow, cases may be returned by the state staff to the contractor staff to have errors fixed or for further clarification. Within each stage, work is divided into tasks. These tasks are generated when work needs to be done on a particular case. Each task goes into a queue that is managed by the state’s central office. Queues are specific to type of staff or stage of application processing, such as verification review or case certification. Each application may involve anywhere from 4 to 14 tasks before it is certified.
Under the WFMS, workers do not “own” a case. Rather, staff are responsible for working the tasks that drop down into their queue. Workers do not know what task will drop down and equated the randomness to a gumball machine.
In the nonmodernized portion of the state, workers continue to follow a case management model.
Some states and local offices implemented task-based (or transaction-based) systems for
case management. Task-based systems give priority-ranked assignments to staff based on the type of work required, as opposed to assigning them individual cases. In some models, specific workers consistently perform one type of SNAP-related task, with the expectation that staff will develop expertise and efficiency in one area. For example, the Milwaukee County Office in Wisconsin created seven specialty assignments, including an intake unit, a call center, a six-month reporting unit, a verification unit, and a review and recertification unit. Workers in each unit completed only work assigned to their specific areas. According to staff, issues with timeliness and lack of responsiveness from staff at the call center led to abandonment of the plan and a move back to a caseload-based system.
Other states implemented similar task-based systems but allowed workers to rotate among specialty areas and thus develop more comprehensive expertise in all aspects of a case. As described in box 4.3, the Larimer County Office in Colorado implemented a task-based management approach that assigned groups of workers to single tasks and rotated them to others on a weekly basis. In D.C., some local offices had implemented a “case banking” task-based approach, in which staff are assigned to different parts of the eligibility determination process—such as intake, interviews, and document processing—on a daily rotating basis. Under this new system, staff did not carry a caseload. D.C. staff reported that this new model resulted in significant reductions in the time it took to approve and process an application, with one staff member noting that “turnover for applications went from 30 or 40 days to a week.” They also reported that clients appreciated the change because it reduced office wait times and the time it took to begin receiving benefits. The change was also viewed as a success in terms of staff satisfaction because staff no longer had a backlog of cases;
36
supervisors reported improved morale and less absenteeism after the new approach was implemented.
Finally, as described in box 4.4, Indiana implemented a task-based system in which staff
were assigned randomly to discrete tasks or transactions from the workload queue. On any given day, eligibility staff worked on a wide variety of tasks associated with many different cases.
Critical to the success of these task-based management systems is some type of automated workload management system for both routing and tracking assignments and completion of work. (See Section 4D, below.) Utah piloted a similar system in the late 1990s but abandoned it, in part, because the technology was not yet available to build in worker accountability for assigned tasks.
Process Simplification and Improved Customer Access All case study states implemented multiple changes that resulted in simplifying the SNAP application or recertification process or increasing customer access. For example, all 14 states offered a combined application that allowed clients to apply for several benefit programs at one time. These states also accepted application and recertification paperwork by fax as well as mail. About half the states reported using “language lines” or telephone interpreter services for conversations with non-English-speaking clients for whom they did not have in-house translation services.
Six states recently redesigned forms and other paperwork for clients to simplify them and
make them more user-friendly. Wisconsin modified benefit notices sent from the SNAP agency in response to client complaints that the notices were too long, unreadable, and confusing. On the basis of suggestions received in client focus groups, notices were redesigned to include more pictures and bullets to highlight the most important information. The forms were also restructured to mirror the format of the screens on the state’s new multipurpose web site and rewritten to target those with a fourth-grade reading level.
States also made organizational changes to expand access to face-to-face services.
Nationally, 30 states reported that they had outstationed workers at sites other than the local SNAP agency office. Nine of 14 case study states made arrangements with community partners or other government agencies to locate SNAP workers at their sites (e.g., food pantries, refugee centers) to provide information about SNAP benefits, take applications, and conduct interviews. These partnerships enabled SNAP workers to be available on a scheduled basis to meet with clients in more convenient and potentially more comfortable settings. For example, the SNAP agency in Wichita, Kansas, had eight outstationed staff serving 12 community locations. Staff cited an instance in which a client with health issues that prevented her from traveling to her local SNAP office was provided with contact information for outstationed workers at community partner locations closer to her residence where she could apply for benefits.
Three states had mobile eligibility units staffed by SNAP workers that went directly into
communities to help clients apply for benefits. Indiana had a van that served as a fully functional SNAP office, staffed by eligibility workers who can process applications and approve benefits for SNAP, TANF, and Medicaid. It makes scheduled stops at locations in modernized regions
37
throughout the state. At the time of Hurricane Katrina, the SNAP agency in Mississippi outfitted a recreational vehicle with a satellite, wireless Internet, and direct access to the eligibility determination system and sent workers into the hardest hit communities to help families affected by the disaster apply for and receive SNAP benefits.
Half the case study states have implemented extended office hours, primarily to improve
access for working families. Selected local offices in D.C., Colorado, and Kansas remain open beyond normal business hours one or more nights per week; offices in Mecklenburg County, North Carolina, are open for business on Saturdays. Staff in call centers are often available on an extended-hours basis.
Restructuring of Staffing Configurations and Practices Some states implemented new administrative procedures that provided staff with greater workplace flexibility but at the same time created more efficient business processes. Two of these efforts, telecommuting and telework, and changes to staff hours and workdays, are described below. Telecommuting and Telework. Nationally, seven states reported that they made modifications that allowed workers to telecommute from home or to telework or “port” work from one area of the state to another. These changes were made to increase efficiency and save resources as well as to meet staffing needs. For example, dwindling caseloads in rural areas in Utah created situations in which staff did not have an adequate caseload for a full day’s work. Offices with larger caseloads in the urban areas surrounding Salt Lake City faced frequent turnover among staff who often found better jobs in the strong local economy. Telecommuting allowed for portability of work by telephone from the busy Central Region to experienced but underutilized workers in rural areas where a state job is very desirable. The pilot program began with 10 workers in fall 2004, and at the time of the interview there were approximately 200 to 225 telecommuters statewide (about 50 percent of the front-line staff). There is a waiting list for these jobs, which tend to go to the most experienced and productive staff. The telecommuters are expected to have 10 percent higher productivity from home because of their “capacity to be more productive” and are monitored through programs that track keystrokes and screens viewed.
Some states are using call center and electronic case file technology to port work within the state to meet shifting client needs and to better manage workload. In Washington, for example, the call center system implemented in 2009 was designed so that calls originating from any area in the state can be routed from one statewide call center to the next available worker at any location. This type of system allows the state to transfer work in cases of disaster, power outages, or staff work overload. Other states (e.g., Pennsylvania, Utah) are moving toward similar systems to address these issues. Changes in Staff Hours or Days. Four case study states implemented changes to allow staff to work flexible schedules for cost savings, to meet the needs of clients or in response to staff requests. Since 2007, workers in some local offices in D.C. have flexible work schedules. Staff can work nine days over a two-week period, generally taking every other Friday off. As a budgetary measure, Mississippi implemented “compressed time” or 4.5-day work weeks. Despite the fact that they were still expected to manage the same workload, it was reported that staff
38
Box 4.5: Washington’s Service Delivery Redesign Project
Washington’s service delivery redesign project started in fall 2008 and encompassed all programs within the Consumer Services Division of the Department of Social and Health Services. The purpose of the project was to take advantage of process improvements including current and emerging technology to improve customer service, improve the working environment for staff, and create capacity through reducing complex processes. Staff noted that the agency moved to this approach by necessity—the economic downturn and anticipated staff cutback meant they had to change how they did business.
The redesign approach was based on Ken Miller’s The
Change Agent’s Guide to Radical Improvement (ASQ Quality Press, 2002), which calls for process mapping and addressing areas that yield the biggest improvement. The examination of procedures and available data was coupled with information about customers’ desired changes.
The key to the redesign was staff input and participation.
There were six implementation teams, each looking at a different set of processes:
Outreach, intake, and interviews Verification and eligibility determination Maintenance, recertification, and changes Case management and social services Call center initiatives Access Spokane Demonstration Team
The teams examined the customer’s path through the
system and conducted extensive stakeholder analyses, calling on stakeholders to provide input and ideas. Once the teams (made up of representatives from region staff who met four days a month) identified efficiencies, they were presented to a steering committee (including the director, regional administrator, and office chief) for review. Initiatives approved by the steering committee were first piloted and then implemented statewide. Although there were timelines for specific initiatives, the service delivery redesign project was an ongoing effort—the state wanted to promote an environment for change and improvement.
generally reacted positively to this change because it gave them some flexibility in their schedule. Staff members noted that the new hours helped retain workers who needed to arrive late or leave early one day per week. In Wichita, Kansas, staff in some local offices also worked a flextime schedule so that workers were available to make telephone calls to clients either before or after normal business hours. As part of a major cost-saving measure, all state offices in Utah shifted to a four-day workweek in August 2008. The governor mandated that all state offices remain open from 7 am to 6 pm Monday through Thursday; offices are closed on Friday. According to staff, the extended business hours for working families and clients with alternative work schedules were well received; however, the three-day waits for clients in need of help on Fridays were initially an issue.
Use of Workgroups in Developing Modernization Efforts Nine case study states reported that they convened workgroups composed of some combination of local staff and administrators, state officials, advocacy group members, IT consultants, and, in some cases, clients to develop, review, and provide advice on new modernization activities. For example, Pennsylvania’s state office established a number of committees and workgroups, which met regularly to solicit input and feedback from state, regional, and local staff; various community stakeholders; and clients on proposed changes. The Income Maintenance Advisory Committee is composed of advocates and clients who meet quarterly to
39
review policies, propose changes, and make recommendations. Other workgroups were convened to study industry practices and new technology, consult with other states, work closely with contractors, and weigh the effects of specific modernization efforts on the agency, workers, clients, and the budget. One state staff member noted, “The better the stakeholder group, the better the end product.” As described in Box 4.5, Washington’s service delivery redesign project was also the product of collaborative workgroups.
2. Contracted Administrative Functions As part of their modernization efforts to reengineer administrative structures and functions, most states established contractual relationships with commercial businesses to perform paid tasks. In response to budget constraints and also as part of a general movement toward privatization of government functions, two states pursued sweeping efforts to privatize some application and recertification procedures statewide across SNAP and other benefit programs. Most states also hired outside contractors to develop new or upgrade existing technology. The following section provides information about the contracts case study states have with for-profit organizations to carry out some SNAP functions.
Major Efforts to Privatize SNAP Functions: Texas and Indiana Texas and Indiana launched substantial efforts to shift some administration of SNAP and other benefit programs to private contractors. Federal regulations prevent nonstate employees from determining SNAP eligibility, but both states elected to allow contracted staff to answer inquiries, provide information about SNAP, make referrals, and schedule appointments for clients. Both states experienced significant challenges with these initiatives. A few other states reported that their legislatures had considered privatization of some program functions but negative publicity about the others states’ experiences made them wary of moving in this direction. Opposition by unions representing SNAP workers who feared that their jobs would be eliminated under this strategy also played a role in some states’ decisions not to privatize. Utah developed a new business plan that included a comprehensive overhaul of its eligibility model in order to preempt possible legislative consideration of privatization. Privatization in Texas. Efforts to integrate eligibility processes across programs and outsource administrative functions first began after the state’s passage of major welfare reform legislation in 1995. The current initiatives began in 2003, when the Texas legislature mandated a consolidation of the state’s health and human services systems and authorized the use of privately run call centers as part of a strategy to address state budget cuts to these programs. Using a competitive bidding process, the Texas Health and Human Services Commission (HHSC) selected Accenture, Ltd., with a team of subcontractors, and, in 2005, entered into an $899 million, five-year contract.
Staff reported a number of challenges related to the privatization. After the legislature
announced impending staffing cuts and plans for privatization, many experienced staff left the agency for other jobs. The loss of their institutional knowledge, staff shortages in general, and the relative inexperience of staff hired by contractors slowed processing times to the point that they were below federal standards. Poor performance by contractors was also an issue. By March 2007, the contract with Accenture, Ltd. had been dissolved. Problems were attributed to the large
40
and poorly defined scope of the contract as well as the pressure to implement too much, too quickly. Further rollout of the Texas Integrated Eligibility Redesign System (TIERS) was delayed and is now moving more gradually. Maximus Inc., a key subcontractor on the Accenture contract, now operates the call centers and other integrated eligibility activities, but the scope of contractor responsibilities is more limited and more clearly defined than in the original Accenture contract.
For the current contract with Maximus, HHSC staff identified and transferred more
routine functions from experienced state staff to less expensive vendor staff. For example, staff at vendor-operated call centers in selected areas act as a first point of access for clients through a statewide toll-free number. Contractors provide information and referrals to clients, answer basic eligibility and application questions (such as documentation requirements), schedule client appointments, and are responsible for document imaging and image assembly for electronic case records. Calls requiring eligibility interviews, benefits certification, and more complicated issues are routed to state employees in client care centers or in local offices. At the time of the site visits, the state was planning to rebid contracts so that multiple contractors would be responsible for specific tasks (e.g., document imaging) as opposed to having a single contract for all tasks.
Privatization in Indiana. The shift to privatization of certain administrative processes for the SNAP, TANF, and Medicaid programs was a more recent development in Indiana, initiated in 2007. Motivated by a desire to improve customer access, achieve cost savings, and standardize processes statewide, the state entered into a $1.16 billion contract with IBM to take over responsibility for handling general inquiries, conducting data-gathering interviews, screening for benefits, accepting household-reported changes, operating call centers, and conducting document imaging.
At the time of the site visit, these changes were implemented in only five of the state’s
eight regions, or one-third of the state’s caseload. Each of these regions had a service center (or call center), operated by a private firm, Affiliated Computer Services. Service centers were staffed by both vendor staff, responsible for providing information and gathering data, and state-employed state eligibility consultants (SECs), who alone were authorized to conduct the eligibility interview and determine eligibility. Each region also had local offices operated by Arbor Education and Training, a for-profit provider of education, training, and counseling services. Their employees (many of whom were former state employees) conducted clerical and data-gathering tasks, but eligibility determinations were made by SECs. Small state-run offices, staffed by state employees, were also located in each county. One vendor-operated service center also serves as the centralized location for all document imaging operations.
A number of issues and challenges related to the privatization of SNAP service delivery were identified. First, there were concerns that vendor staff did not have the required experience or adequate training to understand the complexities of the program or to collect the required information, so state SECs often found it necessary to duplicate work already done. Many applications “fell through the cracks” because specific tasks such as document review were not processed and completed, resulting in case closures for failure to provide verifications. Clients also reported excessive wait times and repeated instances of receiving inaccurate information through the service centers.
41
The state’s application processing rate continued to be problematic throughout its
experience with privatization. The state cancelled the contract with IBM as of December 15, 2009, and is in the process of negotiating new contracts with most other vendors. The state plans to continue with the current arrangement for certifying and recertifying SNAP applications while developing a long-term plan. However, there is continued pressure from outside entities to keep many of the other contractors from providing SNAP, TANF, and Medicaid services in Indiana.
Contractual Arrangements for Developing and Monitoring Technological Innovations Although some states still rely on in-house staff to develop new or upgrade existing technology, most states hire outside contractors for this function. Often, states do not have adequate internal staff resources to complete the work themselves. Some states decide to hire outside contractors on the basis of what they learn from other states on their performance with similar projects.
According to the national survey, 37 states had contracts with private businesses to develop, implement, or manage aspects of their technological initiatives. These states employed consulting firms for designing technological innovations, such as selecting and installing hardware and software, programming systems, and maintaining and supporting new systems.
The majority of the case study states had contracts with private firms to assist with similar tasks. In most cases, the contractor worked closely with state agency policy, program, and IT staff. For example, Pennsylvania has a longstanding contractual relationship with Deloitte for IT consulting services. Deloitte staff collaborate with in-house state agency staff on technology development, participating in regular meetings to ensure that their efforts are coordinated. Utah is developing a rules-based automated eligibility system (eREP), a tri-agency undertaking composed of five modules that are being systematically and incrementally piloted and rolled out over a six-year period between 2003 and 2009. Technology contractors IBM and Cúram were selected through a competitive bid process and were heavily involved in the first phases of project, working closely with in-house IT staff on this ongoing umbrella technology initiative. Colorado completely outsourced the development of its MIS to EDS but, after numerous operational issues, ended that relationship. In 2009, the state selected Deloitte as the new IT contractor to make additional enhancements to the system. Other states, such as Texas, contracted out programming and maintenance for their integrated eligibility systems.
D. Technological Innovations
Technological innovations encompass a range of modernization efforts that use new technologies or update and expand old applications. Key activities included implementation of call centers, electronic applications, electronic case files, and document imaging. The following sections describe the technological innovations states implemented for SNAP and other assistance programs.
1. Call Centers Call centers allow clients to call a single number to provide or receive information. Communication can be through an automated system or from a SNAP employee. The functions
42
Box 4.6: Washington’s Call Center
Washington first implemented call centers in its 43 community services offices (CSOs) in 2000 and has continued to examine operations and exploit new technology in order to meet increased demand for services with more limited resources. A plan to enhance the service delivery model, including call centers, was adopted in 2002, but statewide planning was deemphasized. Variations developed across the CSOs in call center scope of services, implementation of program policies and procedures, and service delivery models.
A 2008 review of call centers by the Department of Social and Health Services found many different operational models and inconsistent procedures. Washington is currently implementing a new operational model that includes a virtual statewide call center with one toll-free number for clients, six regional call centers that are virtually connected, and a standard scope of services for all centers. Most call center workers will still sit in their current CSO but be connected to one of six regional call centers; some workers will be transferred to one of the regional call centers.
Clients call a toll-free number, select the language they need, and enter their client ID, social security number, or zip code. The call is routed to a regional call centers based on location—the first try will be to a call center worker in the local area nearest to the client’s zip code, the second to a call center worker within the region, and the third to the next available worker, statewide. For current clients, an application automatically opens the case record on the worker’s computer screen when he or she receives the call. Call centers have one statewide administrator with local supervisors. Call center staff can be moved virtually between regional units as workload fluctuates and work can be shared statewide.
of call centers vary widely by state. Call centers may enable clients to apply for assistance, submit changes to their case, recertify their case, check the status of their claim, ask questions about their case, or schedule appointments. Nationally, 21 states implemented call centers, with 8 others planning to implement. About half the centers were available to clients statewide; the others were available only in select counties or regions. Most states plan to expand the call centers to more regions. In the 14 case study states, 12 states had implemented call centers in at least some regions of the state. As shown in table 4.4, call centers in over half of those states were available only in select counties or regions.
There are several types of call centers ranging from information lines to full-service centers. The centers in the case study states provided general information, application assistance, and case status information. All but one—North Carolina—accepted client-reported changes. In about half the centers, initial and recertification interviews were conducted and appointments scheduled. As part of the interviews, a few states discussed plans for creating a telephonic signature, which records the client’s verbal signature at the end of an interview and stores it as an audio file. When the telephonic signature is available, the client does not have to follow up with a written signature, which is required with phone interviews. Box 4.6 provides more detail on Washington’s call center operations.
SNAP caseworkers staff the call centers in most states, but some states have contractor-
operated information lines. Indiana and Texas use a hybrid of these: A contractor staffs the call
43
centers and conducts interviews (to obtain the primary data needed for certifications and recertifications), but clients are transferred to state staff for eligibility determination. In most call centers, staff work solely on the phones; however, some states either rotated staff on and off the phones (e.g., Washington)—staff work in the call centers some days and on casework others—or required staff to conduct additional functions (e.g., Utah, Wisconsin), such as working cases or processing verifications.
Table 4.4: Case Study State Call Centers As of June 2009
Statea Service area Structure
Functions across All Centers in State
Ans
wer
que
stio
ns
Prov
ide
appl
icat
ion
assi
stan
ce
Con
duct
initi
al
appl
icat
ion
inte
rvie
w
Con
duct
re
cert
ifica
tion
inte
rvie
w
Sche
dule
ap
poin
tmen
ts
Prov
ide
info
rmat
ion
on c
ase
stat
us
Acc
ept c
lient
ch
ange
s
Colorado Select areas County discretion for
who staffs and functions provided
D.C. Statewide One call center
Idaho Statewide
One call center, equipped to call people
back so they do not have to hold
Illinois Select areas County discretion to implement and to design
Indiana Select areas All centers handle
applications start to finish
Massachusetts Select areas Pilot test for single office
North Carolina Select areas County discretion to implement and to design
Pennsylvania Statewide Eight call centers, one dedicated to Philadelphia
Texas Select areas Each call center provides vendor- and state-staffed
services
Utah Statewide
Five virtual call centers housed in two physical
buildings with caseworkers from all
regions and telecommuters
b
Washington Statewide Forty-five call centers,
but the state is moving to six regional centers
Wisconsin Select areas County discretion to implement and to design
a Kansas and Mississippi do not have call centers. b Utah does not schedule interviews. Utah received an appointment-scheduling waiver, which allows clients to call for an interview at their convenience.
44
The size and structure of the call centers varied across the states. Some states and counties had a few employees answering calls in individual offices. Dane County, Wisconsin, had 10 dedicated staff answering calls within the office and some local offices in Washington had 2 or 3 staff answering calls. Other states had large call centers, generally housed outside the local SNAP offices that serve regions or the entire state. For instance, Indiana had a regional call center that served about 45 percent of the state and employed about 250 workers. They received 8,000 to 10,000 calls per day and conducted about 2,500 interviews per month.
Most call centers had some type of technology to let staff know how many calls were
waiting. Some more sophisticated centers, such as those in Washington, had software that also showed staff the average time it took to complete a call and the staff available. In Indiana, large screens indicated how many callers were waiting along with their need (general questions, certification interviews, etc.) as well as the length of time on hold. There was a color-coded system on the screens based on the length of time callers were waiting, which quickly let staff know of backlogs in the system.
Most telephone systems also used technology to help clients access the correct services
and notify them of wait times. Several states used automated response or directory technology that provided clients with several choices for directing their call. The client either said or pushed a number based on the help needed, and the call would be directed to the correct department. In states that had regionalized call centers, such as Utah, the client was asked for his or her case number and zip code and directed to the correct county office and caseworker. Many systems also informed clients of the length of the wait for the next available representative.
Use of Call Centers Most states were able to track call volume (number of calls received), wait times (length of time clients wait before their call is answered), and abandonment rates (percentage of callers who hang up before their call is answered) through their phone systems. Some states had the ability to track much more information: For example, Utah could also track talk time, after-call work time, and the number of applications completed by worker. Wisconsin, however, was not able yet to track basic activity although an upgrade is being pursued. The average number of calls per month varies from 20,000 in Washington, D.C., to 238,000 in Washington State. For states providing average wait times, clients waited for as little as two to six minutes in North Carolina, Utah, and Washington and over 30 minutes in D.C. and Indiana. There was wide variation in the abandonment rates (percentage of callers hanging up before their call is answered) provided by states. Indiana had the lowest rate at around 7 percent, while North Carolina and Utah had rates of 35 percent and 29 percent, respectively. Utah staff reported that clients typically abandon after about three and a half minutes. This was described as a client’s option not to wait but to call back at a more convenient time. Table 4.5 provides available information about the use of call centers in the case study states.
45
Table 4.5: Usage Patterns at the Call Centers in Case Study States As of 2009
State Average Usage
Call volume per month Wait times Abandonment rate Coloradoa 34,000 Not available Not available D.C. 20,000 35 minutes Not available Idaho Not available Not available Not available Illinois Not available Not available Not available Indiana 195,000 Not available 7% Massachusetts 28,000 Not available Not available
North Carolinab 81,000 5 minutes (English); 15 minutes (Spanish) 35%
Pennsylvania 130,000 Not available Not available Texas 226,000 Not available 11%c Utah 25,000–30,000 6 minutes 29% Washington 238,000 2 minutes 18% Wisconsin Not available Not available Not available
Notes: Monthly estimates for call volume used a 5-day workweek and 4.33 weeks per month. Numbers are rounded to the nearest thousand. a Larimer County call center only b Wake County call center only c State provided data for FY 2008 instead of 2009.
Client Impressions of Call Centers The SNAP participants in the focus groups had mixed impressions of the call centers. Some liked the fact that they did not have to go into the office to “deal with the waiting and staff,” while others did not like waiting on the phones or not being able to talk to a “live person.” Participants in Illinois, Pennsylvania, and Utah reported positive experiences with the call centers. A participant in Illinois liked recertifying over the phone and was always able to talk to someone right away. She said, “I love it because I don’t have to go and sit, or bother my friend who drives me to sit all day. I don’t have to mess with mean people; everyone is nice on this toll-free number.” Participants in Pennsylvania and Utah also commented that they rarely had to wait on the phone, and the staff were extremely helpful. In other states, however, clients reported particularly long waits and sometimes being cut off and having to start over again. Clients were particularly frustrated in states that had no other options for contacting office staff other than through a call center. A participant in Indiana mentioned that she added the SNAP call center number to her “friends and family” list on her cell phone plan because she spent so much time on the phone with them. This was a challenge mentioned several times—many clients have only cell phones and any time on hold is using minutes on their plans. Participants frequently mentioned their displeasure with not being able to go into the office to see their caseworker or being able to call them directly. There was a sense that the offices have “lost the personal touch.” In one state, a participant said it feels like they “treat us like second-class citizens” by ignoring their calls and leaving them on hold.
46
2. Online Application and Other Benefit Tools Many states have developed web sites through which clients may complete a variety of application and case management functions. All these web sites include electronic applications (some with an e-signature function, some without). Many states also include other types of benefit tools, such as prescreening tools providing results for which programs a client may be potentially eligible, secure account information about a client’s case, and the ability to submit changes online.
Nationally, 22 states had online application and other benefit tools, with 21 additional states planning to implement one. Of the states with tools, 18 were publicly accessible through the Internet; the others were available only through partner organizations or local offices. Sixteen states had tools available statewide, while the other six were restricted to selected regions in the state.
In the case study states, nine developed application tools and at least one other benefit
tool (table 4.6). All but one of these released the application statewide. Indiana is currently piloting its online application in select areas of the state. D.C., Mississippi, and North Carolina are planning to develop electronic applications, and Idaho did pilot an online application but ended it in 2008. Idaho decided after launching the online application that it should have been a last step, not a first step—after an MIS and electronic case files were in place.
Clients could submit electronic applications through all the state’s web sites; however,
the submission method varied by state. The majority of states with online applications, both nationally and among the case study states, allowed clients to complete the application electronically, sign it using an e-signature, and submit it to their local office through the web site. Some states, however, allowed clients to submit their applications online but required a written signature be submitted separately—either by mail or by visiting the office. Two states surveyed (none of the case study states) required applicants to print the completed application and then send it to their local office. All case study states without e-signature were planning to add this function to their applications. Indiana was planning to roll out this feature shortly after the state visit.
About half the case study states with online applications had electronic applications that automatically populated the state’s MIS. In the other states, when a caseworker received the electronic applications, he or she had to transfer manually all the information from the application to the eligibility system—as is done with paper applications. Most of these states planned to upgrade their systems to allow the electronic applications to autopopulate their MIS.
Among the case study states with online applications, clients could apply for multiple
programs. Most often the web sites included access to apply for the Medicaid; Women, Infants, and Children (WIC); and TANF programs. When applying for multiple programs, clients generally completed and submitted only one application to apply for all programs of interest.
47
Table 4.6: Online Application and Benefit Tools in Case Study States As of June 2009
Mississippi + * North Carolina + * Pennsylvania Statewide 2006 20% Texas Statewide 2005 * a
Utah Pilot; statewide 2007; 2008 * * 40%
Washington Statewide 2002 33% Wisconsin Statewide 2006 40%
N/A = not available a Texas did not provide an exact number but indicated that the percentage was “very small.” * State planning to develop and implement. † Linked to the USDA benefit calculator.
Beyond applying for assistance, many web sites offered additional tools for clients to
determine eligibility and manage their cases. All study states with online tools had a prescreening tool or benefit calculator, except for Utah. Utah had developed a prescreening tool. However, clients found it difficult to use and confusing, so it was removed. The state plans to design a more user-friendly version. The five case study states without electronic application tools do have web sites that include some type of prescreener, or they link to the USDA benefit calculator. Six study states allowed clients to create user accounts through which they may check the status of their case and benefit levels and report changes. For instance, in Utah, the user account included a 12-month history of information on program receipt, benefit start/close date, benefit status, and reasons for denial, and all received verification materials (anything scanned immediately appears in real time). In Pennsylvania and Wisconsin, users may report changes to their cases, such as increases in income or job loss. Box 4.7 describes the features of Wisconsin’s online tool. Most states plan to improve and expand the functions of their online tools. For example, Wisconsin is planning to add an online recertification interview option, which will allow clients
48
Box 4.7: Wisconsin’s ACCESS Tool
Using an FNS program participation grant and state funds, Wisconsin invested around $6 million to develop a set of tools, known collectively as ACCESS. ACCESS is a publicly available, web-based tool that allows customers to prescreen for benefits, complete and submit applications, get up-to-date information about the status of their benefits, and report changes online. All the ACCESS tools are available in English and Spanish and text is written at a fourth-grade reading level. The tool has a variety of helpful features such as a progress bar, help buttons, and intelligent driver flow designed with questions based on previous answers.
Eligibility Screening Tool. The Am I Eligible self-assessment tool was implemented in August 2004 and it allows customers to quickly—within 15 minutes—determine if they are eligible for a host of social service programs. The screener provides a list of programs the client is potentially eligible for and how to apply to them. The tool also provides a potential dollar range for the SNAP benefit.
Application Tool. The Apply for Benefits application tool, implemented in June 2006, enables individuals to apply for multiple programs and takes 30 to 60 minutes on average. The application includes an e-signature and the information provided by the applicant is prepopulated in the CARES MIS. About 40 percent of applications in the state are submitted through ACCESS.
Personalized Benefit Information Tool. Check My Benefits, added in September 2005, allows customers to check the status of their benefits, the amount and date of distribution of benefits, and the date of their next review. It will also let the user know what documents he or she needs to provide and by when the documentation needs to be provided (e.g., proof of earnings) and the reason why a benefit is denied.
Change Reporting. Report My Changes, added in September 2006, allows customers to report job changes (i.e., new jobs, change in wage or hours, and loss of job). The state is working on adding other types of changes such as address, other income, household composition, and expenses.
to log into their account when it is time for their recertification interview and verify and update their information. They will use the e-signature function to certify the interview. Some states also plan to add to their sites the capability to report changes and to improve the usability of their sites (e.g., reducing the length of the application, making the site more readable).
Client Impressions of Online Tools Overall, few focus group members in the case study states had used the online tools or applications—many had not even heard about them prior to the focus group. For those with experience, the view was positive. They thought it could help make the process easier. Some participants indicated that they used the web sites to get a lot of their questions answered and to determine what they needed before going to the local office to save them multiple trips. One participant indicated that by using the prescreening tool “at least you would know if it was worth it to come down and bring documentation.”
Focus group participants were more positive when those applications included an e-signature. In the states that did not have an e-signature at the time of the study, participants tended to agree that there was not as much benefit to the online application. One focus group member stated, “…so what’s the difference, you still have to take it in.” Also, in most states verification documents still need to be dropped off at the office or mailed, so many participants felt the online application did not eliminate the need for office visits.
49
Many participants were intimidated by the technology or concerned about putting their
personal information on the Internet. These people indicated that they would likely never use this type of technology. One participant said, “I hate it when everyone thinks the world knows how to use a computer.” Although state and local staff indicated that they thought these concerns were mostly generational, these sentiments were expressed by some focus group participants of all ages, including people in their 20s and 30s.
Use of Electronic Applications Electronic applications were not the primary method for receiving applications in any case study states. Table 4.7 shows that in Indiana and Kansas only about 10 percent of all applications statewide were submitted online. Massachusetts, Utah, Washington, and Wisconsin had the highest percentage of electronic applications, with 30 to 40 percent of the total number of applications completed online. Utah indicated that, in some regions of the state, close to 80 percent of the applications received were electronic.
In the states with relatively low usage, some staff speculated that the lack of use could be due to fear of technology—clients not being computer savvy or being afraid to submit personal information through the Internet. In Kansas, staff suggested that their online applications could be more user-friendly. In some states, there could also be a lack of knowledge about the online applications, as suggested by the focus group participants. Often, there was not much advertising of the new application options in the states, particularly in the early stages. Some states take a more proactive approach. In Utah and Wisconsin, for example, clients are encouraged by staff to use the electronic applications, even if they come into the office. This could also account for the higher percentage of electronic applications for those states.
Challenges Related to Electronic Applications State staff, on several occasions, noted challenges specific only to electronic applications. Respondents in Illinois and Massachusetts reported that their staff were challenged by the increased number of applications, some of which were duplicates. They observed that clients would apply online multiple times and would then come into the office to apply again, creating unnecessary work for staff. This may be because some online tools did not clearly indicate that an application was received or clients were not confident that their application was submitted. According to one staff respondent in Illinois, a SNAP client recently applied for SNAP 50 times. In Massachusetts, duplicate applications account for approximately 8 percent of total applications received. Some states, including Massachusetts, Indiana, and Kansas, reported that it was difficult to adapt the application to multiple programs and still keep it simple enough to ensure that a client could complete it online.
In addition, many workers in the case study states reported that the online applications
were not necessarily more efficient. Overall, they found online applications were more incomplete than the paper applications, so the interviews generally took longer because of the need to fill in missing information. About half the case study states with online applications do not automatically populate their information systems from the applications. For them, there is no time savings in data entry.
50
Box 4.8: Texas’ Paperless Systems
Texas has a vendor-operated document processing center that serves as the point of entry for all mailed-in documents across the state. Most documents are imaged the same day they are received. The Texas Integrated Eligibility Redesign System (TIERS) is designed to work with the document imaging system. At the document processing center, mail is sorted, prioritized, prepared, and scanned into electronic images. The images are then delivered electronically to image assembly, where contractor staff associate documents from the processing center, as well as faxed documents, with the correct TIERS case. (Some more recent documents are barcoded with the TIERS case number and don’t require image assembly.) Everything associated with a case is stored under one imaging case number on the computer system.
Because documents are available electronically and are organized by case, work can be moved to any worker at any location. For example, a state employee can view previous certifications for a client on a computer screen and pull up all records for that client. If a disaster such as Hurricane Ike overloads a call center, work can be shifted to another location because the case file can be accessed by other computers on the system.
Though documents received for cases on the legacy computer styles are also imaged, there are no electronic case files on the old system.
3. Technology to Advance Paperless Systems Many states used technology to reduce the use of paper in case files. These initiatives include document imaging of applications, client notices and forms, and verification documents. Other applications involve creating electronic case notes and files, developing data-sharing systems that reduce the number of times a client provides the same verification, and creating online caseworker manuals and electronic updates and memos for staff use. The extent to which a state went “paperless” varied widely, ranging from fully electronic case files, applications, and documentation to electronic case note files that case managers could key in electronically during an interview. For example, Washington implemented document imaging, data sharing, online applications, electronic check-in, and automated response at call centers. Together these steps were considered to be successful time- saving and efficiency measures that contributed to the state’s receipt of performance bonuses for payment accuracy in 2006 and 2007 and for timeliness of application processing in 2008.
Document Imaging and Electronic Case Files
Document imaging and electronic case file systems allow states to transform large paper case files into electronic files. These initiatives reduce the space needed to store case-related documents, organize files for staff more efficiently, and create a more portable system that can help manage workflow across the state. In many states, document imaging and electronic case files are created as part of the same initiative; however, that is not always the case. Box 4.8 describes Texas’ advancements toward paperless systems.
Nationally, 19 states used document imaging systems. Table 4.7 shows that 12 case study
states implemented document imaging in at least some part of the state. In the two states that did
51
not have imaging, D.C. mentioned that it plans to image documents in the future, and Illinois had piloted document imaging in Chicago in 2003 but abandoned it because the technology infrastructure was not in place to support it.
Table 4.7: Document Imaging and Electronic Case Files in Case Study States As of June 2009
State Document Imaging Electronic Case Files
Date Scope Status Date Scope Status
Colorado 2003 One county Fully implemented 2003 One county Fully electronic case file
D.C. Planned 2008 Statewide System allows for electronic case notes
Indiana 2007 Some regions Fully implemented 2007 Some regions Fully electronic case file
Kansas Not available Select areas
Limited efforts—not scanning all documents
Massachusetts 2009 One office Pilot Pre-2000 Statewide System allows for
electronic case notes Mississippi 2005 Three offices Piloted North Carolina 2008 Two counties Fully implemented 2003 Select offices System allows for
electronic case notes
Pennsylvania 2004 Statewide
Fully implemented for verification
documents; planning to expand to
applications and other documents
2004 Statewide
Only those documents that are scanned are part of
electronic case file—still have hardcopy
files for some documents
Texas 2003 Select areas Fully implemented 2003 Select areas Fully electronic case file
Utah
Pilot 2000;
statewide 2002
Statewide Fully implemented 2002 Statewide Fully electronic case file
Washington 2001 Statewide Fully implemented 2001 Statewide Fully electronic case file
Wisconsin
Pilot 2004;
statewide 2006
Statewide Fully implemented 2006 Statewide Fully electronic case file
Idaho, Pennsylvania, Utah, Washington, and Wisconsin implemented document imaging
statewide, while the rest of the case study states implemented imaging only in select counties or offices in the state. Most of the latter were planning to expand their imaging projects statewide. Some had concrete plans to expand, while others were seeking funds and support to do so. In most states, all new documents and applications received were scanned; however, Kansas, Massachusetts, and Pennsylvania did not scan all documents. For example, Pennsylvania imaged
52
all verification documents but still required hard copies of applications and some additional forms.
Document imaging can be conducted on the front end (i.e., any new document is scanned prior to appearing in the case file or made available to caseworkers) or the back end (i.e., the document is scanned after it is processed by caseworkers). Most states image first; however, three states—Colorado, Massachusetts, and Wisconsin—scan on the back end. There are pros and cons to both methods. Wisconsin indicated that it is planning to assess methods for front-end scanning because the state feels it would be more efficient (i.e., fewer people would touch the documents and there is less likelihood of misplacing documents). However, in Utah, which scans about 85 percent of all documents statewide from one facility at the front end, a virus corrupted the state’s document imaging server, and the entire system went down. The state was dealing with backlogs and continued problems for months, and it created timeliness problems for applications. Several cases were closed because of missing verification materials, although the clients had submitted them. As one staff member said, “If it doesn’t get imaged, it doesn’t get verified, and it doesn’t exist.”
States have several methods for imaging. In states such as Massachusetts and Mississippi,
the scanning is conducted in individual offices, while in states such as Texas and Utah most scanning for the entire state is conducted at one service center. In other states, such as Washington and Wisconsin, the scanning is done by region or county. The process for scanning also varies. For instance, in Mississippi, clerical staff scanned documents as they arrived and sent them electronically to an eligibility worker’s “Inbox,” an electronic system used to verify client information provided in the interview. In Utah, full-time scanning staff implement a much more extensive process. All new documents are put into a queue, and workers on the processing team get an electronic alert notifying them of new documents waiting to be scanned. They are scanned and barcoded. The barcode identifies what the document is, who it belongs to, and where it should be assigned in the system.
Generally, document imaging and electronic case files are created as part of the same initiative. For those states that have fully implemented document imaging, once a system is developed to electronically attach documents to the proper case, the documents are scanned. An electronic case file exists and paper files are no longer needed. However, some states may not have fully implemented electronic case files but are moving toward this by adding fields in their MISs to allow staff to add case notes or narratives to individual cases. Paper files are still used to store verification documents, applications, and signatures, but some aspect of the case is documented and stored electronically.
Nationally, 32 states created some type of electronic case files. Eleven case study states have electronic case files in at least some areas of the state; Colorado, Indiana, North Carolina, and Texas created electronic case files in only select areas of the state. Most of these states created fully electronic case files, whereas D.C., Massachusetts, and North Carolina added only electronic case notes or narratives to their systems.
53
BOX 4.9: UTAH’S DATA-SHARING SYSTEM In January 2004, after two years of planning and development, Utah rolled out eFIND, a web-based data-sharing system that compiles customer information (based on Social Security number, or SSN) from multiple other data sources. Workers enter case numbers into eFIND and the system returns all customers included in the case and their SSN, age, and relationship to the client. The worker can specify search criteria—including which systems to search, the date range, and which customers to include—based on the verifications needed. eFIND includes data from the Social Security Administration, State New Hire Registry, State Quarterly Wages, State Unemployment Insurance, Office of Child Support Recovery Services, Public Assistance Reporting Information System (PARIS), Alien Registration, State Motor Vehicles, Employment Services (TANF and Food Stamp participation), Food Stamp Disqualification, Public Housing, Worker’s Compensation, Utility Assistance, Driver’s License, Prison Systems, National Directory of New Hires, Vital Statistics (Birth and Death Records), and The Work Number. The application was designed to be user-friendly and performs quickly—the average time for a full search is 15 to 20 seconds.
Using SSNs as the identifier, eFIND allows workers to gather and view customer information in one application rather than toggling between multiple screens and systems, which greatly reduces the time spent searching for and compiling information. It also expedites the verification process. For example, during the application process, workers can immediately find and verify a customer’s birth certificate and driver’s license, without requiring documentation from the client. Furthermore, because eligibility workers are no longer manually comparing information among different systems, eFIND has the potential to increase accuracy and reduce errors.
Staff Impressions of Document Imaging and Electronic Case Files In most states, staff found document imaging and electronic case files to be more efficient and to improve the way they process cases. It dramatically reduced the amount of paper staff had to sort through and allowed easier transition of cases between staff and offices. Indiana staff touted the new system and indicated that it facilitated the entire reorganization of their work (i.e., moving to a task-based system or porting work across the state). North Carolina’s Mecklenburg County return-on-investment study showed significant cost savings from its document imaging initiative, in both staff time and resources. The study linked implementation of the new initiative to reduced costs for office space, transporting files, and training, because imaging software automated completion of some forms. Utah administrators also mentioned that they could not have done any of their other modernization as efficiently without document imaging and electronic case files. They felt this was the first step for any state in modernizing. Several states, including Indiana, Mississippi, and Wisconsin, also mentioned that these efforts were indispensable during disaster relief in their states. Several states had severe flooding and hurricane damage, which caused a large influx of applications for food assistance. With the portability of cases, all counties in the state—including those that had not been affected by the disaster—could help process cases and stay ahead of the work.
54
Data-Sharing Systems Data sharing allows staff in SNAP agencies to use technology to electronically exchange client data and documentation with one or more agencies. In general, data sharing represents a level of cross-system integration that can significantly reduce the time it takes staff to obtain verification documentation and the amount of documentation clients need to submit.
Nationally 14 states created data-sharing systems for staff to verify client information. Eleven case study states have some type of data-sharing system. The centralization of the systems and the number and type of external verification systems vary considerably across the states. In Idaho, North Carolina, Utah, and Washington extensive verification—including data from Social Security records, vital statistics, Department of Motor Vehicle (DMV) records and licenses, employment and hiring data, and prison records—is available through one searchable web site. In D.C. and Wisconsin, periodic data matching from a few sources, such as the Internal Revenue Service (IRS), DMV, and state wage records, is available to staff. Table 4.8 provides additional details about the kinds of data-sharing systems available in the case study states. Box 4.9 describes Utah’s extensive data-sharing system.
Table 4.8: Data-Sharing Systems in Case Study States As of June 2009
State Data sharing Colorado Interface retrieves data from Department of Labor (UI), IRS, and SSA.
D.C. MIS imports data on a daily, weekly, or monthly basis from the IRS, Department of Employment Services, Department of Motor Vehicles, Low-Income Home Energy Assistance Program, and Department of Labor (UI).
Idaho A web-based tool is used to check data from the state Department of Labor, Child Support, Child Care, and Vital Statistics.
Kansas Workers link directly to other agency data, including SSA, DMV, Child Support, Department of Labor, local county property tax rolls, The Work Number, and Kansas Adult Supervised Population Electronic Repository.
Mississippi Multiple data matches are conducted and available online, from SSA, the Employment Division, Corrections, PARIS, and Human Services benefits in other states.
North Carolina An online verification system provides access to data from SNAP, SSA, Child Support, DMV, employment, and revenue records.
Pennsylvania Workers can access data and search for data matches from 11 different sources, including SSA, Department of Labor and Industry, and lottery benefits.
Texas The MIS links to other agency systems, including wage records, unemployment compensation, SSA, SSI, and Social Security Disability Insurance.
Utah A web-based system searches data from multiple sites (see Box 4.9 for a detailed list).
Washington Through the MIS, data are available online from the state penal system, Child Care, Child Support, Vital Statistics, employment data, veterans’ benefits, unemployment, and benefit receipt from other states through PARIS. Verification is almost completely done online.
Wisconsin The state conducts matches with the Department of Transportation (DMV), IRS, state wage data, the Child Support division, and PARIS.
Notes: Illinois, Indiana, and Massachusetts do not have data sharing.
PARIS = Public Assistance Reporting Information System.
These systems have the potential to save hours of work time, reduce the effort needed from clients to find and send verification, and increase payment accuracy. In North Carolina,
55
staff estimated that they saved 30 minutes per client because of the new verification system. In Utah, workers said, “Without eFIND we don’t know how we would live.” Initially, staff were skeptical that one system for all verification would be accurate, but they quickly accepted the system after using it for a few months. It reduced work and increased efficiency. In Washington, client data verification is almost completely conducted online, and staff noted that they do not have to ask clients for as much information during interviews or for follow-up and that fewer cases are denied because of lack of documentation.
Electronic Caseworker Manuals and Correspondence Nationally, 46 states had online caseworker manuals for their staff to use in lieu of paper copies. All the case study states had created online manuals for staff, and in some states the manuals were also available online to the public. All except two states—D.C. and Indiana—also sent all updates, memos, and policy bulletins electronically to the staff. The states all posted the correspondence on the worker sites, and in some states, like Mississippi and Wisconsin, they sent e-mails or alerts directly to the workers.
4. New or Upgraded MIS and Workflow Management Systems Several of the states visited had updated or were in the process of updating their legacy MISs from mainframe systems to web-based systems. This created new worker interfaces and, in some states, allowed offices to transform the way they managed work. These new systems facilitate moving from caseload to workload management and allow the use of task-based models through automatic assignment and task tracking. Such systems can order the priority of work that is sent to staff, and supervisors can use the systems to monitor and assess performance of individual workers and the overall office. Seven case study states made substantial updates to their MIS or developed new systems. Nine states created a new worker entry interface (i.e., generally an interactive, web-based interface that relies on links and drop-down boxes for navigation) to manage the flow of work, which could be part of the MIS overhaul or could be a separate task of adding the new up-front interface to the old MIS (processing behind the new interface). Table 4.9 provides more information about these efforts.
In most older legacy systems, staff used a series of codes to move from one page to another and to pull up files and information. In contrast, the new web-based systems allow workers to use links and drop-down boxes to move from case to case and page to page. Many of these systems also include standardized correspondence to clients that is sent through the system itself, the ability to add more in-depth case notes, and sophisticated, customizable reports. There were often sidebar navigation panes that allowed workers to move easily between screens and functions.
Pennsylvania, Utah, and Wisconsin have taken an incremental approach to moving from
their mainframe system to their new web-based systems. As components of the new system were developed, they were rolled out to staff and replaced the mainframe functions. These conversions are conducted over several years, and staff use both the legacy systems and the new system until the conversion is complete, at which point the old legacy systems will no longer be used.
56
Most states agreed that the new technology would produce cost savings and efficiencies over the long run. However, staff sometimes struggled with the amount of training needed to understand the new systems and the time it took to navigate the web-based tools. For example, in Utah’s system, workers needed to enter more information up-front and the entry system was more structured than the legacy system (i.e., workers have less ability to skip screens or move between screens). The workers often felt that it took more time to complete the cases using the new system. State staff believed, however, that the savings in reducing overpayments and increasing accuracy will outweigh the additional up-front time.
Table 4.9: MIS Upgrades and New Worker Entry Systems in the Case Study States As of June 2009
Statea MIS (Major upgrades to new system) New worker entry system
Colorado
Colorado developed a new integrated MIS in 2004. The system included several programs and calculated eligibility and benefits within the system. There were initial difficulties with the system but slowly the state has made improvements and is currently working with a new contractor to make significant improvements, making it more efficient.
Idaho
At the time of the visit, the state was in the process of implementing a new web-based MIS. The new system is all web-based and fully integrated with the web tools for electronic case files, verification, determinations, and caseload management.
Indiana Mississippi
North Carolina
In 2006, North Carolina implemented service delivery interfaces (SDIs) in select counties. SDI adapts specific county legacy systems to the statewide reporting system, Food Safety and Inspection Service, so that information does not need to be entered into two systems. Rather, information entered into the county-specific legacy system will automatically populate the state system.
Pennsylvania
Pennsylvania has adopted the “incremental renewal” approach to updating its information technology systems, moving the functionality of the mainframe (older technologies) to web-based projects (new technologies), with the eventual goal of phasing out the mainframe system.
Texas
The state has been in the process of replacing outdated computer systems with the Texas Integrated Eligibility and Redesign System (TIERS) and currently uses two computer systems: TIERS and a legacy system. TIERS was piloted in two counties and it is being rolled out in the state through adding new programs and pursuing a limited geographic expansion.
Utah
eREP is a rules-based system, which means that policy-based rules are encoded in the program. The system determines which programs an individual is eligible for based on client data that are entered in the system. This is being phased in to replace the old MIS, which requires the user to choose the programs for which eligibility should be determined. Workers will no longer have to memorize program codes required by the old system; all rules and codes are embedded in eREP.
Washington
Wisconsin
The state is developing the CARES Worker Web (CWW), which serves as the caseworker access point for the web-based eligibility system. The CARES eligibility mainframe is being phased out and the state is moving to a web-based system, housed within the CWW. Over 90 percent of the work for an interview has been converted to this web-based system; however, the mainframe is still in place for some tasks.
a D.C., Illinois, Kansas, and Massachusetts did not develop new MISs or worker entry interfaces.
57
E. Partnering Arrangements to Support Client Applications
The fourth category of modernization activity undertaken by states is partnering arrangements that state and local offices establish with CBOs, private businesses, and other government agencies. While some of these arrangements may include grant funds or other payments, these partners were not fully reimbursed for the value of the services they provide. Typically, the partners contribute staff time or office space as part of the arrangement. The primary function of these arrangements is to increase customer access to SNAP services.19 Most states have had relationships with partner organizations for many years, typically to conduct outreach and provide information about SNAP or to serve as supplemental access points, provide application assistance, or conduct follow-up activities with clients who need additional assistance.
According to the national inventory, 43 states reported collaborations with partners; most partners helped with information sharing and application assistance. While this discussion of partnering arrangements in the 14 case study states included collaborations that involve information sharing, the focus is on more intensive partnerships and activities closely associated with modernization. Generally, states enter into these arrangements to take advantage of community relationships and systems already in place to expand access and make benefits more readily available to multiple populations.
1. Types of Partners As shown in table 4.10, all 14 case study states had partnering relationships—either statewide or in select local sites—with a community-based, faith-based, or national nonprofit organization. Six states—Colorado, Illinois, Kansas, Massachusetts, Pennsylvania, and Washington—reported partnering arrangements with government agencies. Only two states, Kansas and Texas, had partnering arrangements with businesses that provided some type of application assistance, as described in more detail below.
2. Types of Agreements Findings from the national survey indicated that states employed a number of different types of arrangements with partner organizations, which varied in degree of formality. Similarly, the 14 states used contracts, grants, memoranda of understanding (MOUs) and, in many cases, more informal arrangements, with their partners. Washington established “pay per performance” contracts with 11 prime contractors (who in turn subcontracted to 67 regional and local contractors) to provide application assistance at various access points throughout the state. Texas issued a formal grant to the Texas Food Bank network to provide SNAP application assistance and other activities through its 19 partner agencies located throughout the state. Other states, such as D.C., characterize partnerships with organizations assisting clients with online applications as informal.
19 Partnerships or contractual relationships with businesses that involve full reimbursement for provision of services (e.g., privatization of administrative functions) are discussed in Section 4C.
58
Table 4.10: Types of Partnering Arrangements in Case Study States As of June 2009
State
Community-Based Organizations Other Government Agencies Businesses
Partnering arrangement
Partners provide direct
application assistance
Outstationed SNAP workers provide direct
application assistance
Partnering arrangement
Partners provide direct
application assistance
Outstationed SNAP workers provide direct
application assistance
Partnering arrangement
Partners provide direct
application assistance
Outstationed SNAP workers provide direct
application assistance
Colorado
D.C.
Idaho
Illinois
Indiana
Kansas
Massachusetts
Mississippi
North Carolina
Pennsylvania
Texas
Utah
Washington
Wisconsina a. Wisconsin provided computers and training for community-based organizations to assist clients during the implementation of their online tools. Although Wisconsin is included in this count, these formal partnerships have since ended.
59
Box 4.10: Illinois’ Express Stamps Program: A Partnership with Food Banks
The Food Stamp Demonstration Project, or Express Stamps, is a partnership of the Illinois Department of Human Services (DHS), the national coalition of food banks (Feeding America), the Northern Illinois Food Bank, and USDA-FNS. The project makes it possible for customers to apply for and be approved to receive short-term SNAP benefits—equivalent to two months of benefits—in selected partner food pantries. The pantries use a shortened application that can take as little as 15 minutes to complete. Designed to improve access and increase participation in SNAP, this collaborative effort specifically targets families with earned income, immigrants, and the elderly who frequent the food banks.
Launched in October 2006 in five partner pantries, the program has expanded to ten locations serving customers in five Illinois counties. Trained volunteers assist customers in completing the brief application using laptops provided by Feeding America, with a direct link to the DHS network. Eligibility is determined based on self-declaration of number of household members, income, assets, and housing and utility costs; only verification of identification is required. EBT cards are issued immediately, although approved customers must wait for a PIN to arrive in the mail to access the benefit allotment for one month. Approved cases are assigned to DHS workers who then inform the new customers that they must “reapply” to continue receiving benefits after the trial period has ended. State staff reported that 1,468 Express Stamps reapplications were received as of May 2009, which translated to a 68 percent reapplication rate.
3. Services Provided through Partnering Arrangements All 14 case study states developed and implemented partnerships, either statewide or at selected local sites, that provide additional access points to SNAP in community locations that potential clients frequent. All these states have partnerships that include some form of application assistance, but services available at these partner locations vary widely in scope and scale.
Application Assistance Provided by Community Partners As shown in table 4.10, all case study states had community partners that provided some type of direct application assistance. Utah, for example, used a $500,000 SNAP participation grant to launch the Community Partner Initiative in four pilot sites to provide partner agencies, such as food pantries and senior centers, with computers, printers, and fax machines to be used in helping clients apply for SNAP benefits online. State SNAP agency staff provided training on both the online application and the state’s online client case information system to partner staff. This initiative was expected to be rolled out to 60 sites statewide. Pennsylvania awarded $75,000 grants to 20 community organizations to assist new clients with the state’s online application process. The state developed and shared with partners a specially designed, condensed “power” version of the application, which allowed users to track applications. Massachusetts had a similar arrangement, training hundreds of community partners and agencies to help clients apply for SNAP and a number of other programs on the “partner face” of its electronic application tool. The unique partnership between the Illinois Department of Human Services and the national Feeding America program (see Box 4.10) allows clients to apply for and actually receive short-term SNAP benefits at local food banks. State staff felt that the program had begun to achieve its goal of increasing access to SNAP among the immigrant population, reporting that noncitizen Express Stamps applications
60
had increased. On a smaller scale, Mecklenburg County in North Carolina contracted with CBOs (e.g., Salvation Army) to provide application assistance, awarding contracts based on the number of approved applications submitted previously.
Application and Certification Services Provided by Outstationed SNAP Workers at Community Partner or Other Agency Sites According to the national survey, 30 states had SNAP workers stationed at sites outside the local offices. Ten of 14 case study states made arrangements with community partners or other government agencies to position SNAP workers at their sites. These workers provided information about SNAP benefits, took applications, and conducted interviews and typically provided all the services available in the local offices, thus eliminating the need for an in-person office visit. States partnered with organizations such as health centers, senior centers, food pantries, homeless shelters, and refugee centers to have SNAP workers available on a scheduled basis to meet with clients in a potentially more comfortable setting. Idaho, for example, negotiated a MOU with several local refugee organizations to assist with the application process for new refugees. Partner staff worked with applicants initially to ensure that all application information and verification documents were in order; a SNAP caseworker then went to the agency with a laptop and completed the application and interview with the help of an interpreter, if necessary. In Wichita, Kansas, eight outstationed workers staffed 12 Access Points in the city, providing SNAP services as part of the Community Collaboration Initiative. Staff felt that these Access Points enabled them to reach out and collaborate with partners in the community in order to meet clients where they are most comfortable and to increase their access to services.
Two states also partnered with other government agencies to provide clients with access
to SNAP benefits in locations where other services were delivered. The SNAP agency in Denver, Colorado, partnered with the Division of Child Welfare to provide outstationed SNAP workers at Family-to-Family child abuse and neglect prevention sites and with the Division of Supportive Housing and Homelessness to provide outstationed workers at Denver-area shelters. Workers used laptops to process SNAP applications and eligible clients were given EBT cards immediately, although they had to wait a few days for benefits to be loaded onto the card. In Belltown, Washington, the local SNAP office provided an outstationed worker at the county courthouse, so that individuals who were there for other business could access SNAP benefits. The worker conducted interviews and used a laptop to connect to the eligibility system via a secure network to process applications.
Application Assistance Services Provided by Businesses Two states, Kansas and Texas, had partnerships with businesses to provide SNAP application services that were not reimbursed by the state SNAP agency. H&R Block partnered with the state SNAP agency in Kansas to assist individuals in applying for SNAP benefits at their tax-preparation sites. Originally piloted during the 2007 tax season in three counties, the program was rolled out statewide in 2008, with training provided to 425 H&R Block staff. Staff assisted potential SNAP clients with completion of tax returns and then helped those who were interested complete applications, using the Benefits Enrollment Network software to capture required information and populate the application. Applications were then filed electronically or mailed to
61
service centers. Through a partnership with a grocery store chain, outreach workers from contracted partners visit grocery stores in south Texas to assist applicants.
Advising and Consulting Services Provided by Partners Six states—Washington, D.C., North Carolina, Pennsylvania, Utah, and Wisconsin—noted the important role that community partners played in providing advice and feedback on service delivery processes in general and in helping to shape and develop specific modernization efforts. For example, Wisconsin contracted with two CBOs—the Wisconsin Community Action Program and the Milwaukee Hunger Task Force—to serve as formal project advisors during the development and implementation of their online ACCESS tool (see box 4.7 above). The two partners were involved in reviewing and providing feedback on the design of the tool in the early stages, identifying and overseeing several demonstration sites, and promoting the use of the tool. Advocate partners played a key role on Pennsylvania’s Income Maintenance Advisory Committee Program Subcommittee. Pennsylvania also received regular feedback from the community partners who assist clients with the partner version of the state’s online application. D.C. cited the contributions of advocates in alerting SNAP agency staff to other modernization initiatives being implemented nationally, as well as sharing information about SNAP options available.
4. Client Experiences A key reason for establishing these partnerships is to make SNAP more accessible at locations clients frequent and where they feel comfortable. A number of focus group participants shared positive experiences about help they received from staff at partner agencies, including job centers, libraries, community centers, faith-based organizations, and food pantries. For example, one participant noted that a food bank staffer had helped her fill out the “financial part” of the SNAP application correctly so she “would get the most she could.” Another participant described her experiences with a counselor in her high school who helped her fill out an application at the school. Still another received help in applying for benefits just prior to release from prison.
F. Training of Staff and Partners
Training staff and partners plays an important role in the implementation of modernization initiatives. Nationally, over 60 percent of states reported that staff training was a challenge to modernization, and the 14 case study states echoed similar views.
The 14 case study states each used a variety of training approaches, ranging from ad hoc, in-person trainings to statewide, week-long classroom sessions. The type of training often depended on the scope of the modernization initiative and the level of need.
The need for training is gauged differently across states. Some states chose to train everyone, some tested workers to see if they met some level of proficiency, and some designated staff members to find those workers in need of training and help them get up to speed. All states noted that they use QC data as a means of seeing where additional training is needed.
62
To measure the success of a training component, multiple states tested staff after sessions and required a “passing” score before completion. This was done on computers, through written tests, and through on-site observations. Staff noted that immediate testing ensured that workers truly learned. Others, such as Idaho, created implementation teams that follow training with office observations.
In almost all the case study states, the implementation of new SNAP policy options and waivers to facilitate modernization was not accompanied by intense training. In general, such policy changes were communicated to local offices and staff through memos, bulletins, “notifications,” “alerts,” or e-mails. In Massachusetts, for example, all policies and procedures were developed by the central office and distributed to the local offices through “Field Operations Memos” (procedures), “State Letters” (policies), and a monthly newsletter called Transitions. Field Operations Memos include specific instructions to ensure that department policies were followed correctly. Policy changes could also be viewed in the MIS, with descriptions of changes available through a “what’s new” button in the system.
For modernization efforts that have a greater effect on the business process of local offices, a wider variety of training approaches were used. Several states used some sort of distance-learning or online-learning mechanism. In Texas, staff conducted quarterly “webinar trainings” on any changes in processes for staff and for contracted community partners. Pennsylvania staff members noted that their state now has travel restrictions for government employees, making long-distance learning a necessity. Distance learning can often be completed at a staff member’s desk and at the convenience of the worker. Wisconsin staff receive “distance-learning packages” (i.e., online training) through the worker web site. The state occasionally distributes these packages to all staff, and they were required to complete the online training in a set amount of time. Online trainings could include built-in tests, video instructions, and interactive features.
Most states also used a “train the trainer” approach for some initiatives, in which staff were trained on a given initiative and then charged with training their office or group. Specific training “liaisons” were established in both North Carolina and Massachusetts for local offices. Other states used local supervisors or directors as designated trainers. Several states also used staff from offices that piloted initiatives to train other offices when the initiatives were rolled out statewide. Local office directors and front-line staff involved with pilots in North Carolina and D.C. were used to expand business processes changes and technological updates to other offices in their respective states. Staff noted that this approach had the added benefit of using real experiences in implementation.
Most states also offered training seminars at the state, region, or local level. Similar to training given to new hires, local staff congregated in one place for a few hours or a few days. This training was most commonly developed and administered by state training units and could require local workers to travel to the state offices. In Mississippi and Idaho, training labs, complete with computers and intake software, were used to simulate the workers’ local office workspace. Some states, however, sent their training units to local offices. For Pennsylvania’s new MIS, state staff traveled around the state to provide three or four days of training in each county. In general, seminars were reserved for larger modernization efforts, though several state
63
Box 4.11: Washington’s Learning Management System
Washington has an extensive training system designed to provide targeted, efficient training while also giving staff a means of promotion through completing extra courses online. State staff explained the system as one of “blended learning,” mixing instructor-led trainings, on-the-job trainings, and automated, online trainings.
As part of the online training, Washington runs the online Learning Management System (LMS), which keeps track of each staff member’s training history. Using the LMS, staff can see who has signed up, who has started, and who has finished any given training. These trainings can be streamed over the Internet and allow for staff to take them when it is convenient. As part of the LMS, Washington implemented just-in-time training processes, in which trainings are given to staff just before the rollout of a new initiative. This, according to staff members, ensured that trainings would be fresh in the minds of workers for rollout.
and local training units also offered targeted trainings to groups of employees having trouble with certain smaller initiatives. Some states, such as Idaho, stressed the need for continued conventional training methods, highlighting their success with classroom settings and role-playing exercises.
Several states were also modernizing their training programs. Mississippi recently moved to a paperless system for all training materials, and Kansas piloted a new training system with assessments to measure the needs of each employee, creating automated, targeted training sessions that could be completed at a computer. Washington structured its online training system to allow customization, accommodating the schedule and training needs of individual employees (see box 4.11 for more details). Partner staff in most states were also trained, generally on basic SNAP policy and application procedures. Staff members in the majority of the case study states reported training partners at food banks, shelters, or other community organizations on basic SNAP procedures. Illinois provided training to volunteers at local food pantries, and Utah conducted trainings for all partners using their online tools. Both Texas and North Carolina used a train-the-trainer approach with food banks. For example, North Carolina SNAP staff trained food bank directors at monthly food bank meetings and then asked the directors to train their staff. Massachusetts expanded its online trainings to include partners—both government and nonprofits. According to staff members, they have had about three trainings on the online application every month for the past three years and have trained approximately 150 provider sites.
64
CHAPTER 5: THE BIG PICTURE: MODERNIZATION IN PRACTICE
Chapter 4 focuses on the discrete efforts that states implemented; however, in most states modernization is a process involving combinations of efforts and continual evolution. This chapter discusses modernization more broadly, including how states structure modernization and how efforts come together to meet the overall state goals.
A. Structure of Modernization
There is no clear or uniform definition of modernization across the states, and many states do not view the policies and initiatives they implement as modernization. Often states see their actions as simply a way to more efficiently administer the program, decrease staff workloads, or expand client access. For example, when staff in Wisconsin described their activities, they did not focus on the need to modernize their service delivery system or individual initiatives that they implemented. They instead discussed three primary goals for their programs: (1) to increase participation and access, including providing good customer service; (2) to increase payment accuracy; and (3) to decrease workload and increase efficiency. Generally, new efforts evolved as part of a strategy to meet these three goals.
States approached modernization in several ways. For some states, modernization was viewed as an overall process, not a series of discrete activities implemented one at a time. States such as Pennsylvania, Utah, Washington, and Wisconsin looked at the process more holistically and made a series of modifications across categories to effect an overall change. For instance, Utah implemented a combination of changes, which effectively eliminated the need for clients to go to a local office when applying for or maintaining assistance. No single change made this possible; rather, a host of changes, including redesigning the business model, using multiple types of technology, and applying for several waivers to federal policies, was required.
Not all the states planned and implemented modernization with overarching, comprehensive goals, however. States such as Kansas and Mississippi took a more piecemeal approach, making one or two changes periodically. Most other case study states fall somewhere in between on the continuum.
It is also important to note that modernization activities in most states were not limited to SNAP but involve application and recertification procedures for multiple benefits programs, typically TANF and Medicaid. In many cases, the desire to modernize SNAP was not the initial driving force behind these changes. For example, Pennsylvania’s online application first allowed families to apply electronically for health care benefits for children; SNAP, TANF, and other healthcare programs were subsequently added. As part of the governor’s e-government initiative, Massachusetts’ “Virtual Gateway” was developed as a portal to provide online access to multiple benefits programs, with an initial emphasis on Medicaid. Efforts to change SNAP policies and business processes must take into consideration and attempt to align the rules and regulations that govern other benefits programs, and this can often be a time-consuming and cumbersome process. States in which these programs are administered
65
by multiple departments with close working relationships or in one umbrella agency seemed to have an advantage in launching comprehensive efforts.
B. Combinations of Modernization Efforts
All case study states implemented several modernization initiatives, because very few initiatives can stand alone. Most necessitate multiple changes and new activities to work efficiently. For example, a state can create a call center, but it may serve as little more than a general information line if the state does not also implement policy changes, such as waiving the face-to-face interview to conduct initial or recertification interviews. Call center operations are enhanced substantially if the state has also implemented electronic case files and document imaging so that workers can view client cases while on a call.
In many of the most modernized states, technology and policy changes ease and facilitate modernization, but organizational or business process changes are the central component of modernization. The states generally determine which type of business model they will use (i.e., regionalization, task-based systems) and the policy and technology are created to help the model function. In Indiana, the state (using contractors) determined that they would regionalize the administration of the program and use a task-based model. From there they used new technology to facilitate the structural changes—they created regional service centers for processing phone calls and document imaging and they developed a new worker interface that disseminated work through discrete tasks and allowed for monitoring. Washington created an overall plan for modernizing its Community Services Division programs through the use of many initiatives, as presented in figure 5.1 (provided by the state).
States that relied on technology to drive modernization often found it more difficult to
adjust business models later. For instance, Utah indicated that it would like to move to a task-based system, but because of the approach it used to build its new MIS, the state is limited in the way it can distribute and monitor work. A number of state and local staff cautioned against quickly implementing new “bells and whistles” for the purposes of modernizing and then trying to modify other processes to fit around the new investments. States recommended taking the time to develop new plans for business processes that best fit the state’s needs and goals and then adding new technology to achieve those goals. Massachusetts is one state that warned against focusing too much on technology overall as the key to modernizing. It was very successful in using inventive policy changes and partnering with other state agencies to increase access and participation, which the state felt had much larger effects than did any technological initiatives it implemented.
Some states, however, were successful in building technology or implementing policy
changes first and then expanding the application to fit a new business model. For example, Washington first developed a document imaging system with a very narrow focus, basing it on the same model it used for processing and maintaining paper files. Once the new system was operational, the state realized that the technology could change the way it conducted business, including expanding the use and function of call centers. State staff explained that not only does it take time to implement a new system, but, once implemented, it also takes time to “grow into it” and really learn how to make the best use of the enhancements or new technology.
66
Figure 5.1: Washington’s Modernization Structure
Source: Cindy Mund, “Building our Future: Accessing CSD Services.” Washington State Department of Social and Health Services, February 4, 2009.
Not surprisingly, states that are more modernized have been implementing and enhancing
modernization efforts for longer periods. Utah and Washington began in 2000, Pennsylvania in 2001, and Wisconsin in 2003. In addition, these states kicked off their initiatives by first implementing either document imaging or call centers. Staff in Utah, for example, felt that the document imaging system was the lynchpin in their comprehensive modernization system, making the call centers, the electronic case files, and telecommuting feasible. Indiana, Pennsylvania, Utah, Washington, and Wisconsin are all currently operating document imaging systems, call centers, and online applications. All five states have implemented seven or more policy changes; four have been granted a waiver of face-to-face interviews at application. All states have made one or more modifications to the in-office up-front process to increase efficiency and improve client service. All these states have at least piloted a task-based case management approach, although only Indiana, Pennsylvania, and Washington are currently operating this model at any local offices. One state, Indiana, has privatized some administrative functions.
Because states often implement various modernization activities concurrently, it is difficult, if not impossible, to separate the effects of any one effort on participation, accuracy,
67
and error rates. In addition, few states have conducted internal analyses of these changes and when they do, the focus is on outcomes associated with larger technological efforts. At the same time, several states indicated that they modernized aspects of their programs in order to improve such performance outcomes, and some used FNS grants or reinvestment funds to offset the costs. States such as Indiana and Texas privatized parts of their systems to increase participation rates and lower error rates. While participation did increase in these states, their error rates continued to rise after the modernization. With the available information, it is difficult to know to what degree and in what way privatization and other changes negatively affected error rates.
It is also difficult to determine the relative effect of state modernization versus a declining economy on the recent precipitous growth in caseloads. Most case study states reported anecdotally that the economy was driving recent increases, but the changes the state made to expand access likely allowed clients to more easily use the system. Some states also noted they did not know what the workload would be like if they had not modernized their systems. With massive staff and funding cutbacks, many offices were already pushed to the limit to keep up with caseloads. The huge influx of new applications has strained offices even further. Several states reported that they would not have been able to adequately address the increased demand if they had not put some efficiencies in place that allow workers to process cases more quickly. Also, states mentioned that initiatives that helped to limit office traffic improved workflow and efficiency.
68
CHAPTER 6: CHALLENGES AND SUCCESSES OF MODERNIZATION AND FUTURE PLANS
When considering challenges and successes, state and local office staff often thought about modernization in general terms, rather than singling out specific modernization efforts. This chapter describes the overall challenges states faced when undertaking modernization initiatives and summarizes the key successes identified. Future plans for modernization efforts are also presented. Findings from the national inventory are included for context, with more detailed descriptions of the 14 case study states.
A. Modernization Challenges
Nationally, a majority of states encountered modernization challenges related to limited staff or resources (98 percent), unanticipated costs (91 percent), delays in schedules and deadlines (76 percent), competing priorities (68 percent), limited time for rollout (71 percent), restructuring local staff (88 percent), hiring staff (57 percent), training staff (60 percent), working with unions (63 percent), and obtaining approval for waivers (69 percent). Staff in the 14 case study states reported several challenges as well, shown in table 6.1.
Table 6.1: Challenges to Modernization Reported by Case Study States
State
Staf
f sho
rtag
es
Staf
f tur
nove
r
Man
agin
g st
aff a
nd
clie
nt r
espo
nses
Prog
ram
in
tegr
atio
n
Tra
inin
g
Ove
rall
case
load
vo
lum
e
Insu
ffic
ient
re
sour
ces
Tec
hnol
ogic
al
limita
tions
No
prev
ious
ex
peri
ence
Loc
al o
ffic
e di
ffer
ence
s
Uni
on p
ress
ure
Leg
isla
ture
pr
essu
re
Colorado
D.C.
Idaho
Illinois
Indiana
Kansas
Massachusetts
Mississippi
North Carolina
Pennsylvania
Texas
Utah
Washington
Wisconsin
1. Staff Shortages
As shown in table 6.1, in 10 case study states, inadequate staffing levels were a general obstacle to modernization initiatives. As caseloads rose dramatically, staffing levels dropped or remained
69
stagnant in both state and local offices. Budget shortfalls and hiring freezes kept most states from hiring additional staff to meet the increased demand for services. For example, in Washington, eligibility staff decreased by 35 percent in recent years, while the caseload rose dramatically; in Texas, staff reported staffing reductions as high as 50 percent.
Staff shortages posed two problems for modernization initiatives. First, administrators found that planning and implementing new initiatives with overburdened staff was difficult because all their extra energy was put into keeping up with the current caseload. Administrators in several states noted that staff were working overtime just to keep from falling behind. Second, once modernization efforts were implemented, staff reported that these efforts, especially larger business process changes and technological initiatives, required more staff at the front end to ensure that the effort got off the ground and the transition went smoothly. These staff need training and support as they learn new roles and at the same time their previous workload must be redistributed to other staff. In Dane County, Wisconsin, when the office implemented the call center, some eligibility staff reacted negatively to the amount of resources that went into getting the call center up and running and the amount of extra case work they had to redistribute as workers moved to call center positions. One D.C. worker noted, however, that the success of the city’s business process changes was attributable to the decision to shift more staff to the pilot initiative during rollout. Without that increase in workers, the initiative would not have succeeded. In Texas, difficulty in rolling out its statewide eligibility and service delivery initiative was attributed to a lack of staff, with one worker noting: “We could roll out TIERS [their MIS system] if we had 30–40 percent more staff…there is not enough TIERS-trained staff; enough mentors to trouble shoot…80 percent of the problem is lack of staff.”
2. Staff Turnover Staff turnover compounded problems caused by staff reductions and created new problems due to the loss of institutional knowledge. In Texas, staff members reported that the percentage of workers with two or more years of experience decreased dramatically in the past five years and that using less experienced workers can lead to increases in error rates and reduced timeliness.
In some instances, modernization itself led to higher staff turnover. States reported that some staff simply chose to quit rather than learn new procedures. In Texas, plans for privatization resulted in high turnover as staff left for other jobs rather than waiting for their jobs to be outsourced. Some older staff also chose to transition out of their jobs as the use of new technologies expanded, rather than learn the new systems.
Turnover also creates more work to hire and train new staff. New staff need substantial
training and on-the-job mentoring. They tend to complete work more slowly until they gain experience. Wisconsin indicated that it takes about 12 to 18 months to fully train caseworkers and get them to a point where they are managing a full caseload. Staff turnover meant less time for planning and less in-house expertise to steer successful implementation of a modernization initiative. Administrators and staff noted that many modernization efforts, from policy changes to technological upgrades, required seasoned workers to help newer staff adapt to changes while complying with federal and state regulations.
70
3. Managing Staff and Client Responses to Modernization Changes New ways of doing business were met with different reactions and varying degrees of acceptance from local office staff as well as clients. Feedback from both groups indicated that a change in the existing culture might be required for successful institutionalization of the modernization changes.
Staff Responses In states with modified SNAP business practices, some staff resisted changes that significantly altered the existing service delivery models or the “old way of doing business.” Particularly among long-term staff who were accustomed to the traditional client-worker case management model, the loss of one-on-one, ongoing relationships that accompanied the shift to call centers or a task-based case processing system was difficult. Administrators also noted that technological changes were a particular problem for staff unaccustomed to using computers and the Internet. They did note, however, that this challenge would likely dissipate as older workers retire and are replaced by younger workers more at ease with electronic communication systems. Modernization efforts were also challenged when staff stayed in their positions and pushed back against changes. One administrator reported that the biggest obstacle to modernization is “selling new ideas to the field.”
In some cases, administrators tried to address this issue by assigning workers to tasks they preferred. For example, in a Philadelphia local office, workers who enjoyed meeting with clients were assigned up-front work as customer service representatives while other “behind the scenes” staff completed task-based work. Call centers require staff that can work in a fast-paced environment (there is little “down time” in the call center) and have an even temperament to deal with the high volume of clients, who are often calling with problems. In Wisconsin, supervisors found that some staff were not a good fit for the call centers because they were not “phone people”; ultimately these staff returned to caseworker positions. Many states also indicated there was a high-level of “burnout” among call center staff, and some states began rotating staff on and off the telephones.
Kansas piloted a task-based case management model in one region that, according to staff, was an “utter failure,” resulting in increased error rates. The model was discontinued after two years. Reportedly, one reason for the lack of success was that the decision to implement this model was made without the buy-in of local staff.
In general, states tried to address resistance to change by launching efforts to keep staff at all levels informed about new activities and to obtain their engagement and support. Texas used SNAP agency staff called “change champions” to manage and facilitate the change process. They were tasked with presenting the new automated eligibility system in a positive light and allaying staff fears that it threatened their jobs. Administrators in Larimer County, Colorado, worked closely with staff to keep them informed about the rationale for the shift to a task-based case management model and to help them adjust to the loss of a personal relationship with clients.
71
Client Responses While some focus group participants identified positive outcomes related to time-saving changes, others complained about specific aspects of new service delivery models, particularly the cultural shift required for the move away from face-to-face contact with a worker. Some noted loss of the “personal touch” and the trust they felt when they had a dedicated caseworker. Others expressed frustrations with the call center design that prevented them from talking to workers in their local offices and with the complicated automated phone response systems, which made it hard to get through to a caseworker or “real person.” They also described frustrations with an increased emphasis on more automated processes (as opposed to in-person processes), in which they were redirected to the telephone or computer to obtain services. With the shift to task-based organizations, clients also sometimes felt there were inconsistencies in the information they received. They might talk to several people—the up-front workers, call center staff, and a caseworker—all of whom might provide them with different information. Dropping off or mailing verification documentation was also a concern voiced by many clients. They indicated that they preferred to “put it in someone’s hands,” so they knew it had been received. This distrust and frustration sometimes had negative consequences for the workload as well. In some states, when clients could not contact a worker to check on the status of their case, they would send applications and verifications multiple times to make sure the office received it. This backed up the systems that process documents and created more work for staff. In fact, the multiple points of contact sometimes perpetuated this problem. In Indiana, when the document imaging center fell behind in processing paperwork, the MIS was not able to acknowledge that verification documents had been submitted. If a client contacted the call center, he or she was told the documentation had not been received and to send it again. The document imaging center then had duplicate documents for individual cases, which caused further delays.
4. Program Integration The SNAP offices in each of the 14 case study states were responsible for multiple programs, ranging from TANF and SNAP only to more than 10 federal and state benefit programs. With integrated programs came increased complexity for SNAP modernization. Changes made to SNAP often affected multiple benefits programs, indirectly through shared information systems or directly through changed business processes. For example, D.C.’s MIS contains the eligibility determination tool for all benefits programs administered by the umbrella agency. When program criteria are changed for SNAP but not for other programs, special programming code must be written so that the new policy affects only the SNAP benefits.
Integration of benefit programs presented challenges not only for programming staff but also for intake workers trying to determine where to enter information and to understand what polices affect which benefits. Clients also had to learn which changes affected what programs. In Massachusetts, the SNAP unit experienced several challenges related to developing and implementing the online application for multiple programs. With one application for multiple programs, a lot of compromise and “work-arounds” were needed to make terminology applicable to all programs. For example, staff members noted that SNAP policy defines a “household”
72
differently than do most other programs. Staff also noted that competing priorities among benefit programs for system development work slowed SNAP changes. One worker reported that MassHealth, Massachusetts’s health care program, has always been the priority and programming for SNAP must compete with the demands for MassHealth enhancements.
5. Training Training for specific modernization initiatives proved to be challenging for a number of states. While some state staff reported that implementation of an initiative was hindered by insufficient training, others complained about the types of training provided. State staff in Wisconsin reported that local office workers disliked traveling to the state offices for in-person training, but also found distance learning to be unhelpful at times. Finding the right balance in type of training was a struggle. Staff members in Wisconsin noted that training was not always effective and that conveying the information to a county did not guarantee correct implementation. One worker noted, “Communication and implementation are two different things.”
States also reported that trainers were overburdened with existing work and that any further training needs would be difficult to meet. Several states experienced a reduction in training resources with budget shortfalls, further exacerbating the problem.
In addition, updating training materials proved to be a needed but difficult endeavor. Staff complained that it was impossible to predict all the problems a county might encounter during the rollout of an initiative and that updates were constantly needed. Staff in Colorado reportedly struggled to keep training up to date and to convey those changes to the local offices once an initiative was implemented. The process turned out to be extremely time consuming and resource intensive.
6. Overall Caseload Volume As previously noted, dramatic increases in local office caseloads made some modernization initiatives difficult to take on. In all 14 states, staff noted that both state and local workers were strained to simply maintain their current level of service given the increases and changes in composition of the caseload. While some modernization efforts became a necessity because of the increased participation, others—particularly those that did not specifically address staff and process efficiency—were put aside because staff did not have the time to plan or implement them. For example, Wisconsin was approved for a CAP waiver two years ago, but the staff did not have the time or resources to plan and implement the initiative.
7. Insufficient Resources
Changes in the states’ economic situations reportedly created challenges for modernization, making it difficult to identify and secure sufficient state funding for new activities. Staff in Kansas, for example, convened workgroups to review options, looked at systems used by other states, and developed specifications for a new MIS. Plans were approved by the relevant state agencies but not funded by the legislature. Although the upgrade is currently on hold, staff have discussed plans to try to convince the legislature that the lack of up-to-date technology affects the work process, timeliness, and ability to produce reports on outcomes. Lack of funding was
73
also cited as the reason for not implementing call centers or moving toward document imaging or electronic case files in Kansas. Colorado, as well, decided not to implement needed changes to its MIS because of budget shortfalls, and reported that it planned far more technological innovations than it could ultimately afford to implement. States such as Washington, Texas, and Idaho reported that they were under specific budget neutrality obligations, requiring any new modernization efforts to be offset by cuts in other program spending. Many states also mentioned that IT resources were particularly scarce and that fiscal constraints slowed or halted the implementation of various modernization efforts. Technological efforts, business process changes, and policy changes often required changes to MIS hardware and software.
8. Existing Technological Limitations In some states, certain initiatives were halted because the existing technological infrastructure was inadequate. Pennsylvania and Kansas staff identified a number of challenges related to the introduction of scanning and document imaging, mostly related to insufficient numbers of machines and outdated equipment. Illinois reported significant challenges with its systems infrastructure. Specifically, the state’s MIS was developed in the 1960s and 1970s and was not designed to support the kinds of changes that the state has made. Mississippi, too, faced technological limitations because of its MIS and computer hardware, and was looking at further upgrades so that more imaging initiatives could be implemented. Other states, such as Indiana, found that software crashes in the MIS slowed modernization efforts, as did problems with phone monitoring systems in D.C. Staff in Utah noted that technology can be an efficient tool “when it is working, but can cripple the entire system for months when it is not,” as was the case when a virus corrupted the state’s document imaging server.
9. Previous Experience Some states struggled to design a comprehensive plan for modernization. Staff reported that planning large initiatives was difficult and that trying to take into account all the potential problems was impossible—inevitably something would be overlooked. In Indiana, staff reported a need to design their initiative from scratch because there were no existing models from which to learn. Even with extensive testing, they noted, it took several months to work out all the bugs in the system. Staff also indicated that if they had another state’s experience to draw from—particularly related to privatization—mistakes could have been avoided.
10. Local Office Differences Differences in local office practices and authority posed a problem for some case study states. State staff in one state felt that the planning process for modernization initiatives suffered because the local offices could not agree on how to move forward, noting “you can do many more things with a committee of 1 rather than 100.” This was a particular problem for county-administered states looking to implement statewide changes. In Wisconsin, the state had to make sure that initiatives could work in urban and rural counties and with all types of organizational systems. Milwaukee County posed a particular challenge because their organization was the most different and they had the largest caseload. If a change worked there, it would generally work elsewhere in the state.
74
In some case study states, local office variation also resulted in ongoing problems and negotiations. Statewide directives were interpreted differently across counties, causing initiatives to be implemented in different ways and perhaps not as effectively in some offices. One staff member commented, “Each local office operated under the same policies but everyone had their own twist. It has been a challenge to break those local office habits.”
11. Pressures from Outside the Agency Pressure from other sources, such as legislatures, unions, and advocates, presented challenges to modernization efforts for half the case study states. Pennsylvania reported that unions representing agency workers were particularly active and strong. They were suspicious of efforts to streamline and simplify processes, fearing that the use of new technology might eliminate jobs. Washington also noted that union rules and responses were a major consideration in the planning process for modernization. With respect to legislative pressures, staff in Texas reported that the legislature imposed a tight timeline for implementation on their statewide eligibility and service delivery system. Staff reported that the restrictive timeline caused them to overlook initial problems. In Colorado, staff noted that legislative pressures caused them to promise more technology than they could ultimately afford. Some states also reported that advocacy organizations pushed them to move forward with modernization activities more quickly than planned. For example, staff in D.C. reported that advocates encouraged members of the D.C. Council to propose legislation requesting adoption of broad-based categorical eligibility. Although the agency was already planning to do so, some staff felt that this pressure forced them to take action more quickly.
B. Modernization Successes
Nationally, states felt that increased SNAP caseloads were the greatest success of modernization efforts; 76 percent of states felt that their modernization efforts were successful in increasing overall SNAP participation. Moreover, 67 percent of states indicated that their modernization efforts positively affected client satisfaction and 43 percent reported they decreased application processing time.
Administrators and staff in the case study states cited a number of successes related to modernization, despite economic downturns and unprecedented caseload growth. Generally, staff felt that modernization resulted in increased customer access, participation, and staff satisfaction. They also reported positive outcomes for customer service and overall efficiency (including timeliness, accuracy, and cost savings). However, it was hard for states to disentangle increases in participation resulting from implementation of modernization efforts from those resulting from general caseload increases occurring nationally over the past several years.
There was a substantial amount of overlap when describing successes related to specific
goals or outcomes. For example, implementation of changes to the in-office up-front process could be viewed as a success in improving not just customer access and customer service but also efficiency and staff satisfaction.
75
Keys to Successful Modernization One topic of considerable interest is why some states are more successful in implementing modernization activities than others. Closer examination of the history of modernization in the case study states on the more modernized end of the spectrum provided some additional insight into factors that lead to successful implementation of comprehensive modernization initiatives. Leadership. Some more modernized states benefitted from the commitment and motivation of a key group of SNAP administrators and staff who initiated and continued to lead modernization efforts as they evolved over several years. Staff in Utah, for example, felt that their success was due in no small part to the “great leadership” provided by the SNAP agency. A core group of state staff in Utah, for example, was responsible for initially developing an agency business plan that included a comprehensive overhaul of their eligibility model, focusing on improvements to their business process. State staff hoped to preempt possible consideration by the legislature of privatization of eligibility processes by already having a successful, in-house model in place. Key team members also participated in a site visit to Florida to learn more about that state’s modernization efforts to help guide Utah’s multiphase planning and development process. Pennsylvania’s modernization efforts, which began with the development of an online application, were also led by a very experienced cross-department team from within the SNAP agency, with strong support from the agency director. A strong SNAP agency leadership team in Washington was also credited with launching their document imaging effort and expanding their modernization efforts over several years. Available Funding. States that have implemented modernization activities have been successful in identifying and securing funding for these efforts in ways that other states have not. Some states receive allocations directly from the legislature while others used FNS bonus money for accuracy and timeliness performance to fund modernization. Although a variety of factors affect success at finding needed resources, some possible explanations include particularly strong leadership in the state offices, agencies that develop effective mission statements and goals, and well-developed collegial relationships with governors and legislatures. History of Innovation. Several more modernized states can be characterized as having a tradition of innovation. Utah, Washington, and Wisconsin have typically been among the pioneers in testing new service delivery strategies. Advocacy Collaboration. Active involvement and, in some cases, pressure from advocacy organizations was associated with successful modernization in some states, including Washington, Utah, and Pennsylvania. For example, staff in Washington reported that they included representatives from advocacy groups and unions in their planning process to secure their support and buy-in as efforts progressed.
C. Future Plans
Most case study states continue to make plans that will increase access and participation while making their administrative process more streamlined and efficient. Some states were actively planning new efforts, whereas others were just discussing possibilities. Figure 6.1 illustrates the continuum of modernization plans based on what states reported in early 2009.
76
Figure 6.1: Future Plans Continuum
Limited plans for future modernization activities tended to be more fragmented, with a
scattering of initiatives in the planning stages or larger more comprehensive initiatives still far from fruition. Mississippi, for instance, was discussing plans to expand statewide its document imaging pilot as well as its business process changes. Further modernization initiatives were in the very early planning stages but included plans for e-signatures that would allow supervisors to sign off on cases remotely, automating state reports, and making the MIS more interactive. In Kansas, future plans included a CAP and a waiver of face-to-face interviews at application. The state also planned to work with the legislature to secure funding for restructuring the MIS.
Moderately advanced plans included states that intend both to expand current efforts and to develop additional initiatives not already developed. For example, Illinois had formal plans for expanding its Express Stamps initiative and its call centers. In addition, state officials were looking at several policy initiatives, including expanded categorical eligibility and a waiver of the face-to-face interview at application. Both were intended to increase program access. Colorado indicated that it convene a monthly meeting of directors from the counties with the 10 largest caseloads to discuss and prioritize new ideas and activities, including upgrades to the MIS and improvements to the business model. Along with various other smaller initiatives, Texas planned to expand its integrated eligibility system. Wisconsin planned to implement a telephonic signature, online recertifications, and its CAP waiver. Massachusetts was moving forward with expansion of its document imaging system and was considering expanding its call centers. This state is also continually looking for new opportunities to partner with CBOs and other governmental agencies.
States with comprehensive approaches had firm plans to modernize their programs and, in some cases, had planning groups actively working on modernization efforts. In North Carolina, the first two phases of its comprehensive modernization initiative, both online verifications and new service delivery software, had been rolled out. Expansion of the new service delivery interface system began in 2009, with full implementation planned to be completed by 2014. Additional case management software will be implemented in 2010, allowing for easier portability of cases, streamlined workloads, and simplified reporting procedures. This initiative will automate much of the application process using document imaging, an online verification system, and the new service delivery software. As part of the plan, case workers will process benefits for more programs, thus changing the business process for most caseworkers who currently administer only TANF and SNAP. Implementation of this
Moderate Plans
Comprehensive Plans
Kansas
Mississippi
Colorado Illinois Indiana
Massachusetts Texas
Wisconsin
D.C. Idaho
North Carolina Pennsylvania
Utah Washington
Limited Plans
77
initiative is overseen by a steering committee in charge of keeping the initiative on track. Washington was in the process of rolling out a comprehensive change in its call center system, moving to a statewide, regionally based system that will be connected virtually through online verification and document imaging systems. The state has an extensive service redesign model for planning and ensuring modernization in the future.
Although less formalized, D.C. was also undertaking broad changes. These included expanding service delivery initiatives, consolidating local offices, reaching out to community partners, introducing document imaging and kiosks, expanding categorical eligibility, and applying for e-signatures so that they can develop an electronic application that will feed directly into its MIS. All the activities were part of a broad push by a new agency director to modernize the system and increase access and efficiency. Utah, Idaho, and Pennsylvania were also planning to expand or implement comprehensive initiatives across modernization categories. Utah, in particular, planned to conduct numerous technological initiatives, including an electronic prescreening tool, a payment portal, interactive voice response upgrades to their toll-free information line, and a redesign of their business process.
78
CHAPTER 7: LESSONS LEARNED AND FUTURE POLICY CONSIDERATIONS
This chapter presents lessons reported by state respondents, followed by policy considerations to inform future state modernization efforts.
A. Lessons Learned
Modernization has been a trial-and-error process for many states. State staff reported that they tested various strategies, occasionally retooled them mid-implementation, and, in some cases, abandoned efforts all together. On the basis of their experiences, states identified a number of lessons learned about implementation of modernization initiatives.
Careful Planning Is Essential Nationally, 36 percent of all states reported that additional planning should have happened before they implemented efforts, and another 26 percent suggested that states take more time to roll out efforts during the initial implementation period. This sentiment was echoed by staff in the 14 case study states. Staff attributed success to careful planning and implementation and cautioned against rushing to implement. Illinois pointed to its efforts to develop easily understood scripts for its web application and felt that its success was partly a result of these efforts. Utah staff suggested that states should not “plow new ground” when beginning to modernize. In other words, planning processes should take into account the efforts already implemented in other states.
The plan itself should clearly set goals. Pennsylvania administrators suggested that modernization planners decide what they want their program to look like in the future, develop the appropriate business plan, and then develop the business processes needed to accomplish their goals. D.C. staffers cautioned against “letting automation drive service delivery.” Too often, staff members noted, technology is brought in before adequate planning on how the process would best be administered.
Roll Out the Modernization Incrementally Nationally, a few states—all that had implemented several major initiatives—suggested that the actual rollout of modernization efforts should be done incrementally. Several case study states stressed the importance of slowing down the implementation process and breaking it into segments, after a careful planning process. Staff in a number of states suggested that most modernization efforts should be piloted first and that a certain degree of freedom should be given to pilot programs to change plans and models as they encounter problems. D.C. staff noted that piloting their new service delivery system was crucial to its success, allowing planners to identify problem areas and to get input from staff at all levels. Texas cautioned against rushing the early implementation process, noting that it tried to do too much too quickly. Staff in Wisconsin recognized that even with extensive planning up-front, unanticipated problems spring
79
up, so they recommended building in time and resources to make postimplementation modifications and refinements.
Utah staff also felt that their iterative approach to implementation had contributed greatly to their success. By first launching each new component (e.g., online application) as a pilot, followed by staggered office-by-office implementation, the state was able to identify and correct issues as they arose, prior to a statewide rollout. This approach also enabled Utah staff to demonstrate success with one or more modernization activities, helping them gain support and buy-in from both staff and policymakers before moving on to another related effort.
Flexibility Is Key to Success Staff in several states noted the importance of giving local offices a certain degree of flexibility so that they could adapt an effort to their needs and choose the most efficient approaches for their environment. This included allowing frequent feedback, addressing suggestions of local offices, and maintaining close oversight to ensure that local variation remains consistent with the goals of modernization For example, both D.C. and Mississippi provided local offices with some latitude in developing processes and procedures for implementing document imaging efforts, believing that they knew the best way to integrate a new system into their existing business processes.
Training Is an Integral Part of the Process Staff in several case study states recommended that the implementation process for modernization efforts include time and resources for adequate training. Using workers who have previous experience to provide the training and incorporating ways to test training results were also considered important to success.
Actively Encourage Buy-In from Staff and Stakeholders Nationally, 60 percent of states suggested that buy-in and support from staff at all levels was needed before a modernization effort was implemented. Staff in the 14 case study states offered approaches to gain staff acceptance and ownership of modernization activities. Administrators in Larimer County, Colorado, worked closely with staff to keep them informed about the rationale for the shift to a task-based case management model and to help them adjust to the loss of a personal relationship with clients. The county office leadership recognized that they needed help to make this transition and hired a consultant to work with managers and supervisors on helping their case workers and clerical staff adjust to the new business model. State officials in Wisconsin, which has a county-administered system, knew that engaging the counties and getting buy-in during the early stages of their modernization initiatives was vital. Staff communicated the purpose and goals of each activity to stakeholders to engage them and to get their support for new activities. When these groups were “on board,” the state found that they actually helped to champion the initiatives to others. They also actively solicited and considered feedback from local community organizations, advocates, and clients. Staff in Pennsylvania recommended obtaining the commitment of top agency officials, involving community partners and the relevant stakeholders, and keeping all local managers informed from the onset to secure their buy-in. Finally, staff reported that soliciting input and getting approval from other state
80
administrators was beneficial to implementation. Involving all stakeholders in early as well as ongoing planning sessions and demonstrated acknowledgement and incorporation of feedback into plans were considered to be critical to obtaining buy-in for new initiatives.
Make the Most of Technology Although technology should not drive modernization, staff in several states suggested that other states maximize their use of technology because it creates efficiency and facilitates overall modernization. Mississippi noted the importance of having updated computer terminals in order to push through a host of changes. One Wisconsin staffer noted that “one of the lessons learned is that you have to embrace technology. You can slice and dice it. Think outside the box and technology allows you to do many different things.…We’re foolish if we don’t jump on opportunities to make it easier for workers to manage work.”
B. Future Policy Considerations
Modernization has brought sweeping changes to client access and staff productivity in the delivery of SNAP benefits. However, the trajectory has been uneven across the country and some modernization activities have been especially challenging. The convergence of increasing caseloads, state budget constraints, and improved technology make this a critical time for an informed and deliberate effort to further advance SNAP modernization. Future federal policy considerations of the following steps may be useful.
Coordination among Federal Agencies to Better Align Program Goals and Policies At the state and local level, SNAP is administered along with other benefit programs and shares computer systems and workers with those programs—primarily TANF and Medicaid. Improved coordination of policy changes in federal requirements, with an eye toward their implications for eligibility and case management systems, could help to alleviate some of the challenges to modernization. However, as long as each program has different eligibility and benefit rules, coordination will likely remain a complex and evolving process.
Development of Templates for State Use Certain modernization activities have been implemented in a number of states for years, yet other states struggle to get these efforts off the ground. For example, many states are developing and implementing online applications, but applications vary widely in their appearance and functionality. There is also a large up-front cost in developing this kind of technology in each state. A federally developed template for an electronic application could be provided for states to customize and incorporate into their eligibility systems. Such a template would serve to jump-start states that have been slower to modernize, disseminate knowledge gained from existing efforts, defray some costs of investing in this type of technology, and communicate federal support for online applications.
81
Consider Changes to Funding Incentives Some states were motivated to modernize by the need to improve their SNAP performance, while other states used their performance bonuses to fund modernization activities. Additional types of incentives focused on promoting specific modernization initiatives could be incorporated into the existing performance bonus incentives structure.
Consider Evaluating Specific State Initiatives Tying modernization initiatives to outcomes requires detailed data collection over time and careful analysis to rule out other explanations. Most states collect some activity data, and a smaller number of states have some performance measures. FNS is currently examining the performance measures that states are using. However, a more rigorous examination of the relationship between specific initiatives and impact requires a commitment to demonstration conditions, dedicated funding, and time. Viewing states as “laboratories for innovation” offers an opportunity to learn a great deal through demonstration projects similar to those funded by the Department of Health and Human Services during the period of TANF reform.


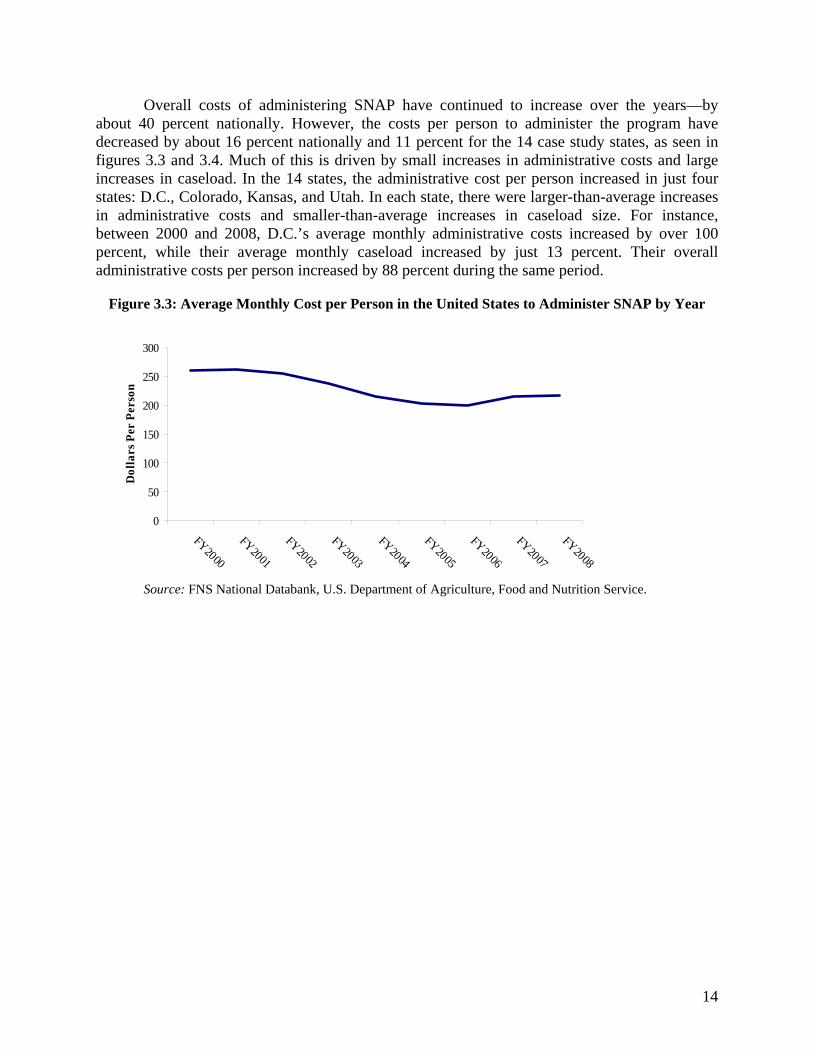


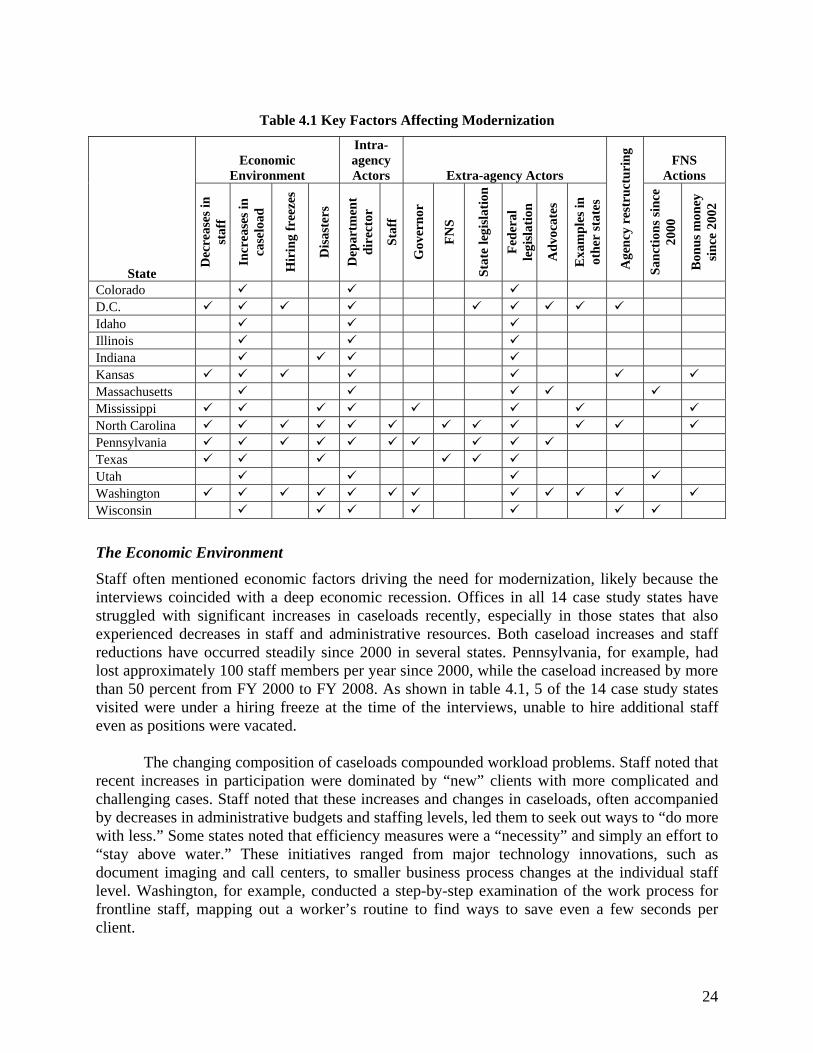
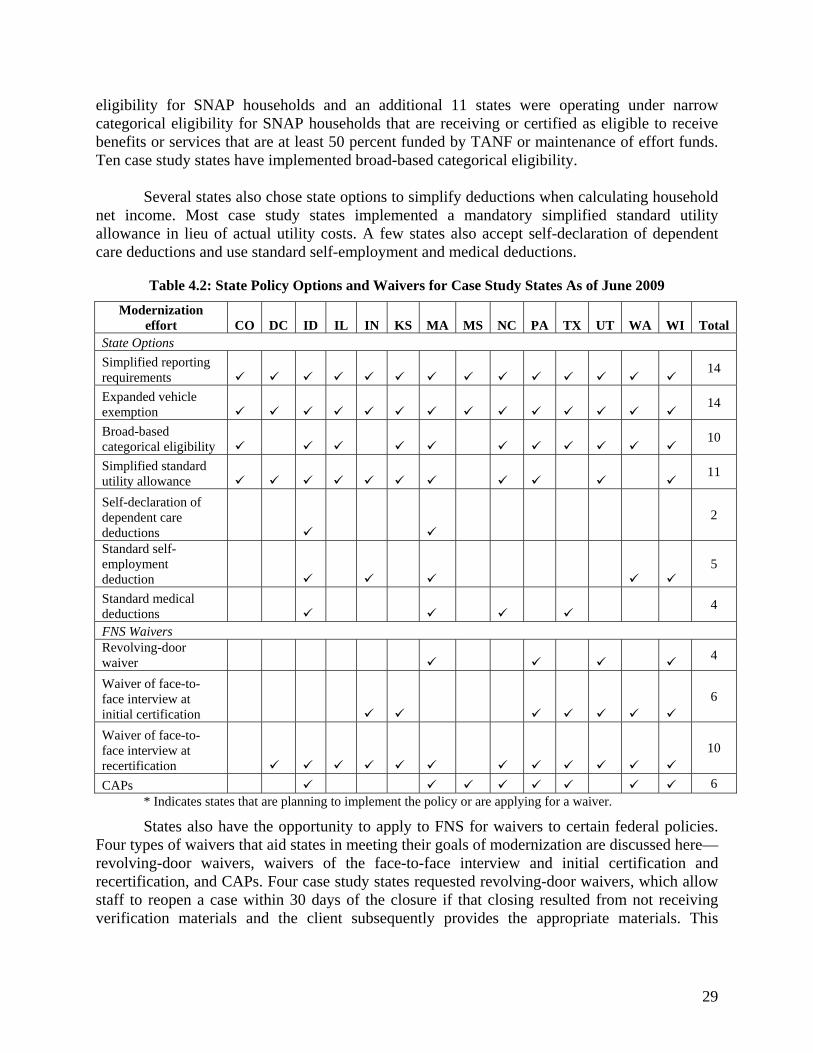


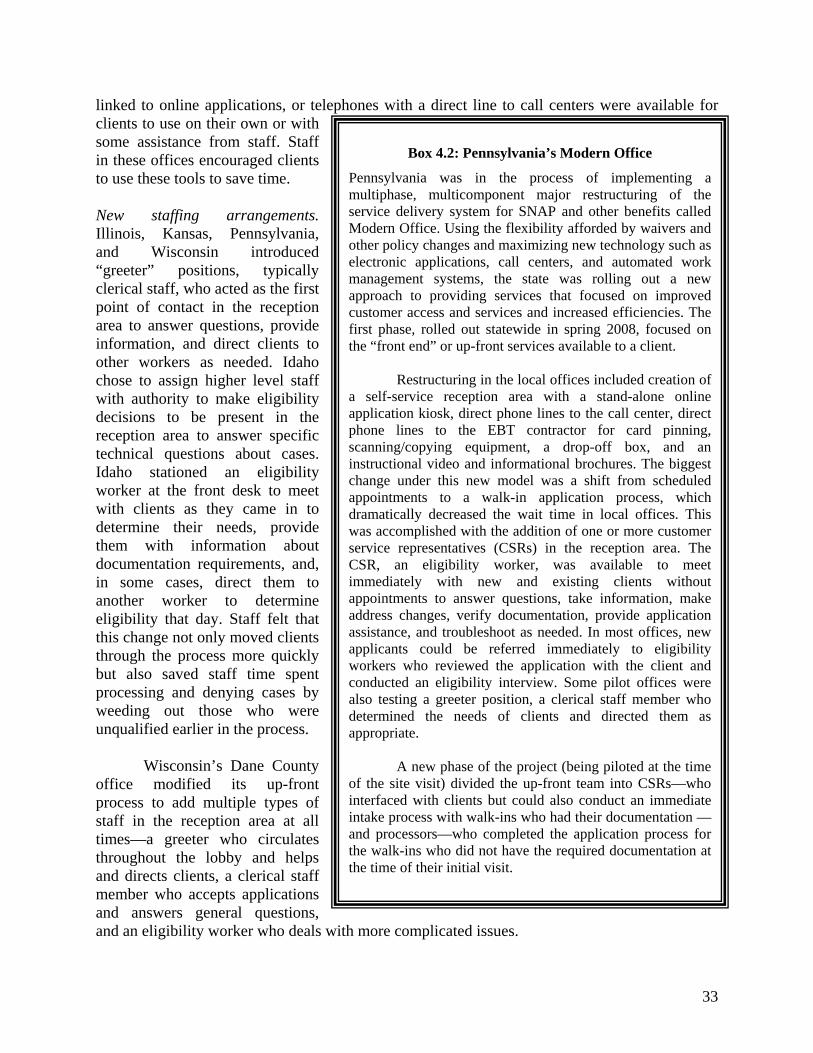
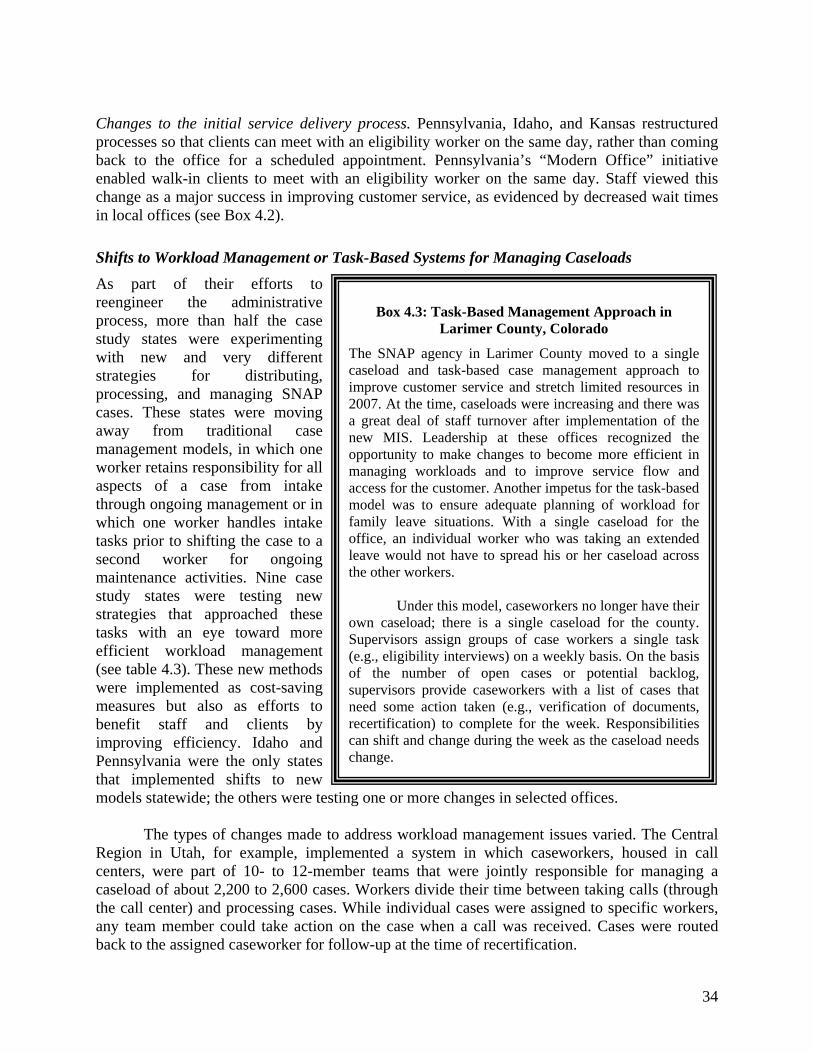


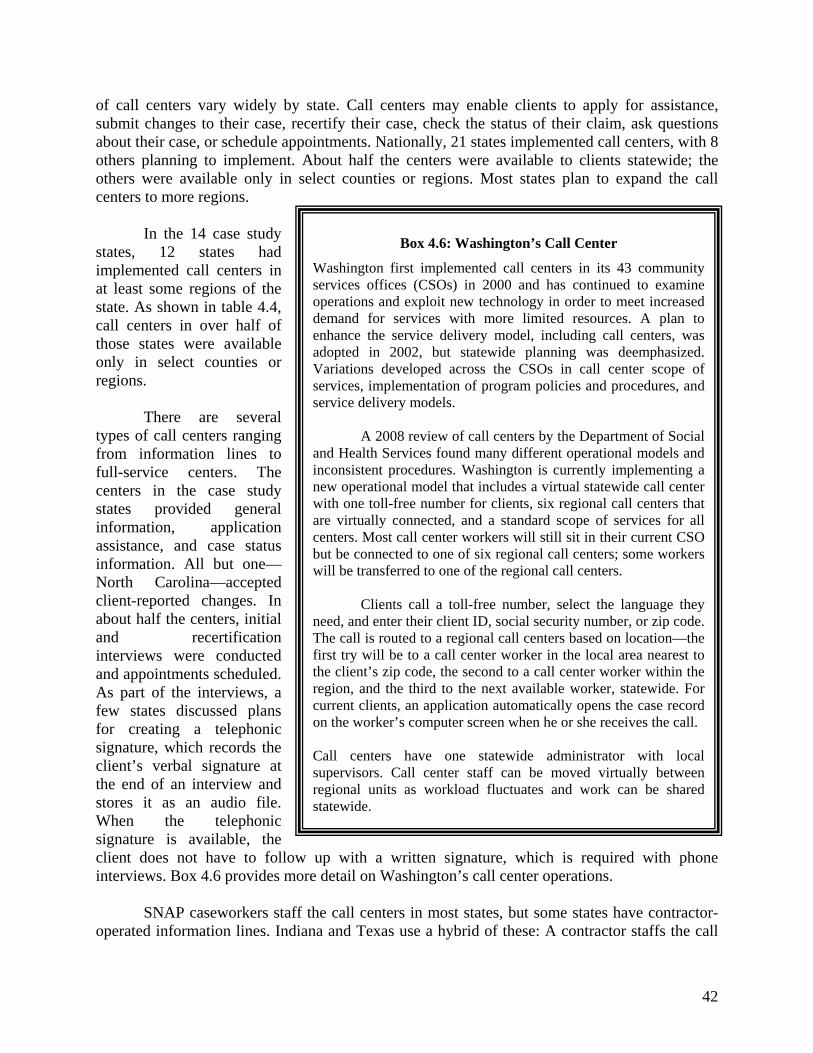


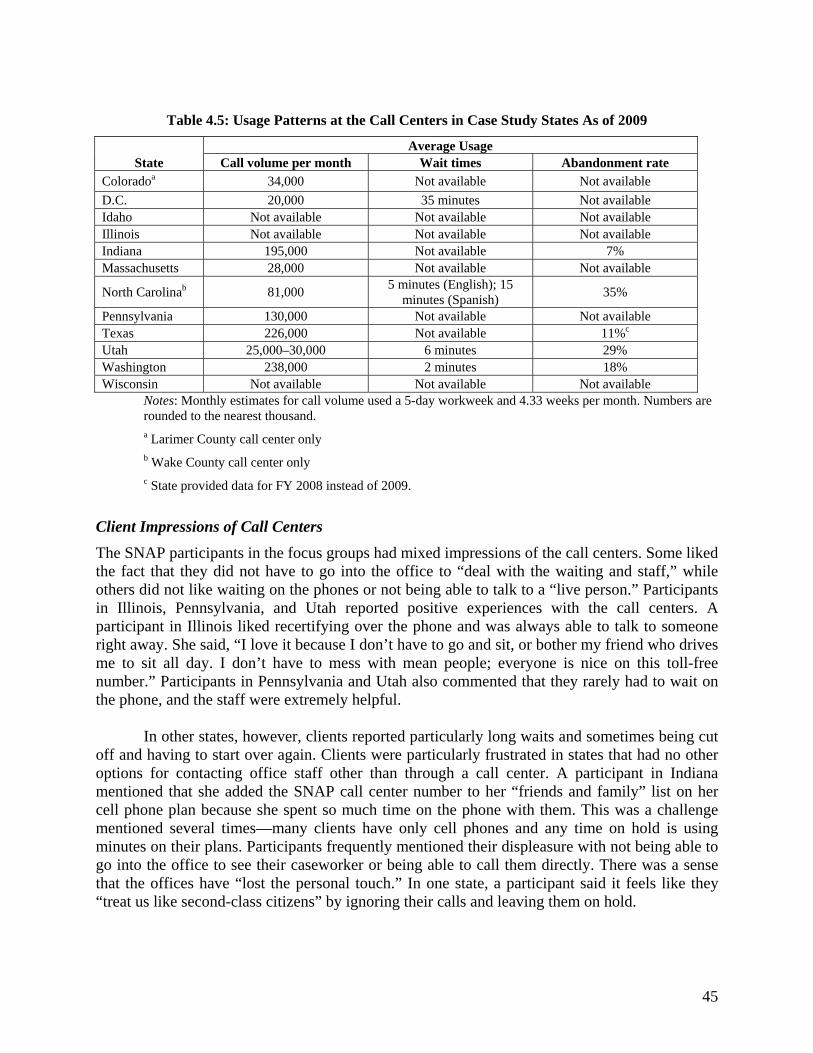


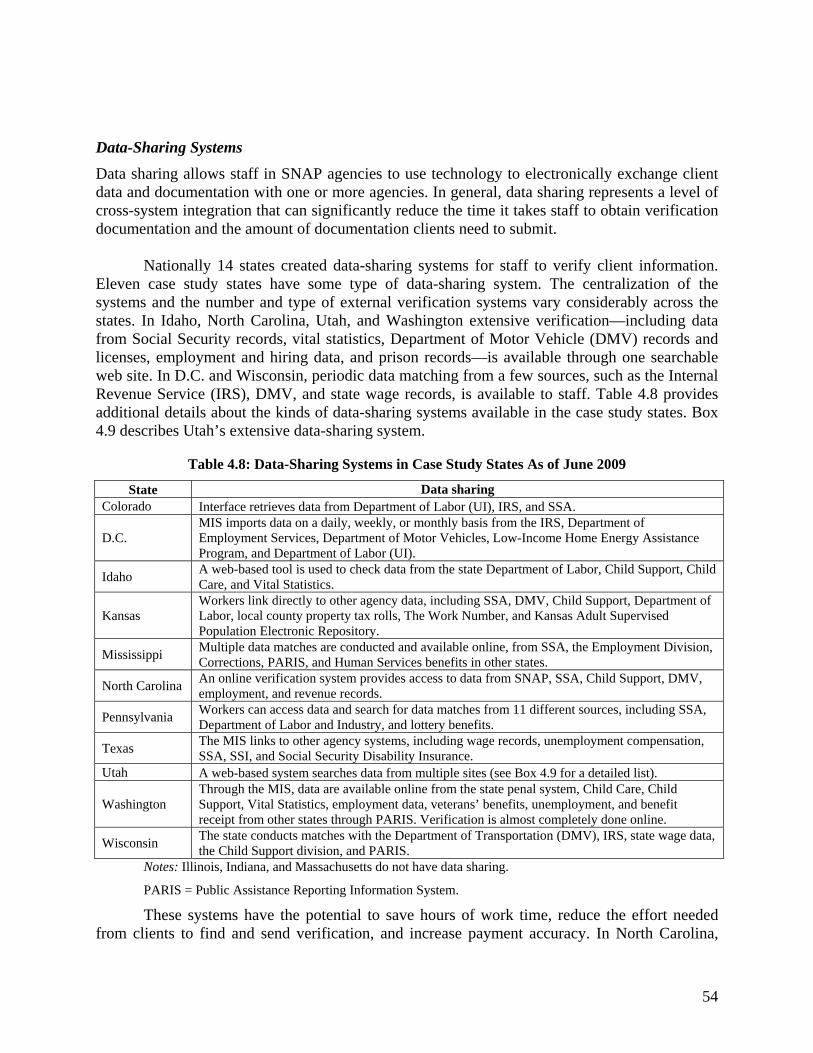

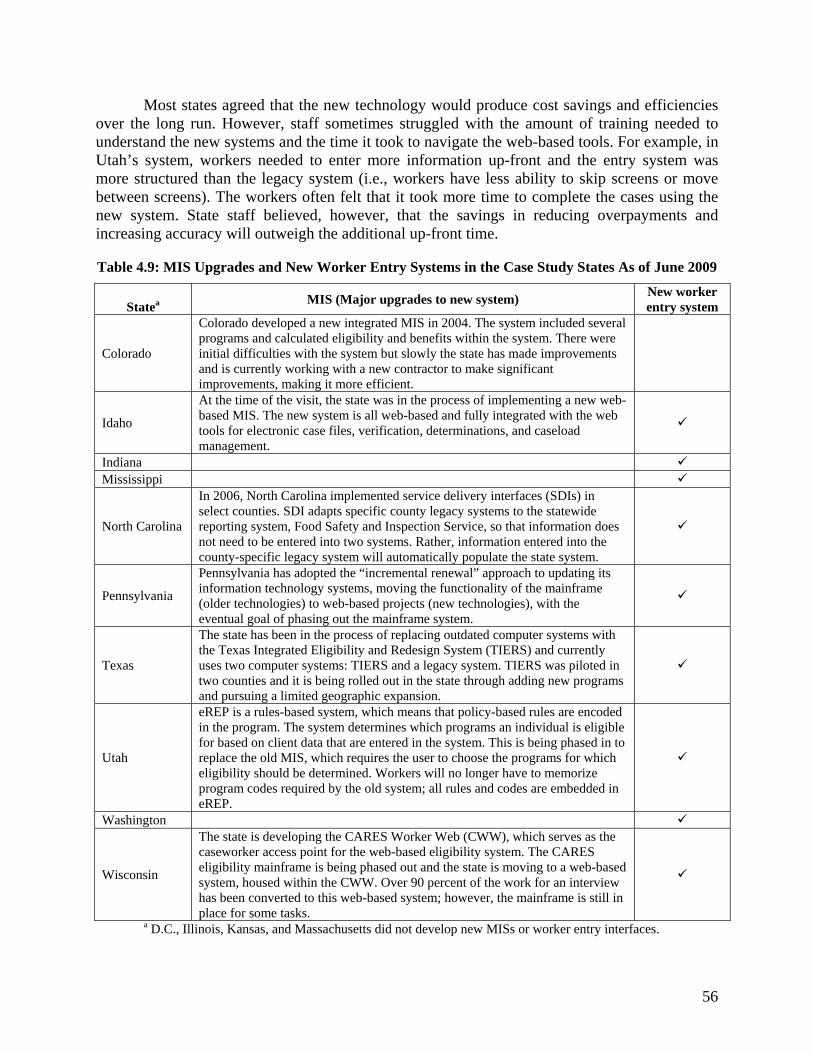


![Snap Gk Analysis -2009[1]](https://static.documents.pub/doc/80x56/577daac71a28ab223f8b5861/snap-gk-analysis-20091.jpg)


