Office of Social and Economic Data Analysis Office of Social and Economic Data Analysis Missouri Student Success Network Missouri Alternative Education Network October 13, 2010 October 13, 2010 Jefferson City, Missouri Jefferson City, Missouri
Transcript
Office of Social and Economic Data AnalysisOffice of Social and Economic Data Analysis
Missouri Student Success NetworkMissouri Alternative Education Network
October 13, 2010October 13, 2010
Jefferson City, MissouriJefferson City, Missouri
Office of Social and Economic Data AnalysisOffice of Social and Economic Data Analysis
• Data Data
• Information Information
• Knowledge Knowledge
• Wisdom Wisdom
“The construction of knowledge involves more the orderly loss of information than it’s meaningless accumulation.”
-- Kenneth Boulding
Http://WWW.OSEDA.MISSOURI.EDU
OSEDA…
Office of Social and Economic Data AnalysisOffice of Social and Economic Data Analysis
Overview
• The Social and Economic Context– Educational Needs– Workforce
• The Spring MSSN Survey Overall
• Use of the Survey for Regional Discussion• Regional Program Profiles• Critical Questions for Collaboration• Contending with Challenging Times
Office of Social and Economic Data AnalysisOffice of Social and Economic Data Analysis
The context of population change in the U.S.
Total Population 2009
World: 6.8 Billion
U.S.: 307 Million
Mo.: 5,987,580
Office of Social and Economic Data AnalysisOffice of Social and Economic Data Analysis
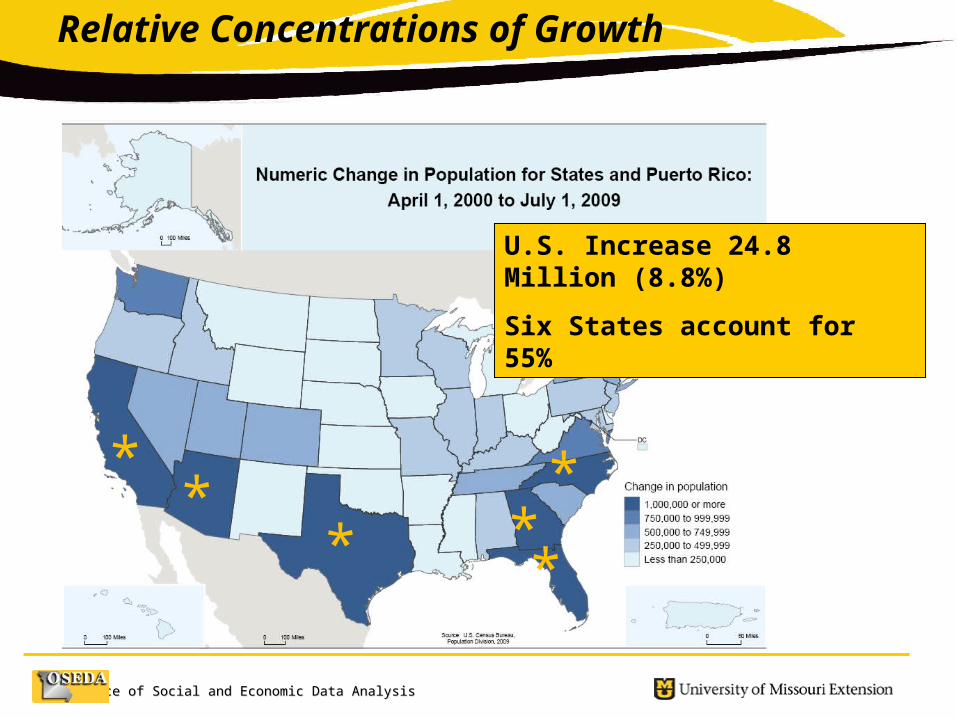
Change in Population By State2000 – 2008
Change in Population By State 2000 – 2008 Total Population 2009
World: 6.8 Billion
U.S.: 307 Million
Mo.: 5,987,580
Missouri 381,515 7%
US 24,834,593 9%
Population Change
Office of Social and Economic Data AnalysisOffice of Social and Economic Data Analysis
**
* **
*
U.S. Increase 24.8 Million (8.8%)
Six States account for 55%
Relative Concentrations of Growth
Office of Social and Economic Data AnalysisOffice of Social and Economic Data Analysis
Diverse Trends: Regions within Regions – and within urban areas
Office of Social and Economic Data AnalysisOffice of Social and Economic Data Analysis
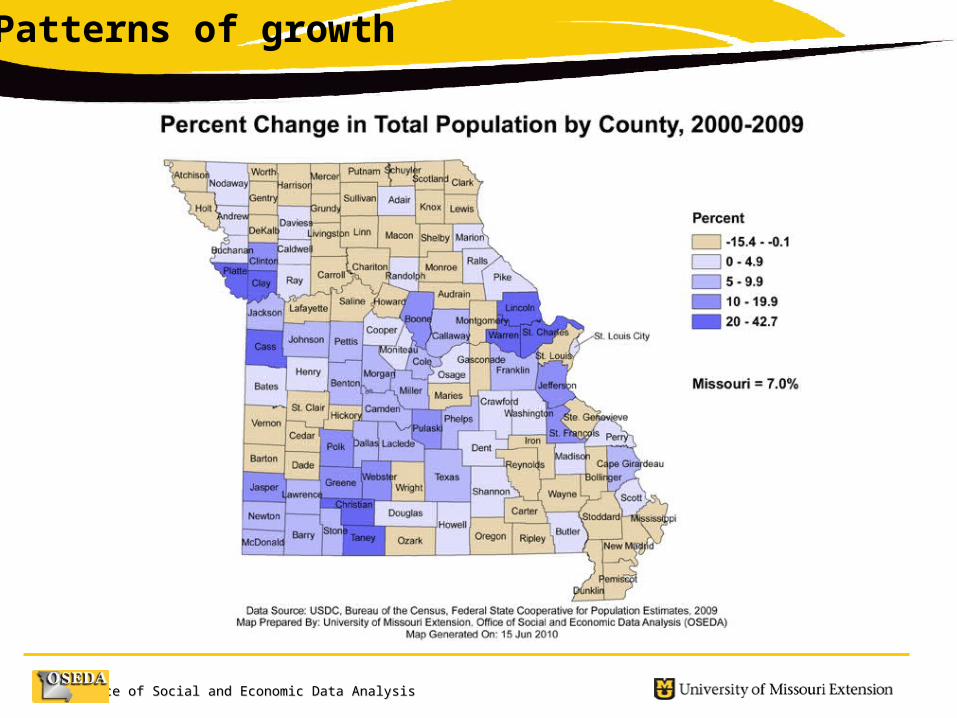
Patterns of growth
Office of Social and Economic Data AnalysisOffice of Social and Economic Data Analysis
Other data that shows urban concentration
Office of Social and Economic Data AnalysisOffice of Social and Economic Data Analysis
Increasing Diversity
Office of Social and Economic Data AnalysisOffice of Social and Economic Data Analysis
Increasing Diversity
Office of Social and Economic Data AnalysisOffice of Social and Economic Data Analysis
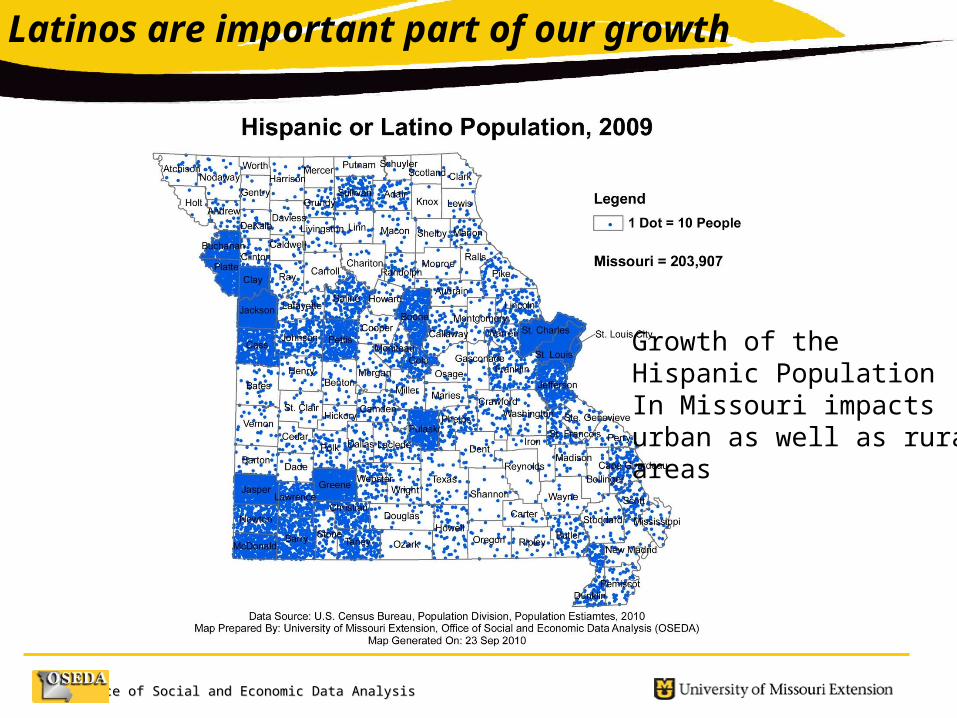
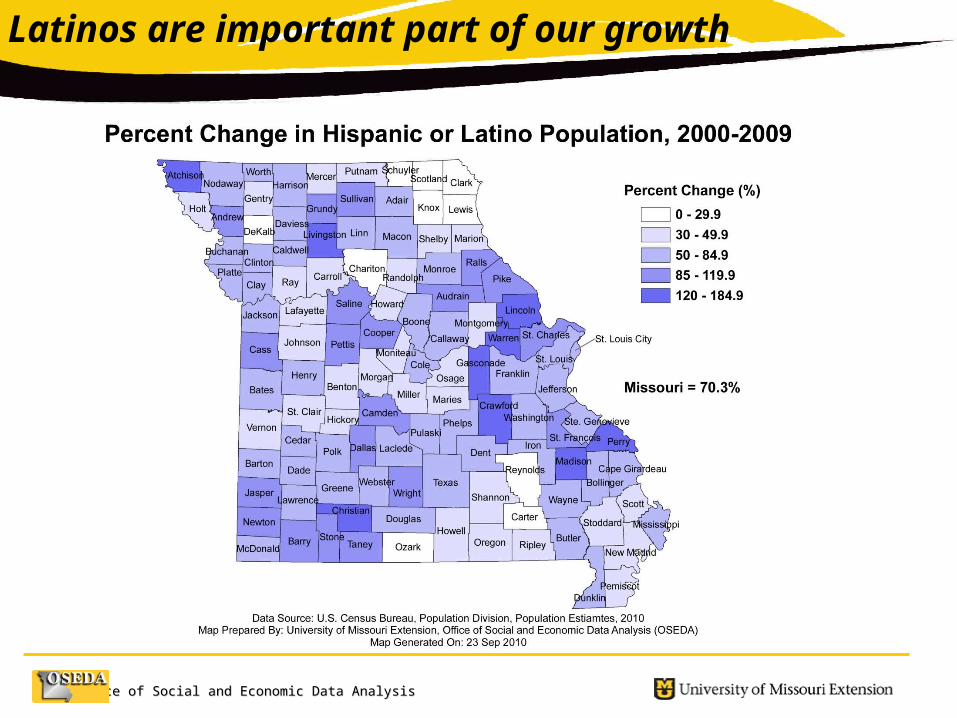
Growth of the Hispanic PopulationIn Missouri impactsurban as well as ruralareas
Latinos are important part of our growth
Office of Social and Economic Data AnalysisOffice of Social and Economic Data Analysis
Latinos are important part of our growth
Office of Social and Economic Data AnalysisOffice of Social and Economic Data Analysis
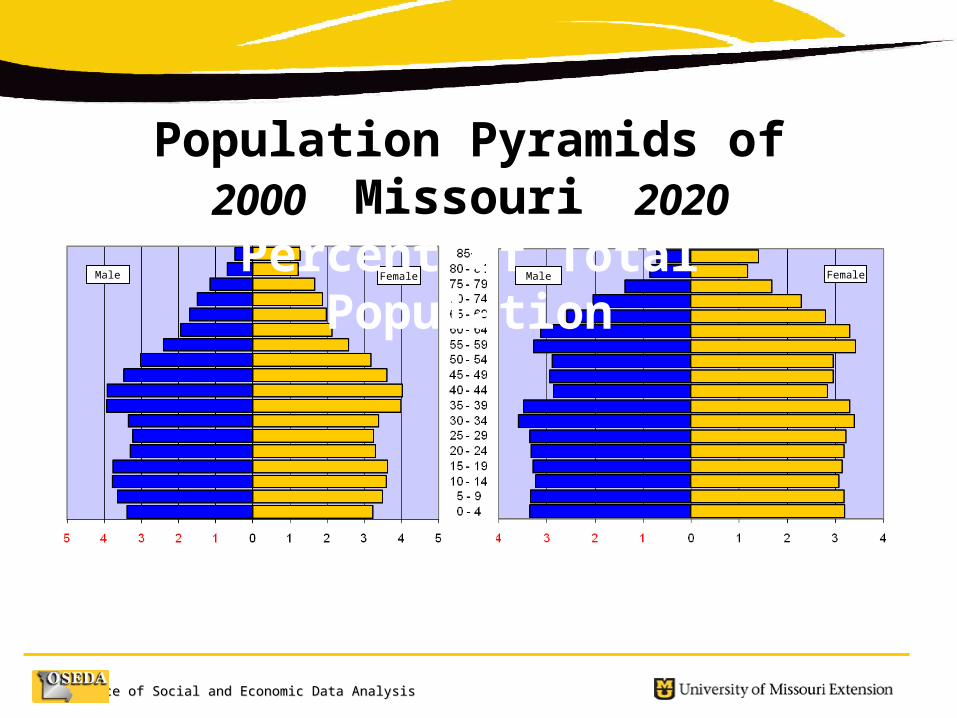
Male FemaleMale Female
Population Pyramids of MissouriPercent of Total Population2000 2020
Office of Social and Economic Data AnalysisOffice of Social and Economic Data Analysis
Office of Social and Economic Data AnalysisOffice of Social and Economic Data Analysis
Office of Social and Economic Data AnalysisOffice of Social and Economic Data Analysis
Office of Social and Economic Data AnalysisOffice of Social and Economic Data Analysis
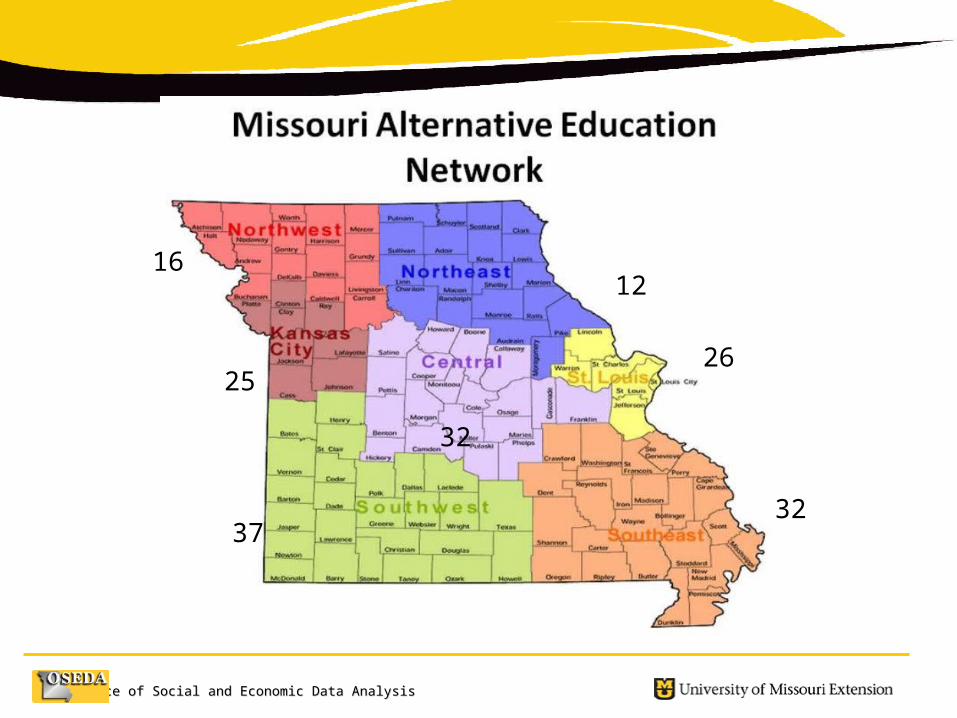
25
32
1216
3237
26
Office of Social and Economic Data AnalysisOffice of Social and Economic Data Analysis
Quality of Life --- Children
Office of Social and Economic Data AnalysisOffice of Social and Economic Data Analysis
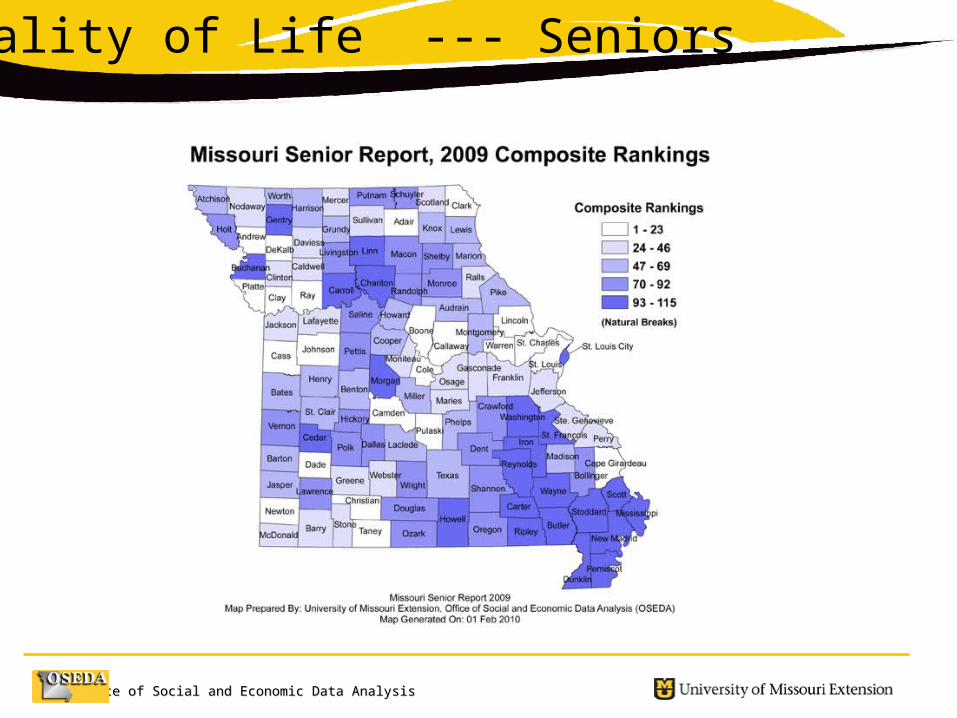
Quality of Life --- Seniors
Office of Social and Economic Data AnalysisOffice of Social and Economic Data Analysis
Workforce Issues
Office of Social and Economic Data AnalysisOffice of Social and Economic Data Analysis
Office of Social and Economic Data AnalysisOffice of Social and Economic Data Analysis
From the “Employer” Report:Returns to Associate Degrees
Educational Issues – building expectations
Office of Social and Economic Data AnalysisOffice of Social and Economic Data Analysis
27 percent increase in Dropouts from 2005 to 2009
Source: DESE Web Site, 2010
Office of Social and Economic Data AnalysisOffice of Social and Economic Data Analysis
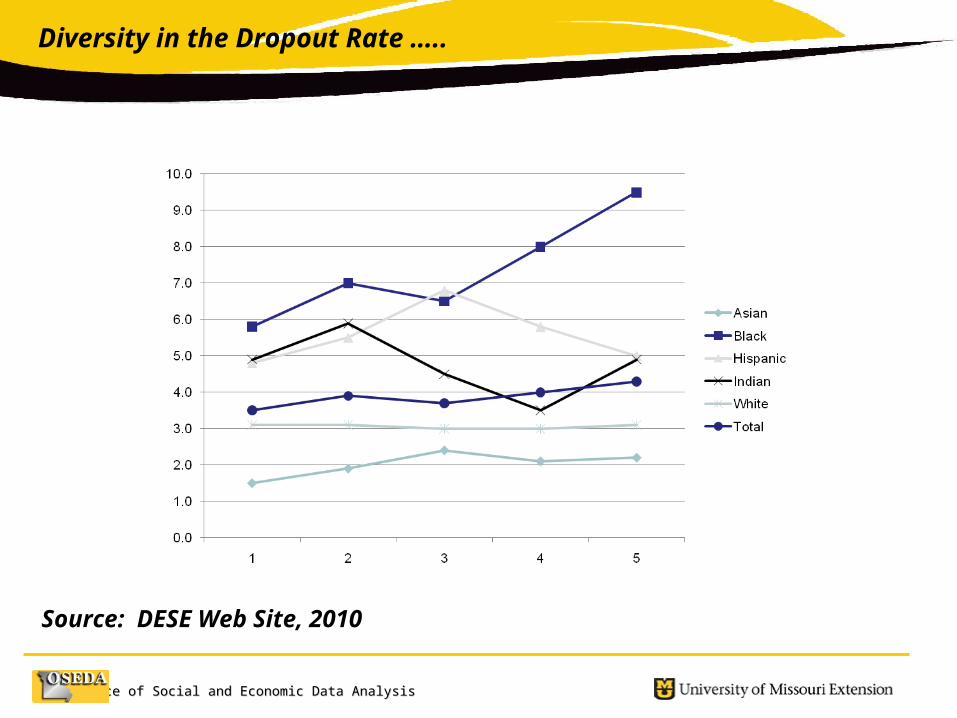
Diversity in the Dropout Rate …..
Source: DESE Web Site, 2010
Office of Social and Economic Data AnalysisOffice of Social and Economic Data Analysis
And so,……
Office of Social and Economic Data AnalysisOffice of Social and Economic Data Analysis
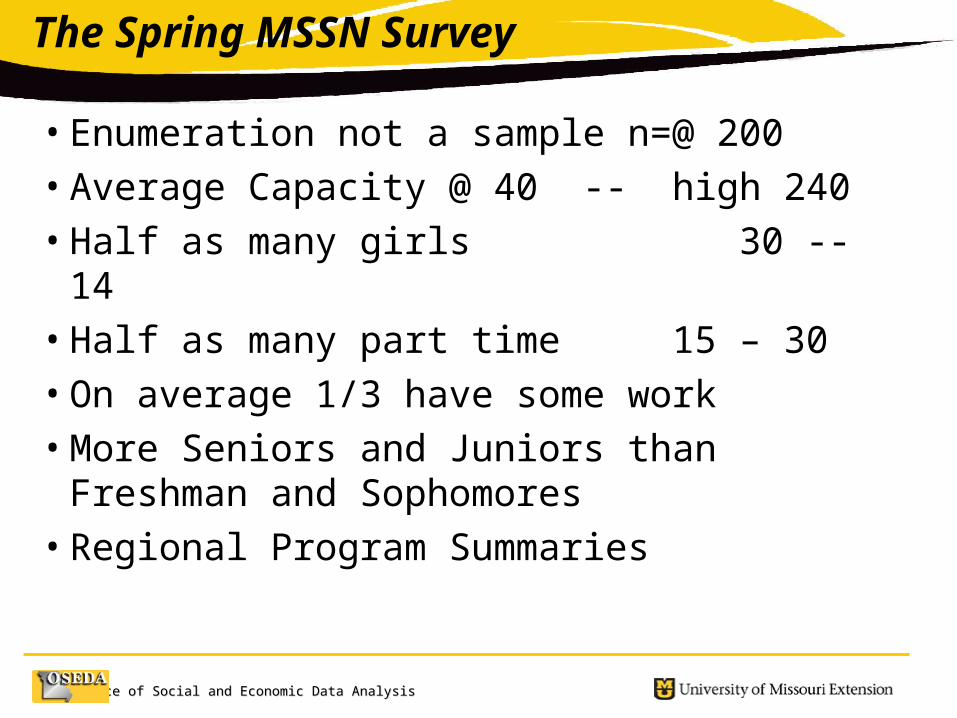
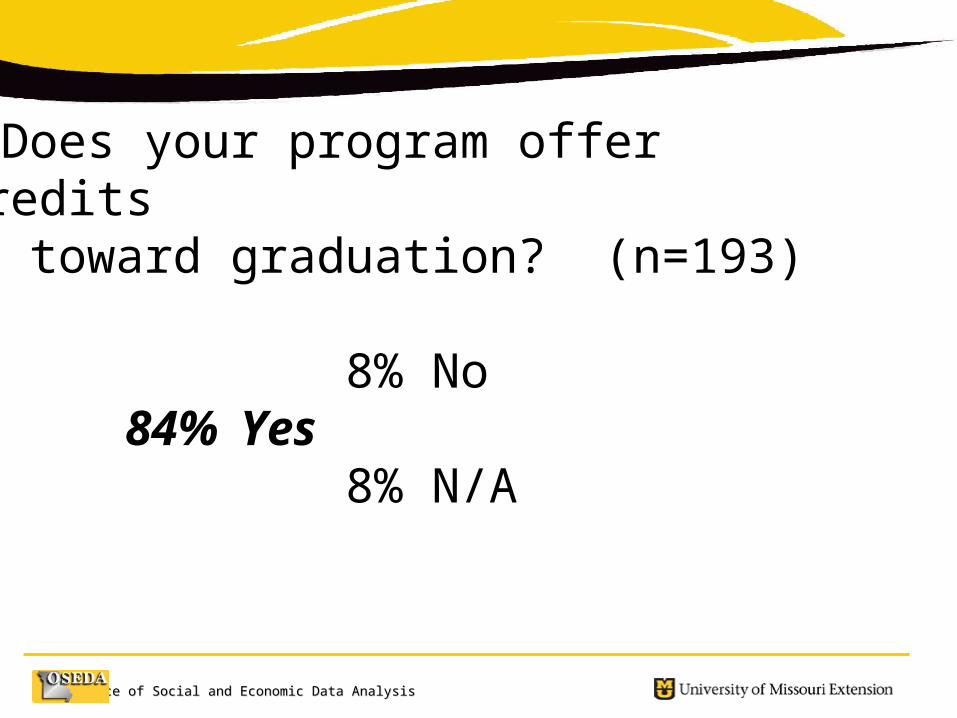
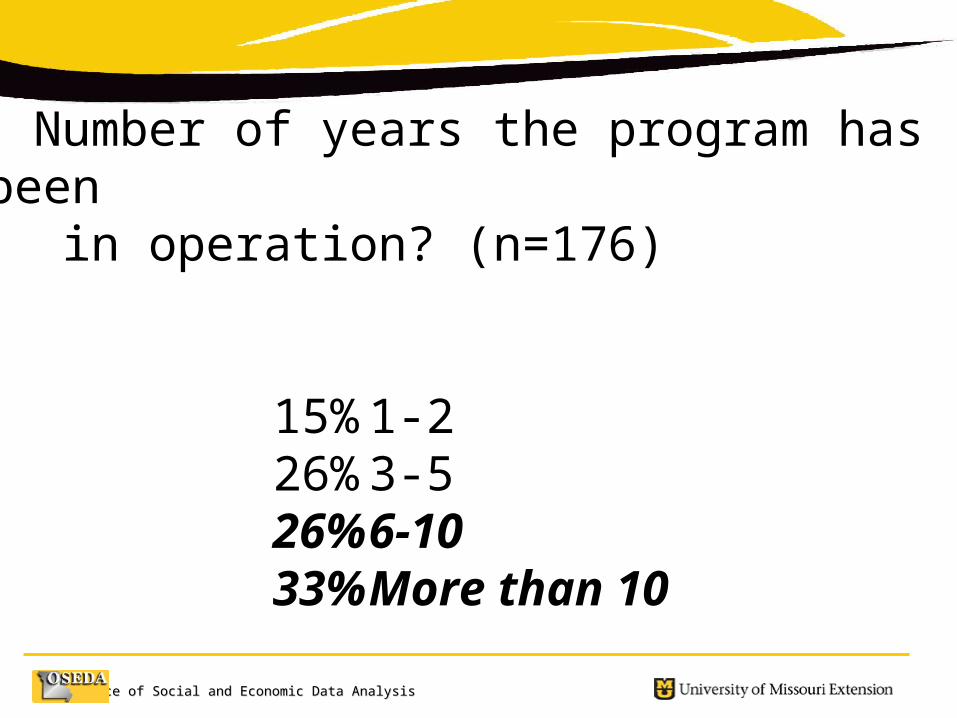
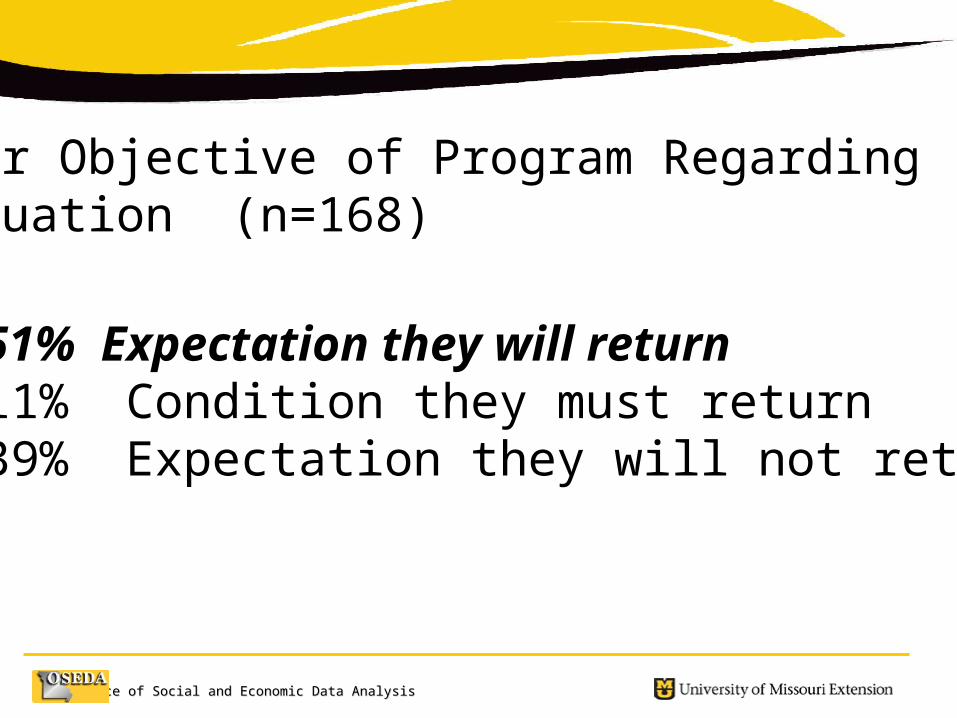
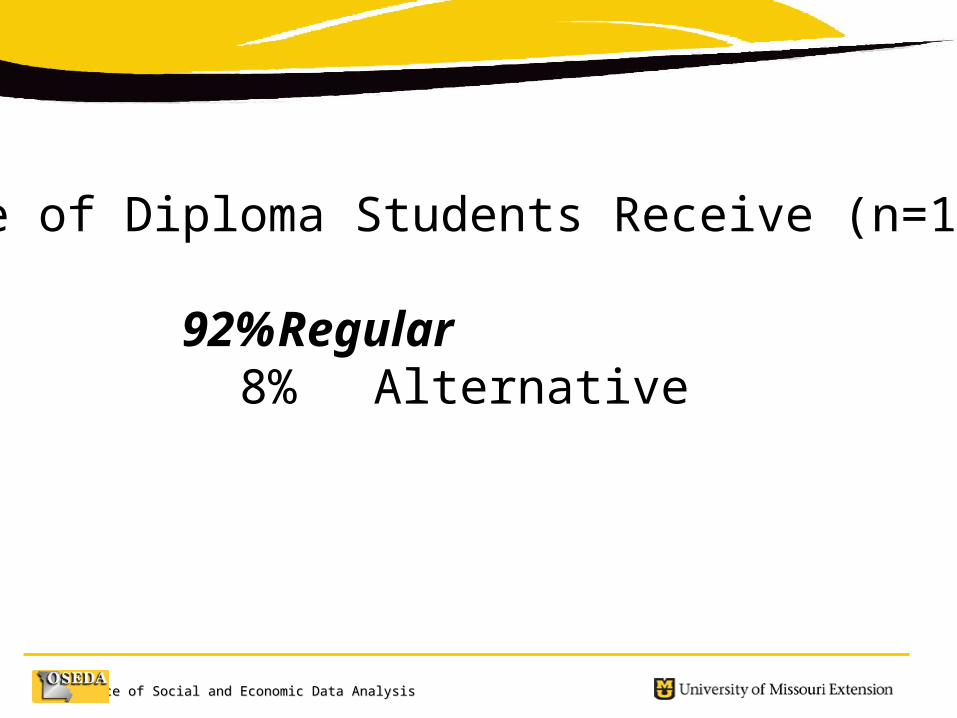
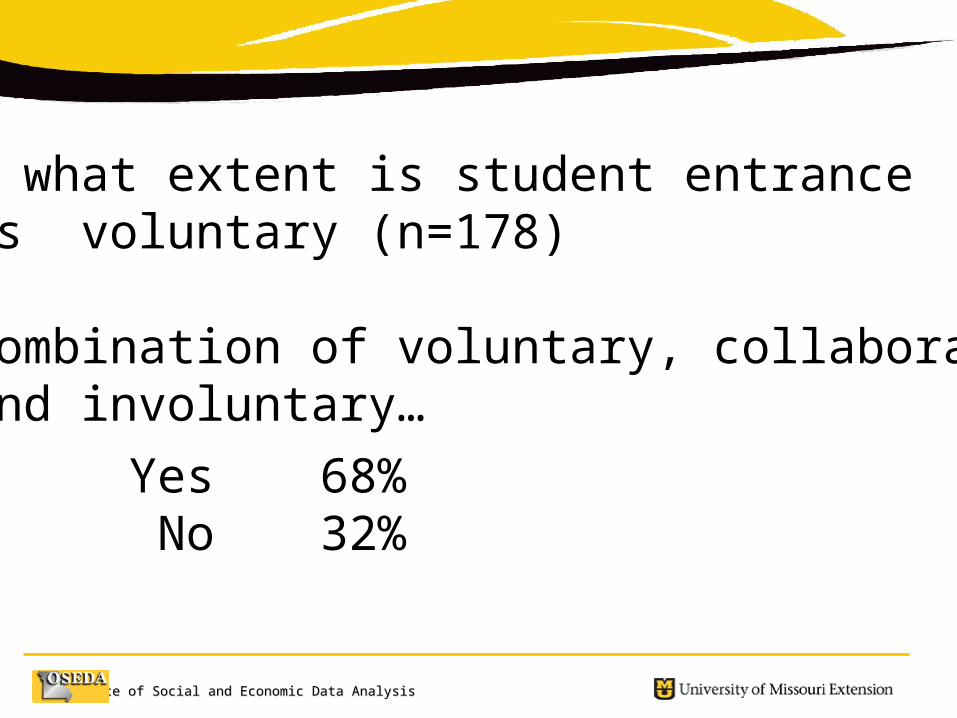
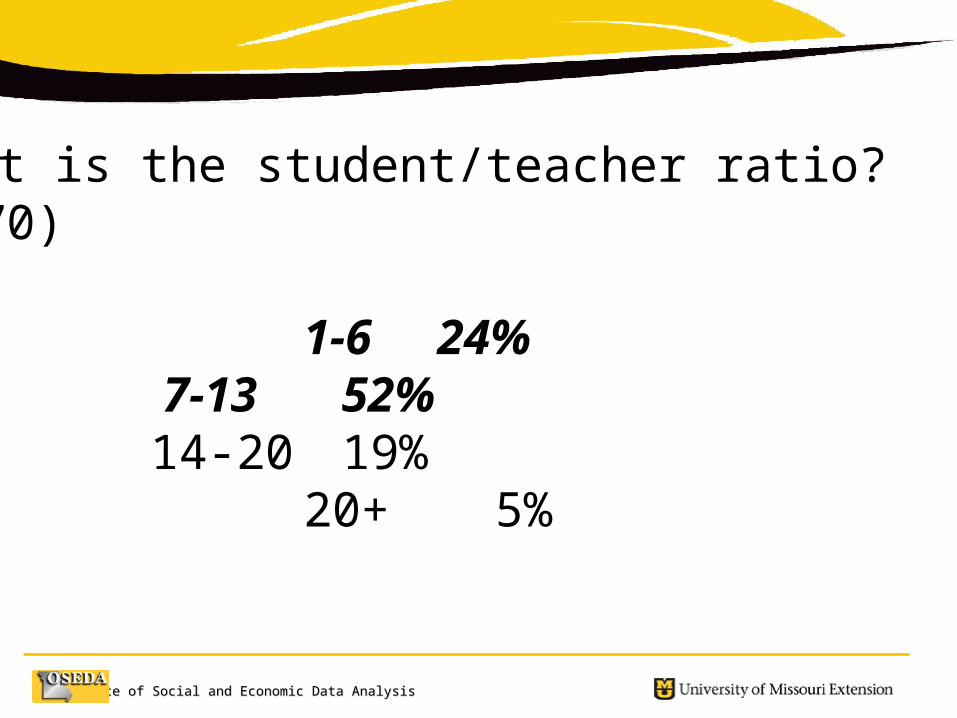
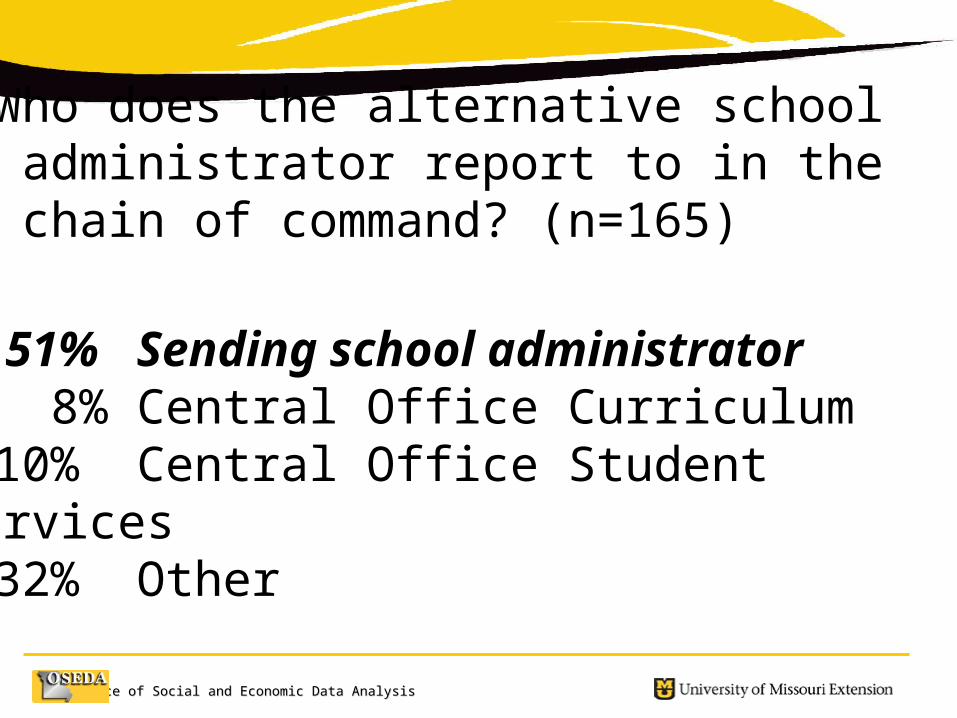
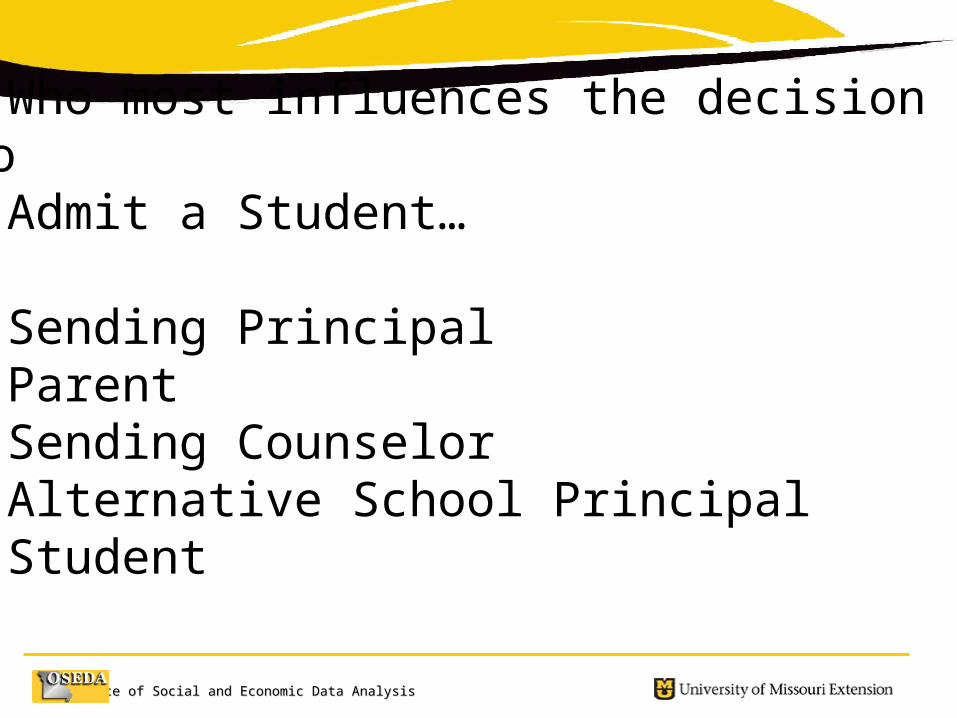
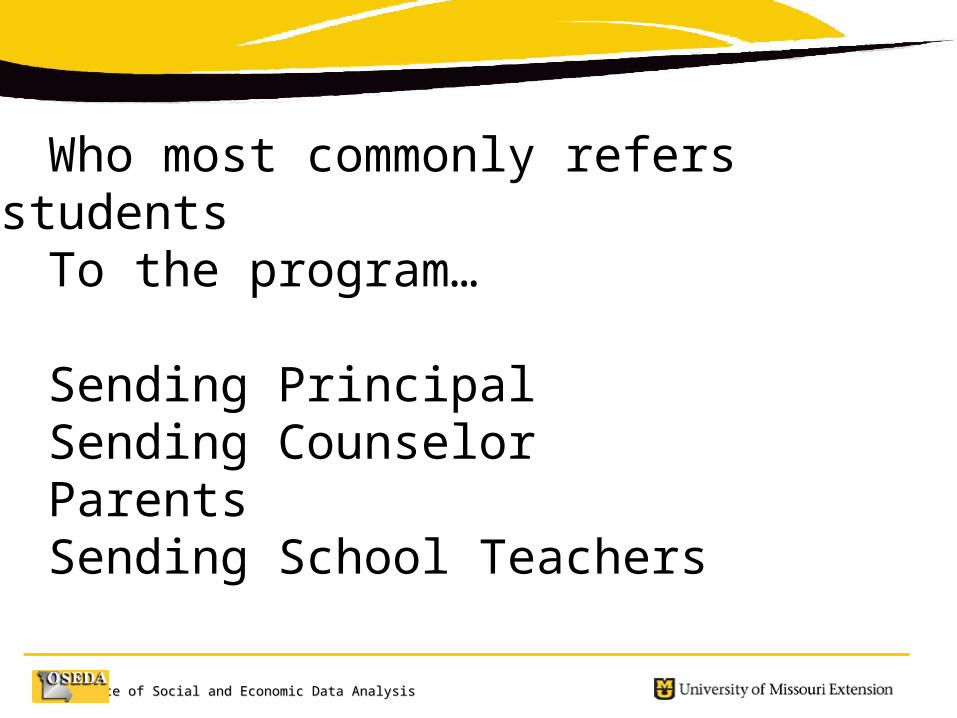
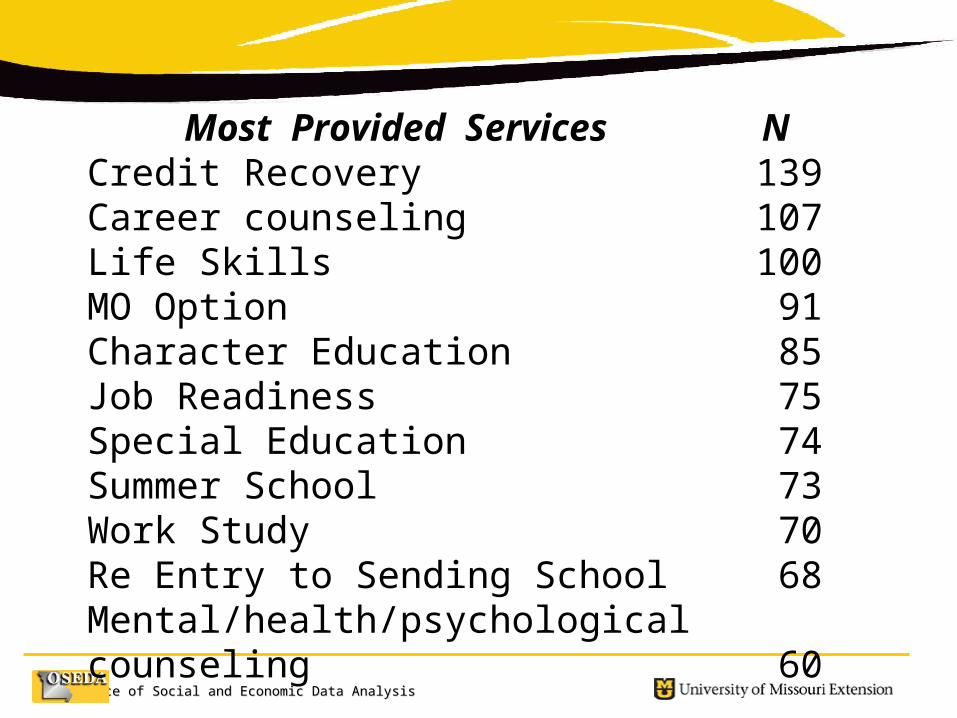
The Spring MSSN Survey
• Enumeration not a sample n=@ 200• Average Capacity @ 40 -- high 240• Half as many girls 30 -- 14• Half as many part time 15 – 30• On average 1/3 have some work• More Seniors and Juniors than
Freshman and Sophomores• Regional Program Summaries
Office of Social and Economic Data AnalysisOffice of Social and Economic Data Analysis