41
• • • • •

• •
• • •
603
Chapter 22
Transfer and Valuation of Biomedical Intellectual Property
cristina thalhammer-reyero*
A. INTRODUCTION
The subject of technology and intellectual property (IP) valuation has been covered in many books and articles. Because the process of valuing very early-stage technologies is more an art than a science, the objective here is not to enter into the mathematical or financial details, and only brief exposures of the most used methods will be presented. Instead, a mosaic of information, sources, and actual cases will be provided to illustrate the application of valuation of biomedical technology and IP, all in the context of the interplay between government, academia, and commerce that must take place to bring products to the market.
Although technologies and IP are frequently developed for internal use, an organization very frequently does not have the resources or desire to exploit their full commercial value, and there are many ways of technol-ogy transfer by which additional value and applications can be extracted. Each form of transfer provides different types of value to the receiving or-ganization, from obtaining enabling materials or technologies, to obtaining legal rights to avoid litigation and penalties for infringement, or to get the right to exclude others. Each form of transfer also carries different obliga-tions and is associated with different royalty components, and the valuation
* The author wishes to thank Steven M. Ferguson, M.B.A., Uri Reichman, Ph.D., M.B.A., and Mark Rohrbaugh, Ph.D., J.D., of the Office of Technology Transfer, U.S. National Institutes of Health, for their review and suggestions for this chapter.

604 cristina thalhammer-reyero
methods for each of them have to take the corresponding bundle of rights into consideration.
Corporations need to perform valuation of technology and IP in a variety of contexts, encompassing purposes such as for licensing, mergers and ac-quisitions, loan collateral, investment, taxation, or reporting. The objective for public and non-profit entities, such as government agencies or academic institutions, is the transfer of technology or IP for commercial exploitation, and licensing is often the only alternative available. In the last case, the li-censed technologies are mainly in an embryonic stage and need substantial further investment before they can be commercialized.
The biomedical technologies that are the focus of this chapter support an important sector of the economy and provide fertile grounds for tech-nology transfer, licensing, and other commercial activities. In 2004, the United States spent on health care US$6,280 per person, or US$1.9 trillion, which is a 16 percent share of GDP in 2004.1 The figure is projected to reach 18.7 percent by 2014, which is about US$3.6 trillion in 2014. Spending on prescription drugs is expected to account for 15.5 percent of total health expenditures by 2013, up from 10.5 percent in 2002.2 In 2003, spending on prescription drugs in the United States was US$190 billion, while spending on biomedical research was US$95 billion.3 The latter represents about 5.6 percent of all health related expenditures in the United States, with 57 per-cent of the total provided by private industry and 28 percent by the National Institutes of Health (NIH), an agency of the U.S. Department of Health and Human Services (HHS).4
NIH is the primary source of biomedical research funding in the United States and conducts internal research in addition to funding other institu-tions within the United States and also abroad. NIH and academic scientists conduct basic research on the biology of diseases and identify compounds, methods, and chemical reactions and pathways that may be of value in treating diseases. While these scientists may also conduct pre-clinical and clinical testing of drugs (Phase I and Phase II trials) under investigational
1 Gross Domestic Product (GDP) is the total value of final goods and services producedGross Domestic Product (GDP) is the total value of final goods and services produced within a country’s borders in a year.
2 Centers for Medicare �� Medicaid Services (CMS), �Brief Summaries of Medicare �� Med-Centers for Medicare �� Medicaid Services (CMS), �Brief Summaries of Medicare �� Med-icaid” (1 November 2005), online: www.cms.hhs.gov/MedicareProgramRatesStats/down-loads/MedicareMedicaidSummaries2005.pdf.
3 Hamilton Moses IIIHamilton Moses III et al., �Financial Anatomy of Biomedical Research” (2005) 294:11 Jour-nal of the American Medical Association 1333.
4 HHS has research laboratories at NIH and other agencies, including the Food and DrugHHS has research laboratories at NIH and other agencies, including the Food and Drug Administration (FDA) and Centers for Disease Control and Prevention (CDC), whose pri-mary mission is to acquire new knowledge through the conduct and support of biomedical research to improve the public health.

Transfer and Valuation of Biomedical Intellectual Property 605
new drug (IND) applications, they do not have manufacturing, processing, or packing facilities, and therefore they cannot sponsor a new drug applica-tion (NDA) process through the U.S. Food and Drug Administration (FDA) or its equivalents in other countries. As a result, most of their biomedical inventions are early-stage, and not final product, and industry is needed to conduct more extensive clinical trials (Phase III trials), manufacture, and market the drugs. Therefore, the technology needs to be transferred under a licence, whereby the early technology developer and the licensee divide the future economic benefit according to their contributions, as defined by the terms of the licence agreement. The licensee typically pays for the obtained rights in the form of milestone payments and royalties, which are usually important components of a licence.
The NIH Office of Technology Transfer (OTT) and the correspond-ing offices at other U.S. research organizations were created in response to a series of legislative acts related to technology transfer passed by the U.S. Congress from 1980 through 2000, and broadly referred to as the Bayh-Dole legislation.5 This legislation allowed institutions to take title to inventions and IP developed with U.S. federal funds, such as grants and contracts, in exchange for an obligation by those institutions to seek and protect the commercialization of those technologies by the private sector. Furthermore, the U.S. federal laboratories, including those of HHS, were given a statutory mandate to ensure that new technologies developed in these laboratories are transferred to the private sector and commercialized in an expeditious and efficient manner. Interestingly, although this legisla-tion was passed initially to address the increasing loss of competitiveness
5 In 1980, the U.S. Congress passed two landmark pieces of legislation: theIn 1980, the U.S. Congress passed two landmark pieces of legislation: the Stevenson-Wydler
Technology Innovation Act of 1980 (Pub. L. No. 96-480, 94 Stat 2311, with subsequent amendments, 15 U.S.C. § 3701, including the Federal Technology Transfer Act), under which inventions owned by the government remain under the management and control of the agencies that produce them, and providing for the distribution of royalties to include the inventors with the remainder retained by the agency; and the Bayh-Dole Act (Pub. L. No. 96-517, § 6(a), 94 Stat. 3019, with subsequent amendments, 35 U.S.C. § 200–212), which gives small businesses, universities, and other non-profit organizations the right to retain title to and profit from the inventions arising from their federally funded research, under a research and development contract or grant, provided they adhere to certain requirements. The intent was to promote economic development, enhancing U.S. competitiveness, and benefiting the public by encouraging the commercialization of technologies developed with federal funding. The Act also contains several provisions to protect the public’s interest in commercializing federally funded inventions, such as a requirement that a contractor or grantee that retains title to a federally funded invention file for patent protection whenever possible (except for research tools, see online: http://ott.od.nih.gov/policy/rt_guide_final.html) and makes efforts to commercialize it. In return, the government retains the right to use the IP for government purposes without paying royalties.
606 cristina thalhammer-reyero
of the United States against Japan in some technological areas, it turns out that Japan has very recently passed similar legislation modeled on that of the United States, and India is following the path as well.
The largest segment of technology available for licensing in the United States by universities and government is in the biomedical area. OTT has broad statutory authority to negotiate agreements for licensing the inven-tions made at the NIH and FDA to the private sector for further develop-ment.6 OTT oversees patent prosecution, negotiates, and monitors licensing agreements, and provides oversight and central policy review of Coopera-tive Research and Development Agreements (CRADAs),7 as well as other policy issues.8 OTT seeks to patent biomedical technologies when a patent will facilitate and attract investment by commercial partners for further re-search and commercial development of the technology, or when necessary to encourage a commercial partner to keep important materials or products available for research use. However, when patenting is unnecessary and could inhibit broad dissemination and application of the technology, as is the case with some research tools and methods of performing surgical pro-cedures, patent protection will not be sought.
B. GENERALMETHODSOFVALUATION
Valuation of technology or IP is the process of attaching to it a dollar amount. The principles and approaches used in valuing IP related to bio-medical technologies are the same as those used to valuing IP in other areas. The first questions to be asked are, What is the IP to be valued? What is the purpose of the valuation? For whom is the valuation? What is the most appropriate valuation method?
There are well-accepted methods of valuation described in a variety of books9 and other resources available online, including a web site on IP
6 Online: http://ott.od.nih.gov/policy/phslic_policy.html.Online: http://ott.od.nih.gov/policy/phslic_policy.html.7 Authorized under theAuthorized under the Federal Technology Transfer Act of 1986 (Pub. L. No. 99-502, 100
Stat. 1785), a CRADA is an agreement between one or more federal laboratories and one or more non-federal parties under which the federal laboratories provide personnel, services, facilities, equipment, or other resources with or without reimbursement (but not funds to non-federal parties) and the non-federal parties provide funds, personnel, services, facili-ties, equipment, or other resources toward the conduct of specified research or development efforts that are consistent with the missions of the laboratory, online: http://ott.od.nih.gov/cradas/model_agree.html.
8 OTT also is responsible for the central development of technology transfer policies for HHS,OTT also is responsible for the central development of technology transfer policies for HHS, particularly its research agencies: NIH, FDA, the Centers for Disease Control and Preven-tion, and the Agency for Healthcare Research and Quality.
9 Russell L. Parr �� Patrick H. Sullivan,Russell L. Parr �� Patrick H. Sullivan, Technology Licensing: Corporate Strategies for Maximiz-
ing Value (New York: Wiley, 1996); Robert F. Reilly �� Robert P. Schweihs, Valuing Intangible

Transfer and Valuation of Biomedical Intellectual Property 607
valuation by the World Intellectual Property Organization (WIPO),10 which also organizes related workshops.11 For example, Gordon Smith presents a detailed analysis of the pros and cons of the three generally accepted asset valuation methods,12 and Russell Parr suggests how to optimize the pricing of IP by combining advanced investment theory with general rules-of-thumb.13 It is not the intention here to cover any of the methods in detail, but rather to provide a brief summary of several methods and then to give some examples of real-life situations.
The cost approach quantifies the cost of reproduction of the property or its replacement cost, after depreciation. The licensor may structure the royalty so as to recover and achieve a return on the cost of developing the technology. It is rarely useful in the valuation of early-stage technology, as there are many discoveries that happen by chance at relatively low cost but are of great eco-nomic value, as well as very costly projects that fail. Development cost is irrel-evant to the economic benefit that the technology might be able to produce.
The market approach measures the value the technology or IP in the marketplace. It may not be useful in some cases because of the lack of good comparables. In a licence transaction, it is common for the parties to look at other transactions or industry standards for guidance when information on licensing royalties is available. However, it is important to recognize that technologies and licences are very unique and specific, and they may not be that comparable.
The income approach measures the present value of the future stream of economic benefits that are derived from the ownership of rights to the technology or IP. Those benefits may include the net income to be received over the life of the property. The calculation of this income includes adjust-ments for an assumption of the risk associated with realizing the predicted income and an estimation of the cost of capital, which is dependent on other factors, such as inflation, liquidity, and real interest rates. This method is
Assets (New York: McGraw-Hill, 1998); Richard Razgaitis, Early-Stage Technologies: Valua-
tion and Pricing (New York: Wiley, 1999); F. Peter Boer, The Valuation of Technology (New York: Wiley, 1999); Gordon V. Smith �� Russell L. Parr, Valuation of Intellectual Property and
Intangible Assets, 3d ed. (New York: Wiley, 2000); James L. Horvath �� Steven A. Hacker, �Valuing Computer Software, Brands, and other Intellectual Property: Concepts, Complexi-ties, and Controversies,” in D.W. Chodikoff �� J.L. Horvath, eds., Advocacy & Taxation in
Canada (Toronto: Irwin Law, 2004); and Gordon V. Smith �� Russell L. Parr, Intellectual
Property: Valuation, Exploitation, and Infringement Damages (Hoboken, NJ: Wiley, 2005).10 Online: www.wipo.int/sme/en/documents/valuationdocs/index.htm.Online: www.wipo.int/sme/en/documents/valuationdocs/index.htm. 11 International Workshop on Management and Commercialization of Inventions and Tech-International Workshop on Management and Commercialization of Inventions and Tech-
nology organized by the World Intellectual Property Organization (WIPO), Monterrey, Mexico, 17–19 April 2002.
12 Online: www.wipo.int/innovation/en/meetings/2002/inv_mty/pdf/mty02_4.pdf.Online: www.wipo.int/innovation/en/meetings/2002/inv_mty/pdf/mty02_4.pdf.13 Online: www.wipo.int/sme/en/documents/valuationdocs/vpi_lim_98_2.pdf.Online: www.wipo.int/sme/en/documents/valuationdocs/vpi_lim_98_2.pdf.

608 cristina thalhammer-reyero
difficult to use for early-stage technologies because of the difficulty in fore-casting the amount of income and other input data. Furthermore, the tech-nology or IP often has economic benefits that cannot be measured directly as income — such as increased quality, productivity, or safety — that could be estimated in monetary terms.
Because the technologies in the public sector are developed with tax dol-lars, the question in this case is how the public gets the best return on the taxpayers’ investment.14 It is a process of attaching not only a dollar amount, but also an intangible value to the intangible assets. The best return for the taxpayers is not necessarily measured only in direct financial terms, but also in terms of the benefits in health and well-being that are difficult to measure because, in addition to preventing suffering, they have an import-ant economic value by improving productivity and reducing major costs to corporations and governments. Therefore, from NIH’s point of view, direct financial return is just one component in the valuation process, and not necessarily the most important one.
C. LICENSING,ROYALTIES,ANDTHEFACTORSTHATINFLUENCETHEVALUEOFIP
Licensing agreements are contracts by which the licensor — the owner or rights-holder of the technology or IP — agrees not to assert its IP rights against one or more licensees who wish to exploit the technology or IP, and sometimes transfers the right of the licensee to exclude others from practi-cing the IP. A licensing agreement creates contractual rights, duties, and obli-gations between the licensor and the licensee that regulate their relationship in a legally enforceable way. The licensee usually compensates the licensor fi-nancially for the use of the rights granted by the licence, and the licensor does not need to develop the IP further, participate in its marketing, or remain otherwise active. From NIH’s perspective, and most frequently that of other research organizations, valuation of technology or IP is only for the purpose of out-licensing it for exploitation by commercial entities so that useful prod-ucts reach the public. Government and academic research together amounts to about one third of investment in the United States, and, therefore, licens-ing represents a large proportion of the transactions. Many factors other than dollars, such as decisions on the type of licence, become an important part of the valuation process (e.g., for technologies involving research tools where the most important criterion, according to NIH policy, is broad dissemination).
14 NIH,NIH, A Plan to Ensure Taxpayers’ Interests are Protected, online: www.ott.nih.gov/policy/pol-icy_protect_text.html.

Transfer and Valuation of Biomedical Intellectual Property 609
In the pharmaceutical sector, most IP is patented and many licences are granted on an exclusive basis, which is needed to protect the licensee because of the large investment required in the development, clinical, and regulatory phases of taking a product to market. In an exclusive licence, the owner of the IP cannot license to anyone else, nor exploit the IP himself, for commercial purposes. However, the licensor can maximize the benefits from the commercialization of the IP by separately licensing different fields of use or different geographic regions to different licensees, or by retaining the right to exploit itself the IP in some applications. Each of these licences is an exclusive licence within its field of use or region limitations. In con-trast, a non-exclusive licence is one where the owner of the IP is able to license to several licensees, even for the same field of use or region, as well as to retain the right to exploit the IP itself. Some biotechnologies may lend themselves to the grant of numerous non-exclusive licences for biological materials such as antibodies, cell receptors, promoters, viral vectors, vac-cine delivery systems, cell lines, and animal models.
Typically, the term of a licence begins on the date the licence is executed. When patents are involved, a license typically ends upon the expiration of the last patent to expire, including term extensions of patents for pharma-ceutical products granted to compensate for the lengthy clinical trials and regulatory process. All the possible variations of rights granted affect the valuation of the IP for that particular license, and they are associated with different royalty components that can be adjusted within the �bundle of rights” that each of the parties get under the licence, the most common of which are summarized in Table 1, below. Common to most exclusive licences are performance obligations that the licensee must perform or achieve to ensure that the IP is developed at an expeditious pace, with the failure to do so possibly resulting in the termination of the licence. For example, a licence may require that the licensee take a compound through the different clinical trial phases in specified and mutually agreed upon timeframes, and that licensor receives minimum annual royalties as well as milestone payments at the time such obligations are achieved. This is relevant particularly for pharmaceutical products that require a long de-velopment time before royalties on sales are generated.
Establishing the royalty rates for licensing agreements is a more com-mon exercise than the calculation of an outright sales price. There are a number of analyses that can be used to estimate an appropriate royalty, including the three most accepted valuation methods summarized above. The context has to be determined before deciding which valuation method is most appropriate, as technology or IP can change in value substantially depending upon the context in which it is being valued. Is the valuation

610 cristina thalhammer-reyero
in the context of litigation, arbitration, or settlement, or is it just an arm’s-length licence based on a fair market value, with neither party compelled to buy or negotiate, and in a non-tax environment?
Table 1: Typical Licence Bundle of Rights Exchanged for Exclusive Licence
Licensor gets Licensee getsLicence execution feeMinimum annual royalty Regulatory milestone paymentsProduct milestone paymentsRoyalty income on salesExecution fees on sublicensingRoyalty income on sublicensing
•••••••
Right to enforce and exclude othersOngoing right to enforce and exclude othersExclusive development rightsExclusive manufacturing rightsExclusive sales profit rightsRight to sublicenseExpanded sales profits
•••••••
In general, the licensing transaction is controlled by the economics of the licensee’s business, but it is a profit-split approach. For a new prod-uct or service, the successful exploitation of the IP will produce a future income stream, and a running royalty is quantified based on net sales of the new product or service. If the IP will produce an enhanced product or service, then the royalty is a percentage of the enhanced revenue. The calculation of the present value of the benefit to which the licensor is en-titled has to consider the parties’ relative risks, the costs of exploitation, and who will bear them. Factors on the licensee-side that would justify higher royalty rates include the contribution of the IP to (a) lowering the costs of bringing the product to market by reducing the time to market or lowering the R��D expenditures; (b) generating higher profit margins by reducing costs of production/capital investment or by increasing product quality; and (c) creating economies of scale associated with market size, afforded by higher market penetration potential resulting from the ability to exclude the competition.
There are many factors that influence the negotiation of royalty rates, such as exclusivity, remaining life of the patents, collaboration between both parties, and other monetary and non-monetary forms of compensa-tion. The competition affects the economic benefits of IP when alternate products or services are introduced or superior technology is developed, and, consequently, the scope of patent protection of technologies is very important. Emerging technologies are less relevant for products that would take years to enter the market, such as therapeutics and vaccines. For non-patented technologies, the most important factors are the cost of reproduc-tion and the emerging competing technologies. The timing and the pattern of receiving the economic benefit are also important components to deter-mine the risk assumed as the business environment changes over time.

Transfer and Valuation of Biomedical Intellectual Property 611
The business environment is relevant to the financial terms in differ-ent ways. For example, for early-stage technologies that would be licensed to start-up companies, and especially when the particular sector is not attracting venture capital at a point in time, the financial terms have to be structured to favor deferred payments in the form of future royalties with minimal up-front fees. On the other hand, if the technology is developed to the point of attracting investment from pharmaceutical companies, they would be more inclined to increase the upfront fees in exchange for lower future royalties as percentage of sales. For technologies with applications in developing or less developed countries, it would be appropriate to reduce the royalties on sales in those countries for both social and economic reasons. At any rate, it is un-likely that there would be any strong patent protection in those countries.
Another consideration in negotiating royalty rates is the effect of stacking royalties and the corresponding adjustments usually demanded by licensees, as several patents owned by different parties may be required to develop a sin-gle product or process. A good example are therapeutic products based on the chemokine receptor 5 (CCR5), whose sequence was originally uncovered as part of a random, large scale project and patented by a company.15 In addition to those initial patents, there are a number of subsequent filed and issued patents that are related to CCR5 and filed by different parties, including those that cover different methods of preventing or treating infection by HIV by compositions that bind to CCR5.16 If a company wanted to license rights to develop any of the preventive, therapeutic, or diagnostic applications that would be derived from the later inventions, the company would also be required to license the earlier dominant CCR5 issued patents, with the need now to pay royal-ties to at least two companies. Frequently, a licence agreement will allow for limited discounts, down to a minimum royalty rate, if it is later determined that royalties have to be paid by the licensee to one or more third parties in order to be able to exercise the licence.
15 The sequence for a cell surface chemokine receptor, later identified as CCR5, was originallyThe sequence for a cell surface chemokine receptor, later identified as CCR5, was originally uncovered by Human Genome Sciences and is one of a very large number of sequences included in a patent application filed in 1995, which resulted in U.S. patents 6,025,154 (claiming the isolated nucleic acid molecule that turned out to encode CCR5), 6,511,826, and 6,800,729 (issued more recently and claiming the isolated CCR5 polypeptides). Not long after that, other investigators at NIH and elsewhere were able to determine the role this protein, now termed CCR5, plays as a docking protein on the surface of target cells that the HIV virus requires for entry to infect cells.
16 There are twenty-seven issued patents and fifty-three patent applications that mention CCR5There are twenty-seven issued patents and fifty-three patent applications that mention CCR5 and HIV in their abstracts, including antibodies that recognize different parts of the CCR5 receptor or CCR5 agonists or antagonists (6,900,211 and 6,908,734); methods for screening for compounds which bind the CCR5 receptor (6,743,594 and 6,800,447); and a method of genotyping the CCR5 receptor, which would determine whether an individual is susceptible or resistant to infection by HIV.

612 cristina thalhammer-reyero
Once all the factors involved in a licence at hand are determined, the mar-ket approach would be a good way to determine reasonable royalty rates when other licence agreements for similar or equivalent technologies in the same industry are available. However, the financial terms of publicized licences are most frequently absent or incomplete. If they are available, it is usually dif-ficult to compare the financial terms of different licences, even if they are for related technologies. There are many factors that should be considered:
1. The nature of the transaction being one that is arm’s-length between unrelated parties, as internal licences between different units of a com-pany may not reflect their real economic value when other interests, such as lowering taxes, are present.
2. The time of the transaction, as what is important is the expectation of future value, and historic rates after a long time has passed may not be relevant.
3. The financial condition of the licensor and business needs of the licen-see. For example, if the licensee needs a licence to continue operations, the true value of the IP might not have been obtained because fair and reasonable value can be only obtained when the parties are free to not enter into the deal.
4. The fact that, frequently, a group of related patents from the same owner of rights, or a combination of patents and other forms of IP, such as know-how, are required to develop a technology and are packaged into a single licence, and, therefore, it is difficult to isolate the value assigned to any single technology or patent.
According to Recombinant Capital,17 in 2004, biotech therapeutic out-li-censing and alliance deals, which represent about 630 deals and one quarter of the total deals they track, totaled more that US$10 billion in announced deal value and more that US$30 billion in total estimated deal value. By comparison, the total equity raised by biotech, excluding corporate allian-ces, was US$20.8 billion. The out-licensing deals were distributed as shown in Table 2.
Table 2: Terms of Biotech Out-Licensing to Biotech/Pharma for 2004 (US$ Million)
Median Average DealsUpfront $6 $13 86R&D $15 $38 17Milestones $43 $96 74Equity $10 $17 33
17 Michael G. McCully of Recombinant Capital, �Current Trends in Deals and Financing”Michael G. McCully of Recombinant Capital, �Current Trends in Deals and Financing” (Paper presented to GTCbio’s Metabolic Diseases World Summit: Partnering and Deal-Mak-ing Summit, 1 July 2005).

Transfer and Valuation of Biomedical Intellectual Property 613
The average size of the deals was US$73 million for early-stage, US$108 million for mid-stage, and US$82 million for late-stage. The larger share of the payments is in the form of milestones. For example, a group of recent mid-stage deals included four pre-clinical stage deals, with US$5–20 million in up-front payments and US$105–550 million in milestones, and five Phase I deals, with US$5–80 million in upfront payments and US$84–420 million in mile-stones. However, the royalties on sales are usually not reported, and these are often the larger payments. The median terms of biotech out-licensing for the period 1995–2004, in terms of the stage of development of the technology, are shown in Table 3.
Table 3: Median Terms of Biotech Out-Licensing to Biotech or Pharma for
1995–2004 in US$ Million
Lead Pre I II IIIUpfront $2 $3 $5 $4 $10R&D $8 $9 $16 $6 $20Milestones $13 $22 $31 $26 $45Equity $5 $5 $5 $6 $12
Despite all the previous analysis, and the methodologies and factors de-scribed above, very often the basis for establishing royalties are simple rules-of-thumb. The 25 percent rule method calculates a royalty of about 25 to 33 percent of the profit before tax. However, because of the accounting involved in the calculation of gross profit, a corresponding royalty based on a percentage of net sales is a more common practice. For historical reasons, the 5 percent of revenues method seems to be the more popular in many different industries, including embryonic technologies. Even as all the factors should be analyzed, such as profits, capital investments, earnings growth, operating expenses, de-velopments costs, and investment risks, the results will be just as good as the assumptions, and when dealing with early-stage technologies, they are just educated guesses. Therefore, those other factors are frequently used merely to adjust downwards or upwards the 5 percent royalty rate, which would typically end up being somewhere between 1 and 10 percent.
D. STRATEGICALLIANCESANDJOINTVENTURES
Strategic alliances and joint ventures allow the owner or rights holder of the IP to partner strategically with another entity for the development and exploitation of the IP. There are two main types: a) in a co-development agreement, the IP is typically licensed by the licensor to the alliance partner in order for the two partners to jointly undertake the further development of the IP, and the licensor, by continuing to add value to the development

614 cristina thalhammer-reyero
of the IP, is therefore entitled to greater financial remuneration than in a passive licence; and b) in a co-marketing agreement, the IP is licensed by the licensor to the alliance partner and they jointly market the pharmaceut-ical products developed from the IP. Therefore, the value is added by the partners each accessing their respective marketing networks and resources to jointly take a pharmaceutical product to market, and the profits are split according to the contributions of the parties. It is very difficult to compare one deal to another, as each one has its own set of rights bundled in dif-ferent ways. What many consider winning alliances are those where the technology owner is capable of negotiating successful co-development and co-promotion alliances, which give the smaller companies the opportunity to build and maintain their own sales forces and establish or maintain a position in the market.
1) ExamplesandSources
One good resource for financial information on deals is Recombinant Capital,18 including some freely available information in its Signals maga-zine.19 The following are summaries of deals, provided for the annual list of nominees for the Allicense best deal awards.20 The financial data provide a glimpse at the current state of pharmaceutical alliances and a range of ap-proaches used for technologies in different stages of development.
The 2005 winner was a 2004 broad-based strategic alliance between Theravance Inc. and GlaxoSmithKline plc (GSK) to develop and com-mercialize drugs in a wide range of therapeutic areas, including bac-terial infection, urinary incontinence, and gastrointestinal disorders, which provides GSK an option to develop, manufacture, and com-mercialize elected programs in exchange for US$20 million cash upfront, US$109 million equity, and milestones of US$130–252 mil-lion per program, as well as royalties on product sales and additional equity options. A 2003 early-stage alliance between Neurogen Corp. and Merck �� Co. Inc. for small molecule drug candidates and ongoing programs focused on the vanilloid receptor 1 for treatment of pain, where Merck will cover the R��D costs and commercialize any resulting drugs. Neurogen gets US$15 million upfront, US$15 million in equity, US$7
18 Online: www.recap.com/.Online: www.recap.com/. 19 Online: www.signalsmag.com/.Online: www.signalsmag.com/. 20 �The Five Best Deals of 2004”�The Five Best Deals of 2004” Signals (2 May 2005), online: www.signalsmag.com/signals
mag.nsf/657b06742b5748e888256570005cba01/7c235bc376cf418888256ff5000ad0b1? OpenDocument��Highlight=0,allicense.
•
•

Transfer and Valuation of Biomedical Intellectual Property 615
million licence fees; and US$9 million in R��D funding over three years, up to US$118M in approval milestone payments per product (regardless of its origin) per indication, milestone payments for the approval of additional indications and the attainment of certain sales levels, and royalties on product sales.A 2004 partnership between CancerVax Corp. and Serono S.A. to complete the development and commercialization of the vaccine Can-vaxin, an immunotherapy in Phase III clinical trials for treating Stage III and IV melanoma, where the partners will co-develop Canvaxin for melanoma and other indications and share the costs equally, and will also co-promote the vaccine in the United States. CancerVax gets US$25M upfront, US$12 million in equity, up to US$253 million in development and sales milestones, and royalties on ex-U.S. sales.A 2004 global co-development and commercialization collabora-tion between Medarex and Bristol-Myers Squibb of two compounds, one in Phase III and the other investigational, for the treatment of melanoma, also has an option to co-promote in the United States. The deal includes US$25 million cash upfront, US$25 million equity investment, US$192 million development funds (35 percent paid by Medarex), US$205 million in development milestones, and US$275 million in sales milestones.
Another resource for information on industry valuations is Biotech In-telligence, an online biotech global information resource.21 An example is the information provided for a 2005 collaboration agreement between Exel-ixis, Inc. and Bristol-Myers Squibb Company (BMS) to discover, develop, and commercialize novel therapies targeted against the Liver X Receptor (LXR), a nuclear hormone receptor implicated in a variety of cardiovascular and metabolic disorders. The companies will jointly identify drug candi-dates and BMS will undertake further preclinical and clinical development, regulatory, manufacturing, and sales/marketing activities for such com-pounds. Payments from BMS to Exelixis include US$17.5 million upfront, R��D funding of about US$10 million per year for two years, pre-specified development, and regulatory milestones totaling approximately US$140 million per product for up to two products from the collaboration, as well as sales milestones and royalties on sales of products commercialized under the collaboration.
News on companies’ web sites may also include financial information. For example, Astex22 recently announced that it granted a worldwide licence
21 Online: www.biotech-intelligence.com/.Online: www.biotech-intelligence.com/. 22 Online: www.astex-therapeutics.com/investorsandmedia/pressdetail.php?uid=79.Online: www.astex-therapeutics.com/investorsandmedia/pressdetail.php?uid=79.
•
•

616 cristina thalhammer-reyero
to Novartis for its novel cell-cycle inhibitor, AT9311, with an option to license a second Astex cell cycle inhibitor, AT7519, currently in Phase 1. Astex will receive upfront payment and deferred equity payments of US$25 million with a potential of up to US$520 million in fees and equity payments, op-tion payments, and milestones, excluding royalties and assuming AT9311, AT7519, and one other cell cycle control product are successfully commer-cialized. Astex will also receive royalties on global product sales and retain option to co-commercialize compounds in the United States.
Other sources of information include companies’ annual reports, local newspapers, and industry magazines, as well as dedicated biotech news sites,23 and companies’ provision of partnering reports.24
E. OTHERWAYSOFTRANSFERRINGTECHNOLOGYANDIP
1) MaterialTransferAgreements
Material Transfer Agreements are used to authorize transfer of possession of biological materials from one person to another. The biological materials transferred usually represent or embody IP that needs to be protected and that may or may not be patented, and include compounds, vectors, gen-etic material, proteins, viruses, cell lines, animal models, and so forth. The agreement deals with ownership, permitted use, ownership of derived IP, safety, and any human subject or animal welfare issues. It usually disallows commercial uses in the absence of a commercial biological materials li-cence, provides no warranties, and requires the recipient to assume all risks associated with the use of material. When a patent has not yet been filed, the transfer of possession of the biological material, when it is not other-wise in the public domain, without confidentiality restrictions, can affect novelty and put at risk the patentability of the IP. New IP generated by the recipient while using the material, such as progeny and derivative materi-als, raises difficult questions of who should own the new IP.25 There is no universal way of dealing with new IP created pursuant to a material transfer agreement, and on occasions, joint ownership might be appropriate. How-ever, partial or even joint ownership of the new IP by both the provider and the recipient may present obstacles to exploitation. Model agreements and
23 Online: www.biospace.com/news.aspx.Online: www.biospace.com/news.aspx. 24 Partneringdesk, online: http://pharmalicensing.com/desk/.Partneringdesk, online: http://pharmalicensing.com/desk/. 25 The Universal Biological Material Transfer Agreement (UBMTA), developed by the NIH inThe Universal Biological Material Transfer Agreement (UBMTA), developed by the NIH in
collaboration with the greater research community, attempts to address this challenge by defining the original material, progeny, unmodified materials, and modifications, online: www.autm.net/aboutTT/aboutTT_umbta.cfm.

Transfer and Valuation of Biomedical Intellectual Property 617
policy endorsed by NIH stipulate that institutional ownership of any new IP follows from the inventorship and discourage any reach-through provisions that the provider might attach to the recipient’s new inventions, other than perhaps a research use licence.26
2) Collaborations
Collaborations are an important component in the process of technology transfer, and they are the livelihood of small biotech companies. Pharma-ceutical and biotech companies of all sizes collaborate frequently with each other and with academic institutions in order to achieve what each of them could not achieve in isolation, some examples of which are provided in a separate section below. Even the largest multinational companies rely on collaborations as a necessary extension of their internal research and de-velopment (R��D) effort for various reasons, including: (a) a lack of internal resources in specific areas; (b) greater cost efficiency in outsourcing; or (c) the existence of the necessary IP and expertise in some other organiza-tion. The collaborations agreements usually include some kind of licensing of the products resulting from the collaboration to the larger commercial partner in exchange for funding of R��D, future royalties, and other forms of financial support to the smaller or research partner. NIH investigators also collaborate with investigators in other institutions, most frequently on academic settings, under informal collaboration agreements. As a U.S. gov-ernment agency, NIH also uses CRADAs, a more formal mechanism and the only legal mechanism that it has to confer to the commercial CRADA partner the exclusive right to elect an exclusive licence to the technology developed under the CRADA and within the scope of the CRADA’s re-search plan.27 If the partner elects to license the technology, the valuation process takes into consideration contributions performed by the non-fed-eral partner. Current trends in biomedical research funding also encour-age collaborations among different academic, government, and commercial institutions, each providing their various and complementary strengths in their contributions.28
26 See M.L. Rohrbaugh, �Distribution of Data and Unique Material Resources Made with NIHSee M.L. Rohrbaugh, �Distribution of Data and Unique Material Resources Made with NIH Funding” (2005) 11:3 J. Commercial Biotech. 249.
27 The various HHS CRADA Model Agreements are standard documents developed to facili-The various HHS CRADA Model Agreements are standard documents developed to facili-tate the negotiation and approval process and to incorporate HHS policies on collaborative agreements and technology transfer, online: www.ott.nih.gov/forms_model_agreements/forms_model_agreements.html. See above note 8 for an explanation of CRADA.
28 NIH, Roadmap for Medical Research, online: http://nihroad map.nih.gov/.NIH, Roadmap for Medical Research, online: http://nihroad map.nih.gov/.

618 cristina thalhammer-reyero
3) Assignments
Assignments are permanent transferences of ownership of IP from one per-son to another. In the pharmaceutical sector, assignments are significantly less frequent than licensing, because the monetary value of IP at any early discovery or lead candidate stage is relatively small. Typically, assignments are for a lump amount of money, which is calculated by factoring in dis-count rates and the risk, measured as the probability of scientific, clinical, regulatory, and market failure. The assignment is permanent and irrevoc-able, with no future upside and without-performance obligations, contrary to the prospect of financial upside that could be achieved by royalties if the IP was licensed at this early stage.
F. OTHERSOURCES,USES,ANDISSUESOFIPVALUATIONS
1) ResearchandDevelopmentLimitedPartnerships
Another way to look at the industry’s historical valuations is by tracking the many diverse ways in which deals are structured. The investment commun-ity involved with the biotech industry in the United States has been very imaginative in creating new vehicles to finance projects and companies. For example, many of the best-known biotech companies have used alternative ways to finance projects, such as research and development limited partner-ships, that do not dilute the shares of existing holders, including commonly used instruments such as Stock Warrant Off-balance-sheet Research and Development (SWORD) and Special Purpose Accelerated Research Com-pany (SPARC). Under a typical deal structure, the parent company provides to the partnership a licence to the technology in exchange for R��D funding and options to commercialize and buy out; the investors provide to the part-nership the cash funding in exchange for tax credits and potential future payments, as well as warrants for a specified number of shares of the par-ent company, for a limited period of time at a specified price per share. Ac-cording to Recombinant Capital,29 among the major biotech R��D Limited Partnerships, are those used by
Genentech: US$55 million for Protropin (hGH), US$32 million for Activase (tPA), US$32 million for TNF and US$64 million for CD-4; Genzyme: US$35 million for Seprafilm (HA); US$44 million for Thyrogen and US$44 million for Cystic Fibrosis gene therapy; Amgen: US$80 million for Neupogen (G-CSF); and Immunex: US$27 million for soluble cytokine receptors.
29 Above note 17.Above note 17.
•
•
•
•

Transfer and Valuation of Biomedical Intellectual Property 619
More recent and advanced deals may also include additional co-develop-ment partners, such as the US$80 million clinical partnership of Exelixis for three compounds and various applications, in which GSK also partici-pates with additional funds and large milestone payments that could lead towards buying the compounds back.30
2) FinancialReportingintheUnitedStates:TheSarbanes-Oxley ActandValuationofIP
The need for IP valuation is not limited to transactions, as in the United States it is also needed for financial reporting purposes. The Sarbanes-Oxley Act of 200231 and the associated reporting rules from the Financial Account-ing Standards Board (FASB)32 require publicly held companies to identify and report on the valuation and performance of intangible assets, includ-ing all IP. The Act also affects privately held companies that are preparing to go public or to be sold, and the large accounting firms are applying their new auditing standards across the board to privately held clients, as well. The rules require that a company that owns or licenses IP that is �material” to its operation, must set up internal controls for identifying and valuing its IP and monitoring changes to the values of its IP, including licences, patents, pending patent applications, copyrights, trade secrets, common law trademarks, invention disclosures, more generalized know-how, informa-tion stored in engineers’ and scientists’ notebooks, and proprietary and li-censed computer applications. The IP audit team must consist of business managers, engineers, or scientists, in-house counsel, outside IP counsel, and an auditor. The controls must not only address how the company is identifying and protecting its own IP assets, but also what the company does to avoid infringing upon third parties’ IP rights. The company must perform IP audits at least annually, and the IP assets must be valued, as it is not enough to simply determine what income the company derives from those IP assets. The true value of the IP assets may be determined in a variety of ways, such as any of those described above. Further, IP counsel should identify on an on-going basis other IP issues that could affect the values, such as an invalidity defense in an infringement proceeding, or a recent case law that affects the validity, enforceability, or breadth of a patent.
30 Ibid.
31 TheThe Sarbanes-Oxley Act of 2002, 15 U.S.C. § 7241 holds a publicly held company’s executive officers, directors, auditors, and attorneys responsible for the identification and valuation of the company’s assets. Under the Act, assets include not only �tangible” assets but �intan-gible” assets as well, online: http://news.findlaw.com/hdocs/docs/gwbush/sarbanesox-ley072302.pdf.
32 See online: www.fasb.org.See online: www.fasb.org.

620 cristina thalhammer-reyero
Under the Act, a company must disclose the value of its IP and any material changes with the accompanying certification of an executive officer.
3) Infringement:DamagesAnalysis
Another method of obtaining royalty rates models is to look at court awards under patent infringement legal proceedings. Particularly relevant are those reaffirmed and strengthened after appeal to the Court of Appeals of the Fed-eral Circuit (CAFC), which is the only court that handles IP-related appeals in the United States. While the creation of the CAFC in 1981 has led more patents to be upheld as valid, patent infringement litigation has become an increasingly costly and risky strategy, where the burden to prove invalidity of the patents is placed on the accused infringer. The granting of prelim-inary injunctions by the CAFC, together with the willingness of jurors to grant large awards, particularly when wilful infringement is proven and the damage award can thus be increased to three times the actual amount of damages, has greatly increased the value of patents in the United States. It has also resulted in the downfall of many infringing companies.
The analytical approach used by the courts to measure the strength of patents is based on calculating differential profits. That is, a reasonable roy-alty is expressed as the difference between the expected or realized profit margin when infringing the patent, and a normal industry profit margin. That can be accomplished by, for example, comparing financial documents and internal memoranda from the infringing company, before and after the infringement. The problem here is with determining the normal industry profit margin, or even the company’s profit margin for the infringing prod-uct, when the company has more than one relevant product line or division. Also, the investment required to realize the additional profit margin is ig-nored. Furthermore, the profit margin would be higher for products cov-ered by patents than for the equivalent products that are not protected and become commodities but the infringing company may have not realized that higher profit margin. In the pharmaceutical industry, the difference between those profit margins for proprietary drugs under patent protection and for generic drugs is substantial. A primary difference can be seen when patent protection is lost. Brand name drugs typically cost 30 to 50 percent more than their generic alternatives.33
33 �Market Forces Usher in a Golden Age of Generic Drug”�Market Forces Usher in a Golden Age of Generic Drug” Pharmaceutical Business News (29 November 1993).

Transfer and Valuation of Biomedical Intellectual Property 621
4) InternalUse:RateofReturnonIPInvestments
IP could be valued like any other investment, by analyzing its rate of return, but traditionally it has not been done that way. The earnings associated with the IP would be calculated and converted into a royalty by dividing them by the associated revenues. Then, the portion of that attributable only to the specific subject patents is determined. This would require assignment of earnings attributed to the technology, and a separation from the contribu-tion by other technologies or assets is not always possible. The appropriate rate of return for IP may be higher than that for other assets because usu-ally it is associated with more risk, particularly with low liquidity. As an alternative, a discounted cash flow analysis can be performed to derive a royalty rate.
G. EXAMPLESOFLICENSEDTECHNOLOGIESDEVELOPEDWITHU.S.PUBLICFUNDS
Nothing in applicable law34 restricts the amount of royalties that NIH can negotiate, but a number of considerations bear on the negotiations. These include the stage of product development, the potential market value of the invention, the contribution to public health of making the product available, and the contributions by the partner if the technology was developed under a CRADA.35 Another factor is whether the licensee needs legal freedom to operate or exclusivity to justify the large investment required to go through the regulatory process. In general, the valuation methods NIH most fre-quently uses are based on comparable royalty rates for similar technolo-gies previously licensed by NIH, with adjustments through the negotiation process to accommodate the different situations and needs of the licensees. Other methods based on historical cost, such as the cost method, could be used in principle to set the minimum value to be recovered. However, in addition to being a poor way to measure value, as discussed above, this method would be impractical to apply for most of the technologies that NIH licenses, as the costs of the research that leads to the materials or IP to be li-censed are not tracked in such a manner. The replacement or reproduction cost would be easier to calculate from the point of view of the licensee, and it is likely that licensees use this method in the process of deciding whether to license a product that is not patented, such as a biological material or
34 15 U.S.C. § 3710: Utilization of Federal Technology. 35 Of the twenty-four drugs and vaccines currently approved by the FDA that contain an NIHOf the twenty-four drugs and vaccines currently approved by the FDA that contain an NIH
technology, only four involved a CRADA.
622 cristina thalhammer-reyero
software, or to reproduce it internally. However, this valuation method is not an option if the product or process is patented.
Most of NIH’s funded technologies, whether developed internally or at other research institutions, are at an embryonic stage of development, and their fullest value can only be obtained by commercialization of the IP. In many cases, the applicants for a licence are small companies that might not yet have the adequate resources to develop the technology by themselves. In these cases, the licensees receive the added value of their association with technologies or investigators from NIH or from other highly recognized research institutions, and the licence is a very valuable intangible that pro-vides higher credibility when the small companies seek venture capital or negotiate collaborations with pharmaceutical companies. From the NIH’s perspective, companies with adequate resources may not be interested in the early-stage technology, which may remain on the shelf, putting at risk the potential successful development of needed drugs, diagnostics, or re-search tools. Therefore, it is advantageous for NIH to share some risks with start-up companies that will add more value before they try to sublicense or collaborate with larger partners, which in turn will provide the required financial, regulatory, operational, and marketing resources required to suc-cessfully bring a product to market.
The NIH technology transfer and licensing program has the dual pur-pose of bringing products to the market for the benefit of the public health and driving economic development to maximize the value of the taxpayers’ investment. Therefore, we are dealing with intangibles at both the input and output ends of the valuation process. That makes it more complex, as common approaches to measure value, such as the amount of royalties generated, do not illustrate the full scope of benefits. An attempt by NIH to measure outcomes is to focus on the extent to which NIH technologies transferred to commercial partners meet the NIH mission of improving the public health.36 A summary of NIH’s technology transfer activities is shown in Table 4, which indicates that, in general, about half of the invention dis-closures are patented, and only a fraction of those will issue.
The number of licences is increasing over the years, but the number of patented technologies newly licensed fluctuates around numbers increas-ing only slightly.
36 FDA Approved Products Developed with Technologies from the NIH Intramural ResearchFDA Approved Products Developed with Technologies from the NIH Intramural Research Program, online: http://ott.od.nih.gov/about_nih/fda_approved_products.html.

Transfer and Valuation of Biomedical Intellectual Property 623
Table 4: Nih – Office Of Technology Transfer Activities37
FY20051 FY2004 FY 2003
Invention Disclosures2 388 403 400
New U.S. Patent Applications Filed3 186 199 196
Total U.S. Patent Applications Filed4 347 396 382
Issued U.S. Patents 66 122 86
Executed Licences5 313 276 209
Royalties (US $million)6 $98.27 $56.38 $53.79
Total Executed Agreements 313 276 207
Patent Commercial Exclusive Licences 20 18 25
Patent Commercial Non-exclusive Licences 33 23 26
Patent Internal Use Non-exclusive Licences 28 33 22
Biological Material Licences 56 64 46
Commercial Evaluation Licences 35 20 22
Inter-Institutional Agreements 42 28 11
Amendments 77 79 52
Others 22 11 71 Data extracted from the NI�� Office of Technology Transfer internal automated trac�ingData extracted from the NI�� Office of Technology Transfer internal automated trac�ing
system (TechTracS). Data reflect information available as of 27 December 2005.
2 Data reflect invention disclosures that include a government inventor.Data reflect invention disclosures that include a government inventor.
3 Patent applications include only the first U.S. patent application for a new disclosure filed inPatent applications include only the first U.S. patent application for a new disclosure filed in
the reporting period (data include CIP filings but not divisional applications).
4 Total patent applications filed during the reporting period regardless of type�� such as provi-Total patent applications filed during the reporting period regardless of type�� such as provi-
sional�� ordinary�� continuation�� etc.
5 Data reflect licences that were fully executed during the reporting period.Data reflect licences that were fully executed during the reporting period.
6 Royalty income reflects monies received during the reporting period.Royalty income reflects monies received during the reporting period.
7 Royalty income for F�� 2005 reflects information ta�en from OTT�s technology managementRoyalty income for F�� 2005 reflects information ta�en from OTT�s technology management
trac�ing system.
8 Royalty income for F�� 2004 reflects information ta�en from OTT�s technology managementRoyalty income for F�� 2004 reflects information ta�en from OTT�s technology management
trac�ing system.
9 Royalty income for F�� 2003 reflects figures reported by the NI�� Office of FinancialRoyalty income for F�� 2003 reflects figures reported by the NI�� Office of Financial
Management.
The financial terms of the individual licensing activities at NIH attributable to a specific licence agreement are not available publicly because federal laws prohibit agencies from disclosing commercial and financial information from licensees and collaborators.38 Therefore, individual details of agreements that NIH makes with industry partners cannot be included in this chapter, other
37 Online: http://ott.od.nih.gov/about_nih/statistics.html. Additional technology transferOnline: http://ott.od.nih.gov/about_nih/statistics.html. Additional technology transfer statistics are available from the U.S. Department of Commerce. These government-wide statistics use various methods of calculation. The reader is referred to the FY 2004 OMB Circular A-11, online: www.whitehouse.gov/omb/circulars/a11/current_year/a_11_2004.pdf.
38 See 15 U.S.C. § 3710a(c)(7) (1980); 18 U.S.C. § 1905 (2000). SeeSee 15 U.S.C. § 3710a(c)(7) (1980); 18 U.S.C. § 1905 (2000). See Public Citizen Health Re-
search Group v. NIH, 209 F. Supp. 2d 37 (D.D.C. 2002), see also 5 U.S.C. § 552(b)(4) (2000),

624 cristina thalhammer-reyero
than information that is already in the public domain. Tables 5 and 6 show the aggregated financial terms of NIH’s new patent commercialization licence agreements for fiscal years 2003–2005. They do not include licences for inter-nal use or amendments. The terms do not include those corresponding to po-tential sublicence agreements or reimbursement of patent prosecutions costs.
Table 5 shows that for exclusive licences, the major components are mile-stones payments in the range of $0–$10 million, with an average of about $1.1 million. However, it is difficult to appreciate from the table that, for success-fully marketed products, the major payoff is the royalties on sales received over the life of the patents.
Table 5: Financial Terms39 of Nih’s New Exclusive Commercial Patent Licence
Agreements in Fiscal Years 2003–2005
YearCategory 2005 2004 2003 2003–2005No. of Licences
20 18 25 63
Execution Fees
Range $4��000–$500��000
$5��000–$300��000
$2��000–$1��000��000
$2��000–$1��000��000
Average $66��450 $93��610 $105��560 $89��730
Median $42��500 $67��500 $50��000 $50��000
Minimum Annual Royalty
Range $1��000–$20��000 $0–$50��000 $0–$66��667 $0–$66��667
Average $8��554 $16��875 $15��66 $13��746
Median $5��000 $11��250 $7��200 $7��200
Milestones
Range $0–$2��875��000 $0–$10��300��000 $0–$5��150��000 $0–$10��300��000
Average $448��625 $1��676��528 $1��192��400 $1��094��603
Median $233��750 $815��000 $1��000��000 $815��000
Royalty Rate on Net Sales
Range 1.13%–5.00% 1.50%–5.00% 0.50%–8.00% 0.50%–8.00%
Average 2.96% 2.93% 3.25% 3.07%
Median 3.00% 2.38% 3.00% 2.96%
Table 6 shows that execution fees and minimum annual royalties are usu-ally lower for non-exclusive licences, as compared to the exclusive licences, and that for the fewer non-exclusive licences that include milestones payments, those are the major components. It is interesting to observe that the royalty
which exempts trade secrets, processes, operations, and related information and commer-cial and financial information that is privileged or confidential, from public disclosure.
39 This list does not include terms corresponding to potential sublicence agreements andThis list does not include terms corresponding to potential sublicence agreements and reimbursement of patent prosecutions costs.

Transfer and Valuation of Biomedical Intellectual Property 625
rates for non-exclusive licences are substantially higher than for exclusive li-cences, reflecting mainly that non-exclusive licences are usually for reagents or other products that are licensed in a state much closer to finished product, which command higher rates because of their lower development costs. Clas-sical examples are antibodies, which get a rate of 20–30 percent for reagent sales and perhaps only 0 percent of that rate for therapeutic use. On the other hand, the products derived from the exclusive licences usually serve much lar-ger markets and therefore produce a much higher rate of return for the licen-sor, even at lower rates.
Table 6: Financial Terms40 of Nih’s New Non-Exclusive Commercial Patent Licence
Agreements in Fiscal Years 2003–2005
YearCategory 2005 2004 2003 2003–2005No. of licences
33 23 22 78
Execution Fees
Range $1��000–$100��000 $500–$210��000 $0–$100��000 $0–$210��000
Average $20��697 $30��622 $24��614 $24��728
Median $20��000 $5��000 $10��000 $10��00
Minimum Annual Royalty
Range $0–$15��000 0$–$25��000 $0–$35��000 $0–$35��000
Average $4��025 $4��020 $6��038 $4��591
Median $3��000 $1��000 $2��250 $2��250
Milestones
Range $0–$1��725000 $0–$1��200-000 $0–$1��725��000 $0–$1��725��000
Average $206��212 $118��043 $159��727 $167��103
Median $0 $0 $0 $0
Royalty Rate on Net Sales
Range 1.00%–15.00% 1.00%–24.50% 2.00%–20.00% 1.00%–24.50%
Average 4.89% 6.79% 6��72% 5.97%
Median 3.50% 4.50% 5.19% 4.50%
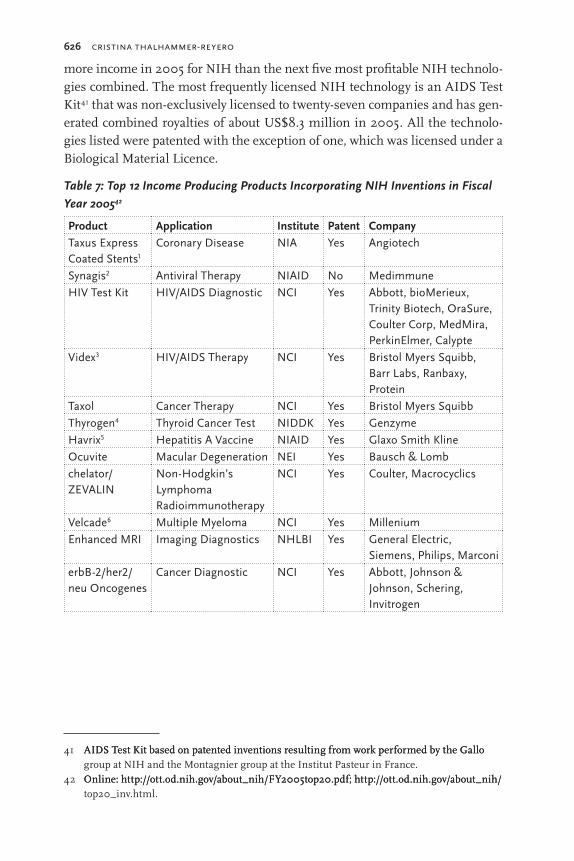
The products incorporating the top twelve most profitable NIH technolo-gies in 2005, which combined generated over US$78 million in 2005, are listed in Table 7, below. The most profitable NIH technology in 2005 in terms of collected income is the Taxus Express Coated Stent. This is a paclitaxel-coated stent combining two existing products, a device and a drug better known as Taxol used for cancer treatment (discussed in a different context below), which proved valuable in treating coronary disease. This technology has generated
40 This list does not include terms corresponding to potential sublicence agreements andThis list does not include terms corresponding to potential sublicence agreements and reimbursement of patent prosecutions costs.
626 cristina thalhammer-reyero
more income in 2005 for NIH than the next five most profitable NIH technolo-gies combined. The most frequently licensed NIH technology is an AIDS Test Kit41 that was non-exclusively licensed to twenty-seven companies and has gen-erated combined royalties of about US$8.3 million in 2005. All the technolo-gies listed were patented with the exception of one, which was licensed under a Biological Material Licence.
Table 7: Top 12 income Producing Products incorporating Nih inventions in Fiscal
Year 200542
Product Application Institute Patent CompanyTaxus Express Coated Stents1
Coronary Disease NIA ��es Angiotech
Synagis2 Antiviral Therapy NIAID No Medimmune
��IV Test Kit ��IV/AIDS Diagnostic NCI ��es Abbott�� bioMerieux�� Trinity Biotech�� OraSure�� Coulter Corp�� MedMira�� Per�inElmer�� Calypte
Videx3 ��IV/AIDS Therapy NCI ��es Bristol Myers Squibb�� Barr Labs�� Ranbaxy�� Protein
Taxol Cancer Therapy NCI ��es Bristol Myers Squibb
Thyrogen4 Thyroid Cancer Test NIDDK ��es Genzyme
��avrix5 ��epatitis A Vaccine NIAID ��es Glaxo Smith Kline
Ocuvite Macular Degeneration NEI ��es Bausch & Lomb
chelator/ ZEVALIN
Non-��odg�in�s Lymphoma Radioimmunotherapy
NCI ��es Coulter�� Macrocyclics
Velcade6 Multiple Myeloma NCI ��es Millenium
Enhanced MRI Imaging Diagnostics N��LBI ��es General Electric�� Siemens�� Philips�� Marconi
erbB-2/her2/neu Oncogenes
Cancer Diagnostic NCI ��es Abbott�� Johnson & Johnson�� Schering�� Invitrogen
41 AIDS Test Kit based on patented inventions resulting from work performed by the GalloAIDS Test Kit based on patented inventions resulting from work performed by the Gallo group at NIH and the Montagnier group at the Institut Pasteur in France.
42 Online: http://ott.od.nih.gov/about_nih/FY2005top20.pdf; http://ott.od.nih.gov/about_nih/Online: http://ott.od.nih.gov/about_nih/FY2005top20.pdf; http://ott.od.nih.gov/about_nih/top20_inv.html.

Transfer and Valuation of Biomedical Intellectual Property 627
Notes:
1 Paclitaxel-coated Stents: A �ay to Bypass By-Pass Surgery�� online: http://ott.od.nih.gov/Paclitaxel-coated Stents: A �ay to Bypass By-Pass Surgery�� online: http://ott.od.nih.gov/
pdfs/TaxusCS.pdf.
2 Synagis ��elping Infants and Parents Breathe Easier: A Case Study�� online: http://ott.od.nih.Synagis ��elping Infants and Parents Breathe Easier: A Case Study�� online: http://ott.od.nih.
gov/pdfs/SynagisCS.pdf.
3 VidexVidex
Expanding Possibilities: A Case Study�� online: http://ott.od.nih.gov/pdfs/VidexCS.pdf.
4 Thyrogen Increasing Patient Compliance: A Case Study�� online: http://ott.od.nih.gov/pdfs/Thyrogen Increasing Patient Compliance: A Case Study�� online: http://ott.od.nih.gov/pdfs/
ThyrogenCS.pdf.
5 ��avrix��avrix
�aging �ar Against a Common Enemy: A Case Study�� online: online: http://ott.
od.nih.gov/pdfs/��avrixCS.pdf.
6 Velcade�� New Science and New ��ope: A Case Study�� online: http://ott.od.nih.gov/pdfs/Velcade�� New Science and New ��ope: A Case Study�� online: http://ott.od.nih.gov/pdfs/
VelcadeCS.pdf.
One example of licensing by NIH for which there is financial data in the public domain is a collaboration and licence agreement between NIH and Bristol-Myers Squibb Company (BMS) for the development of the anti-can-cer drug Taxol. The details are provided in a report by the U.S. Government Accountability Office (GAO).43 At the time, this molecular entity was in the public domain and could not be patented, and it was difficult for NIH to attract any commercial interest in its further development. Although this is not a typical example that would be representative of licensing activities at NIH, it is a good example of how important is to have IP that covers, or can be reasonably expected to cover, the eventual products, and to have that input for valuation purposes at the time a licence is negotiated.
The blockbuster drug Taxol44 was developed by BMS in part under two CRADAs with NIH, the primary and first one signed in 1991. That was after the safety and effectiveness of the drug, a naturally occurring com-pound discovered in the 1960s (initially called taxol and later known by the generic name of paclitaxel, to distinguish it from the BMS trademark), was examined through research funded by NIH.45 NIH transferred its research
43 See GAO-03-829 Technology Transfer in Taxol Development, a report to U.S. SenatorSee GAO-03-829 Technology Transfer in Taxol Development, a report to U.S. Senator Wyden, online: www.gao.gov/new.items/d03829.pdf, considered by GAO as a case study and not necessarily representative of the way NIH performs technology transfer activities. This report was related to a senate hearing induced by a third-party request for NIH to impose price controls on the drugs because the development of the product was paid in part by public funds.
44 The bioactive compound, first extracted from the bark of the slow-growing Pacific yew treeThe bioactive compound, first extracted from the bark of the slow-growing Pacific yew tree Taxus brevifolia in the 1960s, was known as taxol from its discovery in the 1960s until BMS trade-marked it as Taxol in 1992, at which point the name of the generic drug was changed to paclitaxel.
45 Between 1983 and 1989, NIH filed and got approval by the FDA for the Phase I and PhaseBetween 1983 and 1989, NIH filed and got approval by the FDA for the Phase I and Phase II clinical trials for ovarian cancer. As a result, NIH posted a Federal Register notice (54 Fed. Reg. 31733 (1989)) seeking a pharmaceutical company that could further develop and market taxol, stating that the drug could not be patented and that the CRADA partner

628 cristina thalhammer-reyero
results and discoveries to BMS, who used it to obtain approval to market the drug from the FDA. NIH estimates that its cost for conducting clinical trials that supported the development of Taxol through the 1991 CRADA was US$80 million plus US$16 million in financial support from BMS, while the drug BMS supplied NIH through the CRADA was estimated to have a value of US$92 million. The results of NIH’s clinical trials were critical for BMS to secure the FDA’s initial approval in 1992 to market Taxol for the treatment of advanced ovarian cancer, with five of the six studies submitted to the FDA by BMS either conducted or funded by NIH. NIH’s total invest-ment in paclitaxel-related research from 1977 to 2002, including other ap-plications not utilized by BMS, was US$484 million, while BMS stated that the company spent US$1 billion to develop Taxol since signing the CRADA in January 1991.46 BMS negotiated its only licence agreement with NIH for paclitaxel in 1996, when BMS licensed from NIH three patents on particu-lar methods for the administration of paclitaxel in cancer treatment that were never added to the FDA-approved product label. The licence required BMS to pay royalties to NIH at a rate of 0.5 percent of its worldwide sales of Taxol, reflecting the non-essential nature of the IP involved. In 2001, Taxol became the best-selling cancer drug in history. However, sales decreased after the release in 2000 of the first generic version, the use of which was not covered by the NIH patents, and which is currently used to treat several types of cancer, including advanced ovarian and breast cancer, certain lung cancers, and AIDS-related Kaposi’s sarcoma. Worldwide Taxol sales totaled over US$9 billion from 1993 through 2002, but the BMS licence agreement resulted in only US$35 million in royalties for NIH through 2002,47 accord-ing to the GAO report.
On a parallel track, NCI provided about US$2 million in funding to Florida State University (FSU) for research that led to the development of a key semi-synthetic process for producing the drug from more abundant sources, which FSU patented in 1989 and subsequently licensed to BMS in 1990. BMS started using the FSU invention to manufacture Taxol in 1996 in order to increase its supply and paid FSU substantial royalties, which, according to FSU’s web site, amounted to about US$194 million for the five
would receive the exclusive rights to the data from its clinical trials. Four companies applied and BMS was selected for the CRADA. NIH patented three methods for using paclitaxel in combination with other treatments for cancer that resulted from the 1991 CRADA.
46 A recent analysis shows that the average out-of-pocket cost of developing a new drug wasA recent analysis shows that the average out-of-pocket cost of developing a new drug was estimated to be $543 million in 2000 dollars. See J.A. DiMasi, R.W. Hansen, �� H.G. Grabowski, �The Price of Innovation: New Estimates of Drug Development Costs” (2003) 22 Journal of Health Economics 151.
47 From 1996 through 2002, NIH’s total royalty income from all its licensed inventions wasFrom 1996 through 2002, NIH’s total royalty income from all its licensed inventions was $296 million.

Transfer and Valuation of Biomedical Intellectual Property 629
years 2000 to 2004.48 Without this semi-synthetic method, there would not have been sufficient supply of the drug to complete even the clinical trials because the natural product had been initially collected and isolated from the limited number of Pacific Yew trees. The concerns later raised were whether NIH collected a fair return on the tax dollars investment in the re-search leading to Taxol from the sales of this product by BMS, and the GAO was asked to examine the legal and financial issues involved in technology transfer. GAO reviewed the CRADAs as well as the licence agreement be-tween NIH and BMS,49 and it found that the negotiations for the CRADAs and licence agreements involved a weighing of NIH’s goals and priorities with those of a potential partner, recognizing tradeoffs necessary to reach an agreement. The difference in outcomes in terms of the rate of royalties received by NIH and FSU underscores the importance of having strong pat-ented technologies that cover the product to be eventually sold or its method of manufacture. The existence of such patents permits one to negotiate sub-stantially higher royalty rates than when they are not available.50
Regarding licensing activities by other research organizations, every year the Association of University Technology Managers (AUTM) publishes the AUTM Licensing Survey of its members, which include U.S. universities, hospitals, and research institutions. The results for fiscal years 200351 and 200452 are summarized in Table 8. About 305 institutions were surveyed and 65 percent responded.
The results show that even when licensed, the average patent never gen-erates enough licence revenue to pay for patent costs, so institutions depend on �big hit” licences that pay for themselves, plus all the other patents that were not so successful. Of the US$1.31 billion in licence income, only 151 licences, that is, 1.4 percent, generated more than US$1 million. The re-search expenditures data show that 66 percent is provided by the federal government, and the net licensing income represents only 3.4 percent of the research expenditures.
Licensing activities by the public sector are not to be driven only by the desire to obtain royalties. For example, there is some debate and concern
48 Online: www.techtransfer.fsu.edu/tts.html, updated 29 August 2007.Online: www.techtransfer.fsu.edu/tts.html, updated 29 August 2007.49 BMS voluntarily agreed to the disclosure of its commercial information in the CRADAs andBMS voluntarily agreed to the disclosure of its commercial information in the CRADAs and
the licence agreement so that GAO’s study could be made available publicly.50 Even so, the NIH and others have made the point that the greatest return to the taxpayerEven so, the NIH and others have made the point that the greatest return to the taxpayer
on its investment in biomedical research is in the value of improved public health and economic returns from companies that produce these new products. See A Plan to Ensure
Taxpayers’ Interests are Protected, above note 14. 51 AUTM Licensing Survey: FY 2003, online: www.autm.net/about/dsp.pubDetail2.AUTM Licensing Survey: FY 2003, online: www.autm.net/about/dsp.pubDetail2.
cfm?pid=16. 52 AUTM Licensing Survey: FY 2004, online: www.autm.net/about/dsp.pubDetail2.cfm?pid=28.AUTM Licensing Survey: FY 2004, online: www.autm.net/about/dsp.pubDetail2.cfm?pid=28.

630 cristina thalhammer-reyero
Tabl
e 8:
Sum
mar
y of
AU
TM L
icen
sing
Sur
veys
for
Fisc
al Y
ears
200
3 an
d 20
04
Out
com
es20
0420
03In
stitu
tions
Lice
nces
and
opt
ions
exe
cute
d4��
787
4��51
619
5
Lice
nces
to s
tart
up
a co
mpa
ny14
.2%
(90
.9%
exc
lusi
ve)
12.9
% (
94%
exc
lusi
ve)
Lice
nces
to s
mal
l com
pani
es
53.6
% (
42.1
% e
xclu
sive
)52
.5%
(43
.2%
exc
lusi
ve)
Lice
nces
to la
rge
com
pani
es32
.2%
(34
.7%
exc
lusi
ve)
34.5
% (
35.2
% e
xclu
sive
)
Lice
nces
yie
ldin
g an
y in
com
e11
��398
10��6
8219
5
Lice
nces
wit
h ro
yalti
es o
n sa
les
6��11
65��
682
193
Gro
ss li
cens
ing
inco
me
US$
1��46
9 m
illio
nU
S$1��
414
mill
ion
194
Net
lice
nsin
g in
com
eU
S$1��
385
mill
ion
US$
1��30
6 m
illio
n19
4
Run
ning
roy
alti
es o
n sa
les
79.3
%79
.9%
Cas
hed-
in-e
quit
y2.
0%2.
8%
Oth
er in
com
e1 18
.7%
17.3
%
Star
tup
com
pani
es fo
rmed
459
374
190
Inve
ntio
n di
sclo
sure
s16
��871
15��4
1019
5
New
U.S
. pat
ent a
pplic
atio
ns10
��517
7��94
919
2
Pate
nts
issu
ed3��
680
3��93
319
5
Exp
endi
ture
s
Res
earc
h ex
pend
itur
esU
S$41
.2 b
illio
nU
S$38
.5 b
illio
n18
8
Fund
ing
by fe
dera
l gov
ernm
ent
66%
66%
182
Fund
ing
by in
dust
ry7%
7%17
7
Lega
l Fee
s E
xpen
ditu
res
US$
221
mill
ion
US$
204
mill
ion
191
Lega
l Fee
s R
eim
burs
emen
tsU
S$91
mill
ion
US$
86 m
illio
n18
81
Oth
erty
pes
oflic
ence
inco
me��
such
asup
fron
tfee
s��an
nual
min
imum
roya
ltie
s��m
ilest
one
paym
ents
��lit
igat
ion
sett
lem
ents
��and
sofo
rth.
Oth
er t
ypes
of l
icen
ce in
com
e�� s
uch
as u
pfro
nt fe
es�� a
nnua
l min
imum
roy
alti
es�� m
ilest
one
paym
ents
�� lit
igat
ion
sett
lem
ents
�� and
so
fort
h.

Transfer and Valuation of Biomedical Intellectual Property 631
regarding the patenting and the forms of licensing of IP involving research tools. Should patents be licensed exclusively for diagnostic use as opposed to therapeutic use, in particular when DNA or genes are involved?53 These practices may hinder progress and innovation in the development of new products or the availability of diagnostics when the technologies are not made broadly available. It is estimated that 30–40 percent of human genes will be covered by some form of IP claims, and the question is whether the public is really benefited by gene patents when there is no identifiable useful product. The multiplicity of patents in some areas also increases the need for various licences to patents from different owners to develop a sin-gle product, as discussed above for the case of CCR5. Therefore, the value of these patents can be great, but they also increase the risk of very expensive court challenges, particularly when the stakes are high. Areas of concern include:
1. gene regulatory sequences;2. single nucleotide polymorphisms, human variations, and their use in
diagnostics; 3. proteins and protein structures;4. protein-protein interaction data;5. mouse knockouts and the IP constraints on the technology to create
them; 6. the notion of copyrights on databases of biological information; and 7. small molecules.
Small molecules are the bread and butter of the pharmaceutical indus-try, as they can also be used as probes of biological function. For example, some haplotypes54 will be important because they will be associated with susceptibility to diabetes, heart disease, mental illness, or other diseases. Haplotypes associated with particular genes have already been patented without any association with a risk of disease, and those haplotypes were judged by the U.S. Patent Office as sufficiently novel, non-obvious, and use-ful to allow the patents to issue. Because of all these concerns, and to pro-mote broad and non-exclusive access, NIH has issued various guidelines to steer grantees in their patenting and licensing activities in these areas, in-
53 The NIH’s Human Genome Research Institute (HGRI) and the Department of Energy, theThe NIH’s Human Genome Research Institute (HGRI) and the Department of Energy, the partners in the U.S. Genome Project, have been interested for some time in the issue of IP. See Francis Collins, �Monetary Licensing and Non-Monetary Licensing,” online: www7.nationalacademies.org/step/Genomics_Committee_Meeting_1_transcript.pdf.
54 Haplotypes are variations in the human genome, which have ten million places in whichHaplotypes are variations in the human genome, which have ten million places in which the human population have common variations.

632 cristina thalhammer-reyero
cluding those on �Sharing Biomedical Research Resources,”55 �Developing Sponsored Research Agreements,”56 and �Best Practices for the Licensing of Genomic Inventions.”57
A recent federally funded survey58 of licensing practices at nineteen of the thirty U.S. academic institutions that have received the largest num-ber of DNA patents reveals that of the 39,023 DNA patents issued as of 30 November 2005, about 78 percent were owned by for-profit entities and 22 percent by non-profits. The top two entities holding the most DNA patents are the University of California and the U.S. Government (mainly from the NIH intramural program), followed by eleven companies.
There are various other mechanisms to protect the interest of the public and to provide or retain different forms of value. For example, the govern-ment can regain ownership of publicly funded inventions if the research institutions are not interested in patenting and promoting their commer-cialization. Furthermore, licence agreements, including exclusive licences, granted by NIH and many of its funded institutions, include clauses retain-ing the right to grant others non-exclusive licences for research use. Finally, many licences for vaccines include a clause requiring licensees to provide plans for the distribution of the vaccine in developing countries.
H. COMPANIESEXTRACTINGVALUEOFPATENTSTHROUGHENFORCEMENT
Companies sometimes patent inventions which, despite full development by private investment and following practices that any reasonable business would use, are considered to be controversial because they are broad and far reaching. The value of those patents would be great, but would be ac-companied by a high level of resistance to licensing them, which ultimately increases the cost of enforcement and may result in years of litigation.
55 �Principles and Guidelines for Recipients of NIH Research Grants and Contracts on Ob-taining and Disseminating Biomedical Research Resources: Final Notice” Federal Register, Vol. 64, No. 246, at 72090–96 (23 December 1999), online: http://ott.od.nih.gov/policy/ research_tool.html.
56 �Developing Sponsored Research Agreements: Considerations for Recipients of NIH�Developing Sponsored Research Agreements: Considerations for Recipients of NIH Research Grants and Contracts,” reprinted from the Federal Register, Vol. 59, No. 215, pp. 55674–79 (8 November 1994), online: http://ott.od.nih.gov/policy/spons_research.html.
57 Best Practices for the Licensing of Genomic Inventions: Final Notice” Federal Register, Vol.Best Practices for the Licensing of Genomic Inventions: Final Notice” Federal Register, Vol. 70, No. 68, pp. 18413–511 (11 April 2005), online: http://ott.od.nih.gov/pdfs/70FR18413.pdf; http://ott.od.nih.gov/policy/genomic_invention.html.
58 Lori PressmanLori Pressman et al., �The Licensing of DNA Patents by U.S. Academic Institutions: An Empirical Survey” (2006) 24 Nature Biotechnology 31.
Transfer and Valuation of Biomedical Intellectual Property 633
A case in point is Genetic Technologies Limited (GTG),59 an Austral-ian company that first recognized and filed key patents controlling broad genetic applications of non-coding, or junk, DNA,60 which potentially im-pacts the work of hundreds of biotech companies, service providers, and non-profit organizations, particularly in the pharmacogenomics arena. The inventor sought a financial backer to help him patent it, and the first patents were granted by the U.S. Patent Office in 1993 and 1998.61 GTG has since been granted patents in twenty-four countries around the world, securing IP rights for particular uses of non-coding DNA in genetic analysis and gene mapping across all genes in all multi-cellular species. According to GTG, they invested US$20 million to win worldwide patents that give the company the right to charge licence fees from anyone who makes use of non-coding DNA, and the claims are being infringed by almost every lab-oratory worldwide that is testing for inherited diseases. Although the com-pany has a dominant commercial genetic testing business in Australia, a major component of its business strategy includes the global commercial-ization of its patents through an active licensing program.
GTG protected itself from the strategy of some large companies to induce small companies to sue, and then overwhelm them in legal fees in order to eliminate the threat. GTG secured patent insurance to avoid being wiped out because of the burden of US$5–6 million in legal fees if they do need to litigate.62 Despite the criticism of the patents, they proved to be not easily challenged. In early 2003, GTG initiated legal action in the United States
59 GTG, co-founded in Melbourne by the inventor, Dr. Malcolm Simons, and the investor, Dr.GTG, co-founded in Melbourne by the inventor, Dr. Malcolm Simons, and the investor, Dr. Mervyn Jacobson, in 1989, was listed on the NASDAQ National Market under the ticker symbol GENE on 2 September 2005.
60 DNA is DeoxyriboNucleic Acid. Non-coding DNA refers to DNA that does not containDNA is DeoxyriboNucleic Acid. Non-coding DNA refers to DNA that does not contain instructions for making proteins or other cell products, such as RNAs. Much of this DNA has no known function and is sometimes referred to as �junk DNA.” A large percentage of many organisms’ total genome sizes is comprised of non-coding DNA and about 97 percent of the human genome has been designated as junk. Dr. Malcolm Simons pioneered the concept that non-coding DNA could not be �junk” because the DNA sequence differences were ordered, and were conserved between humans of the same coding-gene type. That was going against scientific beliefs in the late 1980s. See online: www.haplomics.com/.
61 Two patents, 5,612,179 and 5,851,762, cover the use of amplifying intron DNA, the non-Two patents, 5,612,179 and 5,851,762, cover the use of amplifying intron DNA, the non-coding sequences that interrupt genes, to map genes and determine individual haplotypes, either by DNA sequencing or allele-specific oligonucleotides, the staple of many microarray methods. Granted in more than twenty countries, they apply to the genomes of all organ-isms, not just humans. Simons licensed these patents to GTG but departed the company after it went public in 2000, leaving Jacobson in charge. Simons now owns neither the IP nor shares in GTG.
62 Rebecca Urban, �U.S. Trial Looms for Genetic”Rebecca Urban, �U.S. Trial Looms for Genetic” The Age (21 February 2005), online: www.theage.com.au/news/Business/US-trial-looms-for-Genetic/2005/02/20/1108834657440.html.

634 cristina thalhammer-reyero
against three companies, claiming patent infringement of the GTG �non-coding” patents.63 The legal actions against Nuvelo, Inc. and Covance Inc. were settled a few months later and the terms remained confidential, while the legal action against Applera Corporation continued. After a court �Mark-man hearing”64 in late 2004 ruled mostly in favor of GTG on the disputed terms of its patent claims, the court ordered a mediation. On 12 Decem-ber 2005, GTG announced65 that Applera had agreed to pay an undisclosed amount to settle its ongoing patent-infringement suit surrounding the firm’s junk DNA gene-testing technologies, and while details of the settlement re-mained confidential, the companies executed several binding agreements, including a final settlement agreement, a licence agreement, and a supply agreement, and all claims and counterclaims to be dismissed.
GTG’s commercial licences typically comprise two components: an �up-front” payment and a royalty or annuity component that covers future use, in most cases payable annually up to the date on which the final patent lapses (2015). GTG collected in 2002 about US$5 million in licence fees,66 and in 2005 had US$5 million from the signing fee of just one company.67 Even as the majority of the total revenues received from the granting of li-cences falls into the up-front category, the cumulative annuity component is steadily growing, as shown in Table 9, below, such that GTG is now generat-ing more that US$1.3 million per annum from these �recurring” fees.
Table 9: GTG iP-Related Revenues & Expenses in A$
June 2005 June 2004
Total Operating Revenues 8��962��441 2��442��323
Up-Front Licence Fees 5��935��300 291��621
Royalties and Annuities 635��193 93��819
Patents Expenses 3��500��280 3��127��007
Today, GTG’s patents are being enforced worldwide, granting a total of twenty-eight licences to its technology to pharmaceutical companies, biotech-
63 GTG Company News: �Positive Progress in Patent Litigation,” online: www.gtg.com.au/in-GTG Company News: �Positive Progress in Patent Litigation,” online: www.gtg.com.au/in-dex.asp?menuid=060.070.200.020.010��artid=222.
64 Markman hearings present claim construction arguments before a judge, based on canonsMarkman hearings present claim construction arguments before a judge, based on canons of construction, the use of the terms in the claims, the use of the same terms in the pat-ent specification, arguments made during the prosecution of the patent application, and, possibly, industry usage of those terms. See online: www.howrey.com/practices/ip/index.cfm?contentID=288.
65 Online: www.gtg.com.au/index.asp?menuid=060.070.130��artid=264.Online: www.gtg.com.au/index.asp?menuid=060.070.130��artid=264. 66 Tom Noble, �’Junk’ DNA Pioneer Defends Patents”Tom Noble, �’Junk’ DNA Pioneer Defends Patents” The Age (9 July 2003), online: www.
theage.com.au/articles/2003/07/08/1057430202587.html. 67 Above note 62.Above note 62.

Transfer and Valuation of Biomedical Intellectual Property 635
nology firms, and researchers.68 The partial list of licensees shown in Table 10, below, corroborates the perception of validity of the patents by those compan-ies. The most important licence is that to Genzyme, which agreed to pay GTG AUS$5 million in cash and AUS$2.5 million in the form of other IP, as well as AUS$1 million per year until 2015, at which time the patents expire. The up-front payment is for past infringement by Genzyme while carrying out DNA testing services since 1994, and the deal allows the company to do research, preclinical trials, and commercial genetic testing using non-coding DNA in the United States, Europe, and Japan.69 GTG listed on the U.S. National Market NASDAQ in September 2005 under the ticker symbol GENE.
Table 10: Partial “Junk DNA” Patents70
Company Year Amount in A$ FieldGenetic Solutions Pty Limited (AU)
2002 75��000 plus royalties on sales
AU�� livestoc� applications
Nanogen (U.S.) 2002 650��000 Genetic research and human diagnostics
Sequenom (U.S.) 2002 1��000��000 Broad licence
Perlegen Sciences (U.S.) 2002 1��600��000 Limited genomic research
Myriad Genetics�� Inc. (U.S.) 2002 1��850��000 plus annual licence fees
Broad licence
Pyrosequencing AB (Sweden) 2003 5��000��000 Sweden
Orchid Biosciences (U.S.) 2003 3��200��000 Past infringing activities
Quest Diagnostics Incorporated (U.S.)
2003 Signing fee plus royalties on services
U.S.�� CA�� and MX
Vialactia Biosciences (NZ) 2003 Undisclosed Dairy industry
TM Bioscience Corporation (CA) 2003 Undisclosed Diagnostic �its for human genetic testing
LabCorp (U.S.) 2004 Signing fee plus annual payments
��uman diagnostic services in U.S. and CA
Genzyme (U.S.) 2004 $7.5 million upfront�� $1 million per year until 2015
U.S.�� EU�� and JP
MetaMorphix�� Inc. (U.S.) 2004 $1.8 million Livestoc��� pets�� and aquaculture
68 Online: http://esvc001057.wic005u.server-web.com/archives/1/070.040/190/Annual�20ReOnline: http://esvc001057.wic005u.server-web.com/archives/1/070.040/190/Annual�20Report�202005�20FINAL.pdf.
69 GTG Company News, www.gtg.com.au/index.asp?menuid=060.070.200.010.020��artid=30.GTG Company News, www.gtg.com.au/index.asp?menuid=060.070.200.010.020��artid=30.70 GTG Company News Archives, www.gtg.com.au/index.asp?menuid=060.070.200.010.02.GTG Company News Archives, www.gtg.com.au/index.asp?menuid=060.070.200.010.02.

636 cristina thalhammer-reyero
The value of patents is subjective and varies between stakeholders as they examine their strategic interests. For instance, Sequenom took a licence of the patents to avoid a protracted court fight and to gain the ability to sublicense to their customers, although their preferred embodiment did not infringe the patent.71 In 2002, GTG signed a strategic alliance with Myriad Genetics, Inc. under which they will cross-license certain technologies related for the assess-ment of inherited human diseases.72 Under the terms of the agreement, Myriad will receive a broad, non-exclusive licence to GTG’s non-coding DNA analysis and mapping patents for all applications in human therapeutics and diagnos-tics, and GTG becomes Myriad’s exclusive marketing agent in Australia and New Zealand for its world-leading predictive medicine products for a range of important diseases. Under the financial terms of the agreement, Myriad paid GTG an upfront licence fee of US$1 million plus annual licence fees, while GTG will pay Myriad various option fees and annual product royalties. Other financial terms were not disclosed.
In 2003, the University of Sydney and the University of Utah signed the first academic licences for fifteen years for only US$1,000, which GTG viewed as insurance for the universities from potential future higher royalties, while the amount did not even cover the cost of signing an agreement. That got gen-eticists fuming against GTG,73 because �[t]he research exemption, while not codified by law in the U.S., is a tradition that normally protects academic re-searchers from charges of patent violation, based on the assumption that the public is best served by the free exercise of scientific creativity in the not-for-profit sector … asking for any licence fee at all starts one down a slippery slope toward significant restriction of academic research.”74 GTG insists it is acting in a socially responsible way to get the technology out. The company’s position is strengthened by recent U.S. court rulings, such as Madey v. Duke Univer-sity,75 that make it more difficult for academic researchers to claim exemptions from patented technologies. Commercial uses were covered under a separate licence with the Associated Regional and University Pathologists (ARUP) at the University of Utah, with more than one thousand employees doing commercial
71 A Patent’s Place,A Patent’s Place, BIO-IT World (13 August 2003), online: www.bio-itworld.com/ar-chive/081303/horizons_aussie_sidebar_1.html.
72 Genetic Technologies and Myriad Genetics Announce Strategic Licensing Agreement (28Genetic Technologies and Myriad Genetics Announce Strategic Licensing Agreement (28 October 2002), online: www.myriad.com/news/release/349733.
73 Jonathan Holmes, �Patently a Problem: Are the Public Health Benefits of Speedy DiagnosesJonathan Holmes, �Patently a Problem: Are the Public Health Benefits of Speedy Diagnoses and Groundbreaking Research Being Jeopardised in a Rush for a Biotech Bonanza?” Austra-
lian Broadcasting Corporation, online: www.abc.net.au/4corners/content/2003/transcripts/s922059.htm.
74 Above note 71.Above note 71.75 307 F.3d 1351 (Fed. Cir. 2003) cert. den., 539 U.S. 958 (2003). Online: www.cptech.org/ip/307 F.3d 1351 (Fed. Cir. 2003) cert. den., 539 U.S. 958 (2003). Online: www.cptech.org/ip/
briefs/madeyduke-cptech-pk.pdf.

Transfer and Valuation of Biomedical Intellectual Property 637
genetic testing, for a one-time fee of US$75,000. GTG’s view on this is: �The old days of researchers being in academia and not being commercial are not true any more — it’s very blurred. U.S. academic institutes generate US$870M in licensing fees in a year, which is wonderful if they’re making inventions and then licensing technology. But doing it utilizing the inventions of others? It seems to be hypocritical that they want the right to commercialize their own inventions without paying those on whose shoulders they’re standing.”76 Later, King’s College in London, the University of Technology in Sydney, and the Col-orado State University also took a research licence for the non-coding patents.
I. COMPANIESEXTRACTINGVALUEOFPATENTSTHROUGHCOLLABORATIONS
Human Genome Sciences, Inc. (HGSI) had 432 issued U.S. patents as of March 2005, covering genes, proteins, and antibodies, and many more filed U.S. patent applications covering several other human genes, the proteins they encode, antibodies, and proprietary technologies, as well as the corres-ponding patents and applications in other countries. As a result of having filed those patent applications, HGSI was able to enter into numerous stra-tegic alliances with leading pharmaceutical and biotechnology companies. The value of that IP is very difficult to assign, as HGSI uses three major types of collaborations, summarized below, some of which are already generating income, but most of them are still waiting for their potential to be realized.
Between 1993 and 1997, HGSI entered into major collaborations, first with GlaxoSmithKline (GSK) and later, through GSK, with Takeda, Scher-ing-Plough, Sanofi-Synthelabo and Merck KGaA, referred to by HGSI as the �Human Gene Therapeutic Consortium.” Under these collaborations, HGSI provided its drug discovery capabilities in exchange for access to its partners’ drug development and commercialization expertise, research funding, rights to long-term milestone and royalty payments, as well as certain co-promotion, co-development, revenue sharing, and other prod-uct rights. The initial research term of these agreements expired on 30 June 2001, but GSK and its licensees continue pursuing research programs involving many different genes for the creation of small molecule, protein, and antibody drugs. HGSI is entitled to receive royalty payments, based on net sales of certain products developed by any of these companies from any of HGSI’s patents or technologies that fall within GSK’s field, as well
76 �Conversation with Mervyn Jacobson: Playing by Aussie Rules” BIO-IT World (13 August 2003), online: www.bio-itworld.com/archive/081303/horizons_aussie.html; Genetic Tech-nologies Limited, �Letter from GTG to Medical and Scientific Colleagues” (21 July 2003), online: www.gtg.com.au/index.asp?menuid=060.070.130.010��artid=97.

638 cristina thalhammer-reyero
as milestone payments in connection with the development of these prod-ucts. HGSI also holds an option to co-develop and co-commercialize certain HGSI’s products, including LymphoStat-B, HGS-ETR1, and HGS-ETR2, if it develops these products through Phase 2. Takeda has exercised its option to develop and commercialize TRAIL-R1 mAb in Japan.
A second type of collaboration is out-licensing activities in the form of product collaborations, summarized in Table 11, below.
Table 11: hGSi’s Product Collaborations (Out-Licensing)
GSK Exclusive rights for Albugon (albumin-GLP-1) for all human therapeutic and prophylactic applications.
• Milestone payments up to US$183 million; mile-stones for other indica-tions and royalties on net sales of products
•
Kirin Agonistic human antibodies to TRAIL receptor 2 .
• Japan and Asia/Australasia
•
Corautus Exclusive licence for VEGF-2 gene in the field of gene therapy .
• 18% equity interest•
diaDexus Lipoprotein-associated phospholipase A2 (Lp-PLA2) diagnostic to predict ris� for coronary heart disease.
• Royalties on sales of the PLAC test
•
Genentech Exclusive licence for therapeutic biologic products in immunology�� oncology�� and neurology applications�� and non-exclu-sive for diagnostic and small molecule products�� based on a human gene discovered by ��GSI.
•
MedImmune Collaboration and licence for drugs based upon infectious agents sequenced or licensed by ��GSI�� including vaccines and therapeutics for non-encapsulated Streptococcus pneumoniae, sublicensed to GSK.
• Received US$1.1 million through 2003
•
The in-licensing activities in the form of technology collaborations, sum-marized in Table 12, include the acquisition in 2003 by HGSI of an exclusive worldwide licence from Abgenix to develop and commercialize a fully human monoclonal antibody to CCR5, the molecule discussed above, followed in 2004 by HGSI’s initiation of a Phase 1 clinical trial in patients infected with HIV-1. As in most cases, only partial information is available on some of those trans-actions to be useful for valuation purposes.

Transfer and Valuation of Biomedical Intellectual Property 639
Table 12: hGSi’s Technology Collaboration (in-Licensing)
Abgenix Collaboration and licence for fully hu-man antibody drug candidates based on ��GSI�s antigens.
• Partners will pay reciprocal milestone and royalty pay-ments for products de-veloped and commercialized.
•
Cambridge Antibody Technology (CAT)
1999 licence for fully human antibody therapeutics for up to three of ��GSI�s target human proteins�� exclusive licence for Lymphostat-B to ��GSI.
• Paid to CAT US$2.3 million for one milestone and fees through the end of 2004.
•
Cambridge Antibody Technology (CAT)
2000 collaboration and licence for fully human antibodies for therapeutic and diagnostic purposes based on ��GSI�s antigens. ��GSI exercised its option to TRAIL receptor 1�� TRAIL receptor 2 and ABthrax.
• Paid CAT US$12 million for ten years of research sup-port�� equity investment�� and US$4.5 million in milestone payments through the end of 2004�� plus option to share clinical development costs and profits equally on some products .
•
Dyax Licence of phage display and peptide technology to develop unlimited number of peptide drugs�� human monoclonal antibody drugs�� and in vitro diagnostics.
• Milestone and royalty pay-ments to Dyax on products.
•
Medarex Collaboration for fully human anti-bodies based on ��GSI�s antigens�� op-tion to license exclusively therapeutic and diagnostic antibody products.
• Licence fees�� milestone payments�� and royalties on any commercial sales to Medarex.
•
Transgene ��uman gene therapy�� including vac-cines�� granted Transgene the right to license exclusively up to ten genes�� selected CTGF-2 for coronary artery disease and TIMP-4 for restenosis.
• Obtained a 10% equity interest in Transgene and certain co-development and co-mar�eting rights.
•
J. CONCLUSIONS
The reader may now appreciate the statement made at the beginning of this chapter, that the process of valuing early stage technologies is more an art than a science. It depends on many factors difficult to quantify, including the context of the valuation, the goals of the licensor, the financial position of the licensee, the stage of development of the technology, and many others. I hope that the information and case studies provided in this chapter, as well as the sources for obtaining additional data, will be helpful in the valuation of biomedical technology and IP in the various contexts covered.

640 cristina thalhammer-reyero
It is apparent that the valuation of technologies offered by the commer-cial players is usually higher than the valuation of technologies offered by academic institutions or government agencies.77 This is mainly due to the more advanced stage of development of the technologies offered by the for-mer, but it is also due in part to other factors, such as the government’s in-terest in having new products developed for the benefit of the public heath, as well as an interest in economic development. The government therefore grants licences of more limited scope, to the extent necessary for the com-mercial activity, to reserve the right to grant research licences to both for-profit and non-profit entities, and to continue research programs that might generate new competing technology in the long term. As a governmental agency, NIH is not able to contribute other valuable commercial services that a corporate partner might otherwise offer. As stated, each form of transfer provides different types of value to the receiving organization, from obtain-ing enabling materials, technologies, legal rights to operate, or the right to exclude others. Each form of transfer also carries different obligations and is associated with different royalty components.
The most useful method of valuation is probably the market approach, where deals of similar nature are available. The context of the valuation and the bundle of rights exchanged have to be taken into consideration. The size of the commercial deals, when reported, usually only includes the one-time payments, the larger share of which is in the form of milestones. However, the royalties on sales are usually not reported, and these are often the lar-ger payments over the life of the licence. In the same way, for successfully marketed products, the major payoffs for government and academic institu-tions are the royalties on sales received over the life of the patent.78 A large proportion of the total royalties reported usually reflect royalties on sales of a few successful products. For example, for NIH in 2005, the top ten most profitable technologies generated combined over US$70 million, while the total royalties were US$98 million.
It is also clear from the examples provided that, although unpatented materials can also be licensed, patented technologies can generate a sub-stantially higher payoff, notwithstanding the fact that many patents are never licensed or are licensed and the royalties received do not even cover the patent prosecution costs. Furthermore, as the licensing income and
77 For example, the median terms of biotech out-licensing for the period 1995 to 2004, for theFor example, the median terms of biotech out-licensing for the period 1995 to 2004, for the earlier stage of technology development, are upfront fees of $2 million and milestones of $13 million, while for NIH, exclusive licences for the period 2003 to 2005 are upfront fees of $50,000 and milestones of $705,000.
78 As reflected by the data provided by AUTM, where about 80 percent of the licensing incomeAs reflected by the data provided by AUTM, where about 80 percent of the licensing income is reported as running royalties on sales.

Transfer and Valuation of Biomedical Intellectual Property 641
research expenditures data provided by AUTM show, for academic insti-tutions in the United States, the net licensing income represents only 3.4 percent of the research expenditures. It is clear that much of the value of the research funded with public funds is provided to the public without fees attached, for the benefit of society. Therefore, the value of biomedical technology and IP can be very high, but also very variable from case to case, with significant indirect values for public health and welfare that do not always show up directly in financial statements.


