Page 1
Excellence Respect Diversity
Date: March 18, 2011 To: Ramsey County Citizens and Web Visitors From: Stephen L. Baker CAE, SAMA, Subject: 2011 payable 2012 Assessment Report We recently mailed the 2011 payable 2012 valuation notice to each Ramsey County property owner. The valuation notice included the assessors’ proposed estimated market value, the proposed taxable market value, and the proposed property classification for 2011 payable 2012. This year we reduced values for most properties. The total countywide reduction in market value was $1.614 billion before adding back the value from new construction; this is a slight improvement from last year’s reduction of $2.75 billion. Of the entire population of values 100,167 properties had a decrease in value, 50,905 properties had no change in value and 5,689 properties had an increase in value. After factoring in all changes in value deferments and exclusions, and new construction the total countywide decline in value is $2.588 billion, the total estimated market value for 2011 taxes payable 2012 is $41.25 billion (not-including personal property, utilities and railroad). This year we experienced declines in assessed value in residential and commercial property, but increases in overall market value for the apartment property segment. But even the apartment class, which experienced an increase in aggregate value, had more parcels with declining value than parcels with increasing value; this was because the parcels with increasing values tended to be the larger, more valuable properties.
2011 Assessment
The percentage changes in 2011 aggregate value (excluding new construction but including land) by property class, for the City of St. Paul and for the suburbs taken together and countywide are as follows:
Overall Residential Commercial/Industrial Apartments
City of Saint Paul -3.3% -4.2% -3.2% +2.1%
Suburban Ramsey -3.5% -4.4% -3.0% +4.3% Countywide -3.4% -4.3% -3.1% +2.9% Median Values for 2010 and 2011 are as follow: Residential Commercial/Industrial Apartments City of Saint Paul - 2010 $154,400 $399,900 $465,500 City of Saint Paul – 2011 $146,600 $385,000 $465,300
Office of the County Assessor Stephen L Baker, SAMA, CAE County Assessor
90 West Plato Boulevard
Suite 400 Tel: 651-266-2131
St. Paul, MN 55107 Fax: 651-266-2101
[email protected]
Working with You To Enhance
Our Quality of Life
Page 2
Excellence Respect Diversity
Residential Commercial/Industrial Apartments Suburban Ramsey -2010 $200,400 $767,600 $817,400 Suburban Ramsey -2011 $191,700 $756,200 $799,500 Countywide - 2010 $180,400 $525,000 $505,400 Countywide - 2011 $172,200 $498,800 $508,300 Last year I reported, “As we move into 2011 and 2012 the commercial markets continue to be the biggest unknown. Commercial fundamentals remain soft- rents are falling and vacancy is rising and market activity remains extremely flat. Yet we have not seen the declines in value that have been widely speculated to by the “experts”.” The good news now seems to be that this market has bottomed and is stabilizing, and sellers appear to have weathered the worst of the storm. The activity in the fourth quarter of 2010 seems to be a harbinger of improvements in commercial property valuations. We are beginning to see buyers and liquidity returning to the market. This is particularly true for investment grade property. Apartments have benefitted from an increased demand for rental housing, a byproduct of the continued weakness in the overall housing market, and by a number of years of very low construction of new units. Vacancy rates for apartments are falling, rents are increasing, and cap rates remain low. The residential markets, which a year ago appeared to be showing modest signs of improvement during the period of the Federal Tax Credit for buyers, suffered a set-back in 2010 after the rise of economic troubles in Europe and the end of the tax credit program. So we now enter 2011 with a market that remains soft, with a very unclear road to recovery. Buyers appear to remain skittish, and lending practices and credit remain tight. As troubling is current appraisal practice, appraisals had often been inflated in the years leading up to the bubble, but practices have now reversed too far, and have become overly conservative. We now receive reports of buyer and sellers reaching agreement as to sale price, and the appraiser undercutting the price and stalling or killing the transaction. We can verify that this is happening when these appraisals are presented to us by potential buyers or sellers as evidence of market value. The assessor’s office continues to actively track the market activity and we will continue to follow the prices determined in the market in 2011 for our 2012 assessment. We continue to closely monitor all sales including short-sales and foreclosure activity. Foreclosures increased in 2010, not to as high a level as 2008 but the trend is troubling. The resulting bank REO sales still constitute a continuing threat to some local market areas of the county, and we continue to adjust values to reflect the foreclosure influence, although these adjustments were much smaller this year – a good sign that the market may be stabilizing.
Taxpayer Review Options for their Proposed 2011 pay 2012 Assessment
The final quality-control step in the development and finalization of the 2011 assessment is the review process triggered by the taxpayers after they receive their valuation notice. It is at this point that the taxpayers bring to our attention any proposed valuations that appear to be inaccurate. There are three main options for our citizens in this review process. They can call our office or attend one of the open book meetings, they can appeal to the Ramsey County Special Board of Appeal and Equalization, or they can file a petition with the Minnesota Tax Court.
Open Book Meetings
The assessor’s office will again be holding open book meetings with the public. The intent of these meetings is to provide an opportunity for property owners to meet individually with a county appraiser to review their property
information for accuracy, discuss how their property was valued, and to answer questions about the assessment.
Page 3
Excellence Respect Diversity
The 2011 meetings are scheduled as follows:
April 5th through April 7th, 10:00 a.m. - 7:00 p.m. Property Records & Revenue Conference Center, 90 West Plato Blvd., St. Paul
Taxpayers will be asked to fill out a registration form prior to meeting with an Assessor. We request owners bring a copy of their 2011 Valuation Notice. Please note that we require our appraisers perform an interior inspection of a property prior to authorizing a reduction in assessed value.
Special County Board of Appeal and Equalization
Step 1 – Taxpayers may request a formal review by the County Assessor by completing a County Board of Appeal and Equalization form, which can be obtained from our office. Appeal forms must be postmarked by May 6, 2011. These appeals will be reviewed and owners will be notified by mail of the result. We will continue to perform assessment reviews after May 6. Step 2 – If an owner is not satisfied with our response to their appeal, they may appear before the County Board of Appeal and Equalization in person, by letter, or through an authorized personal representative. Owners must call 651-266-2131, in advance, to be scheduled on the Board’s agenda. The filing of an appeal form does not automatically place an owner on the Board’s agenda. All appearances will be by appointment only. The 2011 County Board of Appeal and Equalization will meet at the Ramsey County Property Records and Revenue Building at 90 W. Plato Boulevard St. Paul MN. The Special Board of Appeal and Equalization will convene June 13, 2011 and will conclude on or before June 24, 2011. The meeting times will be from 9:00 a.m. to 5:00 p.m. or 9:00 am to 7:00 pm Minnesota Tax Court Taxpayers have until April 30, 2011, to file an appeal with the Minnesota Tax Court for the 2010 payable 2011 valuation. Most residential property owners can file in the Small Claims division of the tax court, non-homestead property valued at $300,000 or higher must file in Regular Division. The deadline for filing an appeal of the 2011 payable 2012 assessment is April 29, 2012. The Tax Court Web site is http://www.taxcourt.state.mn.us/
Revaluation Activities Please remember that we will have appraisers out reviewing one-fifth of the properties in the county again this year, so don’t be surprised if you have visit from one of our staff appraisers. We thank you in advance for your cooperation with our appraisers as they perform their work and encourage you to allow them to review the entire property. Our appraisers will always have county ID and will be carrying county records describing your property. If you would like additional information about this year’s assessment, please call or email. We are happy to provide you any additional information you feel might be helpful. Our office may be reached at 266-2131 or by email at: [email protected] Our website address is: http://www.co.ramsey.mn.us/prr/index.htm Sincerely,
Stephen L. Baker
Stephen L. Baker, CAE, SAMA County Assessor
Page 4
CITY ST.
PAUL
2010 pay 2011 ESTIMATED
MARKET VALUE TOTALS
with Added Improvement
2011 pay 2012
ADDED
IMPROVEMENT
2011 pay 2012 ESTIMATED
MARKET VALUE TOTALS
with Added Improvemnt
ESTIMATED MARKET
VALUE INCREASE FROM
2010 p 2011 TO 2011 p
2012 Including Added
Improvements
ESTIMATED MARKET VALUE
INCREASE FROM 2010 p 2011
TO 2011 p 2012 Without Added
Improvements
Growth 10 to
11 Asmt
RESIDENTIAL 13,688,412,410 36,497,500 13,117,309,650 -571,102,760 -607,600,260 -4.17%AGRICULTURAL
HIGH VALUE 4,023,200 0 4,023,200 0 0 0.00%APARTMENT 2,178,229,190 16,834,700 2,223,681,150 45,451,960 28,617,260 2.09%COMMERCIAL/
INDUSTRIAL 3,822,054,900 12,095,600 3,697,684,200 -124,370,700 -136,466,300 -3.25%
TOTAL 19,692,719,700 65,427,800 19,042,698,200 -650,021,500 -715,449,300 -3.30%
SUBURBS
2010 pay 2011 ESTIMATED
MARKET VALUE TOTALS
with Added Improvement
2011 pay 2012
ADDED
IMPROVEMENT
2011 pay 2012 ESTIMATED
MARKET VALUE TOTALS
with Added Improvement
ESTIMATED MARKET
VALUE INCREASE FROM
2010 p 2011 TO 2011 p
2012 Including Added
Improvements
ESTIMATED MARKET VALUE
INCREASE FROM 2010 p 2011
TO 2011 p 2012 Without Added
Improvements
Growth 10 to
11 Asmt
RESIDENTIAL 16,395,640,200 38,718,500 15,671,380,500 -724,259,700 -762,978,200 -4.42%AGRICULTURAL
HIGH VALUE 35,381,100 0 33,835,900 -1,545,200 -1,545,200 -4.37%
APARTMENT 1,402,854,700 28,747,200 1,463,128,400 60,273,700 31,526,500 4.30%COMMERCIAL/
INDUSTRIAL 5,192,505,200 11,430,100 5,038,296,100 -154,209,100 -165,639,200 -2.97%
TOTAL 23,026,381,200 78,895,800 22,206,640,900 -819,740,300 -898,636,100 -3.56%
COUNTY
WIDE
2010 pay 2011 ESTIMATED
MARKET VALUE TOTALS
with Added Improvement
2011 pay 2012
ADDED
IMPROVEMENT
2011 pay 2012 ESTIMATED
MARKET VALUE TOTALS
with Added Improvement
ESTIMATED MARKET
VALUE INCREASE FROM
2010 p 2011 TO 2011 p
2012 Including Added
Improvements
ESTIMATED MARKET VALUE
INCREASE FROM 2010 p 2011
TO 2011 p 2012 Without Added
Improvements
Growth 10 to
11 Asmt
RESIDENTIAL 30,084,052,610 75,216,000 28,788,690,150 -1,295,362,460 -1,370,578,460 -4.31%AGRICULTURAL
HIGH VALUE 39,404,300 0 37,859,100 -1,545,200 -1,545,200 -3.92%
APARTMENT 3,581,083,890 45,581,900 3,686,809,550 105,725,660 60,143,760 2.95%COMMERCIAL/
INDUSTRIAL 9,014,560,100 23,525,700 8,735,980,300 -278,579,800 -302,105,500 -3.09%
TOTAL 42,719,100,900 144,323,600 41,249,339,100 -1,469,761,800 -1,614,085,400 -3.44%
Prepared 3/17/2010 JS/SB
(2010 p 2011 Values Taken From the 2010 Fall Mini, 2011 p 2012 Values Taken From Preliminary 2011 Spring Mini Run 3-15-2011.
(Includes Added Improvement for 2010 p 2011 and 2011 p 2012)
(Includes Vacant Land for all Property Types)
RAMSEY COUNTY ESTIMATED MARKET VALUE TOTALSSORTED BY PROPERTY TYPE AND CITY/SUBURBAN
2010 payable 2011 vs. 2011 payable 2012
AI is Added Improvement
(Reported Values Exclude Personal Property, Manufactured Homes, and State Assessed Utility & Railroad Property)
(All 2011 pay 2012 Values are subject to review and change until the conclusion of the Special Board of Appeal and
Equalization in mid-June 2011)
Page 5
0.0
50.0
100.0
150.0
200.0
250.0
0
10
20
30
40
50
60
2001 2002 2003 2004 2005 2006 2007 2008 2009 2010 2011 2012
ME
DIA
N V
AL
UE
S (
00
0'S
)
TO
TA
L V
AL
UE
(B
ILL
ION
S)
PAYABLE YEARS
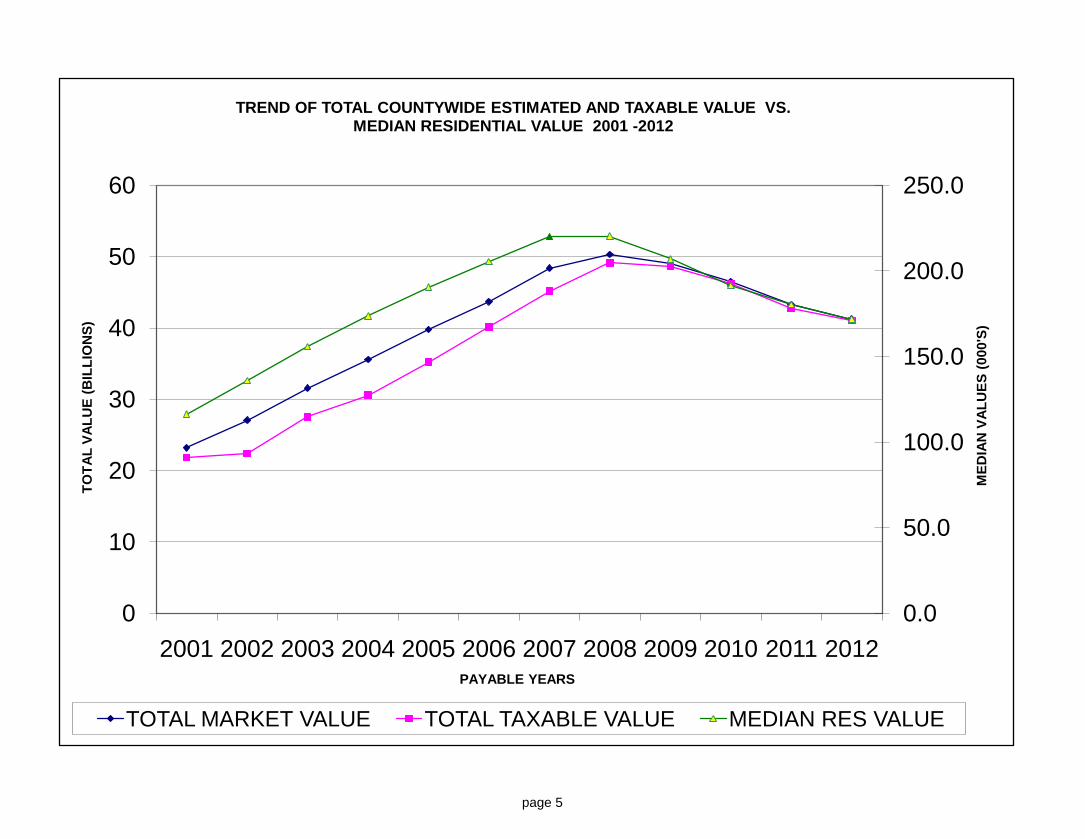
TREND OF TOTAL COUNTYWIDE ESTIMATED AND TAXABLE VALUE VS. MEDIAN RESIDENTIAL VALUE 2001 -2012
TOTAL MARKET VALUE TOTAL TAXABLE VALUE MEDIAN RES VALUE
page 5
Page 6
Ramsey County
Breakdown of 2011 Estimated Market Value and Percentage Chage from 2010
2011 Residential
Estimated
Market Value
Percentage
Change in
Resid. Value
'10 to '11
2011 Apartment
Estimated
Market Value
Percentage
Change in
Apartment
Value '10 to
'11
2011 Commercial
/ Industrial
Estimated Market
Value
Percentage
Change in
Commercial
Value '10 to
'11
2011 Total Real
Property Estimated
Market Value (Excludes
Utility, Leased Public,
Manuf Homes and
Railroad)
Percentage
Change in Total
Value '0 to '11
ARDENHILLS 697,733,300 -3.58 18,582,800 1.80 351,460,200 -0.64 1,067,776,300 -2.54
BLAINE 0 0.00 0 0.00 43,919,200 -1.85 43,919,200 -1.85
FALCON HEIGHTS 328,211,500 -2.24 36,634,700 1.40 24,866,300 1.64 389,712,500 -1.67
GEM LAKE 73,683,300 -6.86 1,772,100 15.39 24,652,500 0.15 100,107,900 -4.90
LAUDERDALE 115,568,000 -4.43 23,033,700 3.16 17,508,900 -0.70 156,110,600 -2.97-
LITTLE CANADA 530,018,000 -3.86 94,870,000 3.89 250,084,500 -1.39 874,972,500 -2.37
MAPLEWOOD 2,125,923,700 -6.20 243,355,800 3.72 950,374,100 -2.11 3,319,653,600 -4.39
MOUNDS VIEW 557,907,000 -4.28 81,186,100 3.17 267,867,000 -1.20 906,960,100 -2.75
NORTH ST PAUL 613,122,400 -3.80 62,618,000 1.72 91,526,200 -3.41 767,266,600 -3.33
NEW BRIGHTON 1,332,193,900 -5.08 158,244,400 2.90 333,180,600 -1.88 1,823,618,900 -3.86
NORTH OAKS 1,032,664,100 -2.60 49,603,400 -20.10 57,322,000 -3.34 1,139,589,500 -3.55
ROSEVILLE 2,321,106,300 -4.00 288,440,700 2.15 1,319,412,900 -4.35 3,928,959,900 -3.69
SHOREVIEW 2,249,378,500 -4.84 75,419,400 4.78 375,960,000 -4.09 2,700,757,900 -4.49
SPRING LAKE PARK 10,605,000 -9.70 498,500 0.00 442,000 0.00 11,545,500 -8.98
ST ANTHONY 116,791,200 -5.54 81,741,300 2.89 68,520,400 -3.15 267,052,900 -2.48
ST PAUL 13,060,644,500 -4.48 2,205,799,700 0.56 3,689,087,600 -2.95 18,955,531,800 -3.62
VADNAIS HEIGHTS 952,018,500 -4.54 44,789,700 7.59 348,080,200 -2.43 1,344,888,400 -3.64
WHITE BEAR LAKE 1,551,027,200 -4.92 179,150,800 5.62 353,582,200 -3.78 2,083,760,200 -3.91
WHITE BEAR TOWN 1,012,801,900 -5.69 6,352,000 -0.33 147,637,700 -4.26 1,166,791,600 -5.48
SUBURBAN 15,620,753,800 -4.64 1,446,293,400 2.41 5,026,396,900 -2.88 22,093,444,100 -3.81
COUNTYWIDE 28,681,398,300 -3.72 3,652,093,100 1.28 8,715,484,500 -2.91 41,048,975,900 -3.72
Preliminary Matket Value Totals -
(as stated on Notices of Valuation, prior to initial owner appeals) -6-
Page 7
Ramsey County Breakdown of 2010 Estimated Market Value and Percent Change from 2009
2010 Residential
Estimated
Market Value
Percentage
Change in
Resid. Value
'09 to '10
2010 Apartment
Estimated Market
Value
Percentage
Change in
Apartment
Value '09 to
'10
2010 Commercial
/ Industrial
Estimated Market
Value
Percentage
Change in
Commercial
Value '09 to
'10
2010 Total Real
Property Estimated
Market Value (Excludes
Utility, Leased Public,
Manuf Homes and
Railroad)
Percentage
Change in Total
Value '09 to '10
ARDENHILLS 723,182,100 -2.84 18,254,000 -2.17 356,962,900 -9.94 1,098,399,000 -5.25
BLAINE 0 0.00 0 0.00 44,900,300 -3.04 44,900,300 -3.04
FALCON HEIGHTS 335,478,200 -4.11 36,108,800 -7.22 24,465,300 -4.58 396,052,300 -4.43
GEM LAKE 78,925,000 -2.95 0 0.00 25,536,500 -4.24 104,461,500 -3.27
LAUDERDALE 120,893,500 1.49 22,328,400 -9.51 17,562,700 -1.76 160,784,600 -0.55
LITTLE CANADA 557,817,900 -5.32 91,382,400 -5.78 251,544,000 -7.21 900,744,300 -5.90
MAPLEWOOD 2,262,324,500 -6.13 233,443,200 -3.63 990,122,400 -4.93 3,485,890,100 -5.63
MOUNDS VIEW 581,230,600 -4.85 78,244,300 -5.69 272,382,200 -7.31 931,857,100 -5.65
NORTH ST PAUL 637,797,700 -8.09 61,653,300 -6.25 99,533,600 -2.29 798,984,600 -7.26
NEW BRIGHTON 1,403,662,100 -3.92 155,428,700 -5.90 331,011,100 -10.53 1,890,101,900 -5.31
NORTH OAKS 1,061,455,400 -3.64 59,298,800 34.32 59,301,100 -5.21 1,180,055,300 -2.33
ROSEVILLE 2,411,157,800 -4.43 283,052,700 -5.85 1,384,683,500 -3.38 4,078,894,000 -4.18
SHOREVIEW 2,358,080,100 -6.13 70,694,100 -2.60 416,690,300 -0.56 2,845,464,500 -5.27
SPRING LAKE PARK 11,954,800 -6.29 498,500 -10.00 442,000 0.00 12,895,300 -6.24
ST ANTHONY 123,739,600 -4.29 79,613,800 -9.87 70,853,000 -5.37 274,206,400 -6.25
ST PAUL 13,665,319,200 -7.39 2,151,649,600 -4.03 3,880,792,500 -7.37 19,697,761,300 -7.03
VADNAIS HEIGHTS 998,144,000 -4.19 41,628,300 -5.48 365,136,300 -1.42 1,404,908,600 -3.52
WHITE BEAR LAKE 1,631,507,900 -6.84 171,539,700 -4.22 369,305,700 -4.40 2,172,353,300 -6.23
WHITE BEAR TOWN 1,074,220,400 -7.59 3,705,000 -5.00 161,244,400 -5.22 1,239,169,800 -7.28
SUBURBAN 16,371,571,600 -5.33 1,406,874,000 -4.21 5,241,677,300 -4.83 23,020,122,900 -5.15
COUNTYWIDE 30,036,890,800 -6.28 3,558,523,600 -4.10 9,122,469,800 -5.93 42,717,884,200 -6.03
-7-
Page 8
2011
2010 p 2011 2011 p 2012 Average
JURISDICTION # Parcels Median Value Median Value % Change Value
SUNRAY-BATTLECREEK 1 4,828 149,500 138,850 -7.12% 150,065
GREATER EAST SIDE 2 7,060 125,100 118,600 -5.20% 117,866
WEST SIDE 3 3,713 147,500 140,200 -4.95% 144,315
DAYTON'S BLUFF 4 3,995 105,400 101,400 -3.80% 103,579
PAYNE-PHALEN 5 6,820 116,700 106,700 -8.57% 109,619
NORTH END 6 5,615 114,000 109,600 -3.86% 115,045
THOMAS DALE 7 3,023 96,500 90,800 -5.91% 90,647
SUMMIT-UNIVERSITY 8 3,781 176,800 167,400 -5.32% 217,560
WEST SEVENTH 9 3,278 155,850 146,750 -5.84% 158,397
COMO 10 3,686 198,400 193,350 -2.55% 201,499
HAMLINE-MIDWAY 11 3,305 160,100 155,800 -2.69% 157,891
ST ANTHONY PARK 12 1,681 252,100 234,300 -7.06% 256,927
MERRIAM 13 3,870 247,400 242,850 -1.84% 281,984
MACALESTER-GROVELAND 14 6,287 259,600 251,000 -3.31% 282,225
HIGHLAND 15 6,490 257,800 250,050 -3.01% 290,312
SUMMIT HILL 16 1,825 343,650 331,400 -3.56% 393,095
DOWNTOWN 17 1,959 140,200 129,800 -7.42% 154,063
AIRPORT 20
ARDEN HILLS 25 2,511 255,850 250,800 -1.97% 273,743
BLAINE 29
FAIRGROUNDS 30
FALCON HEIGHTS 33 1,292 249,150 238,900 -4.11% 253,411
GEM LAKE 37 155 256,700 247,000 -3.78% 406,153
LAUDERDALE 47 645 183,700 177,000 -3.65% 178,238
LITTLE CANADA 53 2,627 197,950 192,300 -2.85% 198,379
MAPLEWOOD 57 11,254 183,900 171,800 -6.58% 187,021
MOUNDS VIEW 59 3,182 173,300 168,200 -2.94% 174,182
NEW BRIGHTON 63 6,212 207,400 200,500 -3.33% 213,841
NORTH OAKS 67 1,566 577,200 533,700 -7.54% 620,244
NORTH ST. PAUL 69 3,595 166,500 159,200 -4.38% 169,164
ROSEVILLE 79 10,970 204,300 196,500 -3.82% 209,903
ST. ANTHONY 81 607 187,500 183,500 -2.13% 192,261
SHOREVIEW 83 9,395 227,900 215,400 -5.48% 238,572
SPRING LAKE PARK 85 69 166,100 145,500 -12.40% 153,696
VADNAIS HEIGHTS 89 4,314 205,900 197,750 -3.96% 216,981
WHITE BEAR LAKE 93 7,659 183,700 176,000 -4.19% 201,024
WHITE BEAR TOWN 97 4,334 220,300 208,500 -5.36% 230,962
SUBURBS 70,387 200,400 191,700 -4.34% 219,197
CITY 71,216 154,400 146,600 -5.05% 182,278
COUNTYWIDE 141,603 180,400 172,200 -4.55% 200,630
*Excludes added improvement in 2011 values, leased public property, exempt property, and vacant land.
**Residential property includes single-family, duplexes, triplexes, condos and townhomes. Mar-10
MEDIAN ESTIMATED MARKET VALUE OF RESIDENTIAL** IN RAMSEY COUNTY*
2010 Assessment Payable 2011 to 2011 Assessment Payable 2012 Sorted by City
Page 8
Page 9
2010 p 2011 2011 p 2012 Average
JURISDICTION # # Parcels Median Value Median Value % Change Value
SUNRAY-BATTLECREEK 1 4,358 150,100 139,700 -6.93% 152,304
GREATER EAST SIDE 2 6,590 124,900 118,700 -4.96% 117,862
WEST SIDE 3 3,051 146,600 140,400 -4.23% 145,234
DAYTON'S BLUFF 4 3,171 105,000 101,900 -2.95% 103,866
PAYNE-PHALEN 5 5,687 120,000 110,100 -8.25% 112,928
NORTH END 6 4,767 115,700 112,300 -2.94% 117,253
THOMAS DALE 7 2,128 99,750 97,400 -2.36% 94,179
SUMMIT-UNIVERSITY 8 1,889 161,850 158,900 -1.82% 232,356
WEST SEVENTH 9 2,366 148,950 144,900 -2.72% 145,455
COMO 10 3,451 199,900 195,800 -2.05% 204,986
HAMLINE-MIDWAY 11 2,902 159,200 155,100 -2.58% 157,202
ST ANTHONY PARK 12 1,081 286,800 278,400 -2.93% 288,512
MERRIAM 13 3,257 249,100 245,000 -1.65% 288,818
MACALESTER-GROVELAND 14 5,652 263,400 256,300 -2.70% 292,913
HIGHLAND 15 5,731 269,500 262,300 -2.67% 305,706
SUMMIT HILL 16 1,119 412,900 397,500 -3.73% 472,676
DOWNTOWN 17 26 352,100 291,200 -17.30% 555,912
AIRPORT 20
ARDEN HILLS 25 2,083 276,000 272,800 -1.16% 303,104
BLAINE 29
FAIRGROUNDS 30
FALCON HEIGHTS 33 1,134 254,550 244,800 -3.83% 259,650
GEM LAKE 37 153 256,700 247,000 -3.78% 389,273
LAUDERDALE 47 481 187,600 183,200 -2.35% 191,551
LITTLE CANADA 53 1,690 222,300 217,000 -2.38% 251,973
MAPLEWOOD 57 8,987 195,100 182,900 -6.25% 199,517
MOUNDS VIEW 59 2,830 176,300 171,300 -2.84% 179,158
NEW BRIGHTON 63 5,016 218,100 214,100 -1.83% 230,696
NORTH OAKS 67 1,508 576,650 545,050 -5.48% 626,107
NORTH ST. PAUL 69 3,363 167,150 160,000 -4.28% 170,579
ROSEVILLE 79 8,511 214,200 206,300 -3.69% 231,055
ST. ANTHONY 81 154 231,100 233,900 1.21% 289,517
SHOREVIEW 83 6,657 249,350 235,700 -5.47% 275,666
SPRING LAKE PARK 85 34 181,300 176,450 -2.68% 171,985
VADNAIS HEIGHTS 89 2,908 230,600 222,900 -3.34% 254,190
WHITE BEAR LAKE 93 6,391 186,450 179,200 -3.89% 206,023
WHITE BEAR TOWN 97 3,401 226,700 212,900 -6.09% 240,777#DIV/0!
SUBURBS 55,301 213,400 204,700 -4.08% 238,788
CITY 57,226 155,500 149,300 -3.99% 188,108
COUNTYWIDE 112,527 189,700 182,100 -4.01% 213,015
*Excludes added improvement from 2010 values, leased public property, and exempt property, and vacant land.
** Single-family includes LUC 545, 1/2 double dwelling. Mar-10
MEDIAN ESTIMATED MARKET VALUE OF SINGLE-FAMILY HOMES IN RAMSEY COUNTY
2010 Assessment Payable 2011 to 2011 Assessment Payable 2012
Sorted by St. Paul Planning District or City
Page 9
Page 10
Arrayed By District and City 2010 p 2011 2011 p 2012 2011
Parcel Median Median Average
Count Value Value % Change Value
SUNRAY-BATTLECREEK 1 147 112,900 100,400 -11.07% 103,067
GREATER EAST SIDE 2 77 119,900 113,900 -5.00% 107,091
WEST SIDE 3 89 110,700 88,600 -19.96% 106,262
DAYTON'S BLUFF 4 39 160,300 152,300 -4.99% 141,915
PAYNE-PHALEN 5 53 158,600 135,900 -14.31% 129,479
NORTH END 6 123 144,100 100,900 -29.98% 129,704
THOMAS DALE 7 20 110,500 102,400 -7.33% 90,100
SUMMIT-UNIVERSITY 8 173 157,100 152,400 -2.99% 204,969
WEST SEVENTH 9 92 198,500 190,950 -3.80% 234,923
COMO 10 8 128,100 128,100 0.00% 123,838
HAMLINE-MIDWAY 11
ST ANTHONY PARK 12 71 156,800 149,000 -4.97% 146,248
MERRIAM 13 4 128,500 128,500 0.00% 129,850
MACALESTER-GROVELAND 14 28 272,200 272,200 0.00% 254,175
HIGHLAND 15 60 218,500 194,000 -11.21% 221,212
SUMMIT HILL 16 25 325,600 343,200 5.41% 313,180
DOWNTOWN 17 9 400,000 400,000 0.00% 456,289
ARDEN HILLS 25 349 156,300 121,200 -22.46% 138,019
FALCON HEIGHTS 33 15 448,000 448,000 0.00% 349,587
GEM LAKE 37
LAUDERDALE 47 42 208,500 207,750 -0.36% 207,419
LITTLE CANADA 53 308 189,200 188,600 -0.32% 184,560
MAPLEWOOD 57 962 161,400 149,400 -7.43% 155,636
MOUNDS VIEW 59 38 209,000 201,500 -3.59% 173,839
NEW BRIGHTON 63 440 167,100 151,900 -9.10% 162,034
NORTH OAKS 67 146 651,250 616,350 -5.36% 614,934
NORTH ST. PAUL 69 105 124,400 124,400 0.00% 140,252
ROSEVILLE 79 672 189,100 188,400 -0.37% 216,335
ST. ANTHONY 81 148 174,650 164,150 -6.01% 170,517
SHOREVIEW 83 1,816 152,500 147,400 -3.34% 166,483
SPRING LAKE PARK 85 35 166,000 142,300 -14.28% 135,929
VADNAIS HEIGHTS 89 693 154,300 146,600 -4.99% 176,147
WHITE BEAR LAKE 93 677 173,000 170,300 -1.56% 189,352
WHITE BEAR TOWN 97 620 223,000 222,000 -0.45% 235,325#DIV/0!
SUBURBS 7,066 170,300 159,800 -6.17% 187,513
CITY 821 147,750 136,850 -7.38% 161,394
COUNTYWIDE 8,084 167,450 157,300 -6.06% 184,224
*Excludes added improvement from 2011 values, leased public property, exempt property, and vacant land.
District / Jurisdiction
MEDIAN ESTIMATED MARKET VALUE OF TOWNHOMES IN RAMSEY COUNTY*
2010 Assessment Payable 2011 to 2011 Assessment Payable 2012
Page 10
Page 11
2010 p 2011 2011 p 2012 2011
Median Median Average
Jurisdiction # Count Value Value % Change Value
SUNRAY-BATTLECREEK 1 116 97,600 90,600 -7.17% 91,699
GREATER EAST SIDE 2 156 111,900 109,000 -2.59% 110,878
WEST SIDE 3 97 112,800 95,000 -15.78% 104,212
DAYTON'S BLUFF 4 132 109,300 75,700 -30.74% 81,575
PAYNE-PHALEN 5 44 92,600 93,200 0.65% 78,016
NORTH END 6 184 103,200 95,250 -7.70% 101,695
THOMAS DALE 7 244 56,000 51,000 -8.93% 65,200
SUMMIT-UNIVERSITY 8 1,160 172,250 160,000 -7.11% 174,390
WEST SEVENTH 9 464 195,000 187,950 -3.62% 226,719
COMO 10 126 125,300 113,300 -9.58% 116,594
HAMLINE-MIDWAY 11 12 104,500 100,300 -4.02% 101,142
ST ANTHONY PARK 12 366 200,000 192,000 -4.00% 193,403
MERRIAM 13 119 138,500 133,000 -3.97% 159,003
MACALESTER-GROVELAND 14 300 62,600 60,000 -4.15% 80,895
HIGHLAND 15 535 157,600 144,500 -8.31% 148,764
SUMMIT HILL 16 478 201,050 184,350 -8.31% 212,359
DOWNTOWN 17 1,919 138,500 127,900 -7.65% 144,445
ARDEN HILLS 25 72 94,350 83,000 -12.03% 80,044
FALCON HEIGHTS 33 131 164,600 183,600 11.54% 192,732
GEM LAKE 37
LAUDERDALE 47 104 133,300 110,000 -17.48% 100,962
LITTLE CANADA 53 612 85,500 48,000 -43.86% 56,640
MAPLEWOOD 57 1,284 121,000 116,200 -3.97% 123,223
MOUNDS VIEW 59 259 133,100 118,700 -10.82% 121,361
NEW BRIGHTON 63 668 143,200 120,800 -15.64% 125,101
NORTH OAKS 67 19 352,000 334,400 -5.00% 330,484
NORTH ST. PAUL 69 77 131,900 124,500 -5.61% 131,505
ROSEVILLE 79 1,696 93,700 84,200 -10.14% 100,287
ST. ANTHONY 81 294 133,250 121,050 -9.16% 152,015
SHOREVIEW 83 973 114,400 108,300 -5.33% 114,901
SPRING LAKE PARK 85
VADNAIS HEIGHTS 89 700 107,300 95,600 -10.90% 102,319
WHITE BEAR LAKE 93 514 141,200 135,600 -3.97% 153,711
WHITE BEAR TOWN 97 305 119,200 118,300 -0.76% 115,720
SUBURBS 6,452 111,700 102,200 -8.50% 113,947
CITY 7,708 143,700 135,000 -6.05% 152,282
COUNTYWIDE 14,160 122,200 113,100 -7.45% 131,414
*Excludes exempt property, leased public property, added improvement fromthe 2011 values, and vacant land.
Mar-11
MEDIAN ESTIMATED MARKET VALUE OF CONDOS IN RAMSEY COUNTY*
2010 Assessment Payable 2011 to 2011 Assessment Payable 2012 Sorted by City or District
Page 11
Page 12
Sale Median Average Standard Minimum Maximum
Jurisdiction Count Price Price Deviation Price Price
SUNRAY-BATTLECREEK 1 123 152,000 159,452 48,377 75,000 465,000
GREATER EAST SIDE 2 223 135,000 133,805 24,765 45,000 190,000
WEST SIDE 3 93 145,000 143,871 39,906 46,200 335,000
DAYTON'S BLUFF 4 106 120,000 116,561 36,262 25,000 245,000
PAYNE-PHALEN 5 226 124,505 121,415 43,214 29,000 300,000
NORTH END 6 132 133,225 140,573 57,806 33,000 445,000
THOMAS DALE 7 53 125,000 116,719 34,051 39,000 174,900
SUMMIT-UNIVERSITY 8 98 201,500 256,578 191,707 73,556 1,625,000
WEST SEVENTH 9 108 181,575 207,549 97,498 45,000 585,000
COMO 10 69 205,000 211,759 48,286 115,000 320,000
HAMLINE-MIDWAY 11 75 167,000 168,753 30,584 84,000 252,000
ST ANTHONY 12 43 250,000 264,943 75,522 152,000 466,100
MERRIAM 13 85 233,000 307,074 223,628 97,800 1,785,000
MACALESTER-GROVELAND 14 189 255,500 292,298 171,911 33,000 1,550,000
HIGHLAND 15 165 240,000 282,442 136,622 68,000 1,010,000
SUMMIT HILL 16 35 385,000 464,650 259,535 121,500 1,400,000
DOWNTOWN 17 102 164,950 179,512 78,574 50,000 600,000
ARDEN HILLS 25 42 243,325 289,788 234,614 115,000 1,650,000
FALCON HEIGHTS 33 32 243,000 277,209 86,184 115,000 488,000
GEM LAKE 37 1 438,000 438,000 438,000 438,000
LAUDERDALE 47 14 187,450 179,589 47,079 92,000 265,000
LITTLE CANADA 53 56 202,750 191,811 105,608 40,000 560,000
MAPLEWOOD 57 243 181,000 198,427 73,232 63,000 665,000
MOUNDS VIEW 59 53 190,000 192,370 45,492 110,000 329,900
NEW BRIGHTON 63 115 189,900 204,498 59,872 95,700 410,000
NORTH OAKS 67 32 514,500 602,575 272,480 225,000 1,270,000
NORTH ST. PAUL 69 84 174,800 182,696 50,918 89,900 450,000
ROSEVILLE 79 217 217,500 236,182 111,694 52,800 920,005
ST. ANTHONY 81 20 208,500 224,553 116,229 116,900 675,000
SHOREVIEW 83 224 226,500 250,482 123,216 45,000 671,000
SPRING LAKE 85 4 146,900 149,675 41,589 105,000 199,900
VADNAIS 89 92 197,000 224,023 116,627 85,000 550,000
WHITE BEAR 93 170 191,500 217,197 97,000 85,000 775,000
WHITE BEAR 97 80 226,500 255,487 163,669 73,010 1,450,000
CITY 1,925 160,000 195,382 132,127 25,000 1,785,000
SUBURBS 1,479 202,900 231,046 128,383 40,000 1,650,000
COUNTYWIDE 3,404 179,000 210,877 131,687 25,000 1,785,000
**Residential property includes single-family, duplexes, triplexes, condos and townhomes.
RESIDENTIAL SALES BETWEEN 10/1/09 AND 9/30/10
By District / City
Page 12
Page 13
2010p 2011 2011 p 2012 2011 Average
JURISDICTION # Parcels Median Value Median Value % Change Value
SUNRAY-BATTLECREEK 1 39 2,635,000 2,940,000 11.57% 4,170,244
GREATER EAST SIDE 2 100 528,000 528,000 0.00% 1,148,493
WEST SIDE 3 66 292,650 278,000 -5.01% 610,594
DAYTON'S BLUFF 4 116 280,500 271,400 -3.24% 640,024
PAYNE-PHALEN 5 169 276,200 275,000 -0.43% 694,024
NORTH END 6 153 528,000 567,000 7.39% 968,797
THOMAS DALE 7 79 270,000 260,000 -3.70% 535,095
SUMMIT-UNIVERSITY 8 217 396,600 390,000 -1.66% 770,553
WEST SEVENTH 9 72 324,000 295,800 -8.70% 1,614,153
COMO 10 28 637,200 637,200 0.00% 3,652,675
HAMLINE-MIDWAY 11 79 358,600 360,000 0.39% 548,959
ST ANTHONY PARK 12 79 475,900 479,300 0.71% 1,529,881
MERRIAM 13 249 436,500 432,000 -1.03% 633,425
MACALESTER-GROVELAND 14 123 563,400 580,000 2.95% 741,281
HIGHLAND 15 155 867,000 867,000 0.00% 2,182,611
SUMMIT HILL 16 113 616,500 610,000 -1.05% 831,901
DOWNTOWN 17 40 1,146,100 1,229,850 7.31% 3,709,720
ARDEN HILLS 25 10 341,000 315,100 -7.60% 959,640
FALCON HEIGHTS 33 23 574,200 574,200 0.00% 1,214,996
LAUDERDALE 47 17 820,100 820,100 0.00% 1,347,141
LITTLE CANADA 53 36 388,800 369,400 -4.99% 2,457,356
MAPLEWOOD 57 99 974,700 1,430,000 46.71% 2,405,696
MOUNDS VIEW 59 67 288,000 273,600 -5.00% 1,180,690
NEW BRIGHTON 63 68 793,500 793,500 0.00% 2,242,631
NORTH OAKS 67 6 3,670,350 3,810,500 3.82% 7,920,717
NORTH ST. PAUL 69 63 372,600 354,000 -4.99% 971,270
ROSEVILLE 79 104 1,013,000 885,200 -12.62% 2,600,202
ST. ANTHONY 81 24 1,000,850 1,001,300 0.04% 3,144,100
SHOREVIEW 83 19 2,827,200 2,968,600 5.00% 3,600,847
SPRING LAKE PARK 85 1 498,500 498,500 0.00% 498,500
VADNAIS HEIGHTS 89 28 1,500,000 342,000 -77.20% 1,592,132
WHITE BEAR LAKE 93 59 1,937,400 2,034,300 5.00% 2,933,958
WHITE BEAR TWP 97 1 3,705,000 3,890,300 5.00% 3,890,300
CITY OF ST PAUL 1,877 465,500 462,000 -0.75% 1,107,805
SUBURBS 628 817,400 792,400 -3.06% 2,182,013
COUNTYWIDE 2,505 505,400 504,000 -0.28% 1,376,143
*Excludes added improvement in 2011 values, and leased public property.
page 13 Mar-10
2010 Assessment Payable 2011 to 2011 Assessment Payable 2012 Sorted by City
MEDIAN ESTIMATED MARKET VALUE OF APARTMENTS IN RAMSEY COUNTY*
Page 14
2010 p 2011 2011 p 2012
PROPERTY DESC. LUC # PARCELS Median Value Median Value % Change
4 TO 9 UNITS 401 825 317,700 310,000 -2.42%
10 TO 19 UNITS 402 469 605,900 609,000 0.51%
20 TO 49 UNITS 403 244 1,300,000 1,360,800 4.68%
50 TO 99 UNITS 404 67 3,676,600 3,836,700 4.35%
VACANT LAND 405 172 47,000 48,000 2.13%
APT MISC. IMPROV 406 15 402,650
FRATERNITY/SORORITY 407 6 402,650 402,650 0.00%
100 PLUS UNITS 408 93 7,270,900 7,624,900 4.87%
CITYWIDE 1,884 465,500 465,250 -0.05%
*Excludes added improvement in 2011 values, leased public property, exempt property, and vacant land.
2010 Assessment Payable 2011 to 2011 Assessment Payable 2012 Sorted by Land Use Code
(LUC)
MEDIAN ESTIMATED MARKET VALUE OF APARTMENTS IN CITY OF ST. PAUL
Page 14
Page 15
2010p2011 2011p2012
PROPERTY DESC. LUC # PARCELS Median Value Median Value % Change
4 TO 9 UNITS 401 169 315,000 288,000 -8.57%
10 TO 19 UNITS 402 137 770,400 770,400 0.00%
20 TO 49 UNITS 403 111 1,937,700 2,034,300 4.99%
50 TO 99 UNITS 404 80 4,339,400 4,534,650 4.50%
APT MISC IMPROV 405 69 63,400 87,600 38.17%
406 7 73,400
100 PLUS UNITS 408 59 7,235,200 7,573,100 4.67%
ALL SUBURBAN 638 817,400 799,500 -2.19%
*Excludes added improvement in 2011 values, leased public property, exempt property, and vacant land.
MEDIAN ESTIMATED MARKET VALUE OF APARTMENTS IN SUBURBS*
2010 Assessment Payable 2011 to 2011 Assessment Payable 2012 Sorted by LUC
Page 15
Page 16
2010 p 2011 2011 p 2012 Maximum
JURISDICTION # Parcels Median Value Median Value % Change Value
SUNRAY-BATTLECREEK 1 69 876,600 830,000 -5.32% 22,325,000
GREATER EAST SIDE 2 106 280,200 267,800 -4.43% 15,550,000
WEST SIDE 3 214 412,900 400,950 -2.89% 12,121,700
DAYTON'S BLUFF 4 160 243,550 225,250 -7.51% 19,000,000
PAYNE-PHALEN 5 322 235,800 223,350 -5.28% 20,000,000
NORTH END 6 332 285,450 274,550 -3.82% 8,455,000
THOMAS DALE 7 190 398,250 391,900 -1.59% 6,065,400
SUMMIT-UNIVERSITY 8 166 358,600 348,700 -2.76% 10,088,400
WEST SEVENTH 9 239 419,750 393,700 -6.21% 26,476,100
COMO 10 62 522,500 497,550 -4.78% 17,869,500
HAMLINE-MIDWAY 11 174 435,200 423,750 -2.63% 16,758,000
ST ANTHONY PARK 12 251 797,000 749,500 -5.96% 16,953,700
MERRIAM 13 229 488,400 454,200 -7.00% 24,937,500
MACALESTER-GROVELAND 14 143 398,600 395,900 -0.68% 3,325,000
HIGHLAND 15 134 666,250 634,850 -4.71% 22,325,000
SUMMIT HILL 16 113 623,300 611,300 -1.93% 8,500,000
DOWNTOWN 17 287 382,550 365,500 -4.46% 79,300,000
AIRPORT 20
ARDEN HILLS 25 90 1,803,100 1,803,100 0.00% 80,000,000
BLAINE 29 23 831,200 831,200 0.00% 5,500,000
FAIRGROUNDS 30
FALCON HEIGHTS 33 19 781,200 758,100 -2.96% 10,179,400
GEM LAKE 37 34 475,750 463,600 -2.55% 4,415,700
LAUDERDALE 47 19 642,050 608,000 -5.30% 3,229,100
LITTLE CANADA 53 238 446,800 416,500 -6.78% 18,900,000
MAPLEWOOD 57 392 810,800 796,000 -1.83% 210,000,000
MOUNDS VIEW 59 86 1,014,050 972,450 -4.10% 102,592,700
NEW BRIGHTON 63 204 772,550 771,200 -0.17% 11,222,000
NORTH OAKS 67 15 2,600,000 2,470,000 -5.00% 29,810,500
NORTH ST. PAUL 69 110 405,000 403,400 -0.40% 11,400,000
ROSEVILLE 79 425 1,520,000 1,454,500 -4.31% 100,000,000
ST. ANTHONY 81 42 831,350 822,450 -1.07% 14,000,000
SHOREVIEW 83 128 1,123,150 1,060,550 -5.57% 41,515,000
SPRING LAKE PARK 85 2 199,000 199,000 0.00% 230,000
VADNAIS HEIGHTS 89 189 862,500 835,600 -3.12% 15,300,000
WHITE BEAR LAKE 93 358 462,650 432,950 -6.42% 11,300,000
WHITE BEAR TWP 97 70 1,016,300 928,600 -8.63% 9,566,000
CITY OF ST PAUL 3,191 399,900 385,000 -3.73% 79,300,000
SUBURBS 2,444 767,600 756,200 -1.49% 210,000,000
COUNTYWIDE 5,635 525,000 498,800 -4.99% 210,000,000
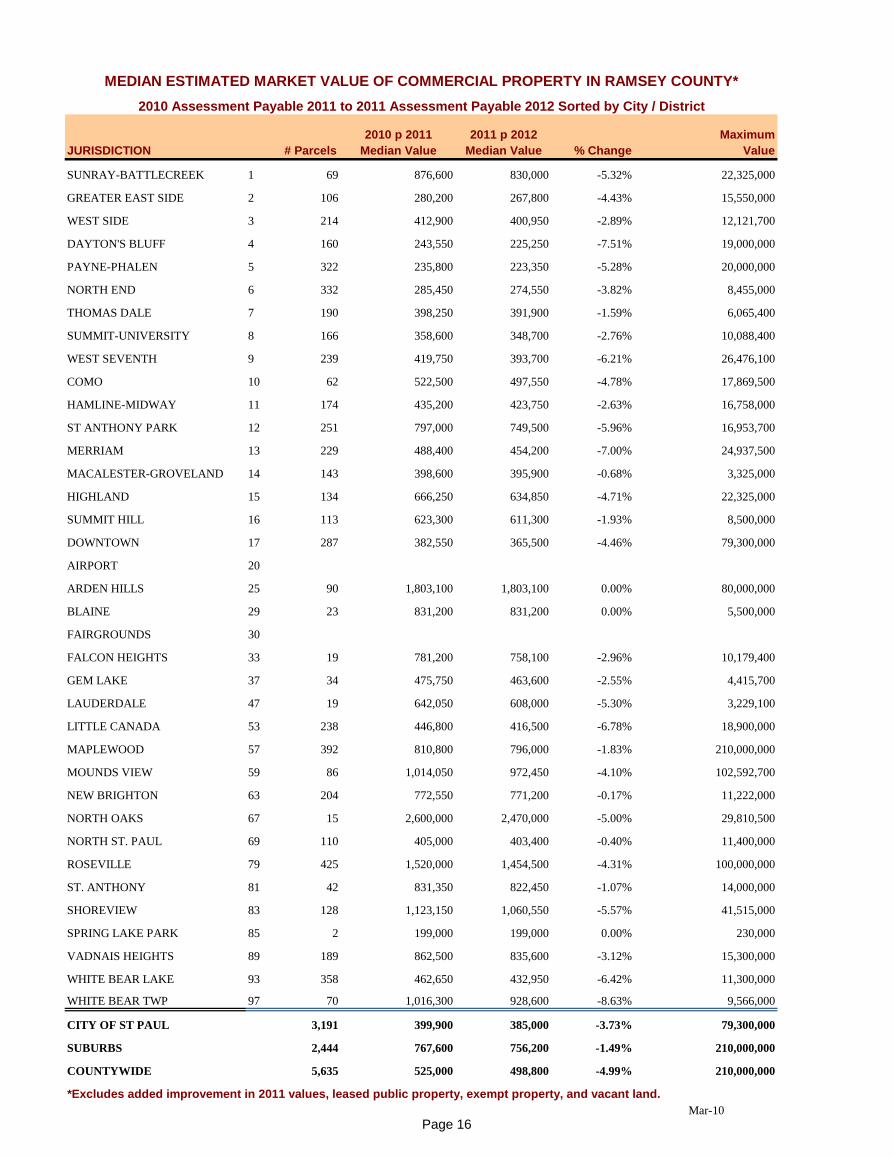
*Excludes added improvement in 2011 values, leased public property, exempt property, and vacant land.
Mar-10
MEDIAN ESTIMATED MARKET VALUE OF COMMERCIAL PROPERTY IN RAMSEY COUNTY*
2010 Assessment Payable 2011 to 2011 Assessment Payable 2012 Sorted by City / District
Page 16
Page 17
By Land Use Code (LUC) -COUNTYWIDE
2011 2010 Median 2011 Median
Change in Median
Value 2011 Average
LUC Property Use- land Use Count Value Value 2010 to 2011 Value
310 FOOD & DRINK PROCESS PLANTS & STORAGE 17 1,133,900 1,209,100 6.6% 1,895,888
320 FOUNDRIES & HEAVY MANUFACT PLANTS 18 2,308,900 1,750,550 -24.2% 2,753,139
330 MANUFACTURING AND ASSEEMPLY MED 1 4,500,000 4,500,000
340 MANUFACTURING & ASSEMBLY LIGHT 277 1,090,500 1,081,800 -0.8% 1,718,057350 INDUSTRIAL WAREHOUSE LIGHT 3 337,100 852,467
370 SMALL -MEDIUM SHOPS 927,000
390 GRAIN ELEVATORS 1 826,400 1,226,400 48.4% 1,226,400
398 INDUSTRIAL - MINUMUM IMPROVEMENT 14 1,090,700 729,100 -33.2% 958,557
399 OTHER INDUSTRIAL STRUCTURES 18 339,200 330,850 -2.5% 1,147,478
410 MOTELS & TOURIST CABINS 21 1,881,800 1,843,400 -2.0% 2,553,024
411 HOTELS 21 4,920,000 5,170,800 5.1% 5,787,943
412 NURSING HOMES & PRIVATE HOSPITALS 29 2,339,900 1,901,900 -18.7% 3,088,783
413 ASSISTED LIVING 1 1,500,000 1,217,000 -18.9% 1,217,000
415 TRAILER/ MOBILE HOME PARK 25 2,127,400 2,468,500 16.0% 3,364,136
419 OTHER COMMERCIAL HOUSING 2 1,597,500 1,597,500 0.0% 1,597,500
420 SMALL DETACHED RETAIL (UNDER 10,000 SF) 541 332,100 316,000 -4.8% 390,919
421 SUPERMARKETS 30 2,660,000 2,513,500 -5.5% 3,639,557
422 DISCOUNT STORES & JR DEPT STORES 17 11,400,000 11,300,000 -0.9% 11,329,094
423 MEDIUM DETACHED RETAIL 90 1,938,600 1,946,950 0.4% 2,003,678
424 FULL LINE DEPARTMENT STORES 10 8,787,400 8,893,700 1.2% 8,201,350
425 NEIGHBORHOOD SHOPPING CENTER 82 2,944,900 2,848,850 -3.3% 3,405,718
426 COMMUNITY SHOPPING CENTER 24 12,500,200 10,830,000 -13.4% 13,106,425
427 REGIONAL SHOPPING CENTER 4 62,750,000 61,500,000 -2.0% 63,250,000
428 VETERINARY CLINIC 26 526,000 526,000 0.0% 585,642
429 MIXED RESIDENTIAL/COMMERCIAL 655 308,550 299,300 -3.0% 508,736
430 RESTAURANT, CAFETERIA, AND/OR BAR 210 474,500 433,200 -8.7% 701,903
431 SMALL STRIP CENTER 76 847,200 819,150 -3.3% 970,671
432 CONVENIENCE STORE 140 585,000 559,250 -4.4% 646,316
433 MIXED RETAIL /COMMERCIAL 39 571,200 573,400 0.4% 852,733
434 RETAIL CONDO 12 215,950 212,500 -1.6% 438,533
435 DRIVE-IN RESTAURANT/FOOD SERVICE FACILITY 135 650,000 650,000 0.0% 683,842
437 DAYCARE CENTERS 34 763,600 757,550 -0.8% 853,288
441 FUNERAL HOMES 29 685,900 685,900 0.0% 848,124
442 MEDICAL CLINICS & OFFICES 104 415,100 411,650 -0.8% 599,838
443 MEDICAL OFFICE 49 3,350,600 3,234,700 -3.5% 4,701,667
444 FULL SERVICE BANKS 78 1,382,500 1,364,850 -1.3% 1,684,719
446 CORPORATE CAMPUS 5 80,000,000 80,000,000 0.0% 82,928,540
447 OFFICE BUILDINGS (1-2 STORIES) 476 560,050 514,850 -8.1% 1,366,889
448 OFFICE BUILDINGS (3 OR MORE STORIES, WALKUP)
449 OFFICE BUILDINGS (3 OR MORE STORIES, ELEVATOR) 118 4,436,900 4,448,050 0.3% 7,863,333
450 CONDOMINIUM OFFICE UNITS 458 239,400 215,700 -9.9% 289,448
451 GAS STATION 33 406,700 400,200 -1.6% 461,694
452 AUTOMOTIVE SERVICE STATION 321 396,400 378,600 -4.5% 602,732
453 CAR WASHES 21 358,500 340,700 -5.0% 475,424
454 AUTO CAR SALES & SERVICE 74 746,500 746,500 0.0% 1,419,903
455 COMMERCIAL GARAGES 6 531,250 460,800 -13.3% 764,183
456 PARKING GARAGE STRUCTURE & LOTS 10 205,700 241,350 17.3% 641,790
457 PARKING RAMP 57 12,000 12,000 0.0% 796,449
458 COMMERCIAL CONDO OUTLOT 1 100 100 0.0% 100
460 THEATERS 5 1,014,600 750,000 -26.1% 3,004,120
463 GOLF COURSES 23 680,800 680,800 0.0% 5,229,896
464 BOWLING ALLEYS 5 1,172,000 1,073,300 -8.4% 1,141,560
465 LODGE HALLS & AMUSEMENT PARKS 31 438,900 450,400 2.6% 518,165
470 1 8,933,800 8,933,800
479 FLEX INDUSTRIAL BUILDINGS 199 2,487,600 2,379,900 -4.3% 2,967,395
480 COMMERCIAL WAREHOUSES 696 690,600 677,000 -2.0% 1,279,389
481 MINI WAREHOUSE 26 2,404,550 2,357,200 -2.0% 2,373,581
482 COMMERCIAL TRUCK TERMINALS 15 2,272,650 2,334,200 2.7% 2,722,487
483 CONDO WAREHOUSE 37 319,250 331,000 3.7% 375,281
485 RESEARCH & DEVELOPMENT FACILITY 9 7,078,100 5,360,800 -24.3% 8,336,533
490 MARINE SERVICE FACILITY 2 707,300 680,300 -3.8% 680,300
496 MARINA (SMALL BOAT)
498 COMMERCIAL MINIMUM IMPROVEMENT 61 489,300 524,000 7.1% 798,798
499 OTHER COMMERCIAL STRUCTURES 112 401,300 380,600 -5.2% 811,859
ALL CITY 3,191 399,900 385,000 -3.7% 1,122,453
ALL SUBURBS 2,444 767,600 756,200 -1.5% 1,942,742
ALL COUNTYWIDE 5,635 525,000 498,800 -5.0% 1,478,227
* Excludes added improvement, and State assessed railroad and utility property
* Excludes Vacant Commercial and Industrial Land Parcels Mar-10
ALL RAMSEY COUNTY COMMERCIAL PROPERTY BY LAND USE CODE
2010 Payable 2011 Assessment VS. 2011 Payable 2012 Assessment
Page 17
Page 18
By Land Use Code (LUC) -City of St. Paul only
2010 2011
Change in
Median 2011
2011 Median Median Value Average
LUC Property Use - Land use Count Value Value 2010 to 2011 Value
310 FOOD & DRINK PROCESS PLANTS & STORAGE 10 778,850 778,850 0.0% 1,020,840
320 FOUNDRIES & HEAVY MANUFACT PLANTS 15 1,772,700 1,192,200 -32.7% 2,297,847
330 1 4,500,000 4,500,000
340 MANUFACTURING & ASSEMBLY LIGHT 127 823,100 739,900 -10.1% 1,387,178
350 3 337,100 852,467
390 GRAIN ELEVATORS 1 826,400 1,226,400 48.4% 1,226,400
398 INDUSTRIAL MINIMUM IMPROVEMENT 10 1,038,600 372,500 -64.1% 847,320
399 OTHER INDUSTRIAL STRUCTURES 11 332,750 264,400 -20.5% 581,636
410 MOTELS & TOURIST CABINS 7 935,600 935,600 0.0%
411 HOTELS 8 5,737,500 6,076,200 5.9% 7,654,100
412 NURSING HOMES & PRIVATE HOSPITALS 18 936,900 921,800 -1.6% 2,763,956
413 ASSISTED LIVING 1 1,500,000 1,217,000 -18.9% 1,217,000
419 OTHER COMMERCIAL HOUSING 1 495,000 495,000 0.0% 495,000
420 SMALL DETACHED RETAIL (UNDER 10,000 SF) 411 315,000 298,700 -5.2% 365,672
421 SUPERMARKETS 19 1,492,200 2,080,500 39.4% 2,258,816
422 DISCOUNT STORES & JR DEPT STORES 5 11,400,000 11,000,000 -3.5% 10,623,500
423 MEDIUM DETACHED RETAIL 34 1,149,500 1,063,150 -7.5% 1,458,203
424 FULL LINE DEPARTMENT STORES 3 9,564,250 10,341,100 8.1% 11,526,167
425 NEIGHBORHOOD SHOPPING CENTER 26 2,417,200 2,393,750 -1.0% 2,957,046
426 COMMUNITY SHOPPING CENTER 10 10,280,000 8,575,500 -16.6% 11,893,990
428 VETERINARY CLINIC 10 425,550 425,550 0.0% 407,650
429 MIXED RESID/COMMERCIAL 575 295,400 285,300 -3.4% 482,008
430 RESTAURANT, CAFETERIA, AND/OR BAR 128 359,500 325,500 -9.5% 484,959
431 SMALL STRIP CENTER 28 872,500 828,850 -5.0% 983,600
432 CONVENIENCE STORE 73 502,600 475,000 -5.5% 554,247
433 MIXED RETAIL /COMMERCIAL 26 508,200 524,500 3.2% 784,769
434 RETAIL CONDO 5 800,000 800,000 0.0% 833,980
435 DRIVE-IN RESTAURANT/FOOD SERVICE FACILITY 64 614,800 573,500 -6.7% 612,202
437 DAYCARE CENTERS 13 613,800 598,500 -2.5% 641,092
441 FUNERAL HOMES 18 622,850 622,850 0.0% 767,333
442 MEDICAL CLINICS & OFFICES 65 336,150 311,800 -7.2% 609,058
443 MEDICAL OFFICE 24 4,515,250 4,515,250 0.0% 6,163,233
444 FULL SERVICE BANKS 35 1,361,600 1,293,500 -5.0% 1,766,151
447 OFFICE BUILDINGS (1-2 STORIES) 254 425,550 396,000 -6.9% 940,396
448 OFFICE BUILDINGS (3 OR MORE STORIES, WALKUP)
449 OFFICE BUILDINGS (3 OR MORE STORIES, ELEVATOR) 79 4,133,050 3,893,600 -5.8% 8,913,213
450 CONDOMINIUM OFFICE UNITS 145 220,000 203,000 -7.7% 413,057
451 GAS STATION 17 430,600 407,500 -5.4% 427,618
452 AUTOMOTIVE SERVICE STATION 193 310,000 298,700 -3.6% 419,382
453 CAR WASHES 10 390,550 371,050 -5.0% 410,330
454 AUTO CAR SALES & SERVICE 29 243,600 242,200 -0.6% 324,917
455 COMMERCIAL GARAGES 1 149,650 55,000 -63.2% 55,000
456 PARKING GARAGE STRUCTURE & LOTS 10 205,700 241,350 17.3% 641,790
457 PARKING RAMP 57 12,000 12,000 0.0% 796,449
460 THEATERS 2 783,100 625,000 -20.2% 625,000
463 GOLF COURSES 13 422,200 474,800 12.5% 3,865,038
464 BOWLING ALLEYS 1 800,650 1,301,300 62.5% 1,301,300
465 LODGE HALLS & AMUSEMENT PARKS 17 343,700 309,300 -10.0% 492,800
479 FLEX INDUSTRIAL BUILDINGS 43 2,628,600 2,537,400 -3.5% 3,390,658
480 COMMERCIAL WAREHOUSES 414 588,300 550,500 -6.4% 1,129,072
481 MINI WAREHOUSE 12 2,084,100 2,096,850 0.6% 2,180,025
482 COMMERCIAL TRUCK TERMINALS 5 1,035,800 1,570,400 51.6% 1,322,880
483 CONDO WAREHOUSE 11 453,100 432,000 -4.7% 571,873
485 RESEARCH & DEVELOPMENT FACILITY 2 5,437,200 5,437,200 0.0% 5,437,200
498 COMMERCIAL MINIMUM IMPROVEMENT 24 340,200 450,000 32.3% 672,838
499 OTHER COMMERCIAL STRUCTURES 66 202,900 192,650 -5.1% 539,962
ALL CITY 3,191 399,900 385,000 -3.7% 1,122,453
* Excludes added improvement, and State assessed railroad and utility property
* Excludes Vacant Commercial and Industrial Land Parcels
CITY OF ST. PAUL COMMERCIAL PROPERTY BY LAND USE CODE
2010 Payable 2011 Assessment VS. 2011 Payable 2012 Assessment
Page 18
Page 19
By Land Use Code (LUC) -SUBURBAN ONLY Change
2011 2010 Median 2011 Median
in Median
Value 2011 Average
LUC Property Use - Land Use Count Value Value 2010 to 2011 Value
310 FOOD & DRINK PROCESS PLANTS & STORAGE 7 3,289,150 3,131,600 -4.8% 3,145,957
320 FOUNDRIES & HEAVY MANUFACT PLANTS 3 2,308,900 2,308,900 0.0% 5,029,600
340 MANUFACTURING & ASSEMBLY LIGHT 150 1,385,750 1,307,400 -5.7% 1,998,201
350 INDUSTRIAL WAREHOUSE LIGHT
370 SMALL MEDIUM SHOPS 927,000
398 INDUSTRIAL MEDIUM IMPROVEMENTS 4 1,223,300 1,223,300 0.0% 1,236,650
399 OTHER INDUSTRIAL STRUCTURES 7 391,700 450,000 14.9% 2,036,657
410 MOTELS & TOURIST CABINS 14 2,741,600 2,677,750 -2.3%
411 HOTELS 13 4,200,000 4,000,000 -4.8% 4,639,538
412 NURSING HOMES & PRIVATE HOSPITALS 11 3,291,800 3,291,800 0.0% 3,620,318
415 TRAILER/ MOBILE HOME PARK 25 2,127,400 2,468,500 16.0% 3,364,136
419 OTHER COMMERCIAL HOUSING 1 2,700,000 2,700,000 0.0% 2,700,000
420 SMALL DETACHED RETAIL (UNDER 10,000 SF) 130 409,200 383,600 -6.3% 470,740
421 SUPERMARKETS 11 7,200,000 6,840,000 -5.0% 6,024,473
422 DISCOUNT STORES & JR DEPT STORES 12 11,375,000 11,300,000 -0.7% 11,623,092
423 MEDIUM DETACHED RETAIL 56 2,200,400 2,117,350 -3.8% 2,334,859
424 FULL LINE DEPARTMENT STORES 7 8,265,000 8,265,000 0.0% 6,776,429
425 NEIGHBORHOOD SHOPPING CENTER 56 3,230,000 2,993,750 -7.3% 3,614,030
426 COMMUNITY SHOPPING CENTER 14 14,725,000 11,352,600 -22.9% 13,972,450
427 REGIONAL SHOPPING CENTER 4 62,750,000 61,500,000 -2.0% 63,250,000
428 VETERINARY CLINIC 16 630,450 630,450 0.0% 696,888
429 MIXED RESID/COMMERCIAL 80 384,000 376,600 -1.9% 700,844
430 RESTAURANT, CAFETERIA, AND/OR BAR 82 873,850 841,100 -3.7% 1,040,548
431 SMALL STRIP CENTER 48 837,900 819,150 -2.2% 963,129
432 CONVENIENCE STORE 67 665,000 621,900 -6.5% 746,631
433 MIXED RETAIL/COMMERCIAL 13 932,700 932,700 0.0% 988,662
434 RETAIL CONDO 7 137,700 133,600 -3.0% 156,071
435 DRIVE-IN RESTAURANT/FOOD SERVICE FACILITY 71 720,700 728,600 1.1% 748,420
437 DAYCARE CENTERS 21 866,800 866,800 0.0% 984,648
441 FUNERAL HOMES 11 792,000 792,000 0.0% 980,327
442 MEDICAL CLINICS & OFFICES 39 464,500 444,300 -4.3% 584,469
443 MEDICAL OFFICE 25 3,179,800 3,000,000 -5.7% 3,298,564
444 FULL SERVICE BANKS 43 1,423,400 1,426,600 0.2% 1,618,437
446 CORPORATE CAMPUS 5 80,000,000 80,000,000 0.0% 82,928,540
447 OFFICE BUILDINGS (1-2 STORIES) 222 852,750 850,000 -0.3% 1,854,858
449 OFFICE BUILDINGS (3 OR MORE STORIES, ELEVATOR) 39 5,020,000 4,845,000 -3.5% 5,736,654
450 CONDOMINIUM OFFICE UNITS 313 243,800 219,400 -10.0% 232,185
451 GAS STATION 16 373,100 348,750 -6.5% 497,900
452 AUTOMOTIVE SERVICE STATION 128 588,850 596,300 1.3% 879,188
453 CAR WASHES 11 346,800 340,700 -1.8% 534,600
454 AUTO CAR SALES & SERVICE 45 2,089,550 2,000,000 -4.3% 2,125,560
455 COMMERCIAL GARGAGE 5 1,035,250 711,400 -31.3% 906,020
457 PARKING RAMP 777,500 777,500
458 COMMERCIAL CONDO OUTLOT 1 100 100 0.0% 100
460 THEATERS 3 3,631,800 5,817,400 60.2% 4,590,200
463 GOLF COURSES 10 883,250 883,250 0.0% 7,004,210
464 BOWLING ALLEYS 4 1,172,000 1,047,250 -10.6% 1,101,625
465 LODGE HALLS & AMUSEMENT PARKS 14 629,650 545,400 -13.4% 548,964
479 FLEX INDUSTRIAL BUILDINGS 156 2,425,000 2,364,150 -2.5% 2,850,726
480 COMMERCIAL WAREHOUSES 282 872,700 848,350 -2.8% 1,500,067
481 MINI WAREHOUSE 14 2,680,100 2,392,200 -10.7% 2,539,486
482 COMMERCIAL TRUCK TERMINALS 10 2,978,550 2,909,650 -2.3% 3,422,290
483 CONDO WAREHOUSE 26 309,900 281,850 -9.1% 292,108
485 RESEARCH & DEVELOPMENT FACILITY 7 7,394,800 5,360,800 -27.5% 9,164,914
490 MARINE SERVICE FACILITY 2 707,300 680,300 -3.8% 680,300
496 MARINA (SMALL BOAT)
498 37 525,000 880,503
499 OTHER COMMERCIAL STRUCTURES 46 588,500 588,500 0.0% 1,201,972
ALL SUBURBS 2,444 767,600 756,200 -1.5% 1,942,742
* Excludes added improvement, and State assessed railroad and utility property Mar-10
* Excludes Vacant Commercial and Industrial Land Parcels
SUBURBAN COMMERCIAL PROPERTY BY LAND USE CODE
2010 Payable 2011 Assessment VS. 2011 Payable 2012Assessment
Page 19
Page 20
PARCEL
COUNT
TOTAL 2010
VALUE TOTAL 2011 VALUE
AGGREGATE
CHANGE
300 INDUSTRIAL LAND 581 142,055,000 145,648,800 2.53%
310 FOOD & DRINK PROCESS PLANTS & STORAGE 17 30,188,500 32,230,100 6.76%
320 FOUNDRIES & HEAVY MANUFACT PLANTS 18 47,918,500 49,556,500 3.42%
330 1 4,500,000
340 MANUFACTURING & ASSEMBLY LIGHT 277 499,855,000 475,901,800 -4.79%
350 INDUSTRIAL WAREHOUSE LIGHT 3 2,557,400
370 SMALL MEDUIUM SHOPS 927,000
390 GRAIN ELEVATORS 1 826,400 1,226,400 48.40%
398 INDUSTRIAL MINIMUM IMPROVEMENTS 14 18,145,100 13,419,800 -26.04%
399 OTHER INDUSTRIAL STRUCTURES 18 25,226,300 20,654,600 -18.12%
400 COMMERCIAL LAND 1355 362,145,700 356,161,600 -1.65%
410 MOTELS & TOURIST CABINS 21 55,307,800 53,613,500 -3.06%
411 HOTELS 21 116,328,400 121,546,800 4.49%
412 NURSING HOMES & PRIVATE HOSPITALS 29 75,031,700 89,574,700 19.38%
413 ASSISTED LIVING 1 1,500,000 1,217,000 -18.87%
415 TRAILER/ MOBILE HOME PARK 25 82,127,500 84,103,400 2.41%
419 OTHER COMMERCIAL HOUSING 2 3,195,000 3,195,000 0.00%
420 SMALL DETACHED RETAIL (UNDER 10,000 SF) 541 221,443,900 211,487,255 -4.50%
421 SUPERMARKETS 30 108,132,300 109,186,700 0.98%
422 DISCOUNT STORES & JR DEPT STORES 17 206,776,500 192,594,600 -6.86%
423 MEDIUM DETACHED RETAIL 90 187,219,000 180,331,000 -3.68%
424 FULL LINE DEPARTMENT STORES 10 90,465,600 82,013,500 -9.34%
425 NEIGHBORHOOD SHOPPING CENTER 82 300,018,300 279,268,900 -6.92%
426 COMMUNITY SHOPPING CENTER 24 306,063,900 314,554,200 2.77%
427 REGIONAL SHOPPING CENTER 4 255,500,000 253,000,000 -0.98%
428 VETERINARY CLINIC 26 14,030,700 15,226,700 8.52%
429 MIXED RESID/COMMERCIAL 655 347,179,900 333,222,100 -4.02%
430 RESTAURANT, CAFETERIA, AND/OR BAR 210 156,176,600 147,399,600 -5.62%
431 SMALL STRIP CENTER 76 73,142,500 73,771,000 0.86%
432 CONVENIENCE STORE 140 95,161,400 90,484,300 -4.91%
433 MIXED RETAIL/COMMERCIAL 39 32,082,000 33,256,600 3.66%
434 RETAIL CONDO 12 5,302,900 5,262,400 -0.76%
435 DRIVE-IN RESTAURANT/FOOD SERVICE FACILITY 135 89,460,400 92,318,700 3.20%
437 DAYCARE CENTERS 34 28,787,000 29,011,800 0.78%
441 FUNERAL HOMES 29 24,681,900 24,595,600 -0.35%
442 MEDICAL CLINICS & OFFICES 104 61,710,100 62,383,100 1.09%
443 MEDICAL OFFICE 49 237,282,300 230,381,700 -2.91%
444 FULL SERVICE BANKS 78 134,795,900 131,408,100 -2.51%
446 CORPORATE CAMPUS 5 415,707,300 414,642,700 -0.26%
447 OFFICE BUILDINGS (1-2 ST) 476 718,447,000 650,639,000 -9.44%
449 OFFICE BUILDINGS 3 + ST 118 1,014,463,300 927,873,300 -8.54%
450 CONDOMINIUM OFFICE UNITS 458 141,173,200 132,567,300 -6.10%
451 GAS STATION 33 17,483,000 15,235,900 -12.85%
452 AUTOMOTIVE SERVICE STATION 321 201,821,100 193,476,900 -4.13%
453 CAR WASHES 21 11,014,000 9,983,900 -9.35%
454 AUTO CAR SALES & SERVICE 74 104,991,700 105,072,800 0.08%
455 COMMERCIAL GARAGES 6 4,750,000 4,585,100 -3.47%
456 PARKING GARAGE/STRUCTURE 10 6,533,700 6,417,900 -1.77%
457 PARKING RAMP 57 47,693,100 45,397,600 -4.81%
458 COMMERCIAL CONDO OUTLOT 1 100
460 THEATERS 5 20,474,600 15,020,600 -26.64%
463 GOLF COURSES 23 112,867,400 120,287,600 6.57%
464 BOWLING ALLEYS 5 6,305,300 5,707,800 -9.48%
465 LODGE HALLS & AMUSEMENT PARKS 31 17,748,300 16,063,100 -9.49%
479 FLEX INDUSTRIAL BUILDINGS 199 547,427,100 590,511,540 7.87%
480 COMMERCIAL WAREHOUSES 696 953,411,300 890,454,900 -6.60%
481 MINI WAREHOUSE 26 63,686,900 61,713,100 -3.10%
482 COMMERCIAL TRUCK TERMINALS 15 44,741,600 40,837,300 -8.73%
483 CONDO WAREHOUSE 37 27,282,600 13,885,400 -49.11%
485 RESEARCH & DEVELOPMENT FACILITY 9 85,145,000 75,028,800 -11.88%
490 MARINE SERVICE FACILITY 2 1,414,600 1,360,600 -3.82%
496 MARINA (SMALL BOAT)
498 COMMERCIAL MINIMUM IMPROVEMENT 61 48,194,800 48,726,700 1.10%
499 OTHER COMMERCIAL STRUCTURES 112 105,427,700 90,928,200 -13.75%
* Excludes added improvement, and State assessed railroad and utility property
Mar-10
LAND USE CODE
AGGREGATE CHANGE FOR COUNTYWIDE COMMERCIAL VALUES - BY LAND USE CODE
2010 PAYABLE 2011 VS 2011 PAYABLE 2012
Page 20
Page 21
Change in
Assessed Value
Number of
Parcels
<=-50% 96
-40% to -50% 113
-30% to -40% 244
-20% to -30% 933
-10% to -20% 12,631
0% to -10% 58,566
0 37,159
0% to 10% 886
10% to 20% 398
20% to 30% 171
30% to 40% 68
40% to 50% 34
50% or More 60
96 113 244 933
12,631
58,566
37,159
886 398 171 68 34 60
<=-50% -40% to -50%
-30% to -40%
-20% to -30%
-10% to -20%
0% to -10%
0 0% to 10%
10% to 20%
20% to 30%
30% to 40%
40% to 50%
50% or More
PERCENT CHANGE
ESTIMATED MARKET VALUE PERCENT CHANGES FROM 2010 TO 2011 (SINGLE FAMILY - RAMSEY COUNTY-WIDE)
Page 21
Page 22
Change in Assessed
Value
Number of
Parcels
<=-50% 85
-40% to -50% 104
-30% to -40% 220
-20% to -30% 747
-10% to -20% 5,874
0% to -10% 27,825
0 21,018
0% to 10% 539
10% to 20% 262
20% to 30% 112
30% to 40% 46
40% to 50% 27
50% or More 43
85 104 220 747
5,874
27,825
21,018
539 262 112 46 27 43
<=-50% -40% to -50%
-30% to -40%
-20% to -30%
-10% to -20%
0% to -10%
0 0% to 10%
10% to 20%
20% to 30%
30% to 40%
40% to 50%
50% or More
ESTIMATED MARKET VALUE PERCENT CHANGES FROM 2010 TO 2011 (SINGLE FAMILY - CITY OF SAINT PAUL)
Page 22
Page 23
Change in Assessed
Value
Number of
Parcels
<=-50% 11
-40% to -50% 9
-30% to -40% 24
-20% to -30% 186
-10% to -20% 6,757
0% to -10% 30,741
0 16,141
0% to 10% 347
10% to 20% 136
20% to 30% 59
30% to 40% 22
40% to 50% 7
50% or More 17
11 9 24 186
6,757
30,741
16,141
347 136 59 22 7 17
<=-50% -40% to -50%
-30% to -40%
-20% to -30%
-10% to -20%
0% to -10%
0 0% to 10%
10% to 20%
20% to 30%
30% to 40%
40% to 50%
50% or More
ESTIMATED MARKET VALUE PERCENT CHANGES FROM 2010 TO 2011(SINGLE FAMILY - SUBURBAN RAMSEY COUNTY)
Page 23
Page 24
Change in
Assessed Value
Number of
Parcels
<=-50% 89
-40% to -50% 6
-30% to -40% 28
-20% to -30% 87
-10% to -20% 47
0% to -10% 508
0 1,055
0% to 10% 649
10% to 20% 35
20% to 30% 4
30% to 40% 0
40% to 50% 1
50% or More 9
89 6 28 87 47
508
1,055
649
35 4 0 1 90
200
400
600
800
1,000
1,200
<=-50%-40% to -50%
-30% to -40%
-20% to -30%
-10% to -20%
0% to -10%
0 0% to 10%
10% to 20%
20% to 30%
30% to 40%
40% to 50%
50% or More
APARTMENT GROWTH RATES 2010 TO 2011 ASSESSMENTS (RAMSEY COUNTY)
Page 24
Page 25
2010 Growth Stratification for St. Paul Apartments
Change in
Assessed Value
Number of
Parcels
<=-50% 74
-40% to -50% 6
-30% to -40% 22
-20% to -30% 74
-10% to -20% 43
0% to -10% 358
0 845
0% to 10% 424
10% to 20% 34
20% to 30% 4
30% to 40% 0
40% to 50% 1
50% or More 7
746 22 74 43
358
845
424
34 4 0 1 70
100200300400500600700800900
<=-50%
-40% to -
50%
-30% to -
40%
-20% to -
30%
-10% to -
20%
0% to -10%
0 0% to 10%
10% to 20%
20% to 30%
30% to 40%
40% to 50%
50% or More
APARTMENT GROWTH RATES 2010TO 2011 ASSESSMENTS (SAINT PAUL PROPERTIES ONLY)
Page 25
Page 26
Change in
Assessed Value
Number of
Parcels
<=-50% 15
-40% to -50% 0
-30% to -40% 6
-20% to -30% 13
-10% to -20% 4
0% to -10% 150
0 210
0% to 10% 225
10% to 20% 1
20% to 30% 0
30% to 40% 0
40% to 50% 0
50% or More 2
0 6 13 4
150
210 225
1 0 0 0 2 0
50
100
150
200
250
-40% to -50%
-30% to -40%
-20% to -30%
-10% to -20%
0% to -10%
0 0% to 10%
10% to 20%
20% to 30%
30% to 40%
40% to 50%
50% or More
APARTMENT GROWTH RATES 2010 TO 2011 ASSESSMENTS (SUBURBAN APARTMENT ONLY)
Page 26
Page 27
Change in
Assessed
Value
Number of
Parcels
<=-50% 409
-40% to -50% 130
-30% to -40% 109
-20% to -30% 129
-10% to -20% 451
0% to -10% 2,573
0 3,545
0% to 10% 107
10% to 20% 46
20% to 30% 12
30% to 40% 7
40% to 50% 8
50% or More 12
409 130 109 129
451
2,573
3,545
107 46 12 7 8 12 0
500 1,000 1,500 2,000 2,500 3,000 3,500 4,000
<=-50%
-40% to -
50%
-30% to -
40%
-20% to -
30%
-10% to -
20%
0% to -10%
0 0% to 10%
10% to 20%
20% to 30%
30% to 40%
40% to 50%
50% or More
COMMERCIAL - INDUSTRIAL GROWTH RATES 2010 TO 2011 ASSESSMENTS (ALL OF RAMSEY COUNTY PROPERTIES)
Page 27
Page 28
Change in Assessed
Value
Number of
Parcels
<=-50% 362
-40% to -50% 107
-30% to -40% 83
-20% to -30% 85
-10% to -20% 178
0% to -10% 1,515
0 2,042
0% to 10% 53
10% to 20% 30
20% to 30% 9
30% to 40% 3
40% to 50% 4
50% or More 11
362 107 83 85 178
1,515
2,042
53 30 9 3 4 11 0
500
1,000
1,500
2,000
2,500
<=-50%
-40% to -
50%
-30% to -
40%
-20% to -
30%
-10% to -
20%
0% to -10%
0 0% to 10%
10% to 20%
20% to 30%
30% to 40%
40% to 50%
50% or More
COMMERCIAL - INDUSTRIAL GROWTH RATES 2010TO 2011 ASSESSMENTS (SAINT PAUL PROPERTIES ONLY)
Page 28
Page 29
Change in Assessed
Value
Number of
Parcels
<=-50% 47
-40% to -50% 23
-30% to -40% 26
-20% to -30% 44
-10% to -20% 273
0% to -10% 1,058
0 1,503
0% to 10% 54
10% to 20% 16
20% to 30% 3
30% to 40% 4
40% to 50% 4
50% or More 1
47 23 26 44
273
1,058
1,503
54 16 3 4 4 1 0
200 400 600 800
1,000 1,200 1,400 1,600
<=-50%
-40% to -
50%
-30% to -
40%
-20% to -
30%
-10% to -
20%
0% to -10%
0 0% to 10%
10% to 20%
20% to 30%
30% to 40%
40% to 50%
50% or More
COMMERCIAL - INDUSTRIAL GROWTH RATES 2010 TO 2011 ASSESSMENTS (SUBURBAN PROPERTIES ONLY)
Page 29