106
Office of the Environmental Protection Authority Annual Report 2015 - 2016 September 2016

Office of the Environmental Protection Authority
Annual Report 2015 - 2016
September 2016

Statement of Compliance
For year ended 30 June 2016
Hon Albert Jacob
Minister for Environment
In accordance with section 63 of the Financial Management Act 2006, I hereby submit for your information and presentation to Parliament, the Annual Report of the Office of the Environmental Protection Authority for the financial year ended 30 June 2016.
The Annual Report has been prepared in accordance with the provisions of the Financial Management Act 2006.
Kim Taylor
Accountable Authority
8 September 2016
ContactsPostal
Locked Bag 10
East Perth WA 6892
Address
Level 8, The Atrium
168 St Georges Terrace
Perth WA 6000
Electronic
w. www.epa.wa.gov.au
p. 08 6145 0800
t. @EPA_WA
This report is available in alternative formats upon request.
National Relay Service TTY: 133 677(To assist persons with hearing and voice impairment)

Office of the Environmental Protection Authority Annual Report 2015 - 2016 | 1
General Manager’s forewordThe Office of the Environmental Protection Authority was established in 2009 to support the Environmental Protection Authority and work with other Government departments to ensure environmental values are protected and development is managed in an environmentally responsible manner.
The OEPA provides two key services to the EPA:
• Environmental Impact Assessment services involving environmental impact assessment of significant development proposals and planning schemes, and
• Environmental Management services involving development of policies, guidelines and strategic advice to protect the environment and manage environmental impacts.
A total of 285 development proposals and planning schemes were referred to the EPA for consideration in 2015–16. Of these, the EPA determined that ten development proposals warranted formal environmental impact assessment. A further eight did not require formal assessment but specific advice was provided to the development proponents and government departments.
Eighteen environmental impact assessment reports were prepared for the EPA and published in 2015–16, covering a diverse range of mining, industrial, infrastructure and oil and gas projects.
For the Department’s key performance indicators, the EPA reported an 88 per cent satisfaction rating for 2015–16 that the OEPA’s Environmental Impact Assessment services were in line with Best Practice Principles.
As part of the Department’s Environmental Management services to the EPA, two new Environmental Protection Bulletins and a Technical Guide were released by the EPA.
The OEPA also continued to work with the Authority to review and enhance its policy framework. During the year, a Legal and Governance Review of the EPA’s policy framework and policies was undertaken. The report of the review, led by Mr Peter Quinlan SC, was completed in May 2016 and made a number of recommendations, including that there be a broad review of the EPA’s policies and guidelines under a new policy framework. The OEPA has now begun the work to support the review of the EPA’s policies in line with the findings, and this will continue into 2016–17.
The OEPA received a 97 per cent satisfaction rating from the EPA for the provision of environmental management services as part of its key performance criteria for 2015-16.

Office of the Environmental Protection Authority Annual Report 2015 - 20162 |
In addition to the Department’s services to the EPA the OEPA is directly responsible to the Minister for Environment, providing support on a range of environmental matters, including administering and auditing the compliance of development proposals with their Ministerial environmental approval conditions.
During the year, the OEPA completed 60 compliance audits of development proposals with a Very High and High priority rating across the State. These included waste management facilities, port and rail infrastructure, oil and gas facilities, chemical processing and manufacturing facilities, power generation facilities, and coal, diamond, gold, iron ore, mineral sands and nickel mines.
Almost all projects – 98 per cent – were found to be compliant with Ministerial conditions as part of these audits. Where proposals were found to be non-compliant, the OEPA ensured remedial action was taken in every case within the time specified.
During 2015–16 the OEPA continued to encourage public participation in the EPA’s and Department’s processes. All opportunities to comment and make formal submissions are promoted and managed through a “consultation hub”. This provides a comprehensive platform for online consultation that enables the EPA and OEPA to manage all its consultation activity, publish and promote EIA and other consultations and surveys, analyse and report on responses, and provide feedback to the public.
The consultation hub includes a mailing list that notifies subscribers by email when new items are published. During 2015–16, public comment was invited on 49 items, and a total of 7,247 responses were received.
As part of the Department’s commitment to continuous improvement, the OEPA maintained its practice of inviting development proponents to provide feedback on the assessment process and their communications with the OEPA. This included feedback on the suitability of policy and guidance material, on the proponent’s interaction with OEPA officers, and on timeliness of assessments.
Overall, the response during 2015–16 was positive and supports the OEPA’s approach to assessment and the provision of timely and professional advice to proponents, and I acknowledge the dedication and professionalism of the staff of the OEPA.
Kim Taylor
GENERAL MANAGER

Office of the Environmental Protection Authority Annual Report 2015 - 2016 | 3
OvERviEw AGEncy PERfORMAncE siGnificAnt issuEs disclOsuREscOntEnts
General Manager’s foreword 1
Contents 3
Overview 7Executive summary 7
Performance highlights 7
Operational structure 7Enabling legislation 8Responsible Minister 8Organisational structure 8
Our Vision 8Our purpose 8Organisational chart 9
Administered legislation 10Subsidiary legislation 10Other key legislation impacting on the OEPA’s activities 10
Performance Management Framework 11Outcome-based Management Framework 11Changes to Outcome Based Management Framework 12Shared responsibilities with other agencies 12
Agency performance 13Report on operations 13
Actual results versus budget targets 13Financial targets 13Working cash targets 13Government Desired Outcomes, Key Effectiveness Indicators and Targets 14Services, Key Efficiency Indicators and Targets 14
Environmental Impact Assessment Services to the EPA 15Overview 15Environmental impact assessment of mining proposals 17
Case Study: Christmas Creek Iron Ore Mine Expansion 18Case study: Hazelmere Wood Waste to Energy Plant 19
Environmental impact assessment of infrastructure proposals 20Case Study: Forrestfield Airport Link – Public Transport Authority 21
Environmental impact assessment of planning schemes and scheme amendments 22Post-assessment changes and offsets in the Pilbara 22
Environmental Management Services to the EPA 24Perth and Peel Strategic Assessment (Green Growth Plan) 24
contents

Office of the Environmental Protection Authority Annual Report 2015 - 20164 |
OvERviEw AGEncy PERfORMAncE siGnificAnt issuEs disclOsuREscOntEnts
New and revised policy and guidance 25State Government Environmental Policy 26Revocation of three Environmental Protection Policies 26
Compliance monitoring services to the Minister 26Compliance and audit activity 27Significant proposals audited 28
Improving our business - EIA reform 28Close out letter from the General Manager – feedback from proponents 28Public consultation 29
Significant issues impacting the OEPA 31Current and emerging issues and trends 31
Economic and social trends 31
Changes in written law 32
Likely developments and forecast result of operations 32
Disclosures, Financial Statements and Key Performance Indicators 33Independent Auditor’s Report 33
To the Parliament of Western Australia 33
Financial Statements 37Certification of Financial Statements 37Statement of Comprehensive Income 38Statement of Financial Position 39Statement of Changes in Equity 40Statement of Cash Flows 41Schedule of Income and Expenses by Service 42Schedule of Assets and Liabilities by Service 43Summary of Consolidated Account Appropriations and Income Estimates 44Notes to the Financial Statements 45
Key Performance Indicators 78Certification of Key Performance Indicators 78Detailed Key Performance Indicators 79Outcomes and Key Effectiveness Indicators 80Services and Key Efficiency Indicators 86
Other disclosures 89Ministerial directives 89Other financial disclosures 89
Pricing policies of services provided 89Employment and Industrial Relations 89
Staff Profile 89Staff development 89
Office of the Environmental Protection Authority Annual Report 2015 - 2016 | 5
OvERviEw AGEncy PERfORMAncE siGnificAnt issuEs disclOsuREscOntEnts
Workers compensation 89Unauthorised Use of Credit Cards 89
Governance disclosures 90Contracts with Senior Officers 90Board remuneration 90
Other legal requirements 91Expenditure on advertising, market research, polling and direct mail 91Disability access and inclusion plan outcomes 91Compliance with Public Sector Standards and ethical codes 92Record keeping plan 92
Record keeping training 93Retention and disposal policy 93Government policy requirements 93
Occupational safety, health and injury management 93
Appendix 1: Public reports and recommendations to the Minister for Environment 96
Appendix 2: Section 45C approved changes to proposals 98
Appendix 3: Other publications 101

Office of the Environmental Protection Authority Annual Report 2015 - 20166 |
OvERviEw AGEncy PERfORMAncE siGnificAnt issuEs disclOsuREscOntEnts
Office of the Environmental Protection Authority Annual Report 2015 - 2016 | 7
OvERviEw AGEncy PERfORMAncE siGnificAnt issuEs disclOsuREscOntEnts
Overview Executive summary
Performance highlights• Eighteen environmental impact assessments were completed and reports
prepared for the EPA during the year covering a diverse range of mining, industrial, infrastructure and oil and gas projects.
• The EPA’s satisfaction with the OEPA’s environmental impacts assessment services was 88%.
• A comprehensive Legal and Governance Review was completed of the EPA’s policy framework and policies, and work commenced on actions to simplify and streamline the policy framework and policies in line with findings of the review.
• The EPA’s satisfaction with the OEPA’s environmental management services involving development of policies, guidelines and strategic advice to protect the environment was 97%.
• 98% of development projects audited during the year were compliant with Ministerial statement approval conditions.
• Remedial actions were implemented by development proponents within specified times in each case where non-compliance was determined.
Operational structureThe OEPA delivers its services through three divisions:• Assessment and Compliance• Strategic Policy and Planning• Business Operations
The Assessment and Compliance Division provides environmental impact assessment support to the EPA for significant proposals (that is, proposals involving major projects, industrial, mining, petroleum and infrastructure developments) and strategic proposals. The division also monitors compliance with Ministerial approval conditions.
The division:• is responsible for administering the environmental impact assessment
processes on behalf of the EPA, for significant proposals and strategic proposals;
• provides environmental impact assessment advice to the EPA on all major infrastructure proposals;
• prepares draft EPA reports and recommendations to the Minister for Environment on environmental assessments;
• assists the Minister for Environment in issuing and managing Ministerial approval statements and conditions of implementation; and
• monitors the implementation of proposals.

Office of the Environmental Protection Authority Annual Report 2015 - 20168 |
OvERviEw AGEncy PERfORMAncE siGnificAnt issuEs disclOsuREscOntEnts
The Strategic Policy and Planning Division provides advice and support to the EPA, the Minister for Environment and other parts of Government by:
• providing technical and policy advice in relation to environmental impact assessment of significant proposals and schemes;
• providing technical and policy advice on environment issues in general;• coordinating the development, analysis, implementation and review of
environmental policies and guidelines;• managing the formulation and review of statutory Environmental
Protection Policies;• providing environmental impact assessment advice to the EPA on major
subdivisions, town planning schemes and amendments and regional schemes;
• Preparing strategic advice on emerging environmental issues;• providing media liaison and internal and external communications
services; and• identifying emerging environmental pressures and innovative technical or
policy solutions.
During 2015–16, the Business Operations Division provided services including ministerial liaison, legal advice and Freedom of Information (FOI) and financial management, as well as executive support and administrative services to the EPA. This division also facilitated and administered the service agreements with the Department of Parks and Wildlife during the year.
Enabling legislationThe Office of the Environmental Protection Authority (OEPA) was established as a department in 2009 under the Public Sector Management Act 1994, and provides its services to the Environmental Protection Authority under the provisions of section 17A of the Environmental Protection Act 1986 (EP Act).
Responsible MinisterDuring 2015–16 the OEPA reported to the Honourable Albert Jacob MLA, Minister for Environment.
Organisational structureOur VisionAn environment that is highly valued and protected.
Our purposeWe support the EPA and work with other departments, industry and the community to ensure environmental values are protected and development is managed in an environmentally responsible manner.
The OEPA is also responsible for administering s48 of the EP Act in auditing compliance with conditions set under these Ministerial approval statements,

Office of the Environmental Protection Authority Annual Report 2015 - 2016 | 9
OvERviEw AGEncy PERfORMAncE siGnificAnt issuEs disclOsuREscOntEnts
Business Processes
Information Management
Executive and administrative support to the EPA
Strategic Policy
Terrestrial Ecosystems
Marine Ecosystems
Environmental Planning
Communications
Mining and Industrial Assessments North
Mining and Industrial Assessments South
Infrastructure Assessments
Compliance
Business Improvement
ASSESSMENT AND COMPLIANCE
Anthony Sutton
STRATEGIC POLICY AND PLANNING
Naomi Arrowsmith
BUSINESS OPERATIONSSteve Beilby
OEPA GENERAL MANAGER
Kim Taylor
MINISTER FOR ENVIRONMENT
Hon Albert Jacob MLA
ENVIRONMENTAL PROTECTION AUTHORITYChairman Dr Tom Hatton
Organisational chart

Office of the Environmental Protection Authority Annual Report 2015 - 201610 |
OvERviEw AGEncy PERfORMAncE siGnificAnt issuEs disclOsuREscOntEnts
reporting on non-compliance to the Minister, and undertaking enforcement action as necessary on behalf of the Minister.
Administered legislationThe OEPA provides services to the EPA to enable it to undertake its statutory functions, in accordance with s17A of the Environmental Protection Act 1986 (EP Act).
In servicing the EPA, the OEPA conducts environmental impact assessment (EIA) of significant development proposals and planning schemes. It also develops statutory policies, guidelines and strategic advice to manage environmental impacts and protect the environment.
This support helps the EPA provide the Minister for Environment with EIA reports and recommendations on proposals and schemes, and with advice on environmental policy and environmental issues generally.
In line with s22(1), the OEPA is directly responsible for servicing the Minister in performance of his functions under the EP Act, particularly for granting and managing Ministerial approval statements for projects under Divisions 2 and 3 of Part IV of the EP Act.
The OEPA is also responsible for administering s48 of the EP Act in auditing compliance with conditions set under these Ministerial approval statements, reporting on non-compliance to the Minister, and undertaking enforcement action as necessary on behalf of the Minister.
subsidiary legislationSubsidiary legislation relevant to the OEPA’s functions includes:
• Environmental Protection Regulations 1987• Environmental Protection (Peel Inlet – Harvey Estuary) Policy 1992• Environmental Protection (Kwinana) (Atmospheric Wastes) Policy 1999• Environmental Protection (Kwinana) (Atmospheric Wastes) Regulations
1992• Environmental Protection (Goldfields Residential Areas) (Sulphur Dioxide)
Policy 2003• Environmental Protection (Goldfields Residential Areas) (Sulphur Dioxide)
Regulations 2003• Environmental Protection (Western Swamp Tortoise Habitat) Policy 2011.It should be noted that other parts of the EP Act are administered by the Department of Environment Regulation.
Other key legislation impacting on the OEPA’s activitiesIn the performance of its functions, the OEPA complies with the following relevant written laws:

Office of the Environmental Protection Authority Annual Report 2015 - 2016 | 11
OvERviEw AGEncy PERfORMAncE siGnificAnt issuEs disclOsuREscOntEnts
• Auditor General Act 2006;• Contaminated Sites Act 2003;• Disability Services Act 1993;• Equal Opportunity Act 1984;• Financial Management Act 2006;• Freedom of Information Act 1992; • Industrial Relations Act 1979;• Minimum Conditions of Employment Act 1993;• Occupational Safety and Health Act 1984;• Public Sector Management Act 1994;• Salaries and Allowances Act 1975;• State Records Act 2000; and • State Supply Commission Act 1991.
Performance Management framework
Outcome-based Management frameworkEach year the OEPA is required to meet a number of targets set by the State Government. These targets relate to Government-desired outcomes, financial management, services to be delivered and performance targets to be achieved. The agreement is a transparent way for the State Government to monitor the operational performance of the OEPA.
The OEPA evaluates, measures and reports on the effectiveness of its services in achieving its desired agency level outcomes through Key Performance Indicators or ‘KPIs’. KPIs comprise both Effectiveness and Efficiency Indicators.
Effectiveness Indicators show the extent to which the department achieved its department-level outcome and the Efficiency Indicators show the cost of services delivered by the department.
The OEPA’s management framework is consistent with the Government goal for social and environmental responsibility, which is to ensure that economic activity is managed in a socially and environmentally responsible manner for the long-term benefit of the State.
The desired outcome is provision of quality advice to the EPA and the Minister for Environment on significant proposals, compliance and environmental issues.
To achieve this outcome, the OEPA performs three services:1. Environmental Impact Assessment Services to the EPA2. Environmental Management Services to the EPA3. Compliance Monitoring Services to the Minister

Office of the Environmental Protection Authority Annual Report 2015 - 201612 |
OvERviEw AGEncy PERfORMAncE siGnificAnt issuEs disclOsuREscOntEnts
changes to Outcome Based Management frameworkThe Office of the EPA’s Outcome Based Management Framework did not change during 2015-16.
shared responsibilities with other agenciesThe Office of the EPA did not share any responsibilities with other agencies in 2015-16.
DESIRED OUTCOMEQuality advice to the Environmental Protection Authority (EPA) and Minister
for Environment (the Minister) on significant proposals, compliance and environmental issues.
GOVERNMENT GOALSocial and environmental responsibility
Ensuring that economic activity is managed in a socially and environmentally responsible manner for the long-term benefit of the State.
Service 1: Environmental Impact Assessment Services to the EPA
KEY EFFECTIVENESS INDICATORS f The EPA’s satisfaction with the Office of the
Environmental Protection Authority’s (OEPA) Environmental Impact Assessment (EIA) services, during the year, in line with Best Practice Principles of EIA
f Percentage of project-specific conditions which did not require significant change following the appeal process
f Percentage of assessments that met agreed timelines
KEY EFFICIENCY INDICATOR
f Cost per Standardised Unit of Assessment Output
Service 2: Environmental Management Services to the EPA
KEY EFFECTIVENESS INDICATORS f The EPA’s satisfaction with the OEPA’s provision
of environmental management services during the year
KEY EFFICIENCY INDICATOR
f Cost per Standardised Unit of Environmental Management Services Output
Service 3: Compliance Monitoring Services to the Minister
KEY EFFECTIVENESS INDICATORS f Percentage of all projects that have been audited
that are compliant with the Ministerial conditions f Percentage of non-compliances where remedial
action has been taken by the proponent within the time specified in the Notice of Non-Compliance
KEY EFFICIENCY INDICATOR
f Average Cost per Environmental Audit Completed

Office of the Environmental Protection Authority Annual Report 2015 - 2016 | 13
OvERviEw AGEncy PERfORMAncE siGnificAnt issuEs disclOsuREscOntEnts
Agency performance
Report on operations Actual results versus budget targetsEach year the OEPA is required to meet a number of targets set by the State Government. These targets relate to Government-desired outcomes, financial management, services to be delivered and performance targets to be achieved. The agreement is a transparent way for the State Government to monitor the operational performance of the OEPA.
The OEPA evaluates, measures and reports on the effectiveness of its services in achieving its desired agency level outcomes through Key Performance Indicators or ‘KPIs’. KPIs comprise both Effectiveness and Efficiency Indicators.
Effectiveness Indicators show the extent to which the department achieved its department-level outcome and the Efficiency Indicators show the cost of services delivered by the department, as summarised in the tables below.
Financial targets2015–16 Target(1)
$,000
2015–16 Actual $,000
Variation (2)
$,000Total cost of services (i.e. endorsed expense limit)
14,448 14,102 346
Net cost of services (details in the Income Statement)
14,150 14,078 72
Total equity (details in the Statement of Financial Position)
(1,130) (440) (690)
Agreed salary expense level 11,543 9,860 1,683
(1) As specified in Budget Papers(2) Further explanations are contained in Note 27 ‘Explanatory statement’ to the financial statements.
Working cash targets
2015–16 Agreed
limit $,000
2015–16 Target (1)/Actual (2)
$,000
Variation (2)
$,000
Working cash limit (at Budget) 738 738 –Working cash limit (at Actuals) 738 714 24
Office of the Environmental Protection Authority Annual Report 2015 - 201614 |
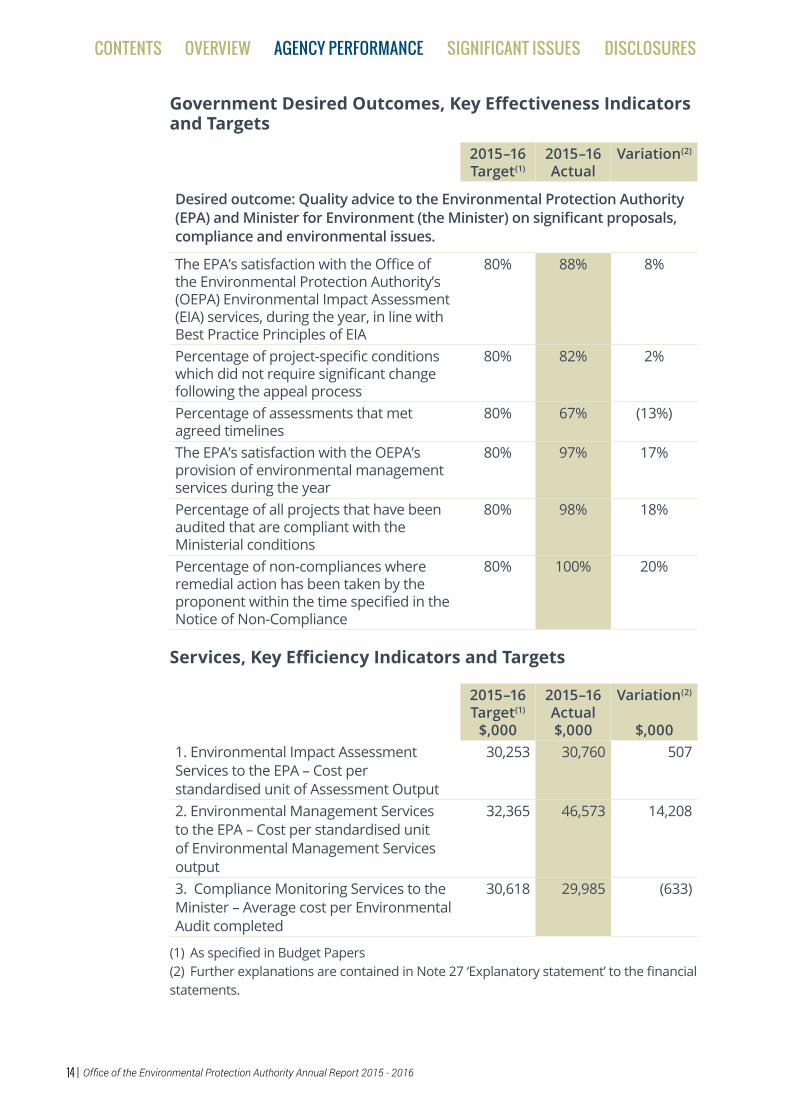
Government Desired Outcomes, Key Effectiveness Indicators and Targets
2015–16 Target(1)
2015–16 Actual
Variation(2)
Desired outcome: Quality advice to the Environmental Protection Authority (EPA) and Minister for Environment (the Minister) on significant proposals, compliance and environmental issues.
The EPA’s satisfaction with the Office of the Environmental Protection Authority’s (OEPA) Environmental Impact Assessment (EIA) services, during the year, in line with Best Practice Principles of EIA
80% 88% 8%
Percentage of project-specific conditions which did not require significant change following the appeal process
80% 82% 2%
Percentage of assessments that met agreed timelines
80% 67% (13%)
The EPA’s satisfaction with the OEPA’s provision of environmental management services during the year
80% 97% 17%
Percentage of all projects that have been audited that are compliant with the Ministerial conditions
80% 98% 18%
Percentage of non-compliances where remedial action has been taken by the proponent within the time specified in the Notice of Non-Compliance
80% 100% 20%
Services, Key Efficiency Indicators and Targets
2015–16 Target(1)
$,000
2015–16 Actual $,000
Variation(2)
$,0001. Environmental Impact Assessment Services to the EPA – Cost per standardised unit of Assessment Output
30,253 30,760 507
2. Environmental Management Services to the EPA – Cost per standardised unit of Environmental Management Services output
32,365 46,573 14,208
3. Compliance Monitoring Services to the Minister – Average cost per Environmental Audit completed
30,618 29,985 (633)
(1) As specified in Budget Papers(2) Further explanations are contained in Note 27 ‘Explanatory statement’ to the financial statements.
OvERviEw AGEncy PERfORMAncE siGnificAnt issuEs disclOsuREscOntEnts

Office of the Environmental Protection Authority Annual Report 2015 - 2016 | 15
Environmental impact Assessment services to the EPA OverviewA total of 285 development proposals and planning schemes were referred to the EPA for consideration in 2015–16, a decrease of approximately 13 per cent from 2014–15.
Of these, the EPA determined that ten development proposals warranted formal assessment. A further eight did not require assessment but specific advice was provided to proponents.
Figure 1 shows the development proposals referred, and a breakdown of the decisions on level of assessment – Public Environmental Review (PER), Assessment on Proponent Information - Category A (API A) and Assessment on Proponent Information - Category B (API B). The decrease in numbers received over the last few years is evident.
The graph also gives a breakdown of where referrals were examined and preliminary investigations and inquiries led to a decision that formal assessment was not warranted.
In May 2016, in response to community feedback that indicated there was a perception that a “Not Assess” decision on a referral meant there had been no serious consideration of a proposal, the EPA amended the way it communicated those decisions to better reflect the level of examination of all referrals received.
0
10
20
30
40
50
60
70
80
90
2012-13 2013-14 2014-15 2015-16
Total received Assess - API A Assess - API B
Assess - PER Assess - Derived proposal Not assessed - managed under Part V
Not assessed - Public advice given Not assessed - no advice given
Figure 1: Breakdown of referrals of development proposals (s38)
OvERviEw AGEncy PERfORMAncE siGnificAnt issuEs disclOsuREscOntEnts

Office of the Environmental Protection Authority Annual Report 2015 - 201616 |
Figure 2: Breakdown of referrals of schemes and scheme amendments (s48)
Figure 2 shows a slight fall in the number of schemes and scheme amendments referred during the year. While none of these warranted formal assessment, the EPA provided advice on 30 scheme amendments.
During 2015–16, the EPA completed 18 reports, with the type and number of assessments shown in Table 1. A list of all proposals assessed is shown in Appendix 1.
Table 1: Completed assessments
Type of assessment 2014–15 2015–16Public Environmental Review and Environmental Review and Management Programme
6 6
Assessment on Proponent Information – Category A
9 6
Assessment on Proponent Information – Category B
2 0
Changes to Conditions – Section 46 14 6Total 31 18
Table 1 includes EPA Report 1569 (Perth to Darwin National Highway) which was completed and transmitted to the Minister for Environment in June 2015, but released publicly on 4 July 2015.
0
50
100
150
200
250
300
2012-13 2013-14 2014-15 2015-16
Not assessed - no advice given
Not assessed - Advice given
Scheme incapable of being made environmentally acceptable
Scheme assessed - Environmental Review
Total received
OvERviEw AGEncy PERfORMAncE siGnificAnt issuEs disclOsuREscOntEnts

Office of the Environmental Protection Authority Annual Report 2015 - 2016 | 17
Figure 3: Location of assessments completed during 2015–16
Environmental impact assessment of mining proposalsThe EPA completed eight assessments for mining proposals during 2015–16: three Public Environmental Review (PER) assessments and five Assessment on Proponent Information (API) – Category A assessments. Iron ore proposals dominated the assessment portfolio with six (75%) completed assessments. Of the iron ore assessments, all proposals are located in the Pilbara region.
The time taken for the completion of API – Category A assessments for mining proposals remained fairly consistent with the previous year with an average assessment time of approximately four months
Expansions to existing projects, a trend that began increasing in the 2014–15 year, continued throughout 2015–16 year. There has been a decrease in the number of new mine proposals referred to the EPA. Of the ten proposals referred during 2015–16 which the EPA decided to formally assess, eight are mining proposals (80%), of which four are proposals relating to iron ore
PILBARA
MID WEST
GOLDFIELDS/ESPERANCE
KIMBERLEY
GASCOYNE
WHEATBELT
SOUTHWEST GREAT SOUTHERN
PERTHPEEL
Legend
! Mining - Iron Ore
") Mining - Mineral Sands
!( Mining - Other
! Oil and Gas
Infrastructure")
OvERviEw AGEncy PERfORMAncE siGnificAnt issuEs disclOsuREscOntEnts

Office of the Environmental Protection Authority Annual Report 2015 - 201618 |
mines (50%). This is a decrease on 2014–15 year numbers where iron ore mines accounted for 75%. However, mining proposals continue to dominate the assessment workload, as 18 mining proposals are currently under assessment representing 62% of the assessment workload.
Assessments on uranium mine proposals will feature prominently in the 2016–17 year with three currently under assessment. The OEPA continues to consider the important role of other State agencies in maintaining a consistent approach to assessment and regulation of uranium projects.
Case Study: Christmas Creek Iron Ore Mine ExpansionThe proposal, by Fortescue Metals Group, is to expand the operating Christmas Creek Mine, approximately 111 kilometres north-north-east of Newman in the Pilbara region of Western Australia. The proposal includes additional mine pits, waste landforms, tailings storage facilities and associated mine infrastructure. It will require additional clearing of approximately 8,000 ha and additional abstraction and injection of groundwater of over 50 gigalitres per year. This will enable ore production to continue at a rate of approximately 50 million tonnes each year, for approximately 14 years.
The proposal is in an area of high biodiversity and is located within the catchment of the Fortescue Marsh, a nationally and internationally important wetland. The EPA decided to assess the proposal at the level of Public Environmental Review (PER) due to its large scale and the number of complex environmental factors, related to the clearing of vegetation and water management. This proposal was also assessed under a bilateral agreement with the Commonwealth Government because of the clearing of habitat that supports threatened species and communities, and migratory species listed under the Environment Protection and Biodiversity Conservation Act 1999 (EPBC Act).
The key environmental factors evaluated were Hydrological Processes, Inland Waters Environmental Quality, Flora and Vegetation, Subterranean Fauna, Terrestrial Fauna and the integrating factors of Rehabilitation and Decommissioning, and Offsets. The EPA’s assessment identified potential significant impacts to groundwater systems, flora and Mulga, Samphire and Coolibah/River Red Gum vegetation, and fauna habitat, including within the Fortescue Marsh area. The cumulative impacts of this proposal, together with the existing mine and other mines in the Fortescue Marsh catchment, was a key concern of the EPA, particularly in relation to the extent of area requiring rehabilitation (including revegetation) once mining ceases.
In its role of supporting the EPA’s assessment of the proposal, the OEPA focused on achieving good environmental outcomes. Assessment officers attended a site visit to understand the context of the proposal in relation to the existing mine. The assessment concluded that the proposal could be implemented subject to conditions. The OEPA helped in the development
OvERviEw AGEncy PERfORMAncE siGnificAnt issuEs disclOsuREscOntEnts

Office of the Environmental Protection Authority Annual Report 2015 - 2016 | 19
of the conditions, which included consulting with the proponent and other government departments to review and revise conditions relating to the existing mine. The OEPA also helped apply the EPA’s recent guidance on environmental management plans in developing the conditions, as the Christmas Creek iron Ore Mine Expansion proposal was one of the first proposals for which the EPA applied its new framework.
The recommended conditions included outcome-based conditions to avoid Priority flora and maintain the health of Mulga, Samphire and Coolibah/River Red Gum vegetation, a management-based condition relating to conservation significant terrestrial fauna and their habitat, and a condition requiring further surveys relating to subterranean fauna and their habitat. The recommended conditions also included a Mine Closure Plan with specific requirements relating to the rehabilitation of Mulga and Coolibah/River Red Gum vegetation, an appropriate monitoring framework for groundwater post-mining, and a performance report to demonstrate rehabilitation progress over time.
The OEPA also coordinated the development of offsets for the proposal which reflected the significant residual impact of the large amount of clearing of native vegetation in ‘Good to Excellent’ condition. This included vegetation located in the Fortescue Marsh area, the cumulative loss of Mulga and Coolibah/River Red Gum vegetation and the loss of potential habitat for conservation significant fauna.
The EPA released its report and recommendations on the proposal in May 2016. The report did not receive any appeals. The Western Australian Minister for Environment will now consult with Ministers who are decision-making authorities for the proposal, on the proposal and the conditions recommended by the EPA, before making a decision on whether or not to approve the proposal.
Case study: Hazelmere Wood Waste to Energy PlantThe proposal by the Eastern Metropolitan Regional Council (EMRC) was to construct a Wood Waste to Energy (WWTE) plant at the existing Hazelmere Recycling Centre located on an industrial site, 14km north-east of Perth. The facility would process up to 13,000 tonne of shredded clean wood that would otherwise be disposed of in landfill. The WWTE plant would contribute 3.5 megawatts of electricity to the South West Interconnected System and nearby industrial consumers. The plant would use a pyrolysis technology – heating the shredded material at high temperature without oxygen to produce syngas, which in turn powers eight 500 kilowatt gas engines to generate electricity.
The level of assessment was set at Public Environmental Review (PER) in March 2014.
The OEPA helped the EPA identity the preliminary environmental factors and prepared a draft Environmental Scoping Document (ESD) describing the
OvERviEw AGEncy PERfORMAncE siGnificAnt issuEs disclOsuREscOntEnts

Office of the Environmental Protection Authority Annual Report 2015 - 201620 |
scope and content to be included in the proponent’s PER document. The EPA approved the ESD in May 2014, and the proponent’s PER document was released for a four-week public review.
A total of 124 public submissions were received during the public review period. The key issues raised related to concerns surrounding technology, air quality, potential health risks, waste hierarchy, and emissions. The OEPA consolidated and summarised these submissions, and provided them to the proponent for a response.
The OEPA coordinated the assessment of the Hazelmere WWTE Plant consistent with previous Waste to Energy assessments through application of recommendations in the Environmental and health performance of waste to energy technologies s16e strategic review, published by the EPA and the Waste Authority, April 2013.
The submittors’ concerns regarding technology were thoroughly investigated by the OEPA. This included the OEPA facilitating an Independent Peer Review on behalf of the EPA to examine the scientific efficacy of the waste-to-energy technology proposed.
Practical functioning of the plant was also looked at with proponent trials of a smaller scale version of the proposal subject to a technical review.
The OEPA worked with the Department of Environment Regulation (DER) to ensure that the EPA’s recommended conditions were complementary to the DER’s works approval and licensing process in order to avoid regulatory overlap.
The EPA concluded that the proposal could be implemented subject to recommended conditions including the implementation of a Waste Acceptance Monitoring and Management Plan and the public availability of environmental data.
EPA Report 1554 Hazelmere Wood Waste to Energy Plant was published in July 2015. The Minister’s conditional environmental approval for the Hazelmere Wood Waste to Energy Plant was issued in April 2016.
Environmental impact assessment of infrastructure proposalsThe EPA has considered a broad range of significant infrastructure proposals in the marine and terrestrial environments in 2015–16. This has included the consideration of proposals for port developments, road and rail infrastructure, pipelines, marinas and large aquaculture developments.
The Perth metropolitan area has been an area of particular interest with the EPA assessing the environmental impacts of a number of State significant infrastructure projects for the development of major roads, railway and water pipelines. Being in the metropolitan area these proposals are often located in sensitive and constrained environments where the cumulative loss of native vegetation and fauna habitat is a key issue.
OvERviEw AGEncy PERfORMAncE siGnificAnt issuEs disclOsuREscOntEnts

Office of the Environmental Protection Authority Annual Report 2015 - 2016 | 21
Case Study: Forrestfield Airport Link – Public Transport Authority The Forrestfield-Airport Link proposal was assessed as an Assessment on Proponent Information – Category A.
The purpose of the Forrestfield Airport Link, by the Public Transport Authority of Western Australia (the proponent), is to extend the Perth rail network from the Bayswater Station/Midland line through to Forrestfield.
The proposal assessed by the EPA included the construction of twin bored tunnels which are approximately five kilometres long, two stations (Airport West and Forrestfield), car parks, dive structures, cross passages, emergency egress shafts, signalling and telecommunication equipment.
The proposal forms part of a wider project which includes development within the Perth Airport. This involves tunnelling under the airport and the excavation and construction of the Central Airport underground station. These components of the wider project within Perth Airport are subject to environmental assessment and approval under the Commonwealth Airports Act 1996 and therefore were not assessed by the EPA in its report.
To minimise the potential environmental impacts to flora and vegetation and people’s amenity, the proponent applied the EPA’s mitigation hierarchy (avoid, minimise, rehabilitate and offset) during the planning of the project and considered three alternative methods of constructing the proposal being: an elevated option which would have a required a crossing over the Swan River and clearing of foreshore vegetation; a partially subterranean option; and an entirely subterranean option which involves tunnelling.
The EPA noted in its assessment that the proponent selected the tunnelling option which reduced the residual impacts of the proposal on flora and vegetation, the Swan River and less construction and operational noise emissions on nearby residents.
The EPA considered the key environmental factors that required evaluation to be Flora and Vegetation and Offsets.
The EPA concluded that the proposal could be implemented subject to recommended conditions relating to: preparing and implementing a Flora and Vegetation Monitoring and Management Plan to ensure there are no adverse indirect impacts to the Threatened Ecological Communities (TEC) outside of the Forrestfield Station Development Envelope, at Poison Gully Creek and Lot 12 Ibis Place from the temporary dewatering and recharge activities required during construction.
Despite the proponent’s avoidance and minimisation measures the proposal will still have a significant residual impact on flora and vegetation through the direct loss of 1.6 hectares of a Threatened Ecological Community (Swan Coastal Plain 20a) and the loss of 25 individual plants of the declared rare flora Conospermum undulatum. The EPA recommended a condition
OvERviEw AGEncy PERfORMAncE siGnificAnt issuEs disclOsuREscOntEnts
Office of the Environmental Protection Authority Annual Report 2015 - 201622 |
requiring the proponent to offset the significant residual impacts to flora and vegetation.
During the course of the assessment, the EPA noted that a large quantity of material would be excavated for the construction of the proposal and that based on the proponent’s investigations, significant quantities of this material would be available for reuse subject to appropriate treatment.
The EPA therefore provided ‘Other advice’ in its report that it supported the proponent engaging with other infrastructure proponents in order to maximise the reuse of the material generated by the proposal and hence minimise waste.
Environmental impact assessment of planning schemes and scheme amendments Under the Planning and Development Act 2005, all schemes and scheme amendments must be referred to the EPA for consideration. The EPA is then required to determine whether or not each scheme or scheme amendment requires formal environmental impact assessment under Part IV of the EP Act or, in rare cases, is environmentally unacceptable.
In 2015–16, the EPA considered 246 scheme amendments. The EPA determined that none of these raised environmental issues that could not be managed through the planning process, and that formal environmental impact assessment was not required. The EPA did, however, provide environmental advice, to be implemented through the planning process, for 30 scheme amendments. This advice helps responsible authorities and other stakeholders ensure that environmental impacts are avoided.
The OEPA is continuing to fast-track scheme amendments that pose little environmental risk from across the entire State through the EPA process, taking on average 14 days to process compared to 19 days for other referrals.
Post-assessment changes and offsets in the PilbaraThe OEPA has noticed an increase in the number of approved proposals in the Pilbara where proponents are requesting further clearing of vegetation. These changes to proposals, which may be approved under s45C of the EP Act if they are to be implemented, are generally for the purposes of expanding mine envelopes to accommodate expanding stockpile and storage areas and infrastructure. Examples include BHP Billiton Iron Ore Pty Ltd’s Orebody 18 Iron Ore Mine and Jimblebar Iron Ore Project.
The EPA is concerned about the extent of clearing in the Pilbara region and has been taking a proactive approach to limiting potential cumulative impacts within the Hamersley Interim Biogeographical Regionalisation for Australia (IBRA) subregion (within the Pilbara IBRA region), by recommending the Minister for Environment set offset conditions on new proposals, or
OvERviEw AGEncy PERfORMAncE siGnificAnt issuEs disclOsuREscOntEnts

Office of the Environmental Protection Authority Annual Report 2015 - 2016 | 23
expanding proposals, involving clearing of native vegetation in the IBRA subregions where extensive clearing has already occurred.
In undertaking a s45C assessment of proposed changes, the OEPA must consider the ‘six aspects test’ in determining if the proposed changes are significantly different to what was originally proposed and whether the s45C may be approved. This information is presented to the EPA for their determination, outlining what the applicable environmental factors are and in what way the changes will be managed to ensure that the objectives of each factor remain to be met.
In the case of the Orebody 18 Iron Ore Mine and Jimblebar Iron Ore projects, the EPA recommended the Minister for Environment include conditions requiring environmental offsets for the clearing of ‘good to excellent’ and ‘very good to excellent’ condition native vegetation within the Hamersley and Fortescue IBRA subregions, applying to the additional clearing. This is consistent with the EPA’s section 16(e) advice Cumulative environmental impacts of development in the Pilbara region; the WAEnvironmentalOffsetsPolicy 2011; the WAEnvironmentalOffsetsGuidelines2014, and Environmental Protection Bulletin No. 1 EnvironmentalOffsets.
In the case of Jimblebar, the additional disturbance was approved and the requirement of the provision of funds to offset the clearing of ‘good to excellent’ native vegetation in accordance with an approved Impact Reconciliation Procedure was required only for the disturbance that was approved under the section 45C, as the offset condition was not retrospective.
the ‘six Aspects test’1. Identification of the content of the original proposal. 2. Identification of the content of the relevant change(s) and determine whether the
change(s) involves a revision of the original proposal. 3. Determination as to whether the original proposal has had or will have any detrimental
effect on the environment and, if so, what. 4. Determination as to whether the change(s) to the original proposal might (in the Minister’s
opinion) have any detrimental effect on the environment and, if so, what. 5. Determination as to whether the detrimental effect (if any) which the change(s) might have
on the environment is additional to, or different from, the detrimental effect (if any) which the original proposal has had or will have.
6. Determination as to whether any detrimental effect which the change(s) to the original proposal might have on the environment, which is additional to, or different from, any detrimental effect which the original proposal has had or will have is, in the circumstances, significant.
OvERviEw AGEncy PERfORMAncE siGnificAnt issuEs disclOsuREscOntEnts

Office of the Environmental Protection Authority Annual Report 2015 - 201624 |
Environmental Management services to the EPAWithin this Service the OEPA develops, for the EPA, policies, guidelines and strategic advice to protect the environment and manage environmental impacts
The OEPA also contributes to the development of Government environmental policy.
This year, in response to the finding of the Supreme Court that invalidated the environmental approval of the Roe 8 project, the Minister for Environment announced the commissioning of a Legal and Governance Review of the EPA’s policies. The report of the review, led by Mr Peter Quinlan SC, was released in May 2016 and made a number or recommendations including that there be a ‘root and branch’ review of the EPA’s policies and guideline under a new policy framework.
The OEPA has now commenced the work to support the review of EPA’s policies in line with the findings, and this will continue into 2016–17.
Perth and Peel strategic Assessment (Green Growth Plan)In August 2015, the EPA provided interim environmental advice, Perth and Peel @ 3.5 million: Environmental impacts, risks and remedies, to the Minister for Environment on the current and likely future pressures on State environmental values in the Perth and Peel regions. The interim advice has been a key contribution to the Perth and Peel Strategic Assessment, which is being undertaken by the Commonwealth Department of the Environment and the Government of Western Australia, led by the Department of the Premier and Cabinet (DPC).
The Commonwealth will assess potential impacts from proposed development in the Perth and Peel regions on matters of national environmental significance (MNES), protected under the Environmental Protection Biodiversity Conservation Act 1999. The EPA’s interim advice is influencing the finalisation of the Western Australian Planning Commission’s Sub-regional Planning Frameworks and the development footprints in the Strategic Assessment, which will address State environmental matters additional to MNES. The parallel consideration of State and Commonwealth environmental issues early in the planning process will allow for streamlined environmental and planning approvals and more strategic environmental outcomes.
The draft Strategic Assessment documentation (Green Growth Plan) was released by the DPC in December 2015 for a four months public comment period. The OEPA has an ongoing role in providing advice on environmental values and impacts associated with addressing public submissions and finalising the Strategic Assessment. The OEPA continues to work with key agencies including the departments of Parks and Wildlife, Planning, Mines and Petroleum, Water, and Environment Regulation, to ensure the
OvERviEw AGEncy PERfORMAncE siGnificAnt issuEs disclOsuREscOntEnts

Office of the Environmental Protection Authority Annual Report 2015 - 2016 | 25
recommendations from the EPA’s interim advice have been incorporated and addressed in the final Strategic Assessment plans.
The Strategic Assessment is being undertaken in anticipation of the growth of the Perth and Peel regions and the potential environmental impacts of the development required to support a city of 3.5 million people.
new and revised policy and guidanceBefore the release of the report from the Legal and Governance Review of EPA Policies in May 2016, the OEPA was continuing to support the EPA to update its policies and develop new policies under its existing policy framework.
Two new Environmental Protection Bulletins (EPB’s) and a Technical Guide were released by the EPA in 2015-16.
Greenhouse gas emissions and consideration of projected climate change impacts in the EIA process (EPB 24) replaced Guidance Statement 12 - Minimising Greenhouse Gas Emissions and was released 29 September 2015. This EPB discusses the circumstances under which the EPA will assess greenhouse gas emissions associated with development proposals; describe what principles the EPA will expect proposals to meet with regard to minimising greenhouse gas emissions and outlines the EPA’s expectations for environmental impact assessment with respect to projected climate change impacts.
Guidance on the EPA Landforms factor (EPB 23) was released 20 July 2015 to communicate how the Landform factor is considered by the EPA in the environmental impact assessment process. This EPB aims to provide proponents with some high level guidance on the EPA’s objective for the Landforms factor to consider when developing their proposal or scheme.
The Technical Guide - Flora and Vegetation Surveys for Environmental Impact Assessment was released in December 2015. It provides detail on flora and vegetation survey standards and techniques to support EPA Guidance Statement 51 – Terrestrial Flora and Vegetation Surveys for Environmental Impact Assessment in Western Australia (2004).
The Draft Environmental Assessment Guideline for Separation Distances between Industrial and Sensitive Land Uses (EAG) was released for stakeholder and public comment from 6 October to 18 November. The purpose of the draft EAG was to outline the EPA’s expectations on how separation distances should be considered in planning schemes and scheme amendments. The draft EAG provided recommended separation distances between sensitive land uses and industries that emit gaseous and particulate material, odour, dust and noise.
Given the findings of the Legal and Governance review, this draft EAG will not be progressed in its current form.
OvERviEw AGEncy PERfORMAncE siGnificAnt issuEs disclOsuREscOntEnts

Office of the Environmental Protection Authority Annual Report 2015 - 201626 |
state Government Environmental Policy The State Environmental (Cockburn Sound) Policy 2015 was released by the Minister for Environment after a review by the EPA, supported by the OEPA.
The State’s first State Environmental (Cockburn Sound) Policy and implementation documents for the protection of Cockburn Sound were released by the Minister for the Environment in January 2005, after extensive scientific and public consultation. The Policy was reviewed and updated and released on 11 December 2015 as the State Environmental (Cockburn Sound) Policy 2015. The overall objective of the Policy is to ensure that water quality of the Sound is maintained and where possible improved so that there is no further net loss and preferably a net gain in seagrass areas, and that the other values and uses are maintained.
Revocation of three Environmental Protection PoliciesThe Environmental Protection Act 1986 requires that the Minister for Environment must seek the advice of the EPA before making any decision to revoke an environmental protection policy.
On the request of the Minister for Environment, the EPA provided advice on the revocation of the following three Environmental Protection Policies: • Environmental Protection (South West Agricultural Zone Wetlands) Policy
1998; • Environmental Protection (Swan Coastal Plain Lakes) Policy 1992; and • Environmental Protection (Gnangara Mound Crown Land) Policy 1992.In preparing its advice, the EPA considered the effectiveness of the policies in achieving the desired environmental outcomes, whether other measures had been introduced which achieve the same objectives as the environmental protection policies, and any risks to the environment which would result from their revocation.
Generally, the EPA found that the three policies were outdated and have been superseded by a number of more effective mechanisms introduced since the policies were first adopted. These include the environmental harm provisions and the clearing provisions of the Environmental Protection Act 1986.
The Minister revoked the three policies on 20 November 2015.
compliance monitoring services to the MinisterSection 48(1) of the Environmental Protection Act 1986 provides that the CEO may monitor compliance of proposals approved by the Minister, for the purpose of determining whether the implementation conditions set out in the Ministerial Statement are being complied with. The OEPA uses a variety of proactive and reactive methods to monitor compliance including audits of proposals, reviews of compliance assessment reports, onsite inspections, and stakeholder engagement.
OvERviEw AGEncy PERfORMAncE siGnificAnt issuEs disclOsuREscOntEnts

Office of the Environmental Protection Authority Annual Report 2015 - 2016 | 27
If a proponent does not ensure that the implementation of the proposal is in accordance with the implementation conditions, the proponent commits an offence. When non-compliance with an implementation condition or proponent commitment of a Ministerial Statement is identified, the proponent is issued with a Notice of Non-Compliance, detailing actions required to rectify the issue and regain compliance. The Minister for Environment is informed of each non-compliance, which enables a range of actions to be undertaken if required.
The OEPA uses a priority matrix to assign a priority rating of Very High, High, Medium or Low to all proposals. The matrix uses information from the environmental impact assessment process, the proposal’s complexity, potential environmental consequences, and proponent performance to rate priority.
The priority rating enables resources to be effectively managed to achieve the best environmental outcome by priority based targeting of active proposals. The priority rating of all proposals is reassessed after each audit or compliance review to ensure the priority rating reflects the proposal phase, proponent performance and implementation status.
The results from the compliance audits identify areas to improve proponent’s compliance, and help in improving future compliance programs and the environmental impact assessment process.
compliance and audit activityIn 2015–16, sixty audits of Ministerial Statements were conducted. The audits were focussed on proposals with a priority rating of Very High, High and Medium together with a number of randomly selected Low priority rated proposal.
Compliance officers conducted audits on a range of proposals in the Kimberley, Pilbara, Mid West, Goldfields, South West and Swan regions during the year. Proposals audited included aquaculture, quick lime manufacturing, coastal development, a waste management facility, a wood processing facility, port and rail infrastructure, oil and gas facilities, chemical processing and manufacturing facilities, power generation facilities, a regional aerodrome, salt production, and coal, diamond, gold, iron ore, mineral sands and nickel mines.
Of the sixty proposals audited during 2015–16, one was found to be non-compliant with the implementation conditions of its Ministerial Statement (2014–15: 97 per cent). In addition to the audit program, one proposal was identified to be non-compliant through proponent self-reporting.
The effectiveness of the compliance monitoring program in ensuring proponents comply with Ministerial conditions is demonstrated by examining the “percentage of non-compliances where remedial action has been taken by the proponent within the time specified in the Notice of Non-Compliance”.
OvERviEw AGEncy PERfORMAncE siGnificAnt issuEs disclOsuREscOntEnts

Office of the Environmental Protection Authority Annual Report 2015 - 201628 |
During the year, 100 per cent of all actions to resolve non-compliance were completed by the required date (2014–15: 100 per cent).
significant proposals auditedThe Koodaideri Iron Ore Mine and Infrastructure Project is currently in the pre-construction phase. The 2015–16 audit assessed compliance with the preparation and submission of management plans, baseline surveys, and impact reconciliation procedures that are required to be submitted before ground disturbing activities begin.
The Pilbara Iron Ore and Infrastructure Project including the port, railway, Christmas Creek and Cloudbreak mine sites were also audited to monitor compliance with the conditions of their respective Ministerial Statements. These proposals are all in the operational stage.
The OEPA continued to closely monitor the Gorgon Gas Development and its associated Jansz Feed Gas Pipeline at Barrow Island Nature Reserve, focusing the 2015–16 audit on the Terrestrial and Marine Quarantine Management System.
The 2015–16 audit of the Wheatstone LNG Development near Onslow focused on implementation of the Coastal Processes Monitoring and Management Plan and the Mangrove Algal Mat and Tidal Creek Protection Management Plan.
improving our business - EiA reformclose out letter from the General Manager – feedback from proponentsAs a part of the OEPA’s commitment to continuous improvement, we invite proponents to provide feedback on the assessment process and their communications with the OEPA, after transmittal of the EPA’s assessment report and recommendations to the Minister. Specifically, feedback is sought relating to: the OEPA’s risk-based approach to assessment and the use of key environmental factors; timeliness of assessments; suitability of policy and guidance material; and the proponent’s interaction with OEPA officers.
The feedback received has helped the OEPA identify what policy and process improvements are working and where further attention may be required. Proponents were positive in the feedback on the level of service provided by the OEPA and the risk-based approached applied for assessment. Comments varied in relation to the timelines of assessments and the application of policy and guidance material.
The areas that proponents identified for improvement were: process guidance on the “response to submissions” stage of assessment; process clarity between the roles of the OEPA and the Office of the Appeals Convenor; and consistency between preliminary key environmental factors (identified at setting level of assessment) and the key environmental factors (identified in
OvERviEw AGEncy PERfORMAncE siGnificAnt issuEs disclOsuREscOntEnts

Office of the Environmental Protection Authority Annual Report 2015 - 2016 | 29
the EPA’s assessment report). Proponents also highlighted some difficulties in navigating the EPA’s policy framework, if during the course of assessment the EPA changed or released new guidance material for environmental impact assessment processes. These matters are being addressed by both the EPA and the OEPA as a part of the work to address the recommendations of the Legal and Governance Review, led by Peter Quinlan SC, released in May 2016.
The feedback process was initiated in November 2014 and has had an overall response rate of 58 per cent. During 2015–16, ten requests for feedback were sent and five responses received (50 per cent response rate).
Overall, the feedback to date has been positive and supports the OEPA’s risk-based approach to assessment and the provision of timely and professional advice to proponents.
Public consultation The public are encouraged to:
• participate in consultation by offering advice, identifying omitted relevant data/information, providing local knowledge and proposing alternatives;
• participate in strategic policy and planning as appropriate, since engagement at these earlier stages may influence the development and evaluation of future proposals;
• be informed of the administration and outcomes of EIA; and• take a responsible approach to opportunities for engagement in the EIA
process, including being informed of objective information about the environmental issues.
Environmental Impact Assessment (Part IV Divisions 1 and 2) Administrative Procedures 2012
To facilitate public participation, all opportunities to comment and make formal submissions on matters before the EPA can be found on the OEPA’s “consultation hub” at https://consultation.epa.wa.gov.au. The OEPA also prefers responses be made through the hub. It provides a comprehensive platform for online consultation that enables the EPA to:
• manage all its consultation activity;• create consultations and surveys;• publicise and promote EIA consultations;• analyse and report on responses; and• feedback to the public.Interested stakeholders can subscribe to be notified when new items are published by signing up to an email mailing list. During 2015–16, public comment was invited on 49 items, and a total of 7,247 responses were received.
OvERviEw AGEncy PERfORMAncE siGnificAnt issuEs disclOsuREscOntEnts

Office of the Environmental Protection Authority Annual Report 2015 - 201630 |
Table 2: Consultations as at 30 June 2016
Type of consultation Number ResponsesSeven-day comment on new referrals 36 286Environmental Scoping Documents 1 2Public Environmental Reviews 10 6,926Consultation on MNES under the State/Commonwealth Bilateral agreement
1 0
Comment on policies and guidance under development
1 33
49 7,247
The EPA also uses Twitter to inform the general public and stakeholders of information relating to EIA and policy development, including notification of new publications; opportunities for public comment/submissions; media releases and other announcements.
OvERviEw AGEncy PERfORMAncE siGnificAnt issuEs disclOsuREscOntEnts

Office of the Environmental Protection Authority Annual Report 2015 - 2016 | 31
significant issues impacting the OEPA
current and emerging issues and trends f In August 2015, the EPA released interim advice on the key Government project on strategic planning and environmental assessment of long-term development in the Perth-Peel region to prepare for growth of the region’s population to 3.5 million people. During the year, the OEPA continued to contribute to this project.
f On 30 November 2015, the application for a judicial review “Save Beeliar Wetlands (inc) v. Minister for Environment” – relating to the EPA’s environmental impact assessment of Roe Highway Stage 8 – was heard in the Supreme Court of Western Australia. Chief Justice Wayne Martin upheld the application on one ground, that the EPA was obliged to take into account relevant policies relating to significant impacts upon critical environmental assets. His Honour held that these policies were mandatory relevant considerations.
f The State Government and the EPA appealed the Supreme Court’s decision to provide clarity for assessment and approval processes. On 15 July 2016, the Court of Appeal found that none of the policies were mandatory relevant considerations and that the notice of contention should be dismissed.
f Following the Supreme Court’s November 2015 decision, amendments were made to assessment practices to ensure that the EPA’s reports and recommendations to the Minister for Environment demonstrated how it’s decisions were made by addressing the relevant policies and guidance for each assessment. This has increased the time required for assessments.
f Also following the decision, the Minister initiated a review into the EPA’s practices for policy and guideline development and their application to environmental impact assessments. The independent legal and governance review was released on 17 May 2016, with the EPA welcoming the findings. Despite the appeal decision, the EPA has committed to implementing the recommendation to develop a new guidelines and procedures framework by December 2016.
Economic and social trends f With the slower economic conditions during 2015–16, the pace at which companies sought approvals for new development proposals continued to slow. However there was still a considerable assessment workload, particularly in the iron ore and uranium sectors. There continued to be an increased focus by proponents on applications to expand existing facilities and infrastructure to maximise their production, resulting in a proportionally high number of requests for post-assessment changes.
OvERviEw AGEncy PERfORMAncE siGnificAnt issuEs disclOsuREscOntEnts

Office of the Environmental Protection Authority Annual Report 2015 - 201632 |
f The level of public engagement with the development of EPA advice and public scrutiny of the environmental impact assessment process has greatly increased over the past few years. During 2015–16, development of a new EPA/OEPA website has progressed, with the primary aim of improving communication of the EPA’s advice and access to information.
changes in written law f There were no changes in any written law that affected the OEPA during the financial year.
likely developments and forecast result of operations f The OEPA will be reviewing existing practices for development and application of policies, guidelines and procedures in the environmental impact assessment process, and implementing improvements to ensure they comply with the Environmental Protection Act 1986 and administrative law requirements.
f The OEPA will continue to contribute to the key Government project on strategic planning and environmental assessment of long-term development in the Perth-Peel region to prepare for growth of the region’s population to 3.5 million people.
f A new website will be launched during 2016–17.
OvERviEw AGEncy PERfORMAncE siGnificAnt issuEs disclOsuREscOntEnts

Office of the Environmental Protection Authority Annual Report 2015 - 2016 | 33
OvERviEw AGEncy PERfORMAncE siGnificAnt issuEs disclOsuREscOntEnts
disclosures, financial statements and Key Performance indicatorsindependent Auditor’s Report
to the Parliament of western Australia
OFFICE OF THE ENVIRONMENTAL PROTECTION AUTHORITY
Report on the Financial Statements
I have audited the accounts and financial statements of the Office of the Environmental Protection Authority.
The financial statements comprise the Statement of Financial Position as at 30 June 2016, the Statement of Comprehensive Income, Statement of Changes in Equity, Statement of Cash Flows, Schedule of Income and Expenses by Service, Schedule of Assets and Liabilities by Service, and Summary of Consolidated Account Appropriations and Income Estimates for the year then ended, and Notes comprising a summary of significant accounting policies and other explanatory information.
Opinion
In my opinion, the financial statements are based on proper accounts and present fairly, in all material respects, the financial position of the Office of the Environmental Protection Authority at 30 June 2016 and its financial performance and cash flows for the year then ended. They are in accordance with Australian Accounting Standards and the Treasurer’s Instructions.
General Manager’s Responsibility for the Financial StatementsThe General Manager is responsible for keeping proper accounts, and the preparation and fair presentation of the financial statements in accordance with Australian Accounting Standards and the Treasurer’s Instructions, and for such internal control as the General Manager determines is necessary to enable the preparation of financial statements that are free from material misstatement, whether due to fraud or error.
Auditor’s Responsibility for the Audit of the Financial Statements
As required by the Auditor General Act 2006, my responsibility is to express an opinion on the financial statements based on my audit. The audit was conducted in accordance with Australian Auditing Standards. Those Standards require compliance with relevant ethical requirements relating to audit engagements and that the audit be planned and performed to obtain reasonable assurance about whether the financial statements are free from material misstatement.

Office of the Environmental Protection Authority Annual Report 2015 - 201634 |
OvERviEw AGEncy PERfORMAncE siGnificAnt issuEs disclOsuREscOntEnts
An audit involves performing procedures to obtain audit evidence about the amounts and disclosures in the financial statements. The procedures selected depend on the auditor’s judgement, including the assessment of the risks of material misstatement of the financial statements, whether due to fraud or error. In making those risk assessments, the auditor considers internal control relevant to the Office’s preparation and fair presentation of the financial statements in order to design audit procedures that are appropriate in the circumstances. An audit also includes evaluating the appropriateness of the accounting policies used and the reasonableness of accounting estimates made by the General Manager, as well as evaluating the overall presentation of the financial statements.
I believe that the audit evidence obtained is sufficient and appropriate to provide a basis for my audit opinion.
Report on Controls
I have audited the controls exercised by the Office of the Environmental Protection Authority during the year ended 30 June 2016.
Controls exercised by the Office of the Environmental Protection Authority are those policies and procedures established by the General Manager to ensure that the receipt, expenditure and investment of money, the acquisition and disposal of property, and the incurring of liabilities have been in accordance with legislative provisions.
Opinion
In my opinion, in all material respects, the controls exercised by the Office of the Environmental Protection Authority are sufficiently adequate to provide reasonable assurance that the receipt, expenditure and investment of money, the acquisition and disposal of property, and the incurring of liabilities have been in accordance with legislative provisions during the year ended 30 June 2016.
General Manager’s Responsibility for ControlsThe General Manager is responsible for maintaining an adequate system of internal control to ensure that the receipt, expenditure and investment of money, the acquisition and disposal of public and other property, and the incurring of liabilities are in accordance with the Financial Management Act 2006 and the Treasurer’s Instructions, and other relevant written law.
Auditor’s Responsibility for the Audit of ControlsAs required by the Auditor General Act 2006, my responsibility is to express an opinion on the controls exercised by the Office of the Environmental Protection Authority based on my audit conducted in accordance with Australian Auditing and Assurance Standards.
An audit involves performing procedures to obtain audit evidence about the adequacy of controls to ensure that the Office complies with the legislative

Office of the Environmental Protection Authority Annual Report 2015 - 2016 | 35
OvERviEw AGEncy PERfORMAncE siGnificAnt issuEs disclOsuREscOntEnts
provisions. The procedures selected depend on the auditor’s judgement and include an evaluation of the design and implementation of relevant controls.
I believe that the audit evidence obtained is sufficient and appropriate to provide a basis for my audit opinion.
Report on the Key Performance Indicators
I have audited the key performance indicators of the Office of the Environmental Protection Authority for the year ended 30 June 2016.
The key performance indicators are the key effectiveness indicators and the key efficiency indicators that provide information on outcome achievement and service provision.
Opinion
In my opinion, in all material respects, the key performance indicators of the Office of the Environmental Protection Authority are relevant and appropriate to assist users to assess the Office’s performance and fairly represent indicated performance for the year ended 30 June 2016.
General Manager’s Responsibility for the Key Performance IndicatorsThe General Manager is responsible for the preparation and fair presentation of the key performance indicators in accordance with the Financial Management Act 2006 and the Treasurer’s Instructions and for such controls as the General Manager determines necessary to ensure that the key performance indicators fairly represent indicated performance.
Auditor’s Responsibility for the Audit of Key Performance IndicatorsAs required by the Auditor General Act 2006, my responsibility is to express an opinion on the key performance indicators based on my audit conducted in accordance with Australian Auditing and Assurance Standards.
An audit involves performing procedures to obtain audit evidence about the key performance indicators. The procedures selected depend on the auditor’s judgement, including the assessment of the risks of material misstatement of the key performance indicators. In making these risk assessments the auditor considers internal control relevant to the General Manager’s preparation and fair presentation of the key performance indicators in order to design audit procedures that are appropriate in the circumstances. An audit also includes evaluating the relevance and appropriateness of the key performance indicators for measuring the extent of outcome achievement and service provision.
I believe that the audit evidence obtained is sufficient and appropriate to provide a basis for my audit opinion.
Independence
In conducting the above audits, I have complied with the independence requirements of the Auditor General Act 2006 and Australian Auditing and

Office of the Environmental Protection Authority Annual Report 2015 - 201636 |
OvERviEw AGEncy PERfORMAncE siGnificAnt issuEs disclOsuREscOntEnts
Assurance Standards, and other relevant ethical requirements.
Matters Relating to the Electronic Publication of the Audited Financial Statements and Key Performance Indicators
This auditor’s report relates to the financial statements and key performance indicators of the Office of the Environmental Protection Authority for the year ended 30 June 2016 included on the Office’s website. The Office’s management is responsible for the integrity of the Office’s website. This audit does not provide assurance on the integrity of the Office’s website. The auditor’s report refers only to the financial statements and key performance indicators described above. lt does not provide an opinion on any other information which may have been hyperlinked to/from these financial statements or key performance indicators. If users of the financial statements and key performance indicators are concerned with the inherent risks arising from publication on a website, they are advised to refer to the hard copy of the audited financial statements and key performance indicators to confirm the information contained in this website version of the financial statements and key performance indicators.
GLEN CLARKE
DEPUTY AUDITOR GENERAL
Delegate of the Auditor General for Western Australia
Perth, Western Australia
24 August 2016

Office of the Environmental Protection Authority Annual Report 2015 - 2016 | 37
OvERviEw AGEncy PERfORMAncE siGnificAnt issuEs disclOsuREscOntEnts
financial statementscertification of financial statementsFor the year ended 30 June 2016
The accompanying financial statements of the Office of the Environmental Protection Authority have been prepared in compliance with the provisions of the Financial Management Act 2006 from proper accounts and records to present fairly the financial transactions for the financial year ended 30 June 2016 and the financial position as at 30 June 2016.
At the date of signing we are not aware of any circumstances which would render the particulars included in the financial statements misleading or inaccurate.
Valma Cartwright Kim Taylor
Chief Finance Officer Accountable Authority
23 August 2016 23 August 2016

Office of the Environmental Protection Authority Annual Report 2015 - 201638 |
OvERviEw AGEncy PERfORMAncE siGnificAnt issuEs disclOsuREscOntEnts
statement of comprehensive incomeFor the year ended 30 June 2016
Note 2016 2015$ $
COST OF SERVICESExpensesEmployee benefits expense 5 10,830,444 11,637,877Supplies and services 6 2,092,865 1,573,929Depreciation and amortisation expense 7 122,014 197,321Accommodation 8 792,369 826,097Loss on disposal of non-current asset 11 5,015 –Other expenses 9 259,325 325,200Total cost of services 14,102,032 14,560,424
IncomeRevenueOther revenue 10 23,721 20,435Total Revenue 23,721 20,435
GainsGain on disposal of non-current assets 11 – 9,135Total Gains – 9,135Total income other than income from State Government
23,721 29,570
NET COST OF SERVICES 14,078,311 14,530,854
Income from State Government 12Service appropriation 14,150,000 14,996,000Services received free of charge 470,816 78,901State grants 148,011 –Total income from State Government 14,768,827 15,074,901SURPLUS/(DEFICIT) FOR THE PERIOD 690,516 544,047TOTAL COMPREHENSIVE INCOME FOR THE PERIOD 690,516 544,047
See also the ‘Schedule of Income and Expenses by Service’.
The Statement of Comprehensive Income should be read in conjunction with the accompanying notes.

Office of the Environmental Protection Authority Annual Report 2015 - 2016 | 39
OvERviEw AGEncy PERfORMAncE siGnificAnt issuEs disclOsuREscOntEnts
statement of financial PositionAs at 30 June 2016
Note 2016 2015$ $
ASSETSCurrent AssetsCash and cash equivalents 23 610,258 184,116Restricted cash and cash equivalents 13, 23 – 354,067Receivables 14 213,011 127,528Amounts receivable for services 15 6,000 50,000Other current assets 16 235,192 31,795Total Current Assets 1,064,461 747,506
Non-Current AssetsRestricted cash and cash equivalents 13, 23 – –Amounts receivable for services 15 588,000 544,000Plant and equipment 17 110,524 162,274Intangible assets 18 237,267 155,757Total Non-Current Assets 935,791 862,031TOTAL ASSETS 2,000,252 1,609,537
LIABILITIESCurrent LiabilitiesPayables 20 104,900 423,643Provisions 21 1,604,018 1,851,511Total Current Liabilities 1,708,918 2,275,154
Non-Current LiabilitiesProvisions 21 730,985 658,550Total Non-Current Liabilities 730,985 658,550TOTAL LIABILITIES 2,439,903 2,933,704
NET ASSETS (439,651) (1,324,167)
EQUITY 22Contributed equity 596,675 402,675Accumulated surplus/(deficit) (1,036,326) (1,726,842)TOTAL EQUITY (439,651) (1,324,167)
See also the ‘Schedule of Assets and Liabilities by Service’.
The Statement of Financial Position should be read in conjunction with the accompanying notes.

Office of the Environmental Protection Authority Annual Report 2015 - 201640 |
OvERviEw AGEncy PERfORMAncE siGnificAnt issuEs disclOsuREscOntEnts
statement of changes in EquityFor the year ended 30 June 2016
Note Contributed equity
Accumulated surplus
Total equity
$ $ $Balance at 1 July 2014 443,675 (2,270,889) (1,827,214)Surplus/(deficit) – 544,047 544,047Transactions with owners in their capacity as owners:Capital appropriations 59,000 – 59,000Distributions to owners (100,000) – (100,000)Balance at 30 June 2015 402,675 (1,726,842) (1,324,167)
Balance at 1 July 2015 402,675 (1,726,842) (1,324,167)
Surplus/(deficit) – 690,516 690,516Transactions with owners in their capacity as owners:Capital appropriations 194,000 – 194,000Distributions to owners – – –Balance at 30 June 2016 596,675 (1,036,326) (439,651)
The Statement of Changes in Equity should be read in conjunction with the accompanying notes.
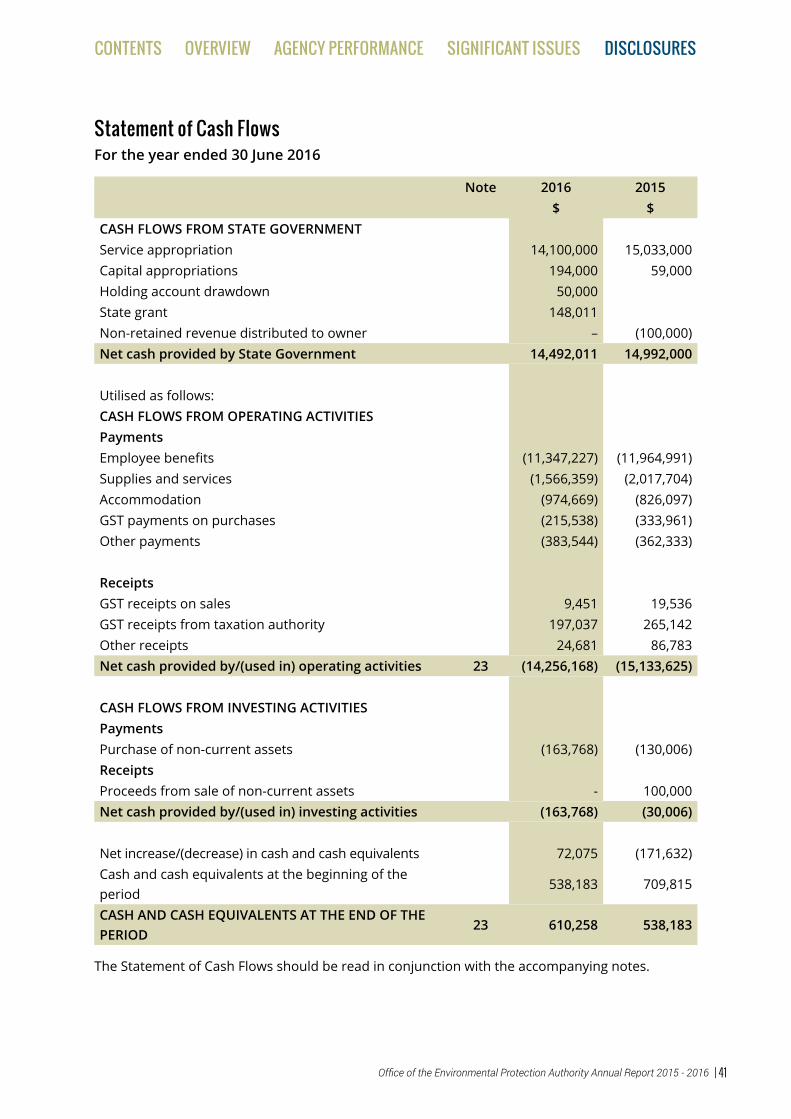
Office of the Environmental Protection Authority Annual Report 2015 - 2016 | 41
OvERviEw AGEncy PERfORMAncE siGnificAnt issuEs disclOsuREscOntEnts
statement of cash flowsFor the year ended 30 June 2016
Note 2016 2015$ $
CASH FLOWS FROM STATE GOVERNMENTService appropriation 14,100,000 15,033,000Capital appropriations 194,000 59,000Holding account drawdown 50,000State grant 148,011Non-retained revenue distributed to owner – (100,000)Net cash provided by State Government 14,492,011 14,992,000
Utilised as follows:CASH FLOWS FROM OPERATING ACTIVITIESPaymentsEmployee benefits (11,347,227) (11,964,991)Supplies and services (1,566,359) (2,017,704)Accommodation (974,669) (826,097)GST payments on purchases (215,538) (333,961)Other payments (383,544) (362,333)
ReceiptsGST receipts on sales 9,451 19,536GST receipts from taxation authority 197,037 265,142Other receipts 24,681 86,783Net cash provided by/(used in) operating activities 23 (14,256,168) (15,133,625)
CASH FLOWS FROM INVESTING ACTIVITIESPaymentsPurchase of non-current assets (163,768) (130,006)ReceiptsProceeds from sale of non-current assets - 100,000Net cash provided by/(used in) investing activities (163,768) (30,006)
Net increase/(decrease) in cash and cash equivalents 72,075 (171,632)Cash and cash equivalents at the beginning of the period
538,183 709,815
CASH AND CASH EQUIVALENTS AT THE END OF THE PERIOD
23 610,258 538,183
The Statement of Cash Flows should be read in conjunction with the accompanying notes.

Office of the Environmental Protection Authority Annual Report 2015 - 201642 |
OvERviEw AGEncy PERfORMAncE siGnificAnt issuEs disclOsuREscOntEnts
schedule of income and Expenses by serviceFor the year ended 30 June 2016
Service 1 - Environmental
Impact Assessment Services to the EPA
Service 2 - Environmental Management
Services to the EPA
Service 3 - Compliance
Monitoring Services to the Minister
Total
2016 2015 2016 2015 2016 2015 2016 2015
$ $ $ $ $ $ $ $
COST OF SERVICES
Expenses
Employee benefits expense 6,791,963 7,314,221 2,567,948 2,783,902 1,470,533 1,539,754 10,830,444 11,637,877
Supplies and services 1,346,894 1,008,166 505,595 368,369 240,376 197,395 2,092,865 1,573,930
Accommodation 507,116 528,702 182,245 190,002 103,008 107,393 792,369 826,097
Depreciation and amortisation expense 78,089 126,285 28,063 45,384 15,862 25,652 122,014 197,321
Loss on disposal of non-current asset 3,210 – 1,153 – 652 – 5,015 –
Other expenses 162,461 200,491 68,232 83,323 28,632 41,385 259,325 325,199
Total cost of services 8,889,733 9,177,865 3,353,236 3,470,980 1,859,063 1,911,579 14,102,032 14,560,424
Income
Other revenue 15,181 13,136 5,456 4,671 3,084 2,628 23,721 20,435
Gain on disposal of non-current assets – 5,847 – 2,101 – 1,187 – 9,135
Total income other than income from State Government
15,181 18,983 5,456 6,772 3,084 3,815 23,721 29,570
NET COST OF SERVICES 8,874,552 9,158,882 3,347,780 3,464,208 1,855,979 1,907,763 14,078,311 14,530,854
INCOME FROM STATE GOVERNMENT
Service appropriation 9,056,000 9,597,440 3,254,500 3,449,080 1,839,500 1,949,480 14,150,000 14,996,000
Services received free of charge 301,322 50,497 108,288 18,147 61,206 10,257 470,816 78,901
State grant – 148,011 – 148,011
Total income from State Government 9,357,322 9,647,937 3,510,799 3,467,227 1,900,706 1,959,737 14,768,827 15,074,901
SURPLUS/DEFICIT FOR THE PERIOD 482,770 489,055 163,019 3,019 44,727 51,973 690,516 544,047

Office of the Environmental Protection Authority Annual Report 2015 - 2016 | 43
OvERviEw AGEncy PERfORMAncE siGnificAnt issuEs disclOsuREscOntEnts
schedule of Assets and liabilities by serviceAs at 30 June 2016
Service 1 - Environmental
Impact Assessment Services to the EPA
Service 2 - Environmental Management
Services to the EPA
Service 3 - Compliance
Monitoring Services to the Minister
Total
2016 2015 2016 2015 2016 2015 2016 2015
$ $ $ $ $ $ $ $
Assets
Current assets 681,256 478,404 234,181 171,926 149,024 97,176 1,064,461 747,506
Non-current assets 598,906 551,700 205,874 198,267 131,011 112,064 935,791 862,031
Total assets 1,280,162 1,030,104 440,055 370,193 280,035 209,240 2,000,252 1,609,537
Liabilities
Current liabilities 1,093,708 1,456,098 375,962 523,285 239,248 295,770 1,708,918 2,275,154
Non-current liabilities
467,830 421,473 160,817 151,467 102,338 85,611 730,985 658,550
Total liabilities 1,561,538 1,877,571 536,779 674,752 341,586 381,381 2,439,903 2,933,704
NET ASSETS (281,376) (847,467) (96,724) (304,559) (61,551) (172,142) (439,561) (1,324,167)
The Schedule of Assets and Liabilities by Service should be read in conjunction with the accompanying notes.

Office of the Environmental Protection Authority Annual Report 2015 - 201644 |
OvERviEw AGEncy PERfORMAncE siGnificAnt issuEs disclOsuREscOntEnts
summary of consolidated Account Appropriations and income EstimatesFor the year ended 30 June 2016
2016 Estimate
2016 Actual
Variance 2016 Actual
2015 Actual
Variance
$ $ $ $ $ $Delivery of ServicesItem 96 Net amount appropriated to deliver services
14,150,000 14,150,000 – 14,150,000 14,996,000 (846,000)
Total appropriations provided to deliver services 14,150,000 14,150,000 – 14,150,000 14,996,000 (846,000)
Capital Capital appropriations 194,000 194,000 – 194,000 59,000 135,000
GRAND TOTAL 14,344,000 14,344,000 – 14,344,000 15,055,000 (711,000)
Details of Expenses by Service
Environmental Impact Assessment Services to the EPA
9,227,000 8,889,733 337,267 8,889,733 9,177,865 (288,132)
Environmental Management Services to the EPA 3,384,000 3,353,236 30,764 3,353,236 3,470,980 (117,744)
Compliance Monitoring Services to the Minister 1,837,000 1,859,063 (22,063) 1,859,063 1,911,579 (52,516)
Total Cost of Services 14,448,000 14,102,032 345,968 14,102,032 14,560,424 (458,392)
Less Total Income (150,000) (23,721) (126,279) (23,721) (29,570) 5,849
Net Cost of Services 14,298,000 14,078,311 219,689 14,078,311 14,530,854 (452,543)Adjustments (148,000) 71,689 (219,689) 71,689 465,146 (393,457)
Total appropriations provided to deliver services 14,150,000 14,150,000 – 14,150,000 14,996,000 (846,000)
Capital Expenditure Purchase of non-current
physical assets244,000 163,768 80,232 163,768 130,006 33,762
Adjustments for other
funding sources(50,000) 80,232 (130,232) 80232 (71,006) 151,238
Capital appropriations 194,000 244,000 (50,000) 244,000 59,000 185,000
Adjustments comprise movements in cash balances and other accrual items such as receivables, payables and superannuation. Note 27 ’Explanatory statement’ provides details of any significant variations between estimates and actual results for 2016 and between the actual results for 2016 and 2015.

Office of the Environmental Protection Authority Annual Report 2015 - 2016 | 45
OvERviEw AGEncy PERfORMAncE siGnificAnt issuEs disclOsuREscOntEnts
notes to the financial statementsFor the year ended 30 June 2016
Note 1. Australian Accounting StandardsGeneral
The Department’s financial statements for the year ended 30 June 2016 have been prepared in accordance with Australian Accounting Standards. The term ‘Australian Accounting Standards’ includes Standards and Interpretations issued by the Australian Accounting Standards Board (AASB).
The Department has adopted any applicable new and revised Australian Accounting Standards from their operative dates.
Early adoption of standards
The Department cannot early adopt an Australian Accounting Standard unless specifically permitted by TI 1101 Application of Australian Accounting Standards and Other Pronouncements. There has been no early adoption of Australian Accounting Standards that have been issued or amended (but not operative) by the Department for the annual reporting period ended 30 June 2016.
Note 2. Summary of significant accounting policies(a) General statement
The Department is a not-for-profit reporting entity that prepares general purpose financial statements in accordance with Australian Accounting Standards, the Framework, Statements of Accounting Concepts and other authoritative pronouncements of the AASB as applied by the Treasurer’s instructions. Several of these are modified by the Treasurer’s instructions to vary application, disclosure, format and wording.
The Financial Management Act and the Treasurer’s instructions impose legislative provisions that govern the preparation of financial statements and take precedence over Australian Accounting Standards, the Framework, Statements of Accounting Concepts and other authoritative pronouncements of the AASB.
Where modification is required and has had a material or significant financial effect upon the reported results, details of that modification and the resulting financial effect are disclosed in the notes to the financial statements.
(b) Basis of preparation
The financial statements have been prepared on the accrual basis of accounting using the historical cost convention.
The accounting policies adopted in the preparation of the financial statements have been consistently applied throughout all periods presented unless otherwise stated.

Office of the Environmental Protection Authority Annual Report 2015 - 201646 |
OvERviEw AGEncy PERfORMAncE siGnificAnt issuEs disclOsuREscOntEnts
The financial statements are presented in Australian dollars and all values are rounded to the nearest dollar ($) and $,000 for Note 27 and 28.
There are no judgements made in the process of applying the Department’s accounting policies that have a significant effect on the amounts recognised in the financial statements.
Note 3 ‘Key sources of estimation uncertainty’ discloses key assumptions made concerning the future, and other key sources of estimation uncertainty at the end of the reporting period, that have a significant risk of causing a material adjustment to the carrying amounts of assets and liabilities within the next financial year.
(c) Reporting entity
Mission
The Department’s mission is to support the work of the EPA by providing rigorous environmental impact assessment advice and policies, and to undertake effective compliance audits.
The Department is predominantly funded by Parliamentary appropriations. It does not provide services on a fee-for-service basis. The financial statements encompass all funds through which the Department controls resources to carry on its functions.
Services
The OEPA’s management framework is consistent with the Government goal for social and environmental responsibility, which is to ensure that economic activity is managed in a socially and environmentally responsible manner for the long-term benefit of the State.
The desired outcome is provision of quality advice to the EPA and the Minister for Environment on significant proposals, compliance and environmental issues.
The Department provides the following services:
1. Environmental Impact Assessment Services to the EPA
2. Environmental Management Services to the EPA
3. Compliance Monitoring Services to the Minister
(d) Contributed equity
AASB Interpretation 1038 Contributions by Owners Made to Wholly-Owned Public Sector Entities requires transfers in the nature of equity contributions, other than as a result of a restructure of administrative arrangements, to be designated by the Government (the owner) as contributions by owners (at the time of, or prior to transfer) before such transfers can be recognised as equity contributions. Capital appropriations have been designated as contributions by owners by TI 955 Contributions by Owners made to Wholly Owned Public Sector Entities and have been credited directly to Contributed equity.

Office of the Environmental Protection Authority Annual Report 2015 - 2016 | 47
OvERviEw AGEncy PERfORMAncE siGnificAnt issuEs disclOsuREscOntEnts
The transfers of net assets to/from other agencies, other than as a result of a restructure of administrative arrangements, are designated as contributions by owners where the transfers are non-discretionary and non-reciprocal.
(e) Income
Revenue recognition
Revenue is recognised and measured at the fair value of consideration received or receivable. Revenue is recognised for the major business activities as follows:
Service appropriations
Service Appropriations are recognised as revenues at fair value in the period in which the Department gains control of the appropriated funds. The Department gains control of appropriated funds at the time those funds are deposited to the bank account or credited to the ‘Amounts receivable for services’ (holding account) held at Treasury.
Grants, donations, gifts and other non-reciprocal contributions
Revenue is recognised at fair value when the Department obtains control over the assets comprising the contributions, usually when cash is received.
Other non-reciprocal contributions that are not contributions by owners are recognised at their fair value. Contributions of services are only recognised when a fair value can be reliably determined and the services would be purchased if not donated.
Royalties for Regions funds are recognised as revenue at fair value in the period in which the Department obtains control over the funds. The Department obtains control of the funds at the time the funds are deposited into the Department’s bank account.
Gains
Realised and unrealised gains are usually recognised on a net basis. These include gains arising on the disposal of non-current assets.
(f) Plant and equipment
Capitalisation/expensing of assets
Items of plant and equipment costing $5,000 or more are recognised as assets and the cost of utilising assets is expensed (depreciated) over their useful lives. Items of plant and equipment costing less than $5,000 are immediately expensed direct to the Statement of Comprehensive Income (other than where they form part of a group of similar items which are significant in total).
Initial recognition and measurement
Plant and equipment are initially recognised at cost.
For items of plant and equipment acquired at no cost or for nominal cost, the cost is the fair value at the date of acquisition.

Office of the Environmental Protection Authority Annual Report 2015 - 201648 |
OvERviEw AGEncy PERfORMAncE siGnificAnt issuEs disclOsuREscOntEnts
Subsequent measurement
Subsequent to initial recognition of an asset, historical cost is used for all plant and equipment. All items of plant and equipment are stated at historical cost less accumulated depreciation and accumulated impairment losses.
Derecognition
Upon disposal or derecognition of an item of plant and equipment, any gain or loss is shown in the statement of Comprehensive Income.
Depreciation
All non-current assets having a limited useful life are systematically depreciated over their estimated useful lives in a manner that reflects the consumption of their future economic benefits.
Depreciation is calculated using the straight line method, using rates which are reviewed annually. Estimated useful lives for each class of depreciable asset are:
Other plant and equipment 5 to 20 years
Information Technology 3 to 4 years
Marine equipment 3 to 10 years
(g) Intangible assets
Capitalisation/expensing of assets
Acquisitions of intangible assets costing $5,000 or more and internally generated intangible assets costing $50,000 or more are capitalised. The cost of utilising the assets is expensed (amortised) over their useful lives. Costs incurred below these thresholds are immediately expensed directly to the Statement of Comprehensive Income.
Intangible assets are initially recognised at cost. For assets acquired at no cost or for nominal cost, the cost is their fair value at the date of acquisition.
The cost model is applied for subsequent measurement requiring the asset to be carried at cost less any accumulated amortisation and accumulated impairment losses.
Amortisation for intangible assets with finite useful lives is calculated for the period of the expected benefit (estimated useful life which is reviewed annually) on the straight line basis. All intangible assets controlled by the Department have a finite useful life and zero residual value.
The expected useful lives for each class of intangible asset are:
Software(a) 3 to 5 years
(a) Software that is not integral to the operation of any related hardware.
Computer software
Software that is an integral part of the related hardware is recognised as plant and

Office of the Environmental Protection Authority Annual Report 2015 - 2016 | 49
OvERviEw AGEncy PERfORMAncE siGnificAnt issuEs disclOsuREscOntEnts
equipment. Software that is not an integral part of the related hardware is recognised as an intangible asset. Software costing less than $5,000 is expensed in the year of acquisition.
(h) Impairment of assets
Plant and equipment and intangible assets are tested for any indication of impairment at the end of each reporting period. Where there is an indication of impairment, the recoverable amount is estimated. Where the recoverable amount is less than the carrying amount, the asset is considered impaired and is written down to the recoverable amount and an impairment loss is recognised. Where an asset measured at cost is written down to recoverable amount, an impairment loss is recognised in profit or loss. As the Department is a not-for-profit entity, unless an asset has been identified as a surplus asset, the recoverable amount is the higher of an asset’s fair value less costs to sell and depreciated replacement cost.
The risk of impairment is generally limited to circumstances where an asset’s depreciation is materially understated, where the replacement cost is falling or where there is a significant change in useful life. Each relevant class of assets is reviewed annually to verify that the accumulated depreciation/amortisation reflects the level of consumption or expiration of the asset’s future economic benefits and to evaluate any impairment risk from falling replacement costs.
(i) Non-current assets (or disposal groups) classified as held for sale
Non-current assets (or disposal groups) held for sale are recognised at the lower of carrying amount and fair value less costs to sell, and are disclosed separately from other assets in the Statement of Financial Position. Assets classified as held for sale are not depreciated or amortised.
The Department has no assets classified as held for sale.
(j) Leases
The Department holds an operating lease for vehicles. Operating leases are expensed on a straight line basis over the lease term as this represents the pattern of benefits derived from the leased properties.
(k) Financial instruments
In addition to cash, the Department has two categories of financial instrument:
• Receivables; and• Financial liabilities measured at amortised cost.
Financial instruments have been disaggregated into the following classes:
• Financial Assets – Cash and cash equivalents – Restricted cash and cash equivalents – Receivables – Amounts receivable for services

Office of the Environmental Protection Authority Annual Report 2015 - 201650 |
OvERviEw AGEncy PERfORMAncE siGnificAnt issuEs disclOsuREscOntEnts
• Financial Liabilities – Payables
Initial recognition and measurement of financial instruments is at fair value which normally equates to the transaction cost or the face value. Subsequent measurement is at amortised cost using the effective interest method.
The fair value of short-term receivables and payables is the transaction cost or the face value because there is no interest rate applicable and subsequent measurement is not required as the effect of discounting is not material.
(l) Cash and cash equivalents
For the purpose of the Statement of Cash Flows, cash and cash equivalent (and restricted cash and cash equivalent) assets comprise cash on hand and short-term deposits with original maturities of three months or less that are readily convertible to a known amount of cash and which are subject to insignificant risk of changes in value.
(m) Accrued salaries
Accrued salaries (see note 20 ‘Payables’) represent the amount due to staff but unpaid at the end of the financial year. Accrued salaries are settled within a fortnight of the financial year end. The Department considers the carrying amount of accrued salaries to be equivalent to its fair value.
The accrued salaries suspense account (See note 13 ‘Restricted cash and cash equivalents’) consists of amounts paid annually into a suspense account over a period of 10 financial years to largely meet the additional cash outflow in each eleventh year when 27 pay days occur instead of the normal 26. No interest is received on this account.
(n) Amounts receivable for services (holding account)
The Department receives funding on an accrual basis. The appropriations are paid partly in cash and partly as an asset (holding account receivable). The accrued amount receivable is accessible on the emergence of the cash funding requirement to cover leave entitlements and asset replacement.
(o) Receivables
Receivables are recognised at original invoice amount less an allowance for any uncollectible amounts (i.e. impairment). The collectability of receivables is reviewed on an ongoing basis and any receivables identified as uncollectible are written-off against the allowance account. The allowance for uncollectible amounts (doubtful debts) is raised when there is objective evidence that the Department will not be able to collect the debts. The carrying amount is equivalent to fair value as it is due for settlement within 30 days.
(p) Payables
Payables are recognised at the amounts payable when the Department becomes obliged to make future payments as a result of a purchase of assets or services. The carrying amount is equivalent to fair value, as settlement is generally within 30 days.

Office of the Environmental Protection Authority Annual Report 2015 - 2016 | 51
OvERviEw AGEncy PERfORMAncE siGnificAnt issuEs disclOsuREscOntEnts
(q) Provisions
Provisions are liabilities of uncertain timing or amount and are recognised where there is a present legal or constructive obligation as a result of a past event and when the outflow of resources embodying economic benefits is probable and a reliable estimate can be made of the amount of the obligation. Provisions are reviewed at the end of each reporting period.
Provisions - employee benefits
All annual leave and long service leave provisions are in respect of employees’ services up to the end of the reporting period.
Annual leave
The liability for annual leave that is expected to be settled within 12 months after the end of the reporting period is recognised and measured at the undiscounted amounts expected to be paid when the liability is settled.
Annual leave that is not expected to be settled within 12 months after the end of the reporting period is recognised and measured at the present value of amounts expected to be paid when the liabilities are settled using the remuneration rate expected to apply at the time of settlement.
When assessing expected future payments consideration is given to expected future wage and salary levels including non-salary components such as employer superannuation contributions, as well as the experience of employee departures and periods of service. The expected future payments are discounted using market yields at the end of the reporting period on national government bonds with terms to maturity that match, as closely as possible, the estimated future cash outflows.
The provision for annual leave is classified as a current liability as the Department does not have an unconditional right to defer settlement of the liability for at least 12 months after the end of the reporting period.
Long service leave
The liability for long service leave that is expected to be settled within 12 months after the end of the reporting period is recognised and measured at the undiscounted amounts expected to be paid when the liability is settled.
Long service leave that is not expected to be settled within 12 months after the end of the reporting period is recognised and measured at the present value of amounts expected to be paid when the liabilities are settled using the remuneration rate expected to apply at the time of settlement.
When assessing expected future payments consideration is given to expected future wage and salary levels including non-salary components such as employer superannuation contributions, as well as the experience of employee departures and periods of service. The expected future payments are discounted using market yields at the end of the reporting period on national government bonds with terms to maturity that match, as closely as possible, the estimated future cash outflows.

Office of the Environmental Protection Authority Annual Report 2015 - 201652 |
OvERviEw AGEncy PERfORMAncE siGnificAnt issuEs disclOsuREscOntEnts
Unconditional long service leave provisions are classified as current liabilities as the Department does not have an unconditional right to defer settlement of the liability for at least 12 months after the end of the reporting period. Pre-conditional and conditional long service leave provisions are classified as non-current liabilities because the Department has an unconditional right to defer the settlement of the liability until the employee has completed the requisite years of service.
Purchased leave
The provision for purchased leave relates to Public Service employees who have entered into an agreement to self-fund up to an additional 10 weeks leave per calendar year. The provision recognises the value of salary set aside for employees and is measured at the undiscounted amounts expected to be paid when the liabilities are settled.
Superannuation
The Government Employees Superannuation Board (GESB) and other fund providers administer public sector superannuation arrangements in Western Australia in accordance with legislative requirements. Eligibility criteria for membership in particular schemes for public sector employees vary according to commencement and implementation dates.
Eligible employees contribute to the Pension Scheme, a defined benefit pension scheme closed to new members since 1987, or the Gold State Superannuation Scheme (GSS), a defined benefit lump sum scheme closed to new members since 1995.
Employees commencing employment prior to 16 April 2007 who were not members of either the Pension Scheme or the GSS became non contributory members of the West State Superannuation Scheme (WSS). Employees commencing employment on or after 16 April 2007 became members of the GESB Super Scheme (GESBS). From 30 March 2012, existing members of the WSS or GESBS and new employees have been able to choose their preferred superannuation fund provider. The Department makes contributions to GESB or other fund provider on behalf of employees in compliance with the Commonwealth Government’s Superannuation Guarantee (Administration) Act 1992. Contributions to these accumulation schemes extinguish the Department’s liability for superannuation charges in respect of employees who are not members of the Pension Scheme or GSS.
The GSS is a defined benefit scheme for the purposes of employees and whole-of-government reporting. However, it is a defined contribution plan for agency purposes because the concurrent contributions (defined contributions) made by the Department to GESB extinguishes the agency’s obligations to the related superannuation liability.
The Department has no liabilities under the Pension Scheme or the GSS. The liabilities for the unfunded Pension Scheme and the unfunded GSS transfer benefits attributable to members who transferred from the Pension Scheme, are assumed by the Treasurer. All other GSS obligations are funded by concurrent contributions made by the Department to the GESB.
The GESB makes all benefit payments in respect of the Pension Scheme and GSS, and is recouped from the Treasurer for the employer’s share.

Office of the Environmental Protection Authority Annual Report 2015 - 2016 | 53
OvERviEw AGEncy PERfORMAncE siGnificAnt issuEs disclOsuREscOntEnts
Provisions – other
Employment on-costs
Employment on-costs, including workers’ compensation insurance, are not employee benefits and are recognised separately as liabilities and expenses when the employment to which they relate has occurred. Employment on-costs are included as part of ‘Other expenses’ and are not included as part of the Department’s ‘Employee benefits expense’. The related liability is included in ‘Employment on-costs provision’.
(r) Superannuation expense
Superannuation expense is recognised in the profit or loss of the Statement of Comprehensive Income and comprises employer ontributions paid to the GSS (concurrent contributions), the WSS, the GESBS, or other superannuation funds. The employer contribution paid to the GESB in respect of the GSS is paid back into the Consolidated Account by the GESB.
(s) Assets and services received free of charge or for nominal cost
Assets or services received free of charge or for nominal cost that the Department would otherwise purchase if not donated, are recognised as income at the fair value of the assets or services where they can be reliably measured. A corresponding expense is recognised for services received. Receipts of assets are recognised in the Statement of Financial Position.
Assets or services received from other State Government agencies are separately disclosed under Income from State Government in the Statement of Comprehensive Income
(t) Comparative figures
Comparative figures are, where appropriate, reclassified to be comparable with the figures presented in the current financial year.
Note 3. Key sources of estimation uncertaintyKey estimates and assumptions concerning the future are based on historical experience and various other factors that have a significant risk of causing a material adjustment to the carrying amount of assets and liabilities within the next financial year.
Long Service Leave
Several estimations and assumptions used in calculating the Department’s long service leave provision include expected future salary rates, discount rates, employee retention rates and expected future payments. Changes in these estimations and assumptions may impact on the carrying amount of the long service leave provision.

Office of the Environmental Protection Authority Annual Report 2015 - 201654 |
OvERviEw AGEncy PERfORMAncE siGnificAnt issuEs disclOsuREscOntEnts
Note 4. Disclosure of changes in accounting policy and estimatesInitial application of an Australian Accounting Standard
The Department has applied the following Australian Accounting Standards effective for annual reporting periods beginning on or after 1 July 2015 that impacted the Authority.
AASB 2013-9
Amendments to Australian Accounting Standards – Conceptual Framework, Materiality and Financial Instruments
Part C of this Standard defers the application of AASB 9 to 1 January 2017. The application date of AASB 9 was subsequently deferred to 1 January 2018 by AASB 2014-1. The Department has not yet determined the application or the potential impact of AASB 9.
AASB 2014-8
Amendments to Australian Accounting Standards arising from AASB 9 (December 2014) – Application of AASB 9 (December 2009) and AASB 9 (December 2010) [AASB 9 (2009 & 2010)]
This Standard makes amendments to AASB 9 Financial Instruments (December 2009) and AASB 9 Financial Instruments (December 2010), arising from the issuance of AASB 9 Financial Instruments in December 2014. The Department has not yet determined the application or the potential impact of AASB 9.
AASB 2015-3
Amendments to Australian Accounting Standards arising from the Withdrawal of AASB 1031 Materiality
This Standard completes the withdrawal of references to AASB 1031 in all Australian Accounting Standards and Interpretations, allowing that Standard to effectively be withdrawn. There is no financial impact.
AASB 2015-7
AmendmentstoAustralianAccountingStandards-FairValueDisclosuresofNot-for-ProfitPublic Sector Entities [AASB 13]
This Standard relieves not-for-profit public sector entities from the reporting burden associated with various disclosures required by AASB 13 for assets within the scope of AASB 116 that are held primarily for their current service potential rather than to generate future net cash inflows. It has no financial impact.
Future impact of Australian Accounting Standards not yet operative
The Department cannot early adopt an Australian Accounting Standard unless specifically permitted by TI 1101 Application of Australian Accounting Standards and Other Pronouncements. Consequently, the Department has not applied early any of the following Australian Accounting Standards that have been issued that may impact the Department. Where applicable, the Department plans to apply these Australian Accounting Standards from their application date.
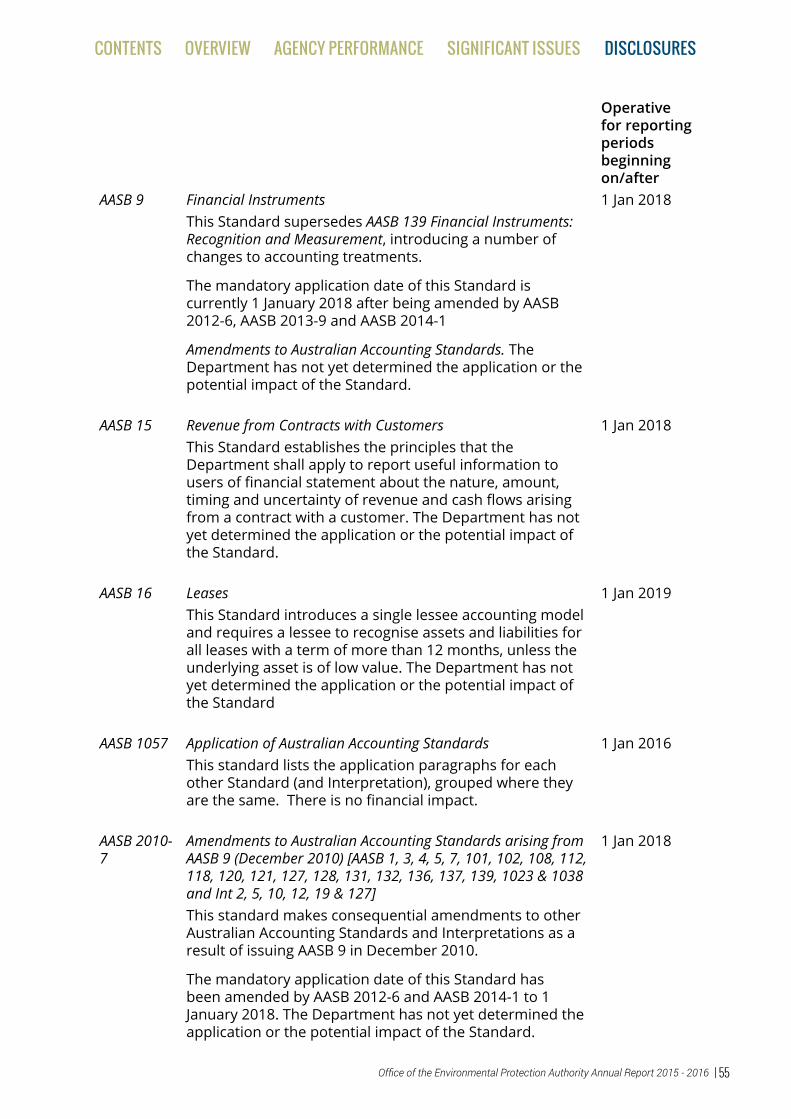
Office of the Environmental Protection Authority Annual Report 2015 - 2016 | 55
OvERviEw AGEncy PERfORMAncE siGnificAnt issuEs disclOsuREscOntEnts
Operative for reporting periods beginning on/after
AASB 9 Financial Instruments 1 Jan 2018This Standard supersedes AASB 139 Financial Instruments: Recognition and Measurement, introducing a number of changes to accounting treatments.
The mandatory application date of this Standard is currently 1 January 2018 after being amended by AASB 2012-6, AASB 2013-9 and AASB 2014-1
Amendments to Australian Accounting Standards. The Department has not yet determined the application or the potential impact of the Standard.
AASB 15 Revenue from Contracts with Customers 1 Jan 2018This Standard establishes the principles that the Department shall apply to report useful information to users of financial statement about the nature, amount, timing and uncertainty of revenue and cash flows arising from a contract with a customer. The Department has not yet determined the application or the potential impact of the Standard.
AASB 16 Leases 1 Jan 2019This Standard introduces a single lessee accounting model and requires a lessee to recognise assets and liabilities for all leases with a term of more than 12 months, unless the underlying asset is of low value. The Department has not yet determined the application or the potential impact of the Standard
AASB 1057 Application of Australian Accounting Standards 1 Jan 2016This standard lists the application paragraphs for each other Standard (and Interpretation), grouped where they are the same. There is no financial impact.
AASB 2010-7
Amendments to Australian Accounting Standards arising from AASB 9 (December 2010) [AASB 1, 3, 4, 5, 7, 101, 102, 108, 112, 118, 120, 121, 127, 128, 131, 132, 136, 137, 139, 1023 & 1038 and Int 2, 5, 10, 12, 19 & 127]
1 Jan 2018
This standard makes consequential amendments to other Australian Accounting Standards and Interpretations as a result of issuing AASB 9 in December 2010.
The mandatory application date of this Standard has been amended by AASB 2012-6 and AASB 2014-1 to 1 January 2018. The Department has not yet determined the application or the potential impact of the Standard.

Office of the Environmental Protection Authority Annual Report 2015 - 201656 |
OvERviEw AGEncy PERfORMAncE siGnificAnt issuEs disclOsuREscOntEnts
AASB 2014-1
Amendments to Australian Accounting Standards 1 Jan 2018
Part E of this Standard makes amendments to AASB 9 and consequential amendments to other Standards. It has not yet been assessed by the Department to determine the application or potential impact of the Standard.
AASB 2014-3
Amendments to Australian Accounting Standards – Accounting for Acquisitions of Interests in Joint Operations [AASB 1 & 11]
1 Jan 2016
The Department establishes Joint Operations in pursuit of its objectives and does not routinely acquire interests in Joint Operations. Therefore, there is no financial impact on application of the Standard.
AASB 2014-4
Amendments to Australian Accounting Standards – ClarificationofAcceptableMethodsofDepreciationandAmortisation [AASB 116 & 138]
1 Jan 2016
The adoption of this Standard has no financial impact for the Department as depreciation and amortisation is not determined by reference to revenue generation, but by reference to consumption of future economic benefits.
AASB 2014-5
Amendments to Australian Accounting Standards arising from AASB 15
1 Jan 2018
This Standard gives effect to the consequential amendments to Australian Accounting Standards (including Interpretations) arising from the issuance of AASB 15. The mandatory application date of this Standard has been amended by AASB 2015-8 to I January 2018. The Department has not yet determined the application or the potential impact of the Standard.
AASB 2014-7
Amendments to Australian Accounting Standards arising from AASB 9 (December 2014)
1 Jan 2018
This Standard gives effect to the consequential amendments to Australian Accounting Standards (including Interpretations) arising from the issuance of AASB 9 (December 2014). The Department has not yet determined the application or the potential impact of the Standard.
AASB 2014-9
Amendments to Australian Accounting Standards – Equity Method in Separate Financial Statements [AASB 1, 127 & 128]
1 Jan 2016
This Standard amends AASB 127, and consequentially amends AASB 1 and AASB 128, to allow entities to use the equity method of accounting for investments in subsidiaries, joint ventures and associates in their separate financial statements. The Department has not yet determined the application or the potential impact of the Standard.

Office of the Environmental Protection Authority Annual Report 2015 - 2016 | 57
OvERviEw AGEncy PERfORMAncE siGnificAnt issuEs disclOsuREscOntEnts
AASB 2014-10
Amendments to Australian Accounting Standards – Sale or Contribution of Assets between an Investor and its Associate or Joint Venture [AASB 10 & 128]
1 Jan 2016
This Standard amends AASB 10 and AASB 128 to address an inconsistency between the requirements in AASB 10 and those in AASB 128 (August 2011), in dealing with the sale or contribution of assets between an investor and its associate or joint venture. The Department has not yet determined the application or the potential impact of the Standard.
AASB 2015-1
Amendments to Australian Accounting Standards – Annual Improvements to Australian Accounting Standards 2012–2014 Cycle [AASB 1, 2, 3, 5, 7, 11, 110, 119, 121, 133, 134, 137 & 140]
1 Jan 2016
These amendments arise from the issuance of International Financial Reporting Standard Annual Improvements to IFRSs 2012–2014 Cycle in September 2014, and editorial corrections. The Department has determined that the application has no financial impact.
AASB 2015-2
Amendments to Australian Accounting Standards – Disclosure Initiative: Amendments to AASB 101 [AASB 7, 101, 134 & 1049]
1 Jan 2016
This Standard amends AASB 101 to provide clarification regarding the disclosure requirements in AASB 101. Specifically, the Standard proposes narrow-focus amendments to address some of the concerns expressed about existing presentation and disclosure requirements and to ensure entities are able to use judgement when applying a Standard in determining what information to disclose in their financial statements. There is no financial impact.
AASB 2015-6
Amendments to Australian Accounting Standards – Extending RelatedPartyDisclosurestoNot-for-ProfitPublicSectorEntities [AASB 10, 124 & 1049]
1 Jul 2016
The amendments extend the scope of AASB 124 to include application by not-for-profit public sector entities. Implementation guidance is included to assist application of the Standard by not-for-profit public sector entities. There is no financial impact.
AASB 2015-8
AmendmentstoAustralianAccountingStandards–EffectiveDate of AASB 15
1 Jan 2017
This Standard amends the mandatory effective date (application date) of AASB 15 Revenue from Contracts with Customers so that AASB 15 is required to be applied for annual reporting periods beginning on or after 1 January 2018 instead of 1 January 2017. The Department has not yet determined the application or the potential impact of AASB 15.

Office of the Environmental Protection Authority Annual Report 2015 - 201658 |
OvERviEw AGEncy PERfORMAncE siGnificAnt issuEs disclOsuREscOntEnts
AASB 2015-10
AmendmentstoAustralianAccountingStandards–EffectiveDate of Amendments 10 & 128
1 Jan 2016
This Standard defers the mandatory effective date (application date) of amendments to AASB 10 & 128 that were originally made in AASB 2014-10 so that the amendments are required to be applied for annual reporting periods beginning on or after 1 January 2018 instead of 1 January 2016. The Department has not yet determined the application or the potential impact of AASB 2014-10.
AASB 2016-2
Amendments to Australian Accounting Standards – Disclosure Initiative: Amendments to AASB 107
1 Jan 2017
This Standard amends AASB 107 Statement of Cash Flows (August 2015) to require disclosures that enable users of financial statements to evaluate changes in liabilities arising from financing activities, including both changes arising from cash flows and non-cash changes. There is not financial impact.
AASB 2016-3
Amendments to Australian Accounting Standards – ClarificationstoAASB15
1 Jan 2018
This Standard clarifies identifying performance obligations, principal versus agent considerations, timing of recognising revenue from granting a license, and, provides further transitional provisions to AASB 15. The Department has not yet determined the application or the potential impact.
AASB 2016-4
Amendments to Australian Accounting Standards –Recoverable Amount of Non-Cash-Generating Specialised Assets of Not-for-ProfitEntities
1 Jan 2017
This Standard clarifies that the recoverable amount of primarily non-cash-generating assets of not-for-profit entities, which are typically specialised in nature and held for continuing use of their service capacity, is expected to be materially the same as fair value determined under AASB 13 Fair Value Measurement.
The Department has not yet determined the application or the potential impact.

Office of the Environmental Protection Authority Annual Report 2015 - 2016 | 59
OvERviEw AGEncy PERfORMAncE siGnificAnt issuEs disclOsuREscOntEnts
Note 5. Employee benefits expense2016
$2015
$Wages and salaries(a) 9,859,837 10,586,908Superannuation – defined contribution plans(b) 970,607 1,050,969
10,830,444 11,637,877
(a) Includes the value of the fringe benefit to the employee plus the fringe benefits tax component, leave entitlements including superannuation contribution component.
(b) Defined contribution plans include West State, Gold State, GESB and other eligible funds.
Employment on-costs expenses, such as workers’ compensation insurance, are included at note 9 ‘Other expenses’.
Employment on-costs liability is included at note 21 ‘Provisions’.
Note 6. Supplies and services2016
$2015
$Communications 67,270 74,940Consultants and contractors(a) 1,791,215 1,324,056Consumables 90,881 86,179Travel 33,718 54,576Other 109,781 34,178
2,092,865 1,573,929
(a) Human Resource Services are supplied by the Department of Parks and Wildlife ($434,000).
Note 7. Depreciation and amortisation expense
2016 $
2015 $
DepreciationInformation technology assets 37,413 35,669Other plant and equipment 19,000 47,608Total depreciation 56,413 83,277AmortisationComputer software 65,601 114,044Total amortisation 65,601 114,044Total depreciation and amortisation 122,014 197,321

Office of the Environmental Protection Authority Annual Report 2015 - 201660 |
OvERviEw AGEncy PERfORMAncE siGnificAnt issuEs disclOsuREscOntEnts
Note 8. Accommodation2016
$2015
$The Atrium 792,369 826,097
792,369 826,097
Note 9. Other expenses2016
$2015
$Audit fees(a) 46,544 48,129Employment on-costs(b) 48,268 44,712Other employment costs 88,594 105,131Lease costs 63,935 95,472Repairs and Maintenance 11,984 31,756
259,325 325,200(a) See note 30 ‘Remuneration of auditor’.
(b) Includes workers compensation insurance and other employment on-costs.
Note 10. Other revenue2016
$2015
$Cost recoup for site visits, audits and administration 23,721 20,435
23,721 20,435
Note 11. Net gain/ (loss) on disposal of non-current assets
2016 $
2015 $
Proceeds from disposal of non-current assetsOther equipment – 100,000
Carrying amount of non-current assets disposedOther equipment (5,015) (90,865)Net gain/(loss) (5,015) 9,135
Note 12. Income from State Government2016
$2015
$Appropriation received during the period:Service appropriation(a) 14,150,000 14,996,000
14,150,000 14,996,000

Office of the Environmental Protection Authority Annual Report 2015 - 2016 | 61
OvERviEw AGEncy PERfORMAncE siGnificAnt issuEs disclOsuREscOntEnts
2016 $
2015 $
Services received free of charge from other State government agencies during the period:State Solicitor’s Office 470,816 78,901
470,816 78,901
State grantsStrategic Assessment of the Perth and Peel Region 148,011 –
148,011 –14,768,827 15,074,901
(a) Service appropriations fund the net cost of services delivered. Appropriation revenue comprises a cash component and a receivable (asset). The receivable (holding account) comprises the budgeted depreciation expense for the year and any agreed increase in leave liabilities during the year.
Note 13. Restricted cash and cash equivalents2016
$2015
$CurrentAccrued salaries suspense account(a) – 354,067
– 354,067
Non-currentAccrued salaries suspense account – –
– –
(a) Funds held in the suspense account for the purpose of meeting the 27th pay have been expended for the 27th pay in 2015–16.
Note 14. Receivables2016
$2015
$CurrentReceivables 187,443 103,636GST receivable 25,568 23,892
213,011 127,528
The Department does not hold any collateral or other credit enhancements as security for receivables.

Office of the Environmental Protection Authority Annual Report 2015 - 201662 |
OvERviEw AGEncy PERfORMAncE siGnificAnt issuEs disclOsuREscOntEnts
Note 15. Amounts receivable for services (Holding Account)
2016 $
2015 $
CurrentAsset Replacement 6,000 50,000
6,000 50,000Non-currentAsset Replacement 44,000Leave Liability 544,000 544,000
588,000 544,000594,000 594,000
Represents the non-cash component of service appropriations. It is restricted in that it can only be used for asset replacement or payment of leave liability.
Note 16. Other current assets2016
$2015
$CurrentPrepayments 235,192 31,795Total current 235,192 31,795
Note 17. Plant and equipment2016
$2015
$Information technologyAt cost 164,804 164,804Accumulated depreciation (129,848) (92,434)
34,956 72,370
Other plant and equipmentAt cost 132,844 133,434Accumulated depreciation (57,276) (43,530)
75,568 89,904110,524 162,274
Reconciliation of plant and equipment
Reconciliations of the carrying amounts of plant and equipment at the beginning and end of the reporting period are set out below.

Office of the Environmental Protection Authority Annual Report 2015 - 2016 | 63
OvERviEw AGEncy PERfORMAncE siGnificAnt issuEs disclOsuREscOntEnts
Information technology
$
Other plant and
equipment $
Total $
2016Carrying amount at start of period 72,370 89,904 162,274Additions – 9,679 9,679Disposal – (5,015) (5,015)Depreciation (37,414) (19,000) (56,414)Carrying amount at end of period 34,956 75,568 110,5242015Carrying amount at start of period 101,061 212,449 313,510Additions 6,978 15,928 22,906Disposal – (90,865) (90,865)Depreciation (35,669) (47,608) (83,277)Carrying amount at end of period 72,370 89,904 162,274
Note 18. Intangible assets2016
$2015
$Computer softwareAt cost 524,296 390,525Accumulated amortisation (287,029) (234,768)
237,267 155,757
Reconciliations2016
$2015
$Computer softwareCarrying amount at start of period 155,757 154,833Additions 147,111 114,967Amortisation expense (65,601) (114,043)Carrying amount at end of period 237,267 155,757
Note 19. Impairment of assetsThere were no indications of impairment to plant and equipment or intangible assets at 30 June 2016.
The Department held no goodwill or intangible assets with an indefinite useful life during the reporting period. At the end of the reporting period there were no intangible assets not yet available for use.
All surplus assets at 30 June 2016 have either been classified as assets held for sale or written-off.

Office of the Environmental Protection Authority Annual Report 2015 - 201664 |
OvERviEw AGEncy PERfORMAncE siGnificAnt issuEs disclOsuREscOntEnts
Note 20. Payables2016
$2015
$CurrentAccrued expenses 104,900 74,562Accrued salaries – 349,081Total current 104,900 423,643
Note 21. Provisions2016
$2015
$CurrentEmployeebenefitsprovisionAnnual leave(a)(c) 470,099 531,840Long service leave(b)(c) 1,119,403 1,302,915Total current 1,589,502 1,834,755
Other provisionsEmployment on-costs(d) 14,516 16,756
14,516 16,7561,604,018 1,851,511
Non-currentEmployeebenefitsprovisionLong service leave(b)(c) 724,370 652,590
724,370 652,590
Other provisionsEmployment on-costs(d) 6,615 5,960
6,615 5,960Total non-current 730,985 658,550Total provisions 2,335,003 2,510,061
(a) Annual leave liabilities have been classified as current as there is no unconditional right to defer settlement for at least 12 months after the end of the reporting period. Assessments indicate that actual settlement of the liabilities is expected to occur as follows:
2016 $
2015 $
Within 12 months of the end of the reporting period 178,449 326,485More than 12 months after the end of the reporting period 291,650 205,355
470,099 531,840
(b) Long service leave liabilities have been classified as current where there is no
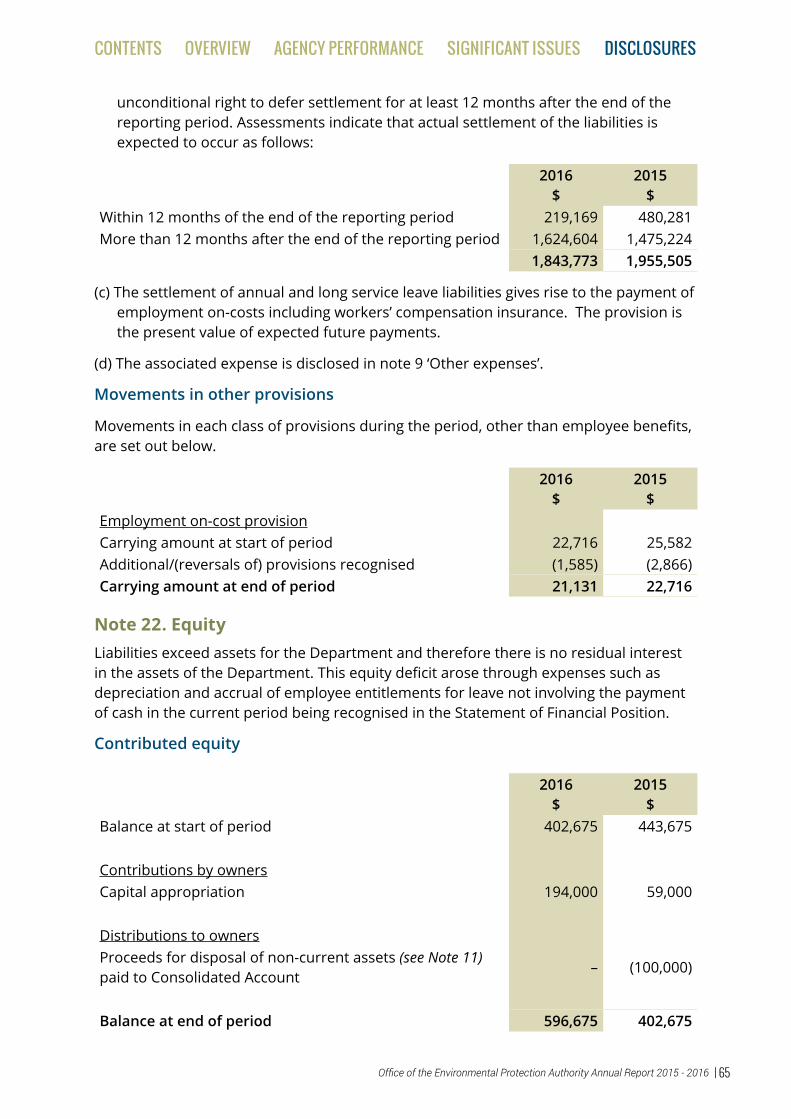
Office of the Environmental Protection Authority Annual Report 2015 - 2016 | 65
OvERviEw AGEncy PERfORMAncE siGnificAnt issuEs disclOsuREscOntEnts
unconditional right to defer settlement for at least 12 months after the end of the reporting period. Assessments indicate that actual settlement of the liabilities is expected to occur as follows:
2016 $
2015 $
Within 12 months of the end of the reporting period 219,169 480,281More than 12 months after the end of the reporting period 1,624,604 1,475,224
1,843,773 1,955,505
(c) The settlement of annual and long service leave liabilities gives rise to the payment of employment on-costs including workers’ compensation insurance. The provision is the present value of expected future payments.
(d) The associated expense is disclosed in note 9 ‘Other expenses’.
Movements in other provisions
Movements in each class of provisions during the period, other than employee benefits, are set out below.
2016 $
2015 $
Employment on-cost provisionCarrying amount at start of period 22,716 25,582Additional/(reversals of) provisions recognised (1,585) (2,866)Carrying amount at end of period 21,131 22,716
Note 22. EquityLiabilities exceed assets for the Department and therefore there is no residual interest in the assets of the Department. This equity deficit arose through expenses such as depreciation and accrual of employee entitlements for leave not involving the payment of cash in the current period being recognised in the Statement of Financial Position.
Contributed equity
2016 $
2015 $
Balance at start of period 402,675 443,675
Contributions by ownersCapital appropriation 194,000 59,000
Distributions to ownersProceeds for disposal of non-current assets (see Note 11) paid to Consolidated Account
– (100,000)
Balance at end of period 596,675 402,675

Office of the Environmental Protection Authority Annual Report 2015 - 201666 |
OvERviEw AGEncy PERfORMAncE siGnificAnt issuEs disclOsuREscOntEnts
2016 $
2015 $
Accumulated surplus/(deficit)Balance at start of period (1,726,842) (2,270,889)Result for the period 690,516 544,047
Balance at end of period (1,036,326) (1,726,842)Total Equity at end of period (439,651) (1,324,167)
Note 23. Notes to the Statement of Cash FlowsReconciliation of cash
Cash at the end of the financial year as shown in the Statement of Cash Flows is reconciled to the related items in the Statement of Financial Position as follows:
2016 $
2015 $
Cash and cash equivalents 610,258 184,116Restricted cash and cash equivalents (note 13 ‘Restricted cash and cash equivalents’)
– 354,067
610,258 538,183
Reconciliation of net cost of services to net cash flows provided by/(used in) operating activities
2016 $
2015 $
Net cost of services (14,102,032) (14,530,854)
Non-cash itemsDepreciation and amortisation expense (note 7 ‘Depreciation and amortisation expense’)
122,014 197,321
Services received free of charge (note 12 ‘Income from State Government’)
470,316 78,902
Net (gain)/loss on disposal of property, plant and equipment (note 11 ‘Net gain on disposal of non-current assets’)
5,015 (9,135)
Adjustment for other non-cash items (2,071)
(Increase)/decrease in assetsCurrent receivables (83,807) (16,413)Other current assets (203,397) (29,419)

Office of the Environmental Protection Authority Annual Report 2015 - 2016 | 67
OvERviEw AGEncy PERfORMAncE siGnificAnt issuEs disclOsuREscOntEnts
2016 $
2015 $
Increase/(decrease) in liabilitiesCurrent payables (318,743) (550,475)Current provisions (247,493) (161,542)Non-current provisions 72,435 (155,156)Net GST receipts/(payments)(a) 9,050 94,157Change in GST in receivables/payables(b) (1,676) (51,012)Net cash provided by/(used in) operating activities (14,256,168) (15,133,626)
(a) This is the net GST paid/received, i.e. cash transactions.
(b) This reverses out the GST in receivables and payables
Note 24. CommitmentsNon-cancellable operating lease commitments
2016 $
2015 $
Commitments for minimum lease payments are payable as follows:Within 1 year 17,907 57,158Later than 1 year and not later than 5 years 3,622 36,442
21,529 93,600
The Department has non-cancellable operating vehicle lease commitments. The lease terms vary dependent upon the vehicle and are for fixed terms payable monthly. The commitments are inclusive of GST.
Note 25. Contingent liabilities and contingent assetsThe Department has no contingent liabilities or contingent asserts as at 30 June 2016.
Note 26. Events occurring after the end of the reporting periodNo events have occurred after the end of the reporting period which would materially impact on the financial statements.
Note 27. Explanatory statementMajor variances between estimates (original budget) and actual results for 2016, and between actual results for 2015 and 2016 are shown below. Narratives are provided for key variations selected from observed major variances, which are generally greater than:
• 5% and $282,000 for the Statement of Comprehensive Income; and• 5% and $40,000 for the Statement of Financial Position; and• 5% and $282,000 for the Statement of Cash Flows.

Office of the Environmental Protection Authority Annual Report 2015 - 201668 |
OvERviEw AGEncy PERfORMAncE siGnificAnt issuEs disclOsuREscOntEnts
Statement of Comprehensive Income
Variance Note
Original Budget
2016
Actual 2016
Actual 2015
Variance between estimate
and actual
Variance between
actual result for 2016 and
2015$’000 $’000 $’000 $’000 $’000
COST OF SERVICESExpensesEmployee benefits expense
1, A 12,925 10,830 11,638 2,095 (808)
Accommodation expense 850 792 826 58 (34)Supplies and services 2, B 415 2,093 1,574 (1,678) 519Depreciation and amortisation expense
50 122 197 (72) (75)
Loss on disposal of non-current asset
– 5 – (5) 5
Other expenses 208 260 325 (52) (65)Total cost of services 14,448 14,102 14,560 346 (458)
IncomeRevenueOther revenue 150 24 20 126 4Total revenue 150 24 20 126 4GainsGain on disposal of non-current assets
– – 9 – (9)
Total Gains – – 9 – (9)Total income other than income from State Government
150 24 29 126 (5)
NET COST OF SERVICES 14,298 14,078 14,531 220 (453)Income from State GovernmentService appropriation 14,150 14,150 14,996 – (846)Services received free of charge
3, C – 471 79 (471) 392
State grant 148 148 – – 148Total income from State Government
14,298 14,769 15,075 (471) (306)
SURPLUS/(DEFICIT) FOR THE PERIOD
– 691 544 (691) 147
TOTAL COMPREHENSIVE INCOME FOR THE PERIOD
– 691 544 (691) 147

Office of the Environmental Protection Authority Annual Report 2015 - 2016 | 69
OvERviEw AGEncy PERfORMAncE siGnificAnt issuEs disclOsuREscOntEnts
Major Estimate and Actual (2016) Variance Narratives
1. ‘Employee benefits expense’ was impacted by the 2015–16 government’s recruitment freeze with a number of vacant positions not being filled during the year resulting with a 16% decrease in costs. Other staffing costs decreased in line with the having a reduction of FTE mid-year.
2. The ‘Supplies and services’ budget has been underestimated and will be reviewed in the next budget cycle. Increased legal services of expenditure occurred due to the impact of unexpected legal costs.
3. ‘Services received free of charge’ were from the State Solicitors Office and included legal services cost associated with the ROE 8 Court Case and Legal and Governance review.
Major Actual (2016) and Comparative (2015) Variance Narratives
A. ‘Employee benefits expense’ includes a downward movement for leave provision of 7% which reflects the continued emphasis on adhering to the OEPA Leave Management Plan. The FTE Levels at end 2014–15 was 84 (with an average of 87.5), while in 2015–16 it was 81 (with an average of 80) due to the impact of the government’s recruitment freeze.
B. 33% of ‘Supplies and services’ was associated with legal expenses including costs associated with the ROE 8 Court Case and Legal and Governance Review.
C. State Solicitors Office provided legal services free of charge associated with general legal services and for the ROE 8 court case and Legal and Governance Review.

Office of the Environmental Protection Authority Annual Report 2015 - 201670 |
OvERviEw AGEncy PERfORMAncE siGnificAnt issuEs disclOsuREscOntEnts
Statement of Financial Position
Variance Note
Original Budget
2015
Actual 2016
Actual 2015
Variance between estimate
and actual
Variance between
actual result for 2016 and
2015$’000 $’000 $’000 $’000 $’000
ASSETSCurrent AssetsCash and cash equivalents
4, D 89 610 184 (521) 426
Restricted cash and cash equivalents
E – – 354 – (354)
Receivables 5, F 162 213 128 (51) 85Amounts receivable for services
G 6 6 50 – (44)
Other current assets 6, H 2 235 32 (233) 203Total Current Assets 259 1,064 748 (805) 316
Non-Current AssetsAmounts receivable for services
588 588 544 – 44
Plant and equipment 7, I 433 111 162 322 (51)Intangible assets J 235 237 156 (2) 81Total Non-Current Assets 1,256 936 862 320 74TOTAL ASSETS 1,515 2,000 1,610 (485) 390
LIABILITIESCurrent LiabilitiesPayables 8, K 619 105 424 514 (319)Provisions 9, L 1,917 1,604 1,852 313 (248)Other 10 91 – – 91 –Total Current Liabilities 2,627 1,709 2,276 918 (567)Non-Current LiabilitiesProvisions 9, L 806 731 658 75 73Other 7 – – 7 –Total Non-Current Liabilities
813 731 658 82 73
TOTAL LIABILITIES 3,440 2,440 2,934 1,000 (494)NET ASSETS (1,925) (440) (1,324) (1,485) 884EQUITYContributed equity 697 596 403 101 193Accumulated surplus/(deficit)
(2,622) (1,036) (1,727) (1,586) 691
TOTAL EQUITY (1,925) (440) (1,324) (1,485) 844

Office of the Environmental Protection Authority Annual Report 2015 - 2016 | 71
OvERviEw AGEncy PERfORMAncE siGnificAnt issuEs disclOsuREscOntEnts
Major Estimate and Actual (2016) Variance Narratives
4. The ‘Cash and cash equivalents’ includes a carryover of $82,000 of capital works funds associated with the delay in the completion of the Case Management System. OEPA’s working cash limit for 2015–16 is $738,000.
5. ‘Receivables’ includes a salary recoup of $162,000 from the Western Australian Marine Science Institute (WAMSI) in 2015–16.
6. ‘Other current assets’ includes a prepayments of $182,000 for the first quarter of 2016–17 for accommodation paid to the Department of Environmental Regulation.
7. The variance in ‘Plant and equipment’ was due to sale of Marine equipment during 2014–15.
8. ‘The ‘Payables’ amount is impacted by an outstanding amount of $96,000 due to Australian Taxation Office for 30 June PAYG.
9. ‘Provisions’ resulted in a reduction in leave liability through the continuation of the OEPA’s Leave Management Policy.
10. The ‘Other’ in estimates is associated with accrued wages of which there is none accrued for 2015–16, see ‘Payables’ in the Statement of Financial Position. (See note 20)
Major Actual (2016) and Comparative (2015) Variance Narratives
D. The ‘Cash and cash equivalents’ includes a carryover of $82,000 of capital works funds associated with the delay in the completion of the Case Management System. OEPA’s working cash limit for 2015–16 is $738,000
E. The funds identified in the 2014–15 ‘Restricted cash and cash equivalents’ was restricted cash for the 27th pay ($354,000) which was received in 2015–16 for payment of the 27th pay.
F. ‘Receivables’ have increased due to the timing of the collection of a salary recoup from WAMSI for $162,000.
G. Current amounts ‘Amounts receivable for services’ has been adjusted to reflect the decrease in drawdowns being received in 2016–17 for asset replacement.
H. ‘Other current assets’ (prepayments) have increased by $203,000 due to the payment of accommodation and licensing costs for 2016–17 in 2015–16.
I. ‘Plant and equipment’ has a 31% decrease due to the scrapping of obsolete equipment and normal depreciation.
J. ‘Intangible assets’ was impacted with the delay in the completion of the Case Management System due to the Legal and Governance review required for the approvals process resulting in an underspend of $80,000 for 2015–16.
K. Current ‘Payables’ has reduced by 75%, as there is no accrued salaries for 2015–16.
L. ‘Provisions’ for Long Service Leave increased by 11%, a recognition of an additional $73,000 for staff associated leave liabilities. OEPA has a Leave Management Policy in place to reduce leave liability overall.

Office of the Environmental Protection Authority Annual Report 2015 - 201672 |
OvERviEw AGEncy PERfORMAncE siGnificAnt issuEs disclOsuREscOntEnts
Statement of Cash Flow
Variance Note
Original Budget
2016
Actual 2016
Actual 2015
Variance between estimate
and actual
Variance between
actual result for 2016 and
2015$’000 $’000 $’000 $’000 $’000
CASH FLOWS FROM STATE GOVERNMENTService appropriation M 14,100 14,100 15,033 – (933)Capital appropriations 194 194 59 – 135Non-retained revenue distributed to owner – (100) – 100
Holding account drawdowns 50 50 – – 50
State grant 148 148 – – 148Net cash provided by State Government 14,492 14,492 14,992 – (500)
Utilised as follows:CASH FLOWS FROM OPERATING ACTIVITIESPaymentsEmployee benefits 11, N (13,199) (11,347) (11,965) (1,852) 618Supplies and services 12, O (465) (1,566) (2,018) 1,101 452Accommodation (850) (975) (826) 125 (149)GST payments on purchases – (216) (334) 216 118
Other payments (666) (384) (362) (282) (22)ReceiptsGST receipts 420 206 284 214 (78)Other receipts 150 24 87 126 (63)Net cash provided by/(used in) operating activities (14,610) (14,256) (15,134) (354) 878
CASH FLOWS FROM INVESTING ACTIVITIESPaymentsPurchase of non-current physical assets (244) (164) (130) (80) (34)
ReceiptsProceeds from sale of non-current physical assets – – 100 – (100)
Net cash provided by/(used in) investing activities (244) (164) (30) (80) (134)
Net increase/(decrease) in cash and cash equivalents (362) 72 (172) (434) 244
Cash and cash equivalents at the beginning of the period
451 538 710 (87) (172)
CASH AND CASH EQUIVALENTS AT THE END OF THE PERIOD
89 610 538 (521) 72

Office of the Environmental Protection Authority Annual Report 2015 - 2016 | 73
OvERviEw AGEncy PERfORMAncE siGnificAnt issuEs disclOsuREscOntEnts
Major Estimate and Actual (2016) Variance Narratives
11. ‘Employee benefits expense’ was impacted by the 2015–16 government’s recruitment freeze with a number of vacant positions not being filled during the year resulting with a 16% decrease in costs. Other staffing costs decreased in line with the having a reduction of FTE mid-year.
12. The ‘Supplies and services’ budget has been underestimated and will be reviewed in the next budget cycle. Increased legal services of expenditure occurred due to the impact of unexpected legal costs.
Major Actual (2016) and Comparative (2015) Variance Narratives
M. The 6% decrease in appropriations received reflects the continuing identification of savings measures.
N. ‘Supplies and services’ in 2014–15 included a 2013–14 payment to the Department of Environmental Protection for accommodation.
O. 33% of ‘Supplies and services’ was associated with legal expenses including costs associated with the ROE 8 Court Case and Legal and Governance Review.
Note 28. Financial instruments(a) Financial risk management objectives and policies
Financial instruments held by the Department are cash and cash equivalents, restricted cash and cash equivalents, receivables and payables. The Department has limited exposure to financial risks. The Department’s overall risk management program focuses on managing the risks identified below.
Credit risk
Credit risk arises when there is the possibility of the Department’s receivables defaulting on their contractual obligations resulting in financial loss to the Department.
The maximum exposure to credit risk at the end of the reporting period in relation to each class of recognised financial assets is the gross carrying amount of those assets inclusive of any allowance for impairment as shown in the table at note 28(c) ‘Financial instruments disclosures’ and note 14 ‘Receivables’.
Credit risk associated with the Department’s financial assets is minimal because the main receivable is the amounts receivable for services (holding account). For receivables other than government, the Department trades only with recognised, creditworthy third parties. The Department has policies in place to ensure that sales of products and services are made to customers with an appropriate credit history. In addition, receivable balances are monitored on an ongoing basis with the result that the Department’s exposure to bad debts is minimal. At the end of the reporting period there were no significant concentrations of credit risk.

Office of the Environmental Protection Authority Annual Report 2015 - 201674 |
OvERviEw AGEncy PERfORMAncE siGnificAnt issuEs disclOsuREscOntEnts
Liquidity risk
Liquidity risk arises when the Department is unable to meet its financial obligations as they fall due.
The Department is exposed to liquidity risk through its trading in the normal course of business.
The Department has appropriate procedures to manage cash flows including drawdown of appropriations by monitoring forecast cash flows to ensure that sufficient funds are available to meet its commitments.
Market risk
Market risk is the risk that changes in market prices such as foreign exchange rates and interest rates will affect the Department’s income or the value of its holdings of financial instruments. The Department does not trade in foreign currency and is not materially exposed to other price risks.
(b) Categories of financial instruments
The carrying amounts of each of the following categories of financial assets and financial liabilities at the end of the reporting period are:
2016 $,000
2015 $,000
Financial AssetsCash and cash equivalents 610 184Restricted cash and cash equivalents – 354Receivables(a) 781 697
Financial LiabilitiesFinancial liabilities measured at amortised cost 105 424
(a) The amount of receivables excludes GST recoverable from the ATO (statutory receivable).
(c) Financial instrument disclosures
Credit risk
The following table details the Department’s maximum exposure to credit risk and the ageing analysis of financial assets. The Department’s maximum exposure to credit risk at the end of the reporting period is the carrying amount of financial assets as shown below. The table discloses the ageing of financial assets that are past due but not impaired and impaired financial assets. The table is based on information provided to senior management of the Department.
The Department does not hold any collateral as security or other credit enhancement relating to the financial assets it holds.

Office of the Environmental Protection Authority Annual Report 2015 - 2016 | 75
OvERviEw AGEncy PERfORMAncE siGnificAnt issuEs disclOsuREscOntEnts
Ageing analysis of financial assets
Past due but not impairedCarrying Amount
Not past due
and not impaired
Up to 1 month
1-3 months
3 months
to 1 year
1-5 years
More than 5 years
Impaired financial assets
$000 $000 $000 $000 $000 $000 $000 $0002016Cash and cash equivalents 610 610 – – – – –
Restricted cash and cash equivalents
– – – – – – –
Receivables(a) 187 – 182 5 – – – –Amounts receivable for services
594 594 – – – – – –
1,391 1,204 182 5 – – – –2015Cash and cash equivalents 184 184 – – – – – –
Restricted cash and cash equivalents
354 354 – – – – – –
Receivables(a) 103 – 103 – – – – –Amounts receivable for services
594 594 – – – – – –
1,235 1,132 103 – – – – –
(a) The amount of receivables excludes the GST recoverable from the ATO (statutory receivable).

Office of the Environmental Protection Authority Annual Report 2015 - 201676 |
OvERviEw AGEncy PERfORMAncE siGnificAnt issuEs disclOsuREscOntEnts
Liquidity risk and interest rate exposure
The following table details the Department’s interest rate exposure and the contractual maturity analysis of financial assets and financial liabilities. The maturity analysis section includes interest and principal cash flows. The interest rate exposure section analyses only the carrying amounts of each item.
Interest rate exposure and maturity analysis of financial assets and financial liabilities
Interest rate exposure (Nil)
Maturity dates
Weighted Average Effective Interest
Rate
Carrying Amount
Non-interest bearing
Nominal Amount
Up to 1 month
1-3 months
3 months
to 1 year
1-5 years
More than
5 years
% $000 $000 $000 $000 $000 $000 $000 $0002016Financial Assets
Cash and cash equivalents 610 610 610 610 – – – –
Restricted cash and cash equivalents
– – – – – – – –
Receivables(a) 187 187 187 187 – – – –
Amounts receivable for services
594 594 594 – – 6 – 588
1,391 1,391 1,391 797 – 6 – 588Financial Liabilities
Payables 105 105 105 105 – – – –
105 105 105 105 – – – –
2015Financial Assets
Cash and cash equivalents 184 184 184 184 – – – –
Restricted cash and cash equivalents
354 354 354 354 – – – –
Receivables(a) 103 103 103 103 – – – –
Amounts receivable for services
594 594 594 – – 50 – 544
1,235 1,235 1,235 641 – 50 – 544Financial Liabilities
Payables 424 424 424 424 – – – –
424 424 424 424 – – – –
(a) The amount of receivables excludes the GST recoverable from the ATO (statutory receivable).
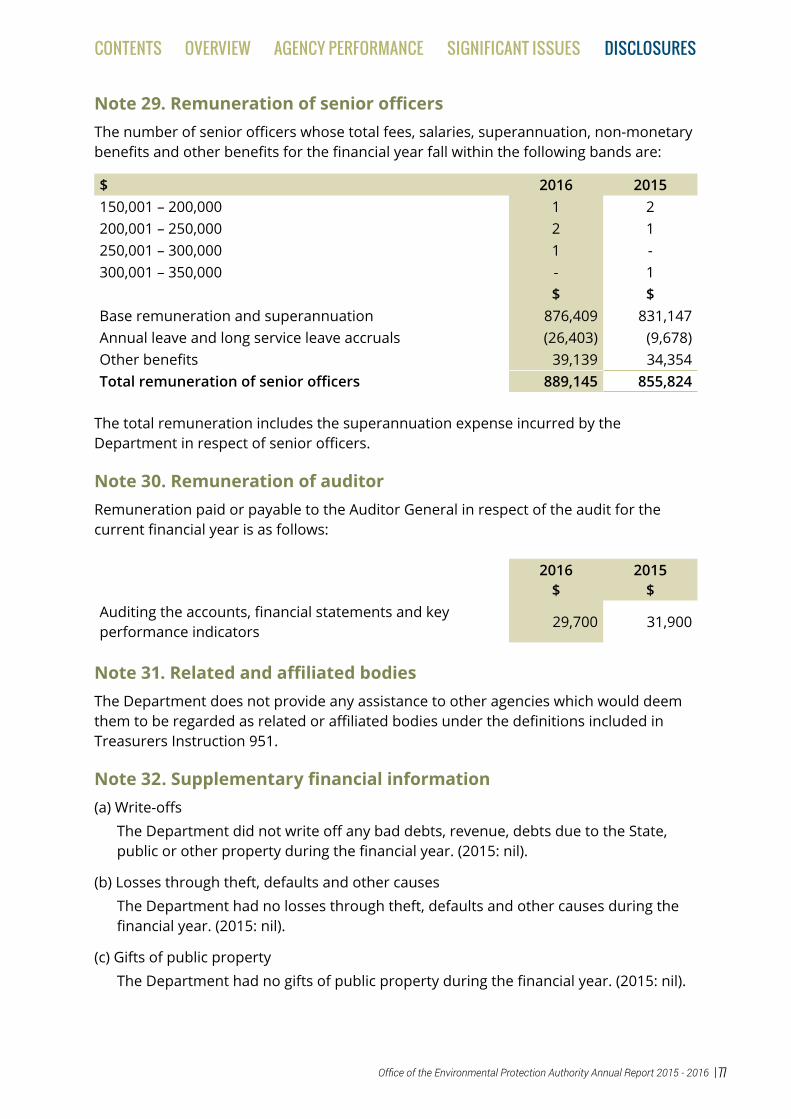
Office of the Environmental Protection Authority Annual Report 2015 - 2016 | 77
OvERviEw AGEncy PERfORMAncE siGnificAnt issuEs disclOsuREscOntEnts
Note 29. Remuneration of senior officers The number of senior officers whose total fees, salaries, superannuation, non-monetary benefits and other benefits for the financial year fall within the following bands are:
$ 2016 2015150,001 – 200,000 1 2200,001 – 250,000 2 1250,001 – 300,000 1 -300,001 – 350,000 - 1
$ $Base remuneration and superannuation 876,409 831,147Annual leave and long service leave accruals (26,403) (9,678)Other benefits 39,139 34,354Total remuneration of senior officers 889,145 855,824
The total remuneration includes the superannuation expense incurred by the Department in respect of senior officers.
Note 30. Remuneration of auditor Remuneration paid or payable to the Auditor General in respect of the audit for the current financial year is as follows:
2016 $
2015 $
Auditing the accounts, financial statements and key performance indicators
29,700 31,900
Note 31. Related and affiliated bodiesThe Department does not provide any assistance to other agencies which would deem them to be regarded as related or affiliated bodies under the definitions included in Treasurers Instruction 951.
Note 32. Supplementary financial information(a) Write-offs
The Department did not write off any bad debts, revenue, debts due to the State, public or other property during the financial year. (2015: nil).
(b) Losses through theft, defaults and other causesThe Department had no losses through theft, defaults and other causes during the financial year. (2015: nil).
(c) Gifts of public propertyThe Department had no gifts of public property during the financial year. (2015: nil).

Office of the Environmental Protection Authority Annual Report 2015 - 201678 |
OvERviEw AGEncy PERfORMAncE siGnificAnt issuEs disclOsuREscOntEnts
Key Performance indicatorscertification of Key Performance indicators For the year ended 30 June 2016
I hereby certify that the key performance indicators are based on proper records, are relevant and appropriate for assisting users to assess the Office of the Environmental Protection Authority’s performance, and fairly represent the performance of the Office of the Environmental Protection Authority for the financial year ended 30 June 2016.
Kim Taylor
Accountable Authority
23 August 2016

Office of the Environmental Protection Authority Annual Report 2015 - 2016 | 79
OvERviEw AGEncy PERfORMAncE siGnificAnt issuEs disclOsuREscOntEnts
detailed Key Performance indicatorsPerformance InformationThe Office of the Environmental Protection Authority (OEPA) was established as a separate Department in November 2009. The OEPA works to support the Government’s goal of ensuring that economic activity is managed in a socially and environmentally responsible manner for the long term benefit of the State. It supports this goal by working to deliver quality advice to the EPA and Minister on significant proposals, compliance and environmental issues.
It should be noted that the OEPA’s performance indicators were reviewed to be more robust, contemporary and fit for purpose and changed on the 22 January 2014.
As these indicators (KPI 1, 2, 4 and 6) were only introduced in 2014–15, the trend data for 3 – 4 years is not available.
The OEPA has three key services that contribute to the above outcome and against which the Department’s effectiveness and efficiency is reported.
1. Environmental impact assessment services to the Environmental Protection Authority (EPA).
2. Environmental management services to the Environmental Protection Authority (EPA).
3. Compliance monitoring services to the Minister

Office of the Environmental Protection Authority Annual Report 2015 - 201680 |
OvERviEw AGEncy PERfORMAncE siGnificAnt issuEs disclOsuREscOntEnts
Outcomes and Key Effectiveness indicatorsOutcome: Quality advice to the Environmental Protection Authority (EPA) and Minister for Environment (the Minister) on significant proposals, compliance and environmental issues.
Environmental impact assessment services to the EPA.1. The EPA’s satisfaction with the Office of the Environmental Protection
Authority’s (OEPA) Environmental Impact Assessment (EIA) services, during the year, in line with Best Practice Principles of EIA
2014-15 Actual
2015-16 Target
2015-16 Actual
2015-16 Variance of Target to Actual
Variance of Actual 2014-15
and 2015-16
The EPA’s satisfaction with the Office of the Environmental Protection Authority’s (OEPA) Environmental Impact Assessment (EIA) services during the year, in line with Best Practice Principles of EIA
89% 80% 88% 8% (1)%
Explanatory Notes
In order to gauge the standard of assessment services provided by the OEPA to the EPA, the EPA rates the quality of the OEPA’s EIA services in comparison to principles of EIA best practice (currently, the International Association for Impact Assessment (IAIA)’s Principles of EIA Best Practice). This is done by means of a survey completed by each member of the EPA upon delivery and EPA endorsement of each assessment.
Following the consideration of each EPA assessment report (12 for 2015–16), the EPA board members evaluate the quality of the assessment of the proposal undertaken by the Office of the Environmental Protection Authority with an 82% survey response rate for 2015–16.
During 2015–16 the EPA’s satisfaction with the OEPA services exceeded the target set. The Projects Eastern Ridge Revised Proposal and Perth-Darwin National Highway (Swan Valley Section) both received a satisfaction rate of 100%. Officers of OEPA kept the EPA Board informed on all aspects of the projects including site visits and detailed information pertaining to the assessments.

Office of the Environmental Protection Authority Annual Report 2015 - 2016 | 81
OvERviEw AGEncy PERfORMAncE siGnificAnt issuEs disclOsuREscOntEnts
2. Percentage of project-specific conditions which did not require significant change following the appeal process.
2014-15 Actual
2015-16 Target
2015-16 Actual
2015-16 Variance of Target to Actual
Variance of Actual 2014-15
and 2015-16
Percentage of project-specific conditions which did not require significant change following the appeal process
99% 80% 82% 2% (17)%
Explanatory Notes
At the completion of an assessment of a significant proposal, the EPA publicly releases its report and recommended conditions to the Minister for Environment. The recommended conditions may subsequently be amended as a result of an appeal, the decision making authority consultation process, or by the Minister.
This effectiveness indicator demonstrates the quality of the OEPA’s EIA advice to the EPA by examining the extent to which the OEPA has avoided the need for significant changes to project specific conditions.
Whether a change to a condition is a significant change is determined on a case by case basis but will generally involve one of the following:
A substantial change to the form of a condition; The deletion of a condition or addition ofanewcondition;Asubstantialchangetotheoutcomeorobjectivespecifiedinacondition;AsubstantialchangetothespecifiedrequirementsofanEnvironmentalManagement plan or environmental monitoring plan; or A substantial change to a prescribed action to be taken.
During 2015–16 – of 14 ministerial statements (with 33 project specific conditions) two had a significant change to conditions required as a result of the above processes.
The 17% variance between the 2014–15 value (99%) and the 2015–16 value (82%) can primarily be attributed to the Minister of Environment granting approval (subject to four new conditions) for the City of Geraldton-Greenough Town to amend its Town Planning Scheme (Scheme No. 1A– Brand Highway, Cape Burney), when the Environmental Protection Authority (EPA) had previously recommended that the scheme amendment should not be approved and, as a result, the EPA did not recommend any conditions (nil conditions).
This addition of four new conditions by the Minister contributed to 12% reduction in the KPI for 2015–16 (from 99% to 87%).
The remaining reduction in the 2015–16 value (from 87% to 82%) can be attributed to one other proposal (the Yoongarillup Mineral Sands Project) where the Minister for

Office of the Environmental Protection Authority Annual Report 2015 - 201682 |
OvERviEw AGEncy PERfORMAncE siGnificAnt issuEs disclOsuREscOntEnts
Environment made two substantial changes to the conditions of approval in response to community concerns.
3. Percentage of assessments that met agreed timelines.
2012-13 Actual
2013-14 Actual
2014-15 Actual
2015-16 Target
2015-16 Actual
2015-16 Variance of Target to Actual
Variance of Actual 2014-15
and 2015-16
Percentage of assessments that met agreed timelines
81% 88% 100% 80% 67% (13)% (33)%
Explanatory Notes
Timelines for an assessment may vary according to the complexity of the project and are usually agreed with the proponent soon after the level of assessment is determined.
This KPI measures the OEPA’s effectiveness in completing the assessment advice to EPA in a timely manner.
The EPA has adopted a practice of publishing in its assessment report to the Minister whether EPA has met the timeline objective.
For calculation purposes the date of completion of the assessment is the date the EPA Chairman signs the report.
The 2015–16 actual is less than the 2015–16 target due to the greater complexity of the proposals assessed and the increased detail of policy consideration.
During 2015–16 – of the 12 assessments, eight met the agreed timelines in full.

Office of the Environmental Protection Authority Annual Report 2015 - 2016 | 83
OvERviEw AGEncy PERfORMAncE siGnificAnt issuEs disclOsuREscOntEnts
Environmental management services to the EPA4. The EPA’s satisfaction with the OEPA’s provision of environmental
management services during the year
2014-15 Actual
2015-16 Target
2015-16 Actual
2015-16 Variance of Target to Actual
Variance of Actual 2014-15
and 2015-16
The EPA’s satisfaction with the OEPA’s provision of environmental management services during the year
92% 80% 97% 17% 5%
Explanatory Notes
The OEPA undertakes a range of environment management services to the EPA, including preparing policies, guidelines and strategic advice. The EPA determines the quality of the environmental management services provided by the OEPA by rating each product after it has been considered.
This effectiveness indicator measures the EPA’s rating of the quality of the OEPA’s environmental management services in comparison with desirable underlying qualities.
Each of the members of the EPA who participate in a decision rates the product on a scale of one to five (poor to excellent) and the scores of each member are averaged, combined and proportionally adjusted to a percentage. The final indicator is the average rating awarded to all environmental management services endorsed by the EPA during the period, representing its overall satisfaction with the environmental management services provided by the OEPA.
During 2015-16 the EPA’s satisfaction with the OEPA services exceeded the target set. In response to past ratings which showed that the only area within this KPI that needed improvement was the level of EPA satisfaction with OEPA’s consultation with stakeholder on policy, the OEPA focussed on improvements in this area during 2015–16. This focus resulted in a high level of satisfaction for this KPI.

Office of the Environmental Protection Authority Annual Report 2015 - 201684 |
OvERviEw AGEncy PERfORMAncE siGnificAnt issuEs disclOsuREscOntEnts
Compliance monitoring services to the MinisterThe OEPA’s provision of compliance services to the Minister under section 47 and 48 of the Environmental Protection (EP) Act.
The OEPA monitors compliance with conditions and informs Minister when such conditions are no longer met.
5. Percentage of all projects that have been audited that are compliant with the Ministerial conditions:
2012-13 Actual
2013-14 Actual
2014-15 Actual
2015-16 Target
2015-16 Actual
2015-16 Variance of Target to Actual
Variance of Actual 2014-15
and 2015-16
Percentage of all projects that have been audited that are compliant with the Ministerial conditions
84% 87% 97% 80% 98% 18% 1%
Explanatory Notes
The Minister imposes conditions (Ministerial Conditions) on proposals in order to ensure that they are managed in an environmentally acceptable manner.
A compliance management program is developed annually and using a priority matrix identifies sixty (60) Ministerial Statements to be audited.
In 2014–2015 – Fifty eight projects (97%) were identified to be in compliance through the audit program.
In 2015–16 – Fifty nine projects (98%) were identified to be in compliance through the audit program.
This indicator measures the effectiveness of the compliance management program in ensuring proponents comply with the ministerial conditions imposed on proposal. Overtime stakeholders will be able to see how effective the program has been in ensuring proponents comply with ministerial conditions imposed.
The compliance management program undertaken by the OEPA since its formation in 2009, has raised the proponent’s awareness that their proposals may be monitored by the OEPA. The outcome of the 2015–16 program was higher than predicted which demonstrates that proponents are ensuring compliance with the range of conditions applied to their proposals.
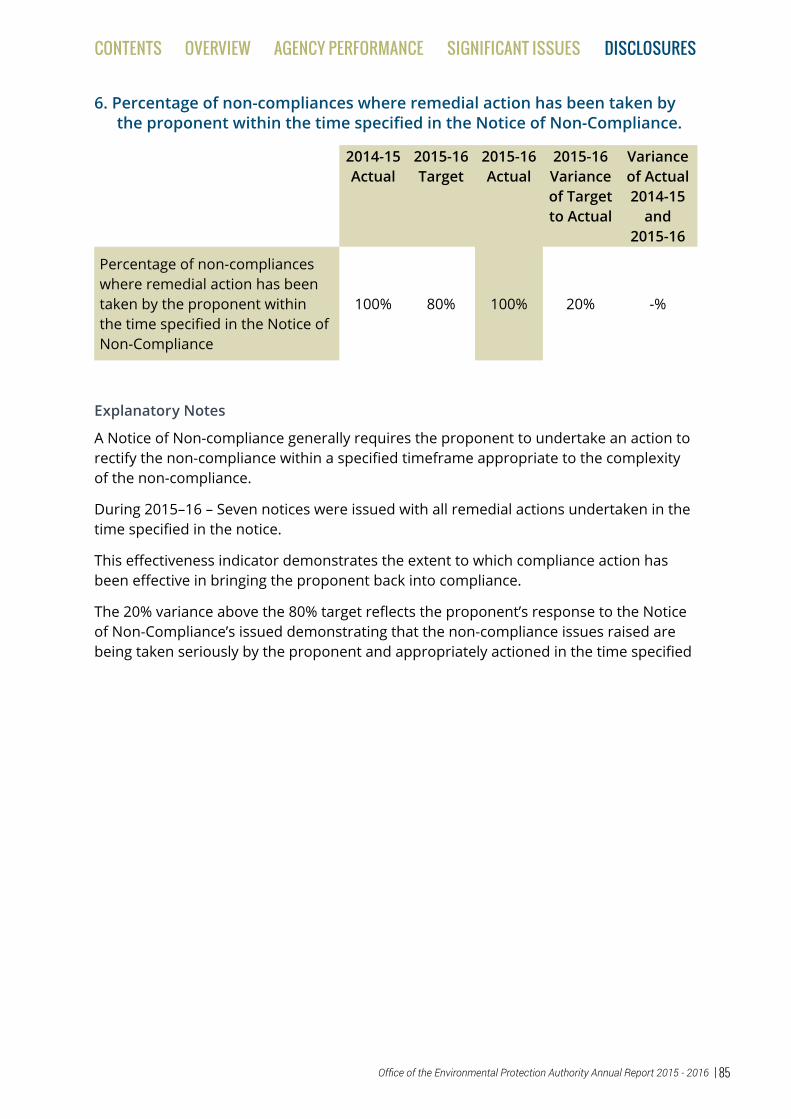
Office of the Environmental Protection Authority Annual Report 2015 - 2016 | 85
OvERviEw AGEncy PERfORMAncE siGnificAnt issuEs disclOsuREscOntEnts
6. Percentage of non-compliances where remedial action has been taken by the proponent within the time specified in the Notice of Non-Compliance.
2014-15 Actual
2015-16 Target
2015-16 Actual
2015-16 Variance of Target to Actual
Variance of Actual 2014-15
and 2015-16
Percentage of non-compliances where remedial action has been taken by the proponent within the time specified in the Notice of Non-Compliance
100% 80% 100% 20% -%
Explanatory Notes
A Notice of Non-compliance generally requires the proponent to undertake an action to rectify the non-compliance within a specified timeframe appropriate to the complexity of the non-compliance.
During 2015–16 – Seven notices were issued with all remedial actions undertaken in the time specified in the notice.
This effectiveness indicator demonstrates the extent to which compliance action has been effective in bringing the proponent back into compliance.
The 20% variance above the 80% target reflects the proponent’s response to the Notice of Non-Compliance’s issued demonstrating that the non-compliance issues raised are being taken seriously by the proponent and appropriately actioned in the time specified

Office of the Environmental Protection Authority Annual Report 2015 - 201686 |
OvERviEw AGEncy PERfORMAncE siGnificAnt issuEs disclOsuREscOntEnts
services and Key Efficiency indicatorsService 1: Environmental Impact Assessment Services to the EPA Conduct, for the EPA, environmental impact assessment of significant proposals and schemes.
1.1 Cost per standardised unit of assessment output
2014-15 Actual
2015-16 Target
2015-16 Actual
2015-16 Variance of Target to Actual
$ $ $ $ %
Cost per standardised unit of Assessment Output
33,867 30,253 30,760 507 1.6
Explanatory Notes
The cost per standardised unit of assessment output is calculated by dividing the total cost of assessments (including an allocation of post approval costs and a portion of costs for policy and administrative support) by the total complexity weighting of assessments completed during the financial year.
While the variation in assessment complexity is reflected in the level of assessment set, a number of other factors affect how complex a proposal is to assess. To account for this range in difficulty, each assessment completed is assigned a weighting according to a matrix.

Office of the Environmental Protection Authority Annual Report 2015 - 2016 | 87
OvERviEw AGEncy PERfORMAncE siGnificAnt issuEs disclOsuREscOntEnts
Service 2: Environmental management services to the EPADevelop, for the EPA, statutory policies, guidelines and strategic advice to manage environmental impacts and protect the environment.
2.1 Cost per standardised unit of environmental management output
2014-15 Actual
2015-16 Target
2015-16 Actual
2015-16 Variance of Target to Actual
$ $ $ $ %
Cost per standardised unit of environmental management services output
18,762 32,365 46,573 14,208 43.8
Explanatory notes
The cost per standardised unit of Environmental Management services output is calculated by dividing the total cost of Environmental Management services (including an allocation of administrative support) by the total complexity weighting of Environmental Management services endorsed during the period.
Because of the great variation in complexity of Environmental Management services provided, an average cost per piece of advice provided would not fairly represent the OEPA’s efficiency in providing such advice to the EPA. In fact, such a measure could provide a perverse incentive to produce many straightforward pieces of advice rather than tackling more complex issues that are more difficult to investigate. To account for this range in difficulty, each assessment completed is assigned a weighting according to a matrix.
It should be noted that, while the difficulty often influences the amount of time spent investigating a matter, the complexity weightings were allocated, in consultation with experienced officers, according to inherent characteristics that cause a piece of Environmental Management advice to be more difficult rather than what causes it to take more time to complete. This ensures that the indicator measures the efficiency of the OEPA’s provision of Environmental Management advice to the EPA rather than the OEPA’s cost per hour.
The cost per standardised unit of environmental management output is higher than the target for 2015–16. This indicator measures only the cost of advice provided by the OEPA to the EPA, not other advice that the OEPA provides to the Minister for Environment and Government. During 2015–16, considerable OEPA resources were expended on advice to Government, rather than to the EPA. This included input to the development of a WA Government Environmental Offsets Metric, and the Strategic Assessment of the Perth and Peel Regions.

Office of the Environmental Protection Authority Annual Report 2015 - 201688 |
OvERviEw AGEncy PERfORMAncE siGnificAnt issuEs disclOsuREscOntEnts
Service 3: Compliance monitoring services to the MinisterAudit the compliance with conditions set under Ministerial approvals and undertake enforcement action as appropriate.
3.1 Average cost per environmental audit completed
2012-13 Actual
2013-14 Actual
2014-15 Actual
2015-16 Target
2015-16 Actual
2015-16 Variance of Target to
Actual$ $ $ $ $ $ %
Average cost per environmental audit completed
34,908 32,198 31,859 30,618 29,985 (633) (2)
Explanatory notes
Division of the total cost (including an allocation of administrative overheads) allocated to compliance monitoring services by the total number of audits (not including desktop scans) completed during the period.
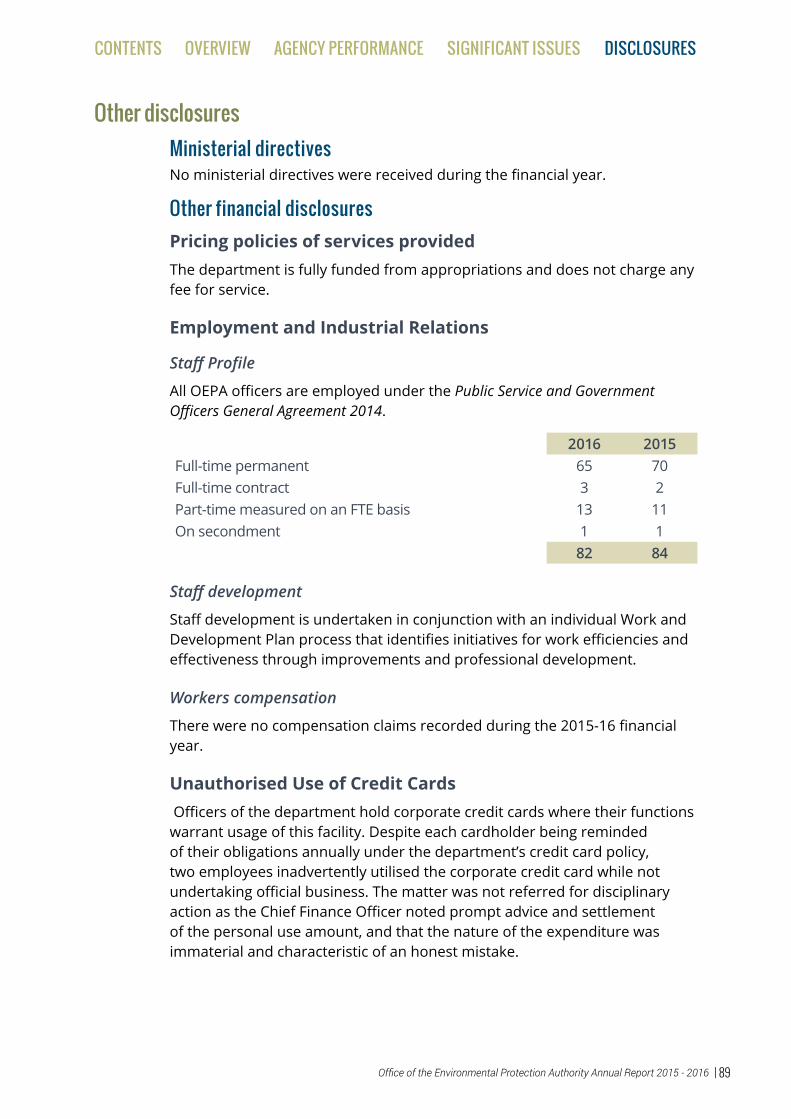
Office of the Environmental Protection Authority Annual Report 2015 - 2016 | 89
OvERviEw AGEncy PERfORMAncE siGnificAnt issuEs disclOsuREscOntEnts
Other disclosuresMinisterial directivesNo ministerial directives were received during the financial year.
Other financial disclosuresPricing policies of services providedThe department is fully funded from appropriations and does not charge any fee for service.
Employment and Industrial Relations
Staff Profile
All OEPA officers are employed under the Public Service and Government OfficersGeneralAgreement2014.
2016 2015Full-time permanent 65 70Full-time contract 3 2Part-time measured on an FTE basis 13 11On secondment 1 1
82 84
Staff development
Staff development is undertaken in conjunction with an individual Work and Development Plan process that identifies initiatives for work efficiencies and effectiveness through improvements and professional development.
Workers compensation
There were no compensation claims recorded during the 2015-16 financial year.
Unauthorised Use of Credit Cards Officers of the department hold corporate credit cards where their functions warrant usage of this facility. Despite each cardholder being reminded of their obligations annually under the department’s credit card policy, two employees inadvertently utilised the corporate credit card while not undertaking official business. The matter was not referred for disciplinary action as the Chief Finance Officer noted prompt advice and settlement of the personal use amount, and that the nature of the expenditure was immaterial and characteristic of an honest mistake.

Office of the Environmental Protection Authority Annual Report 2015 - 201690 |
OvERviEw AGEncy PERfORMAncE siGnificAnt issuEs disclOsuREscOntEnts
2016 2016 $
Aggregate amount of personal use expenditure for the reporting period 112.00
Aggregate amount of personal use expenditure settled by the due date (within 5 working days) 112.00
Aggregate amount of personal use expenditure settled after the period (after 5 working days) –
Aggregate amount of personal use expenditure outstanding at balance date –
Governance disclosures Contracts with Senior OfficersAt the date of reporting, senior officers of the department held no contracts with the department other than normal employment contracts. No senior officers of the department had substantial interests in entities with existing or proposed contracts or agreements with the department.
Board remunerationThe OEPA reports the following remuneration to the Environmental Protection Authority for 2015-16.
Position Name Type of remuneration
Period of membership
Gross/actual renumeration
Chair Dr Paul Vogel Annual 5/11/2007 – 4/11/2015 $255,814
Chair/Member
Dr Tom Hatton Annual 5/11/2015 – 4/11/2020,
18/11/2014 – 17/11/2019
$232,493
Deputy Chair
Mr Robert Harvey
Annual 18/11/2012 – 17/11/2020 $94,914
Member Ms Elizabeth Carr
Annual 4/10/2011 – 3/10/2019 $47,457
Member Mr Glen McLeod
Annual 21/10/2013 – 20/10/2016 $47,457
Member Dr Jim Limerick Annual 5/11/2015 – 4/11/2018 $30,079
Total $708,213
Remuneration for the Board Members include superannuation.

Office of the Environmental Protection Authority Annual Report 2015 - 2016 | 91
OvERviEw AGEncy PERfORMAncE siGnificAnt issuEs disclOsuREscOntEnts
Other legal requirementsExpenditure on advertising, market research, polling and direct mailElectoral Act 1907, section 175ZE
In accordance with s175ZE of the Electoral Act 1907, the agency incurred the following expenditure in advertising, market research, polling, direct mail and media advertising.
Total expenditure for 2015–16 was $5,943
Expenditure was incurred in the following areas:
Expenditure Amount AmountAdvertising agencies NilMarket research organisations NilPolling organisations NilDirect mail organisations $592 Create Send $592Media advertising organisations $5,010 Adcorp
$150 Email Media $5,160Total $5,943
The expenditure reported under direct mail organisations relates to email notification of opportunities for public comment and submissions to subscribers. Expenditure under media advertising organisations relates to recruitment, primarily EPA members.
Disability access and inclusion plan outcomes(Disability Services Act 1993, s29 and Schedule 3 of the Disability Services Regulations 2004)
The OEPA’s new Disability Access and Inclusion Plan has been implemented and is now available on the EPA’s web site. The first annual report has been compiled and sent to the Disability Services Commission including the following case study:
‘Meeting outcomes 2 (access), 4 (quality of service) and 6 (participation in public consultation) occurred where assessment staff agreed at short notice to meet with an elderly gentlemen from Broome with restricted mobility (i.e. he used a frame) because he was already in the Atrium Building (at a meeting with Department of Water) and it would have been very difficult and inconvenient for him to return at a future date.
In terms of service consistent with the DAIP, OEPA staff:
• met him at the entrance to the lift on Level 8;• escorted from the lifts, through front reception to the Boardroom where

Office of the Environmental Protection Authority Annual Report 2015 - 201692 |
OvERviEw AGEncy PERfORMAncE siGnificAnt issuEs disclOsuREscOntEnts
there was sufficient space to manoeuvre his walking frame;• assisted him into a chair;• listened to his concerns; and• provided advice as to how he may participate in EPA assessment
processes.’
Compliance with Public Sector Standards and ethical codes(Public Sector Management Act 1994, s31(1))
The OEPA’s policies are written to support employees in the achievement of a professional standard of behaviour and to comply with legislative and public sector directives. All policies are accessible to department staff through the intranet. In addition, the department undertook the following activities in 2015–16 to support compliance with public sector standards and ethical codes:
• The Department has a published code of conduct linking the WA Code of Ethics and OEPA’s Values and Behaviour Guide.
• A gift decisions form is available on the intranet to complement the conflict of interest declaration form and includes the requirement to declare and record all gifts offered and accepted.
• All employees are enrolled in the ‘Accountable and Ethical Decision Making’ course on commencement.
For 2015–16 the OEPA reports the following public sector standards and ethical codes compliance statistics:
Compliance issues Reported for 2015-16
Public sector standards in human resource management breach claims
0
Non-compliance with the WA Code of Ethics and the Department’s Code of Conduct
0
Substantiated allegations of misconduct under the disciplinary provisions of the Public Sector Management Act 1994
0
Record keeping plan State Records Commission (SRC) Standard 2, Principle 6
OEPA records are contained within Alfresco, a records management system. The OEPA Record Keeping Plan including the Business Classification System (BCS) meets the State Records Commission’s (SRC) principles, policies and standards. Record management procedures and policies have been developed to support the capture of OEPA business records.
In 2016–17 a review of the Record Keeping Plan will be undertaken to ensure continuous improvement in the capture of records.

Office of the Environmental Protection Authority Annual Report 2015 - 2016 | 93
OvERviEw AGEncy PERfORMAncE siGnificAnt issuEs disclOsuREscOntEnts
Record keeping training
A series of training sessions are offered in-house for OEPA employees that aligns with OEPA’s systems and procedures as well as ensuring that all staff understand the importance of good record keeping practice.
In conjunction with the training, step by step video instructions and practical training have been developed and made accessible to assist with the induction of new employees as well as ongoing training for all staff.
The record keeping induction booklet is being revised and will be modified to suit the OEPA’s needs. With the records awareness training complementing the induction process, the OEPA ensures that its induction programme meets the compliance requirements of the record keeping plan. Record keeping roles and responsibilities are also included in accountability and ethical decision making training and the code of conduct.
Retention and disposal policy
A retention and disposal policy has been approved by the State Records Office and is currently being implemented.
Government policy requirementsOccupational safety, health and injury management(Public Sector Commissioner’s Circular 2012-05: Code of Practice: Occupational Safety and Health in the Western Australian Public Sector)
The OEPA and its executive are committed to ensuring the safety, health and wellbeing of their employees, contractors, volunteers and visitors.
While previously the agency used the OHS policies and guidelines from the Department of Parks and Wildlife (DPaW), which provides support to the OEPA, this financial year the OEPA has:
• consulted with staff on their OHSW concerns;• established an Occupational Health Safety and Wellbeing (OHSW)
Committee;• developed an agency specific OHSW Corporate Policy;• prepared agency specific OHSW Induction and Training presentations;• commenced working on a range of OHSW related guidelines that form
part of the new OHSW Management Plan; and• started distributing a monthly OHSW Newsletter.There have been no injuries this financial year but, should there be, the OEPA has access to DPaW’s workers compensation and injury management policy that prescribes the injury management process, including the development of return to work programs for all injured staff under the direction and guidance of the Health and Safety section.

Office of the Environmental Protection Authority Annual Report 2015 - 201694 |
OvERviEw AGEncy PERfORMAncE siGnificAnt issuEs disclOsuREscOntEnts
MeasureActual results Results against target
2014–15 2015–16 Target Comment on result
Number of fatalities 0 0 0 –
Lost time injury and/or disease incidence rate
0 0 0 or 10%
improvement on the
previous 3 years
–
Lost time injury and/or disease severity rate
0 0 0 or 10%
improvement on the
previous 3 years
–
Percentage of injured workers returned to work:(i) within 13 weeks(ii) within 26 weeks
––
––
Greater than or equal to
80%
–
Percentage of managers trained in occupational safety, health and injury management responsibilities
0 0 Greater than or equal to
80%

Office of the Environmental Protection Authority Annual Report 2015 - 2016 | 95
OvERviEw AGEncy PERfORMAncE siGnificAnt issuEs disclOsuREscOntEnts

Office of the Environmental Protection Authority Annual Report 2015 - 201696 |
OvERviEw AGEncy PERfORMAncE siGnificAnt issuEs disclOsuREscOntEnts
Appendix 1: Public reports and recommendations to the Minister for Environment
Public Environmental ReviewReport
No.Title Proponent Release
date1552 Yoongarillup Mineral Sands Project Doral Mineral Sands Pty Ltd 13/7/15
1554 Hazelmere Wood Waste to Energy Plant
Eastern Metropolitan Regional Council
27/7/15
1561 Browse Liquefied Natural Gas Precinct*
Minister for State Development
26/10/15
1567 Christmas Creek Iron Ore Mine Expansion
Fortescue Metals Group Ltd 25/5/16
1568 Wingellina Nickel Project Hinckley Range Pty Ltd 20/6/161569 Perth- Darwin National Highway
(Swan Valley Section) †Commissioner for Main Roads Western Australia
4/7/16
* Prepared under Environmental Protection Act 1986 Delegation No.34 (22 January 2014) by the Browse Delegates.† Transmitted to the Minister for Environment on 29 June 2015.
Assessment on Proponent information - category AReport
No.Title Proponent Release
date1553 Forrestfield Airport Link Public Transport Authority 13/7/151557 Orebody 32 Above Water Table Iron
Ore Mine ProjectBHP Billiton Pty Ltd 17/8/15
1558 Marandoo Iron Ore Project - Revised Proposal
Hamersley Iron Pty Ltd 17/8/15
1559 Orebody 31 Iron Ore Mine Project BHP Billiton Iron Ore Pty Ltd 7/9/151562 Baby Hope Proposal Hamersley HMS Pty Limited 16/11/151565 Western Turner Syncline Iron Ore
Project – Revised ProposalHamersley Iron Pty Limited 11/4/16
changes to conditions - s46 ReportsReport
No.Title Proponent Release
date1555 Cataby Mineral Sands Project - inquiry
under s46 of the Environmental Protection Act 1986 to amend Ministerial Statement 720
Iluka Resources Limited 10/8/15

Office of the Environmental Protection Authority Annual Report 2015 - 2016 | 97
OvERviEw AGEncy PERfORMAncE siGnificAnt issuEs disclOsuREscOntEnts
Report No.
Title Proponent Release date
1556 Port Kennedy Regional Recreation Centre – Becher Point, Stage 1 proposal - inquiry under s46 of the Environmental Protection Act 1986 to amend Ministerial Statements 105 & 359
Western Australian Beach and Golf Resort Pty Ltd
10/8/15
1560 Argyle Diamond Mine, Underground Project – inquiry under s46 of the Environmental Protection Act 1986 to amend Ministerial Statement 711
Argyle Diamonds Limited 7/10/15
1563 West Pilbara Iron Ore Project Stage 1 – Mine and Rail Proposal – inquiry under s46 of the Environmental Protection Act 1986 to amend Ministerial Statement 881
API Management Pty Limited
30/11/15
1564 Jimblebar Iron Ore Project – inquiry under s46 of the Environmental Protection Act 1986 to amend Ministerial Statement 857
BHP Iron Ore Pty Ltd 4/4/2016
1566 Gidji Gold Processing Plant near Kalgoorlie – inquiry under s46 of the Environmental Protection Act 1986 to amend Ministerial Statements 28 & 77
Kalgoorlie Consolidated Gold Mines Pty Ltd
16/5/16

Office of the Environmental Protection Authority Annual Report 2015 - 201698 |
OvERviEw AGEncy PERfORMAncE siGnificAnt issuEs disclOsuREscOntEnts
Appendix 2: section 45c approved changes to proposalsStatement
No.Title
Proponent
Variation Release date
586 Ammonia Plant, Burrup Peninsula
Yara Pilbara Fertilisers Pty Ltd
Increase in disturbance from 28 hectares to 29 hectares; increase in ammonia production capacity; increase in atmospheric emissions; increase in wastewater discharge and some contaminant concentrations; amendments to the structure and content of Table 1: Summary of key proposal characteristics in Schedule 1.
5/8/15
960 Buckland Project
BC Pilbara Iron Ore Pty Ltd
Removal of the original mine village location and replace it with an alternative location; addition of a Central Services Facility (CSF) and associated infrastructure; and increase to the Disturbance Area for the Stage 1 Haul Road.
21/9/15
646 Pinjarra Refinery Efficiency Upgrade
Alcoa of Australia Limited
Increase in production, bauxite residue generation, emissions of NOx, CO and greenhouse gases; update description of the proposal including the ‘Development Envelope’; correction of a unit error; and removal of elements that are not key proposal characteristics relevant to the environment, managed under other legislation, completed, or not relevant to the proposal.
1/10/15
712 Orebody 25 Extension Project
BHP Billiton Iron Ore Pty Ltd
Changes to water supply, water demand and water supply source; removal of elements that are not key characteristics.
12/10/15
933 Iron Valley above Watertable Mining Project
BC Pilbara Iron Ore Pty Ltd
Increase to water use from 360 to 720 mega litres per year.
19/10/15
857 Jimblebar Iron Ore Project
BHP Billiton Iron Ore Pty Ltd
Increase land disturbance from 2,042 hectares to 2,300 hectares and increased development envelope from 7,880 hectares to 8,183 hectares. Removal of power supply as not a key characteristic.
22/10/15

Office of the Environmental Protection Authority Annual Report 2015 - 2016 | 99
OvERviEw AGEncy PERfORMAncE siGnificAnt issuEs disclOsuREscOntEnts
Statement No.
Title
Proponent
Variation Release date
863 Rockingham Industrial Zone Strategic Environmental Assessment
Western Australian Land Authority (trading as LandCorp)
Change the Conservation Area boundaries to remove a rail corridor from the south and provide additional land in the north.
11/11/15
982 Yilgarn Operations – Windarling Range, Mt Jackson Range and Deception Deposit – Shire of Yilgarn and Shire of Menzies
CliffsAsiaPacificIron Ore Pty Ltd
Inclusion of the Windarling W7 Pit deposit; Inclusion of Table 4 - Coordinates defining Windarling W7 Pit and Supporting Infrastructure.
788 Utah Point Berth Project
Port Hedland Port Authority
Removal of the references to Dust and Noise Suppression, and Stormwater Management from the Key Characteristics Table.
14/12/15
824 Roy Hill 1 Iron Ore Mining Project Stage 1
Roy Hill Iron Ore Pty Ltd
Change to mine dewatering volume and rate; change to description of saline water disposal to include use for dust suppression; minor changes to units of measurement (volume).
11/2/16
829 Roy Hill 1 Iron Ore Mining Project Stage 2
Roy Hill Iron Ore Pty Ltd
Change to mine dewatering volume and rate; change to description of saline water disposal to include use for dust suppression; and minor changes to units of measurement (volume).
11/2/16
914 Yandicoogina Iron Ore Project – Expansion to Include Junction South West and Oxbow Deposits
Hamersley Iron - Yandi Pty Limited
Above and below water table mining of an additional small satellite pit at Oxbow East (Oxbow East Pitlet); amalgamation of dewatering limits and removal of surface water discharge limit from Table 2; amendment to the Clearing Avoidance Area as defined in Figure 2; revised Figure 3; and amalgamated Abbreviations and Definitions Table (Table 3).
3/3/16

Office of the Environmental Protection Authority Annual Report 2015 - 2016100 |
OvERviEw AGEncy PERfORMAncE siGnificAnt issuEs disclOsuREscOntEnts
Statement No.
Title
Proponent
Variation Release date
1022 Forrestfield Airport Link
Public Transport Authority Western Australia
Increase in the total combined size of the Bayswater and Forrestfield development envelopes from 65 hectares (ha) to 68.4 ha; and increase in the area of surface disturbance from 46.3 ha to 51.3 ha.
23/3/16
719 Worsley Alumina – Production to Maximum Capacity of 4.4MTPA Alumina
South32 Worsley Alumina Pty Ltd
Increase in clearing within the Refinery Lease Area from 45.5 to 66.6 ha.
15/4/16
933 Iron Valley Above Watertable Mining Project
BC Pilbara Iron Ore Pty Ltd
Remove ‘wholly above the watertable’ from the short description of the project; temporary approval to discharge 2 GL of surplus groundwater; remove the ‘Pit Depth’ element from the Key Characteristics Table.
2/5/16
679 Marillana Creek Yandi Life-of-Mine Proposal, Mining Leases 270SA 47/292, 90 km North-West of Newman, Shire of East Pilbara
BHP Billiton Iron Ore Pty Ltd
Increase the total mining and infrastructure disturbance area by 345 ha; increase the disturbance area associated with diverting Marillana Creek by 163 ha; amalgamate the ‘pits and overburden storage disturbance area’ and the ‘infrastructure disturbance area’; and remove references to mining leases from the key characteristics table.
4/5/16

Office of the Environmental Protection Authority Annual Report 2015 - 2016 | 101
OvERviEw AGEncy PERfORMAncE siGnificAnt issuEs disclOsuREscOntEnts
Appendix 3: Other publicationsEnvironmental Assessment Guidelines (EAGs)
Preparation of management plans under Part IV of the Environmental Protection Act 1986 (EAG 17), August 2015
Recommending environmental conditions (EAG 11), revised August 2015
Separation distances between industrial and sensitive land uses (Draft EAG for public comment), September 2015
Environmental Protection Bulletins (EPBs)Guidance on the EPA Landforms factor (EPB 23), July 2015
Greenhouse gas emissions and consideration of projected climate change impacts in the EIA process (EPB 24), September 2015
technical reportsTechnical Guide - Flora and Vegetation Surveys for Environmental Impact Assessment, December 2015
OtherOfficeoftheEnvironmentalProtectionAuthority2014–2015AnnualReport, September 2015
Environmental Protection Authority 2014–2015 Annual Report, October 2015

Office of the Environmental Protection Authority Annual Report 2015 - 2016102 |
OvERviEw AGEncy PERfORMAncE siGnificAnt issuEs disclOsuREscOntEnts


Office of the Environmental Protection Authoritylevel 8, the Atrium168 st Georges terracePerth wA 6000Phone: 08 6145 [email protected]


![CONSUMER PROTECTION & MARKETS AUTHORITY [Financial Conduct … · 2013-02-13 · CONSUMER PROTECTION & MARKETS AUTHORITY [Financial Conduct Authority] From: FAMILY FINANCE LTD. 93](https://static.documents.pub/doc/80x56/5ebee1caa79e605f0a6b37ed/consumer-protection-markets-authority-financial-conduct-2013-02-13-consumer.jpg)


