1 A Study of the Traffic Safety at Roundabouts in Minnesota Office of Traffic, Safety, and Technology Minnesota Department of Transportation October 30, 2017 Derek Leuer, P.E. Office of Traffic, Safety, and Technology
Transcript
1
A Study of the Traffic Safety at Roundabouts in Minnesota
Office of Traffic, Safety, and Technology Minnesota Department of Transportation
October 30, 2017
Derek Leuer, P.E.
Office of Traffic, Safety, and Technology
2
Executive Summary
The first Minnesota modern roundabout was constructed in 1995. Since then, roundabouts have been
built across the state by the Minnesota Department of Transportation, counties, and cities. There is
no definitive count across Minnesota, but it is likely nearing 200 roundabouts across the state on all
roads. They have become an increasingly popular intersection type by traffic engineers, communities,
and transportation officials. The purpose of this report is to examine the safety performance of
roundabouts by comparing the before construction crash rates and the after construction crash rates
and traffic volume data. Overall, roundabouts are performing well when looking at the crash reduction
record. Roundabouts in Minnesota have had over an 80% reduction in fatal and serious injury
crashes. At the time of this report, there still has not been a multi-vehicle fatality in a roundabout in
Minnesota. Other highlights include:
An 86% reduction in the fatal crash rate at intersections where roundabouts have been
installed. This includes all roundabout types (Single Lane, Unbalanced, and full Dual Lane
Roundabouts). See Pages 6-7 for more information on roundabout types.
An 83% reduction in the serious injury crash rate at intersections where roundabouts have
been installed.
A 69% reduction in the Right Angle crash rate at intersections where Single Lane Roundabout
have been installed.
An 83% reduction in the Left Turning crash rate at intersections where Single Lane
Roundabout have been installed.
A 61% reduction in the injury crash rate at intersections where Single Lane Roundabout have
been installed.
A 42% reduction in the injury crash rate at intersections where Single Lane Roundabout have
been installed.
The average crash rates for roundabouts by type on all roads is below.
Type of Roundabouts Number of Sites Crash Rate (CR) Fatal and Serious
Injury Rate (FAR)
Single Lane 104 0.32 0.31
Unbalanced (2 lanes x 1 lane) 34 0.76 0.15
Full Multi-Lane 6 2.18 0.00
Total (All Roundabouts) 144 0.600 0.24
3
Table of Contents Executive Summary .................................................................................................................. 2
Table of Figures ..................................................................................................................... 4
Table of Tables ....................................................................................................................... 4
Appendix A – Roundabout Data Sheets ................................................................................. 34
4
Table of Figures
Figure 1: The layout and components of a Modern Roundabout .......................................................................................... 5
Figure 2: A single lane roundabout. Located in Waconia, MN. .............................................................................................. 6
Figure 3: An unbalanced roundabout. Located in Carver County, MN. .................................................................................. 6
Figure 4: A dual lane roundabout. Located in Richfield, MN. ................................................................................................. 7
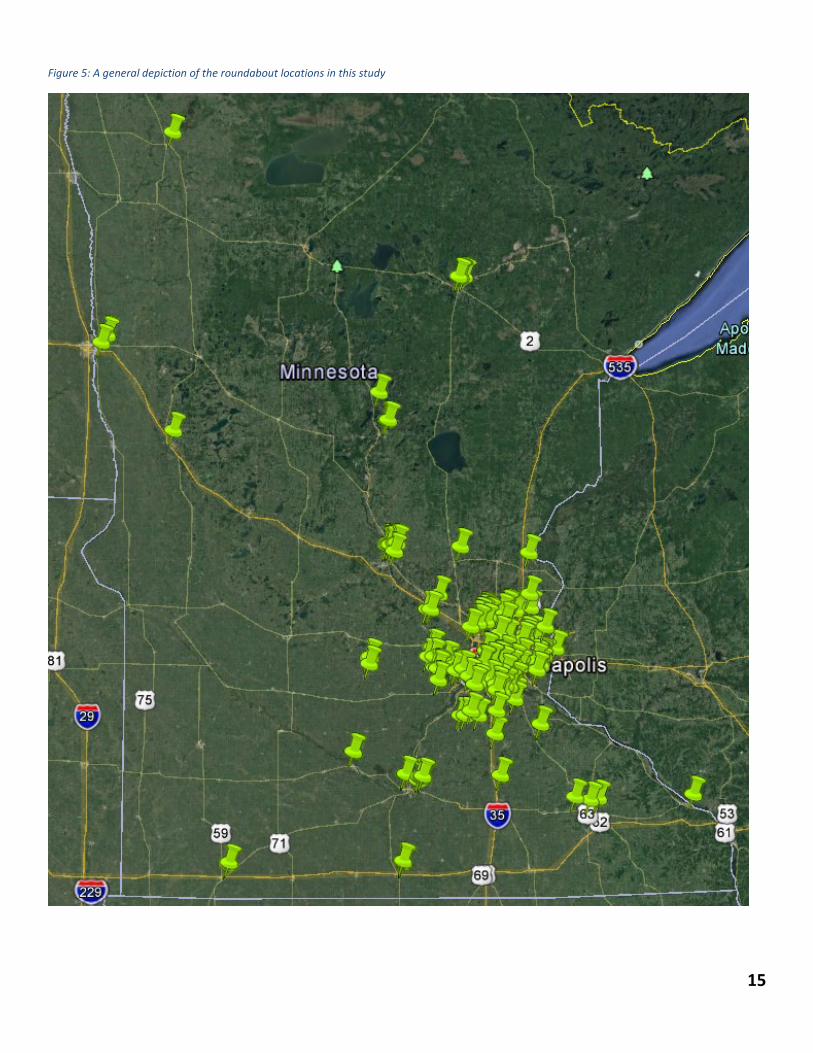
Figure 5: A general depiction of the roundabout locations in this study ............................................................................. 15
Figure 6: A graphical representation of crash rates, by traffic control device ..................................................................... 31
Figure 7: A graphical representation of fatal/serious injury crash rates, by traffic control device ...................................... 31
Table of Tables
Table 1: Characteristics of the selected Roundabouts ......................................................................................................... 11
Table 2: Locations of the selected Roundabouts. ................................................................................................................. 11
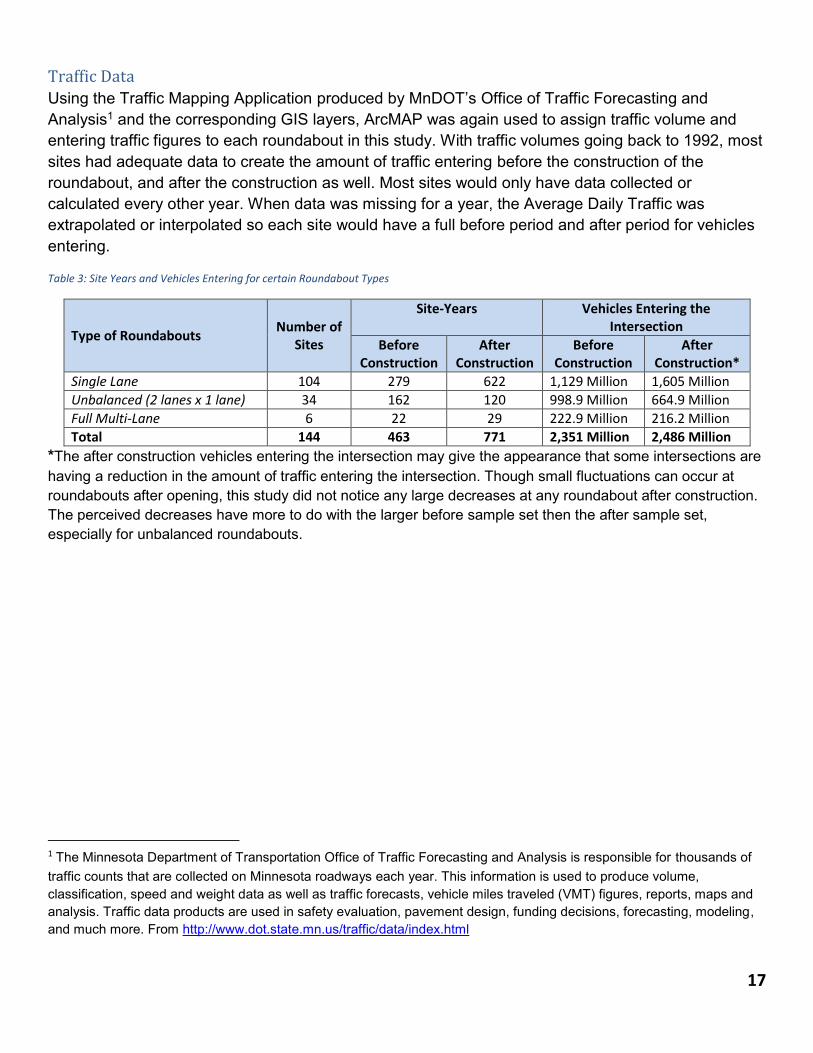
Table 3: Site Years and Vehicles Entering for certain Roundabout Types ............................................................................ 17
Table 4: Crash data from before construction based on Severity ........................................................................................ 18
Table 5: Crash data from before construction based on Crash Type ................................................................................... 18
Table 6: Additional Crash data from before construction based on Crash Type .................................................................. 18
Table 7: Crash data from after construction based on Severity ........................................................................................... 19
Table 8: Crash data from after construction based on Crash Type ...................................................................................... 19
Table 9: Additional Crash data from after construction based on Crash Type ..................................................................... 19
Table 10: A comparison of two roundabouts that had traffic control changes from full dual lane to unbalanced. ............ 20
Table 11: Summary of the fatal and serious injury crashes that have occurred at roundabouts, 2006-2015. .................... 20
Table 12: Crash data from Single Lane Roundabouts based on Severity .............................................................................. 22
Table 13: Crash data from Single Lane Roundabouts based on the crash diagram ............................................................. 22
Table 14: Crash data from Single Lane Roundabouts based on the crash diagram/type ..................................................... 22
Table 15: Crash data from Unbalanced Roundabouts based on Severity ............................................................................ 24
Table 16: Crash data from Unbalanced Roundabouts based on the crash diagram ............................................................ 24
Table 17: Crash data from Unbalanced Roundabouts based on the crash diagram/type ................................................... 24
Table 18: Crash data from Dual Lane Roundabouts based on Severity ................................................................................ 26
Table 19: Crash data from Dual Lane Roundabouts based on the crash diagram ................................................................ 26
Table 20: Crash data from Dual Lane Roundabouts based on the crash diagram/type ....................................................... 26
Table 21: Crash data from all Roundabouts based on Severity ............................................................................................ 28
Table 22: Crash data from all Roundabouts based on the crash diagram ............................................................................ 28
Table 23: Crash data from all Roundabouts based on the crash diagram/type ................................................................... 28
Table 24: Crash Rates and Fatal and Serious Injury Crash Rates comparing various Traffic Control Devices. ..................... 30
5
Introduction: Roundabouts Modern Roundabouts have been built in Minnesota and the United States over the past couple decades. The modern roundabout is a circular intersection form with specific design and traffic control features. These features – including yield control of entering traffic, channelized approaches, and other geometric elements designed to control travel speeds, facilitate efficient exchange of traffic flows, and minimize the number and severity of vehicle conflicts and crashes.
Modern roundabouts have shown to be viable intersection options in a wide variety of different
locations and contexts. This includes urban, suburban, rural, higher volume locations, lower volume
locations, and interchange ramp terminals.
In most cases, modern roundabouts compare favorably in safety and operational performance to conventional intersections with stop control or signalized operation. Additionally, roundabouts have comparable initial construction costs and lower life-cycle costs than a traffic signal with similar traffic capacity.
For these reasons and others, the Minnesota Department of Transportation (MnDOT) practice is that modern roundabouts are an intersection design choice equal to other traffic control methods in terms of the Department’s acceptance and consideration. In general terms, any intersection – whether in an urban or rural environment – that meets the criteria for additional traffic control beyond a thru stop condition, also qualifies for evaluation as a modern roundabout.
In 1995, Minnesota had its first roundabout built in Brooklyn Park in a residential neighborhood at Selzer and Neddersen Parkway. Since then, over 150 roundabouts have been built across the state by the Minnesota Department of Transportation, counties, and cities.
Figure 1: The layout and components of a Modern Roundabout
From FHWA (June, 2017)
6
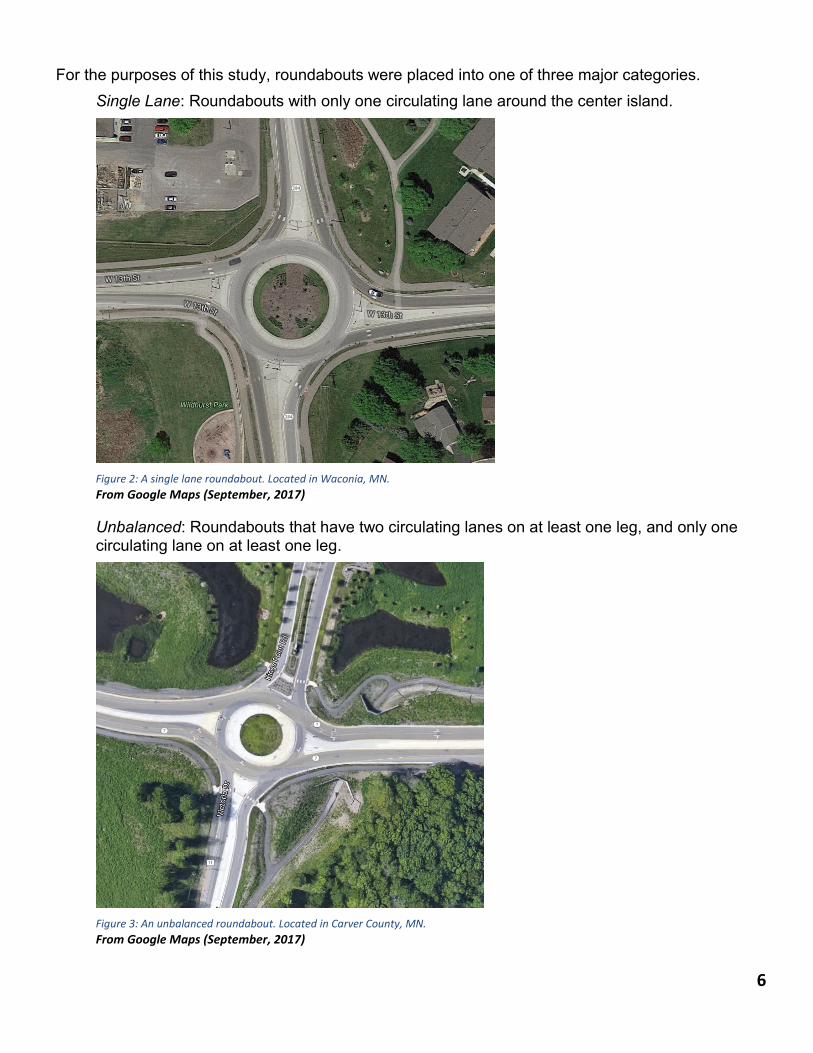
For the purposes of this study, roundabouts were placed into one of three major categories.
Single Lane: Roundabouts with only one circulating lane around the center island.
Figure 2: A single lane roundabout. Located in Waconia, MN.
From Google Maps (September, 2017)
Unbalanced: Roundabouts that have two circulating lanes on at least one leg, and only one circulating lane on at least one leg.
Figure 3: An unbalanced roundabout. Located in Carver County, MN.
From Google Maps (September, 2017)
7
Dual Lane: Roundabouts that have two full circulating lanes on all legs around the center
island.
Figure 4: A dual lane roundabout. Located in Richfield, MN.
From Google Maps (September, 2017)
8
How to Read This Report
Crash Records Data
These analyses used Minnesota crash data to assess crash frequency and severity before the
construction of a roundabout and after construction. These analyses excluded data from the
roundabout construction year.
A site-year is a way to quantify the amount of exposure to traffic by site. For example, a site with
three years of data would have three site-years and another with four years would have four site-
years. Combined, the two sites have seven site-years. This study examined 473 pre-construction
site-years and 771 post construction site-years.
Vehicles Entering was another metric to adjust for exposure to traffic. Most sites used the Minnesota
Traffic Mapping Application and associated Geographic Information System (GIS) layers to establish
how much traffic had entered the intersection during the review years. When traffic volumes were
missing or had gaps, traffic volume was either interpolated or extrapolated.
Injury Severity of Crash
Crash severity means the greatest level of injury sustained by all persons involved in a crash. One
fatal crash may include one or more person killed and any number of persons who sustained other
levels of injury, but it is a K Injury Crash.
K-Injury (Fatal) Crash: One or more person involved in the crash died due to injuries sustained in the
crash
A - Injury Crash: One or more person involved in the crash sustained a serious life-altering injury
due to the crash
B-Injury Crash: One or more person involved in the crash sustained moderate injury, e.g. broken
bones in the crash
C- Injury Crash: One or more person involved in the crash sustained a minor injury in the crash
PDO-Injury Crash: No person involved in the crash sustained an injury and only vehicular or property
damage occurred
9
Crash Type/Diagram
Crash type means the manner in which one or more vehicles collided with one another.
Right angle crash: When two vehicles collide perpendicular to each other, also known as a T-bone
or broadside crash. This type of crash is among the highest risk of death and serious injury.
Rear-end crash: When two vehicles traveling the same direction collide with the front of the following
vehicle colliding with the rear of the leading vehicle. This is the most common type of crash in
Minnesota; however, it is typically of lower risk of death and serious injury.
Run-off-the-road crash: When a single vehicle departs the roadway surface and collides with a
roadside object or rolls over. This includes both departing right and left from the roadway surface.
This type of crash is among the highest risk of death and serious injury.
Head-On: Two vehicles collide directly into each other while heading in opposite directions striking at
the front of both vehicles. This type of crash is among the highest risk of death and serious injury.
Sideswipe crash: Two vehicles collide off-center and scrape the sides of both vehicles. Sideswipe
includes vehicles heading in the same direction or vehicles traveling in opposing directions. This
type of crash is typically at lower risk of death and serious injury.
Left-Turn-Into-Traffic: A left turning vehicle, from either the major or the minor road collides with a
vehicle crossing its intended path. This type of crash typically results in a right-angle crash or a
sideswipe crash.
Other/Not Applicable/Unknown/Blank: These crash types were used when one of the above types or
diagrams did not adequately address what had occurred. These four tended to be a catch-all for
crashes that did not fit the above descriptions.
Multi-vehicle crash*: Involves two or more motor vehicles. This is mutually exclusive of the crash types/diagrams described above.
Pedestrian Crash*: A crash between a motor vehicle and a person walking or using a method of conveyance other than a vehicle or bicycle. This is mutually exclusive of the crash types/diagrams described above.
Bike Crash*: A crash between a motor vehicle and a person using a bicycle. This is mutually exclusive of the crash types/diagrams described above.
*Multi-Vehicle, Pedestrian, and Bike crashes are mutually exclusive from Right Angle, Rear-End, Run-off-the-Road, Head-On, Sideswipes, Left-Turn-Into-Traffic, Other/NA/Unknown, and Blank. As an example, a crash could be both a collision with a pedestrian and be coded as “Other” as well.
10
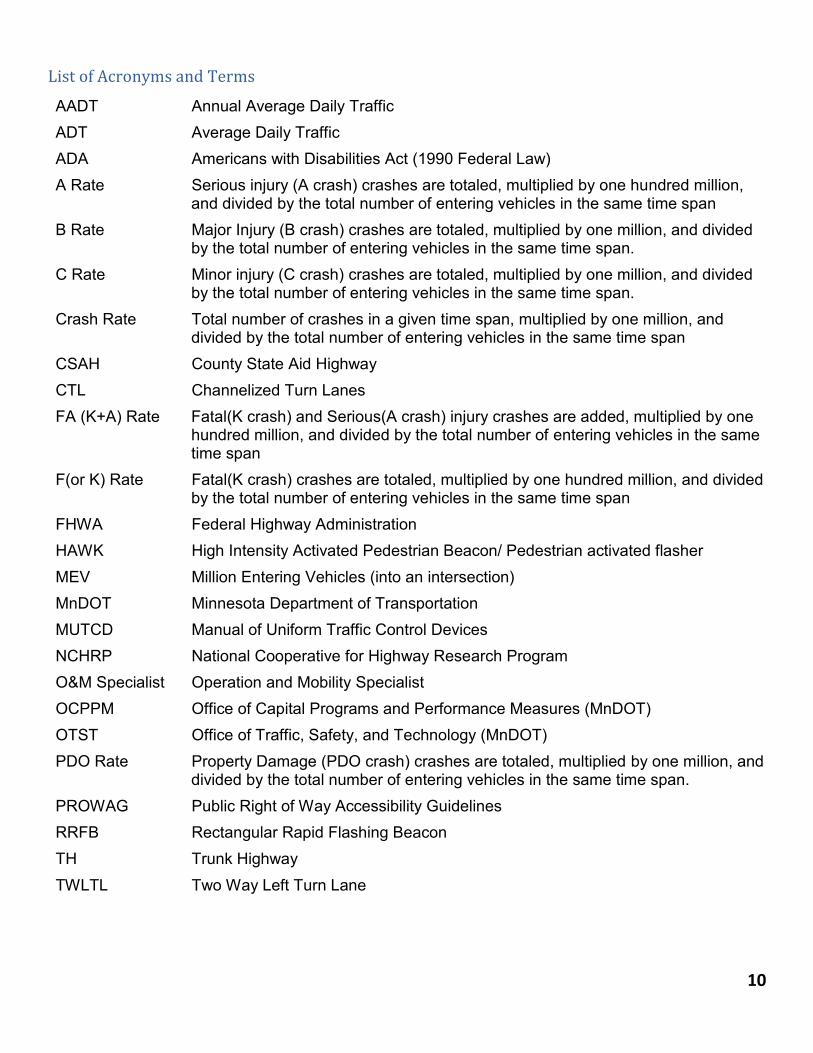
List of Acronyms and Terms
AADT Annual Average Daily Traffic
ADT Average Daily Traffic
ADA Americans with Disabilities Act (1990 Federal Law)
A Rate Serious injury (A crash) crashes are totaled, multiplied by one hundred million, and divided by the total number of entering vehicles in the same time span
B Rate Major Injury (B crash) crashes are totaled, multiplied by one million, and divided by the total number of entering vehicles in the same time span.
C Rate Minor injury (C crash) crashes are totaled, multiplied by one million, and divided by the total number of entering vehicles in the same time span.
Crash Rate Total number of crashes in a given time span, multiplied by one million, and divided by the total number of entering vehicles in the same time span
CSAH County State Aid Highway
CTL Channelized Turn Lanes
FA (K+A) Rate Fatal(K crash) and Serious(A crash) injury crashes are added, multiplied by one hundred million, and divided by the total number of entering vehicles in the same time span
F(or K) Rate Fatal(K crash) crashes are totaled, multiplied by one hundred million, and divided by the total number of entering vehicles in the same time span
FHWA Federal Highway Administration
HAWK High Intensity Activated Pedestrian Beacon/ Pedestrian activated flasher
MEV Million Entering Vehicles (into an intersection)
MnDOT Minnesota Department of Transportation
MUTCD Manual of Uniform Traffic Control Devices
NCHRP National Cooperative for Highway Research Program
O&M Specialist Operation and Mobility Specialist
OCPPM Office of Capital Programs and Performance Measures (MnDOT)
OTST Office of Traffic, Safety, and Technology (MnDOT)
PDO Rate Property Damage (PDO crash) crashes are totaled, multiplied by one million, and divided by the total number of entering vehicles in the same time span.
PROWAG Public Right of Way Accessibility Guidelines
RRFB Rectangular Rapid Flashing Beacon
TH Trunk Highway
TWLTL Two Way Left Turn Lane
11
Roundabout Study Locations This roundabout study is the largest to date conducted in Minnesota on roundabouts. 144 individual
sites were collected for this analysis.
Roundabout sites were selected from an initial list provided by the Minnesota Department of
Transportation State Aid division. MnDOT State Aid has maintained a list of roundabouts constructed
on the Trunk Highway Network and on local streets. The list also contained information such as the
year of construction, specific and general location, prior traffic control, environment, and general
geometric information. Sites with low traffic volumes, or no known traffic volume, were removed from
the location site set as they were typically only servicing local traffic and businesses (residential
neighborhoods, small office parks, etc). This left 142 locations for review. Two of the roundabouts
have been modified since construction. The roundabouts in Forest Lake on TH 61 and Broadway Ave
and at Radio Avenue and Bailey Avenue in Woodbury, were originally constructed as full dual multi-
lane roundabouts. Due to the high number of crashes and complaints, the roundabouts were
restriped to an unbalanced configuration (2 lanes on certain legs, 1 lane on the others). The new
configurations were labeled as a separate “after” site with no before crash data.
The statistics on the sites breaks down as follows:
Table 1: Characteristics of the selected Roundabouts
Type of Roundabouts Number
of Sites
Sites with 3 years or
more “Before” Data
Sites with 3 years or
more “After” Data
Urban Rural
Single Lane 104 47 83 81 23
Unbalanced (2 lanes x 1 lane) 34 25 16 33 1
Full Multi-Lane 6 4 5 6 0
Total 144 69 104 120 24
Table 2: Locations of the selected Roundabouts.
Roundabout ID INTERSECTION CITY COUNTY
3.Dakota 153rd St. / Founders Lane Apple Valley Dakota
5.Anoka Club West Parkway & 113th Avenue Blaine Anoka
6.Anoka Lakes Parkway & Harpers Street Blaine Anoka
9.CrowWing South 4th Street & College Drive Brainerd Crow Wing
10.CrowWing SW 4th Street & College Drive Brainerd Crow Wing
11.CrowWing Mississippi Parkway & College Drive Brainerd Crow Wing
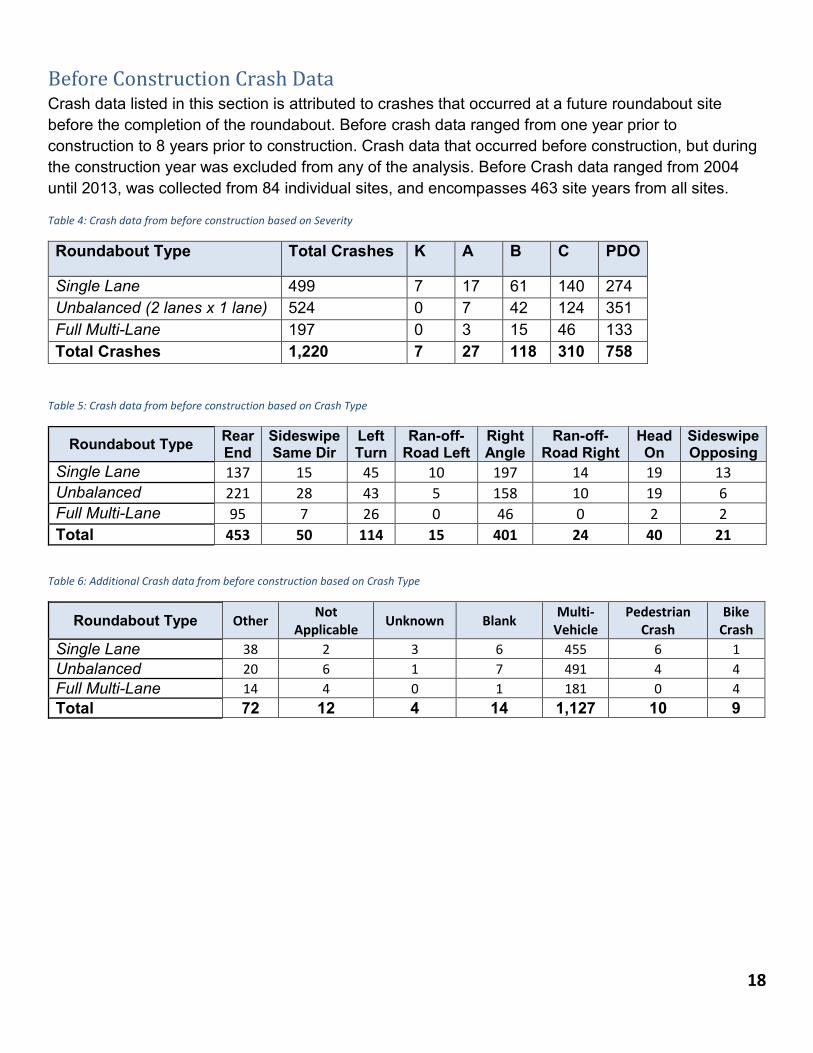
Before Construction Crash Data Crash data listed in this section is attributed to crashes that occurred at a future roundabout site
before the completion of the roundabout. Before crash data ranged from one year prior to
construction to 8 years prior to construction. Crash data that occurred before construction, but during
the construction year was excluded from any of the analysis. Before Crash data ranged from 2004
until 2013, was collected from 84 individual sites, and encompasses 463 site years from all sites.
Table 4: Crash data from before construction based on Severity
Roundabout Type Total Crashes K A B C PDO
Single Lane 499 7 17 61 140 274
Unbalanced (2 lanes x 1 lane) 524 0 7 42 124 351
Full Multi-Lane 197 0 3 15 46 133
Total Crashes 1,220 7 27 118 310 758
Table 5: Crash data from before construction based on Crash Type
Roundabout Type Rear End
Sideswipe Same Dir
Left Turn
Ran-off-Road Left
Right Angle
Ran-off-Road Right
Head On
Sideswipe Opposing
Single Lane 137 15 45 10 197 14 19 13
Unbalanced 221 28 43 5 158 10 19 6
Full Multi-Lane 95 7 26 0 46 0 2 2
Total 453 50 114 15 401 24 40 21
Table 6: Additional Crash data from before construction based on Crash Type
Roundabout Type Other Not
Applicable Unknown Blank
Multi-Vehicle
Pedestrian Crash
Bike Crash
Single Lane 38 2 3 6 455 6 1
Unbalanced 20 6 1 7 491 4 4
Full Multi-Lane 14 4 0 1 181 0 4
Total 72 12 4 14 1,127 10 9
19
After Construction Crash Data Crash data listed in this section is attributed to crashes that occurred at a built roundabout site after
the completion of the roundabout. After crash data ranged from one year after completion to 10 years.
Roundabouts built before 2006 only had data from 2006-2015 included in this data. Crash data that
occurred after construction, but during the construction year was excluded from any of the analysis.
After Crash data ranged from 2006 until 2015, was collected from 142 individual sites, and
encompasses 771 site years from all sites.
Table 7: Crash data from after construction based on Severity
Roundabout Type Total Crashes K A B C PDO
Single Lane 518 1 4 35 87 391
Unbalanced (2 lanes x 1 lane) 502 0 1 18 74 409
Full Multi-Lane 471 0 0 15 53 403
Total Crashes 1,491 1 5 68 214 1,203
Table 8: Crash data from after construction based on Crash Type
Roundabout Type Rear End
Sideswipe Same Dir
Left Turn
Ran-off-Road Left
Right Angle
Ran-off-Road Right
Head On
Sideswipe Opposing
Single Lane 132 42 11 31 89 69 28 5
Unbalanced 112 163 5 20 79 40 13 6
Full Multi-Lane 64 209 19 8 104 11 2 5
Total 308 414 35 59 272 120 43 16
Table 9: Additional Crash data from after construction based on Crash Type
Roundabout Type Other Not
Applicable Unknown Blank
Multi-Vehicle
Pedestrian Crash
Bike Crash
Single Lane 73 18 2 18 313 10 3
Unbalanced 33 15 1 15 399 3 0
Full Multi-Lane 26 3 0 20 435 5 2
Total 132 36 3 53 1,147 18 5
20
Two of the sites, at TH 61/CSAH 2 (Broadway) and at Radio(CSAH 13)/Bailey(CSAH 18), were
converted from full dual lane roundabouts to unbalanced roundabouts in mid-2013. The roundabout
types and crashes were adjusted accordingly. Both sites are represented as two distinct sites in the
after period. Only the original, pre-roundabout condition is included in the before data.
Table 10: A comparison of two roundabouts that had traffic control changes from full dual lane to unbalanced.
Site Location Prior Traffic Control
Year of Roundabout Construction
Before Roundabout
Total Crashes
Full Dual Lane Total Crashes
Unbalanced Total
Crashes
TH 61/ CSAH 2 (Broadway)
Traffic Signal
2010 50 42 21
Radio(CSAH 13) / Bailey(CSAH 18)
All-Way Stop
2007 3 81 17
Fatal and Serious Injury Crashes Exploratory Analysis
With the limited number of fatal and serious injury crashes, examining individual reports may offer
insight into potential issues with roundabouts. A summary of the fatal and serious injury crashes is
included in Table 11.
Table 11: Summary of the fatal and serious injury crashes that have occurred at roundabouts, 2006-2015.
Crash ID Date Location and Type Crash Description
100740239 3/13/2010 MN Highway 7 and MN Highway 25 Carver County Single Lane Roundabout
Serious Injury Crash – Single Vehicle went through the roundabout raised center island at a high rate of speed. Report cited driver impairment as a contributing factor.
102950184 10/22/2010 Minnehaha and Godfrey Road, Minneapolis Single Lane Roundabout
Serious Injury Crash – Bicyclist was hit be vehicle exiting the roundabout
111310223 5/10/2011 MN Highway 19 and 11th Avenue, New Prague Single Lane Roundabout
Fatal Crash – Single Vehicle Motorcyclists entered the roundabout raised center island at a high rate of speed and hit a sign.
130670191 3/1/2013 MN Highway 3 and 190th Street, Dakota County Single Lane Roundabout
Serious Injury Crash – Driver went through the roundabout, over the median, and collided with vehicle head-on in opposing lane. Driver was cited for impaired driving.
143600104 12/26/2014 Radio Drive and Bailey Drive, Woodbury Unbalanced Roundabout
Serious Injury Crash – Motorcyclist entered the roundabout without yielding and was hit by a vehicle traveling through the intersection. Motorcyclist was found to be impaired upon testing.
152420096 8/30/2015 Radio Drive and Military Road, Woodbury Single Lane Roundabout
Serious Injury Crash – Motorcyclist was entering the roundabout, lost control, and flipped. Driver was considered impaired at the time of crash.
21
Analysis The purpose of this analysis is to compare the before construction crash rates, based on severity,
type, and diagram with the after crash rates. Crash rates are calculated with the formula:
Equation 1: The Crash Rate Equation used for comparisons through this report
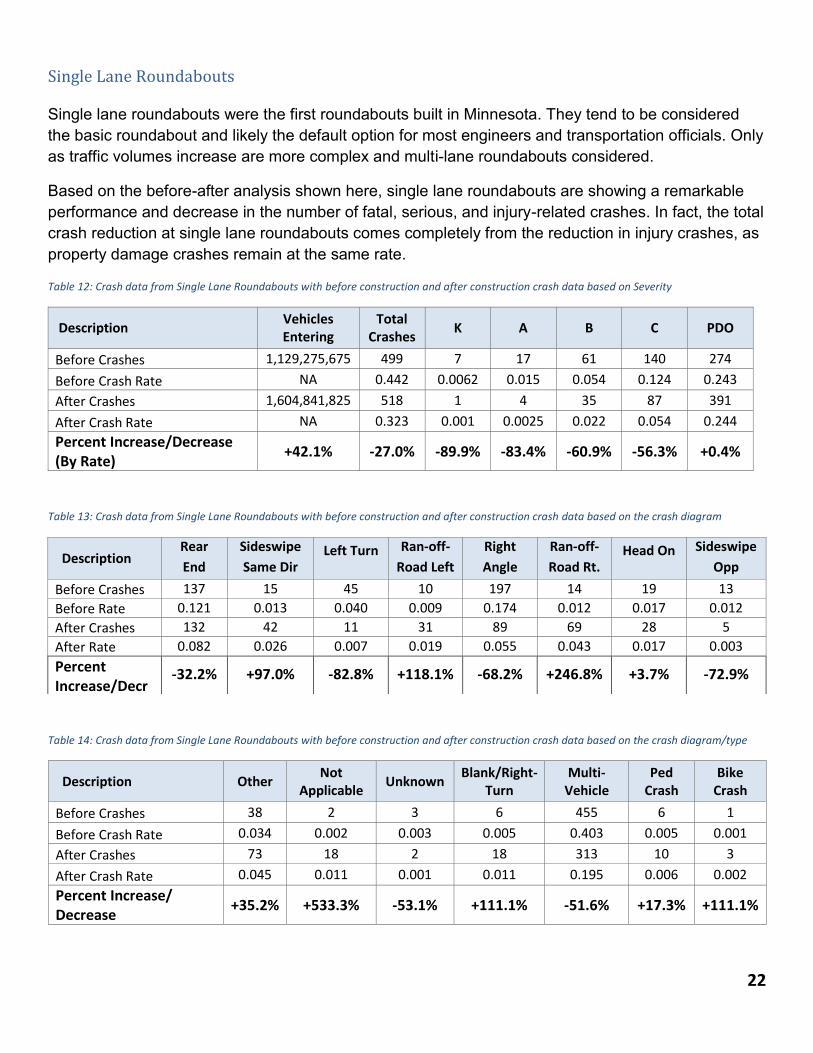
Some of the highlights from the single lane roundabout analysis include:
An 89% reduction in Fatal Crashes
An 83% reduction in Serious Injury Crashes
The Fatal and Serious Injury Crash Rate, one of the Minnesota Department of Transportation’s Statewide Performance Measures, decreased from 0.021 Severe Crashes per 1,000,000 Vehicles Entering to 0.003 Severe Crashes per 1,000,000 Vehicles Entering. This marks an 86% reduction in severe crashes.
Fatal and Injury Crashes (K, A, B, and C injury) decreased from 0.20 injury crashes per 1,000,000 Vehicles Entering to 0.08 injury crashes per 1,000,000 Vehicles Entering. This marks a 60% reduction in injury crashes.
Right Angle crashes, typically the most deadly type of crash in Minnesota, had a total reduction of 68% of all crash severities.
Left Turn into Traffic crashes had an 83% reduction.
Multi-vehicle crashes had a 51% reduction.
24
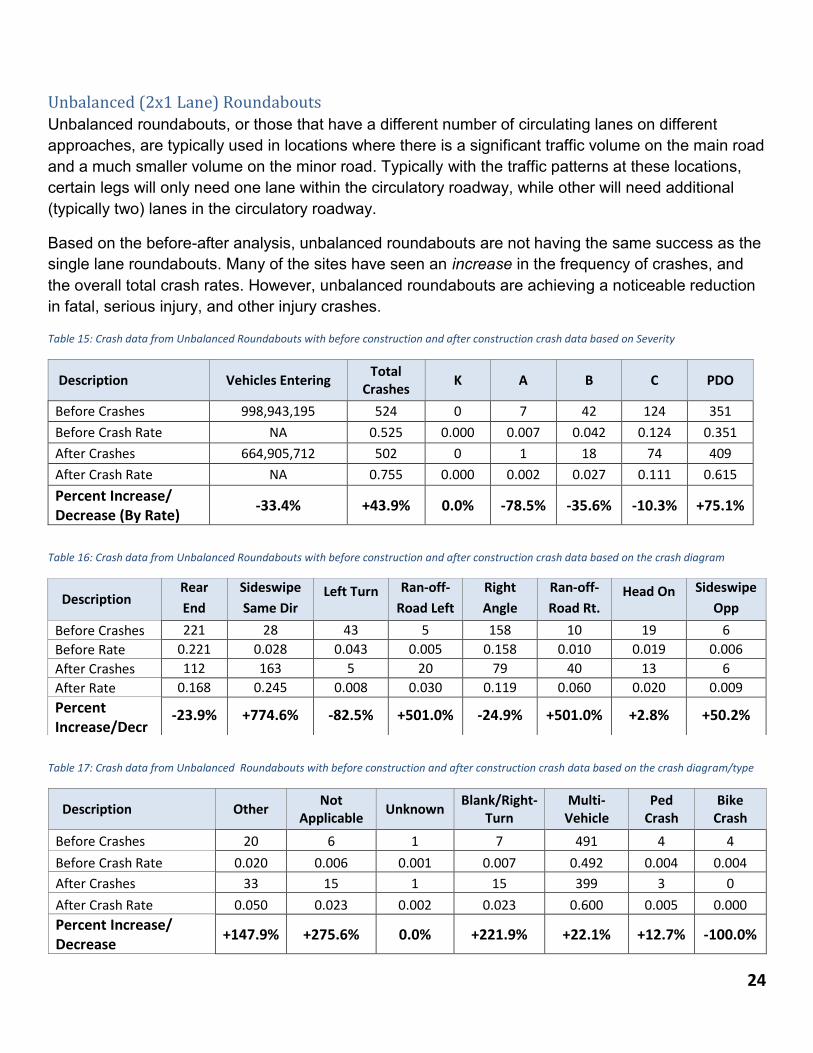
Unbalanced (2x1 Lane) Roundabouts
Unbalanced roundabouts, or those that have a different number of circulating lanes on different
approaches, are typically used in locations where there is a significant traffic volume on the main road
and a much smaller volume on the minor road. Typically with the traffic patterns at these locations,
certain legs will only need one lane within the circulatory roadway, while other will need additional
(typically two) lanes in the circulatory roadway.
Based on the before-after analysis, unbalanced roundabouts are not having the same success as the
single lane roundabouts. Many of the sites have seen an increase in the frequency of crashes, and
the overall total crash rates. However, unbalanced roundabouts are achieving a noticeable reduction
in fatal, serious injury, and other injury crashes.
Table 15: Crash data from Unbalanced Roundabouts with before construction and after construction crash data based on Severity
Description Vehicles Entering Total
Crashes K A B C PDO
Before Crashes 998,943,195 524 0 7 42 124 351
Before Crash Rate NA 0.525 0.000 0.007 0.042 0.124 0.351
After Crashes 664,905,712 502 0 1 18 74 409
After Crash Rate NA 0.755 0.000 0.002 0.027 0.111 0.615
Percent Increase/ Decrease (By Rate)
-33.4% +43.9% 0.0% -78.5% -35.6% -10.3% +75.1%
Table 16: Crash data from Unbalanced Roundabouts with before construction and after construction crash data based on the crash diagram
Table 17: Crash data from Unbalanced Roundabouts with before construction and after construction crash data based on the crash diagram/type
Description Other Not
Applicable Unknown
Blank/Right-Turn
Multi-Vehicle
Ped Crash
Bike Crash
Before Crashes 20 6 1 7 491 4 4
Before Crash Rate 0.020 0.006 0.001 0.007 0.492 0.004 0.004
After Crashes 33 15 1 15 399 3 0
After Crash Rate 0.050 0.023 0.002 0.023 0.600 0.005 0.000
Some of the highlights from the unbalanced roundabout analysis include:
No reported fatal crashes at any of the sites.
A 78% reduction in Serious Injury Crashes
The Fatal and Serious Injury Crash Rate, one of the Minnesota Department of Transportation’s Statewide Performance Measures, decreased from 0.007 Severe Crashes per 1,000,000 Vehicles Entering to 0.002 Severe Crashes per 1,000,000 Vehicles Entering. This marks a 78% reduction in severe crashes.
Fatal and Injury Crashes (K, A, B, and C injury) decreased from 0.17 injury crashes per 1,000,000 Vehicles Entering to 0.14 injury crashes per 1,000,000 Vehicles Entering. This marks an18% reduction in injury crashes.
Right Angle crashes, typically the most deadly type of crash in Minnesota, had a total reduction of 25% of all crash severities.
Left Turn into Traffic crashes had an 83% reduction.
Some of the results to notice for future considerations of unbalanced roundabouts include:
The total crashes rate is up about 44%
Sideswipe Same Direction crash rate is up 774%
Multi-vehicle crashes had a 22% increase.
26
Dual Lane Roundabouts
Full Dual roundabouts, or those that have a 2 circulating lanes on each approach, are typically used
in locations where there is a significant traffic volume on the main road and on the minor road. Since
all of the legs have significant traffic volumes, two circulating lanes are needed on all legs.
Based on the before-after analysis, dual roundabouts are not having the same success as the single
lane roundabouts, and have even higher crash rates then unbalanced roundabouts. Many of the sites
have seen an increase in the frequency of crashes, and the overall total crash rates. However, dual
lane roundabouts are achieving a reduction in serious injury crashes.
Table 18: Crash data from Dual Lane Roundabouts with before construction and after construction crash data based on Severity
Description Vehicles Entering Total
Crashes K A B C PDO
Before Crashes 222,961,345 197 0 3 15 46 133
Before Crash Rate NA 0.884 0.000 0.013 0.067 0.206 0.597
After Crashes 216,209,639 471 0 0 15 53 403
After Crash Rate NA 2.178 0.000 0.000 0.069 0.245 1.864
Percent Increase/ Decrease (By Rate)
-3.0% +146.6% 0.0% -100.0% +3.1% +18.8% +212.5%
Table 19: Crash data from Dual Lane Roundabouts with before construction and after construction crash data based on the crash diagram
Table 20: Crash data from Dual Lane Roundabouts with before construction and after construction crash data based on the crash diagram/type
Description Other Not
Applicable Unknown
Blank/Right-Turn
Multi-Vehicle
Ped Crash
Bike Crash
Before Crashes 14 4 0 1 181 0 4
Before Crash Rate 0.063 0.018 0.000 0.004 0.812 0.000 0.018
After Crashes 26 3 0 20 435 5 2
After Crash Rate 0.120 0.014 0.000 0.093 2.012 0.023 0.009
Percent Increase/ Decrease
91.5% -22.7% 0.0% 1962.5% 147.8% +500% -48.4%
Description Rear
End
Sideswipe
Same Dir
Left Turn Ran-off-
Road Left
Right
Angle
Ran-off-
Road Rt. Head On Sideswipe
Opp
Before Crashes 95 7 26 0 46 0 2 2
Before Rate 0.426 0.031 0.117 0.000 0.206 0.000 0.009 0.009
After Crashes 64 209 19 8 104 11 2 5
After Rate 0.296 0.967 0.088 0.037 0.481 0.051 0.009 0.023
Some of the highlights from the dual lane roundabout analysis include:
No reported fatal crashes at any of the sites.
A 100% reduction in Serious Injury Crashes
The Fatal and Serious Injury Crash Rate, one of the Minnesota Department of Transportation’s Statewide Performance Measures, decreased from 0.013 Severe Crashes per 1,000,000 Vehicles Entering to 0.00 Severe Crashes per 1,000,000 Vehicles Entering. This marks a 100% reduction in severe crashes.
Left Turn into Traffic crashes had a 25% reduction.
Some of the results to notice for future considerations of dual lane roundabouts include:
The total crash rate is up about 146%
Sideswipe Same Direction crash rate is up 2,979%
Right Angle crashes are up 133%
Multi-vehicle crashes had a 148% increase.
28
All Roundabouts
Though each type of roundabout has different safety performance records, the tables below are the
aggregated data from all 144 roundabout sites within this study.
Table 21: Crash data from all Roundabouts with before construction and after construction crash data based on Severity
Description Vehicles Entering Total
Crashes K A B C PDO
Before Crashes 2,351,180,215 1,220 7 27 118 310 758
Before Crash Rate NA 0.519 0.003 0.011 0.050 0.132 0.322
After Crashes 2,485,957,176 1,491 1 5 68 214 1,203
After Crash Rate NA 0.600 0.000 0.002 0.027 0.086 0.484
Percent Increase/ Decrease (By Rate)
+5.7% +15.6% -86.5% -82.5% -45.5% -34.7% +50.1%
Table 22: Crash data from all Roundabouts with before construction and after construction crash data based on the crash diagram
Table 23: Crash data from all Roundabouts with before construction and after construction crash data based on the crash diagram/type
Description Other Not
Applicable Unknown
Blank/Right-Turn
Multi-Vehicle
Ped Crash
Bike Crash
Before Crashes 72 12 4 14 1,127 10 9
Before Crash Rate 0.031 0.005 0.002 0.006 0.479 0.004 0.004
After Crashes 132 36 3 53 1,147 18 5
After Crash Rate 0.053 0.014 0.001 0.021 0.461 0.007 0.002
Percent Increase/ Decrease
+73.4% +183.7% +0.0% +258.0% -3.7% +70.2% -47.5%
Description Rear
End
Sideswipe
Same Dir
Left Turn Ran-off-
Road Left
Right
Angle
Ran-off-
Road Rt. Head On Sideswipe
Opp
Before Crashes 453 50 114 15 401 24 40 21
Before Rate 0.193 0.021 0.048 0.006 0.171 0.010 0.017 0.009
After Crashes 308 414 35 59 272 120 43 16
After Rate 0.124 0.167 0.014 0.024 0.109 0.048 0.017 0.006
Some of the highlights from the total roundabout analysis include:
An 87% reduction in Fatal Crashes
An 83% reduction in Serious Injury Crashes
The Fatal and Serious Injury Crash Rate, one of the Minnesota Department of Transportation’s Statewide Performance Measures, decreased from 0.0144 Severe Crashes per 1,000,000 Vehicles Entering to 0.002 Severe Crashes per 1,000,000 Vehicles Entering. This marks an 84% reduction in severe crashes.
Fatal and Injury Crashes (K, A, B, and C injury) decreased from 0.20 injury crashes per 1,000,000 Vehicles Entering to 0.12 injury crashes per 1,000,000 Vehicles Entering. This marks a 40% reduction in injury crashes.
Right Angle crashes, typically the most deadly type of crash in Minnesota, had a total reduction of 36% of all crash severities.
Left Turn into Traffic crashes had a 71% reduction.
30
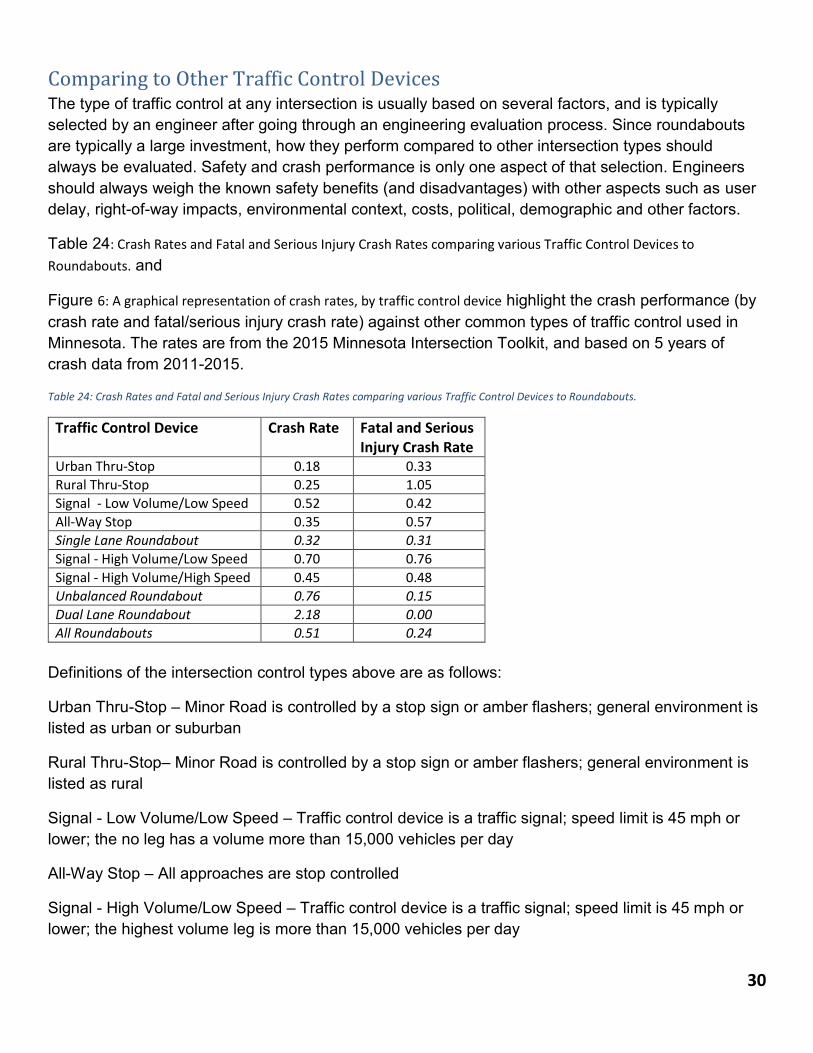
Comparing to Other Traffic Control Devices The type of traffic control at any intersection is usually based on several factors, and is typically
selected by an engineer after going through an engineering evaluation process. Since roundabouts
are typically a large investment, how they perform compared to other intersection types should
always be evaluated. Safety and crash performance is only one aspect of that selection. Engineers
should always weigh the known safety benefits (and disadvantages) with other aspects such as user
delay, right-of-way impacts, environmental context, costs, political, demographic and other factors.
Table 24: Crash Rates and Fatal and Serious Injury Crash Rates comparing various Traffic Control Devices to
Roundabouts. and
Figure 6: A graphical representation of crash rates, by traffic control device highlight the crash performance (by
crash rate and fatal/serious injury crash rate) against other common types of traffic control used in
Minnesota. The rates are from the 2015 Minnesota Intersection Toolkit, and based on 5 years of
crash data from 2011-2015.
Table 24: Crash Rates and Fatal and Serious Injury Crash Rates comparing various Traffic Control Devices to Roundabouts.
Traffic Control Device Crash Rate Fatal and Serious Injury Crash Rate
Urban Thru-Stop 0.18 0.33
Rural Thru-Stop 0.25 1.05
Signal - Low Volume/Low Speed 0.52 0.42
All-Way Stop 0.35 0.57
Single Lane Roundabout 0.32 0.31
Signal - High Volume/Low Speed 0.70 0.76
Signal - High Volume/High Speed 0.45 0.48
Unbalanced Roundabout 0.76 0.15
Dual Lane Roundabout 2.18 0.00
All Roundabouts 0.51 0.24
Definitions of the intersection control types above are as follows:
Urban Thru-Stop – Minor Road is controlled by a stop sign or amber flashers; general environment is
listed as urban or suburban
Rural Thru-Stop– Minor Road is controlled by a stop sign or amber flashers; general environment is
listed as rural
Signal - Low Volume/Low Speed – Traffic control device is a traffic signal; speed limit is 45 mph or
lower; the no leg has a volume more than 15,000 vehicles per day
All-Way Stop – All approaches are stop controlled
Signal - High Volume/Low Speed – Traffic control device is a traffic signal; speed limit is 45 mph or
lower; the highest volume leg is more than 15,000 vehicles per day
31
Signal - High Volume/High Speed– Traffic control device is a traffic signal; speed limit is greater than
45 mph; the highest volume leg is more than 15,000 vehicles per day
Figure 6: A graphical representation of crash rates, by traffic control device
Figure 7: A graphical representation of fatal/serious injury crash rates, by traffic control device
0.18 0.25
0.520.35
Single Lane0.32 0.7
0.45
Unbalanced0.76
Full Dual - 2.18
0.51
0
0.5
1
1.5
2
2.5
Crash Rate
Different Roundabout Types Compared to Other Traffic Control Devices
Urban Thru-Stop Rural Thru-Stop Signal - Low Volume/Low Speed
All-Way Stop Single Lane Roundabout Signal - High Volume/Low Speed
Signal - High Volume/High Speed Unbalanced Roundabout Dual Lane Roundabout
All Roundabouts
0.33
1.05
0.42
0.57
0.31
0.76
0.48
0.15
0.0
0.24
0
0.2
0.4
0.6
0.8
1
1.2
Urban Thru-Stop
Rural Thru-Stop
Signal - LowVolume/Low
Speed
All-Way Stop Single LaneRoundabout
Signal - HighVolume/Low
Speed
Signal - HighVolume/High
Speed
UnbalancedRoundabout
Dual LaneRoundabout
AllRoundabouts
Different Roundabout Types Compared to Other Traffic Control Devices, by Fatal/Serious Injury Crash Rate
32
Conclusion
Roundabouts in Minnesota have experienced over an 80% reduction in fatal and serious injury
crashes. At the time of this report, there still has not been a multi-vehicle fatality in a roundabout in
Minnesota. Other important highlights highlights include:
An 86% reduction in the fatal crash rate at all roundabout types (Single Lane, Unbalanced, and
full Dual Lane Roundabouts)
An 83% reduction in the serious injury crash rate at all roundabout types (Single Lane,
Unbalanced, and full Dual Lane Roundabouts)
A 69% reduction in the Right Angle crash rate at Single Lane Roundabouts.
An 83% reduction in the Left Turning crash rate at Single Lane Roundabouts.
A 61% reduction in the injury crash rate at Single Lane Roundabouts
A 42% reduction in the injury crash rate at all roundabout types (Single Lane, Unbalanced and
full Dual Lane Roundabouts)
The average crash rates for roundabouts by type is shown below.
Type of Roundabouts Number of Sites Crash Rate (CR) Fatal and Serious
Injury Rate (FAR)
Single Lane 104 0.32 0.31
Unbalanced (2 lanes x 1 lane) 34 0.76 0.15
Full Multi-Lane 6 2.18 0.0
Total (All Roundabouts) 144 0.60 0.24
33
Bibliography
"Minnesota Department of Transportation." SALT Home. N.p., n.d. Web. October2 2016. http://www.dot.state.mn.us/stateaid/roundabout/RaListOct2016.xlsx Federal Highway Administration. Roundabouts: An Informational Guide. Tech. no. FHWA-RD-00-067. McLean, VA: Bared, Joe, June 2ooo. Web. 11 Oct. 2016. http://www.fhwa.dot.gov/publications/research/safety/00068/ National Cooperative Highway Research Program. Modern Roundabout Practice in the United States. Rep. Http://onlinepubs.trb.org/onlinepubs/nchrp/nchrp_syn_264.pdf , 1998. Web. 18 Oct. 2016. Federal Highway Administration, Highway Safety Information System (HSIS). Data Request. Submitted and Responded. September 18, 2013 & November 18, 2016. Available online at: http://www.hsisinfo.org/index.cfm Google. Google Maps. Accessed continuously from Accessed continuously from October 1 – July 2017. < https://maps.google.com/ Minnesota Department of Transportation, State Aid for Local Transportation. Crash Mapping Analysis Tool. Accessed continuously from October 1 - July, 2017. http://www.dot.state.mn.us/stateaid/crashmapping.html Minnesota Department of Transportation. Interactive Basemap. Accessed continuously from Accessed continuously from October 1 - July, 2017. http://gisservices.dot.state.mn.us/geocortex/essentials/web/viewer.aspx?site=mndot_basemap Minnesota Department of Transportation. 2006-2015 Crash Data. Accessed continuously from Accessed continuously from October 1 - July, 2017. Minnesota Department of Transportation, Traffic Forecasting and Analysis. AADT GIS Shapefile. Accessed continuously from October 1 - July, 2017. http://www.dot.state.mn.us/traffic/data/data-products.html#volume