13
Officer-Involved Shooting Review Analysis of Cases Investigated by the San Diego County District Attorney’s Office 1996 – 2006 LAW ENFORCEMENT CONFIDENTIAL December 4, 2007

Officer-Involved Shooting Review
Analysis of Cases Investigated by the San Diego County District Attorney’s Office
1996 – 2006
LAW ENFORCEMENT CONFIDENTIAL
December 4, 2007
BACKGROUND This report was prepared by the District Attorney’s Office, in order to better understand the types of officer-involved shootings in San Diego County. Initially, our office sought to collect and analyze ten years of data. Due to the length of time it took to collect all of the necessary data, we were able to include an additional year. The majority of the information comes from the letters sent to the law enforcement agencies by the DA’s Office (SDCDA). Some additional information was obtained from the various law enforcement agencies, in particular the San Diego Police Department’s officer-involved shooting database. Officer-Involved Shooting Reviews The SDCDA has conducted reviews of all officer involved shootings (OIS) in the line of duty by San Diego County peace officers since the mid- 1970's. The role of the District Attorney’s Office is to provide an independent review of all shootings and other use of deadly force, fatal and non-fatal, to determine if there is criminal liability. This review does not examine such issues as compliance with the policies and procedures of any law enforcement agency, ways to improve training, or any issues related to civil liability. Upon completion of the DA’s review where there is a determination that the use of deadly force was justified, a letter summarizing the evidence, including statements of the deputy or officer and other witnesses, is written and delivered to the respective police chief or Sheriff. The review and issuance of the letter may take a couple of months or significantly longer, based on the complexity of the case, the forensic work necessary, and the length of time before the jurisdictional law enforcement agency completes its investigation and presents the case to the DA’s Office (although the data is not available, this may take several weeks up to several months). On average, over the last 11 years, this letter was sent 134 days after the incident occurred (not all of the 2006 cases have had a letter written as of this report). The range was from a low of one month to a high of one and one-half years. Current SDCDA Protocol The “Protocol for Investigation and Review of Officer Involved Shootings and Other Uses of Force Resulting in Death” is signed by the District Attorney, the San Diego County Sheriff, the Warden at Donovan State Prison and the Police Chiefs of all the local law enforcement agencies in San Diego County, including the Border Division of the CHP. The Protocol focuses on the following areas (as they relate to the SDCDA):
• The jurisdictional agency conducts the primary investigation of the incident and submits this to the DA’s Office.
• The jurisdictional agency immediately notifies the designated representative of the DA. • The DA Investigator (DAI) responds and contacts the supervisor in charge of the incident
scene to receive a briefing. The DAI may participate in the witness interviews and view the scene.
• The jurisdictional agency provides a verbal briefing to the DA representatives within 3 days of the incident (if fatal).
1
• Upon completion of the investigation, the jurisdictional agency presents the entire case to the DA’s Office for our independent review.
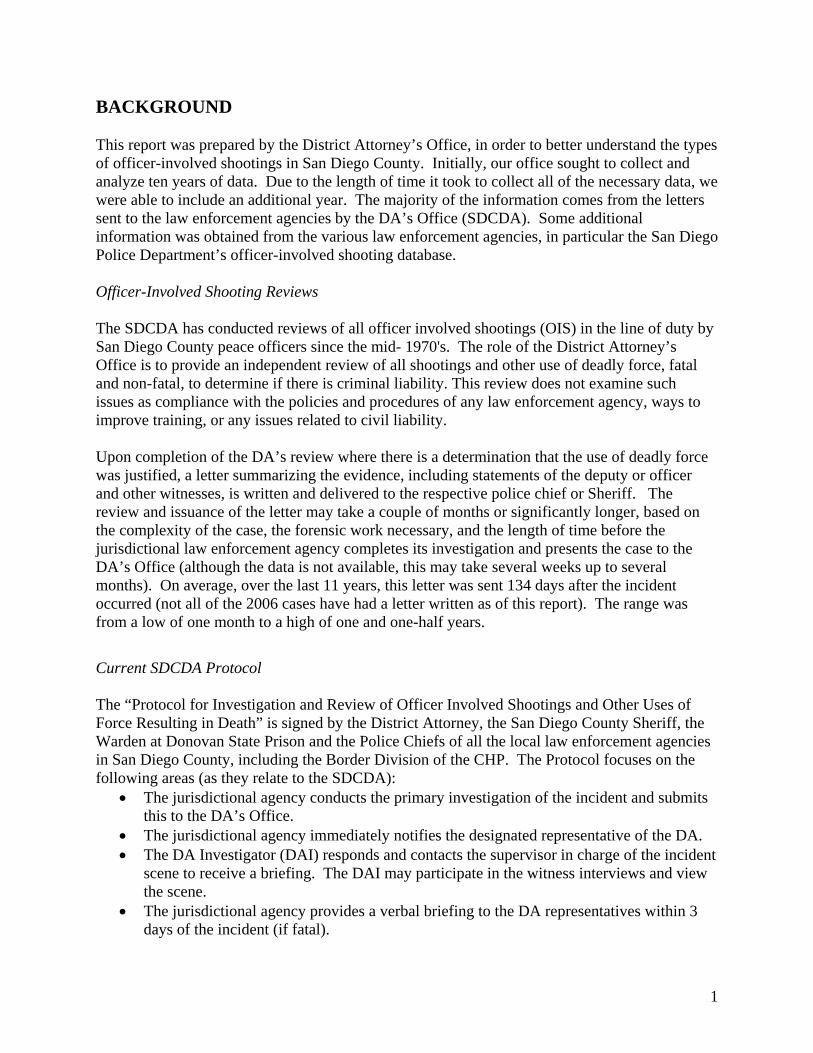
• The DA conducts the independent assessment and writes the letter. ANALYSIS OF THE DATA From 1996 through 2006, the SDCDA investigated 200 OIS cases with 201 suspects. Total cases per year ranged from a low of 10 in 1996 to a high of 24 each in 1997 and 2002. The percentage of fatal shootings ranged from 42% (2002) to 79% (2005) of the total shootings.
BREAKDOWN OF CASES BY YEAR
612
9 10 1013
1013
7
159
4
12
6 49
7 14 10
9
4
8
0
5
10
15
20
25
30
1996
1997
1998
1999
2000
2001
2002
2003
2004
2005
2006
Fatal Non-Fatal
The number of cases per month also varied over the 11 years, with 30 of the 132 months having 0 incidents to a high of 7 incidents in 1 month (May 2002). The average number of cases per month was 1.5. The following graph shows the ups and downs by month over the years.
2

NUMBER OF CASES BY MONTH
0
1
2
3
4
5
6
7
8Ja
n-96
May
-96
Sep-
96Ja
n-97
May
-97
Sep-
97Ja
n-98
May
-98
Sep-
98Ja
n-99
May
-99
Sep-
99Ja
n-00
May
-00
Sep-
00Ja
n-01
May
-01
Sep-
01Ja
n-02
May
-02
Sep-
02Ja
n-03
May
-03
Sep-
03Ja
n-04
May
-04
Sep-
04Ja
n-05
May
-05
Sep-
05Ja
n-06
May
-06
Sep-
06
When did the shootings occur? In analyzing the month of the year in which the incidents occurred, there were no specific months that jumped out over the 11 years. Three months (April, July and December) had 10 each, and November was the high month with 23. Day of Week was also relatively evenly spread, with Saturdays having a slightly higher percentage (one-fifth of the cases) and Sundays and Tuesdays a bit lower.
Sunday10%
Monday14%
Tuesday11%
Wednesday14%
Thursday16%
Friday15%
Saturday20%
3

While shooting incidents occurred during all times of the day and night, most were late night or evening as depicted below. Fifteen cases happened between midnight and 1 am.
0
2
4
6
8
10
12
14
16
Midnight 1am
2am
3am
4am
5am
6am
7am
8am
9am
10am
11am Noon
1pm
2pm
3pm
4pm
5pm
6pm
7pm
8pm
9pm
10pm
11pm
Who was involved? San Diego Police Department was involved in exactly half of the cases, with the Sheriff’s Office involved in just over 25%. The following is a breakdown of the number of cases for all agencies. The total does not add up to 200 as there were several cases that had multiple agencies involved. The federal agencies that are listed are included because they were involved, although not the primary agency. Agency Cases Agency CasesCarlsbad PD 2 La Mesa PD 3CDCR 1 National City PD 10CHP 8 Oceanside PD 10Coronado PD 1 San Diego PD 100Chula Vista PD 4 San Diego Sheriff 52DA's Office 1 State Parks 2El Cajon PD 10 U.S. Marine Corp 1Escondido PD 8 U.S. NCIS 1Harbor PD 1 UCSD PD 1
In 61% of the cases, only 1 officer shot a suspect. There were 2 officers in 44 cases and 3 in 20 cases. Of the remaining, 6 cases had 4 officers firing, 3 had 5 and 1 case each had 6, 7, 9, 10 and 12 officers.
4

The vast majority (92%) of the law enforcement personnel involved in the shootings were patrol/uniformed officers.1 The remainder were split between tactical operations (e.g. SWAT) which had 6% and plain clothes and off-duty were 1% each. The race and gender breakdowns for officers (1st table) and suspects (2nd table) are listed below. Officer Race Female Male Total Suspect Race Female Male TotalAmerican Indian 1 1 Asian/Filipino 3 3 Asian/Filipino 1 11 12 Black 22 22 Black 1 19 20 Hispanic 1 42 43 Hispanic 1 40 41 Other 2 2 Pacific Islander 1 1 White 5 33 38 White 9 230 239 Unknown 4 88 92 Unknown 2 29 31 Total 10 190 200 Total 14 331 345
Of the 103 shootings in which we know the officer(s) and the suspect races, the analysis showed the following breakdown:
mixed(officer)-white(susp)
5%
mixed(officer)-nonwhite(susp)
10%
nonwhite(officer)-
nonwhite(susp)12%
nonwhite(officer)-white(susp)
9%white(officer)-nonwhite(susp)
42%
white(officer)-white(susp)
22%
*Mixed (officer) means that there were multiple officers shooting, and some were white and some were nonwhite. It is very difficult to draw conclusions from this data because of the lack of knowledge of the demographics of the area/population as well as demographics of the officers/agencies assigned to that area.
1 At the time of the study, the assignments were known for only 195 of the 348 officers involved.
5
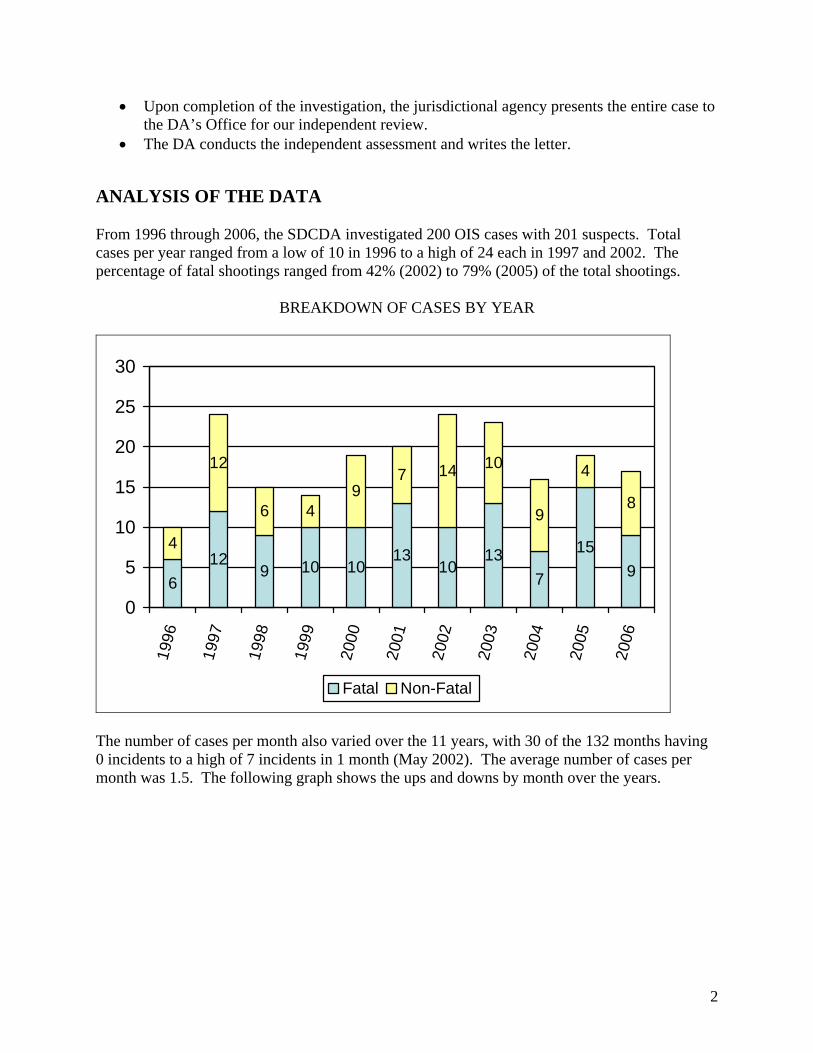
Male suspects ranged in age from 15 to 75, with nearly 50 percent of all suspects being between 18 and 29. Female suspects (only 8 had known ages) ranged from 16 to 51.
0
2
4
6
8
10
12
14
15 17 19 21 23 25 27 29 31 33 35 37 39 41 43 45 49 52 58 75
Age
Num
ber o
f Cas
es
Female Male
Of the 123 Suspects that could be determined if they were on Parole or Probation at the time of the shooting, exactly one-third were and two-thirds were not. Where did the cases take place? While the shootings occurred all over the County, just over half were in the City of San Diego. The remaining 96 were divided up with 24 in unincorporated County, 15 in Vista, 14 in Oceanside, and 8 each in National City and Escondido. The remaining cities had 6 or fewer. City/Community Cases City/Community CasesBonita 1 Lemon Grove 1Borrego Springs 1 National City 8Buckman Springs 1 Oceanside 14Carlsbad 2 Pala 1Chula Vista 4 Poway 1Dulzura 1 Ramona 1El Cajon 6 Rancho Santa Fe 1El Cajon Unincorp 1 San Diego 104Encinitas 2 San Marcos 2Escondido 8 Santee 3Escondido Unincorp 3 Santee Unincorp. 1Fallbrook 3 Solana Beach 2Imperial Beach 1 Spring Valley 4La Mesa 3 Valley Center 2Lakeside 3 Vista 15
6

The following map depicts the specific locations of the shootings:
7

The type of location where the shooting occurred also varied widely. Most were outdoors, with nearly one-third being in the street.
Apt/Multi Family (outside)
9%
Yard5%
Outdoor Open Area3%
Inside Residence
11%
Inside Business4%
Parking Lot14%
Garage/Shed1%
Vehicle16%
Driveway4%
Street32%
Business Complex (outside)
1%
Other Characteristics of the Shootings The officer(s) may use a less than lethal (LTL) option prior to the actual shooting. This was done in 43 cases (22% of the total), with the following breakdown by type of less than lethal used: Less than Lethal (LTL) CasesBaton 4Baton & Chemical Spray 2Baton, Taser & K-9 1Baton, Chemical Spray, Taser, LTL Shotgun, Nunchakus 1Chemical Spray 15Chemical Spray & Nunchakus 1K-9 14LTL Shotgun 1Rubber Bullets & K9 1Taser 3
8

Similar to incidents where officers are killed or assaulted2, family/domestic disturbance is the most common incident type that officers have gone prior to an officer-involved shooting, followed by robbery and traffic stop. The following chart depicts the 12 most common incident types preceding a shooting for the 11 years of cases.
21
20
17
16
15
13
11
11
10
9
8
7
0 5 10 15 20 25
Family/DVRobbery
Traffic StopShots Fired
Warrant/Suspect ContactStolen Vehicle
GunTraffic-related
AssaultMental
Suspicious PersonBurglary
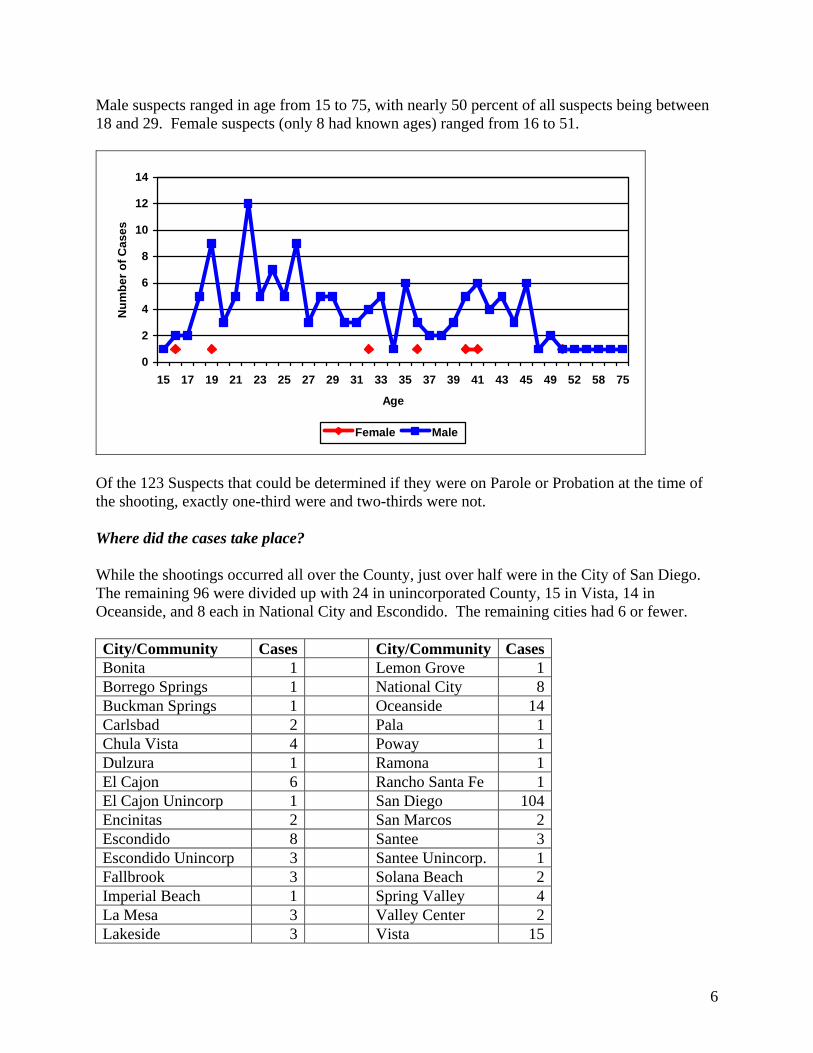
In over half of the cases (60%), the source of the initial contact was a radio call. The next most common sources were self-initiated by the officer (15%) and traffic stops (10%).
2 According to FBI statistics for Law Enforcement Officers Killed and Assaulted (http://www.fbi.gov/ucr/ucr.htm#leoka), in the State of California for 2003 through 2006, approximately 7,000 officers were assaulted and at least 5 killed each year. Disturbance call was the number one crime type for assaults, and the three most common crime types preceding an officer being killed were traffic stop, domestic disturbance, and robbery.
9
Radio Call60%
Citizen Contact
2%
Patrol6%
Other1%Traffic
10%
Follow-up Inv3%
Self-Initiated15%
Investigation3%
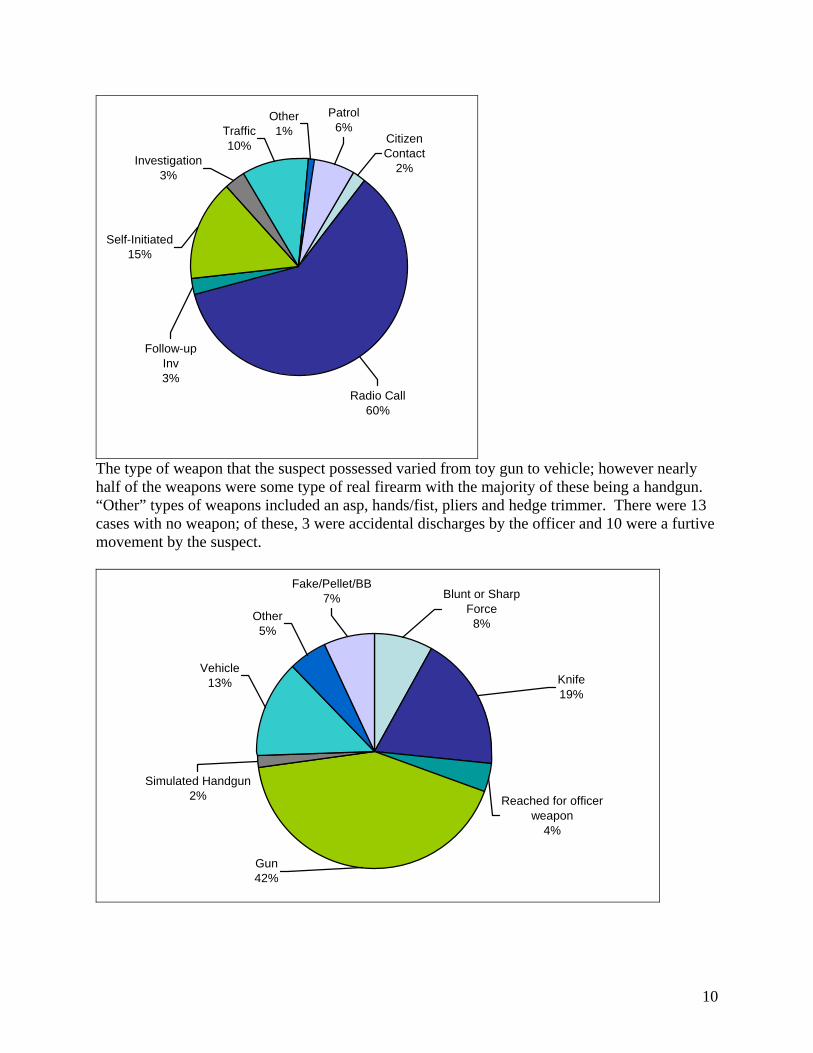
The type of weapon that the suspect possessed varied from toy gun to vehicle; however nearly half of the weapons were some type of real firearm with the majority of these being a handgun. “Other” types of weapons included an asp, hands/fist, pliers and hedge trimmer. There were 13 cases with no weapon; of these, 3 were accidental discharges by the officer and 10 were a furtive movement by the suspect.
Gun42%
Simulated Handgun2%
Vehicle13%
Other5%
Fake/Pellet/BB7% Blunt or Sharp
Force8%
Reached for officer weapon
4%
Knife19%
10
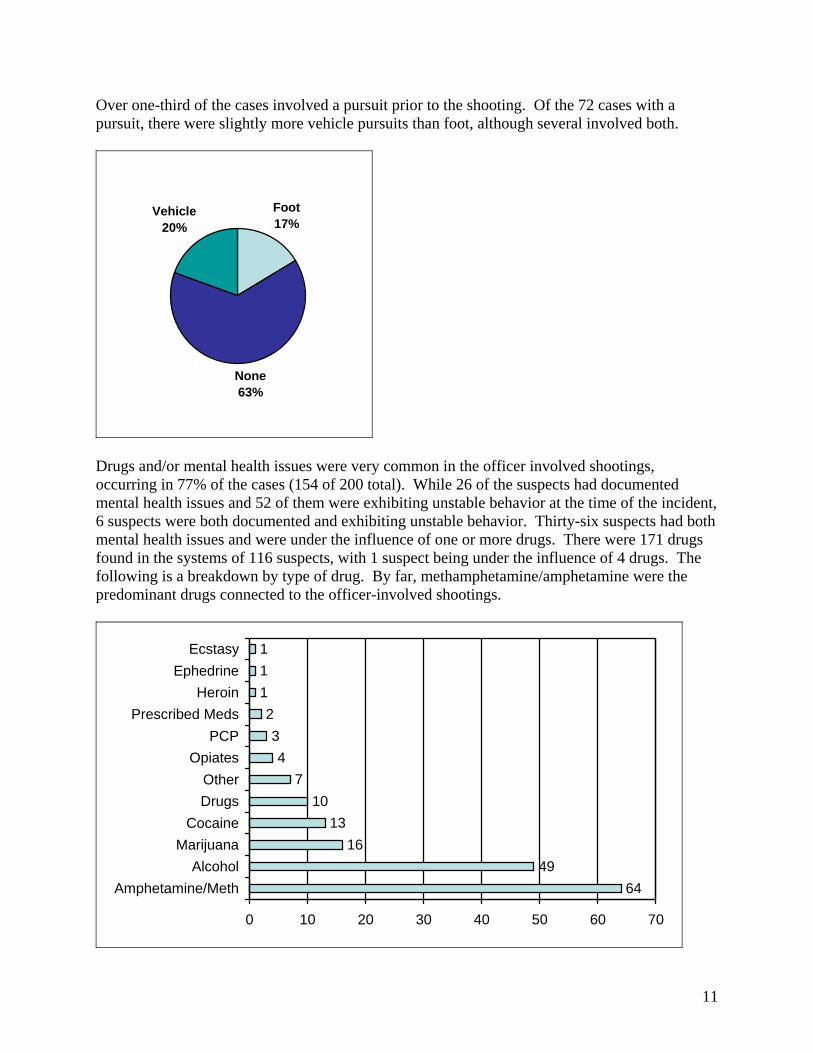
Over one-third of the cases involved a pursuit prior to the shooting. Of the 72 cases with a pursuit, there were slightly more vehicle pursuits than foot, although several involved both.
Foot17%
None63%
Vehicle20%
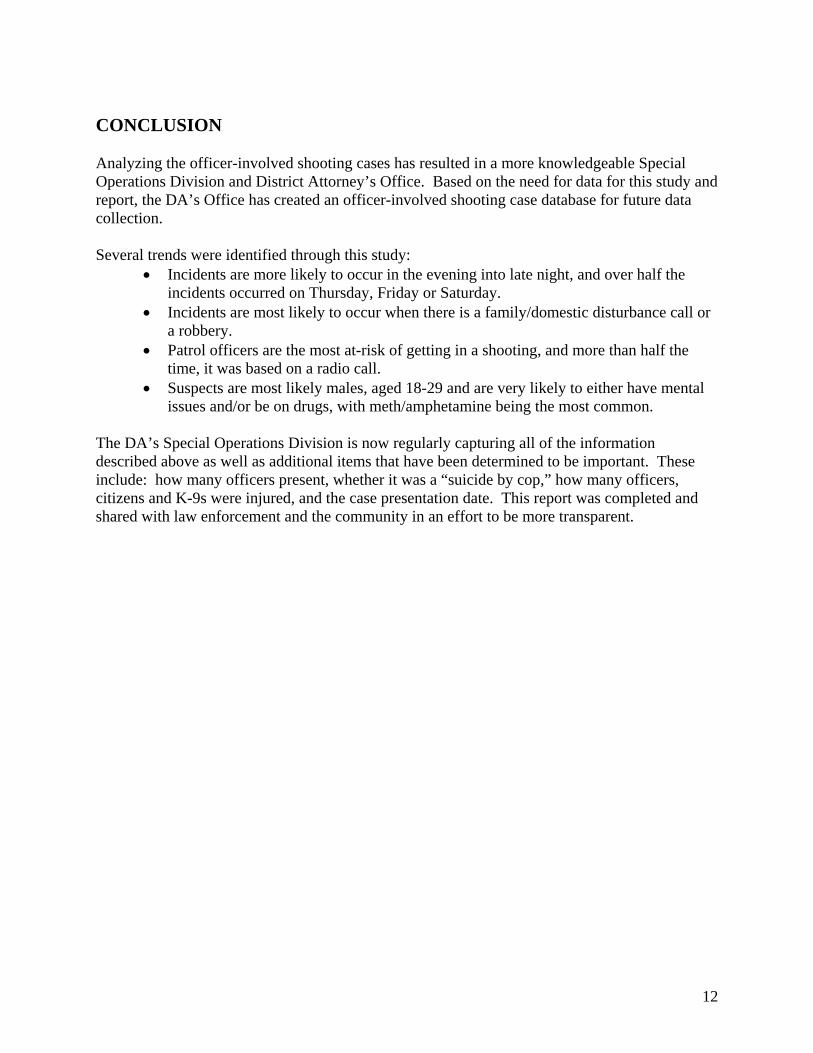
Drugs and/or mental health issues were very common in the officer involved shootings, occurring in 77% of the cases (154 of 200 total). While 26 of the suspects had documented mental health issues and 52 of them were exhibiting unstable behavior at the time of the incident, 6 suspects were both documented and exhibiting unstable behavior. Thirty-six suspects had both mental health issues and were under the influence of one or more drugs. There were 171 drugs found in the systems of 116 suspects, with 1 suspect being under the influence of 4 drugs. The following is a breakdown by type of drug. By far, methamphetamine/amphetamine were the predominant drugs connected to the officer-involved shootings.
6449
1613
107
43
2111
0 10 20 30 40 50 60 70
Amphetamine/MethAlcohol
MarijuanaCocaine
DrugsOther
OpiatesPCP
Prescribed MedsHeroin
EphedrineEcstasy
11
CONCLUSION Analyzing the officer-involved shooting cases has resulted in a more knowledgeable Special Operations Division and District Attorney’s Office. Based on the need for data for this study and report, the DA’s Office has created an officer-involved shooting case database for future data collection. Several trends were identified through this study:
• Incidents are more likely to occur in the evening into late night, and over half the incidents occurred on Thursday, Friday or Saturday.
• Incidents are most likely to occur when there is a family/domestic disturbance call or a robbery.
• Patrol officers are the most at-risk of getting in a shooting, and more than half the time, it was based on a radio call.
• Suspects are most likely males, aged 18-29 and are very likely to either have mental issues and/or be on drugs, with meth/amphetamine being the most common.
The DA’s Special Operations Division is now regularly capturing all of the information described above as well as additional items that have been determined to be important. These include: how many officers present, whether it was a “suicide by cop,” how many officers, citizens and K-9s were injured, and the case presentation date. This report was completed and shared with law enforcement and the community in an effort to be more transparent.
12


