Council Meeting Agenda 24/08/2020 City of Boroondara 4 7.9 Recommendations of the Audit Committee - Annual Financial Statements and Performance Statement for the year ended 30 June 2020 Abstract This report presents to Council the recommendations of the Audit Committee meeting held on 19 August 2020 pertaining to the Annual Financial Statements and Performance Statement for the year ended 30 June 2020. This report also provides an overview of the delivery of all Service Performance Indicators and Council’s assessment against the Governance and Management Checklist. The Annual Financial Statements and Performance Statement for the year ended 30 June 2020 were reviewed by the Audit Committee and were endorsed for Council’s consideration. Officers' recommendation That Council resolve to: 1. Record its approval in principle of the Annual Financial Statements and Performance Statement for the year ended 30 June 2020 as contained in Attachment 1 and annexed to the confidential minutes, as approved by the Audit Committee. 2. Authorise the Chief Executive Officer to provide the Annual Financial Statements, and Performance Statement to the Auditor-General. 3. Authorise the Mayor, Councillor Cynthia Watson and Councillor Lisa Hollingsworth (representing the Audit Committee) to certify the Annual Financial Statements and Performance Statement in their final form. 4. Authorise the Principal Accounting Officer to implement any non-material changes to the Annual Financial Statements and Performance Statement as recommended by the Auditor-General. A summary of these changes if any will be presented at the next Audit Committee meeting. 5. Note that any material changes to the Annual Financial Statements and Performance Statement that may be required by the Auditor-General following his review of the statements will be discussed with the Audit Committee Chair prior to being finalised. 6. Note the results of the Local Government Performance Reporting Framework (LGPRF) indicators and the assessment of materiality thresholds (Attachment 2). 7. Note the Governance and Management Checklist (Attachment 3).
Transcript
Council Meeting Agenda 24/08/2020
City of Boroondara 4
7.9 Recommendations of the Audit Committee - Annual Financial Statements and Performance Statement for the year ended 30 June 2020
Abstract
This report presents to Council the recommendations of the Audit Committee meeting held on 19 August 2020 pertaining to the Annual Financial Statements and Performance Statement for the year ended 30 June 2020. This report also provides an overview of the delivery of all Service Performance Indicators and Council’s assessment against the Governance and Management Checklist.
The Annual Financial Statements and Performance Statement for the year ended 30 June 2020 were reviewed by the Audit Committee and were endorsed for Council’s consideration.
Officers' recommendation
That Council resolve to:
1. Record its approval in principle of the Annual Financial Statements and Performance Statement for the year ended 30 June 2020 as contained in Attachment 1 and annexed to the confidential minutes, as approved by the Audit Committee.
2. Authorise the Chief Executive Officer to provide the Annual Financial Statements, and Performance Statement to the Auditor-General.
3. Authorise the Mayor, Councillor Cynthia Watson and Councillor Lisa Hollingsworth (representing the Audit Committee) to certify the Annual Financial Statements and Performance Statement in their final form.
4. Authorise the Principal Accounting Officer to implement any non-material changes to the Annual Financial Statements and Performance Statement as recommended by the Auditor-General. A summary of these changes if any will be presented at the next Audit Committee meeting.
5. Note that any material changes to the Annual Financial Statements and Performance Statement that may be required by the Auditor-General following his review of the statements will be discussed with the Audit Committee Chair prior to being finalised.
6. Note the results of the Local Government Performance Reporting Framework (LGPRF) indicators and the assessment of materiality thresholds (Attachment 2).
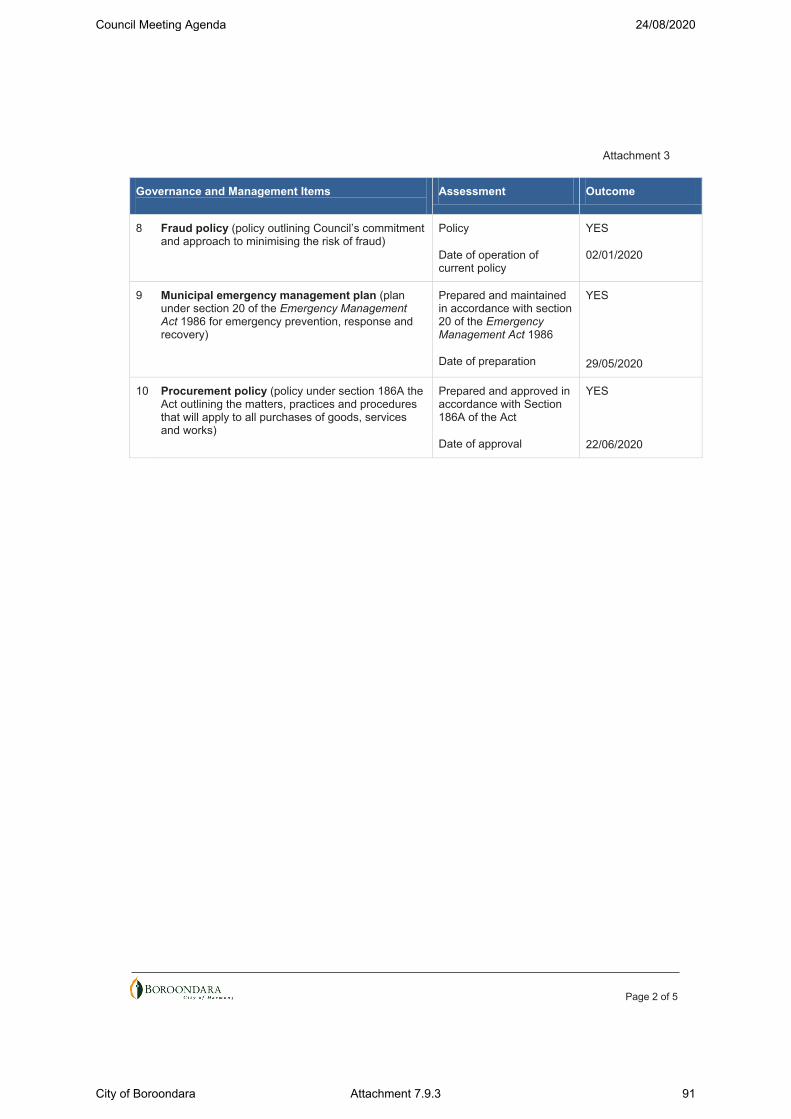
7. Note the Governance and Management Checklist (Attachment 3).
Council Meeting Agenda 24/08/2020
City of Boroondara 5
Responsible director: Bruce DobsonCustomer Experience and Business Transformation
This report presents to Council the recommendations of the Audit Committee meeting held on 19 August 2020 pertaining to the Annual Financial Statements and Performance Statement for the year ended 30 June 2020. This report also includes an overview of the delivery of all Service Performance Indicators and Council’s assessment against the Governance and Management Checklist.
2. Policy implications and relevance to community plan and council plan
The Annual Financial Statements and Performance Statement for the year ended 30 June 2020 have been prepared in accordance with the Local Government (Planning and Reporting) Regulations 2014, the Local Government Act 1989, Australian Accounting Standards, other authoritative pronouncements of the Australian Accounting Standards Board and internal accounting policies.
The Financial Statements have been prepared in accordance with the “Local Government Model Financial Report” issued by the Department of Environment, Land, Water and Planning in February 2020.
The results of Service Performance Indicators and the assessment of Governance and Management checklist have been prepared in accordance with the Local Government (Planning and Reporting) Regulations 2014.
This report is consistent with the Council Plan 2017-21 and the Boroondara Community Plan. In particular, the Council Plan theme of Civic Leadership & Governance and the strategy “Ensure sound financial management while allocating resources to deliver strategic infrastructure and services that meet community needs”.
3. Background
The Audit Committee met on 19 August 2020 to consider the Annual Financial Statements and Performance Statement for the year ended 30 June 2020. Representatives from the Auditor-General’s contracted agent HLB Mann Judd were present.
4. Outline of key issues/options
Council’s Annual Financial Statements and Performance Statement (Attachment 1) have been successfully finalised in accordance with the timelines set down in the year end timetable.
Detailed analysis of operational financial and non-financial performance for the year ended 30 June 2020 has been included in the June 2020 Quarterly Performance Report (QPR) which will be presented to Council at the Council meeting on 24 August 2020.
Council Meeting Agenda 24/08/2020
City of Boroondara 6
The year-end Audit draft Closing Report, the draft Final Management Letter and draft Management Representation was presented to Audit Committee. The Auditor’s Closing Report raised no issues in relation to the statements and the Auditors advised the Committee the Auditor-General has given preliminary approval subject to Council’s endorsement.
Information on all LGPRF Performance Indicators and materiality thresholds is detailed in Attachment 2. This includes the numerator and denominator used to calculate the reported Service Performance indicators and explanations to any material variations.
An assessment of the Governance and Management Checklist is included in Attachment 3.
The Annual Financial Statements and Performance Statement for the year ended 30 June 2020 were reviewed by the Audit Committee and were endorsed for Council’s consideration.
5. Consultation/communication
The agent of the Auditor-General, HLB Mann Judd, has completed the audit of the Annual Financial Statements and Performance Statement for the year ended 30 June 2020. These statements and accompanying documents were presented to the Audit Committee on 19 August 2020.
6. Financial and resource implications
Audit fieldwork and examination of the Annual Financial Statements and the Performance Statement has been completed on time within legislative deadlines.
7. Governance issues
Officers involved in the preparation of this report have no conflict of interest. The list of prescribed human rights contained in the Victorian Charter of Human Rights and Responsibilities has been reviewed in accordance with Council's Human Rights Compatibility Assessment Tool and it is considered that the proposed actions contained in this report present no breaches of, or infringements upon, those prescribed rights.
All related party transactions are fully disclosed in accordance with Australian Accounting Standards in Note 7 of the Annual Financial Statements.
8. Social and environmental issues
Consideration has been given to environmental issues. As a result, Council’s Annual Report (which includes the Annual Financial Statements and Performance Statement) is available online to minimise the impact on the environment.
Council Meeting Agenda 24/08/2020
City of Boroondara 7
9. Evaluation and review
Following adoption of the above recommendations, the Annual Financial Statements and Performance Statement for the year ended 30 June 2020 will be forwarded to the Auditor-General’s office. Final sign-off from the Auditor-General is expected by mid to late September in time to meet the statutory deadline of 30 September 2020 for submission of Council’s Annual Report to the Minister.
10. Conclusion
The Auditor-General’s agent, HLB Mann Judd, has completed their audit and has found no issues that would warrant a qualification of the Financial Statements. The final audit opinion will be issued by the Auditor-General and final audit clearance in the form of an “unqualified” audit opinion is expected.
DRAFT Annual Financial Report For the Year Ended 30 June 2020
Attachment 1 (Part 1)
Year Ended
30 June 2020
Council Meeting Agenda 24/08/2020
City of Boroondara Attachment 7.9.1 8
DRAFT
Council Meeting Agenda 24/08/2020
City of Boroondara Attachment 7.9.1 9
DRAFT
Table of ContentsPage
12
45678
9
Note 1 Performance against budget 101.1. Income and expenditure 101.2. Capital works 12
Note 2 Analysis of Council results by program 14
Note 3 Funding for the delivery of our services 163.1. Rates and charges 163.2. Statutory fees and fines 163.3. User fees 163.4. Funding from other levels of government 173.5. Contributions 183.6. Net gain/(loss) on disposal of property, infrastructure, plant and equipment 183.7. Other income 19
Note 4 The cost of delivering services 194.1. Employee costs 194.2. Materials and services 204.3. Depreciation 204.4. Amortisation - Intangible assets 204.5. Amortisation - Right of use assets 204.6. Bad and doubtful debts 204.7. Borrowing costs 214.8. Finance costs - Leases 214.9. Other expenses 21
Notes to Financial Statements
Statement of Changes in EquityBalance Sheet
Statement of Capital Works
Overview
Financial StatementsComprehensive Income Statement
Statement of Cash Flows
Certification of the Financial StatementsFinancial Report
Note 6 Assets we manage 306.1. Non current assets classified as held for sale 306.2. Property, infrastructure, plant and equipment 316.3. Investments in joint arrangements 386.4. Investment property 39
Note 7 People and relationships 407.1. Council and key management remuneration 407.2. Related party disclosure 42
Note 8 Managing uncertainties 438.1. Contingent assets and liabilities 438.2. Change in accounting standards 448.3. Financial instruments 458.4. Fair value measurement 478.5. Events occurring after balance date
Note 9 Other matters 489.1 Reserves 489.2 Reconciliation of cash flows from operating activities to surplus/(deficit) 509.3 Superannuation 50
Note 10 Change in accounting policy 53
Note 11 Impact of COVID 19 on Council operations and 2019-20 financial report 54
Council Meeting Agenda 24/08/2020
City of Boroondara Attachment 7.9.1 11
DRAFT
1
Callista Clarke, CPA
Date:Camberwell
Cr Cynthia WatsonMayor
Date:Camberwell
Cr Lisa HollingsworthCouncillor
Date:Camberwell
Phillip StorerChief Executive Officer
Date:Camberwell
Certification of the Financial Statements
In our opinion, the accompanying financial statements present fairly the financial transactions of theCity of Boroondara for the year ended 30 June 2020 and the financial position of the Council as at thatdate.
As at the date of signing, we are not aware of any circumstances which would render any particulars inthe financial statements to be misleading or inaccurate.
We have been authorised by the Council and by the Local Government (Planning and Reporting)Regulations 2014 to certify the financial statements in their final form.
Principal Accounting Officer
In my opinion, the accompanying financial statements have been prepared in accordance with theLocal Government Act 1989 , the Local Government (Planning and Reporting) Regulations 2014 , theAustralian Accounting Standards and other mandatory professional reporting requirements.
Council Meeting Agenda 24/08/2020
City of Boroondara Attachment 7.9.1 12
DRAFT
2
<INSERT VAGO REPORT - PAGE 1>
Council Meeting Agenda 24/08/2020
City of Boroondara Attachment 7.9.1 13
DRAFT
3
<INSERT VAGO REPORT - PAGE 2>
Council Meeting Agenda 24/08/2020
City of Boroondara Attachment 7.9.1 14
DRAFT
4
Comprehensive Income StatementFor the year ended 30 June 2020
Note 2020 2019$'000 $'000
IncomeRates and charges 3.1 189,426 179,994Statutory fees and fines 3.2 13,005 15,897User fees 3.3 12,220 13,685Grants - operating 3.4 13,566 14,917Grants - capital 3.4 1,179 1,963Contributions - monetary 3.5 6,919 5,959Contributions - non-monetary assets 3.5 - 840Other income 3.7 7,663 8,987Total income 243,978 242,242
ExpensesEmployee costs 4.1 (98,699) (92,288)Materials and services 4.2 (79,149) (68,846)Depreciation 4.3 (33,902) (32,934)Amortisation - intangible assets 4.4 (631) (735)Amortisation - right of use assets 4.5 (3,059) -Bad and doubtful debts 4.6 (1,516) (1,643)Borrowing costs 4.7 (1,428) (1,652)Finance costs - leases 4.8 (270) -Other expenses 4.9 (8,045) (10,811)Net loss on disposal of property, infrastructure, plant and equipment 3.6 (4,625) (2,288)
Share of net (losses) of joint ventures 6.3 (395) (326)Total expenses (231,719) (211,523)
Surplus for the year 12,259 30,719
Other comprehensive incomeItems that will not be reclassified to surplus or deficit in future periodsNet asset revaluation increment/(decrement) 6.2 135,133 (420,735)
Total comprehensive result 147,392 (390,016)
The above comprehensive income statement should be read in conjunction with the accompanying notes.
Council Meeting Agenda 24/08/2020
City of Boroondara Attachment 7.9.1 15
DRAFT
5
Balance SheetAs at 30 June 2020
Note 2020 2019$'000 $'000
AssetsCurrent assetsCash and cash equivalents 5.1 (a) 99,259 98,935Trade and other receivables 5.1 (c) 21,316 17,790Other financial assets 5.1 (b) 15,078 26,593Inventories 5.2 (a) 31 31Other assets 5.2 (b) 1,956 1,652Total current assets 137,640 145,001
Balance at beginning of the financial year 3,479,503 927,776 2,534,824 16,903Adjusted Opening balance 3,479,503 927,776 2,534,824 16,903
Surplus for the year 12,259 12,259 - -Net asset revaluation increment/ (decrement) 6.2 135,133 - 135,133 -Transfers to other reserves 9.1 - (1,800) - 1,800Transfers from other reserves 9.1 - 1,089 (1,089) -Balance at end of the financial year 3,626,895 939,324 2,668,868 18,703
Balance at beginning of the financial year 3,869,347 898,046 2,956,198 15,103Surplus for the year 30,719 30,719 - -Net asset revaluation increment/ (decrement) 9.1 (420,735) - (420,735) -Transfers to other reserves 9.1 - (1,800) - 1,800Transfers from other reserves 9.1 - 639 (639) -Adjustment directly to equity 172 172 - -Balance at end of the financial year 3,479,503 927,776 2,534,824 16,903
The above statement of changes in equity should be read in conjunction with the accompanying notes.
For the year ended 30 June 2020Statement of Changes in Equity
Council Meeting Agenda 24/08/2020
City of Boroondara Attachment 7.9.1 17
DRAFT
7
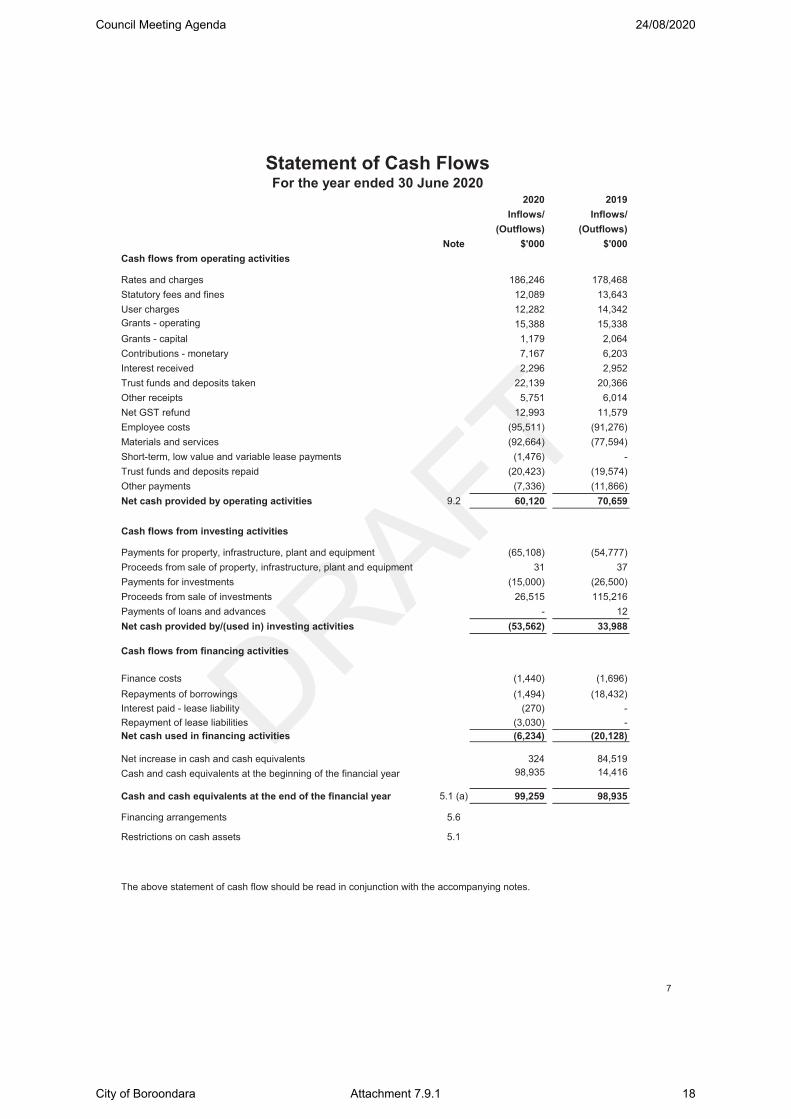
2020 2019Inflows/ Inflows/
(Outflows) (Outflows)Note $'000 $'000
Cash flows from operating activities
Rates and charges 186,246 178,468Statutory fees and fines 12,089 13,643User charges 12,282 14,342Grants - operating 15,388 15,338Grants - capital 1,179 2,064Contributions - monetary 7,167 6,203Interest received 2,296 2,952Trust funds and deposits taken 22,139 20,366Other receipts 5,751 6,014Net GST refund 12,993 11,579Employee costs (95,511) (91,276)Materials and services (92,664) (77,594)Short-term, low value and variable lease payments (1,476) -Trust funds and deposits repaid (20,423) (19,574)Other payments (7,336) (11,866)Net cash provided by operating activities 9.2 60,120 70,659
Cash flows from investing activities
Payments for property, infrastructure, plant and equipment (65,108) (54,777)Proceeds from sale of property, infrastructure, plant and equipment 31 37Payments for investments (15,000) (26,500)Proceeds from sale of investments 26,515 115,216Payments of loans and advances - 12Net cash provided by/(used in) investing activities (53,562) 33,988
Cash flows from financing activities
Finance costs (1,440) (1,696)Repayments of borrowings (1,494) (18,432)Interest paid - lease liability (270) -Repayment of lease liabilities (3,030) -Net cash used in financing activities (6,234) (20,128)
Net increase in cash and cash equivalents 324 84,519Cash and cash equivalents at the beginning of the financial year 98,935 14,416
Cash and cash equivalents at the end of the financial year 5.1 (a) 99,259 98,935
Financing arrangements 5.6
Restrictions on cash assets 5.1
For the year ended 30 June 2020Statement of Cash Flows
The above statement of cash flow should be read in conjunction with the accompanying notes.
Plant and equipmentPlant, machinery and equipment 2,033 2,061Fixtures, fittings and furniture 1,554 1,324Computers and telecommunications 1,834 1,588Library books 902 1,005Total plant and equipment 6,323 5,978
InfrastructureRoads 11,736 11,538Bridges 27 82Footpaths and cycleways 2,539 2,999Drainage 4,298 4,979Recreational, leisure and community facilities 1,903 2,683Parks, open space and streetscapes 9,081 6,655Off street car parks 404 431Total infrastructure 29,988 29,367
The above statement of capital works should be read in conjunction with the accompanying notes.
Statement of Capital WorksFor the year ended 30 June 2020
Council Meeting Agenda 24/08/2020
City of Boroondara Attachment 7.9.1 19
DRAFT
9
OVERVIEW
Introduction
Statement of compliance
Significant accounting policies
(a) Basis of accounting
- the fair value of land, buildings, infrastructure, plant and equipment (refer to Note 6.2) - the determination of depreciation for buildings, infrastructure, plant and equipment (refer to Note 6.2) - the determination of employee provisions (refer to Note 5.5)
Unless otherwise stated, all accounting policies are consistent with those applied in the prior year. Where appropriate, comparative figures have been amended to accord with current presentation (except where transitional requirements of AASB 15 Revenue from Contracts with Customers , AASB 16 Leases and AASB 1058 Income of Not-for-Profit Entities do not require restatement of comparatives under the modified retrospective approach adopted by the Council), and disclosure has been made of any material changes to comparatives.
Notes to the Financial Statements
The City of Boroondara was established by an Order of the Governor in Council on 22 June 1994 and is abody corporate. The Council's main office is located at 8 Inglesby Road, Camberwell.
These financial statements are a general purpose financial report that consists of a Comprehensive IncomeStatement, Balance Sheet, Statement of Changes in Equity, Statement of Cash Flows, Statement of CapitalWorks and notes accompanying these financial statements. The general purpose financial report complieswith Australian Accounting Standards (AAS), other authoritative pronouncements of the AustralianAccounting Standards Board, the Local Government Act 1989 , and the Local Government (Planning andReporting) Regulations 2014 .
The accrual basis of accounting has been used in the preparation of these financial statements, wherebyassets, liabilities, equity, income and expenses are recognised in the reporting period to which they relate,regardless of when cash is received or paid.
Judgements, estimates and assumptions are required to be made about the carrying values of assets andliabilities that are not readily apparent from other sources. The estimates and associated judgements arebased on professional judgement derived from historical experience and various other factors that arebelieved to be reasonable under the circumstances. Actual results may differ from these estimates.
Revisions to accounting estimates are recognised in the period in which the estimate is revised and also infuture periods that are affected by the revision. Judgements and assumptions made by management in theapplication of AAS's that have significant effects on the financial statements and estimates relate to:
- other areas requiring judgments
- the determination of whether performance obligations are sufficiently specific so as to determine whether an arrangement is within the scope of AASB 15 Revenue from Contracts with Customers or AASB 1058 Income of Not-for-Profit Entities (refer to Note 3) - the determination, in accordance with AASB 16 Leases , of the lease term, the estimation of the discount rate when not implicit in the lease and whether an arrangement is in substance short-term or low value (refer to Note 5.8)
Council Meeting Agenda 24/08/2020
City of Boroondara Attachment 7.9.1 20
DRAFT
10
Note 1 - Performance against budget
1.1 Income and ExpenditureBudget Actual Variance Variance
2020 2020 2020 2020Ref $'000 $'000 $'000 %
IncomeRates and charges 188,807 189,426 619 0.3 Statutory fees and fines 1 16,448 13,005 (3,443) (20.9) User fees 2 14,324 12,220 (2,104) (14.7) Grants - operating 3 12,244 13,566 1,322 10.8 Grants - capital 4 1,354 1,179 (175) (12.9) Contributions - monetary 5 5,269 6,919 1,650 31.3 Other income 8,200 7,663 (537) (6.5) Total income 246,646 243,978 2,668- (1.1)
ExpensesEmployee costs 6 95,517 98,699 3,182 3.3 Materials and services 7 80,993 79,149 (1,844) (2.3) Depreciation 8 35,549 33,902 (1,647) (4.6) Amortisation - Intangible assets 9 - 631 631 100.0 Amortisation - Right of use assets 10 - 3,059 3,059 100.0 Bad and doubtful debts 11 1,226 1,516 290 23.7 Borrowing costs 1,424 1,428 4 0.3 Finance costs - Leases 12 - 270 270 100.0 Other expenses 13 12,176 8,045 (4,131) (33.9) Net loss on disposal of property, infrastructure, plant and equipment
14 4,000 4,625 625 15.6
Share of net losses of joint ventures 15 - 395 395 100.0 Total expenses 230,885 231,719 834 0.4
Surplus for the year 15,761 12,259 (3,502)
Notes to the Financial Statements
The performance against budget notes compare Council’s financial plan, expressed through its annual budget, with actualperformance. The Local Government (Planning and Reporting) Regulations 2014 requires explanation of any materialvariances. Council has adopted a materiality threshold of greater than 10 percent or $1,000,000 where further explanation iswarranted. Explanations have not been provided for variations below the materiality threshold unless the variance isconsidered to be material because of its nature.
The budget figures detailed below are those adopted by Council on 24 June 2019. The Budget was based on assumptionsthat were relevant at the time of adoption of the Budget. Council sets guidelines and parameters for revenue and expensetargets in this budget in order to meet Council’s business plan and financial performance targets for both the short and long-term. The budget did not reflect any changes to equity resulting from asset revaluations, as their impacts were notconsidered predictable.
These notes are prepared to meet the requirements of the Local Government Act 1989 and the Local Government(Planning and Reporting) Regulations 2014 .
Council Meeting Agenda 24/08/2020
City of Boroondara Attachment 7.9.1 21
DRAFT
11
Notes to the Financial StatementsNote 1 - Performance against budget (cont.)
(i) Explanation of material variations
1 Statutory fees and fines
2 User fees
3 Grants - operating
4 Grants - capital
5 Contributions - monetary
6 Employee costs
7 Materials and services
8 Depreciation
9 Amortisation - Intangible assets
10 Amortisation - Right of use assets
11 Bad and doubtful debts
12 Finance costs - Leases
13 Other expenses
14 Net loss on disposal of property, infrastructure, plant and equipment
15 Share of net losses of associates and joint ventures
Variance Ref
Statutory fees and fines are lower than budget due to COVID 19 relief provided to the community via various measures including waiving some types of parking infringements ($2.70M), street furniture permit refunds and a reduction in lodgements fees income of $300,000.
User fees are lower than budget due to COVID 19 and the closure of Council's Leisure and Aquatic centres, Boroondara Tennis Centre and Kew Traffic School.
Grants - operating variance is due to receiving part of the Financial Assistance Grant funding for 2020-21 of $2.53M in the current financial year and offset by the adoption of AASB 15 Revenue from Contracts with Customers which reallocated $1.08M of funding to unearned income.
Grants - capital variance is due to the adoption of AASB 15 Revenue from Contracts with Customers which reallocated $432,000 of funding to unearned income. Offset by funding received for Vic Roads Safe Infrastructure program $456K and $800K grant budgeted but not received for Canterbury Community Precinct.
Developer open space contributions are difficult to predict as they are based upon building activity reaching completion. The 2019-20 contributions were higher than expected due to an increase in the number of multi-dwelling developments completed and hence higher contributions were received. The annual budget is based on estimated completion of private sector development.
Employee costs are higher than budget primarily due to reclassification from materials and services to employee costs for planned priority projects.
Materials and services are lower than budget due to carry forwards for planned priority projects, reclassification from employee costs and partly offset by capital works in progress write-offs of $2.50M above budget.
Depreciation variance is due to Amortisation - intangible assets being budgeted under Depreciation and now being disclosed separately.
Item Explanation
Net loss on disposal of property, infrastructure, plant and equipment is higher than budget due to the timing of the delivery of capital works.
The timing of budget information received for the landfill does not allow for its inclusion in Council's budget document.
Amortisation - intangible assets variance is due to being budgeted under Depreciation and is now disclosed separately.
Amortisation - Right of use assets variance is due to the adoption of AASB 16 Leases using the modified retrospective approach adopted by the Council.
Bad and doubtful debts is slightly higher than budget due to an increase in the provision calculations.
Finance costs - Leases variance is due to the adoption of AASB 16 Leases using the modified retrospective approach adopted by the Council.
Other expenses is lower than budget due to AASB 16 Leases and is primarily offset by Amortisation - Right of use assets
Council Meeting Agenda 24/08/2020
City of Boroondara Attachment 7.9.1 22
DRAFT
12
Note 1 - Performance against budget (cont.)
1.2 Capital worksBudget Actual Variance Variance
2020 2020 2020 2020Ref $'000 $'000 $'000 %
PropertyLand improvements - - - -Total land - - -Buildings 1 35,643 27,289 (8,354) (23.4) Building improvements 2 304 349 45 14.8 Total buildings 35,947 27,638 (8,309) (23.1) Total property 35,947 27,638 (8,309) (23.1)
Plant and equipmentPlant, machinery and equipment 3 2,731 2,033 (698) (25.6) Fixtures, fittings and furniture 4 1,059 1,554 495 46.7 Computers and telecommunications 5 2,581 1,834 (747) (28.9) Library books 985 902 (83) (8.4) Total Plant and equipment 7,356 6,323 (1,033) (14.0)
InfrastructureRoads 11,299 11,736 437 3.9 Bridges 6 62 27 (35) (56.5) Footpaths and cycleways 7 3,819 2,539 (1,280) (33.5) Drainage 8 5,132 4,298 (834) (16.3) Recreational, leisure and community facilities 9 3,238 1,903 (1,335) (41.2) Parks, open space and streetscapes 10 8,116 9,081 965 11.9 Off street car parks 11 648 404 (244) (37.7) Total infrastructure 32,314 29,988 (2,326) (7.2)
Total capital works expenditure 75,617 63,949 (11,668) (15.4)
New asset expenditure 15,493 14,889 (604) (3.9) Asset renewal expenditure 39,247 35,617 (3,630) (9.2) Asset expansion expenditure 11,985 6,068 (5,917) (49.4) Asset upgrade expenditure 8,892 7,375 (1,517) (17.1) Total capital works expenditure 75,617 63,949 (11,668) (15.4)
Notes to the Financial Statements
Council Meeting Agenda 24/08/2020
City of Boroondara Attachment 7.9.1 23
DRAFT
13
Notes to the Financial StatementsNote 1 - Performance against budget (cont.)
(i) Explanation of material variations
Item Explanation
1 Buildings
2 Building improvements
3 Plant, machinery and equipment
4 Fixtures, fittings and furniture
5 Computers and telecommunications
6 Bridges
7 Footpaths and cycleways
8 Drainage
9 Recreational, leisure and community facilities
10 Parks, open space and streetscapes
11 Off street car parks
Variance Ref
Fixtures, fittings and furniture is higher than budget due to office refurbishment works endorsed by Council as part of the amended budget review.
Plant, machinery and equipment is lower than budget due to the Ashburton Pool and Recreation Centre mechanical air handling project and Council Chamber Audio-visual (AV) uplift projects being carried forward to 2020-21.
Building improvements expenditure is slightly higher than budget due to forward commitment expenditure for the upgrade of Councils Building Access Security System, endorsed by Council as part of the amended budget review.
The buildings variance is primarily due to project timing of multi year projects including Camberwell Community Centre, Ashburton Seniors Centre, Canterbury Community Precinct, Victoria Road Reserve, Diversity Inclusion and Participation (DIP) Pavilion Program and 605-609 Glenferrie Road Community Facility. Some of these projects are expected to be completed in 2020-21.
Footpaths and cycleways expenditure was lower than budget primarily due to the Bicycle Strategy Implementation, Anniversary Trail missing link through Riversdale Park and Balwyn Shopping Centre streetscape improvements being carried forward to 2020-21. The lower than budget result was also due to Condition 4 Footpaths renewal program and Boroondara Laneway Strategy, and Camberwell Junction Laneway Pilot expenditure all being lower than anticipated.
Computers and telecommunications is lower than budget due to the payroll system upgrade, applications renewal and upgrade program and improve the Council's Network Service Diversity projects being carried forward to 2020-21.Minor bridge rehabilitation works program completed during 2019-20 and is lower than anticipated.
Drainage expenditure was lower than budget primarily due to Riversdale Road, Camberwell and Fortuna & Sunburst Avenues (easement), Balwyn North Drain Work projects being carried forward to 2020-21 and savings in Aquila Street Floodway, Balwyn North project.
Recreational, leisure and community facilities variance is due to the Hawthorn Rowing Ramp and Sportsground Reconstruction Program being carried forward to 2020-21 and savings across various projects including Field Sports Strategy Implementation.
Parks, open spaces and streetscapes variance is due to forward commitment expenditure from 2018-19 for Gordon Barnard Reserve Raingarden & Stormwater Harvesting project included as part of the amended budget.
Capital expenditure relating to off street car parks was lower than budget due to savings primarily in the resurfacing of Condition 4 Car Parks program.
Council Meeting Agenda 24/08/2020
City of Boroondara Attachment 7.9.1 24
DRAFT
14
Note 2 Analysis of Council results by program
2 (a) Environment and Infrastructure
City Planning
Community Development
Customer Experience and Business Transformation
Notes to the Financial Statements
The Environment and Infrastructure directorate is responsible for managing, maintaining and enhancing the public assets under the control of Council to maximise their value to the community. The directorate includes the following departments: - Asset Management - Traffic & Transport - Parks & Infrastructure - Environment & Sustainable Living - Projects & Strategy
The Community Development directorate is responsible for enhancing community, family and cultural life, and facilitating or providing services that respond to community needs. The directorate includes the following departments: - Health, Active Ageing & Disability Services - Library Services - Family, Youth & Recreation - Finance & Corporate Planning - Community Planning & Development - Arts & Cultural Services
Council delivers its functions and activities through the following programs.
The City Planning directorate is responsible for strategic planning to protect and enhance the environment and liveability of the city. It also facilitates and promotes a high standard of community safety, health and amenity. The directorate includes the following departments: - Local Laws - Economic Development - Strategic Planning - Building Services - Statutory Planning
Chief Executive Office and GovernanceIncludes the Chief Executive Office and Governance department. The Governance department is responsible for providing open and transparent processes and strong accountability to the community, ensuring a high standard of democratic and corporate governance.
The Customer Experience and Business Transformation directorate leads the implementation of our business transformation by leading and embedding the Customer Experience Improvement Strategy into our organisation. The directorate includes the following departments: - Chief Information Office - Chief Customer Office - Legal Services - Commercial and Property Services - Customer First Program
People, Culture and DevelopmentThe People, Culture and Development department makes sure Council has the right number of staff with the right skills and attitudes to provide excellent service to the community.
Council Meeting Agenda 24/08/2020
City of Boroondara Attachment 7.9.1 25
DRAFT
15
Note 2 Analysis of Council results by program 2 (b) Summary of revenues, expenses, assets and capital expenses by program
Income Expenses
Surplus / (Deficit)
Grants included
in income Total assets
2020 $'000 $'000 $'000 $'000 $'000Environment and Infrastructure 7,294 75,922 (68,628) 1,781 2,904,772 City Planning 19,267 23,536 (4,269) 708 19,456 Community Development 26,615 90,600 (63,985) 12,256 752,469 Customer Experience and Business Transformation 190,770 35,610 155,161 - 33,827 Chief Executive Office and Governance 31 2,564 (2,533) - 863 People, Culture and Development 1 3,487 (3,487) - 1,418
243,978 231,719 12,259 14,745 3,712,805
Income Expenses
Surplus / (Deficit)
Grants included in income
Total assets
2019 $'000 $'000 $'000 $'000 $'000Environment and Infrastructure 8,738 66,672 (57,935) 2,646 2,761,546 City Planning 22,406 23,483 (1,077) 698 22,656 Community Development 29,601 82,076 (52,474) 13,536 737,819 Customer Experience and Business Transformation 181,445 33,132 148,313 - 31,937 Chief Executive Office and Governance 47 2,656 (2,609) - 1,258 People, Culture and Development 5 3,504 (3,499) - 1,841
242,242 211,523 30,719 16,880 3,557,057
Notes to the Financial Statements
Council Meeting Agenda 24/08/2020
City of Boroondara Attachment 7.9.1 26
DRAFT
16
Notes to the Financial Statements2020 2019$'000 $'000
Note 3 - Funding for the delivery of our services
3.1 - Rates and charges
General rates 156,106 151,396Cultural and recreational - 67Supplementary rates and rate adjustments 1,417 788Waste management charge 29,883 25,679Special rates and charges 1,515 1,512Interest on rates and charges 505 552Total rates and charges 189,426 179,994
3.2 - Statutory fees and finesInfringements and costs 8,082 10,250Court recoveries 1,135 1,252Town planning fees 2,564 3,097Land information certificates 168 166Swimming pool registrations 255 -Permits 801 1,132Total statutory fees and fines 13,005 15,897
3.3 - User fees
Aged and health services 1,699 1,880Building services 1,365 1,224Road occupancy, traffic and drainage 749 732Child care/children's program 131 228Parking 1,454 1,924Leisure centre and recreation 3,418 4,232Registrations and other permits 1,308 1,204Waste management services 1,336 1,329Other fees and charges 760 932Total user fees 12,220 13,685
User fees by timing of revenue recognitionUser fees recognised over time 110 81User fees recognised at a point in time 12,110 13,604Total user fees 12,220 13,685
Annual rates and charges are recognised as revenues when Council issues annual rates notices. Supplementary rates are recognised when a valuation and reassessment is completed and a supplementary rates notice issued.
Council uses Capital Improved Value (CIV) as the basis of valuation of all properties within the municipal district. The CIV of a property is the value of the land and all improvements. The valuation base used to calculate general rates for 2019-20 was $112.93 billion (2018-19: $124.80 billion). The 2019-20 rate in the CIV dollar was 0.001404 (2018-19: 0.001219).
The date of the latest general revaluation of land for rating purposes within the municipal district was 1 January 2020 and the valuation will be first applied in the rating year commencing 1 July 2020.
Impact of COVID 19 on rates and charges are presented in Note 11.
Impact of COVID 19 on statutory fees and fines are presented in Note 11.
Impact of COVID 19 on user fees are presented in Note 11.
Statutory fees and fines (including parking fees and fines) are recognised as revenue when the service has been provided, the payment is received, or when the penalty has been applied, whichever first occurs.
User fees are recognised as revenue at a point in time, or over time, when (or as) the performance obligation is satisfied. Recognition is based on the underlying contractual terms.
Council Meeting Agenda 24/08/2020
City of Boroondara Attachment 7.9.1 27
DRAFT
17
Notes to the Financial Statements2020 2019$'000 $'000
3.4 - Funding from other levels of government
Grants were received in respect of the following :Summary of grantsCommonwealth funded grants 9,541 10,912State funded grants 5,204 5,968Total grants received 14,745 16,880
(a) Operating GrantsRecurrent - Commonwealth GovernmentFinancial Assistance Grants 4,885 4,619Aged care 3,238 4,158Community safety 22 175Community transport 457 -Senior citizen centres 145 166Volunteer services 144 96Recurrent - State GovernmentAged care 632 1,542Libraries 1,092 1,067Maternal and child health 1,122 1,072School crossing supervisors 704 683Family and children 255 237Volunteer services - 60Community safety 168 24Senior citizen centres 3 12Total recurrent operating grants 12,867 13,911
Non-recurrent - Commonwealth GovernmentEnvironmental planning 45 14Other 1 9Non-recurrent - State GovernmentRecycling 48 149Community health 47 15Community safety 53 78Community transport 224 481Family and children 44 68Maternal and child health 88 56Environmental planning 100 69Libraries 44 46Sports and recreation - 6Other 5 15Total non-recurrent operating grants 699 1,006Total operating grants 13,566 14,917
(b) Capital GrantsRecurrent - Commonwealth GovernmentRoads to recovery 594 395Total recurrent capital grants 594 395
Council Meeting Agenda 24/08/2020
City of Boroondara Attachment 7.9.1 28
DRAFT
18
Notes to the Financial Statements2020 2019$'000 $'000
3.4 - Funding from other levels of government (cont.)
Non-recurrent - Commonwealth GovernmentCommunity health - 1,280Buildings 10 -Non-recurrent - State GovernmentRoads 506 250Community safety - 16Environment planning 55 (2)Sport and recreation 14 24Total non-recurrent capital grants 585 1,568Total capital grants 1,179 1,963
(c ) Unspent grants received on condition that they be spent in a specific mannerOperatingBalance at start of year 101 25Received during the financial year and remained unspent at balance date 1,080 101Received in prior years and spent during the financial year (101) (25)Balance at year end 1,080 101
CapitalBalance at start of year 48 86Received during the financial year and remained unspent at balance date 432 48Received in prior years and spent during the financial year (48) (86)Balance at year end 432 48
Proceeds of sale 31 37Written down value of assets sold, replaced and disposed (4,656) (2,325)Total net loss on disposal of property, infrastructure, plant and equipment (4,625) (2,288)
3.6 - Net loss on disposal of property, infrastructure, plant and equipment
The profit or loss on sale of an asset is determined when control of the asset has passed to the buyer.
Grant income is recognised at the point in time when the Council satisfies its performance obligations as specified in the underlying agreement.
Monetary and non-monetary contributions are recognised as revenue when Council obtains control over the contributed asset.
Council Meeting Agenda 24/08/2020
City of Boroondara Attachment 7.9.1 29
DRAFT
19
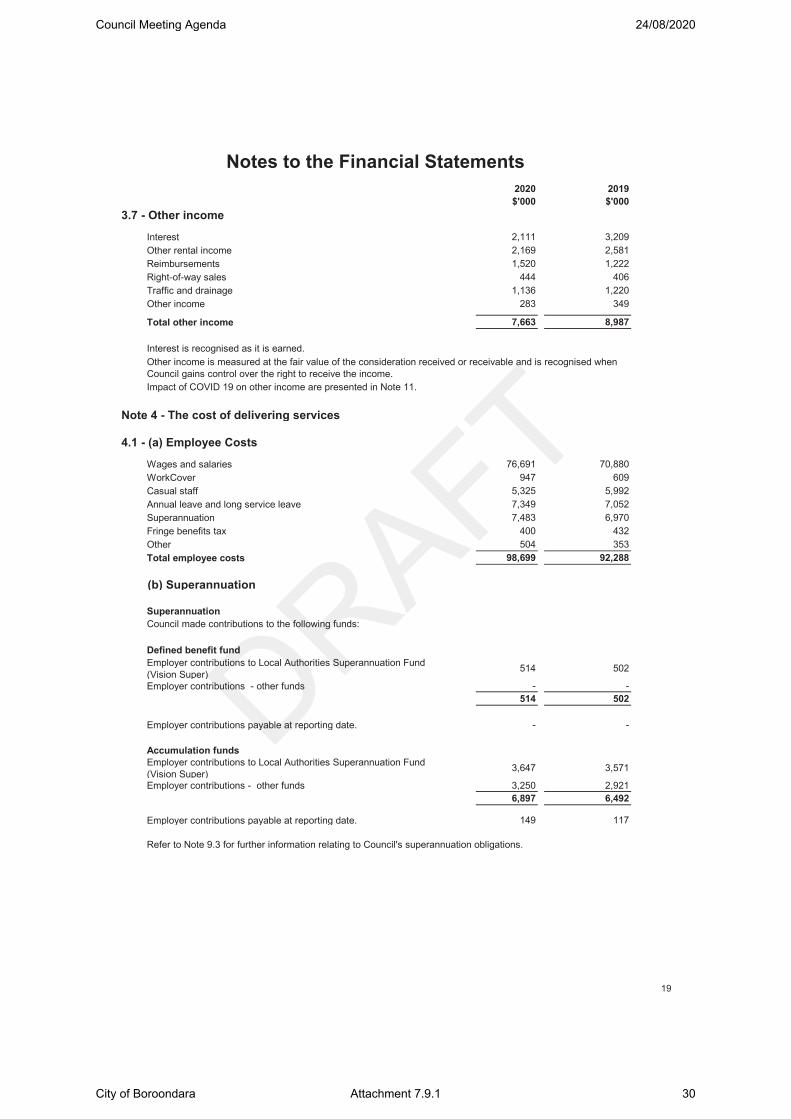
Notes to the Financial Statements2020 2019$'000 $'000
3.7 - Other income
Interest 2,111 3,209Other rental income 2,169 2,581Reimbursements 1,520 1,222Right-of-way sales 444 406Traffic and drainage 1,136 1,220Other income 283 349
Total other income 7,663 8,987
Note 4 - The cost of delivering services
4.1 - (a) Employee Costs
Wages and salaries 76,691 70,880WorkCover 947 609Casual staff 5,325 5,992Annual leave and long service leave 7,349 7,052Superannuation 7,483 6,970Fringe benefits tax 400 432Other 504 353Total employee costs 98,699 92,288
(b) Superannuation
SuperannuationCouncil made contributions to the following funds:
Defined benefit fundEmployer contributions to Local Authorities Superannuation Fund (Vision Super) 514 502
Employer contributions - other funds - -514 502
Employer contributions payable at reporting date. - -
Accumulation fundsEmployer contributions to Local Authorities Superannuation Fund (Vision Super) 3,647 3,571
Employer contributions - other funds 3,250 2,9216,897 6,492
Employer contributions payable at reporting date. 149 117
Refer to Note 9.3 for further information relating to Council's superannuation obligations.
Other income is measured at the fair value of the consideration received or receivable and is recognised when Council gains control over the right to receive the income.
Interest is recognised as it is earned.
Impact of COVID 19 on other income are presented in Note 11.
Council Meeting Agenda 24/08/2020
City of Boroondara Attachment 7.9.1 30
DRAFT
20
Notes to the Financial Statements2020 2019$'000 $'000
4.2 - Materials and services
Contract payments and trade services:-Waste Collection 10,721 9,154-Open Space 10,436 8,618-Minor Projects 4,573 1,798-Parking Management 1,197 1,247-Leisure and Aquatic Centre 1,677 --Other* 14,893 12,422Building maintenance 4,043 3,985General maintenance 4,169 3,397Plant and equipment maintenance 2,286 2,243Utilities 4,518 4,838Consultants 6,137 8,421Office and administration 4,745 4,501Financial and legal 2,797 2,036Information technology 4,927 4,319Insurance 1,893 1,744Other 137 123Total materials and services 79,149 68,846
4.3 - Depreciation
Property 13,268 12,664 Plant and equipment 3,824 3,967 Infrastructure 16,621 16,117 Investment property 189 186 Total depreciation 33,902 32,934 Refer to note 6.2 and 6.4 for a more detailed breakdown of depreciation charges and accounting policy.
4.4 - Amortisation - Intangible assetsSoftware 631 735 Total Amortisation - Intangible assets 631 735 Refer to note 5.2(c) for a more detailed breakdown of amortisation charges and accounting policy.
4.5 - Amortisation - Right of use assetsVehicles 3,057 -Other 2 -Total Amortisation - Right of use assets 3,059 - Refer to note 5.8 for a more detailed breakdown of amortisation charges and accounting policy.
4.6 - Bad and doubtful debtsParking fines and local laws debtors 1,434 1,479Other debtors 82 164Total bad and doubtful debts 1,516 1,643
Movement in provisions for doubtful debtsBalance at the beginning of the year 2,067 1,559New provisions recognised during the year 1,516 1,643Amounts already provided for and written off as uncollectible (1,121) (1,135)Balance at end of year 2,462 2,067
Provision for doubtful debt is recognised based on an expected credit loss model. This model considers both historic and forward looking information in determining the level of impairment. Bad debts are written off when identified.
*This includes amounts individually under $1.00 million where Council engages contractors to deliver services tothe community.
Council Meeting Agenda 24/08/2020
City of Boroondara Attachment 7.9.1 31
DRAFT
21
Notes to the Financial Statements2020 2019$'000 $'000
Auditors' remuneration - VAGO - audit of the financial statements, performance statement and grant acquittals 69 73
Auditors' remuneration - internal 156 157Councillors' allowances 416 408Operating lease rentals 1,346 4,066Community grants and contributions 2,918 2,921Training and professional development 1,116 1,351Special rate scheme expenditure 1,492 1,518Other expenditure 532 317Total other expenses 8,045 10,811
Note 5 - Our financial position
5.1 - Financial assets(a) Cash and cash equivalentsCash on hand 8 8Cash at bank 22,885 10,594Term deposits 76,366 88,333Total cash and cash equivalents 99,259 98,935
(b) Other financial assetsTerm deposits - current 15,078 26,593Unlisted shares 4 4Total other financial assets 15,082 26,597Total financial assets 114,341 125,532
- Trust funds and deposits (Note 5.3) 5,752 4,036Total restricted funds 5,752 4,036Total unrestricted cash and cash equivalents 93,507 94,899
Councils cash and cash equivalents are subject to external restrictions that limit amounts available fordiscretionary use. These include:
4.9 - Other expenses
Borrowing costs are recognised as an expense in the period in which they are incurred, except where they are capitalised as part of a qualifying asset constructed by Council.
Council Meeting Agenda 24/08/2020
City of Boroondara Attachment 7.9.1 32
DRAFT
22
Notes to the Financial Statements2020 2019$'000 $'000
5.1 - Financial assets (cont.)
Intended allocationsAlthough not externally restricted the following amounts have been allocated for specific future purposes by Council: - Cash held to fund carried forward capital works 14,095 6,852 - Cash held to fund carried forward priority projects 7,852 3,565 - Reserves 18,703 16,903Total funds subject to intended allocations 40,650 27,320
Current (not yet due) 2,082 2,039Past due by up to 30 days 199 420Past due between 31 and 180 days 336 493Past due between 181 and 365 days 121 106Past due by more than 1 year 466 274Total trade and other receivables 3,204 3,332
(e) Ageing of individually impaired receivables
The ageing of the Council's trade & other receivables (excluding statutory receivables) that are not impaired was:
At balance date there were no other debtors representing financial assets that were impaired (2018-19 Nil).
Other financial assets are valued at fair value, at balance date. Term deposits are measured at original cost. Any unrealised gains and losses on holdings at balance date are recognised as either a revenue or expense.
Cash and cash equivalents include cash on hand, deposits at call, and other highly liquid investments with original maturities of 90 days or less, net of outstanding bank overdrafts.
The unlisted shares are held with Procurement Australasia Limited.
Short term receivables are carried at invoice amount. A provision for doubtful debts is recognised when there is objective evidence that an impairment has occurred. Long term receivables are carried at amortised cost using the effective interest rate method.
Council Meeting Agenda 24/08/2020
City of Boroondara Attachment 7.9.1 33
DRAFT
23
Notes to the Financial Statements2020 2019$'000 $'000
5.2 - Non - financial assets(a) InventoriesInventories held for distribution 16 16Inventories held for sale 15 15Total inventories 31 31
(b) Other assets
Prepayments 1,956 1,652Total other assets 1,956 1,652
(c) Intangible assets
348 880 348 880
SoftwareGross carrying amountBalance at 1 July 2019 3,755Additions from internal developments 99Balance at 30 June 2020 3,854
Accumulated amortisation and impairmentBalance at 1 July 2019 (2,875)Amortisation expense (631)Accumulated amortisation for disposals -Balance at 30 June 2020 (3,506)
Net book value at 30 June 2019 880Net book value at 30 June 2020 348
5.3 - Payables2020 2019$'000 $'000
(a) Trade and other payables13,494 21,053
5,631 4,442Total trade and other payables 19,125 25,495
(b) Trust funds and deposits4,849 3,333
671 5124 7
228 184Total trust funds and deposits 5,752 4,036
(c) Unearned incomeGrants received in advance - operating 1,080 -Grants received in advance - capital 432 -Other 57 110Total unearned income 1,569 110
SoftwareTotal intangible assets
Trade and other payables
Intangible assets with finite lives are amortised as an expense on a systematic basis over the asset's useful life. Amortisation is generally calculated on a straight line basis, at a rate that allocates the asset value, less any estimated residual value over its estimated useful life. Estimates of the remaining useful lives and amortisation method are reviewed at least annually, and adjustments made where appropriate.
Inventories held for distribution are measured at cost, adjusted when applicable for any loss of service potential. All other inventories, including inventories held for sale, are measured at the lower of cost and net realisable value. Where inventories are acquired for no cost or nominal consideration, they are measured at current replacement cost at the date of acquisition.
Balwyn Rotary Sunday Market trust funds
Accrued expenses
Refundable depositsFire services levyRefundable contract deposits and retention monies
Council Meeting Agenda 24/08/2020
City of Boroondara Attachment 7.9.1 34
DRAFT
24
Notes to the Financial Statements
5.3 - Payables (cont.)
5.4 - Interest-bearing liabilities
2020 2019$'000 $'000
1,573 1,495
23,213 24,785
Total 24,786 26,280
Not later than one year 1,573 1,495Later than one year and not later than five years 7,281 6,879Later than five years 15,932 17,906
24,786 26,280
Current
Purpose and nature of items
Amounts received as deposits and retention amounts controlled by Council are recognised as trust funds until they are returned, transferred in accordance with the purpose of the receipt, or forfeited. Trust funds that are forfeited, resulting in Council gaining control of the funds, are to be recognised as revenue at the time of forfeit.
Borrowings are initially measured at fair value, being the cost of the interest bearing liabilities, net of transaction costs. The measurement basis subsequent to initial recognition depends on whether the Council has categorised its interest-bearing liabilities as either financial liabilities designated at fair value through the profit and loss, or financial liabilities at amortised cost. Any difference between the initial recognised amount and the redemption value is recognised in net result over the period of the borrowing using the effective interest method.The classification depends on the nature and purpose of the interest bearing liabilities. The Council determines the classification of its interest bearing liabilities at initial recognition.
Refundable deposits - Deposits are taken by Council as a form of surety in a number of circumstances, including in relation to building works, tender deposits, contract deposits and the use of civic facilities.
Fire Service Levy - Council is the collection agent for fire services levy on behalf of the State Government. Council remits amounts received on a quarterly basis. Amounts disclosed here will be remitted to the State Government in line with that process.
Retention Amounts - Council has a contractual right to retain certain amounts until a contractor has met certain requirements or a related warrant or defect period has elapsed. Subject to the satisfactory completion of the contractual obligations, or the elapsing of time, these amounts will be paid to the relevant contractor in line with Council's contractual obligations.
Trust funds held on behalf of the operation of the Balwyn Rotary Sunday Market - Profits and losses are transferred each month when they exceed $5,000.
Non-currentBorrowings - secured
a) The maturity profile for Council's borrowings is:
Borrowings are secured over the General Rates of Council as per section 148 of the Local Government Act 1989 .
Current provisions expected to be settled after 12 monthsAnnual leaveLong service leave
Total current employee provisions
Non-current
(a) Employee provisions
Current provisions expected to be settled within 12 monthsAnnual leaveLong service leaveOther
Balance at beginning of the financial yearAdditional provisionsAmounts usedIncrease in the discounted amount arising because of time and the effect of any change in the discount rateBalance at the end of the financial year
Balance at beginning of the financial yearAdditional provisionsAmounts usedIncrease in the discounted amount arising because of time and the effect of any change in the discount rateBalance at the end of the financial year
Long service leave
Aggregate carrying amount of employee provisions:CurrentNon-currentTotal aggregate carrying amount of employee provisions
The calculation of employee costs and benefits includes all relevant on-costs and are calculated as follows at reporting date.
Liabilities for wages and salaries, including non-monetary benefits and annual leave expected to be wholly settled within 12 months of the reporting date are recognised in the provision for employee benefits in respect of employee services up to the reporting date, classified as current liabilities and measured at their nominal values.
Liabilities that are not expected to be wholly settled within 12 months of the reporting date are recognised in the provision for employee benefits as non-current liabilities, measured at present value of the amounts expected to be paid when the liabilities are settled using the remuneration rate expected to apply at the time of settlement.
Liability for long service leave (LSL) is recognised in the provision for employee benefits. LSL is measured at present value. Unconditional LSL is disclosed as a current liability. Conditional LSL that has been accrued, where an employee is yet to reach a qualifying term of employment, is disclosed as a non - current liability.Key assumptions:
(b) OtherProvision for rostered days offCurrent
Council Meeting Agenda 24/08/2020
City of Boroondara Attachment 7.9.1 36
DRAFT
26
Notes to the Financial Statements
2020 2019
5.6 - Financing arrangements $'000 $'000
Council has the following funding arrangements in place as at 30 June 2020:Credit card facilities 300 300Borrowing facilities 24,786 26,280Total facilities 25,086 26,580
Used facilities 24,890 26,408Unused facilities 196 172
5.7 - Commitments
Not later than 1 year
Later than 1 year and
not later than 2 years
Later than 2 years and
not later than 5 years
Later than 5 years Total
$'000 $'000 $'000 $'000 $'000
30 June 2020
OperatingCleaning contracts for council buildings 919 116 78 - 1,113Consultancies 1,875 467 163 - 2,505Garbage Collection 183 - - - 183Home care services 179 179 61 - 419Information systems and technology 1,722 1,545 1,441 - 4,708Maintenance 2,040 1,246 235 - 3,521Open space management 12,705 7,325 5,776 - 25,806Other 8,479 7,094 11,562 729 27,864Recycling 3,106 3,089 3,085 - 9,280
Total operating commitments 31,208 21,061 22,401 729 75,399
CapitalBuildings 6,684 2,327 2,277 - 11,288Computers and telecommunications 2,108 1,159 487 - 3,754Drainage 6,841 4,858 971 - 12,670Footpaths, shopping centre improvements, laneways, car parks 8,641 8,641 2,900 - 20,182
Information systems and technology 30 - - - 30Library materials - Books and furnishings 2,242 68 - - 2,310Open Space Management 110 110 330 135 685Other capital related 754 647 1,577 - 2,978Recreational, leisure and community facilities 1,213 909 1,079 - 3,201Roads 6,648 6,336 555 - 13,539
Total capital commitments 35,271 25,055 10,176 135 70,637
Total commitments after 30 June 2020 66,479 46,116 32,577 864 146,036
The Council has entered into the following commitments. Commitments are not recognised in the Balance Sheet. Commitments are disclosed at their nominal value and presented inclusive of the GST payable.
Council Meeting Agenda 24/08/2020
City of Boroondara Attachment 7.9.1 37
DRAFT
27
Notes to the Financial Statements5.7 - Commitments (cont.)
Not later than 1 year
Later than 1 year and
not later than 2 years
Later than 2 years and
not later than 5 years
Later than 5 years Total
$'000 $'000 $'000 $'000 $'000
30 June 2019
OperatingRecycling 2,128 2,122 2,791 - 7,041Garbage Collection 381 227 114 - 722Open space management 10,322 5,372 5,340 - 21,034Consultancies 2,268 1,735 630 - 4,633Home care services 190 - - - 190Cleaning contracts for Council buildings 931 919 194 - 2,044Information systems and technology 1,766 1,267 2,420 - 5,453Maintenance 1,725 1,720 1,058 - 4,503Other 6,074 4,431 6,455 1,098 18,058
Total operating commitments 25,785 17,793 19,002 1,098 63,678
CapitalBuildings 16,538 2,570 4,556 49 23,713Roads 6,810 6,648 6,891 - 20,349Footpaths, laneways and car parks 8,489 8,465 11,341 - 28,295Drainage 7,418 6,841 5,829 - 20,088Recreational, leisure and community facilities 1,216 1,213 1,988 - 4,417Computers and telecommunications 2,327 2,108 1,645 - 6,080Library materials 2,249 2,242 68 - 4,559Other 195 - - - 195Total capital commitments 45,242 30,087 32,318 49 107,696
Total commitments after 30 June 2019 71,027 47,880 51,320 1,147 171,374
Council Meeting Agenda 24/08/2020
City of Boroondara Attachment 7.9.1 38
DRAFT
28
Notes to the Financial Statements5.8 - Leases
Policy applicable before 1 July 2019
Policy applicable after 1 July 2019
As a lessee, Council classifies leases as operating or finance leases based on its assessment of whether the lease transferred significantly all of the risks and rewards incidental to ownership of the underlying asset to Council.
Operating lease payments, including any contingent rentals, were recognised as an expense in the comprehensive income statement on a straight-line basis over the lease term, except where another systematic basis is more representative of the time pattern of the benefits derived from the use of the leased asset. The leased asset was not recognised in the balance sheet.
All incentives for the agreement of a new or renewed operating lease were recognised as an integral part of the net consideration agreed for the use of the leased asset, irrespective of the incentive’s nature or form or the timing of payments.
In the event that lease incentives were received to enter into operating leases, the aggregate cost of incentives were recognised as a reduction of rental expense over the lease term on a straight-line basis, unless another systematic basis was more representative of the time pattern in which economic benefits from the leased asset were consumed.
Council has applied AASB 16 Leases using a modified retrospective approach with the cumulative effect of initial application recognised as an adjustment to the opening balance of accumulated surplus at 1 July 2019, with no restatement of comparative information. The Council applied the approach consistently to all leases in which it is a lessee.
On transition to AASB 16 Leases , Council elected to apply the practical expedient to ‘grandfather’ the assessment of which transactions are leases. The Council has applied this practical expedient to all of its contracts and therefore applied AASB 16 Leases only to contracts that were previously identified as leases.
· any initial direct costs incurred; and
The lease liability is initially measured at the present value of the lease payments that are not paid at the commencement date, discounted using the interest rate implicit in the lease or, if that rate cannot be readily determined, an appropriate incremental borrowing rate. Generally, Council uses an appropriate incremental borrowing rate as the discount rate.
· an estimate of costs to dismantle and remove the underlying asset or to restore the underlying asset or the site on which it is located.
At inception of a contract, all entities would assess whether a contract is, or contains, a lease. A contract is, or contains, a lease if the contract conveys the right to control the use of an identified asset for a period of time in exchange for consideration. To identify whether a contract conveys the right to control the use of an identified asset, it is necessary to assess whether:- The contract involves the use of an identified asset;- The customer has the right to obtain substantially all of the economic benefits from use of the asset throughout the period of use; and- The customer has the right to direct the use of the asset.
This policy is applied to contracts entered into, or changed, on or after 1 July 2019.
As a lessee, Council recognises a right-of-use asset and a lease liability at the lease commencement date. The right-of-use asset is initially measured at cost which comprises the initial amount of the lease liability adjusted for:· any lease payments made at or before the commencement date less any lease incentives received; plus
The right-of-use asset is subsequently depreciated using the straight-line method from the commencement date to the earlier of the end of the useful life of the right-of-use asset or the end of the lease term. The estimated useful lives of right-of-use assets are determined on the same basis as those of property, plant and equipment. In addition, the right-of-use asset is periodically reduced by impairment losses, if any, and adjusted for certain measurements of the lease liability.
Council Meeting Agenda 24/08/2020
City of Boroondara Attachment 7.9.1 39
DRAFT
29
Notes to the Financial Statements5.8 - Leases (cont.)
Right-of-Use Assets Property Vehicles Other Total$'000 $'000 $'000 $'000
Balance at 1 July 2019 - 9,504 - 9,504Additions - 3,770 54 3,824Amortisation charge - (3,057) (2) (3,059)Balance at 30 June 2020 - 10,217 52 10,269
Lease Liabilities 2020Maturity analysis - contractual undiscounted cash flows $'000Less than one year 2,901One to five years 7,397More than five years -Total undiscounted lease liabilities as at 30 June: 10,298
Current 3,139Non-current 7,159Total lease liabilities 10,298
2020Expenses relating to: $'000Short-term leases 724Leases of low value assets 622Total 1,346
-
· Variable lease payments that depend on an index or a rate, initially measured using the index or rate as at the commencement date;· Amounts expected to be payable under a residual value guarantee; and
· The exercise price under a purchase option that Council is reasonably certain to exercise, lease payments in an optional renewal period if Council is reasonably certain to exercise an extension option, and penalties for early termination of a lease unless Council is reasonably certain not to terminate early.
Lease liabilities included in the Balance Sheet at 30 June:
Council has elected not to recognise right-of-use assets and lease liabilities for short-term leases of machinery that have a lease term of 12 months or less and leases of low-value assets (individual assets worth less than existing capitalisation thresholds for a like asset up to a maximum of AUD$10,000), including IT equipment. Council recognises the lease payments associated with these leases as an expense on a straight-line basis over the lease term.
When the lease liability is re-measured in this way, a corresponding adjustment is made to the carrying amount of the right-of-use asset, or is recorded in profit or loss if the carrying amount of the right-of-use asset has been reduced to zero.
Council has elected to apply the temporary option available under AASB 16 Leases which allows not-for-profit entities to not measure right-of-use assets at initial recognition at fair value in respect of leases that have significantly below-market terms.
Lease payments included in the measurement of the lease liability comprise the following:· Fixed payments
Variable lease payments (not included in measurement of lease liabilities)
Short-term and low value leases
Peppercorn Leases that Council has entered into include leasing of land, car parks and footpaths. Due to the temporary relief granted under AASB 2018-8, peppercorn leases have not been recognised in the balance sheet.
Council Meeting Agenda 24/08/2020
City of Boroondara Attachment 7.9.1 40
DRAFT
30
Notes to the Financial Statements5.8 - Leases (cont.)
Payable:Within one year 666Later than one year but not later than five years 706Total lease commitments 1,372
2019$'000
12,15711,803
Finance lease liability recognised as at 30 June 2019 -
-- Residual value guarantees -- Lease liabilities recognised as at 1 July 2019 9,504
Note 6 - Assets we manage
6.1 - Non current assets classified as held for sale
Non-current assets classified as held for sale (including disposal groups) are measured at the lower of its carrying amount and fair value less costs of disposal, and are not subject to depreciation. Non-current assets, disposal groups and related liabilities and assets are treated as current and classified as held for sale if their carrying amount will be recovered through a sale transaction rather than through continuing use. This condition is regarded as met only when the sale is highly probable and the asset's sale (or disposal group sale) is expected to be completed within 12 months from the date of classification. Council has no non-current assets held for sale at reporting date.
Non-cancellable lease commitments - Short-term and low-value leasesCommitments for minimum lease payments for short-term and low-value leases are payable as follows:
i. Leases classified as operating leases under AASB 117 Leases
At transition, lease liabilities were measured at the present value of the remaining lease payments, discounted at Council's incremental borrowing rate as at 1 July 2019. Right-of-use assets are measured at an amount equal to the lease liability, adjusted by the amount of any prepaid or accrued lease payments. Council applied this approach to all applicable leases.
Council used the following practical expedients when applying AASB 16 Leases to leases previously classified as operating leases under AASB 117 Leases .
- Applied a single discount rate to a portfolio of leases with similar characteristics.- Adjusted the right-of-use assets by the amount of AASB 137 Provisions, Contingent Liabilities and Contingent Assets onerous contract provision immediately before the date of initial application, as an alternative to an impairment review.- Applied the exemption not to recognise right-of-use assets and liabilities for leases with less than 12 months of lease term.- Used hindsight when determining the lease term if the contract contains options to extend or terminate the lease.
ii. Leases previously classified as finance leasesFor leases that were classified as finance leases under AASB 117 Leases , the carrying amount of the right-of-use asset and the lease liability at 1 July 2019 are determined at the carrying amount of the lease asset and lease liability under AASB 117 Leases immediately before that date.
Council is not required to make any adjustments on transition to AASB 16 Leases for leases in which it acts as a lessor, except for a sub-lease. Council accounted for its leases in accordance with AASB 16 Leases from the date of initial application.
- Extension and termination options reasonably certain to be exercised
Impact on financial statementsOn transition to AASB 16 Leases , Council recognised an additional $9,504,290 of right-of-use assets and $9,504,290 of lease liabilities, recognising the difference in retained earnings. When measuring lease liabilities, Council discounted lease payments using its incremental borrowing rate at 1 July 2019. The weighted-average rate applied is 3%.
Operating lease commitment at 30 June 2019 as disclosed in Council's financial statements Discounted using the incremental borrowing rate at 1 July 2019
Council Meeting Agenda 24/08/2020
City of Boroondara Attachment 7.9.1 41
DRAFT
31
6.2 - Property, infrastructure, plant and equipment
Summary of property, infrastructure, plant and equipment
* The $0.16M is additions for Investment Property and Intangibles shown in Note 6.3 and Note 5.2 respectively.** The differences between the two transfer totals relate to the classification of each project as budgeted, which appears in the WIP disclosure , compared to the actual classification of the asset determined at the time of capitalisation which appears in the summary of property, infrastructure, plant and equipment table.
Notes to the Financial Statements
*
**
**
Council Meeting Agenda 24/08/2020
City of Boroondara Attachment 7.9.1 42
DRAFT
32
6.2 - Property, infrastructure, plant and equipment (cont.)
(a) PropertyLand -
specialisedLand - non specialised
Total Land
Buildings - non specialised
TotalBuildings
Work in Progress
TOTAL PROPERTY
$'000 $'000 $'000 $'000 $'000 $'000 $'000
At fair value 1 July 2019 2,207,330 329,624 2,536,954 465,303 465,303 8,934 3,011,191 Accumulated depreciation at 1 July 2019 - - - (168,979) (168,979) - (168,979)
Total property, infrastructure, plant and equipment 3,555,629
Notes to the Financial Statements
Council Meeting Agenda 24/08/2020
City of Boroondara Attachment 7.9.1 45
DRAFT
35
6.2 - Property, infrastructure, plant and equipment (cont.)Acquisition
Asset recognition thresholds and depreciation periods Depreciate Period Threshold Limit
Years $'000PropertyLand N/A -
BuildingsBuildings 2-55 5
Plant and EquipmentPlant, machinery and equipment 5-30 2Arts and heritage 100 0Fixtures, fittings and furniture 10 2Computers and telecommunications 3-5 2Library books 6 0
InfrastructureRoad pavements and seals 30-100 7Road substructure 100-150 7Road kerb, channel and minor culverts 75 7Bridges deck 50-130 7Bridges substructure 50-130 7Footpaths and cycle ways 20-85 7Drainage 20-100 7Recreational, leisure and community facilities 15-80 2Parks, open space and streetscapes 15-100 2Off street car parks 30-100 7
Intangible assets 3 5
Land under roads
Depreciation and amortisationBuildings, land improvements, plant and equipment, infrastructure, and other assets having limited usefullives are systematically depreciated over their useful lives to the Council in a manner which reflectsconsumption of the service potential embodied in those assets. Estimates of remaining useful lives andresidual values are made on a regular basis with major asset classes reassessed annually. Depreciationrates and methods are reviewed annually.Where assets have separate identifiable components that are subject to regular replacement, thesecomponents are assigned distinct useful lives and residual values and a separate depreciation rate isdetermined for each component.
Notes to the Financial Statements
The purchase method of accounting is used for all acquisitions of assets, being the fair value of assetsprovided as consideration at the date of acquisition plus any incidental costs attributable to the acquisition.Fair value is the price that would be received to sell an asset (or paid to transfer a liability) in an orderlytransaction between market participants at the measurement date.Where assets are constructed by Council, cost includes all materials used in construction, direct labour,borrowing costs incurred during construction, and an appropriate share of directly attributable variable andfixed overheads.In accordance with Council's policy, the threshold limits have applied when recognising assets within an applicable asset class and unless otherwise stated are consistent with the prior year.
Council recognises land under roads it controls on a cost basis.
Council Meeting Agenda 24/08/2020
City of Boroondara Attachment 7.9.1 46
DRAFT
36
Notes to the Financial Statements6.2 - Property, infrastructure, plant and equipment (cont.)
Repairs and maintenance
Leasehold improvements
Valuation of land and buildings
Valuation of infrastructure
Where the repair relates to the replacement of a component of an asset and the cost exceeds the capitalisation threshold the cost is capitalised and depreciated. The carrying value of the replaced asset is expensed.
Leasehold improvements are recognised at cost and are amortised over the unexpired period of the lease or the estimated useful life of the improvement, whichever is the shorter. Council does not have any leasehold improvements at reporting date.
Road earthworks are not depreciated on the basis that they are assessed as not having a limited useful life.
Straight line depreciation is charged based on the residual useful life as determined each year.Depreciation periods used are listed below and are consistent with the prior year unless otherwise stated.
The date of the current valuation is detailed in the following table.
The date of the current valuation is detailed in the following table.
Matheson Stephen Valuations Property Consultants undertook a review of ‘Annual Material Change’ in the fair value of the land and building asset classes in the City of Boroondara portfolio for the period 1 January 2020 to 30 June 2020. No material change was identified based on data available.The state of the property market within the review period is at present most influenced by the recent COVID-19 pandemic and resulting declaration of State of Emergency. Market conditions are changing daily at present. The full extent of the effect of these conditions upon the property market and broader economic environment is unclear at best. Initial falls in auction and inspection attendance rates prior to the State of Emergency, the evolution and ensuing shift to online auctions only, and recent return of on-site auctions, albeit limited in attendance numbers, have at varying times all conspired to result in a period of limited transaction volumes from which to base a meaningful and thorough analysis process. For the period of the annual material change review, we consider that there is a market uncertainty resulting in significant valuation uncertainty.
Specialised land is valued at fair value using site values adjusted for englobo (undeveloped and/or unserviced) characteristics, access rights and private interests of other parties and entitlements of infrastructure assets and services. This adjustment is an unobservable input in the valuation. The adjustment has no impact on the comprehensive income statement.
Valuation of infrastructure assets has been determined by Paris Zenonos, Manager Asset Management, Bachelor of Civil Engineering (Honours).
Valuation of land and buildings were undertaken by a qualified independent valuer Matheson Stephen Valuations Property Consultants. The valuation of land and buildings is at fair value, being market value based on highest and best use permitted by relevant land planning provisions. Where land use is restricted through existing planning provisions the valuation is reduced to reflect this limitation. This adjustment is an unobservable input in the valuation. The adjustment has no impact on the comprehensive income statement.
Details of the Council’s land and buildings and information about the fair value hierarchy as at 30 June 2020 are as follows:
Any significant movements in the unobservable inputs for land and land under roads will have a significant impact on the fair value of these assets.
Council Meeting Agenda 24/08/2020
City of Boroondara Attachment 7.9.1 47
DRAFT
37
Notes to the Financial Statements6.2 - Property, infrastructure, plant and equipment (cont.)
Description of significant unobservable inputs into level 3 valuations
2020 2019$'000 $'000
Reconciliation of specialised landLand under roads 1,896 1,650 Parks and reserves 995,303 953,975 Sports Grounds 803,894 776,704 Other 495,574 475,001 Total specialised land 2,296,667 2,207,330
Infrastructure assets are valued based on the depreciated replacement cost. Significant unobservable inputs include the current replacement cost and remaining useful lives of infrastructure. The remaining useful lives of infrastructure assets are determined on the basis of the current condition of the asset and vary from 5 years to 150 years. Replacement cost is sensitive to changes in market conditions, with any increase or decrease in cost flowing through to the valuation. Useful lives of infrastructure are sensitive to changes in use, expectations or requirements that could either shorten or extend the useful lives of infrastructure assets.
Specialised buildings are valued using a depreciated replacement cost technique. Significant unobservable inputs include the current replacement cost and remaining useful lives of buildings. The remaining useful lives of buildings are determined on the basis of the current condition of buildings and vary from 25 years to 55 years. Replacement cost is sensitive to changes in market conditions, with any increase or decrease in cost flowing through to the valuation. Useful lives of buildings are sensitive to changes in expectations or requirements that could either shorten or extend the useful lives of buildings.
Specialised land and land under roads is valued using a market based direct comparison technique. Significant unobservable inputs include the extent and impact of restriction of use and the market cost of land per square metre. The extent and impact of restrictions on use varies and results in a reduction to surrounding land values between 5% and 95%. The market value of land varies significantly depending on the location of the land and the current market conditions. Currently land values range between $32 and $10,667 per square metre.
The valuation is at fair value based on replacement cost less accumulated depreciation as at the date of valuation.
The market that the assets are transacted in is being impacted by the uncertainty that the COVID-19 outbreak has caused. Data to the extent to which Covid-19 has impacted fair value measurements is not available to the Council. Market conditions are changing daily at present. As at the date of valuation we consider that there is a market uncertainty resulting in significant valuation uncertainty.
Details of the Council’s infrastructure and information about the fair value hierarchy as at 30 June 2020 are as follows:
Council Meeting Agenda 24/08/2020
City of Boroondara Attachment 7.9.1 48
DRAFT
38
Notes to the Financial Statements2020 2019$'000 $'000
6.3 - Investments in joint arrangements
Background
Council's share of accumulated surplus(deficit)Council's share of accumulated surplus(deficit) at start of year (4,219) (3,893)Reported surplus/(deficit) for year (395) (326)Council's share of accumulated deficit at end of year (4,614) (4,219)
Movement in carrying value of specific investmentCarrying value of investment at start of year (2,579) (2,253)Share of surplus/(deficit) for year (395) (326)Carrying value of investment at end of year (2,974) (2,579)
The landfill closed on the 29 January 2016. At balance date the landfill itself retains sufficient liquidity to fund the post closure capital works and the post closure after care expenses for the medium term. It is however likely that Council funds will be required to be expended in support of the entity in the longer term.
The City of Boroondara has entered into a joint venture arrangement called Regional Landfill Clayton South, which has developed a refuse tip for a number of municipalities. The Council has a 35.22% interest in the assets, liabilities, revenues and expenses of the joint venture. The remaining joint venture partners include City of Glen Eira, City of Monash, City of Whitehorse and City of Stonnington.
Investments in joint arrangements are classified as either joint operations or joint ventures depending on the contractual rights and obligations each investor has, rather than the legal structure of the joint
tFor joint operations, Council recognises its direct right to its share of jointly held assets, liabilities, revenues and expenses of joint operations.
Council continues to account for Clayton Landfill under the equity method on the basis that Clayton Landfill operating results, assets and liabilities are not material individually or in aggregate. Under this method, the interests are initially recognised in the consolidated balance sheet at cost and adjusted thereafter to recognise Council’s share of the post-acquisition profits or losses and movements in other comprehensive income in profit or loss and other comprehensive income respectively.
Council Meeting Agenda 24/08/2020
City of Boroondara Attachment 7.9.1 49
DRAFT
39
Notes to the Financial Statements2020 2019$'000 $'000
6.4 - Investment property
10,474 10,40759 67
10,533 10,474
(1,429) (1,243)(189) (186)
(1,618) (1,429)
8,915 9,045
Balance at end of financial year
Net book value
Investment property, comprising fresh food market stalls and a commercial shop is held to generate long-term rental yields. All tenant leases are on an arms length basis. Investment property is measured at cost, including transaction costs. Costs incurred subsequent to initial acquisition are capitalised when it is probable that future economic benefit in excess of the originally assessed performance of the asset will flow to the Council. Rental income from the leasing of investment properties is recognised in the Comprehensive Income Statement on a straight line basis over the lease term. AASB 140 Investment Property, paragraph 53 states that if an entity determines that the fair value of an investment property is not reliably determinable on a continuing basis, the entity shall measure that investment property using the cost model in AASB 116 Property, Plant and Equipment .
Gross carrying amountBalance at beginning of financial yearAdditions
Investment property is carried at cost and is depreciated on a straight line basis.
Balance at end of financial year
Accumulated amortisation and impairmentBalance at beginning of the yearDepreciation expense
Council Meeting Agenda 24/08/2020
City of Boroondara Attachment 7.9.1 50
DRAFT
40
Notes to the Financial Statements
Note 7 - People and relationships
7.1 Council and key management remuneration
(a) Related parties
(b) Key management personnel
Councillors Councillor Cynthia Watson (Mayor from 8 Nov 2019 to current)Councillor Jane Addis (Mayor from 8 Nov 2018 to 7 Nov 2019 )Councillor Jim Parke Councillor Phillip HealeyCouncillor Lisa HollingsworthCouncillor Steve HurdCouncillor Coral RossCouncillor Felicity SinfieldCouncillor Garry ThompsonCouncillor Jack Wegman
Chief Executive Officer Phillip Storer
Other KMPs Director Customer Experience and Business Transformation - Bruce Dobson Director Environment and Infrastructure - Daniel Freer (from 11 Nov 2019)Director Community Development - Carolyn McCleanDirector City Planning - Shiran WickramasingheExecutive Manager People Culture and Development - Carolyn Terry
2020 2019No. No.
Total Number of Councillors 10 10Chief Executive Officer and other Key Management Personnel 6 6Total Key Management Personnel 16 16
(c) Remuneration of key management personnel 2020 2019
Total remuneration of key management personnel was as follows: $'000 $'000Short-term benefits 2,147 2,173Post-employment benefits 166 170Long-term benefits 48 40Total 2,361 2,383
Parent entityCity of Boroondara is the parent entity.
Subsidiaries and AssociatesInterests in subsidiaries and associates are detailed in Note 6.3.
Details of persons holding the position of Councillor or other members of key management personnel at any time during the year are:
Council Meeting Agenda 24/08/2020
City of Boroondara Attachment 7.9.1 51
DRAFT
41
Notes to the Financial Statements
7.1 Council and key management remuneration (cont.)
Total remuneration for the reporting year for Senior Officers included above, $'000 $'000amounted to: 9,548 9,203
The numbers of key management personnel whose total remuneration from Council and any related entities, fall within the following bands:
The number of Senior Officers are shown below in their relevant income bands:
Income range:
A Senior Officer is an officer of Council, other than Key Management Personnel, who: a) has management responsibilities and reports directly to the Chief Executive; orb) whose total annual remuneration exceeds $151,000
Council Meeting Agenda 24/08/2020
City of Boroondara Attachment 7.9.1 52
DRAFT
42
Notes to the Financial Statements7.2 Related party disclosure
(a) Transactions with related parties
(a) Roadside Services and Solutions Pty Ltd
(b) Municipal Association of Victoria (MAV)
(b)
(c)
(d)
Outstanding balances with related parties
During the period Council entered into the following transactions with related parties.
Councillor Jim Parke acquired a thirty percent share in Roadside Services and Solutions Pty Ltd on the 30 April 2018. For the year ended 30 June 2020, Council transactions with Roadside Services and Solutions Pty Ltd were valued at $213,599 (2018-19 $229,702) for road line-marking.
Councillor Coral Ross was elected President of Municipal Association of Victoria on the 1 March 2019. For the year ended 30 June 2020, Council transactions with MAV were valued at $156,697 (2018-19 $154,256) for a membership subscription, insurance and other professional services .
There were no balances outstanding at the end of the reporting period in relation to transactions with related parties.
There were no aggregate amount of loans in existence at balance date that have been made, guaranteed or secured by the Council to a responsible person of the Council, or a related party of a responsible person.
There were no aggregate amount of commitments in existence at balance date that have been made, guaranteed or secured by the Council to a related party.
Loans to/from related parties
Commitments to/from related parties
Council Meeting Agenda 24/08/2020
City of Boroondara Attachment 7.9.1 53
DRAFT
43
Notes to the Financial StatementsNote 8 - Managing uncertainties
8.1 - Contingent assets and liabilities
As of 30 June 2020, there are no potential contingent assets.
(a)
(b)
(c)
(a) Contingent assets
Council is a party to an agreement signed under Section 173 of the Planning and Environmental Act in relation to proposed developments in Station Street Camberwell. This agreement was signed on 5 March 1996 pursuant to Planning Permit BOR/9941 and originally imposed certain planning conditions upon the owners of the land, including a limit on future floor area. The agreement also provided that Council would undertake the demolition, removal and relocation of the Public Transport Corporation substation and equipment situated in the Council car park to the west of the subject site and to construct car parking on this land. In the 2013-14 financial year, the Victorian Civil and Administrative Tribunal (VCAT) ruled that the originally proposed developments can proceed. There have been several previous VCAT and Supreme Court proceedings (to which Council was a party) in relation to the developments in Station Street Camberwell and the Section 173 Agreement. All previous VCAT and Supreme Court Cases have been finalised, however, Council will likely be liable for costs associated with these proceedings. As of 30 June 2020, the nature timing and quantum of costs associated with these proceedings have not been reliably determined. The nature, timing and costs associated with honouring the terms of the Section 173 Agreement have also not been reliably determined.
Future superannuation contributions
(b) Contingent liabilities
Council is presently involved in a number of confidential legal matters, which are being conducted through Council's solicitors. The estimated potential financial effect of these matters is unknown at reporting date. The estimate of the financial liability at reporting date representing Council's maximum exposure under its public liability insurance policy for trips and falls on road reserves and footpaths total $228,992 (2018-19 $140,000). This amount is contingent on the outcome of the resolution of these claims.
Council has obligations under a defined benefit superannuation scheme that may result in the need to make additional contributions to the scheme, matters relating to this potential obligation are outlined below. As a result of the volatility in financial markets the likelihood of making such contributions in future periods exists.
In addition to the disclosed contributions, City of Boroondara has paid unfunded liability payments to Vision Super totalling $0 (2018-19 $0). There were no contributions outstanding and no loans issued from or to the above schemes as at 30 June 2020. The expected contributions to be paid to the Defined Benefit category of Vision Super for the year ending 30 June 2021 are $508,000 (2018-19 $517,000).
Council Meeting Agenda 24/08/2020
City of Boroondara Attachment 7.9.1 54
DRAFT
44
Notes to the Financial Statements
8.2 - Change in accounting standards
AASB 2018-7 Amendments to Australian Accounting Standards - Definition of Material (applies 2020/21 for LG Sector)The Standard principally amends AASB 101 Presentation of Financial Statements and AASB 108 Accounting Policies, Changes in Accounting Estimates and Errors . The amendments refine the definition of material in AASB 101. The amendments clarify the definition of material and its application by improving the wording and aligning the definition across AAS and other publications. The impacts on the local government sector are expected to be minimal.
AASB 2019-1 Amendments to Australian Accounting Standards - References to the Conceptual Framework (applies 2020/21 for LG Sector)This Standard sets out amendments to Australian Accounting Standards, Interpretations and other pronouncements to reflect the issuance of the Conceptual Framework for Financial Reporting (Conceptual Framework) by the AASB. The impacts on the local government sector are expected to be minimal.
The following new AAS's have been issued that are not mandatory for the 30 June 2020 reporting period. Council has assessed these pending standards and has identified the following potential impacts will flow from the application of these standards in future reporting periods.
AASB 1059 Service Concession Arrangements: Grantors (AASB 1059) (applies 2020/21 for LG Sector)
AASB 1059 addresses the accounting for a service concession arrangement by a grantor that is a public sector entity by prescribing the accounting for the arrangement from the grantor’s perspective. It requires the grantor to:· recognise a service concession asset constructed, developed or acquired from a third party by the operator, including an upgrade to an existing asset of the grantor, when the grantor controls the asset;
· reclassify an existing asset (including recognising previously unrecognised identifiable intangible assets and land under roads) as a service concession asset when it meets the criteria for recognition as a service concession asset;· initially measure a service concession asset constructed, developed or acquired by the operator or reclassified by the grantor at current replacement cost in accordance with the cost approach to fair value in AASB 13 Fair Value Measuremen t. Subsequent to the initial recognition or reclassification of the asset, the service concession asset is accounted for in accordance with AASB 116 Property, Plant and Equipment or AASB 138 Intangible Assets , as appropriate, except as specified AASB 1059;·recognise a corresponding liability measured initially at the fair value (current replacement cost) of the service concession asset, adjusted for any other consideration between the grantor and the operator; and
·disclose sufficient information to enable users of financial statements to understand the nature, amount, timing and uncertainty of assets, liabilities, revenue and cash flows arising from service concession arrangements.Based on the Council’s current assessment, there is expected to be no impact on the transactions and balances recognised in the financial statements as the Council is not a grantor in a service concession arrangement.
Council Meeting Agenda 24/08/2020
City of Boroondara Attachment 7.9.1 55
DRAFT
45
Notes to the Financial Statements
8.3 - Financial instruments
(a) Objectives and policies
(b) Market risk
Interest rate risk
- benchmarking of returns and comparison with budget.
- diversification of investment product;
There has been no significant change in the Council's exposure, or its objectives, policies and processes for managing interest rate risk or the methods used to measure this risk from the previous reporting period.
The Council's principal financial instruments comprise cash assets, term deposits, receivables (excluding statutory receivables), payables (excluding statutory payables) and bank borrowings. Details of the significant accounting policies and methods adopted, including the criteria for recognition, the basis of measurement and the basis on which income and expenses are recognised, in respect of each class of financial asset, financial liability and equity instrument is disclosed in the Notes of the financial statements. Risk management is carried out by senior management under policies approved by the Council. These policies include identification and analysis of the risk exposure to Council and appropriate procedures, controls and risk minimisation.
Market risk is the risk that the fair value or future cash flows of council financial instruments will fluctuate because of changes in market prices. The Council's exposure to market risk is primarily through interest rate risk with only insignificant exposure to other price risks and no exposure to foreign currency risk.
Interest rate risk refers to the risk that the value of a financial instrument or cash flows associated with the instrument will fluctuate due to changes in market interest rates. Council's interest rate liability risk arises primarily from long term loans and borrowings at fixed rates which exposes council to fair value interest rate risk. Council does not hold any interest bearing financial instruments that are measured at fair value, and therefore has no exposure to fair value interest rate risk. Cash flow interest rate risk is the risk that the future cash flows of a financial instrument will fluctuate because of changes in market interest rates. Council has minimal exposure to cash flow interest rate risk through its cash and deposits that are at floating rates.
Interest rate movements have not been sufficiently significant during the year to have an impact on the Council's year end result.
Investment of surplus funds is made with approved financial institutions under the Local Government Act 1989 . Council manages interest rate risk by adopting an investment policy that ensures:
- monitoring of return on investment; and
Council Meeting Agenda 24/08/2020
City of Boroondara Attachment 7.9.1 56
DRAFT
46
Notes to the Financial Statements
8.3 - Financial instruments (cont.)
(c) Credit risk
(d) Liquidity risk
(e) Sensitivity disclosure analysis
Credit risk is the risk that a contracting entity will not complete its obligations under a financial instrument and cause us to make a financial loss. Council have exposure to credit risk on all financial assets included in our balance sheet. To help manage this risk:
- Council may require collateral where appropriate; and - Council only invest surplus funds with financial institutions which have a recognised credit rating specified in our investment policy.
Liquidity risk includes the risk that, as a result of our operational liquidity requirements or we will not have sufficient funds to settle a transaction when required, we will be forced to sell a financial asset at below value or may be unable to settle or recover a financial asset.
To help reduce these risks Council: - have readily accessible standby facilities and other funding arrangements in place; - have a liquidity portfolio structure that requires surplus funds to be invested within various bands of liquid instruments;
The maximum exposure to credit risk at the reporting date to recognised financial assets is the carrying amount, net of any provisions for impairment of those assets, as disclosed in the balance sheet and notes to the financial statements. Council does not hold any collateral.
There are no material financial assets which are individually determined to be impaired.
Receivables consist of a large number of customers, spread across the ratepayer, business and government sectors. Credit risk associated with the Council's financial assets is minimal because the main debtor is secured by a charge over the rateable property.
- Council have a policy for establishing credit limits for the entities council deal with;
Council may also be subject to credit risk for transactions which are not included in the balance sheet, such as when we provide a guarantee for another party. Details of our contingent liabilities are disclosed in Note 8.1(b).
- monitor budget to actual performance on a regular basis; and
Taking into account past performance, future expectations, economic forecasts, and management's knowledge and experience of the financial markets, Council believes the following movements are 'reasonably possible' over the next 12 months: - A parallel shift of + 1% and -1% in market interest rates (AUD) from year-end rates of 0.91%.These movements will not have a material impact on the valuation of Council's financial assets and liabilities, nor will they have a material impact on the results of Council's operations.
- set limits on borrowings relating to the percentage of loans to rate revenue and percentage of loan principal repayments to rate revenue.
The Council's maximum exposure to liquidity risk is the carrying amounts of financial liabilities as disclosed in the face of the balance sheet and the amounts related to financial guarantees disclosed in Note 8.1(c), and is deemed insignificant based on prior periods' data and current assessment of risk.
There has been no significant change in Council's exposure, or its objectives, policies and processes for managing liquidity risk or the methods used to measure this risk from the previous reporting period.
With the exception of borrowings, all financial liabilities are expected to be settled within normal terms of trade. Details of the maturity profile for borrowings are disclosed at Note 5.4.Unless otherwise stated, the carrying amounts of financial instruments reflect their fair value.
Council Meeting Agenda 24/08/2020
City of Boroondara Attachment 7.9.1 57
DRAFT
47
Notes to the Financial Statements8.4 - Fair value measurement
Revaluation
Land under roads
Impairment of assets
Subsequent to the initial recognition of assets, non-current physical assets, other than plant and equipment, are measured at their fair value, being the price that would be received to sell an asset or paid to transfer a liability in an orderly transaction between market participants at the measurement date. At balance date, the Council reviewed the carrying value of the individual classes of assets measured at fair value to ensure that each asset materially approximated its fair value. Where the carrying value materially differed from the fair value at balance date, the class of asset was revalued.
Fair value valuations are determined in accordance with a valuation hierarchy. Changes to the valuation hierarchy will only occur if an external change in the restrictions or limitations of use on an asset result in changes to the permissible or practical highest and best use of the asset. In addition, Council undertakes a formal revaluation of land, buildings, and infrastructure assets on a regular basis ranging from 2 to 5 years. The valuation is performed either by experienced Council officers or independent experts.
Where the assets are revalued, the revaluation increments are credited directly to the asset revaluation reserve except to the extent that an increment reverses a prior year decrement for that class of asset that had been recognised as an expense in which case the increment is recognised as revenue up to the amount of the expense. Revaluation decrements are recognised as an expense except where prior increments are included in the asset revaluation reserve for that class of asset in which case the decrement is taken to the reserve to the extent of the remaining increments. Within the same class of assets, revaluation increments and decrements within the year are offset.
Council recognises land under roads it controls on a cost basis.
At each reporting date, the Council reviews the carrying value of its assets to determine whether there is any indication that these assets have been impaired. If such an indication exists, the recoverable amount of the asset, being the higher of the asset's fair value less costs to sell and value in use, is compared to the assets carrying value. Any excess of the assets carrying value over its recoverable amount is expensed to the comprehensive income statement, unless the asset is carried at the revalued amount in which case, the impairment loss is recognised directly against the revaluation surplus in respect of the same class of asset to the extent that the impairment loss does not exceed the amount in the revaluation surplus for that same class of asset.
Level 1 — Quoted (unadjusted) market prices in active markets for identical assets or liabilities;Level 2 — Valuation techniques for which the lowest level input that is significant to the fair value measurement is directly or indirectly observable; andLevel 3 — Valuation techniques for which the lowest level input that is significant to the fair value measurement is unobservable.For the purpose of fair value disclosures, Council has determined classes of assets and liabilities on the basis of the nature, characteristics and risks of the asset or liability and the level of the fair value hierarchy as explained above.In addition, Council determines whether transfers have occurred between levels in the hierarchy by re-assessing categorisation (based on the lowest level input that is significant to the fair value measurement as a whole) at the end of each reporting period.
Council's financial assets and liabilities are not valued in accordance with the fair value hierarchy , Council's financial assets and liabilities are measured at amortised cost.
Council measures certain assets and liabilities at fair value where required or permitted by Australian Accounting Standards. AASB 13 Fair value measurement, aims to improve consistency and reduce complexity by providing a definition of fair value and a single source of fair value measurement and disclosure requirements for use across Australian Accounting Standards.
Fair value hierarchy
AASB 13 defines fair value as the price that would be received to sell an asset or paid to transfer a liability in an orderly transaction between market participants at the measurement date. Fair value under AASB 13 is an exit price regardless of whether that price is directly observable or estimated using another valuation technique.
All assets and liabilities for which fair value is measured or disclosed in the financial statements are categorised within a fair value hierarchy, described as follows, based on the lowest level input that is significant to the fair value measurement as a whole:
Sub-total property and infrastructure 2,956,198 (420,735) (639) 2,534,824
Total asset revaluation reserves 2,956,198 (420,735) (639) 2,534,824
The asset revaluation reserve is used to record the movement in fair value of Council's assets over time.
The COVID-19 pandemic has created unprecedented economic uncertainty. Actual economic events and conditions in the future may be materially different from those estimated by the City of Boroondara at the reporting date. As responses by government continue to evolve, management recognises that it is difficult to reliably estimate with any degree of certainty the potential impact of the pandemic after the reporting date on the City of Boroondara, its operations, its future results and financial position.The Victorian Government announced a State of Disaster on the 2 August 2020 and “Stage 4” restrictions were applied to Metro Melbourne, which includes the City of Boroondara. This event does not affect amounts recognised in the 2019-20 financial statements.The introduction of Stage 4 restrictions has had further implications for Council services and facilities beyond those already affected by the previous Stage 3 restrictions. Several of Councils services have now been or continued to be closed including Council’s leisure centre facilities, libraries, community centres and the Hawthorn Arts Centre.Council’s 2020-21 Adopted Budget includes estimated impacts on revenue and expenditure streams under Stage 3 restrictions for the first quarter of 2020-21. An estimated $8.35 million reduction in revenue is expected primarily in User Fees and Statutory Fees and Charges and unexpected cost increases mainly due to the temporary closure of Council’s Leisure and Aquatic Facilities.As part of Stage 3 restrictions Council developed a $4.5 million financial assistance package which commenced in April 2020 and has effect over both the 2019-20 and 2020-21 financial years. The relief package includes a range of initiatives designed to ease the financial burden on residents, local businesses and community groups and is reflected in the 2020-21 budget.Council continues to monitor and review the financial impacts of COVID-19 on Council’s operating budget. No other matters or circumstances have arisen since the end of the financial year which significantly affected or may affect the operations of the City of Boroondara, the results of the operations or the state of affairs of the City of Boroondara in the future financial years.
Council Meeting Agenda 24/08/2020
City of Boroondara Attachment 7.9.1 59
DRAFT
49
Notes to the Financial Statements
9.1 - Reserves (cont.)
Balance atbeginning of
reporting period
Transfer from accumulated
surplus
Transfer to accumulated
surplus
Balance at end of reporting period
$'000 $'000 $'000 $'000(b) Other reserves
2020
Strategic Acquisition fund 434 - - 434Defined Benefit future call up fund 6,000 1,000 - 7,000Open Space development fund 10,469 800 - 11,269
- -Total other reserves 16,903 1,800 - 18,703
2019
Strategic Acquisition fund 434 - - 434Defined Benefit future call up fund 5,000 1,000 - 6,000Open Space development fund 9,669 800 - 10,469
Total other reserves 15,103 1,800 - 16,903
The Strategic Acquisition fund will be available for the purpose of acquiring new strategic assets where they are required for the provision of community services or for additional public open space.
The Open Space development fund allows for the acquisition of land within the municipality for conversion to public open space as it becomes available.
The Defined Benefit future call up fund has been created for use should a shortfall in the defined benefit superannuation fund be called by the Local Government Defined Benefit Superannuation Fund trustee.
Council Meeting Agenda 24/08/2020
City of Boroondara Attachment 7.9.1 60
DRAFT
50
Notes to the Financial Statements2020 2019$'000 $'000
9.2 - Reconciliation of cash flows from operating activities to surplus/(deficit)
Surplus for the period 12,259 30,719
Depreciation and amortisation 37,592 33,669(Profit) /loss on disposal of property, infrastructure, plant and equipment 4,625 2,288Share of joint venture (profits) / losses net of distributions 395 326Works in progress not capitalised (expensed) 6,539 4,712Contributions of non-monetary assets - (840)Borrowing costs 1,428 1,652Finance costs leases 270 -
Change in assets and liabilities:
increase in trade and other receivables (3,340) (2,013)(Increase)/decrease in prepayments (304) (514)(Increase)/decrease in inventories - (5)Increase/(decrease) in trust funds and deposits 1,717 792Increase/(decrease) in trade and other payables (4,850) (1,084)Increase in other liabilities 1,459 28Increase/(decrease) in provisions 2,330 929
Net cash provided by operating activities 60,120 70,659
9.3 - Superannuation
Accumulation
Price inflation (CPI) 2.0% pa.
Vision Super has advised that the estimated VBI at 30 June 2020 was 104.6%.The VBI is used as the primary funding indicator. Because the VBI was above 100%, the 30 June 2019 interim actuarial investigation determined the Defined Benefit category was in a satisfactory financial position and that no change was necessary to the Defined Benefit category’s funding arrangements from prior years.
Net investment returns 6.0% pa Salary information 3.5% pa
A triennial actuarial review is currently underway for the Defined Benefit category as at 30 June 2020 and is expected to be completed by 31 December 2020.
Council makes the majority of its employer superannuation contributions in respect of its employees to the Local Authorities Superannuation Fund (the Fund). This Fund has two categories of membership, accumulation and defined benefit, each of which is funded differently. Obligations for contributions to the Fund are recognised as an expense in Comprehensive Operating Statement when they are made or due.
As at 30 June 2019, an interim actuarial investigation was held as the Fund provides lifetime pensions in the Defined Benefit category. The vested benefit index (VBI) of the Defined Benefit category of which Boroondara City Council is a contributing employer was 107.1%. The financial assumptions used to calculate the VBIs were:
The Fund's accumulation categories, Vision MySuper/Vision Super Saver, receive both employer and employee contributions on a progressive basis. Employer contributions are normally based on a fixed percentage of employee earnings (for the year ended 30 June 2020, this was 9.5% as required under Superannuation Guarantee (SG) legislation).
Defined BenefitCouncil does not use defined benefit accounting for its defined benefit obligations under the Fund's Defined Benefit category. This is because the Fund's Defined Benefit category is a pooled multi-employer sponsored plan.
There is no proportional split of the defined benefit liabilities, assets or costs between the participating employers as the defined benefit obligation is a floating obligation between the participating employers and the only time that the aggregate obligation is allocated to specific employers is when a call is made. As a result, the level of participation of Boroondara City Council in the Fund cannot be measured as a percentage compared with other participating employers. Therefore, the Fund Actuary is unable to allocate benefit liabilities, assets and costs between employers for the purposes of AASB 119.
Council makes employer contributions to the Defined Benefit category of the Fund at rates determined by the Trustee on the advice of the Fund Actuary.
Funding arrangements
Council Meeting Agenda 24/08/2020
City of Boroondara Attachment 7.9.1 61
DRAFT
51
Notes to the Financial Statements
9.3 - Superannuation (cont.)
Funding Calls
The 2019 interim actuarial investigation surplus amounts
2019 2017$m $m
- A VBI Surplus 151.3 69.8 - A total service liability surplus 233.4 193.5 - A discounted accrued benefits surplus 256.7 228.8
Employer contributionsRegular contributions
The VBI surplus means that the market value of the fund’s assets supporting the defined benefit obligations exceed the vested benefits that the defined benefit members would have been entitled to if they had all exited on 30 June 2019.
The total service liability surplus means that the current value of the assets in the Fund’s Defined Benefit category plus expected future contributions exceeds the value of expected future benefits and expenses as at 30 June 2019.The discounted accrued benefit surplus means that the current value of the assets in the Fund’s Defined Benefit category exceeds the value of benefits payable in the future but accrued in respect of service to 30 June 2019.Council was notified of the 30 June 2019 VBI during August 2019 (2018: August 2018).
In the event that the Fund Actuary determines that there is a shortfall based on the above requirement, the Fund’s participating employers (including Council) are required to make an employer contribution to cover the shortfall.
If there is a surplus in the Fund, the surplus cannot be returned to the participating employers.
The Fund’s actuarial investigations identified the following for the Defined Benefit category of which Council is a contributing employer:
In the event that a participating employer is wound-up, the defined benefit obligations of that employer will be transferred to that employer’s successor.
An actuarial investigation is conducted annually for the Defined Benefit category of which Council is a contributing employer. Generally, a full actuarial investigation conducted every three years and interim actuarial investigations are conducted for each intervening year. An interim investigation was conducted as at 30 June 2019 and the last full actuarial investigation was conducted as at 30 June 2017.
Due to the nature of the contractual obligations between the participating employers and the Fund, and that the Fund includes lifetime pensioners and their reversionary beneficiaries, it is unlikely that the Fund will be wound up.
On the basis of the results of the 2017 full actuarial investigation conducted by the Fund Actuary, Council makes employer contributions to the Fund’s Defined Benefit category at rates determined by the Fund’s Trustee. For the year ended 30 June 2020, this rate was 9.5% of members' salaries (9.5% in 2018-2019). This rate is expected to increase in line with any increases in the SG contribution rate and reviewed as part of the 30 June 2020 triennial valuation.In addition, Council reimburses the Fund to cover the excess of the benefits paid as a consequence of retrenchment above the funded resignation or retirement benefit.
Using the agreed methodology, the shortfall amount is apportioned between the participating employers based on the pre-1 July 1993 and post-30 June 1993 service liabilities of the Fund’s Defined Benefit category, together with the employer’s payroll at 30 June 1993 and at the date the shortfall has been calculated.
If the Defined Benefit category is in an unsatisfactory financial position at an actuarial investigation or the Defined Benefit category‘s VBI is below its shortfall limit at any time other than the date of the actuarial investigation, the Defined Benefit category has a shortfall for the purposes of SPS 160 and the Fund is required to put a plan in place so that the shortfall is fully funded within three years of the shortfall occurring. The Fund monitors its VBI on a quarterly basis and the Fund has set its shortfall limit at 97%.
Council Meeting Agenda 24/08/2020
City of Boroondara Attachment 7.9.1 62
DRAFT
52
Notes to the Financial Statements
9.3 - Superannuation (cont.)
The 2020 triennial actuarial investigation
2020 2017Triennial
InvestigationTriennial
Investigation
Net investment return 5.60% pa 6.50% paSalary Inflation 2.50 %pa
for the first two years and 2.75%pa
thereafter
3.50% pa
Price Inflation 2.00% pa 2.50% pa
Superannuation contributions
2020 2019Scheme Type of Scheme Rate $'000 $'000Vision Super Defined benefit 9.5% 514 502 Vision Super Accumulation fund 9.5% 3,647 3,571 Other scheme Accumulation fund 9.5% 3,250 2,921
Contributions by Council (excluding any unfunded liability payments) to the above superannuation plans for the financial year ended 30 June 2020 are detailed below:
There were no contributions outstanding and no loans issued from or to the above schemes as at 30 June 2020.
The expected contributions to be paid to the Defined Benefit category of Vision Super for the year ending 30 June 2021 is $508,000.
A triennial actuarial investigation is being conducted for the Fund’s position as at 30 June 2020. It is anticipated that this actuarial investigation will be completed by 31 December 2020. The financial assumptions for the purposes of this investigation are:
In addition to the above contributions, Council has paid unfunded liability payments to Vision Super totalling $0 paid during the 2019-20 year (2018-19 $0).
Council Meeting Agenda 24/08/2020
City of Boroondara Attachment 7.9.1 63
DRAFT
53
Notes to the Financial Statements10 - Change in accounting policy
a) AASB 15 Revenue from Contracts with Customers - Impact of Adoption
b) AASB 16 Leases
c) AASB 1058 Income of Not-for-Profit Entities
d) Transition impacts
2019$'000
Retained earnings at 30 June 2019 927,776 Revenue adjustment - impact of AASB 15 Revenue from Contracts with Customers - Income Adjustment - impact of AASB 1058 Income of Not-for-Profit Entities - Retained earnings at 1 July 2019 927,776
As reported 30 June 2019 Adjustments Post adoption
Assets $'000 $'000 $'000Right of use assets - 9,504 9,504 Grants receivable - - -
- 9,504 9,504LiabilitiesUnearned income - operating grants - - - Unearned income - capital grants - - - Lease liability - current - (2,780) (2,780)Lease liability - non-current - (6,724) (6,724)
- (9,504) (9,504)
Council has adopted AASB 15 Revenue from Contracts with Customers, AASB 16 Leases and AASB 1058 Income of Not-for-Profit Entities , from 1 July 2019. This has resulted in changes in accounting policies and adjustments to the amounts recognised in the financial statements.
Due to the transition methods chosen by Council in applying these standards, comparative information throughout these financial statements has not been restated to reflect the requirements of the new standards except in relation to contracts that were not complete at 1 July 2019. The transition impact of these are detailed below.
AASB 15 Revenue from Contracts with Customers applies to revenue transactions where Council provides services or goods under contractual arrangements. Council adopted AASB 15 Revenue from Contracts with Customers using the modified (cumulative catch up) method. Revenue for 2019 as reported under AASB 118 Revenue is not adjusted, because the new standard is only applied from the date of initial application.AASB 15 Revenue from Contracts with Customers requires revenue from contracts with customers to be recognised as Council satisfies the performance obligations under the contract.
AASB 16 Leases requires right of use assets and related liabilities for all lease agreements to be recognised on the balance sheet. The Statement of Comprehensive Income is to separately recognise the amortisation of the right of use asset, and the finance costs relating to the lease. Council has elected to adopt the modified (cumulative catch up) method under the standard and as such has not adjusted 2019 disclosures. The transition impact of these are detailed below.
Council adopted the practical expedient of deeming the lease asset to be equal in value to the lease liability at 1 July 2019. As such there was no impact on retained earnings on the adoption of AASB 16 Leases.The following table summarises the impacts of transition to the new standards on Council's balance sheet for the year ending 30 June 2019.
AASB 1058 Income of Not-for-Profit Entities applies to income received where no contract is in place. This includes statutory charges (such as rates) as well as most grant agreements.Council adopted AASB 1058 Income of Not-for-Profit Entities using the modified (cumulative catch up) method. Income for 2019 is not adjusted, because the new standard is only applied from the date of initial application.AASB 1058 Income of Not-for-Profit Entities requires income to be recognised as Council satisfies the performance obligations under the contract.
The following table summarises the impact of transition to the new standards on retained earnings at 1 July 2019.
Council Meeting Agenda 24/08/2020
City of Boroondara Attachment 7.9.1 64
DRAFT
54
Notes to the Financial Statements
11 - Impact of COVID 19 on Council operations and 2019-20 Financial Report
• Statutory fees and fines and user fees were impacted by COVID-19 impacting Council revenue by $6.97M. This included: - Suspended enforcement of time restrictions for parking in and around hospitals, Centrelink offices and under-utilised car parks. - Suspended ticket parking machine fees in paid parking areas to assist traders, shoppers and visitors. - Waived waste management traders fees for the Maling Road, Greythorn and Camberwell shopping districts. - Waived trader parking permits fees (quarterly and annual). - All footpath trading fees including permits for outdoor dining on Council land were waived and rebated.- Waived food premises registration fees to assist local traders.- Reduced hire fee for users of the Anderson Park Meeting Room for 2020.
• The below resulted in a decrease in rent revenue of $662,000: - Rental reduction for store holders at Camberwell Fresh Food Market. - Kew Court House and Hawthorn Arts Centre tenants, both community and commercial, received reduced rent for their lease/licences to match the period they have been unable to access the venues. - Council waived lease and licence fees for some community groups.- Council waived all fees under the Camberwell Sunday Market licence, including licence fee, stallholder levy and monthly instalments. Council also offered Boroondara Farmers Market and Hawthorn Makers Market stallholders the opportunity to have their own online ordering and delivery information promoted on Council’s website and the relevant market’s social media pages.
• Council waived winter season sportsground tenancy fees and utilities charges for sporting clubs.
On 30 January 2020, COVID-19 was declared as a global pandemic by the World Health Organisation. Various measures were taken by all three levels of Government in Australia to reduce the spread of COVID-19.
To ease the financial burden on Boroondara residents, local businesses and community groups Council introduced a series of measures effective April 2020. The measures combined with other costs has impacted Council’s operations for the financial year end 2020 in the following areas:
• Council has extended its Financial hardship policy in response to COVID-19 from April 2020. Deferral of rates revenue received has resulted in the debtor balance as at 30 June 2020 to increase by $3.60M compared to last year. No interest is being charged on late rate payments.
• In response to COVID-19 restrictions and government directives the leisure centre facilities, libraries, community centres and the Hawthorn Arts Centre were closed. These closures resulted in a decrease in the council user fee revenue by $1.36M and an increase in associated expenses by $1.29M.
• Application fees have been waived for 3-year-old and 4-year-old kindergarten enrolments and charges for parent information sessions were also waived.
• The state of the property market within the review period is at present most influenced by the recent COVID-19 pandemic and resulting declaration of State of Emergency. Market conditions are changing daily at present. The full extent of the effect of these conditions upon the property market and broader economic environment is unclear at best. Initial falls in auction and inspection attendance rates prior to the State of Emergency, the evolution and ensuing shift to online auctions only, and recent return of on-site auctions, albeit limited in attendance numbers, have at varying times all conspired to result in a period of limited transaction volumes from which to base a meaningful and thorough analysis process. For the period of the annual material change review, we consider that there is a market uncertainty resulting insignificant valuation uncertainty.
• The market that the infrastructure assets are transacted in is being impacted by the uncertainty that the COVID-19 outbreak has caused. Data to the extent to which Covid-19 has impacted fair value measurements is not available to the Council. Market conditions are changing daily at present. As at the date of valuation we consider that there is a market uncertainty resulting in significant valuation uncertainty.
Council continues to monitor the situation, work with the business community and review the initiatives over the coming months.
Council Meeting Agenda 24/08/2020
City of Boroondara Attachment 7.9.1 65
DRAFT
Council Meeting Agenda 24/08/2020
City of Boroondara Attachment 7.9.1 66
DRAFT
Council Meeting Agenda 24/08/2020
City of Boroondara Attachment 7.9.1 67
DRAFT
Performance Statement For the year ended 30 June 2020
Description of municipality The City of Boroondara (the Council) is located in the inner eastern suburbs of Melbourne, between 5 and 10 kilometres east of the Melbourne Central Business District and covers an area of 60 square kilometres. The Council includes the suburbs of Ashburton, Balwyn, Balwyn North, Camberwell, Canterbury, Deepdene, Hawthorn, Hawthorn East, Kew and Kew East, and parts of Glen Iris, Surrey Hills and Mont Albert.
Boroondara has an estimated residential population of 183,199 people (at 30 June 2019). Compared with greater Melbourne, we have a smaller proportion of young children and people aged 30 to 39, but a larger proportion of 10 to 19 year olds and people over 50 years. Of all 79 Victorian local government areas, Boroondara has the fifth largest population of people aged 85 years and over. At the 2016 Census 3.8% of the population needed assistance with daily living tasks.
Boroondara is culturally and linguistically diverse. The proportion of Boroondara residents who were born overseas increased from 25.5% in 2006 to 30.9% in 2016. Residents were born in more than 145 countries and spoke more than 120 languages.
By area, Boroondara has one of the highest concentrations of schools of all Victorian local government areas, with 58 secondary, primary and special education schools, including 12 combined primary and secondary schools, as well as Swinburne University, Swinburne TAFE, the Hawthorn-Melbourne English Language Centre and two Universities of the Third Age. Currently, 74 organisations offer a kindergarten program in Boroondara spanning across standalone kindergartens, long day care centres and independent schools. The City also has 11 neighbourhood and community centres where residents can participate in programs focussing on health and wellbeing, languages, creative pursuits, the arts, cooking and technology.
On 30 January 2020, COVID-19 was declared as a global pandemic by the World Health Organisation. Various measures were taken by all three levels of Government in Australia to reduce the spread of COVID-19.
To ease the financial burden on Boroondara residents, local businesses and community groups Council introduced a series of measures effective April 2020 and include: • Council has extended its financial hardship policy in response to COVID-19 from April 2020. No interest is being charged on laterate payments.• Support for families - application fees have been waived for 3-year-old and 4-year-old kindergarten enrolments and charges forparent information sessions were also waived• Public Parking - suspended enforcement of time restrictions for parking in and around hospitals, Centrelink offices and under-utilised car parks and ticket parking machine fees in paid parking areas until September 2020 to assist traders, shoppers andvisitors• Support for Community Groups - waived lease and licence fees for some community groups, including sporting clubs• Relief for local businesses - waived fees for footpath trading fees, food premises registration, trader parking permits and wastemanagement traders fees for Maling Road, Greythorn and Camberwell shopping districts• Our markets - waived all fees under the Camberwell Sunday Market licence, including licence fee, stallholder levy and monthlyinstalments.
Council's revenue and expenditure streams has been impacted by COVID-19 primarily in in User Fees and Statutory Fees and Charges totalling $6.97 million.
In response to COVID-19 restrictions and government directives the leisure centre facilities, libraries, community centres and the Hawthorn Arts Centre were closed. These closures resulted in a decrease in the council user fee revenue by $1.36 million and an increase in associated expenses by $1.29 million. These restrictions also resulted in decreased visitations to council facilities and also decreased participation in Council programs.
Council continues to monitor the situation, work with the business community and review the initiatives over the coming months.
Refer to the Annual Financial Statements for further information.
Page 1 of 9
Council Meeting Agenda 24/08/2020
City of Boroondara Attachment 7.9.1 68
DRAFTPopulationExpenses per head of municipal population(Total expenses/Municipal population) $1,120.37 $1,109.28 $1,166.77 $1,265.02
Council continues to deliver services in accordance with it's long term financial plan. Expenditure has increased primarily due to an increase in materials and services costs.
Infrastructure per head of municipal population(Value of infrastructure/Municipal population) $4,775.59 $4,720.19 $4,772.34 $4,903.10
Population density per length of road(Municipal population/Kilometres of local roads) 314.50 318.59 321.86 323.22
Workforce turnoverPercentage of staff turnover[Number of permanent staff resignations and terminations / Average number of permanent staff for the financial year] x100 12.1% 11.4% 8.1% 9.5%
The variance is partially attributable to changes in operating models arising from service review as well as normal variances in departures.
2020
10
"population" means the resident population estimated by council"own-source revenue" means adjusted underlying revenue other than revenue that is not under the control of council (including government grants)"relative socio-economic disadvantage", in relation to a municipality, means the relative socio-economic disadvantage, expressed as a decile for the relevant financial year, of the area in which the municipality is located according to the index of Relative Socio-Economic Disadvantage (Catalogue Number 2033.0.55.001) of SEIFA"SEIFA" means the Socio-Economic Indexes for Areas published from time to time by the Australian Bureau of Statistics on its internet website"unrestricted cash" means all cash and cash equivalents other than restricted cash.
$1,213.68
$73.48
$1,180.03
$86.40
10
2018 2019
$1,205.61
$78.91
10
Results
Sustainable Capacity IndicatorsFor the year ended 30 June 2020
Definitions"adjusted underlying revenue" means total income other than - (a) non-recurrent grants used to fund capital expenditure; and(b) non-monetary asset contributions; and(c) contributions to fund capital expenditure from sources other than those referred to in paragraphs (a) and (b)"infrastructure" means non-current property, plant andequipment excluding land"local road" means a sealed or unsealed road for which the council is the responsible road authority under theRoad Management Act 2004
Own-source revenueOwn-source revenue per head of municipal population(Own-source revenue/Municipal population)
Recurrent grantsRecurrent grants per head of municipal population(Recurrent grants/Municipal population)
Indicator/measure Material Variations
DisadvantageRelative Socio-Economic disadvantage(Index of Relative Socio-Economic Disadvantage by decile)
$1,160.91
$98.97
10
2017
Page 2 of 9
Council Meeting Agenda 24/08/2020
City of Boroondara Attachment 7.9.1 69
DRAFT
Service Performance IndicatorsFor the year ended 30 June 2020
Indicator/measure 2017 2018 2019 2020 Material Variations
Maternal and child healthParticipationParticipation in the MCH service(Number of children who attend the MCH service at least once in the year/Number of children who enrolled in the MCH service) x 100
79% 80% 83% 82%
ParticipationParticipation in the MCH service by Aboriginal children(Number of Aboriginal children who attend the MCH service at least once in the year/Number of Aboriginal children enrolled in the MCH service) x 100
100% 96% 88% 100% All children who identify as Aboriginal have attended all required Key Age and Stage visits.
Food safetyHealth and safetyCritical and major non-compliance outcome notifications(Number of critical non-compliance outcome notifications and major non-compliance notifications about a food premises followed up/Number of critical non-compliance outcome notifications and major non-compliance notifications about a food premises) x 100
99%
GovernanceSatisfactionSatisfaction with council decisions(Community satisfaction rating out of 100 with how council has performance in making decisions in the interest of the community)
60 60
99%
59
Animal managementHealth and safetyAnimal management prosecutions(Number of successful animal management prosecutions / Total number of animal management prosecutions) x 100
New measure in 2019-20. New in 2020
New in 2020
New in 2020 100%
Results
62
10
25%
72
Aquatic facilitiesUtilisationUtilisation of aquatic facilities(Number of visits to aquatic facilities/Municipal population)
Visitations heavily impacted by COVID-19 pandemic. 14 14 15
99%99%
RoadsSatisfactionSatisfaction with sealed local roads(Community satisfaction rating out of 100 with how council has performed on the condition of sealed local roads)
LibrariesParticipationActive library borrowers in municipality(Number of active library burrowers in the last three years/The sum of the population for the last three years)x100
Measure changed in 2019-20 from ‘Active library members’ to ‘Active library borrowers’ with changes to the numerator and the denominator to extend the calculation to the last three years.
71
26%
73
25%
71
27%
Page 3 of 9
Council Meeting Agenda 24/08/2020
City of Boroondara Attachment 7.9.1 70
DRAFT
Service Performance IndicatorsFor the year ended 30 June 2020
Indicator/measure 2017 2018 2019 2020 Material VariationsResults
RETIREDIndicator/measure 2017 2018 2019 2020 Comments Animal ManagementHealth and safetyAnimal management prosecutions[Number of successful animal management prosecutions]
6 Retired in 2020
From 1 July 2019, this measure was replaced by Animal management prosecutions calculated as a percentage of successful animal management prosecutions.
41%52% 49%
53%
Waste collectionWaste diversionKerbside collection waste diverted from landfill(Weight of recyclables and green organics collected from kerbside bins/Weight of garbage, recyclables and green organics collected from kerbside bins) x 100
49% 49% 49%
Definitions"Aboriginal child" means a child who is an Aboriginal person"Aboriginal person" has the same meaning as in the Aboriginal Heritage Act 2006"active library member" means a member of a library who has borrowed a book from the library"annual report" means an annual report prepared by a council under sections 131, 132 and 133 of the Act"class 1 food premises" means food premises, within the meaning of the Food Act 1984, that have been declared as class 1 food premises under section 19C of that Act"class 2 food premises" means food premises, within the meaning of the Food Act 1984, that have been declared as class 2 food premises under section 19C of that Act"critical non-compliance outcome notification" means a notification received by council under section 19N(3) or (4) of the Food Act 1984, or advice given to council by an authorised officer under that Act, of a deficiency that poses an immediate serious threat to public health"food premises" has the same meaning as the Food Act 1984"local road" means a sealed or unsealed road for which the council is the responsible road authority under the Road Management Act 2004"major non-compliance outcome notification" means a notification received by a council under section 19N(3) or (4) of the Food Act 1984, or advice given to council by an authorized officer under that Act, of a deficiency that does not pose an immediate serious threat to public health but may do so if no remedial action is taken "MCH" means the Maternal and Child Health Service provided by a council to support the health and development of children within the municipality from birth until school age"population" means the resident population estimated by council "WorkSafe reportable aquatic facility safety incident" means an incident relating to a council aquatic facility that is required to be notified to the Victorian WorkCover Authority under Part 5 of the Occupational Health and Safety Act 2004.
52%
Statutory PlanningDecision makingPlanning decisions upheld at VCAT(Number of VCAT decisions that did not set aside council's decision in relation to a planning application/Number of VCAT decisions in relation to planning applications)x100
An indicator of the sustainable operating result required to enable Council to continue to provide core services and meet its objectives. The adjusted underlying result in 2019-20 and 2020-21 are due the impacts of COVID-19 and the 2020-21 Financial Assistance grants of $2.43 million or 50% brought forward to the 2019-20 financial year, with the operating result returning to normal surplus levels in future years of the Strategic Resource Plan.
LiquidityWorking capitalCurrent assets compared to current liabilities(Current assets / Current liabilities) x 100
The reduction in working capital in 2021-22 is due to the movement of Council's loans to current liabilities due to full loan payment scheduled for 2022-23 and Council's continued investment in planned priority projects.
Unrestricted cashUnrestricted cash compared to current liabilities(Unrestricted cash / Current liabilities) x 100
The reduction in unrestricted cash is due to higher levels of funding held in investments with a term of greater than 90 days maturity in order to maximise interest income. At the end of 30 June 2020 Council held $15.08 million in investments with a maturity date greater than three months. During 2020-21, term deposits will be redeemed and transferred to cash and cash equivalents. Council does not forecast the level of funds held in greater than 90 day maturity term deposits. Hence prior years actual are not comparable with forecast years.
ObligationsLoans and borrowingsLoans and borrowings compared to rates( Interest bearing loans and borrowings / Rate revenue) x100
The decrease over years 2018-19 to 2019-20 is due to a combination of higher rate revenue (2.5% rate cap in 2019-20) and lower principal repayments as Council continues to reduce existing debt. Council proposes to borrow $70 million in 2021-22 to fund significant infrastructure projects.
Loans and borrowingsLoans and borrowings repayments compared to rates( Interest and principal repayments on interest bearing loans and borrowings / Rate revenue) x100
3.99% 3.87% 11.28% 1.56% 1.53% 1.95% 14.41% 3.62%
The increase in 2018-19 and 2022-23 is due to Council retiring existing debt. A 20 year loan refinanced in 2014-15 was repaid in full in 2018-19. In 2012-13, Council continued with substantial investment in major building redevelopment works and borrowed $29 million. This loan balance is scheduled to be repaid in full in 2022-23.
Financial Performance IndicatorsFor the year ended 30 June 2020
During the 2019-20 financial year the implementation of the new Accounting standard, Australian Accounting Standards Board 16 Leases (AASB 16 Leases) has taken effect and requires Council to bring the majority of operating leases (primarily fleet charges and leased assets) on-balance sheet. Council also proposes to borrow $70 million in 2021-22 to fund significant infrastructure projects. In 2019-20 and 2020-21 Council's own source revenue has decreased and reflects Council's immediate and short term response to COVID-19 and resulting impacts on revenue primarily in in User Fees and Statutory Fees and Charges. The reduction also includes Council's $4.50 million support and relief package to assist local residents, businesses and community groups due to the impacts of COVID-19 and has an effect over both 2019-20 and 2020-21.
Asset renewal and upgradeAsset renewal and upgrade compared to depreciation(Asset renewal and asset upgrade expense / Asset depreciation) x100 New in
2020New in 2020
New in 2020 126.81% 148.13% 172.67% 110.46% 113.49%
Based on Asset Renewal budgets and the timing of major projects. Increase in 2020-21 & 2021-22 due to planned major project expenditure demonstrates Council's ongoing commitment to invest in the renewal of its existing community infrastructure.
Boroondara receives a very low level of financial assistance from the State Government hence rate revenue will continue to be a key source of funding for the delivery of high quality services and infrastructure to the community.
Rates effortRates compared to property values(Rate revenue / Capital improved value of rateable properties in the municipality) x 100 0.16% 0.16% 0.14% 0.17% 0.16% 0.17% 0.17% 0.17%
The result is due to a 13% decrease in 2019-20 property values compared to rate revenue only increasing by the rate cap of 2.50%.
EfficiencyExpenditure levelExpenses per property assessment(Total expenses / Number of property assessments)
$2,601 $2,578 $2,723 $2,952 $3,215 $3,203 $3,132 $3,128Council continues to deliver services in accordance with its long term financial plan. Expenditure has increased primarily due to an increase in materials and services costs.
Revenue levelAverage rate per property assessment(General rates and Municipal charges / Number of property assessments)
New in 2020
New in 2020
New in 2020 $2,006 $2,061 $2,104 $2,146 $2,189
Council's budgeted rate increase in 2019-20 was capped at 2.50%. Council is delivering services in accordance with its long term financial strategy.
RETIREDDimension/Indicator/measure 2017 2018 2019 2020 Comments Average residential rate per residential property assessment[Residential rate revenue / Number of residential property assessments] $2,200 $2,234 $2,314 Retired in
2020As of 1 July 2019, this measure was replaced by Average rate per property assessment.
Asset renewal compared to depreciation[Asset renewal expense / Asset depreciation] x100] 117.56% 137.69% 133.55% Retired in
2020As of 1 July 2019, this measure was replaced by Asset renewal and upgrade expense compared to depreciation.
"non-recurrent grant" means a grant obtained on the condition that it be expended in a specified manner and is not expected to be received again during the period covered by a council's Strategic Resource Plan"own-source revenue" means adjusted underlying revenue other than revenue that is not under the control of council (including government grants)"population" means the resident population estimated by council"rate revenue" means revenue from general rates, municipal charges, service rates and service charges"recurrent grant" means a grant other than a non-recurrent grant"residential rates" means revenue from general rates, municipal charges, service rates and service charges levied on residential properties"restricted cash" means cash and cash equivalents, within the meaning of the AAS, that are not available for use other than for a purpose for which it is restricted, and includes cash to be used to fund capital works expenditure from the previous financial year"unrestricted cash" means all cash and cash equivalents other than restricted cash.
Definitions"adjusted underlying revenue" means total income other than - (a) non-recurrent grants used to fund capital expenditure; and(b) non-monetary asset contributions; and(c) contributions to fund capital expenditure from sources other than those referred to in paragraphs (a) and (b)"adjusted underlying surplus (or deficit)" means adjusted underlying revenue less total expenditure"asset renewal expenditure" means expenditure on an existing asset or on replacing an existing asset that returns the service capability of the asset to its original capability"current assets" has the same meaning as in the AAS"current liabilities" has the same meaning as in the AAS"non-current assets" means all assets other than current assets"non-current liabilities" means all liabilities other than current liabilities
Page 7 of 9
Council Meeting Agenda 24/08/2020
City of Boroondara Attachment 7.9.1 74
DRAFT
Other InformationFor the year ended 30 June 2020
1. Basis of preparationCouncil is required to prepare and include a performance statement within its annual report. The performance statement includes the results of the prescribed sustainable capacity, service performance and financial performance indicators and measures together with a description of the municipal district and an explanation of material variations in the results. This statement has been prepared to meet the requirements of the Local Government Act 1989 and Local Government (Planning and Reporting) Regulations 2014.
Where applicable the results in the performance statement have been prepared on accounting bases consistent with those reported in the Financial Statements. The other results are based on information drawn from council information systems or from third parties (e.g. Australian Bureau of Statistics).
The performance statement presents the actual results for the current year and for the prescribed financial performance indicators and measures, the results forecast by the council’s strategic resource plan. The Local Government (Planning and Reporting) Regulations 2014 requires explanation of any material variations in the results contained in the performance statement. Council has adopted materiality thresholds relevant to each indicator and measure and explanations have not been provided for variations below the materiality thresholds unless the variance is considered to be material because of its nature.
The forecast figures included in the performance statement are based on those adopted by council in its strategic resource plan on 20 July 2020 and which forms part of the council plan. The strategic resource plan includes estimates based on key assumptions about the future that were relevant at the time of adoption and aimed at achieving sustainability over the long term. Detailed information on the actual financial results is contained in the General Purpose Financial Statements. The strategic resource plan can be obtained by contacting council.
Page 8 of 9
Council Meeting Agenda 24/08/2020
City of Boroondara Attachment 7.9.1 75
DRAFTCr Cynthia WatsonMayor
Date: Camberwell
Cr Lisa HollingsworthCouncillor
Date: Camberwell
Phillip StorerChief Executive Officer
Date: Camberwell
Certification of Performance Statement
In my opinion, the accompanying performance statement has been prepared in accordance with the Local Government Act 1989 and the Local Government (Planning and Reporting) Regulations 2014.
Callista Clarke, CPAPrincipal Accounting Officer
Date: Camberwell
In our opinion, the accompanying performance statement of the City of Boroondara for the year ended 30 June 2020 presents fairly the results of council’s performance in accordance with the Local Government Act 1989 and the Local Government (Planning and Reporting) Regulations 2014.
The performance statement contains the relevant performance indicators, measures and results in relation to service performance, financial performance and sustainable capacity.
At the date of signing, we are not aware of any circumstances that would render any particulars in the performance statement to be misleading or inaccurate.
We have been authorised by the council and by the Local Government (Planning and Reporting) Regulations 2014 to certify this performance statement in its final form.
Page 9 of 9
Council Meeting Agenda 24/08/2020
City of Boroondara Attachment 7.9.1 76
LGPRF Performance Indicators - Service Performance IndicatorsFor the year ending 30 June 2020All measures
Measures - based on Financial year Annual 2016-17
Annual 2017-18
Annual 2018-19
Annual 2019-20
Annualdifference2018-19 vs
2019-20
Annual Materiality Threshold
Aquatic facilitiesAF1: User satisfaction with aquatic facilities (optional)(Defined as the satisfaction of users with the aquatic facility). 87 87 85 N/A N/A + / - 5
AF2: Health inspections of aquatic facilities (number of inspections by an authorised officer within the meaning of the Public Health and Wellbeing Act 2008 carried out per Council aquatic facility).
2.00 1.75 2.00 2.00 - + / - 1
AF2.1 SUB KPI: Number of authorised officer inspections of Council aquatic facilities. 8 7 8 8 AF2.2 SUB KPI: Number of Council aquatic facilities. 4 4 4 4
AF6: Utilisation of aquatic facilities (number of visits to aquatic facilities per head of municipal population). 14.5 14.3 14.6 10.3 - 4.3 + / - 3 visits
AF6.1 SUB KPI: Number of visits to aquatic facilities. 2,558,359 2,566,545 2,643,637 1,890,901 AF6.2 SUB KPI: Municipal population. 176,732 179,446 181,289 183,199
AF7: Cost of aquatic facilities(direct cost to Council less any income received for providing aquatic facilities per visit). ($1.01) ($0.82) ($0.88) ($0.03) $0.85 + / - $1
AF7.1 SUB KPI: Direct cost of aquatic facilities less income received. ($2,579,304) ($2,095,776) ($2,327,571) ($54,151)AF7.2 SUB KPI: Number of visits to aquatic facilities. 2,558,359 2,566,545 2,643,637 1,891,171
Comment: CERM surveying was not carried out in early 2020 due to the facilities being closed because of the COVID-19 pandemic.
Comment: Visitations heavily impacted by COVID-19.
Page 1 of 13
Attachment 2
Council Meeting Agenda 24/08/2020
City of Boroondara Attachment 7.9.2 77
LGPRF Performance Indicators - Service Performance IndicatorsFor the year ending 30 June 2020All measures
Measures - based on Financial year Annual 2016-17
Annual 2017-18
Annual 2018-19
Annual 2019-20
Annualdifference2018-19 vs
2019-20
Annual Materiality Threshold
Animal management
AM1: Time taken to action animal requests (Days) (average no. days it has taken for Council to action animal management related requests). 3.86 2.43 1.42 1.58 0.16 + / - 1.5 days
AM1.1 SUB KPI: Number of days between receipt and first response action for all animal management requests. 26,797 20,747 11,667 13,683
AM1.2 SUB KPI: Number of animal management requests. 6,943 8,540 8,194 8,648
AM2: Animals reclaimed (percentage of collected registrable animals under the Domestic Animals Act 1994 reclaimed). 64% 44% 51% 59% 8% + / - 10%
AM2.1 SUB KPI: Number of animals reclaimed. 172 161 159 142 AM2.2 SUB KPI: Number of animals collected (excluding Feral animals). 267 363 312 241
AM5: Animals rehomed(percentage of collected registrable animals under the Domestic Animals Act 1994 that are rehomed).
N/A N/A N/A 10% N/A + / - 30%
AM5.1 SUB KPI: Number of animals rehomed. - - - 25 AM5.2 SUB KPI: Number of animals collected (excluding Feral animals). 267 363 312 241
AM6: Cost of animal management service per population(cost to Council of the animal management service per population). $ 6.86 $ 6.88 $ 7.67 $ 7.73 $ 0.06 + / - $1
AM6.1 SUB KPI: Direct cost of the animal management service. $ 1,212,056 $ 1,234,354 $ 1,390,613 $ 1,415,373 AM6.2 SUB KPI: Municipal population. 176,732 179,446 181,289 183,199
AM7.1 SUB KPI: Number of successful animal management prosecutions. 3 17 6 5AM7.2 SUB KPI: Total number of animal management prosecutions. 3 17 7 5Comment: Measure changed in 2019-20. Historic figures have been updated.
Comment: 2019-20 figures exclude feral animals.
Comment: New measure in 2019-20. Data not available for previous periods.
Comment: Measure changed in 2019-20. Historic figures have been updated.
Page 2 of 13
Attachment 2
Council Meeting Agenda 24/08/2020
City of Boroondara Attachment 7.9.2 78
LGPRF Performance Indicators - Service Performance IndicatorsFor the year ending 30 June 2020All measures
Measures - based on Financial year Annual 2016-17
Annual 2017-18
Annual 2018-19
Annual 2019-20
Annualdifference2018-19 vs
2019-20
Annual Materiality Threshold
Governance
G1: Council resolutions made at meetings closed to the public (percentage of Council resolutions made at an ordinary or special meeting of Council, or at a meeting of a special committee consisting only of Councillors, closed to the public under section 89(2) of the Act).
3.3% 1.1% 2.1% 4.8% 2.7% + / - 3%
G1.1 SUB KPI: Number of Council resolutions made at ordinary or special meetings of Council, or at meetings of a special committee consisting only of Councillors, closed to the public.
9 3 5 9
G1.2 SUB KPI: Number of Council resolutions made at ordinary or special meetings of Council or at meetings of a special committee consisting only of Councillors. 271 266 237 186
G2: Satisfaction with community consultation and engagement (Defined as the community satisfaction rating out of 100 with the consultation and engagement efforts of the council. This includes consulting and engaging directly with the community on key local issues requiring decisions by council).
60 62 62 59 - 3 + / - 5
G3: Councillor attendance at Council meetings (percentage of attendance at ordinary and special Council meetings by Councillors). 99% 98% 97% 98% 1% + / - 10%
G:3.1 SUB KPI: The sum of the number of Councillors who attended each ordinary and special Council meeting. 169 156 145 215
G:3.2 SUB KPI: Number of ordinary and special Council meetings. 17 16 15 22 G:4.2 SUB KPI: Number of Councillors elected at the last Council general election. 10 10 10 10
G4: Cost of elected representation(direct cost of delivering Council's governance service per Councillor). $ 53,607 $ 57,642 $ 55,884 $ 52,684 -$ 3,200 + / - $5,000
G4.1 SUB KPI: Direct cost of the governance service. $ 536,068 $ 576,423 $ 558,836 $ 526,837 G4.2 SUB KPI: Number of Councillors elected at the last Council general election. 10 10 10 10 Performance statement - EXTERNALLY AUDITEDG5: Satisfaction with Council decisions (Defined as the community satisfaction rating out of 100 with how Council has performed in making decisions in the interests of the community).
60 60 62 59 - 3 + / - 5
Page 3 of 13
Attachment 2
Council Meeting Agenda 24/08/2020
City of Boroondara Attachment 7.9.2 79
LGPRF Performance Indicators - Service Performance IndicatorsFor the year ending 30 June 2020All measures
LB1.1 SUB KPI: Number of physical library collection item loans. 2,224,392 2,299,922 2,374,888 1,595,204 LB1.2 SUB KPI: Number of physical library collection items. 460,094 432,794 465,589 431,817
LB2: Recently purchased library collection(number of library collection items purchased in the last 5 years). 49.3% 50.9% 50.7% 47.7% -3.0% + / - 7.5%
LB2.1 SUB KPI: Number of library collection items purchased in the last 5 years. 237,787 237,735 236,132 229,294 LB2.2 SUB KPI: Number of library collection items. 482,457 466,828 465,589 480,375
Performance statement - EXTERNALLY AUDITEDLB4: Active library borrowers in municipality(percentage of the municipal population that are active library borrowers in the last three years).
24.3% 24.9% 25.9% 25.0% -0.9% + / - 5%
LB4.1 SUB KPI: Number of active library borrowers (2 years ago). 39,890 41,498 46,170 44,354 LB4.1 SUB KPI: Number of active library borrowers (1 year ago). 41,498 46,170 44,354 48,648 LB4.1 SUB KPI: Number of active library borrowers (This year). 46,170 44,354 48,648 43,139 LB4.2 SUB KPI: Municipal population (2 years ago). 172,612 174,787 176,732 179,446 LB4.2 SUB KPI: Municipal population (1 year ago). 174,787 176,732 179,446 181,289 LB4.2 SUB KPI: Municipal population (This year). 176,732 179,446 181,289 183,199
LB5: Cost of library service per population(direct cost to Council of the library service per population). $ 44.53 $ 46.05 $ 50.39 $ 49.71 -$ 0.69 + / - $10
LB5.1 SUB KPI: Direct cost to Council of the library Service. $ 7,869,032 $ 8,263,016 $ 9,135,694 $ 9,106,404 LB5.2 SUB KPI: Municipal population. 176,732 179,446 181,289 183,199
Comment: All libraries closed in April and May, re-opening with significantly reduced services in June 2020 due to COVID 19. A book delivery service for Boroondara residents was implemented during the closure with very positive feedback from the community.
Comment: Measure changed in 2019-20 from ‘Active library members’ to ‘Active library borrowers’ with changes to the numerator and the denominator to extend the calculation to the last three years. Updated historic data to reflect the change.
Page 4 of 13
Attachment 2
Council Meeting Agenda 24/08/2020
City of Boroondara Attachment 7.9.2 80
LGPRF Performance Indicators - Service Performance IndicatorsFor the year ending 30 June 2020All measures
Measures - based on Financial year Annual 2016-17
Annual 2017-18
Annual 2018-19
Annual 2019-20
Annualdifference2018-19 vs
2019-20
Annual Materiality Threshold
Maternal and Child Health
MC2: Infant enrolments in the MCH service (percentage of infants enrolled in the MCH). 102% 101% 101% 102% 1% + / - 10%
MC2.1 SUB KPI: Number of infants enrolled in the MCH service 1,509 1,434 1,413 1,370 MC2.2 SUB KPI: Number of birth notifications received. 1,485 1,414 1,400 1,349
MC3: Cost of the MCH service (cost to Council of the MCH service per hour of service delivered). $ 71.32 $ 72.34 $ 70.72 $ 71.89 $1.17 + / - $15
LGPRF (MC3.1) SUB KPI: Cost to Council of the MCH service. $ 1,926,437 $ 1,953,928 $ 2,192,636 $ 2,324,010 LGPRF (MC3.2) SUB KPI: Hours worked by MCH nurses. 27,012 27,012 31,004 32,328
Performance statement - EXTERNALLY AUDITEDMC4: Participation in the MCH service(percentage of children enrolled who participate in the MCH service). 79% 80% 83% 82% -1% + / - 10%
MC4.1 SUB KPI: Number of children who attend the MCH service at least once (in the year). 5,058 4,849 4,864 4,646
MC4.2 SUB KPI: Number of children enrolled in the MCH service. 6,427 6,063 5,877 5,664
MC5: Participation in MCH service by aboriginal children(percentage of Aboriginal children enrolled who participate in the MCH service). 100% 96% 88% 100% 12% + / - 10%
MC5.1 SUB KPI: Number of aboriginal children who attend the MCH service at least once (in the year). 15.5 24.5 11.0 17.5
MC5.2 SUB KPI: Number of aboriginal children enrolled in the MCH service. 15.5 25.5 12.5 17.5
MC6: Participation in 4-week Key Age and Stage visit(percentage of infants enrolled in the MCH service who receive the first home visit). N/A N/A N/A 99% N/A + / - 10%
MC6.1 SUB KPI: Number of 4-week key age stage visits. - - - 1,340 MC1.2 SUB KPI: Number of birth notifications received. 1,485 1,414 1,400 1,349
Comment: Target exceeded. All children who identify as Aboriginal have attended all required Key Age and Stage visits.
Comment: New measure in 2019-20. Data not available for previous periods.
Page 5 of 13
Attachment 2
Council Meeting Agenda 24/08/2020
City of Boroondara Attachment 7.9.2 81
LGPRF Performance Indicators - Service Performance IndicatorsFor the year ending 30 June 2020All measures
Measures - based on Financial year Annual 2016-17
Annual 2017-18
Annual 2018-19
Annual 2019-20
Annualdifference2018-19 vs
2019-20
Annual Materiality Threshold
Roads
R1: Sealed local road requests (Number of sealed local road requests per 100 kilometres of sealed local road). 91.8 90.5 63.2 66.8 3.6 + / - 20
requestsR1.1 SUB KPI: Number of sealed local road requests. 515 509 355 378 R1.2 SUB KPI: Kilometres of sealed local roads. 561 562 562 566
R2: Sealed local roads below the intervention level (percentage of sealed local roads that are below the renewal intervention level set by Council and not requiring renewal).
98.0% 97.5% 97.5% 95.8% -1.7% + / - 10%
R2.1 SUB KPI: Number of kilometres of sealed local roads below the renewal intervention level set by Council. 550 548 548 541
R2.2 SUB KPI: Kilometres of sealed local roads. 561 562 562 565
R3: Cost of sealed local road reconstruction (direct reconstruction cost to Council per square metre of sealed local roads reconstructed). $ 86.2 $ 93.5 $ 90.6 $ 91.5 $0.9 + / - $25
R3.1 SUB KPI: Direct cost of sealed local road reconstruction. $ 5,188,844 $ 5,180,737 $ 7,135,806 $ 5,254,947 R3.2 SUB KPI: Square metres of sealed local roads reconstructed. 60,226 55,434 78,786 57,434
R4: Cost of sealed local road resealing (direct resealing cost to Council per square metre of sealed local roads resealed). $ 19.73 $ 24.18 $ 19.60 $ 20.16 $0.56 + / - $10
R4.1 SUB KPI: Direct cost of sealed local road resealing. $ 5,707,563 $ 2,115,506 $ 3,449,828 $ 4,339,232 R4.2 SUB KPI: Square metres of sealed local roads resealed. 289,319 87,507 175,986 215,231
Performance statement - EXTERNALLY AUDITEDR5: Satisfaction with sealed local roads (defined as the community satisfaction rating out of 100 with how Council has performed on the condition of sealed local roads).
71 73 71 72 1 + / - 5
Page 6 of 13
Attachment 2
Council Meeting Agenda 24/08/2020
City of Boroondara Attachment 7.9.2 82
LGPRF Performance Indicators - Service Performance IndicatorsFor the year ending 30 June 2020All measures
Measures - based on Financial year Annual 2016-17
Annual 2017-18
Annual 2018-19
Annual 2019-20
Annualdifference2018-19 vs
2019-20
Annual Materiality Threshold
Statutory PlanningSP1: Time taken to decide planning applications (median number of days between receipt of a planning application and a decision on the application).
89 105 119 98 -21 + / - 20 days
SP2: Planning applications decided within required timeframes(percentage of planning application decisions made within required timeframes). 64.0% 59.7% 65.4% 73.8% 8.4% + / - 7.5%
SP2.1 SUB KPI: Number of planning application decisions made within required timeframes. 1,138 911 1,006 970 SP2.2 SUB KPI: Number of planning application decisions made. 1,777 1,527 1,539 1,314
SP3: Cost of statutory planning service (direct cost to Council of the statutory planning service per planning application). $ 3,247 $ 3,472 4,019 $ 3,740 -$ 279 + / - $350
SP3.1 SUB KPI: Direct cost of the statutory planning service. $ 4,643,144 $ 4,864,095 $ 4,883,176 $ 5,004,156 SP3.2 SUB KPI: Number of planning applications received. 1,430 1,401 1,215 1,338
Performance statement - EXTERNALLY AUDITEDSP4: Council planning decisions upheld at VCAT (percentage of planning application decisions subject to review by VCAT and that were not set aside).
52.2% 51.9% 40.8% 49.5% 8.7% + / - 10%
SP4.1 SUB KPI: Number of VCAT decisions that did not set aside Council's decision in relation to a planning application. 35 40 31 49
SP4.2 SUB KPI: Number of VCAT decisions in relation to planning applications. 67 77 76 99
Comment: The reduction in median time compared to 2018/19 reflects the slowing of the housing and commercial property markets as well as the COVID-19 pandemic, which has led to less larger and more complex planning applications being lodged. It is also a reflection of the improved average processing times achieved for the year.
Comment: Measure changed in 2019-20 to include total applications in the denominator.
Comment: The increase in the percentage of applications processed within the specified time frames is a result of the reduction in overall application numbers as a result of the slowing housing and commercial property markets, improved processing times and the implementation of measures to improve timeframes for minor VicSmart planning applications.
Page 7 of 13
Attachment 2
Council Meeting Agenda 24/08/2020
City of Boroondara Attachment 7.9.2 83
LGPRF Performance Indicators - Service Performance IndicatorsFor the year ending 30 June 2020All measures
Measures - based on Financial year Annual 2016-17
Annual 2017-18
Annual 2018-19
Annual 2019-20
Annualdifference2018-19 vs
2019-20
Annual Materiality Threshold
Waste collection
WC1: Kerbside bin collection requests (number of kerbside bin collection requests per 1,000 kerbside bin collection households). 168.32 197.09 210.99 328.53 117.54 + / - 20
requestsWC1.1 SUB KPI: Number of kerbside garbage and recycling bin collection requests. 11,132 13,066 13,940 21,726 WC1.2 SUB KPI: Number of kerbside bin collection households. 66,136 66,296 66,068 66,130
WC2: Kerbside collection bins missed (number of kerbside collection bins missed per 10,000 scheduled kerbside collection bin lifts). 4.09 6.54 6.45 14.86 8.41 + / - 5 bins
WC2.1 SUB KPI: Number of kerbside garbage and recycling collection bins missed. 2,680 4,301 4,253 9,422 WC2.2 SUB KPI: Number of scheduled kerbside garbage and recycling collection bin lifts. 6,551,259 6,577,077 6,591,026 6,340,812
WC3: Cost of kerbside garbage collection service (direct cost of the kerbside garbage bin collection service per kerbside garbage collection bin). $ 119.83 $ 121.79 $ 123.89 $ 139.81 $ 15.92 + / - $20
WC3.1 SUB KPI: Direct cost of the kerbside garbage bin collection service. $ 7,683,231 $ 7,810,061 $ 7,899,769 $ 8,927,996 WC3.2 SUB KPI: Number of kerbside garbage collection bins. 64,116 64,127 63,764 63,860
WC4: Cost of kerbside recyclables bin collection service (direct cost of the kerbside recyclables collection service per kerbside recyclables collection bin).
$ 33.19 $ 46.99 $ 74.96 $ 84.08 $ 9.12 + / - $10
WC4.1 SUB KPI: Direct cost of the kerbside recyclables bin collection service. $ 2,035,384 $ 2,948,367 $ 4,716,842 $ 5,308,482 WC4.2 SUB KPI: Number of kerbside recyclables collection bins. 61,324 62,745 62,924 63,139
Comment:
Comment: Comment required
Comment: The introduction of the new FOGO service including a change to the collection frequency of garbage bins. This resulted in elevated customer requests for missed bins during the changeover period.
Comment: The introduction of the new FOGO service including a change to the collection frequency of garbage bins. This resulted in elevated customer requests for missed bins during the changeover period.
Page 8 of 13
Attachment 2
Council Meeting Agenda 24/08/2020
City of Boroondara Attachment 7.9.2 84
LGPRF Performance Indicators - Service Performance IndicatorsFor the year ending 30 June 2020All measures
Measures - based on Financial year Annual 2016-17
Annual 2017-18
Annual 2018-19
Annual 2019-20
Annualdifference2018-19 vs
2019-20
Annual Materiality Threshold
Performance statement - EXTERNALLY AUDITEDWC5: Kerbside collection waste diverted from landfill (percentage of garbage, recyclables and green organics collected from kerbside bins that is diverted from landfill).
48.81% 48.70% 48.67% 53.09% 4.43% + / - 10%
WC5.1 SUB KPI: Weight of recyclables and green organics collected from kerbside bins. 34,939 33,874 32,835 38,051 WC5.2 SUB KPI: Weight of garbage, recyclables and green organics collected from kerbside bins. 71,580 69,559 67,468 71,669
Food safetyFS3: Cost of food safety service (direct cost to Council of the food safety service per food premises registered by Council, or for which Council has received notification during the year).
$ 444 $ 398 $ 351 $ 366 $15 + / - $75
FS3.1 SUB KPI: Direct cost of food safety service. $ 929,800 $ 868,113 $ 798,050 $ 814,874 FS3.2 SUB KPI: Number of food premises registered or notified in accordance with the Food Act 1984. 2,094 2,182 2,276 2,229
Page 9 of 13
Attachment 2
Council Meeting Agenda 24/08/2020
City of Boroondara Attachment 7.9.2 85
LGPRF Performance Indicators - Service Performance IndicatorsFor the period ending 30 June 2020
All measures
Measures - based on Calendar year Annual 2016
Annual 2017
Annual 2018
Annual 2019
Q2 YTD2019
Q2 YTD2020
Q2 YTD Difference
Annual Materiality Threshold
Food safetyFS1: Time taken to action food complaints (applicable from 1 July 2015)(average no. days taken for Council to action food complaints received from members of the public about the safety or handling of food for sale).
1.50 1.70 1.70 1.66 1.20 1.60 0.40 + / - 2 days
FS1.1 SUB KPI: Number of days between receipt and first response action for all food complaints. 120 241 260 283 102 104
FS1.2 SUB KPI: Number of food complaints. 80 142 153 170 85 65
FS2: Food safety assessments (percentage of registered class 1 food premises and class 2 food premises that receive an annual food safety assessment).
100% 100% 100% 100% 100% 100% 0% + / - 10%
FS2.1 SUB KPI: Number of registered class 1 food premises and class 2 food premises that receive an annual food safety assessment in accordance with the Food Act 1984.
956 962 968 961 988 963
FS2.2 SUB KPI: Number of registered class 1 food premises and class 2 food premises that require an annual food safety assessment in accordance with the Food Act 1984.
956 962 968 961 988 963
Performance statement - EXTERNALLY AUDITEDFS4: Critical and major non-compliance notifications (percentage of critical and major non-compliance outcome notifications that are followed up by Council).
99% 99% 99% 99% 99% 93% -5% + / - 10%
FS4.1 SUB KPI: Number of critical non-compliance notifications and major non-compliance notifications about a food premises followed up. 490 451 396 427 213 100
FS4.2 SUB KPI: Number of critical non-compliance notifications and major non-compliance notifications about food premises. 493 454 401 431 216 107
Comment: Although Council endeavours to follow up all critical and major non-compliance notifications within the specified timeframes, due to the impact of the COVID-19 pandemic some food premises have not been operating at the time of the scheduled follow up inspection. Officers have been engaging with food premises proprietors to ensure follow up inspections occur prior to the business reopening when COVID-19 restrictions ease.
Sustainable Capacity IndicatorsPopulationExpenses per head of municipal population $1,120 $1,109 $1,167 $1,265 $98 + / - $200
[Total expenses / Municipal population]
Infrastructure per head of municipal population $4,776 $4,720 $4,772 $4,903 $131 + / - $1,000 [Value of infrastructure / Municipal population]
Population density per length of road 314.50 318.59 321.86 323.22 1.37 + / - 10 people [Municipal population / Kilometres of local roads]
Own-source revenue
Own-source revenue per head of municipal population $1,161 $1,180 $1,206 $1,214 $8 + / - $100 [Own-source revenue / Municipal population]
Recurrent grants
Recurrent grants per head of municipal population $99 $86 $79 $73 -$5 + / - $50 [Recurrent grants / Municipal population]
Disadvantage
Relative Socio-Economic Disadvantage 10.00 10.00 10.00 10.00 0.00 + / - 1 decile [Index of Relative Socio-Economic Disadvantage by decile]
Workforce turnover
Percentage of staff turnover 12.1% 11.4% 8.1% 9.5% 1.3% + / - 2%[Number of permanent staff resignations and terminations / Average number of permanent staff for the financial year] x100
ObligationsLoans and borrowings Loans and borrowings compared to rates 29.6% 26.2% 14.7% 13.2% -1.5% + / - 10%
[Interest bearing loans and borrowings / Rate revenue] x100Loans and borrowings repayments compared to rates 4.0% 3.9% 11.3% 1.6% -9.7% + / - 2%
[Interest and principal repayments on interest bearing loans and borrowings / Rate revenue] x100
Indebtedness Non-current liabilities compared to own source revenue 23.3% 14.3% 13.4% 15.9% 2.5% + / - 5%
[Non-current liabilities / Own source revenue] x100Asset renewal and upgrade *Asset renewal and upgrade compared to depreciation New in 2020 New in 2020 New in 2020 126.8% New in 2020 + / - 30%
[Asset renewal and asset upgrade expense / Asset depreciation] x100
[Rate revenue / Capital improved value of rateable properties in the municipality] x100
* This is an annual indicator. Timing of revenue and expenditure can vary throughout the year, distorting quarterly results.1. Expenses per property assessment and Adjusted underlying surplus (or deficit):In response to the COVID-19 pandemic, there have been impacts on revenue and expenditure streams for 2019-20 and the 2020-21 Budget. This includes $4.50 million of Council's financial assistancesupport for residents, local business and community groups.
Attachment 2
Council Meeting Agenda 24/08/2020
City of Boroondara Attachment 7.9.2 89
Attachment 3
Page 1 of 5
Governance and Management Checklist(as at 30 June 2020)
Governance and Management Items Assessment Outcome
1 Community engagement policy (policy outlining Council’s commitment to engaging with the community on matters of public interest)
Policy
Date of operation of current policy
YES
10/12/2015
2 Community engagement guidelines (guidelines to assist staff to determine when and how to engage with the community)
Guidelines
Date of operation of current guidelines
YES
10/12/2015
3 Strategic Resource Plan (plan under section 126 of the Act outlining the financial and non-financial resources required for at least the next 4 financial years)
Adopted in accordance with section 126 of the Act
Date of adoption
YES
20/07/2020
4 Annual budget (plan under section 130 of the Act setting out the services to be provided and initiatives to be undertaken over the next 12 months and the funding and other resources required)
Adopted in accordance with section 130 of the Act
Date of adoption
YES
20/07/2020
5 Asset management plans (plans that set out the asset maintenance and renewal needs for key infrastructure asset classes for at least the next 10 years)
Plans
Date of operation of current plans
Roads Asset Management Plan
Buildings Asset Management Plan
Paths Asset Management Plan
Drainage Asset Management Plan
Open Space Asset Management Plan
YES
February 2016
August 2017
September 2016
September 2017
June 2016
6 Rating strategy (strategy setting out the rating structure of council to levy rates and charges)
Strategy
Date of operation of current strategy
YES
26/06/2017
7 Risk policy (policy outlining Council’s commitment and approach to minimising the risks to Council’s operations)
Policy
Date of operation of current policy
YES
25/02/2019
Council Meeting Agenda 24/08/2020
City of Boroondara Attachment 7.9.3 90
Attachment 3
Page 2 of 5
Governance and Management Items Assessment Outcome
8 Fraud policy (policy outlining Council’s commitment and approach to minimising the risk of fraud)
Policy
Date of operation of current policy
YES
02/01/2020
9 Municipal emergency management plan (plan under section 20 of the Emergency Management Act 1986 for emergency prevention, response and recovery)
Prepared and maintained in accordance with section 20 of the Emergency Management Act 1986
Date of preparation
YES
29/05/2020
10 Procurement policy (policy under section 186A the Act outlining the matters, practices and procedures that will apply to all purchases of goods, services and works)
Prepared and approved in accordance with Section 186A of the Act
Date of approval
YES
22/06/2020
Council Meeting Agenda 24/08/2020
City of Boroondara Attachment 7.9.3 91
Attachment 3
Page 3 of 5
Governance and Management Items Assessment Outcome
11 Business continuity plan (plan setting out the actions that will be undertaken to ensure that key services continue to operate in the event of a disaster)
Plan
Date of operation of current plan
People Culture & Development
Governance
Health, Active Aging and Disability
Family, Youth and Recreation
Arts and Culture
Finance and Corporate Planning
Library Services
Community Planning and Development
Chief Customer Office and Strategic Communications
Change Management, Project Management Office and Business Process Optimisation
Building Services
Local Laws
Statutory Planning
Commercial and Property Services
Parks and Infrastructure -Riversdale Depot and Kew Deport
Asset Management
Traffic and Transport
Projects and Strategy
Environment and Sustainable Living
Yes
November 2019
November 2019
November 2019
November 2019
November 2019
November 2019
November 2019
September 2018
November 2019
September 2018
November 2019
November 2019
September 2018
November 2019
January 2020
September 2018
May 2019
May 2019
May 2019
Council Meeting Agenda 24/08/2020
City of Boroondara Attachment 7.9.3 92
Attachment 3
Page 4 of 5
Governance and Management Items Assessment Outcome
12 Disaster recovery plan (plan setting out the actions that will be undertaken to recover and restore business capability in the event of a disaster)
Plan
Date of operation of current plan
YES
08/11/2019
13 Risk management framework (framework outliningCouncil’s approach to managing risks to the Council’s operations)
Framework
Date of operation of current framework
YES
25/02/2019
14 Audit committee (Advisory committee of Council under section 139 of the Act whose role is to oversee the integrity of Council’s financial reporting, processes to manage risks to the Council’s operations and for compliance with applicable legal, ethical and regulatory requirements)
Established in accordance with section 139 of the Act
Date of establishmentNote: Boroondara has had an Audit Committee from the date of its establishment.
The Audit Committee Charter is reviewed annually.Councillor Committee members are nominated by Council on an annual basis.The current Audit Committee Charter was adopted by Council on 11 June 2019.
YES
11/06/2019
15 Internal audit (independent accounting professionals engaged by the Council to provide analyses and recommendations aimed at improving Council’s governance, risk and management controls)
Engaged
Date of engagement of current provider
YES
01/10/2017
16 Performance reporting framework (a set of indicators measuring financial and non-financial performance including the performance indicators referred to in section 131 of the act)
Framework
Date of operation of current framework
YES
23/06/2015
17 Council plan reporting (report reviewing the performance of the Council against the Council Plan including the results in relation to the strategic indicators, for the first six months of the financial year)
Report
Date of operation of current report
YES
24/02/2020
18 Financial reporting (quarterly statements to Council under section 138 of the Act comparing budgeted revenue and expenditure with actual revenue and expenditure)
Statements presented to Council in accordance with section 138(1) of the Act
Date statements presented
YES
25/05/2020
24/02/2020
25/11/2019
26/08/2019
Council Meeting Agenda 24/08/2020
City of Boroondara Attachment 7.9.3 93
Attachment 3
Page 5 of 5
Governance and Management Items Assessment Outcome
19 Risk reporting (six-monthly reports of strategic risks to Council’s operations, their likelihood and consequences of occurring and risk minimisation strategies)
Reports
Date of reports
YES
13/11/2019
12/05/2020
20 Performance reporting (six-monthly reports of indicators measuring the results against financial and non-financial performance, including the performance indicators referred to in section 131 of the Act)
Reports
Date of reports
YES
25/05/2020
24/02/2020
25/11/2019
26/08/2019
21 Annual report (annual report under sections 131, 132 and 133 of the Act to the community containing a report of operations and audited financial and performance statements)
Considered at a meeting of Council in accordance with section 134 of the Act
Date of consideration
YES
28/10/2019
22 Councillor Code of Conduct (Code under section 76C of the Act setting out the conduct principles and the dispute resolution process to be followed by all councillors)
Reviewed in accordance with section 76C of the Act
Date reviewed
YES
13/02/2017
23 Delegations (a document setting out the powers, duties and functions of Council and the Chief Executive Officer that have been delegated to members of staff)
Reviewed in accordance with section 98(6) of the Act
Date reviewed
Council to CEO
Council to Staff
Council to Committees
YES
01/06/2020
23/09/2019
27/02/2017
24 Meeting procedures (a local law governing the conduct of meetings of Council and special committees)
Meeting procedures local law made in accordance with section 91(1) of the Act