40
Official Publication of the Society for Information Display • www.informationdisplay.org

Official Publication of the Society for Information Display • www.informationdisplay.org
Jan-Feb Cover RJT_SID Cover 1/9/2017 8:24 PM Page 1

Radiant.InformationDisplay11.2015_outlines.indd 1 11/12/2015 3:06:34 PM

2 Editorial: Vision for a New Yearn By Stephen P. Atwood
3 Industry News: Samsung Buys Harman Internationaln By Jenny Donelan
4 Guest Editorial: Display Imagery vs. Real Imageryn By Martin S. Banks
6 Frontline Technology: Head-Mounted-Display Tracking for Augmented andVirtual RealityHead tracking is a key technical component for AR and VR applications that use head-mounted displays. Many different head-tracking systems are currently in use, but onecalled “inside-out” tracking seems to have the edge for consumer displays. n By Michael J. Gourlay and Robert T. Held
12 Frontline Technology: Visible Artifacts and Limitations in Stereoscopic 3DDisplaysStereoscopic 3D (S3D) displays send slightly different images to both eyes and thereby create an additional sense of depth compared to conventional non-stereoscopic displays.Nearly all direct-view S3D displays accomplish this by using either temporal interlacing,which alternates the images of the two eyes in time, or spatial interlacing, which alternatesthe images on a row-by-row (or column-by-column) basis. The two methods each havelimitations, but it is possible to design S3D displays that minimize these.n By Paul V. Johnson, Joohwan Kim, and Martin S. Banks
18 Frontline Technology: Accurate Image-Based Estimates of Focus Error in theHuman Eye and in a Smartphone CameraEstimation of focus error is a key consideration in the design of any advanced image-capturesystem. Today’s contrast-based auto-focus algorithms in digital cameras perform more slowlyand less accurately than the human eye. New methods for estimating focus error can closethe gap. By making use of optical imperfections, like chromatic aberration, these new methods could significantly improve the performance of digital auto-focusing techniques.n By Johannes Burge
24 Market Insights: ID Interviews David Fattal, Founder and CEO of LEIA, Inc.David Fattal was the principal investigator of the LEIA project at HP Labs, from where heled a spin-off in late 2013 to co-found LEIA, Inc.n By Jenny Donelan
26 Frontline Technology: Quantifying Display Coating AppearanceModern displays often utilize anti-reflection coatings to enhance contrast and improvereadability. However, display manufacturers have unique requirements for coatings notfound in other industries. New metrology instrumentation has been designed to obtain the necessary measurements for display makers and to work with the thin glass substratesincreasingly employed in display fabrication. n By Trevor Vogt
32 SID News: SID Revises Governance Structure
36 Corporate Members and Index to Advertisers
Information Display 1/17 1
JANUARY/FEBRUARY 2017VOL. 33, NO. 1
InformationDISPLAYcontents
For Industry News, New Products, Current and Forthcoming Articles, see www.informationdisplay.org
INFORMATION DISPLAY (ISSN 0362-0972) is published 6 times ayear for the Society for Information Display by Palisades ConventionManagement, 411 Lafayette Street, 2nd Floor, New York, NY 10003;William Klein, President and CEO. EDITORIAL AND BUSINESSOFFICES: Jay Morreale, Editor-in-Chief, Palisades ConventionManagement, 411 Lafayette Street, 2nd Floor, New York, NY 10003;telephone 212/460-9700. Send manuscripts to the attention of theEditor, ID. SID HEADQUARTERS, for correspondence on sub-scriptions and membership: Society for Information Display, 1475 S. Bascom Ave., Ste. 114, Campbell, CA 95008; telephone 408/879-3901, fax -3833. SUB SCRIP TIONS: Information Display is distributedwithout charge to those qualified and to SID members as a benefit ofmembership (annual dues $100.00). Subscriptions to others: U.S. &Canada: $75.00 one year, $7.50 single copy; elsewhere: $100.00 oneyear, $7.50 single copy. PRINTED by Wiley & Sons. PERMISSIONS:Abstracting is permitted with credit to the source. Libraries are per-mitted to photocopy beyond the limits of the U.S. copyright law forprivate use of patrons, providing a fee of $2.00 per article is paid to theCopyright Clearance Center, 21 Congress Street, Salem, MA 01970(reference serial code 0362-0972/17/$1.00 + $0.00). Instructors arepermitted to photocopy isolated articles for noncommercial classroomuse without fee. This permission does not apply to any special reportsor lists published in this magazine. For other copying, reprint orrepublication permission, write to Society for Information Display, 1475S. Bascom Ave., Ste. 114, Campbell, CA 95008. Copyright © 2017Society for Information Display. All rights reserved.
In the Next Issue ofInformation Display
Display Week 2017 Preview andMaterials• 2017 SID Honors & Awards• DW Symposium Preview• Progress in TADF Emitters• High-Mobility TFTs for Flexible Electronics
• Top 10 Display Discoveries at GES
SIDSOCIETY FOR INFORMATION DISPLAY
Official Publication of the Society for Information Display • www.informationdisplay.org
Cover Design: Jodi Buckley3D smartphone illustration coutesy of LEIA, Inc.
ON THE COVER: It is an exciting time to beinvolved in the design, construction, and evalua-tion of visual displays. Recent developments in3D imaging have presented great challenges butalso breathtaking opportunites that will greatlyenhance the viewer experience.
ID TOC Issue1 p1_Layout 1 1/2/2017 10:32 PM Page 1

Vision for a New Year
by Stephen P. Atwood
Happy New Year and welcome to 2017. By the time youread this, many of us will be back from Seattle, where weassembled the technical program for this year’s DisplayWeek Symposium to be held in Los Angeles, May 21–26. I strongly suggest marking your calendar now and makingyour reservations soon. This year is sure to be another
“don’t-miss” event with many new developments to see and hear. Thus far, the papersubmission count is over 600, with a very high number focused on Virtual Reality(VR), Augmented Reality (AR), and holography/3D displays of various forms. Whenwe started covering this topic a few years ago in ID, I said that the innovations wouldstart coming fast once certain foundational technology problems were overcome. Thatprediction is looking like a safer bet every season. Of course, tomorrow is not goingto bring the holodeck or the real-time light-field projection TV to your living room,but I think we are on the verge of seeing credible commercial endeavors. These includehead-worn AR/VR technology and possibly a new concept that Intel terms “MergedReality” (MR). The definition of success might be fluid, with leading-edge applications such as
gaming, social media, and entertainment novelties driving initial demand. Surely,some hardware providers will be overly eager to push new things to market to satisfyinvestors. But, unlike stereoscopic TV, I do not think this is going to flash and fade. I think the potential to create or enhance so many applications, along with solving current limitations in our existing user-interface world, will combine with the rapidlygrowing pool of hardware and software components to produce an unstoppable wave. An example of this is on our cover, which shows a typical user trying to find their
way in downtown Manhattan – an experience I believe most of us can relate to. Tradi-tional navigation tools are good today, showing 2D maps and usually providing decentturn-by-turn directions. However, it is easy to see how a true 3D rendering of theentire area, with building sizes shown to actual scale, would dramatically enhance thevalue and accessibility of the application. We present this example thanks to the generosity of our friends at LEIA, Inc., a technology spinoff from HP Labs. The display shown is one of their technology illustrations which we were inspired to usebased on our interview with LEIA Founder and CEO David Fattal, which appears inthis issue. I think it is fair to predict that consumers would line up in large numbers to buy a smartphone with this feature in its display. We could debate whether the mostuseful application would be 3D navigation or something else, but I am confident thisdisplay capability, especially if combined with some type of 3D gesture sensing,would be a major value to consumers.Our issue theme this month is Applied Vision, and in that context we bring to you
three features developed by our Guest Editor Martin (Marty) Banks, professor ofoptometry, vision science, psychology, and neuroscience at UC Berkeley. In his Guest Editorial titled “Display Imagery vs. Real Imagery,” Martin talks about a “Turing Test” for 3D displays in which a user would be challenged to decide if theywere viewing a real scene or one created by a display. It is tempting to dismiss thelikelihood of us ever being fooled in such a way, but for the sake of argument I chooseto believe that this is indeed a possibility.
2 Information Display 1/17
Executive Editor: Stephen P. Atwood617/306-9729, [email protected]
Editor-in-Chief: Jay Morreale212/46 0-9700, [email protected]
Managing Editor: Jenny Donelan603/924-9628, [email protected]
Global Advertising Director: Stephen Jezzard, [email protected]
Senior Account ManagerPrint & E Advertising: Roland Espinosa201-748-6819, [email protected]
Editorial Advisory BoardStephen P. Atwood, ChairAzonix Corp., U.S.A.
Helge SeetzenTandemLaunch Technologies, Westmont, Quebec,Canada
Allan KmetzConsultant, U.S.A.
Larry WeberConsultant, U.S.A.
Guest EditorsApplied VisionMartin Banks, University of California at Berkeley
Automotive DisplaysKarlheinz Blankenbach, Pforzheim University
Digital Signage Gary Feather, NanoLumens
MaterialsIon Bita, Apple
Wearables/FlexibleRuiqing (Ray) Ma, Universal Display Corp.
Light-Field and Holographic SystemsNikhil Balram, Google
Contributing EditorsAlfred Poor, ConsultantSteve Sechrist, ConsultantPaul Semenza, ConsultantJason Heikenfeld, University of Cincinnati Raymond M. Soneira, DisplayMate Technologies
InformationDISPLAY
The opinions expressed in editorials, columns, and feature articles do not necessarily reflect the opinions ofthe Executive Editor or Publisher of Information DisplayMagazine, nor do they necessarily reflect the position ofthe Society for Information Display.
editorial
(continued on page 34)
ID Editorial Issue1 p2,34_Layout 1 1/2/2017 7:42 PM Page 2

Samsung Buys HarmanInternational Late last year, Samsung Electronics and HarmanInternational Industries announced that Samsung would acquire Harman International,a company specializing in audio and “info-tainment” solutions, for approximately $8 billion. In a press release, Samsung stated that the
transaction was designed to make it a signifi-cant presence in the market for connectedtechnologies, and particularly in automotiveelectronics, which Samsung refers to as a“strategic priority.”1 More than 30 millionvehicles are currently equipped with Harman’s connected car and audio systems. According to a recent article in Forbes,
although Harman is most commonly associ-ated with premium audio equipment, roughly65% of the firm’s $7 billion in revenues (forthe 12 months ending September 2016) actu-ally came from supplying components anddeveloping software for auto manufacturers,including navigation systems, infotainment, telematics, and driver-assistance technologies.2
Forbes also suggested that this is a move todiversify Samsung’s portfolio beyond smart-phones in the wake of last year’s Galaxy Note7 discontinuation. In any event, Samsung’ssignificant investment demonstrates a strongcommitment to the connected and automotivemarkets in the short- and long-term future. As outlined in an investors’ presentation, thecompanies’ complementary technologies openup possibilities for shared applications amongmobile devices, cars, public venues, smarthomes, and more.
______1https://news.samsung.com/global/samsung-electronics-to-acquire-harman-accelerating-growth-in-automotive-and-connected-technologies2http://www.forbes.com/sites/greatspeculations/2016/11/16/why-samsung-is-buying-harman/#2ab36c9323b3
Osram Intros World’s FirstBroadband Infrared LED Osram Opto Semiconductors is utilizing converter technology for infrared emitters toproduce an LED that emits broadband infrared
light in a wavelength range from 650 to 1,050 nm.The main target application for the technologyat this time is near-infrared spectroscopy formeasuring fat, protein, water, or sugar contentin food, in a format that can be used at theconsumer level.
Infrared spectroscopy detects the character-istic absorption behavior of certain molecularcompounds. If a defined spectrum is directedat a sample, it is possible to determine thepresence and quantity of certain ingredients
(continued on page 35)
Information Display 1/17 3
industry news
Connecting the Quantum Dots
Nanoco Acquires Quantum-Dot Patents from KodakNanoco Group plc, a developer and manufacturer of cadmium-free quantum dotsand other nanomaterials, recently announced the acquisition of a group of patentsfrom the Eastman Kodak Company in connection with the use of quantum dots inelectroluminescent displays.According to Nanoco, this patent acquisition reinforces its intellectual propertyposition in quantum-dot electroluminescent displays (QLEDs), a technology withwhich the company hopes to replace the current materials in organic light-emitting-diode (OLED) displays.Michael Edelman, Nanoco’s Chief Executive Officer, said: “This patent purchasefrom Kodak broadens our intellectual-property estate and commercial position infuture display technologies. The vast majority of current displays are based on LCDtechnology, and we expect LCDs to dominate display sales in the near and mediumterm. In the longer term, QLED displays could challenge current OLED displays andwe aim to have a strong competitive position in this space in preparation for anymarket change. Our current focus remains driving near-term revenue from the sup-ply to the LCD industry of the company’s cadmium-free quantum dots manufacturedand marketed by Nanoco and our licensees, Dow, Merck and Wah Hong.” The com-mercial terms of the patent acquisition are undisclosed.Samsung Acquires QD VisionIn late November, Samsung announced the pending acquisition of Massachusetts-based quantum-dot-developer QD Vision. Samsung did not confirm the exact valueof the deal but it is estimated to be approximately $70 million or 82.14 billion won.According to a recent article about the acquisition in The Korea Times, Samsunghas been the global TV market leader for 11 consecutive years and is acquiring theQD Vision technology in order to strengthen the technological edge of the quantum-dot TVs it already sells. In particular, noted The Times, the latest announcement isexpected to heat up the already-intense rivalry between Samsung and (OLED cham-pion) LG over the next standard for the TV industry.3QD Vision was founded by MIT researchers in 2004 and has to date partneredwith TV manufacturers including China’s TCL and Hisense and Japan’s Sony of Japan.Samsung Electronics also announced that it would be collaborating with QD Visionin such areas as heavy metal-free quantum-dot technologies. ________________________3https://www.koreatimes.co.kr/www/news/tech/2016/11/133_218800.html
Quantum dots, a “hot” display technology for a couple of years now, isshowing some movement in terms of major players. Below are some briefannouncements. It may be too early to say whether the changes represent maturity, consolidation, or both. We’ll report in more detail in the next issue.
ID Industry News Issue1 p3,35_Layout 1 1/2/2017 7:45 PM Page 3

Display Imagery vs. Real Imagery
by Martin S. Banks
A review article on 3D displays, by Banks, Hoffman, Kim,and Wetzstein (Annual Reviews of Vision Science, 2016),asked the reader to imagine a Turing test for displays. Inthis test, a person would view input that comes either froma direct view of the real world or from a simulated view ofthat world presented on a display. Then the reader wouldhave to decide: is it real or is it imagery from a display?
The display would pass the Turing test if the viewer could not distinguish which was which.Today’s displays would clearly fail this test because no one would be unable to
distinguish real from display. Many displays would fail because of limitations in spatial and temporal resolution. Many would fail because of limitations in color andthe range of displayable intensities. And many would fail because they would not create a realistic three-dimensional experience or would not stimulate oculomotorfunction (e.g., accommodation and eye movements) appropriately. But very significantprogress has been and is being made in each of these areas.Several disciplines are involved in the design, construction, evaluation, and use of
displays including materials science, electrical engineering, computer graphics, andhuman-factors engineering. But an understanding of human vision is proving to becrucial to the enterprise because in the end the goal is to provide the desired perceptualexperience for a human viewer. And display and computer-graphics engineers cannotknow how to do this without incorporating what is known about the visual system’scapacities, particularly its limitations.There are numerous areas in which an understanding of the human visual system
has aided and continues to aid the design and construction of more-effective displays,as well as the development of better algorithms in computer graphics. In this issue ofInformation Display, we sample a small subset of these areas by focusing on three specific topics in which knowledge of human vision has been intimately involved. In “Visible artifacts and limitations in stereoscopic 3D displays,” Johnson, Kim, andBanks describe how previous research on temporal and spatial filtering in humanvision has been used to minimize flicker, motion artifacts, and distortions of perceiveddepth in stereoscopic 3D displays. They show how one can best utilize a display’stemporal and spatial properties to enable realistic, undistorted visual experiences. In “Head-mounted-display tracking for augmented and virtual reality,” Gourlay and Held review the latest techniques for implementing head tracking in virtual- and augmented-reality displays. As the accuracy of head tracking improves in space and time, we canprovide the viewer of a head-mounted display the compelling experience of a stablevisual world. In “Accurate image-based estimates of focus error in the human eye andin a smartphone camera,” Burge reviews research on how the human eye accommo-dates to focus natural images. He then shows how the knowledge gained from under-standing how the eye does it has led to a more efficient algorithm for focusing a camera.It is an exciting time to be involved in the design, construction, and evaluation of
visual displays. For instance, the development of head-mounted displays for virtualand augmented reality has created great challenges, but also breathtaking opportunities. I look forward to the time when the perceptual experience that devices provide will besufficiently realistic to give the Turing test a run for its money.
Martin S. Banks received his B.A. degree in psychology from Occidental College in 1970, M.A.degree in experimental psychology from UC San Diego in 1973, and Ph.D. in developmentalpsychology from the University of Minnesota in 1976. He was an assistant and associate professor of psychology at the University of Texas at Austin from 1976 to 1985 before moving to UC Berkeley where he is now professor of optometry, vision science, psychology, and neuro-science. He can be reached at [email protected].
4 Information Display 1/17
guest editorialSID EXECUTIVE COMMITTEE
President: Y. S. KimPresident-Elect: H. SeetzenRegional VP, Americas: S. PeruvembaRegional VP, Asia: X. YanRegional VP, Europe: P. KathirgamanathanTreasurer: T. TsujimuraSecretary: A. BhowmikPast President: A. Ghosh
DIRECTORSBangalore: T. RuckmongathenBay Area: J. MillerBeijing: Q. YanBelarus: A. SmirnovCanada: J. ViethGreater Dayton: D. G. HopperDelaware Valley: J. W. Parker IIIMetropolitan Detroit: J. KanickiFrance: F. TemplierHong Kong: H. S. KwokIndia: V. N. MohapatraIsrael: G. GolanJapan: K. KondohKorea: J. SoukLatin America: A. MammanaLos Angeles: L. TannasMid-Atlantic: J. KymissisMid-Europe: H. De SmetNew England: R. PowellPacific Northwest: A. AbileahRussia: V. BelyaevSingapore: T. WongSouthwest: K. SarmaTaipei: J. ChenTexas: Z. YanivU.K. & Ireland: S. DayUkraine: V. SerganUpper Mid-West: B. Hufnagel
COMMITTEE CHAIRSAcademic: H. J. KimArchives: L. Tannas, Jr.Audit: S. O’Rourke / R. PowellBylaws: A. SilzarsChapter Formation: D. McCartneyConventions: P. DrzaicConventions Vice-Chair, BC and MC: A. SilzarsConventions Vice-Chair, Europe: I. SageConventions Vice-Chair, Asia: K.-W. WhangDefinitions & Standards: T. FiskeDisplay Industry Awards: W. ChenHonors & Awards: S-T. WuI-Zone: L. WeberInvestment: H. SeetzenLong-Range Planning: H. SeetzenMarketing: S. PeruvembaMembership: H.-S. KwokMembership Vice-Chair, Social Media: H. AtkuriNominating: A. GhoshPublications: J. KymissisSenior Member Grade: H. SeetzenWeb Site: H. Seetzen
CHAPTER CHAIRSBangalore: S. SambadamBay Area: R. GrulkheBeijing: N. XuBelarus: V. A. VyssotskiCanada: A. KitaiDayton: J. LuuDelaware Valley: J. BlakeDetroit: J. ByrdFrance: L. VignauHong Kong: M. WongIndia: S. KauraIsrael: I. Ben DavidJapan: K. KondoKorea: S. T. ShinLatin America: V. MammanaLos Angeles: L. IboshiMid-Atlantic: G. MelnikMid-Europe: H. J. LempNew England: J. GandhiPacific Northwest: K. YugawaRussia: M. SychovSingapore/Malaysia: C. C. ChaoSouthwest: M. StrnadTaipei: C. C. WuTexas: R. FinkU.K. & Ireland: M. JonesUkraine: V. SorokinUpper Mid-West: R. D. Polak
SOCIETY FOR INFORMATION DISPLAY1475 S. Bascom Ave., Ste. 114, Campbell, CA 95008408/879-3901 e-mail: [email protected]://www.sid.org
ID Guest Editorial Issue1 p4_Layout 1 1/2/2017 8:53 PM Page 4

Display Week 2017SID International Symposium, Seminar & Exhibition
May 21–26, 2017Los Angeles Convention Center, Los Angeles, California, USA
Display Week 2017 offers synergies unparalleled by any other display event, with attendees and exhibitors whorepresent the top engineering talent from all over the world, as well as leadership from both the commercial andconsumer markets. Display Week is the ideal place to conduct business, discuss systems intengration, networkwith colleagues, and above all, learn about the latest display technologies.
Get started building a better future for your company now!
www.displayweek.org
LCDDISPLAYS
Water Vapor Transmission Rate TestingProviding Unparalleled Testing of Thin Films for the Most Challenging Applications
Contact us to learn more | Dr. Benjamin Russ | [email protected] | +1-858-455-3902
OLEDDISPLAYS
GENERAL ATOMICS
• Detectable range down to 10-8g/(m2•day)• Multidirectional Sensitivity• Utilizes patented tritiated water tracer process• Measures continuous real-time permeation• Profiles permeation across full temperature range (20 - 150°C)• Characterizes film and seal permeation
SID Ad 4Press.indd 1 12/21/16 3:23 PM

IN 2016, several head-mounted displays(HMDs) reached the consumer marketplace,providing users with the ability to augmentthe real world with digital content andimmerse themselves in virtual worlds. A keytechnical component for this is “head tracking.”Tracking estimates the pose (orientation andsometimes position) of the HMD relative towhere it has been in the past. Having thatpose permits synchronization of a virtual camera with real-world head motion, which in turn allows virtual models (holograms) toappear as though they are locked to the world.This article provides a brief overview of howmost tracking systems work, with a focus ontechnologies in use in contemporary HMDs.
Tracking OverviewHead position can be represented by the position along three head-centered axes (X, Y, and Z in Fig. 1) and by orientation relativeto those axes. Tracking can be accomplishedwith a variety of sensors, including inertial
and visual. (Others are possible, such as GPSand magnetic, but they will not be discussedhere.) Some trackers provide only orientation,which entails three degrees of freedom (DoF).They are called 3 DoF trackers. Other track-ers also provide position, so they are called 6 DoF trackers.
Inertial tracking is fast, cheap, and robust,but typically suffices only for 3 DoF trackingbecause the inertial tracking of positionrequires integration of noisy acceleration measurements over time, which leads to agradual accumulation of error. Visual trackingis comparatively slow and expensive but canbe extremely accurate with essentially nodrift. Combining these two techniques intovisual-inertial tracking through “sensorfusion” yields the best of both worlds – lowlatency, high accuracy, and no drift – andenables high-quality augmented-reality (AR)and virtual-reality (VR) experiences.
How 6-DoF Tracking Works: Inertialand Visual TrackingInertial tracking involves integrating measure-ments from components of an inertial meas-urement unit (IMU), which typically containsan accelerometer (that measures linear accel-eration), a gyroscope (that measures angularvelocity), and sometimes a magnetometer(that measures the local magnetic field). Integrating those values can be conceptuallystraightforward; the mathematics would be
Head-Mounted-Display Tracking forAugmented and Virtual RealityHead tracking is a key technical component for AR and VR applications that use head-mounted displays. Many different head-tracking systems are currently in use, but one called “inside-out” tracking seems to have the edge for consumer displays.
by Michael J. Gourlay and Robert T. Held
Michael J. Gourlay is a Principal Develop-ment Lead at the Environment Understandinggroup in Analog, the division of Microsoft that makes HoloLens, Hello, and WindowsHolographic. He can be reached at [email protected]. Robert T. Held is a SeniorSoftware Engineer in the HoloLens ExperienceTeam at Microsoft. He can be reached at [email protected].
6 Information Display 1/170362-0972/1/2017-006$1.00 + .00 © SID 2017
frontline technology
Fig. 1: The momentary position of the head is described by three position numbers: X corresponds to left-right position, Y corre-sponds to up-down, and Z corresponds to forward-backward (where the origin of the X-Y-Z coordinate system is the center of thehead). Positional changes are described bychanges in those three numbers. The momen-tary orientation of the head is described byrotations about the X, Y, and Z axes (wherezero is normally referenced to earth-centeredcoordinates). Pitch corresponds to rotationsabout the X axis (head rotating up or down);yaw corresponds to rotations about the Y axis(rotating left or right); and roll corresponds torotation about the Z axis (tilting the head tothe side).
ID Held p6-11_Layout 1 1/2/2017 8:11 PM Page 6

familiar to a person who took physics, calcu-lus, and linear-algebra classes. Integrationcan be used to obtain a linear velocity fromlinear acceleration and a position from thevelocity. Likewise, orientation can beobtained from the angular velocity. Further-more, the constant and uniform accelerationdue to gravity can be used to obtain orienta-tion in two dimensions (elevation, which issimilar to pitch except it’s fixed to the earthcoordinate frame, and tilt, which is roll rela-tive to gravity) and the magnetic-field-readingrelative orientation in the azimuthal direction(yaw relative to an initial direction).
In practice, inertial tracking also must handle noise, bias, and other sources of errorsin IMUs and combine inertial tracking estimates with estimates obtained throughvisual tracking. Otherwise, the pose obtainedfrom inertial tracking tends to drift away fromthe correct value (especially when using smallinexpensive IMUs as used in consumerdevices).
Inside-Out Tracking: Sparse FeatureTracking and MappingThere are two major types of visual tracking:inside-out and outside-in. There are manyvariations within the two types. This sectiondescribes one variation of inside-out trackingand one of outside-in tracking. We alsodescribe “lighthouse tracking,” which is similar to inside-out tracking but with somekey distinctions.
Inside-out vision-based tracking is alsocalled “ego-motion tracking,” which meansthat the object being tracked is the cameraitself, i.e., not what the camera is looking at.The distinction is somewhat artificial becauseif the camera were stationary and the worldwere moving, the results would be visuallyidentical. This point reflects a key aspect ofvisual tracking: To estimate the pose of thecamera, the algorithm also needs a geometricmodel of the environment captured by thecamera. The motion of the camera can betracked relative to the environment, so eitherentity could move and have its motiontracked. If the geometry of the environment is not already known (and in most consumersituations it is not), the algorithm must simul-taneously model the environment and trackthe camera pose. Hence, this type of algo-rithm is called “simultaneous localization and mapping” (SLAM) or “tracking and mapping.” a The model of the environment
could be sparse, dense, or somewhere inbetween the two. A sparse model consists of a collection of feature points (such as corners),whereas a dense model consists of denseregions of either scene geometry or images.We will focus on sparse models.
Visual tracking requires accurate knowl-edge of the locations of feature points in theenvironment relative to the camera. Mathe-matically, an ideal camera can be modeled asa pinhole through which light rays pass. Sucha camera maps light reflected off points in 3Dspace onto a 2D plane (Fig. 2). Such a cameracan be described by the position of the pinholeand the position and orientation of the planeonto which light is projected.
Real cameras have lenses that distort thedirections in which rays pass through theaperture. With calibration, those distortionscan be measured. That distortion can be modeled with a function and then one can“undistort” rays, after which a real camera canbe effectively treated as a pinhole camera.
Stereo TriangulationVisual trackers can use either one camera or a“rig” of cameras rigidly mounted together,some of which might have overlapping fieldsof view. In practice, these options are imple-
mented in a variety of ways. For example, a“stereo rig” has two cameras with overlappingfields of view. Such a rig can be used todetermine the distances of image features relative to the cameras (Fig. 3). In contrast,visual tracking with a single camera meansthat distances can never be determined inworld units; all distances would be relative toother distances within the images; i.e., thescale is ambiguous. A tracker for which thedistance of features to the camera rig isknown, for example, through stereo triangula-tion and how that triangulation works will bedescribed. It suffices for the followingdescription to know that image features have aposition in three-dimensional space relative tothe camera, and those 3D positions can beknown, from a single stereo image, with someuncertainty.
To use a stereo rig to determine the 3Dpositions of features within a scene, the rela-tive position and orientation of the camerapair need to be known. This can be done bytaking a photograph of a calibration target,such as a checkerboard, that has known structure with sufficient complexity (e.g., hasenough identifiable features, like corners onthe checkerboard), and then solving a systemof linear equations for the positions and orien-tations of the two cameras and the marker-board plane. Assuming the rig is rigid, thiscalibration can then be used to infer the 3Dstructure of any scene it captures.
Triangulation involves finding pairs of corresponding feature points in the images ofthe two cameras and measuring their disparity
Information Display 1/17 7
aTechnically, a visual tracker could estimaterelative motion without retaining a map;tracking could always be relative to a previousframe. Such tracking is called “visual odometry”and has practical applications, but that conceptwill not be described further.
Fig. 2: This diagram shows the projection of a 3D point onto the image plane of a pinhole camera.
ID Held p6-11_Layout 1 1/2/2017 8:11 PM Page 7

across the two images. In general, the differ-ences in the positions of images from oneobject (i.e, the disparity) occur along a line: anepipolar line. When the cameras are paralleland horizontally displaced from one another,epipolar lines are just horizontal lines in thecamera’s sensors. Thus, the search for pairsof corresponding feature points and the measurement of disparity is simpler. Even asingle set of 3D features from a single stereoimage pair suffices for tracking.
Tracking with a Known MapIf the 3D structure of the environment isknown, the algorithm for tracking against theknown map works like this:
● Start with a hypothesis for camera pose.● Numerically project 3D points from the
environment’s map into the current camera.
● Find correspondences between imagefeatures and projected 3D points.
● Compute the distance (in image space)between corresponding image featuresand projected 3D points.
● Minimize error with respect to pose.Note that this tracking algorithm does not
need (or even use) stereo overlap or depthinformation from tracking images. Trackingcan be “monocular” even if the rig is stereo.
Step 1: Start with a hypothesis for camerapose. The “hypothesis” for the camera posecould be as simple as using the previous
camera pose. (The initial pose is arbitrary.)The hypothesis can be made more sophisti-cated by assuming the camera will continueon its current trajectory; i.e., assume the camera moves according to a motion model(e.g., constant acceleration) and then predictwhere it is currently.
Step 2: Numerically project 3D pointsfrom the environment’s map into the currentcamera. Mathematically, a camera is just afunction that maps 3D points to a 2D plane;i.e. “projection.” The inputs to that functioninclude the 3D position and orientation (a.k.a.pose) of the camera relative to the 3D positionsof all the points in the map. So, Step 2 entailsapplying that function to the 3D points in themap to synthesize a virtual image.
Step 3: Find correspondences betweenimage features and projected 3D points.Now there are two images: The real imagecaptured by the camera and the virtual image.The virtual camera is meant to have the sameproperties (e.g., pose, focal length, aspectratio, and field of view) as the real camera.So features in the virtual image are meant tomatch features in the real image. Each featurepoint in the real image should have a corre-sponding point in the virtual image. Step 3entails associating each of these pairs ofpoints, a process called “data association.”
There are many ways to accomplish thisstep. Among the simplest is to assume that,for any point in the real image, the correspon-ding point is the one nearest to it in the virtual
image. Instead, each feature can also bedescribed in the real image with some func-tion (like a hash), and then one can apply thesame function to the virtual image and formcorrespondences according to this featuredescription. Each data-association methodhas benefits and drawbacks, but ultimately theoutcome of Step 3 is some collection of corre-sponding pairs of feature points, one from thereal image and one from the virtual image.
Step 4: Compute the distance (in imagespace) between corresponding image fea-tures and projected 3D points. Given eachpair of features from Step 3, compute the distance between those features. The unitscould be in pixels or in the angle subtended bythat distance. This error is “reprojectionerror.” b
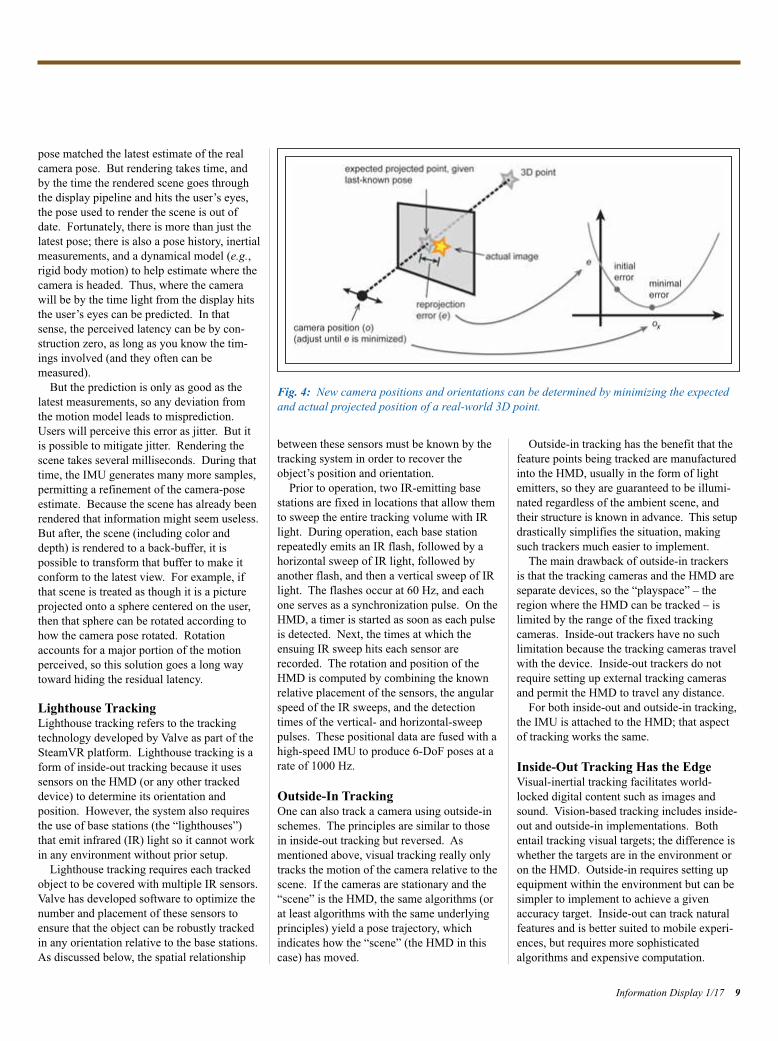
Step 5: Minimize error with respect topose. As shown in Fig. 4, the idea is to wiggle the virtual camera, trying various perturbations in position and orientation, andrepeat steps 1–4 until the pose that results inthe smallest reprojection error possible isdetermined. In principle, this could be doneby brute force: try every possible position andorientation. But this takes too long to com-pute because pose exists in a six-dimensionalspace. So, in practice, a numerical model ofhow the error varies with each component ofthe pose (three translations and three rotations)can be formulated, then the reprojection errorcan be minimized by using some numericaloptimization algorithm, such as least-squaresor one of its variants such as gradient descent,Gauss-Newton, or Levenberg-Marquardt.
Multiple sources of pose estimates can becombined, such as from inertial and visualtrackers, for example, by using a Kalman filter. This yields the benefits – and reducesthe drawbacks – of the various sources. Theycan be combined into a weighted runningaverage where the weight is inversely propor-tional to the uncertainty of each measurementsource.
Hiding LatencyThe naïve way to render a virtual scene givena real camera pose would be to render the virtual scene using a virtual camera whose
frontline technology
8 Information Display 1/17
bThere are multiple subtle variations possiblefor precisely how to compute this, and amongthem only one is properly called “reprojectionerror,” but the details are beyond the scope ofthis article.
Fig. 3: Stereo triangulation uses knowledge of the relative positions and orientations of twocameras to convert a real-world feature’s disparate projections into a distance measurement.
ID Held p6-11_Layout 1 1/2/2017 8:11 PM Page 8
pose matched the latest estimate of the realcamera pose. But rendering takes time, andby the time the rendered scene goes throughthe display pipeline and hits the user’s eyes,the pose used to render the scene is out ofdate. Fortunately, there is more than just thelatest pose; there is also a pose history, inertialmeasurements, and a dynamical model (e.g.,rigid body motion) to help estimate where thecamera is headed. Thus, where the camerawill be by the time light from the display hitsthe user’s eyes can be predicted. In thatsense, the perceived latency can be by con-struction zero, as long as you know the tim-ings involved (and they often can bemeasured).
But the prediction is only as good as the latest measurements, so any deviation fromthe motion model leads to misprediction.Users will perceive this error as jitter. But itis possible to mitigate jitter. Rendering thescene takes several milliseconds. During thattime, the IMU generates many more samples,permitting a refinement of the camera-poseestimate. Because the scene has already beenrendered that information might seem useless.But after, the scene (including color anddepth) is rendered to a back-buffer, it is possible to transform that buffer to make itconform to the latest view. For example, ifthat scene is treated as though it is a pictureprojected onto a sphere centered on the user,then that sphere can be rotated according tohow the camera pose rotated. Rotationaccounts for a major portion of the motionperceived, so this solution goes a long waytoward hiding the residual latency.
Lighthouse TrackingLighthouse tracking refers to the trackingtechnology developed by Valve as part of theSteamVR platform. Lighthouse tracking is aform of inside-out tracking because it usessensors on the HMD (or any other trackeddevice) to determine its orientation and position. However, the system also requiresthe use of base stations (the “lighthouses”)that emit infrared (IR) light so it cannot workin any environment without prior setup.
Lighthouse tracking requires each trackedobject to be covered with multiple IR sensors.Valve has developed software to optimize thenumber and placement of these sensors toensure that the object can be robustly trackedin any orientation relative to the base stations.As discussed below, the spatial relationship
between these sensors must be known by thetracking system in order to recover theobject’s position and orientation.
Prior to operation, two IR-emitting basestations are fixed in locations that allow themto sweep the entire tracking volume with IRlight. During operation, each base stationrepeatedly emits an IR flash, followed by ahorizontal sweep of IR light, followed byanother flash, and then a vertical sweep of IRlight. The flashes occur at 60 Hz, and eachone serves as a synchronization pulse. On theHMD, a timer is started as soon as each pulseis detected. Next, the times at which the ensuing IR sweep hits each sensor arerecorded. The rotation and position of theHMD is computed by combining the knownrelative placement of the sensors, the angularspeed of the IR sweeps, and the detectiontimes of the vertical- and horizontal-sweeppulses. These positional data are fused with ahigh-speed IMU to produce 6-DoF poses at arate of 1000 Hz.
Outside-In TrackingOne can also track a camera using outside-inschemes. The principles are similar to thosein inside-out tracking but reversed. As mentioned above, visual tracking really onlytracks the motion of the camera relative to thescene. If the cameras are stationary and the“scene” is the HMD, the same algorithms (orat least algorithms with the same underlyingprinciples) yield a pose trajectory, which indicates how the “scene” (the HMD in thiscase) has moved.
Outside-in tracking has the benefit that thefeature points being tracked are manufacturedinto the HMD, usually in the form of lightemitters, so they are guaranteed to be illumi-nated regardless of the ambient scene, andtheir structure is known in advance. This setupdrastically simplifies the situation, makingsuch trackers much easier to implement.
The main drawback of outside-in trackers is that the tracking cameras and the HMD areseparate devices, so the “playspace” – theregion where the HMD can be tracked – islimited by the range of the fixed tracking cameras. Inside-out trackers have no suchlimitation because the tracking cameras travelwith the device. Inside-out trackers do notrequire setting up external tracking camerasand permit the HMD to travel any distance.
For both inside-out and outside-in tracking,the IMU is attached to the HMD; that aspectof tracking works the same.
Inside-Out Tracking Has the EdgeVisual-inertial tracking facilitates world-locked digital content such as images andsound. Vision-based tracking includes inside-out and outside-in implementations. Bothentail tracking visual targets; the difference iswhether the targets are in the environment oron the HMD. Outside-in requires setting upequipment within the environment but can besimpler to implement to achieve a given accuracy target. Inside-out can track naturalfeatures and is better suited to mobile experi-ences, but requires more sophisticated algorithms and expensive computation.
Information Display 1/17 9
Fig. 4: New camera positions and orientations can be determined by minimizing the expectedand actual projected position of a real-world 3D point.
ID Held p6-11_Layout 1 1/2/2017 8:11 PM Page 9

Both technologies can be found in currentconsumer products, but the trend seems to betoward inside-out tracking due to the simpli-fied user experience and mobility.
Further ReadingKalman, “A new approach to linear filtering
and prediction problems,” Transactions ofthe ASME – Journal of Basic Engineering82, series D, 35–45 (1960).
Horn, “Closed-form solution of absolute orientation using unit quaternions,” J. Opt.Soc. Am. A. 4, No. 4 (April, 1986).
Hartley and Zisserman, Multiple View Geometry in Computer Vision (CambridgeUniversity Press, 2004).
Boyd and Vandenberghe, Convex Optimiza-tion (Cambridge University Press, 2004).
Klein and Murray, “Parallel Tracking andMapping for Small AR Workspaces,”ISMAR 2007.
Szeliski, Computer Vision: Algorithms andApplications (Springer, 2011).
Valve, “SteamVR Tracking” (2011), https://partner.steamgames.com/vrtracking/ n
frontline technology
10 Information Display 1/17
J O I N S I DWe invite you to join SID to participate in shaping the future development of:• Display technologies and display-related products
• Materials and components for displays and display applications
• Manufacturing processes and equipment
• New markets and applicationsIn every specialty you will find SIDmembers as leading contributors totheir profession.
http://www.sid.org/Membership.aspx
Information Display welcomescontributions that containunique technical, manufactur-ing, or market research contentthat will interest and/or assistour readers – individuals
involved in the business or research of displays.
Please contact Jenny Donelan, Managing Editor,at [email protected] with questions or proposals.
Turn to page 31 for a list of 2017 editorial themes, with approximate dates for submitting article proposals.
InformationDISPLAY
SIDSOCIETY FOR INFORMATION DISPLAY
DISPLAY WEEK 2015 REVIEW AND METROLOGY ISSUE
Official Publication of the Society for Information Display • www.informationdisplay.org
Sept./Oct. 2015
Vol. 31, No. 5
IMAGING TECHNOLOGIES AND LIGHTING ISSUE
Official Monthly Publication of the Society for Information Display • www.informationdisplay.org Nov./Dec. 2015Vol. 31, No. 6
For the latest information on Display Week 2017:
www.displayweek.org
ID Held p6-11_Layout 1 1/2/2017 8:11 PM Page 10

Display Week 2017SID International Symposium, Seminar & Exhibition
May 21–26, 2017Los Angeles Convention Center, Los Angeles, California, USA
Display Week 2017 offers synergies unparalleled by any other display event, with attendees and exhibitors whorepresent the top engineering talent from all over the world, as well as leadership from both the commercial andconsumer markets. Display Week is the ideal place to conduct business, discuss systems intengration, networkwith colleagues, and above all, learn about the latest display technologies.
Get started building a better future for your company now!
www.displayweek.org
ID Held p6-11_Layout 1 1/2/2017 8:11 PM Page 11

THE binocular disparity between what theleft and right eyes see in an everyday environ-ment is a strong cue to depth. Stereoscopic3D (S3D) displays recreate this by sendingslightly different images to each eye. Thiscreates an enhanced sensation of depth compared to conventional non-stereoscopicdisplays. Nearly all current S3D displays useone of two methods to present differentimages to each eye: temporal interlacing orspatial interlacing. The two methods each have a unique set of
artifacts or limitations, such as flicker, motionartifacts, depth distortion, and reduced spatialresolution. But with an understanding of howthe visual system processes information inspace and time, we can design S3D displaysthat minimize objectionable artifacts and constraints. In this article, we review the
perceptual problems that occur with differentmethods of stereoscopic presentation anddescribe alternative display methods that minimize some of the artifacts by takingadvantage of known properties of the visualsystem. Temporal interlacing delivers the left- and
right-eye views alternately over time by usingactive glasses that transmit and block imagesto the eyes in synchrony with the display orby using passive glasses and alternating polarization from the display. In temporalinterlacing, only one eye receives light at anygiven time, but it receives all the pixels. Thismethod is schematized on the left side of Fig. 1. Spatial interlacing alternates left- and right-
eye views on a row-by-row (or column-by-column) basis, simultaneously delivering halfthe pixels to one eye and the other half to theother eye. This is typically done using a film-patterned retarder on the display that polarizesthe emitted light in opposite directions row byrow (or column by column). The viewerwears passive eyewear that transmits alternaterows (or columns) to both eyes. With spatialinterlacing, each eye receives images at anygiven moment, but each receives only half thepixels. This protocol is schematized on theright side of Fig. 1.
Each method is prone to visible artifactsdue to the way the display is sampled in spaceand time. Temporal interlacing is prone totemporal artifacts, while spatial interlacing isprone to spatial artifacts. A significant problem with spatial inter-
lacing is lower effective spatial resolutionbecause each eye receives only a half-resolution image at any given time. Someresearchers and manufacturers have claimedthat the visual system can fuse the two half-resolution images to create a full-resolutionimage in the visual brain.8,14 But an under-standing of how binocular fusion occurs in the human visual system casts doubt on thisclaim. A fundamental principle in binocularfusion is that image features with dissimilarproperties will not be matched in both eyes.Consequently, illuminated pixel rows (orcolumns) in one eye will almost always bematched with illuminated rows in the othereye and, likewise, non-illuminated rows willbe matched in both eyes.12 Because of this,the claim that full-resolution images can becreated from two half-resolution images in aspatial-interlacing display is very questionable.Kim and Banks10 measured effective spatial
resolution in spatial- and temporal-interlacingdisplays. In a series of psychophysical experi-
Visible Artifacts and Limitations inStereoscopic 3D DisplaysStereoscopic 3D (S3D) displays send slightly different images to our two eyes and therebycreate an additional sense of depth compared to conventional non-stereoscopic displays.Nearly all direct-view S3D displays accomplish this by using either temporal interlacing,which alternates the images of the two eyes in time, or spatial interlacing, which alternatesthe images on a row-by-row (or column-by-column) basis. The two methods each have limitations, but it is possible to design S3D displays that minimize these.
by Paul V. Johnson, Joohwan Kim, and Martin S. Banks
Paul V. Johnson is a display engineer atApple. He can be reached at [email protected]. Joohwan Kim is a research scientist with Nvidia. He can be reached [email protected]. Martin S. Banks is aprofessor of optometry, vision science, psychology, and neuroscience at UC Berkeley.He can be reached at [email protected].
12 Information Display 1/170362-0972/1/2017-012$1.00 + .00 © SID 2017
frontline technology
ID Johnson p12-17_Layout 1 1/2/2017 8:16 PM Page 12

ments they found that resolution was indeedlower with spatial interlacing, but the resolutionloss depended on viewing distance. At shortdistances, resolution was significantly lowerwith spatial interlacing than with temporal.At such distances, resolution is display limited,that is, resolution is determined primarily bythe density of pixels. Said another way, thepixel rows can be seen at short distance, sofusion occurs with bright rows being matchedto bright rows and dark rows to dark rows,thereby creating a fused but half-resolutionimage. The recommended viewing distancesfor HDTV and UHDTV fall into thisregime.4,5 Kim and Banks found that resolu-tion was equivalent for the two types of inter-lacing at long viewing distances because, atthose distances, resolution is eye limited, thatis, resolution is determined primarily by theacuity of the viewer’s eye.Temporal interlacing is prone to temporal
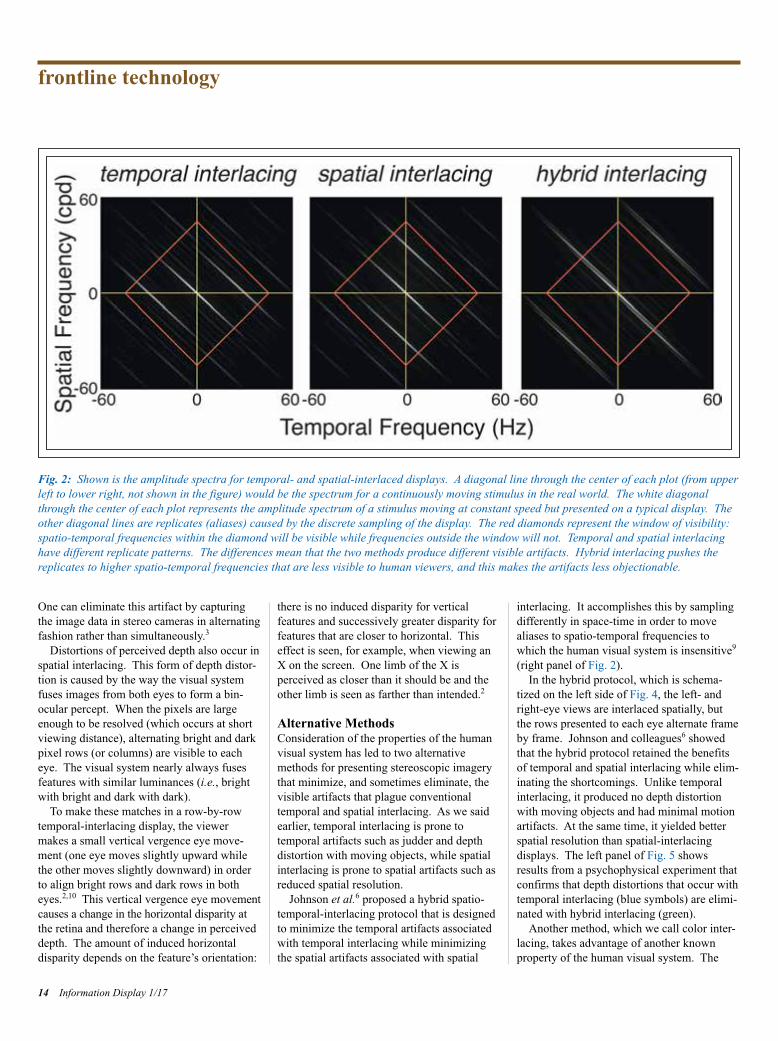
artifacts such as flicker and unsmooth motionappearance.3,7 These artifacts can be bestunderstood by an analysis in the spatio-temporal frequency domain using the conceptof the window of visibility.15,16 The windowrepresents the range of spatial and temporal
frequencies that are visible to a typical viewer.It is depicted by the red diamonds in Fig. 2. Consider a thin object moving in the world
at constant speed. Its spatio-temporal ampli-tude spectrum (in the Fourier domain) is adiagonal line in plots like that in Fig. 2. When the same object is presented on a digitaldisplay, its amplitude spectrum is given by theconvolution of the smoothly moving objectwith the spatio-temporal point-spread functionof the display. This creates replicates (oraliases) in the spectrum, which are the diago-nals in the figure that do not run through theorigin. When the replicates are low in spatio-temporal frequency they fall within the window of visibility and therefore becomevisible. In this case, the viewer perceives thedisplayed and real objects as different: the displayed object has visible artifacts such asflicker, judder, and pixelization. Sampling intemporal and spatial interlacing differs, so thespatio-temporal frequencies of the replicatesin the two methods differ as well.1,6Temporal interlacing creates replicates
primarily in temporal frequency, while spatialinterlacing creates them primarily in spatialfrequency. For this reason, temporal inter-
lacing is prone to artifacts in time such asflicker and judder and spatial interlacing toartifacts in space such as spatial aliasing andpixelization.3,6,10Hoffman et al.3 and Johnson et al.7 carried
out a series of psychophysical experiments toquantify the determinants of the temporal artifacts associated with temporal interlacing.The artifacts include judder (jerky orunsmooth motion appearance), motion blur(apparent smearing in the direction of stimu-lus motion), and banding (appearance of multiple edges in the direction of stimulusmotion). The researchers observed that the primary
determinants of motion artifacts are capturerate (the number of unique images presentedper unit time) and the speed of a movingobject: artifacts become more visible withdecreasing capture rate and increasingspeed.3,7 Motion artifacts occurred at highercapture rates and lower stimulus speeds withtemporal interlacing than with spatial interlacingbecause the former requires two sub-frames to present the two images while the latterrequires only one. These results were wellpredicted by the spatiotemporal frequenciescreated by the two stereoscopic protocols andthe degree to which those frequencies fallwithin the window of visibility. Another type of artifact occurs with temporal
and spatial interlacing: distortions of perceiveddepth. In temporal interlacing, an object moving horizontally across the screen canappear displaced in depth because of an ambi-guity in how the visual system matches left-and right-eye images. With this type of inter-lacing, the two eyes do not receive images atthe same time. Thus, a given frame presentedto the left eye could in principle be matchedwith a preceding or succeeding frame in theright eye.3,13 This is illustrated in Fig. 3. Depending on how the temporal interlacing
is done, one of those matches yields the correct disparity while the other match yieldsan incorrect disparity. The visual system hasno way of knowing which value is correct andwhich is incorrect, so it averages the two estimates, causing perceived depth to be displaced by an amount that depends onobject speed and frame rate. The direction ofthe depth distortion (object seen as too far ortoo near) depends on whether the object ismoving leftward or rightward. Experimentalmeasurements of perceived depth confirm thepredictions of the model depicted in Fig. 3.3,7
Information Display 1/17 13
Fig. 1: Temporal interlacing is shown at left and spatial interlacing at right. To illustrate thesetwo protocols, we show the images seen by the left and right eyes with time proceeding from topto bottom. The grid pattern represents individual pixels. The stimulus being displayed is theletter “E” with a height of 5 pixels.
ID Johnson p12-17_Layout 1 1/2/2017 8:16 PM Page 13
One can eliminate this artifact by capturingthe image data in stereo cameras in alternatingfashion rather than simultaneously.3Distortions of perceived depth also occur in
spatial interlacing. This form of depth distor-tion is caused by the way the visual systemfuses images from both eyes to form a bin-ocular percept. When the pixels are largeenough to be resolved (which occurs at shortviewing distance), alternating bright and darkpixel rows (or columns) are visible to eacheye. The visual system nearly always fusesfeatures with similar luminances (i.e., brightwith bright and dark with dark). To make these matches in a row-by-row
temporal-interlacing display, the viewermakes a small vertical vergence eye move-ment (one eye moves slightly upward whilethe other moves slightly downward) in orderto align bright rows and dark rows in botheyes.2,10 This vertical vergence eye movementcauses a change in the horizontal disparity atthe retina and therefore a change in perceiveddepth. The amount of induced horizontal disparity depends on the feature’s orientation:
there is no induced disparity for vertical features and successively greater disparity forfeatures that are closer to horizontal. Thiseffect is seen, for example, when viewing anX on the screen. One limb of the X is perceived as closer than it should be and theother limb is seen as farther than intended.2
Alternative Methods Consideration of the properties of the humanvisual system has led to two alternative methods for presenting stereoscopic imagerythat minimize, and sometimes eliminate, thevisible artifacts that plague conventional temporal and spatial interlacing. As we saidearlier, temporal interlacing is prone to temporal artifacts such as judder and depthdistortion with moving objects, while spatialinterlacing is prone to spatial artifacts such asreduced spatial resolution. Johnson et al.6 proposed a hybrid spatio-
temporal-interlacing protocol that is designedto minimize the temporal artifacts associatedwith temporal interlacing while minimizingthe spatial artifacts associated with spatial
interlacing. It accomplishes this by samplingdifferently in space-time in order to movealiases to spatio-temporal frequencies towhich the human visual system is insensitive9(right panel of Fig. 2). In the hybrid protocol, which is schema-
tized on the left side of Fig. 4, the left- andright-eye views are interlaced spatially, butthe rows presented to each eye alternate frameby frame. Johnson and colleagues6 showedthat the hybrid protocol retained the benefitsof temporal and spatial interlacing while elim-inating the shortcomings. Unlike temporalinterlacing, it produced no depth distortionwith moving objects and had minimal motionartifacts. At the same time, it yielded betterspatial resolution than spatial-interlacing displays. The left panel of Fig. 5 showsresults from a psychophysical experiment thatconfirms that depth distortions that occur withtemporal interlacing (blue symbols) are elimi-nated with hybrid interlacing (green).Another method, which we call color inter-
lacing, takes advantage of another knownproperty of the human visual system. The
frontline technology
14 Information Display 1/17
Fig. 2: Shown is the amplitude spectra for temporal- and spatial-interlaced displays. A diagonal line through the center of each plot (from upperleft to lower right, not shown in the figure) would be the spectrum for a continuously moving stimulus in the real world. The white diagonalthrough the center of each plot represents the amplitude spectrum of a stimulus moving at constant speed but presented on a typical display. Theother diagonal lines are replicates (aliases) caused by the discrete sampling of the display. The red diamonds represent the window of visibility:spatio-temporal frequencies within the diamond will be visible while frequencies outside the window will not. Temporal and spatial interlacinghave different replicate patterns. The differences mean that the two methods produce different visible artifacts. Hybrid interlacing pushes thereplicates to higher spatio-temporal frequencies that are less visible to human viewers, and this makes the artifacts less objectionable.
ID Johnson p12-17_Layout 1 1/2/2017 8:16 PM Page 14

visual system converts the signals from thethree cone types [long, medium, and shortwavelength (L, M, and S)] into a luminancesignal (L + M) and two color-opponent signals (L – M or red-green opponent and (L + M) – S or blue-yellow opponent). Disparity is primarily calculated from theluminance signal and not the color-opponentsignals. Furthermore, flicker appearance isprimarily determined by luminance variationand not color variation.
Information Display 1/17 15
Fig. 4: Hybrid- and color-interlacing methods are illustrated. At left, the hybrid-interlacing protocol presents odd pixel rows to the left eye and even pixel rows to the righteye in one frame, and then even rows to theleft eye and odd to the right in the next frame.At right, the color-interlacing protocol pres-ents the green primary (G) to the left eye andthe red and blue primaries (R+B) to the righteye at the same time, and then R+B to the lefteye and G to the right in the next frame.
Fig. 3: The charts illustrate disparity computation with temporal interlacing. At left appears a space-time plot of a horizontally moving stimuluson a temporally interlaced display. The stimulus has zero disparity, so it should be seen in the plane of the display screen. Each right-eye imageis delayed by Δi relative to each left-eye image. Binocular matches could, in principle, be made between a left-eye image and the succeedingright-eye image or between the left-eye image and the preceding right-eye image. At right is a disparity estimation with weighted averaging overtime. The weight given to each potential match is shown by the value on the right ordinate. In this example, the object is seen as closer to theviewer than intended.
ID Johnson p12-17_Layout 1 1/2/2017 8:16 PM Page 15

This color-interlacing method takes advan-tage of these properties to reduce depth distortion and flicker.11 Each frame is dividedinto two sub-frames. In the first sub-frame,the image from the green primary is presentedto the left eye while the images from the redand blue primaries (i.e., magenta) are presentedto the right eye. In the second sub-frame, thecolors are reversed so magenta is presented tothe left eye and green to the right eye. Thepresentation is split this way so that both eyesare being stimulated at all times, therebykeeping luminance at the eyes roughly constant over time. Kim and colleagues11 implemented this
protocol and measured depth distortion andflicker. They found that both were signifi-cantly reduced with color interlacing comparedto conventional temporal interlacing. Thedepth distortion results are shown on the rightside of Fig. 5. Note that depth distortion iseliminated altogether when the displayedcolor is desaturated (e.g., gray) and that theamount of distortion approaches that in temporal interlacing as the colors becomehighly saturated. Thus, color interlacing is anattractive approach for reducing artifacts dueto temporal interlacing.
Better Stereoscopic Displays through Understanding the Human VisualSystemSingle-screen stereoscopic displays createobjectionable artifacts due to the manner inwhich different images are delivered to eacheye. Whether one separates the left- andright-eye images in time or space producesdifferent sorts of problems. We have shown,however, that knowledge of the properties ofthe human visual system can be considered inthe design of displays that will produce lessobjectionable artifacts. We hope that theseexamples will stimulate more ideas in how todovetail the properties of displays to thevisual capabilities of the viewer.
References1M. S. Banks, D. M. Hoffman, J. Kim, and G. Wetzstein, “3D Displays,” Annual Reviewof Vision Science 2(1) (2016).2J. H. Hakala, P. Oittinen, and J. P. Häkkinen,“Depth artifacts caused by spatial interlacingin stereoscopic 3D displays,” Transactions onApplied Perception 12(1), 3 (2015).3D. M. Hoffman, V. I. Karasev, and M. S.Banks, “Temporal presentation protocols instereoscopic displays: Flicker visibility,
perceived motion, and perceived depth,” J. Soc. Info. Display 19(3), 271–297 (2011).4ITU-R Recommendation BT.2022 (2012),General viewing conditions for subjectiveassessment of quality of SDTV and HDTVtelevision pictures on flat-panel displays,International Telecommunication Union,Geneva, Switzerland.5ITU-R Recommendation BT.709-5 (2002),Parameter values for the HDTV standards forproduction and international programmeexchange, International TelecommunicationUnion, Geneva, Switzerland.6P. V. Johnson, J. Kim, and M. S. Banks,“Stereoscopic 3D display technique using spatiotemporal interlacing has improved spatial and temporal properties,” OpticsExpress 23(7), 9252–9275 (2015a).7P. V. Johnson, J. Kim, D. M. Hoffman, A. D. Vargas, and M. S. Banks, “Motion artifacts on 240-Hz OLED stereoscopic 3Ddisplays,” J. Soc. Info. Display 22(8),393–403 (2015b).8E. F. Kelley, “Resolving resolution,” Infor-mation Display 27(9), 18–21 (2011).9D, H, Kelly, “Motion and Vision: II. Stabi-lized spatio-temporal threshold surface.” J. Opt. Soc. Am. 69, 1340–1349 (1979).
frontline technology
16 Information Display 1/17
Fig. 5: Two charts illustrate depth distortion in hybrid and color interlacing. At left, hybrid interlacing is compared to temporal and spatialinterlacing. The ordinate is the disparity that must be added to a horizontally moving stimulus in order to eliminate depth distortion. Theabscissa is the speed of the stimulus. When the added disparity is zero, no depth distortion occurred. At right, color interlacing is compared to temporal interlacing. The ordinate is again the disparity that must be added to a horizontal moving stimulus to eliminate depth distortion. The abscissa is the speed of the stimulus. Different symbols represent the results for different colors.
ID Johnson p12-17_Layout 1 1/2/2017 8:16 PM Page 16

10J. Kim, and M. S. Banks, “Effective SpatialResolution of Temporally and Spatially Inter-laced Stereo 3D Televisions (paper 65.1),”SID Symp. Digest Tech. Papers 43(1),879–882 (2012).11J. Kim, P. V. Johnson, and M. S. Banks,“Stereoscopic 3D display with color interlac-ing improves perceived depth,” OpticsExpress 22(26), 31924–31934 (2014).12J. D. Krol and W. A. van de Grind, “Depthfrom dichoptic edges depends on vergencetuning,” Perception 12, 425–438 (1983).13J. C. A. Read and B. G. Cumming, “Thestroboscopic Pulfrich effect is not evidencefor the joint encoding of motion and depth,” J. Vision 5, 417–434 (2005).14R. M. Soneira, “3D TV display technologyshoot out” (2011); http://www.displaymate.com/3D_TV_ShootOut_1.htm15A. B. Watson, “High frame rates and humanvision: A view through the window of visibility,”SMPTE Motion Imaging Journal 122, 18–32(2013).16A. B. Watson, A. J. Ahumada, and J. E. Farrell, “Window of visibility: A psychophys-ical theory of fidelity in time-sampled visualmotion displays,” J. Opt. Soc. Am. 3(3), 300–307 (1986). n
Information Display 1/17 17
SID International Symposium, Seminar & Exhibition
May 21–26, 2017Los Angeles Convention Center
Los Angeles, California, USA
I-ZoneCompetition of live demonstrationsregarding emerging information-display technologies, such as not-yet-commercialized prototypes andproof of concepts. Sponsored by E Ink.
Individual Honors and AwardsThe SID Board of Directors, based on recommendations madeby the Honors & Awards Committee, grants several annualawards based upon outstanding achievements and significantcontributions.Display Industry AwardsEach year, the SID awards Display of the Year Awards in threecategories: Display of the Year, Display Application of the Year,and Display Component of the Year.Best-in-Show AwardsThe Society for Information Display highlights the most significant new products and technologies shown on theexhibit floor during Display Week.Journal of the Society for Information Display ( JSID)Outstanding Student Paper of the Year AwardEach year a sub-committee of the Editorial Board of JSIDselects one paper for this award which consists of a plaqueand a $1000 prize.
Rolling Out the Red Carpet
VISITINFORMATION
DISPLAY ON-LINEFor daily displayindustry news
www.informationdisplay.org
Submit Your News ReleasesPlease send all press releases and new productannouncements to:
Jenny DonelanInformation Display Magazine411 Lafayette Street, Suite 201
New York, NY 10003Fax: 212.460.5460
e-mail: [email protected]
ID Johnson p12-17_Layout 1 1/2/2017 8:16 PM Page 17
THE visual systems of humans and otheranimals perform powerful computations thatexploit information in retinal images that isuseful for critical sensory-perceptual tasks.The information in retinal images is deter-mined by the statistical structure of naturalscenes, projection geometry, and the proper-ties of the optical system and the retina itself.Task performance is determined by the qualityof the information available in retinal imagesand by how well that information is exploited.To characterize the theoretical limits of performance in a specific natural task, allthese factors must be accounted for. Nearly all sighted mammals have lens-
based imaging systems (eyes) that focus anddefocus light on the retinal photoreceptors.The estimation of focus error (i.e., defocus) is one particularly important natural task.Focus information is useful for a wide range
of tasks, including depth estimation, eye-growth regulation, and accommodation control.6,8,15 Typical lenses focus light fromonly one distance at a time, but natural scenes contain objects and surfaces at many distances. Most regions in images of depth-varying scenes are therefore out-of-focus and blurry under normal observing situations. The amount of image blur causedby a given focus error depends on the lensoptics and the size and shape of the lens aperture.For tasks that depend on high-resolution
images, image blur can be a significantimpediment. To sharply image an out-of-focus target, the lens must be refocused sothat the focus distance equals the target distance. It has been estimated that humansrefocus their eyes more than 100,000 timesper day.10,12 Perhaps because of all this practice, human accommodation (biologicalautofocusing) is fast, accurate, and precise.Two- to three-hundred milliseconds after presentation of a defocused target, the humanlens refocuses ballistically with (approxi-mately) the correct magnitude in the correctdirection nearly 100% of the time.7
Consumers are often frustrated by the slowspeed and inaccuracy of image-based smart-phone autofocus routines. Achieving thespeed of human accommodation would be agreat improvement. The most popular image-based autofocus routine is contrast detection.This is a “guess-and-check” procedure thatemploys an iterative search for maximum contrast. The procedure is non-optimal for atleast two reasons: (1) Contrast-detection auto-focus does not provide information aboutfocus error sign; when simple detection algo-rithms start the search for best focus, thedirection of the initial response (closer vs. farther) is random. (2) Contrast-detection autofocus does not provide estimates of focuserror magnitude; in the search for best focus,the focus adjustment often crosses the point ofbest focus and then must turn around andcome back. Here, we describe recent advances in our
ability to estimate focus error from smallpatches of individual images. We show thatprecise unbiased estimates of focus error can be obtained for both the human visual system and for a popular smartphone camera. Chromatic aberrations that are introduced by
Accurate Image-Based Estimates of FocusError in the Human Eye and in a SmartphoneCameraEstimation of focus error is a key consideration in the design of any advanced image-capturesystem. Today’s contrast-based auto-focus algorithms in digital cameras perform moreslowly and less accurately than the human eye. New methods for estimating focus error canclose this gap. By making use of optical imperfections, like chromatic aberration, these newmethods could significantly improve the performance of digital auto-focusing techniques.
by Johannes Burge
Johannes Burge is currently an AssistantProfessor at the University of Pennsylvaniawhere he is a member of the Department ofPsychology and the Neuroscience and Bio-engineering Graduate Groups. He can bereached at [email protected].
18 Information Display 1/170362-0972/1/2017-018$1.00 + .00 © SID 2017
frontline technology
ID Burge p18-23_Layout 1 1/2/2017 10:33 PM Page 18

the lenses of these vision systems can be usedto resolve the sign ambiguity. Thus, theapproach has the potential to significantlyimprove image-based autofocus routines insmartphone cameras, medical devices forassistive vision, and other electronic imagingdevices.
BackgroundFocus-error estimation suffers from aninverse-optics problem; from image informa-tion alone, it is impossible to determine withcertainty whether a given image pattern is dueto focus error (blur) or some feature of thescene (e.g., shadows). Focus-error estimationis also said to suffer from a sign ambiguity;under certain conditions, focus errors of thesame magnitude but different signs produceidentical images. These issues may make itseem that accurate focus-error estimationfrom individual images is impossible. However, in many vision systems, the opticalproperties of the lens and the sensing proper-ties of the photosensor array, together with the statistical properties of natural images,make a solution possible. We now discussthese factors.
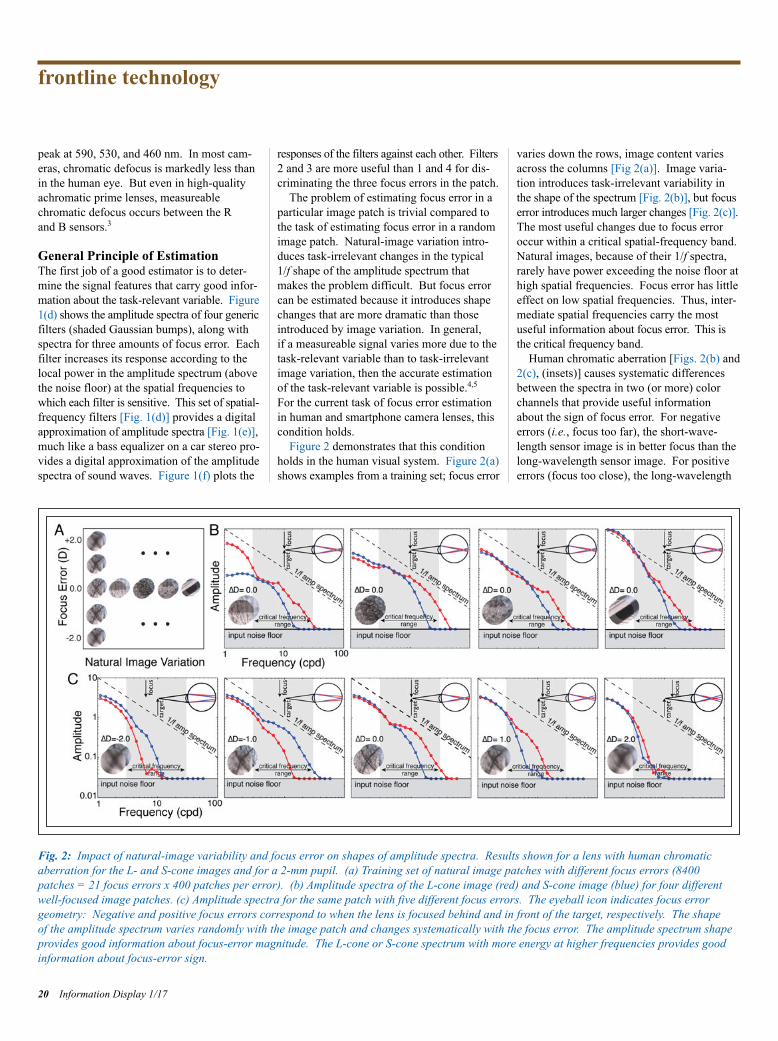
Statistical Properties of Natural ImagesNatural images are remarkably varied. In natural viewing conditions, the eye images astaggering variety of object colors, shapes,sizes, and textures [Fig 1(a)]. In spite of this
variation, there is one property of naturalimages that is relatively stable: the shape ofthe amplitude spectrum. Most well-focusednatural-image patches have amplitude spectrawith a 1/f fall-off; i.e., in a typical patch, thereis 10× less contrast at 10 cpd (cycles perdegree) and 30× less at 30 cpd than at 1 cpd.Of course, the shape of the amplitude spec-trum varies somewhat with patch content, andvariability increases as patch size decreases.Nevertheless, the shape of the natural ampli-tude spectrum is stable enough. To obtain anempirical estimate of the statistical structureof natural images, we collected a large data-base of well-focused images of naturalscenes.2.
Optical Properties of LensesFocus-error changes the shape of the ampli-tude spectrum. Small focus errors attenuatethe spectrum (i.e., power) at high frequencies;intermediate focus errors attenuate the spec-trum at intermediate frequencies, and so on[Fig. 1(b)]. These shape changes provideinformation about focus-error magnitude [Fig.1(c)]. However, under certain conditions,lenses provide no information about the signof the error (focus too close vs. too far). Forexample, in an ideal optical system withmonochromatic light, image quality isdegraded by focus error (i.e., defocus) and dif-fraction alone. Focus errors of the same mag-nitude but opposite signs thus yield identical
point-spread functions (PSFs) and correspon-ding modulation-transfer functions [MTFs;Fig. 1(b)]. The effect of this type of focuserror on the amplitude spectrum of a represen-tative natural image patch is shown in Fig.1(c).In real optical systems with broadband
light, image quality is degraded not just bydefocus and diffraction, but also by chromaticand monochromatic aberrations other thandefocus (e.g., astigmatism). Although theseaberrations reduce best-possible image quality, they introduce information into retinalimages than can be used to precisely estimatethe magnitude and sign of focus error.2,3,17Here, we focus on the usefulness of chromaticaberration in the human visual system14 andsmartphone cameras.
Sensing Properties of PhotosensorsFor chromatic aberrations to be useful, thevision system must be able to sense them.The human visual system and most camerashave arrays of sensors that are differentiallysensitive to long-, medium-, and short-wave-length light. In human vision, the sensitivitiesof the long- (L), medium- (M), and short- (S) wavelength cones peak at 570, 530, and 445nm, respectively13 In the human eye, thechange in chromatic defocus between the peaksensitivities of the L and S cones is approxi-mately 1 diopter (D).1 In many cameras, thesensitivity of the red, green, and blue sensors
Information Display 1/17 19
Fig. 1: Signals for focus-error estimation: (a) Natural image variation is substantial. (b) Monochromatic modulation transfer function (MTF) in a diffraction limited lens for a range of focus errors (colors). The MTF is the modulus of the Fourier transform of the point-spread function(PSF). (c) The amplitude spectrum of a particular local patch (1°, inset) changes shape systematically with focus error (colors matched to b). (d) Spatial-frequency filters (Gaussian bumps labeled 1–4) tiling the critical band of the spatial-frequency domain. (e) Each filter respondsaccording to power in the spectrum in its passband. The responses provide a digital approximation to the shape of the amplitude spectrum. (f) Joint filter responses. Filter 2 and 3 responses (open symbols) to spectra with different focus errors are significantly further apart than filter 1 and 4 responses (closed symbols). Hence, filters 2 and 3 provide more useful information for classifying focus error in this patch.
ID Burge p18-23_Layout 1 1/2/2017 10:33 PM Page 19
peak at 590, 530, and 460 nm. In most cam-eras, chromatic defocus is markedly less thanin the human eye. But even in high-qualityachromatic prime lenses, measureable chromatic defocus occurs between the R and B sensors.3
General Principle of EstimationThe first job of a good estimator is to deter-mine the signal features that carry good infor-mation about the task-relevant variable. Figure 1(d) shows the amplitude spectra of four generic filters (shaded Gaussian bumps), along withspectra for three amounts of focus error. Eachfilter increases its response according to thelocal power in the amplitude spectrum (abovethe noise floor) at the spatial frequencies to which each filter is sensitive. This set of spatial-frequency filters [Fig. 1(d)] provides a digital approximation of amplitude spectra [Fig. 1(e)], much like a bass equalizer on a car stereo pro-vides a digital approximation of the amplitudespectra of sound waves. Figure 1(f) plots the
responses of the filters against each other. Filters 2 and 3 are more useful than 1 and 4 for dis-criminating the three focus errors in the patch. The problem of estimating focus error in a
particular image patch is trivial compared tothe task of estimating focus error in a randomimage patch. Natural-image variation intro-duces task-irrelevant changes in the typical 1/f shape of the amplitude spectrum thatmakes the problem difficult. But focus errorcan be estimated because it introduces shapechanges that are more dramatic than thoseintroduced by image variation. In general, if a measureable signal varies more due to thetask-relevant variable than to task-irrelevantimage variation, then the accurate estimationof the task-relevant variable is possible.4,5For the current task of focus error estimationin human and smartphone camera lenses, thiscondition holds. Figure 2 demonstrates that this condition
holds in the human visual system. Figure 2(a)shows examples from a training set; focus error
varies down the rows, image content variesacross the columns [Fig 2(a)]. Image varia-tion introduces task-irrelevant variability in the shape of the spectrum [Fig. 2(b)], but focus error introduces much larger changes [Fig. 2(c)]. The most useful changes due to focus erroroccur within a critical spatial-frequency band.Natural images, because of their 1/f spectra,rarely have power exceeding the noise floor athigh spatial frequencies. Focus error has littleeffect on low spatial frequencies. Thus, inter-mediate spatial frequencies carry the mostuseful information about focus error. This isthe critical frequency band. Human chromatic aberration [Figs. 2(b) and
2(c), (insets)] causes systematic differencesbetween the spectra in two (or more) colorchannels that provide useful informationabout the sign of focus error. For negativeerrors (i.e., focus too far), the short-wave-length sensor image is in better focus than thelong-wavelength sensor image. For positiveerrors (focus too close), the long-wavelength
frontline technology
20 Information Display 1/17
Fig. 2: Impact of natural-image variability and focus error on shapes of amplitude spectra. Results shown for a lens with human chromaticaberration for the L- and S-cone images and for a 2-mm pupil. (a) Training set of natural image patches with different focus errors (8400 patches = 21 focus errors x 400 patches per error). (b) Amplitude spectra of the L-cone image (red) and S-cone image (blue) for four differentwell-focused image patches. (c) Amplitude spectra for the same patch with five different focus errors. The eyeball icon indicates focus errorgeometry: Negative and positive focus errors correspond to when the lens is focused behind and in front of the target, respectively. The shape of the amplitude spectrum varies randomly with the image patch and changes systematically with the focus error. The amplitude spectrum shapeprovides good information about focus-error magnitude. The L-cone or S-cone spectrum with more energy at higher frequencies provides goodinformation about focus-error sign.
ID Burge p18-23_Layout 1 1/2/2017 10:33 PM Page 20

sensor image is in better focus. Chromaticaberration thus introduces a useful signal fordetermining the sign of a focus error.
ResultsWe developed an algorithm for estimatingfocus error based on the principles and obser-vations described above.2 We next describeits performance for the human visual systemand for a popular smartphone camera: theSamsung Galaxy S4. For the human visualsystem, we assumed a 2-mm pupil (typical fordaylight), optics with human chromatic aber-ration, sensors with the wavelength sensitivi-ties of the L and S cones, and a plausible inputnoise level.16 For the Galaxy S4, we assumed
a fixed 1.7-mm aperture and measured itsoptics, wavelength sensitivity, and noise in theR and B sensors.3 (Two of the three availablesensors are used for computational simplicity.Similar performance is obtained with all three sensors together.) Note that image blur due tofocus error decreases as aperture size decreases. Vision systems with larger apertures and com-parable optics will, in general, yield moreaccurate results than those presented here.Next, in each vision system we found the
spatial-frequency filters that are most usefulfor estimating focus error from –2.5 to +2.5Dusing Accuracy Maximization Analysis, arecently developed task-specific method fordimensionality reduction. Assuming a focus
distance of 40 cm, this range of focus errorscorresponds to distances of 20 cm to infinity.For the human visual system, the filters oper-ate on the amplitude spectra of the L- and S-cone sensor images. For the Galaxy S4smartphone, the filters operate on the ampli-tude spectra of the R- and B-sensor images. The four most useful filters for estimating
focus error in the human eye are shown in Fig. 3(b). These filters find the spectral features that provide the best possible infor-mation about focus error, given the variabilityof natural images and the effect of focus error in each color channel on the captured images’amplitude spectra. The filters concentrate inand near the frequency range known to drive
Information Display 1/17 21
Fig. 3: Focus-error estimation in the human visual system. (a) Schematic of optimal focus-error estimation and how it can be used to eliminatefocus error as part of an autofocusing routine. The estimate of focus error can be used as input to an autofocus routine to null focus error. (b)Spatial-frequency filters that extract the most useful information for estimating focus error in the human visual system. The filters weight and sumof the amplitude spectra of captured L-cone and S-cone images. The first filter is selective for differences in the shapes of the L- and S-coneamplitude spectra and is most useful for discriminating focus-error sign. The second filter is less selective for differences between the color channels. The filters apply more weight to an intermediate frequency band because this band carries the most useful information. (c) Filters 1and 2 responses to different retinal images (symbols) with different focus errors (colors). The conditional filter responses cluster as a function of focus error and can be approximated by a Gaussian distribution. (d) Optimal focus-error estimates across thousands of test images. Errorbars represent 68% confidence intervals. Inset shows the rectangular approximation of the human-cone mosaic used to sample the images.
ID Burge p18-23_Layout 1 1/2/2017 10:33 PM Page 21
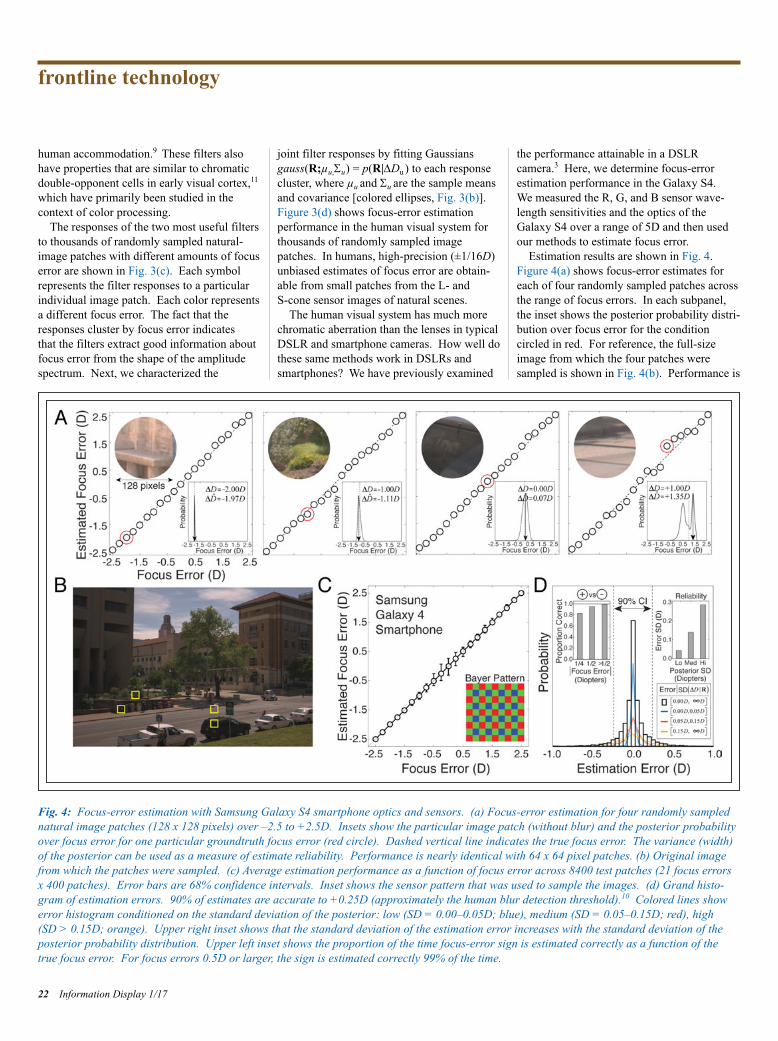
human accommodation.9 These filters alsohave properties that are similar to chromaticdouble-opponent cells in early visual cortex,11which have primarily been studied in the context of color processing. The responses of the two most useful filters
to thousands of randomly sampled natural-image patches with different amounts of focuserror are shown in Fig. 3(c). Each symbolrepresents the filter responses to a particularindividual image patch. Each color representsa different focus error. The fact that theresponses cluster by focus error indicates that the filters extract good information aboutfocus error from the shape of the amplitudespectrum. Next, we characterized the
joint filter responses by fitting Gaussiansgauss(R;µu,Su) = p(R|DDu ) to each responsecluster, where µu and Su are the sample meansand covariance [colored ellipses, Fig. 3(b)].Figure 3(d) shows focus-error estimation performance in the human visual system forthousands of randomly sampled imagepatches. In humans, high-precision (±1/16D)unbiased estimates of focus error are obtain-able from small patches from the L- and S-cone sensor images of natural scenes. The human visual system has much more
chromatic aberration than the lenses in typicalDSLR and smartphone cameras. How well dothese same methods work in DSLRs andsmartphones? We have previously examined
the performance attainable in a DSLRcamera.3 Here, we determine focus-error estimation performance in the Galaxy S4. We measured the R, G, and B sensor wave-length sensitivities and the optics of theGalaxy S4 over a range of 5D and then usedour methods to estimate focus error. Estimation results are shown in Fig. 4.
Figure 4(a) shows focus-error estimates foreach of four randomly sampled patches acrossthe range of focus errors. In each subpanel,the inset shows the posterior probability distri-bution over focus error for the condition circled in red. For reference, the full-sizeimage from which the four patches were sampled is shown in Fig. 4(b). Performance is
frontline technology
22 Information Display 1/17
Fig. 4: Focus-error estimation with Samsung Galaxy S4 smartphone optics and sensors. (a) Focus-error estimation for four randomly samplednatural image patches (128 x 128 pixels) over –2.5 to +2.5D. Insets show the particular image patch (without blur) and the posterior probabilityover focus error for one particular groundtruth focus error (red circle). Dashed vertical line indicates the true focus error. The variance (width)of the posterior can be used as a measure of estimate reliability. Performance is nearly identical with 64 x 64 pixel patches. (b) Original imagefrom which the patches were sampled. (c) Average estimation performance as a function of focus error across 8400 test patches (21 focus errors x 400 patches). Error bars are 68% confidence intervals. Inset shows the sensor pattern that was used to sample the images. (d) Grand histo-gram of estimation errors. 90% of estimates are accurate to +0.25D (approximately the human blur detection threshold).10 Colored lines showerror histogram conditioned on the standard deviation of the posterior: low (SD = 0.00–0.05D; blue), medium (SD = 0.05–0.15D; red), high (SD > 0.15D; orange). Upper right inset shows that the standard deviation of the estimation error increases with the standard deviation of theposterior probability distribution. Upper left inset shows the proportion of the time focus-error sign is estimated correctly as a function of thetrue focus error. For focus errors 0.5D or larger, the sign is estimated correctly 99% of the time.
ID Burge p18-23_Layout 1 1/2/2017 10:33 PM Page 22

good for each patch, but it is not perfect, andsome patches produce more accurate estimatesthan others. For example, estimates for thepatch in the rightmost subpanel of Fig. 4(a)are the least accurate on average. The shadowsagainst the street curb make the sharp patch(inset) look somewhat blurry. Some of thesame features that confuse humans seem toconfuse the algorithm. Also, a featureless surface carries no information about focuserror, and therefore yields highly inaccurateestimates. This variability in accuracy acrosspatches is an unavoidable aspect of estimationperformance with natural stimuli.10It would therefore be advantageous for an
autofocus routine to have not just an estimateof focus error but of each estimate’s reliability.The standard deviation (width) of the poste-rior probability distribution predicts the relia-bility of each patch-by-patch estimate. Thissignal could therefore have utility in thedesign of a control system for autofocusing asmartphone camera. Estimation performance in the Samsung
Galaxy S4, averaged across thousands ofpatches, is shown in Figs. 4(c) and 4(d). Noneof the test patches were in the training set,indicating that the estimation algorithmshould generalize well to arbitrary images.The grand histogram of estimate errors isshown in Fig. 4(d). Errors are generally quitesmall. 90% of the estimates are within +0.25Dof the correct value. Given the 1.7-mm aper-ture and 4.2-mm focal length of the Galaxy S4(f-stop of f/2.4), errors of ~0.25D will bewithin the depth of field. Sign estimation wasalso accurate.The colored lines in Fig. 4(d) show error
histograms conditioned on the standard devia-tion of the posterior probability distribution.When the posterior probability distributionhas a low standard deviation [e.g., Fig 4(a),left panel] errors are very small. When theposterior probability distribution has a highstandard deviation [e.g., Fig 4(a), right panel],errors tend to be larger. These results showthat, in both humans and a popular smart-phone camera, accurate estimates of focuserror (including sign) can be obtained fromsmall patches of individual images.
ApplicationsThe method described here provides highlyaccurate estimates of focus error, given theoptics and sensors in a popular smartphonecamera, and it has the potential to signifi-
cantly improve the autofocus routines in smartphone cameras and other digital-imaging devices. It has the advantages of both contrast-measurement and phase-detectionautofocus techniques, without their disadvan-tages. Like phase detection, the method provides estimates of focus error (magnitudeand sign) but unlike phase detection, it doesnot require specialized hardware. Like contrast measurement, the method is imagebased and can operate in “Live View” mode,but unlike contrast measurement, it does notrequire an iterative search for best focus. Andbecause the method is image based and can beimplemented exclusively in software, it hasthe potential to improve performance withoutincreasing manufacturing cost.This same method for estimating focus
error may also be useful for improving certainmedical technologies. A number of differentassistive vision devices have hit the market inrecent years. These devices act, essentially, as digital magnifying glasses. If these devicescould benefit from improved autofocusing,our method could apply there as well.
References1F. Autrusseau, L. Thibos, and S. K. Shevell,“Chromatic and wavefront aberrations: L-, M-, and S-cone stimulation with typical andextreme retinal image quality,” VisionResearch 51(21–22), 2282–2294 (2011);http://doi.org/10.1016/j.visres.2011.08.0202J.. Burge and W. S. Geisler, “Optimal defocusestimation in individual natural images,” Proceedings of the National Academy of Sciences of the United States of America108(40), 16849–16854 (2011); http://doi.org/10.1073/pnas.11084911083J.. Burge and W. S. Geisler, “Optimal defocusestimates from individual images for auto-focusing a digital camera,” Proc. IS&T/SPIE47th Annual Meeting, Proc. SPIE (2012);http:// doi.org/10.1117/12.9120664J.Burge and W. S. Geisler, “Optimal disparityestimation in natural stereo images,” J. Vision14(2) (2014); http://doi.org/10.1167/ 14.2.15J. Burge and W. S. Geisler, “Optimal speedestimation in natural image movies predictshuman performance,” Nature Communica-tions 6, 7900 (2015); http://doi.org/10.1038/ncomms89006R. T. Held, E. A. Cooper, J. F. O’Brien, andM. S. Banks, “Using Blur to Affect PerceivedDistance and Size,” ACM Transactions onGraphics 29(2), 19:1–19:16 (2010); http://
doi.org/10.1145/1731047.17310577S. Kasthurirangan, A. S. Vilupuru, and A. Glasser, “Amplitude dependent accom-modative dynamics in humans,” VisionResearch 43(27), 2945–2956 (2003).8P. B. Kruger, P. B., Mathews, S. M. Katz, K. R. Aggarwala, and S. Nowbotsing,“Accommodation without feedback suggestsdirectional signals specify ocular focus,”Vision Research 37(18), 2511–2526 (1997).9K. J. MacKenzie, D. M. Hoffman, and S. J.Watt, “Accommodation to multiple-focal-plane displays: Implications for improvingstereoscopic displays and for accommodationcontrol,” Journal of Vision 10(8), 22 (2010);http://doi.org/10.1167/10.8.2210S. Sebastian, J. Burge, and W. S. Geisler,“Defocus blur discrimination in naturalimages with natural optics,” Journal of Vision15(5), 16 (2015); http://doi.org/10.1167/15.5.1611R. Shapley and M. J. Hawken, “Color in thecortex: single- and double-opponent cells,”Vision Research 51(7), 701–717 (2011);http://doi.org/10.1016/j.visres.2011.02.01212W. W. Sprague, E. A. Cooper, S. Reissier, B. Yellapragada, and M. S. Banks, “The natural statistics of blur,” Journal of Vision16(10), 23 (2016); http://doi.org/10.1167/16.10.2313A. Stockman and L. T. Sharpe, “The spectralsensitivities of the middle- and long-wave-length-sensitive cones derived from measurements in observers of known geno-type,” Vision Research 40(13), 1711–1737(2000).14L. N. Thibos, M. Ye, X. Zhang, and A.Bradley, “The chromatic eye: a new reduced-eye model of ocular chromatic aberration inhumans,” Applied Optics 31(19), 3594–3600(1992).15C. F. Wildsoet and K. L. Schmid,“Emmetropization in chicks uses optical vergence and relative distance cues to decodedefocus,” Vision Research 41(24), 3197–3204(2001).16D. R. Williams, “Visibility of interferencefringes near the resolution limit,” J. Opt. Soc.Am. A 2(7), 1087–1093 (1985).17B. J. Wilson, K. E. Decker, and A. Roorda,“Monochromatic aberrations provide an odd-error cue to focus direction,” J. Opt. Soc. Am.A, Optics, Image Science, and Vision, 19(5),833–839 (2002). n
Information Display 1/17 23
ID Burge p18-23_Layout 1 1/2/2017 10:33 PM Page 23
ID: Can you tell us a little about LEIA? How did you get started?What’s the mission?
DF: LEIA, Inc., is a technology spinoff from HP Labs. Our researchteam had been working on optical interconnect for many years,an area of photonics concerned with the transmission andmanipulation of information in optical-form inside computerchips. Using specially designed nano-photonic structures simi-lar to diffraction gratings, we were routinely extracting light fromplanar “photonics” chips into directional light beams that wouldbe coupled to optical fibers and transported to another chip. Weenjoyed great success in controlling the precise parameters oflight extraction using wavefront engineering techniques. Today, these same types of nano-structures and wavefront
engineering methods are powering LEIA’s core holographic-display technology. We became an independent company,based in Menlo Park, California, in early 2014. We have a clearmission to accelerate the time to market for smartphone displayproducts. And beyond cell phones, we are also now looking atall kinds of form factors – from tablet to laptop to automotive.
Our long-term goal is to become THEinterface technologyto the digital world,
letting you visualize, manipulate, and touch 3D holographiccontent from any type of screen.
ID: How does LEIA’s holographic technology work?DF: Today, LEIA’s products are based on a slight modification of
an LCD. We use an off-the-shelf LCD frontplane and simplyaugment the backlighting unit with our nano-structures, result-ing in a so-called diffractive light-field backlight (DLB). Theresult is a display that you can either operate in its original 2Dmode – with no loss of brightness or resolution – or in a light-field “holographic” mode, where many different images can beprojected into different regions of space, producing an effect ofboth depth and parallax for several viewers at a time.
ID: So what would it be like for me to use this technology?DF: First and foremost, you have the option to operate the display in
conventional 2D mode. In a smartphone context, this would bethe normal mode of operation for the home screen, readingnews and emails, or even for operation in a VR headset such asGear VR or Google Daydream. But you would also have theoption to launch a 3D app – HoloChat, for instance – where thedisplay would transition smoothly to light-field mode and letyou enjoy a conversation with a holographic image of a friend,
ID Interviews David Fattal, Founder and CEOof LEIA, a Silicon Valley Startup That Is Developing an Interactive HolographicDisplay for Mobile DevicesDavid Fattal was the principal investigator of the LEIA project at HP Labs, from where he leda spin-off in late 2013 to co-found LEIA, Inc. Fattal spent his early career in the QuantumPhotonics group at HP Labs, specializing in the manipulation of light at the nanoscale. He has a Ph.D. in physics from Stanford University and a B.S. in mathematical physics from Ecole Polytechnique, France. In 2013, he was featured in the MIT Tech Review list of35 Innovators under 35 and was also awarded the French Order of Merit for inventing the Multiview Backlight concept. He is the author of 80 granted patents.
Conducted by Jenny Donelan
Jenny Donelan is the Managing Editor ofInformation Display Magazine. She can bereached at [email protected].
24 Information Display 1/170362-0972/1/2017-024$1.00 + .00 © SID 2017
market insights
ID Donelan Interview p24-25_Layout 1 1/2/2017 8:32 PM Page 24

seen directly on the device (no headsetneeded). This image would provide asense of depth, parallax, and accurate rendering of textures. Skin looks like skin (without that “plastic” effect you get with a 2D display) and metal lookstruly “shiny” due to the ability to create an angle-dependent treatment of lightreflections.As long as you stay within the pre-
scribed field of view (anywhere between30 and 90° depending on the version), theparallax movement is coherent. If you wantto see completely around objects, we usetricks to detect the relative motion of thephone to the user’s face and are able toshift the field of view dynamically toaccommodate extreme points of view (ourso-called dynamic-FOV feature). Last butnot least, our handsets will soon beequipped with a hover touch feature that will let users manipu-late holographic content above the screen using finger motion.The resulting experience is quite magical.
ID: It sounds like it! What are some other likely applications?DF: Gaming and 3D video streaming are obvious applications for
which an ecosystem is already in place, and tons of content isreadily available. But this is barely scratching the surface. We are big believers in “social 3D,” a suite of apps giving youthe ability to scan your friends and yourself in 3D and use theseavatars in messaging, videos, chat, social networks, etc. (See,for example, AltspaceVR at https://altvr.com.) Augmented reality is another big potential application, letting you introduce3D digital content over the real world seen though the device.
ID: What recent breakthroughs have made this technology commer-cially viable today vs. yesterday?
DF: There is a combination of factors. First, nano-manufacturingmethods have recently achieved an unprecedented level ofmaturity, which allow the mass-fabrication of our backlightparts. This is how we can reliably define structures with dimen-sions of a few hundred nanometers at very precise locations onthe surface of the backlight and in a cost-effective way. Second,mobile chipsets are now powerful enough to handle 3D renderingat sufficient speed and decent power-consumption levels. Andit’s only getting better with the push for VR.
Last but not least, the 3D ecosystemhas grown tremendously from that of afew years ago. Most games today arebased on 3D assets rendered for a 2Dscreen, and they are straightforward tore-compile for a LEIA screen. Shootingreal content in 3D has become routine,and content developers are now lookingforward to the next multiview mediaplatform. It could be VR or it could beus – the good news is that the data for-mats are almost identical.
ID: Do you have plans to jump-start yourbusiness?
DF: We announced a partnership with thetechnology and media group Altice backin May to bring the first holographicsmartphone to the European market bythe end of 2017.
ID: What challenges/pitfalls do you expect to encounter? DF: The main challenge at this point is to get enough content ready
for the launch. We are well on our way there.
ID: From an entrepreneurial standpoint, what does it take for some-one to start a business like this?
DF: To tell you the truth, you need to be extremely self-confidentand slightly crazy. Not many new display technologies havebeen successful in the marketplace in recent years. However,you don’t stumble on a major innovation like that poweringLEIA very often either. When starting LEIA, we made a big betthat leaving the corporate world to build a new venture fromscratch was the right thing to do. Now that the technology iscommercially ready with paying customers, this seems like ano-brainer, but at the time we (and our early investors) weretaking a big risk.
ID: What lessons have you learned so far?DF: Just keep your head down and keep grinding!
Readers can see LEIA’s technology first-hand, including smartphonedemos, at Display Week 2017 in Los Angeles this May. n
Information Display 1/17 25
Just keep your head down and keep grinding! “ ”
David Fattal
ID Donelan Interview p24-25_Layout 1 1/2/2017 8:32 PM Page 25

ANTI-REFLECTION (AR) coatings areoften used on the outermost glass surface offlat-panel displays to reduce glare andincrease visibility. But while AR coatingtechnology has been utilized for decades with a variety of precision optics, includingtelescopes, camera lenses, microscope optics,laser components, and even eyeglasses, its use in display applications presents somechallenges not encountered in those otherapplications. In particular, display manufac-turers are often highly concerned with theapparent color and unit-to-unit consistency ofthe coating. Even slight variations in a thin-film coating that do not put it out of specifica-tion in terms of overall reflectance andtransmittance values can change the reflectedcolor in a way that is readily perceptible to theeye, thereby impacting perceived quality andvalue. These variations are common in ARcoatings. This article reviews the need for coatings
and how they operate and explores the tech-nology used for quantifying coating perform-ance and color. Finally, we discuss theexperiences of MAC Thin Films, a manufac-turer of coatings for display applications, andshow how this company implemented instru-mentation from Gamma Scientific to success-fully perform coating color measurement on aproduction basis.
AR Coating BasicsA glass window forms the topmost layer ofmost commercial display types, includingLCDs and AMOLED displays and virtually alltypes of capacitive touch-screen displays.Glass by itself reflects about 4% of incidentvisible light at each interface with air (withnormal, 0° angle of incidence). Since theglass display window is invariably bonded toanother material, usually a polarizer, this 4%reflectance generally occurs only at the outer-most layer of the display. However, even thisrelatively low reflection is still sufficient to bevisually distracting and can make the displaysubstantially harder to read in high ambientlight. To compensate for this, the user willoften increase display luminance, consuming
more precious battery power. The applicationof an AR coating to the top glass surfacereduces the reflection to a much lower leveland therefore improves both optical perform-ance and battery life. AR coatings consist of one or more thin
layers of materials, typically dielectrics,which are deposited directly on to the surfaceof the glass. These layers modify thereflectance characteristics of the glass throughthe mechanism of optical interference,enabled by the wave properties of light. Asimplified schematic of how this works isshown in Fig. 1. The conditions shown in the figure for
complete elimination of the reflection using asingle-layer coating can only be exactly satis-
Quantifying Display Coating AppearanceModern displays often utilize anti-reflection coatings to enhance contrast and improve read-ability. However, display manufacturers have unique requirements for coatings not found inother industries. New metrology instrumentation has been designed to obtain the necessarymeasurements for display makers and to work with the thin glass substrates increasinglyemployed in display fabrication.
by Trevor Vogt
Trevor Vogt is Technical Product Manager atGamma Scientific and can be reached at [email protected], www.gamma-sci.com.
26 Information Display 1/170362-0972/1/2017-026$1.00 + .00 © SID 2017
frontline technology
Fig. 1: This schematic shows a representative single-layer AR-coating operation. Illustrationcourtesy Gamma Scientific.
ID Vogt p26-30_Layout 1 1/2/2017 10:35 PM Page 26

fied at one wavelength and one angle of inci-dence. Thus, while single-layer AR coatingsare widely used, thin films for more demand-ing applications often comprise multiple layers of various materials and thicknesses.These more complex multilayer designs candeliver higher performance and enable opera-tion over a wider range of wavelengths andincident angles. They also permit the use of the most practical and readily availablecoating materials.
Coating Fabrication ChallengesThere are a number of different technologiescurrently in use for producing the types ofmultilayer thin-film optical coatings justdescribed. Typically, these involve convertinga series of solid coating materials into vaporutilizing heating, sputtering, or some kind ofchemical means. The process is performedwithin a vacuum chamber, and, in some cases,oxygen or other gasses are introduced to thechamber to react with the coating material andcreate new species. Once vaporized, the
coating material eventually recondenses onthe surface of the substrate in a thin layerwhose thickness is carefully controlled. Theuse of different coating materials in seriesallows for multilayer films of substantial complexity and sophistication to be created. Of course, any real-world manufacturing
process experiences variations. For coatings,these are most significantly errors in layerthickness and variations in layer refractiveindex from the design goal. These small vari-ations become particularly important in coat-ings for consumer display applicationsbecause cosmetic coating appearance is moreimportant in this context than for most otheruses. A particular problem arises because virtu-
ally all AR coatings appear to have a colorcast when viewed in reflection under white-light illumination. Furthermore, this colordepends very strongly on the exact thicknessand refractive index of each individual coatinglayer. Even slight variations in these parameters,which are not large enough to keep the coating
from meeting its nominal reflectance andtransmittance specifications, can significantlyinfluence its visual appearance. Thus, it iscommon to see batch-to-batch variations inreflected color for a given AR coating design. These variations in perceived coating color
are particularly objectionable to display manufacturers who want a product that isvisually consistent from unit to unit and thatconforms to cosmetic standards congruentwith brand image. For example, manufacturerswant to be able to display their products sideby side in retail stores without the consumerseeing obvious differences in color (whetheras a result of coatings or other causes).
Color-Measurement BasicsFor the manufacturer, the first step in control-ling coating color is measuring it accurately.The schematic of one type of system for quan-tifying surface reflectance is shown in Fig. 2.In this instrument, called a goniospectrophoto-meter, a light source is focused at a non-normal angle of incidence onto the surface
Information Display 1/17 27
Fig. 2: The main functional optical elements of a goniospectrophotometer include (left) optics for focusing a light source onto the device undertest and collecting the reflected light and (right) a dispersive element and array detector that enables the spectral content of the collected light tobe analyzed. Illustration courtesy Gamma Scientific.
ID Vogt p26-30_Layout 1 1/2/2017 10:35 PM Page 27

under test. In order to make measurementsthat span the entire visible spectrum, a broad-band light source, such as a halogen bulb, isused. Collection optics are positioned exactly
opposite the source angle of incidence in order to collect specularly reflected light (as opposed to scattered light). The gathered light is then focused into a fiber-optic cable. Sometimes thepositions of the focusing and collection opticscan be mechanically adjusted along an arc,centered on the surface under test, to enablemeasurements at a variety of incidence angles. The fiber feeds into an optical multichannel
analyzer (OMA). This is a type of spectrum-eter that uses a diffraction grating to split thebroadband input light into its spectral compo-nents. This light is then focused onto theequivalent of a 1024-pixel linear-array detectorso that each element of the array only collectslight from a small band of wavelengths. This allows the instrument to make a rapidmeasurement of reflectance intensity as afunction of wavelength over the entire desiredspectral range all at once. However, this spectral reflectance data does
not quantify how an object appears to thehuman visual system (its perceived color).And even minor changes in the reflected spectrum can affect the human experience ofcolor. Representing color in a way that corre-
lates well with human visual experiencerequires working in a calibrated color space,such as those defined by the InternationalCommission on Illumination (CIE). Theradiometric spectral data from the OMA is,therefore, mathematically converted into colorimetric tristimulus values which can thenbe mapped into any one of the numerous CIEcolor spaces.
Advanced Coating MeasurementTechnologyVarious embodiments of this type ofgoniospectrophotometer technology havebeen commercially available from a numberof manufacturers for decades. This basicmeasurement engine design is effective andwell-proven. However, all past commercialproducts have had some combination of practical limitations that prevented their use inhigh-volume industrial inspection applicationssuch as display metrology. One significant drawback of most commer-
cial goniospectrophotometers is that theiroptics collect light from several of the manyclosely spaced multiple reflections that occurin a glass component, when all that is desiredis the first reflection from the top surface (see Fig. 3). This is particularly problematicwhen measuring AR coatings on an individualglass substrate because the signal from the top
(AR coated) surface is much smaller than theunwanted returned light from the uncoatedbottom surface. Note that these multiplereflections do not occur when the glass is integrated into a tablet or cell-phone displaybecause then the bottom glass surface will bein contact with another material (usually apolarizer) having a similar index of refraction.Rather, this issue only occurs when attemptingto measure the glass substrate after coating,but before it is integrated into the displayassembly. This is a specific application challenge because the testing is performed by the cover-glass manufacturer, not the finaldisplay integrator. At point of test, the glassmanufacturer has no access to the polarizer orthe other display components that will eventu-ally be used with it. But manufacturers stillneed to ensure that the glass they produce willdeliver the necessary performance in the finalassembly. Thus, they need to suppress the second surface reflectance (because the polarizer will eliminate it in the final display assembly)and measure just the first surface reflectance. The reflection from the bottom surface can
be reduced or eliminated by covering it withan absorptive paint or by placing that surfacein contact with an index-matching fluid.However, both of these approaches introduceextra steps into the measurement process(painting, cleaning, etc.), often representingan unacceptable increase in production costsfor high-volume fabrication.Alternately, some instrument makers do not
suppress the second surface reflection, butinstead use a mathematical algorithm to subtract it from the measured data. Unfortu-nately, this indirect approach requires thatassumptions be made about the refractiveindex and absorption characteristics of theglass under test, which cannot easily be verified. This method therefore substantiallylimits results accuracy. A more ideal solution is to introduce some
sort of spatial filtering into the collectionoptics. This takes advantage of the fact that,at other than normal incidence, there is asmall lateral displacement between the desiredtop surface reflection and the other multiplereflections. Thus, the unwanted light can bephysically blocked out. This approach delivers superior accuracy,
especially for AR coatings, and does notincrease measurement cost or reduce measure-ment speed. And, importantly, this methodcan be successfully applied with glass
frontline technology
28 Information Display 1/17
Fig. 3: Light striking a glass plate at an angle undergoes multiple reflections. Illustrationcourtesy Gamma Scientific.
ID Vogt p26-30_Layout 1 1/2/2017 10:35 PM Page 28

substrates having thicknesses as low as 0.5 mm. This is critical because thin glass isfinding increasing use in displays. The other significant limitation of many
goniospectrophotometers is that they aredesigned for laboratory use rather than for in-line production environments. Typically,they can only measure a small (usually 2 in.square) witness sample. Furthermore, theirmeasurement speed (several minutes) is notalways sufficient to keep pace with productionprocesses.Gamma Scientific has recently developed
new technology to address these shortcomingssimultaneously. Specifically, its goniospec-trophotometers all incorporate spatial filteringto suppress second surface reflectance anddeliver highly accurate measurements (Fig. 4).Spatial filtering takes advantage of the factthat, at non-normal angles of incidence, the(unwanted) second surface reflection is laterally displaced from the first surfacereflection. An appropriately sized aperture,also called a spatial filter, can therefore beplaced into the beam path to block the secondsurface reflection, preventing it from enteringthe OMA. Additionally, the measurement speed has
been reduced from seconds down to milli-seconds through the use of use of a highlyefficient optical design and the CCD-arraydetector in the OMA. The detector employedis of a type referred to as “back-thinned,”which offers increased sensitivity and shorterexposure times than front illuminated detectors.In a conventional front-illuminated CCDdetector, the pixel drive circuity is on the topside (where the light comes in). This circuitryreflects some of the incident light causing areduction in signal, and hence reducing devicesensitivity. A back-thinned sensor is just asthe term implies – the silicon-wafer substrateof the CCD is reduced in thickness during fabrication, allowing the finished sensor to beused with light entering the back rather thanthe front side. Thus, the light does not have topass through all the driver circuitry. This canimprove the chance of an input photon beingcaptured from about 60% to over 90%, thussubstantially improving sensitivity. Thus,back-thinned sensors are often employed inlow-light optical measurement applications. These instruments have also been optimized
to test substrates of essentially any size inline, and they can be configured with motioncontrol and part-handling hardware to support
fully automated operation. This is possiblebecause these systems are not configured likeconventional spectrophotometers, which areself-contained instruments into which theoperator places a small (typically 2-in. square)witness sample in order to perform testing.Instead, the Gamma Scientific system consistsof a goniospectrophotometer optical measure-ment head (as previously described) whichsits over a large testbed. This testbed can besized to allow parts of virtually any dimen-sions to be placed on it, and then positioned(manually or under motorized control) forrapid measurement. The goniospectrophotometer acquires the
spectral power distribution function (e.g.,reflectance as a function of wavelength) of thedevice under test, and then inputs this rawdata into the tristimulus equations. Thisenables the calculation of color values for anyarbitrary color space under any illuminationconditions (most commonly D65). In turn,this allows the visual appearance of the part,under any lighting conditions, to be determined. Another key aspect of the system software
is that it performs a non-linear regression on
the measured data. In order for this to workwith an optical coating, the system is origi-nally programmed with a model of the nomi-nal coating design (e.g., layer thickness andrefractive indices) and also given informationon which parameters might vary in actual production. When a part is measured, thesoftware can then determine its likely coatingparameters. Thus, if a coating is not perform-ing to specification, the system is able to iden-tify which coating layer(s) are in error, and theparticular nature of that specific error (e.g.,incorrect thickness). This enables the manu-facturer to rapidly identify and correct specificproblems with its process without any guess-work.The system software is originally config-
ured by an engineer or R&D person with technical expertise who inputs all the processparameters. They can also determine how thedata will be displayed to production personneland set pass/fail criteria for virtually any measured parameter (spectral power distribu-tion, color, various layer parameters, etc.).Thus, production-line personnel can be presentedwith anything from detailed measurement
Information Display 1/17 29
Fig. 4: This simplified schematic shows the spatial-filtering technique used to effectively eliminate second-surface reflections from reflectance measurements.
ID Vogt p26-30_Layout 1 1/2/2017 10:35 PM Page 29

results to an extremely simplified interfacethat simply provides pass/fail results for anycriteria of interest to the manufacturer.
Display-Glass Metrology at MAC ThinFilmsMAC Thin Films, a manufacturer of high-performance mirror and AR coatings, recentlybegan using a Gamma Scientific goniospec-trophotometer for production screening of itscoatings. The rest of this article describeshow this enabled a dramatic difference in process capability. MAC Thin Films employs a continuous
process for multilayer thin-film coating. Here,the glass is loaded on to a conveyor belt andthen transported into a series of airlock cham-bers where a progressively higher vacuum isdrawn. Once at the appropriate vacuum levelfor coating, the glass moves through a seriesof deposition chambers, all of which arealready evacuated. In each station, a singlelayer of coating material can be deposited.Finally, the glass enters another series of air-lock chambers where it is returned to ambientpressure. As product advances through eachstage of the system, new parts are beingloaded and finished parts are being unloaded. In this type of continuous processing, it is
critical to know as soon as possible when anycomponent of the process has gone out ofspecification. This is because the longer thedelay before a problem is identified, thegreater the number of out-of-specificationparts (i.e., scrap) that are produced. The AR coatings for display applications
produced at MAC Thin Films are usuallyspecified to deliver less than 1% reflectancethroughout the entire visible spectrum. Overthe past several years, it has also becomecommonplace for customers to specify theapparent color of the coating as well. However, most customers do not start with anumerical specification for this, in terms ofthe coating’s nominal CIE color coordinatesand tolerances. Rather, MAC Thin Films usually determine these parameters through an iterative process with prospective customers, in which they are shown a series of samples and then pick out the range of ones that look acceptable. For most customers, MAC Thin Films coats
32 × 50 in., or 25 × 32 in., substrates. Theseare subsequently cut down into individualpieces that are the size of the finished display.In the case of chemically strengthened glass,
the pieces are supplied already cut to finalsize. The thickness of the substrates rangesfrom 0.7 to 10 mm. During a typical production run, one piece is
taken off the line every 10 minutes for inspec-tion using the Gamma Scientific system. Theprocess at MAC Thin Films is highly stable,so this level of sampling has been found to beadequate. For substrates receiving the Print-Free coating, a second set of color measure-ments are taken after that process too. To perform a measurement, a technician
first places the part by hand on the instru-ment’s testbed. The system’s optical headautomatically acquires focus with micron-level precision which is critical for properoperation of the second-surface suppressionoptics. To achieve this precise focus, theinstrument utilizes an off-the-shelf laser-baseddistance sensor, which is mounted on thegoniosphectrophotometer optical head. Theglass testbed itself is mounted on a high preci-sion z-axis motion stage. A feedback loop isused to vertically adjust the height of the glasssurface until it is at the correct distance fromthe optics, which have a known fixed focaldistance. This eliminates any errors due tovariations in glass thickness or mechanicalplacement on the testbed. Once focus is acquired, which takes just a
fraction of a second, a measurement is made.Typically, for a 32 × 50 in. substrate, the technician samples the part at three locations
– the center and two diagonally oppositeedges. Each measurement takes about 10 sec(Fig. 5).Usually, the system is programmed to
deliver a graph of reflectance as a function ofwavelength and the color coordinates at eachmeasured point. This is the data supplied tothe customer. Additionally, the system soft-ware is set to display the results in a colorcoded, “go/no go,” map which immediatelyalerts the operator when a part is out of speci-fication. Furthermore, trend charting is usedto indicate how the coating process is devel-oping over time so that nascent problems canbe identified and fixed before they result inthe production of scrap product. The non-linear regression capabilities of the softwareare particularly useful in this connectionbecause they allow the exact nature of anyproblems with the coating process (such as anerror in layer refractive index) to be specifi-cally identified. In conclusion, sophisticated thin-film
coatings are now a standard part of displayfabrication for many applications. This technology, together with a greater emphasison product cosmetics, has created a need formetrology equipment that can quantify bothcoating performance and appearance, andwhich delivers the speed and ease-of-use necessary for employment in today’s produc-tion environments. n
frontline technology
30 Information Display 1/17
Fig. 5: A worker places glass onto a roller bed and then positions it under the optical head inorder to perform a measurement. Photo courtesy MAC Thin Films.
ID Vogt p26-30_Layout 1 1/2/2017 10:35 PM Page 30

4 |
w w w.Informat ionDisp lay.org 2017 PRINT & DIGITA L MEDI A GU IDE
INFORMATION DISPLAY
2017 Editorial CalendarTHE DISPLAY INDUSTRY’S SOURCE FOR NEWS AND TECHNICAL INFORMATION
Issue Editorial Coverage Ad Closing Date
January/February Applied VisionSpecial Features: Reducing Stereoscopic Artifacts, Realizing Augmented and Virtual Reality, New Display Frontiers, Cool New Devices for a New Year
Markets: Game developers, medical equipment manufacturers, research institutions, OEMs, software developers, wearable designers, entertainment industry research and developers
December 28
March/April Display Week Preview, Display MaterialsSpecial Features: SID Honors and Awards, Symposium Preview, Display Week at a Glance, MicroLEDs, Progress in OLED Manufacturing, Disruptive Materials, Nine Most Important Display Trends from CES
Markets: OEMs, deposition equipment manufacturers, entertainment industry research and developers, display and electronic industry analysts
February 27
May/June Display Week Special, Automotive DisplaysSpecial Features: Display Industry Awards, Products on Display, Key Trends in Automotive Displays, Head-up Designs for Vehicles, Novel Interfaces for Automobiles
Markets: Consumer products (TV makers, mobile phone companies), OEMs, research institutes, auto makers, display module manufacturers, marine and aeronautical companies
Bonus Distribution: Display Week 2017 in Los Angeles
April 18
July/August Wearable, Flexible Technology and HDR & Advanced DisplaysSpecial Features: Flexible Technology Overview, Advanced Displays Overview, Wearables Round-up, Overcoming HDR Challenges
Markets: Research institutions, OEMs, OLED process and materials manufacturers, entertainment industry research and development, measurement systems manufacturers
June 16
September/ October
Display Week Wrap-up, Digital Signage Special Features: Display Week Technology Reviews, Best in Show and Innovation Awards, Digital Signage Trends, Ruggedization Challenges for Digital Signage
Markets: Large-area digital signage developers; in-store electronic label manufacturers, advertising and entertainment system developers, consumer product developers, retail system developers
August 22
November/ December
Light-field and Holographic SystemsSpecial Features: Real-world light-field applications, holographic approaches, solving problems of next-generation displays
Markets: OEMs, Consumer product developers, research institutes, auto makers, entertainment and gaming developers; measurement systems manufacturers
October 20
SID-2017.indd 4 11/4/16 5:03 PM
2017 EDITORIAL CALENDAR
Official Monthly Publication of the Society for Information Display
Contact: Roland Espinosa
INFORMATION DISPLAY MAGAZINEAdvertising Representative
Phone: 201-748-6819 • Email: [email protected] View the Information Display Website: www.informationdisplay.org
� January/FebruaryApplied Vision Special Features: Reducing Stereoscopic Artifacts,Realizing Augmented and Virtual Reality, New DisplayFrontiers, Cool New Devices for a New YearMarkets: Game developers, medical equipment manufac-turers, research institutions, OEMs, software developers,wearable designers, entertainment industry research anddevelopersDecember 28: Ad closing
� March/AprilDisplay Week Preview, Display MaterialsSpecial Features: SID Honors and Awards, SymposiumPreview, Display Week at a Glance, MicroLEDs, Progress inOLED Manufacturing, Disruptive Materials, Nine MostImportant Display Trends from CESMarkets: OEMs, deposition equipment manufacturers, enter-tainment industry research and developers, display and elec-tronic industry analystsFebruary 27: Ad closing
� May/JuneDisplay Week Special, Automotive DisplaysSpecial Features: Display Industry Awards, Products onDisplay, Key Trends in Automotive Displays, Head-upDesigns for Vehicles, Novel Interfaces for AutomobilesMarkets: Consumer products (TV makers, mobile phonecompanies), OEMs, research institutes, auto makers, displaymodule manufacturers, marine and aeronautical companiesApril 18: Ad closing Bonus Distribution: Display Week 2017 in Los Angeles
� July/AugustWearable, Flexible Technology and HDR & AdvancedDisplaysSpecial Features: Flexible Technology Overview, AdvancedDisplays Overview, Wearables Round-up, Overcoming HDRChallengesMarkets: Research institutions, OEMs, OLED process andmaterials manufacturers, entertainment industry researchand development, measurement systems manufacturersJune 16: Ad closing
� September/OctoberDisplay Week Wrap-up, Digital SignageSpecial Features: Display Week Technology Reviews, Bestin Show and Innovation Awards, Digital Signage Trends,Ruggedization Challenges for Digital SignageMarkets: Large-area digital signage developers; in-storeelectronic label manufacturers, advertising and entertainmentsystem developers, consumer product developers, retail sys-tem developersAugust 22: Ad closing
� November/DecemberLight-field and Holographic SystemsSpecial Features: Real-world light-field applications, holo-graphic approaches, solving problems of next-generation dis-playsMarkets: OEMs, Consumer product developers, researchinstitutes, auto makers, entertainment and gaming develop-ers; measurement systems manufacturersOctober 20: Ad closing
LIGHT-FIELD DISPLAY SYSTEMS
Official Publication of the Society for Information Display • www.informationdisplay.orgJuly/August 2016Vol. 32, No. 4

SID Revises Governance StructureThe Society for Information Display hasrevised its governance structure, the first suchmajor update since the Society was founded50-plus years ago. Among the major changesare a reduction in the size of the Board ofDirectors and the replacement of ChapterDirectors with Regional Vice Presidents interms of Board participation. InformationDisplay asked SID President-Elect HelgeSeetzen, one of the architects of the new structure, to describe the changes and howthey will affect SID operations and members.
by Helge Seetzen
The governance structure of the Society forInformation Display has been largelyunchanged for almost half a century. It isnearly as old as the Society itself, founded in1962. That structure helped SID thrive andsuccessfully manage its business for a verylong time.
Since the 1960s, however, the world hasevolved dramatically, and in order to keeppace with that evolution, SID’s ExecutiveCommittee recently set about creating a modern governance structure for the Society.The goal was to retain the best elements of the existing structure while improving on it.A supporting goal was to create the leastamount of disruption to members, chapters,and the organization as a whole.
The original structure, in brief, consisted ofa Board of Directors (BoD) made up of fiveofficers: the Treasurer, Secretary, President-Elect, President, and Past-President; threeRegional Vice Presidents; and one elected representative from each chapter (ChapterDirectors). These Chapter Directors wereelected by their respective chapters to serve a3-year period. Currently, there are 28 chaptersaround the world, not including student chapters. An Executive Committee (EC)made up of the officers and the regional VPswas charged with conducting the business ofSID, under the direction of the Board.
Traditionally, SID business meetings havebeen held three times a year (in January, atDisplay Week in May or June, and in the fallat an international conference) with the ECmeeting on the first day and the Board ofDirectors the day afterward. At the BoDmeeting on that second day, SID business proposed by the EC was voted on, with at
least one-half of the board present constitutinga quorum for conducting business.
Highlights of the recent changes (whichwent into effect starting January of 2017) andthe reasons behind them are as follows:
● Reducing the Size of the Board: In thepast, a meeting of the Board of Directorsof the Society had a nominal invitationlist of 36 full voting members, includingChapter Directors and assorted CommitteeChairs. With such a large group, minimumattendance levels to achieve a quorumwere sometimes not achieved; almostevery meeting turned into an administra-tive struggle to secure enough proxyholders and conference-call attendees tomake quorum. The new structure, withfewer mandatory attendees, shouldensure that key governance can takeplace as needed with well-informed representatives.
● New Board Composition:● Two Tenure-Based Officers (President,
Past-President)● Three Elected Officers (President-
Elect, Treasurer, Secretary)● Seven Elected Regional Vice-Presidents
representing the Bay Area, Pacific North West, South America, East Americas, Europe, Japan, Greater China, and the Rest of Asia
The main benefit of the new system is thatthe representation of the regions will greatlyincrease at the governance level. Previously,there were three RVPs participating in an eight-person Executive Committee. Now thereare seven RVPs out of a 12-person board. So,the regions go from being “add-ons” to beingthe majority of the core leadership of the Society. In addition, global membership representation by Chapter Directors at theboard meetings did not used to be evenly dis-tributed – for example, there were 10 Direc-tors for America vs. one for Japan because allof Japan is included in one SID chapter. Thehope is that this change will not only providemore visibility to the various regions, but alsodrive regional development of SID, especiallyin “newer” areas such as China and India.
Better Representation through Regional VPs The role of the RVPs is the same as before.There will just be more of them and they willbe more homogenously distributed. EachRVP will represent between 400 and 700members, so every member has an equal voice
(as opposed to the past system of ChapterDirectors in which the director of a chapterwith 10 members had the same vote as thedirector of a chapter with 700 members).Apart from the obvious inequality in represen-tation, this created many problems in areassuch as workload distribution, chapter funding,administrative oversight, and so forth. Thenew structure’s proportional representation for Society members will include systems toadjust representation over time to future-proofthe governance structure.
In addition, SID is planning to provideadditional budget and local authority to theRVPs, which should allow them to better support the chapters in their regions. Finally,the RVPs will act as a communication inter-face between the Board and the chapters/members in the regions.
Chapter ConsiderationsSince chapters have been a primary elementof the Society since its inception, it may behelpful to take a closer look at how the gover-nance changes will affect them. Except forthe elimination of the official title of ChapterDirector, nothing really changes. There are,however, two optional transitions. First, forchapters with active volunteers in the leader-ship team, SID recommends the introductionof a Chapter President who will perform theduties of the previous Chapter Director (withthe exception of belonging to the BoD andattending its meetings). The President title isoptional but may be useful in maintaining volunteer engagement and organization.
Second, SID is now offering virtual bankingas an option. In the past, chapters wererequired to have their own financial structure– as incorporated entities – in order to receiverebates. This required financial managementand reporting to HQ that could be difficult andtime consuming. Moreover, setting up legalentities like this can be challenging in someregions. SID has therefore introduced a virtual banking option in which the RVP canoffer to centrally administer a chapter’s finan-cials in a virtual account – assisted by HQ –from which chapter expenses can be paid.This removes the need for financial reportingwhile maintaining the chapter’s ability to paylocal expenses. Any chapter can also keep itscurrent banking system. SID expects that virtual banking will make it easier to establishnew chapters, especially in emerging regionswhere setting up legal entities is difficult.
32 Information Display 1/17
NEWSSOCIETY FORINFORMATION
DISPLAY
ID SID News Issue1 p32-33_Layout 1 1/2/2017 8:46 PM Page 32

Existing chapters should continue to provide member services and work with theirnew RVPs to see if they can encourage expan-sion of such services. Geographically diversechapters could consider forming “spin-off”chapters in remote regions. For example, theCanadian chapter is largely concentrated inthe Ontario area, where the bulk of the membersreside, but it might be possible to create aVancouver chapter to serve the emerging display community there (some 2000 kmaway from Ontario). This model has emergedorganically in the US, where there are over adozen local chapters, and the new governancemodel will allow the Society to do the same inother regions. The first step toward some-thing like this will be to find local championswho can act as the leadership seed for suchnew chapters.
In terms of logistics, the Regional VPs willreport to their chapters after each board meeting.For face-to-face interaction, SID is institutingan annual Chapter Day during Display Weekthat will be attended by all chapter officersand board members.
TimingThe election process is under way, and thenew RVPs were nominated in late Decemberand January. Voting commences February15th and ends April 15th. The new Board willbe fully in place for the May 2017 meeting atDisplay Week.
Touch Taiwan 2016 Demonstratesthe Strength of the Country’sDisplay Industry The fifth International Smart Display andTouch Panel Exhibition, Touch Taiwan 2016,held August 24–26, attracted almost 25,000visitors from 12 different countries. The tradeshow, which is the world’s premier touch-panel and optical-film exhibition, also featuredLCD and OLED panels, flexible and wearabledisplays, digital signage, printed electronics,and more. Touch Taiwan is organized by theTaiwan Display Union Association in collabo-ration with several other display and electronicsassociations. The 2016 event, held at theTaipei World Trade Center’s Nangang Exhibi-tion Hall, featured 304 exhibitors from sectors including materials, components andparts, equipment and technology research, anddisplay modules and panels.
Tsai Ing-wen, President of Taiwan (officiallythe Republic of China or ROC), attended theshow’s opening ceremony, noting that the display industry has played an important rolein the country’s economy and that eventhough faced by strong competition, Taiwan’sdisplay production output is ranked numbertwo in the world. She said she believes Taiwan’s display manufacturers are well-positioned to increase the country’s industrymarket share.
Paul Peng, Chairman of the Taiwan DisplayUnion Association, reiterated the importanceof the display industry in the opening cere-mony, noting that there are approximately100,000 people in Taiwan employed in monitor manufacturing and relevant industries.The overall output of the panel sector in thecountry reaches over NT $950 billion (US$30.05 billion) each year, accounting for 7.4%of Taiwan’s entire manufacturing output, headded. He supported Tsai lng-wen’s view-point by saying that Taiwan’s display industrywill prosper in the area of connected devices,including commercial displays, telematics,gaming, wearable, smart homes, smart medi-cine, and many other new applications.
Show organizers consider Touch Taiwan2016 to be a resounding success and note thatbecause Taiwan has successfully developedtechnology for flexible AMOLED displays,they expect that technology will be transferredto domestic companies and hence become amore vital part of the show in years to come.
For Touch Taiwan 2017 early bird registra-tion, please contact TDUA Secretariat JoannaKuan at [email protected] and visit http://www.touchtaiwan.com/en/index.asp. n
Information Display 1/17 33
Display Week 2017Innovation Zone (I-Zone)
May 23–25, 2017Sponsored by E InkThe prototypes on display inthe Innovation Zone at DisplayWeek 2017 will be among themost exciting things you see at thisyear’s show. These exhibits werechosen by the Society for InformationDisplay’s I-Zone Committee for theirnovelty, quality, and potential toenhance and even transform the dis-play industry. Programmable shoes,interactive holograms, the latesthead-up displays, and much morewill not only fire your imagination,but provide an advance look at manyof the commercial products you’ll beusing a few years from now.SID created the I-Zone as a forum forlive demonstrations of emerginginformation-display technologies. This special exhibit offers researchers space to demonstrate their proto-types or other hardware demos dur-ing Display Week, and encouragesparticipation by small companies,startups, universities, governmentlabs, and independent research labs.Don’t miss the 2017 I-Zone, takingplace on the show floor at DisplayWeek, May 23–25.
I-Zone 2016 Best Prototype Award Winner:
nVerpix
VISITINFORMATION
DISPLAY ON-LINEFor daily displayindustry news
www.informationdisplay.org
For Industry News, New Products, Current and Forthcoming Articles, see www.informationdisplay.org
ID SID News Issue1 p32-33_Layout 1 1/2/2017 8:46 PM Page 33

Consider today the computer-driven appli-cations that might arguably pass the originalTuring test. Turing proposed that a humanevaluator would be unable to determine thesource of natural language conversationsbetween a human and a machine that isdesigned to converse like a human – i.e., is ita human or machine on the other side of theconversation? Turing did not even requirethat the computer render actual speech, but in fact there are several examples today ofcomputers being able to conduct natural language conversations, including those capable of producing synthetic speech with agreat deal of realism and some personality. Similarly, computers can drive cars – in
many cases better than humans. In both cases,computers are designed to mimic humanbehavior (or improve on it) using the bound-aries and conventions established by humans(like social conventions or highway rules).Essentially, you can fool a human by mimickinga human. So, with this context, we can seehow fundamental it is for any true 3D displaysystem to mimic the natural characteristics ofhuman vision if there is a hope of achieving aTuring-like outcome. As Martin succinctlystates “…an understanding of human vision isproving to be crucial to the enterprise becausein the end the goal is to provide the desiredperceptual experience for a human viewer.” Hence, the three outstanding articles that Martin has developed for us focus on this theme. Weare very grateful for his hard work, especiallythrough the holidays, to provide an excellentensemble for our ID readers.The first is a Frontline Technology article
by Michael J. Gourlay and Robert T. Held,both associated with a team at Microsoft thatis developing technology for HoloLens, Hello, and Windows Holographic. This articletitled “Head-Mounted-Display Tracking forAugmented and Virtual Reality” provides acomplete primer of the fundamental principlesof head tracking as well as describing thechallenges and best practices being developedtoday. In order for a virtual world to appearreal, the technology must be able to accuratelyrespond to an observer’s natural head andbody movements exactly as they would occurin the physical world. Getting this right willbe paramount to a seamless believable virtualexperience. This article provides a clearunderstanding of the fundamentals as well asthe latest thinking from people who areclearly driving this research area.
The second Frontline Technology feature,“Visible Artifacts and Limitations in Stereo-scopic 3D Displays,” written by Paul V. Johnson, Joohwan Kim, and Martin S. Banks,provides the most complete treatment of thissubject we have published to date and willeasily be an important reference article for thefuture. It is especially interesting to readwhere the authors point out some fairly well-accepted but apparently incorrect beliefs ofhow observers merge the left-and right-eyeimages and the perceived resolution of 3Dstereo images. New ideas employing hybridspatial, temporal, and color-based interlacingare explained and explored for their advan-tages over current methods as well – expertlytaking onto account features and limitations of human vision to gain an edge over currentmethods. The third Frontline Technology feature
from author Johannes Burge, Assistant Professorat the University of Pennsylvania, is titled“Accurate Image-Based Estimates of FocusError in the Human Eye and in a SmartphoneCamera.” Johannes reports on some excellentwork characterizing the aspects of humanvision that make focusing in the physicalworld so intuitive and apparently instanta-neous. Did you know, for example, that youprobably refocus your eyes more than 100,000times per day? When you do, I doubt youexperience any noticeable searching the waythe scene from a digital camera might appearduring focusing. That is because the humaneye has several important characteristics thathelp provide additional cues to aid adjustmentof the lens – characteristics not currently utilized in auto-focus algorithms today. I amsure you will find this article very interestingand educational. Earlier I mentioned our cover and the
technology from LEIA, Inc., being illustrated.The company’s Founder and CEO David Fattal participated in a digital interview withJenny Donelan for a Business of Displays feature to explain his company and technology,some creative applications, and his efforts tojumpstart the company to get its displays intothe hands of customers. It’s exciting partiallyin part because LEIA is working with existingcell- phone and tablet LCDs with modifica-tions to the backlight structure. Fattal refersto this capability as a “diffractive light-fieldbacklight (DLB).” The result is a display thatcan be operated either in its original 2D modeor in a 3D light-field “holographic” mode,
making its implementation into existing hand-held devices seem relatively easy. Our final Frontline Technology feature for
this month is still somewhat vision related. Itis a story by author Trevor Vogt, ProductManager at Gamma Scientific, discussing thecompany’s latest advancements in “QuantifyingDisplay Coating Appearance.” Or, morespecifically, measuring the optical perform-ance of anti-reflective (AR) and similar coat-ings directly from the substrate without someof the problems such as second surface reflec-tions usually associated with this type ofmeasurement. What I like about this article isboth the innovation (and inherent simplicity)of the solution and the company’s willingnessto discuss performance under real-world conditions at an actual coating manufacturer’sfacility. The article includes some good back-ground both on AR-coating technology and onthe current metrology methods generallyemployed as well.Turning our attention now to the good
works of our Society, we offer a special addi-tion of SID News covering the latest bylawchanges affecting the governance structure ofSID. President-Elect Helge Seetzen, withsome help from Jenny Donelan, outlines forus the reasons for the recent significantchanges to the makeup of the SID Board ofDirectors and how this will help SID growstronger in the years to come. If you were notaware of these changes, and I suspect some ofyou may not be, please take the time to readthis news. It is a great thing that is happeningand reflects the substantial vision and talentsof our SID leadership team.By now you must be thinking this is a big
issue of ID magazine, and indeed it is. I feellike we are starting the New Year off with astrong product and we could not do that with-out the incredible efforts of our Guest Editorsand all our volunteer authors. And so, onceagain I want to say thank you not only to thepeople who contributed to this issue but toeveryone who gives us their time and effort tomake Information Display come together eachissue. To everyone I wish much good health,success, and happiness in the New Year! n
continued from page 2
34 Information Display 1/17
editorial
ID Editorial Issue1 p2,34_Layout 1 1/2/2017 7:42 PM Page 34

from the wavelength distribution of thereflected light. This approach is used in thefood industry and in agriculture, among othersectors, to measure the water, fat, carbohy-drate, sugar, or protein content of foodstuffs,which is often an indication of freshness,quality, or calorie content.The LED is based on a blue 1-mm2 chip
in UX:3 technology (Fig. 1). Its light is con-verted into infrared radiation with the aid of aphosphor converter developed specifically forthis application. A residual blue component inthe light helps users target the area they wantto investigate. Such compact units for spectroscopic
chemical analyses have the potential to open a new range of applications in consumer elec-tronics. One option is a compact sensor –
similar to a USB stick – that would be usedwith an appropriate smartphone app to measure calories, freshness, or nutritionalcontent (Fig. 1). Experts expect that it will bepossible in the near future to integrate spectro-meters directly with mobile devices.
E Ink and Japan Display FormAllianceE Ink, the well-known innovator of electronic-ink technology, recently announced that it hasagreed to enter a long-term strategic alliancewith Japan Display Inc., a maker of LCD-based mobile phone and automotive displays. By partnering with E Ink, JDI will add
e-Paper technology to its existing digital
signage and mobile-phone offerings. At thesame time, JDI will continue to advance thedevelopment, production, and sales of newproducts using LCD backplane technology,including innovative e-Paper products usingJDI’s proprietary LTPS and Pixel Eyes in-celltouch to enter markets such as automotive,dynamic computer keyboards, display cards,education, IOT displays, and many more. Interms of serving E Ink, JDI’s LTPS technol-ogy can improve the performance of E Inkdisplay modules. n
Information Display 1/17 35
continued from page 3
industry news
Submit Your News ReleasesPlease send all press releases and newproduct announcements to:Jenny DonelanInformation Display Magazine411 Lafayette Street, Suite 201New York, NY 10003Fax: 212.460.5460e-mail: [email protected]
New Products Briefly MentionedAPPLE recently began shipping the latest MacBook Pro, which comes with an OLED-basedtouchbar on the keyboard for quick tool access.
GOOGLE’s Pixel and Pixel XL, the company’s first forays into the smartphone business,have been getting early positive reviews for clean looks and smooth performance.
LG ELECTRONICS is introducing a new laser projector, the LG ProBeam, with an enginethat produces a luminance of up to 2,000 lm, enabling home-cinema viewers to enjoy videocontent even in a bright room.
VOLANTI DISPLAYS, a maker of LCD-based touch-screen monitors, table displays, andvideo walls and other large-format displays, has announced the availability of interactive 4Kcollaboration touch-screen displays that use Trello collaboration software and Cnverg’swhiteboard application. The displays are available in 42-, 55-, 65-, 84-, and 98-in. sizes.
Fig. 1: The SFH 4735 (left) is the first broadband infrared LED on the market. Its primaryapplication is near-infrared spectroscopy, for example, in analyzing food (right). The chip canserve as a calorie or nutrition sensor in a smartphone, measuring the fat, protein, water, orsugar content in food. Images courtesy Osram.
J O I N S I DWe invite you to join SID to participate in shaping the future development of:
• Display technologies and display-related products
• Materials and components for displays and display applications
• Manufacturing processes and equipment
• New markets and applications
In every specialty you will find SIDmembers as leading contributors totheir profession.
http://www.sid.org/Membership.aspx
ID Industry News Issue1 p3,35_Layout 1 1/2/2017 7:49 PM Page 35
3LCDAbrisa TechnologiesAcerAdvantechApple, Inc.Applied Concepts, Inc.Applied Materials, Inc.AU Optronics Corp.CASIOCLEARinkCoretronicCynora GmbHDawar TechnologiesDontechE Ink HoldingsEarth LCDEpoxy TechnologyeMagin Corp.Europtec USA, Inc.FocalTech SystemsFUJIFILM Dimatix, Inc.Gigaphoton, Inc.GIS
HenkelIndustrial Technology Research Institute
InnoluxI-PEXJapan Display, Inc.Japan Patent OfficeKMTCLXD Research & Display,LLC
MegaChips Corp.Merck Display Technologies, Ltd.
Mitsu ChemicalsMY Polymers, Ltd.NANOSYSNLT TechnologiesNoritake Itron Corp.NvidiaOculus Panasonic Corp.Pixel ScientificPrecision Glass BendingCorp.
RealDRolic TechnologiesSakai Display ProductsSharp Corp.TDMDATDUATeijin Dupont FilmsJapan, Ltd.
TFD, Inc. TLC International TOUCH TURNSTTLAUniversal Display Corporation
US Micro ProductsVestel ElectronicsWestar Display Technologies, Inc.
YUASA SYSTEM Co.,Ltd.
EMD Performance Materials ....C3General Atomics..........................5
Radiant Vision Systems ............C2TFD.........................................C4
36 Information Display 1/17
corporate members index to advertisers
Sales Office
Steven JezzardGlobal Advertising DirectorWiley111 River StreetHoboken, NJ [email protected]
Global Sales Office (Except Japan/China)
Roland EspinosaSr. Account ManagerPrint & E Media AdvertisingWiley111 River StreetHoboken, NJ [email protected]
Japan Sales Office
Kimiyoshi IshibashiAssociate Commercial Director – JapanJohn Wiley & Sons (Asia) Pte Ltd.Frontier Koishikawa Bldg., 4F1-28-1 Koishikawa, Bunkyo-kuTokyo 112-0002, [email protected]
China Sales Office
Ying WangCorporate Sales Manager – ChinaJohn Wiley & Sons (Asia) Pte Ltd.1402-1404 Cross Tower318 Fuzhou Road, Huangpu DistrictShanghai 200001, People’s Republic ofChina
+86 21 5116 [email protected]
SILVER CORPORATE MEMBERS
GOLD CORPORATE MEMBERS
Corporate Members
ID Ad Index Issue6 p40_Layout 1 1/2/2017 7:13 PM Page 36

theperfectpixelpixel
ADVANCED MATERIALS FOR DISPLAYS – AND BEYOND. Our products promote an advanced visual experience, possibilities for new product design, improved process effi ciency in FPD manufacturing schemes and new applications beyond displays.
EMDgroup.com
EMD Performance Materials is a business of Merck KGaA, Darmstadt, Germany
Anzeige SID2016, MERCK + EMD, 206x276.indd 2 20.04.2016 17:40:19

Economical and Superior Coatings and Products
Thin Film Devices Incorporated
1180 N. Tustin Avenue, Anahiem, CA 92807
Phone: 714.630.7127
Fax: 714.630.7119
Email: [email protected]
China Supply Chain: Group International [email protected]
Korean Manufacturing: Ion-Tek [email protected]
Taiwan Manufacturing: Acrosense Technologies
Imbedded Mesh(≤ 5 OPS, T% ≥ 90% @ 420-680nm)
Glass Interposer
Flexible Dye Cell
OLED + Bank
Foundry Capability for MEMs, OLED, Banks, OPV, Dye Cell, Interposer, Chip on Glass & Others
PHOTOETCH & PATTERNING CAPABILITIES: SMALL TO LARGE SCALE
STANDARD COATING & SERVICES:
• STD TCO’s ITO/IZO/AZO/FTO & WRTCO™
• BBAR 200µm – 12µm Multiple Range
• IMITO™ (EMI & Heaters) Several Types
• Hot & Cold Mirrors Several Types
• Black Mask: Black Cr, Nb or Resist
• Custom P-Caps Several Types
• Color Filters (Resist Type) Several Types
• Lamination: Ruggedization, Glass to Glass, Anti-Vandal, Filters, EMI/Heater to LCD
MEMs
Micro Blinder


