24
Official Time Usage in the Federal Government Fiscal Year 2014 March 201 7 UNITED STATES O FFICE OF PERSONNEL MANAGEMENT OPM.GOV
Official Time Usage in the Federal Government
Fiscal Year 2014
March 2017
United StateS Office Of PerSOnnel ManageMent
OPM.GOV

1
Introduction The Federal Government’s labor-management relations program has evolved from a 1962 Executive Order granting limited collective bargaining rights to a formal collective bargaining program established by statute. A landmark piece of legislation, Title VII of the Civil Service Reform Act (CSRA) of 1978, also known as the Federal Service Labor-Management Relations Statute (Statute), codified in Chapter 71 of Title 5 of the United States Code, has served as the foundation for labor-management relations in the Federal Government since it became effective. Official Time
The Statute1 establishes a collective bargaining system that is tailored to the unique concerns of the Federal Government, carefully balancing the interests of the public, agency management, and employees. For example, Federal employees are prohibited by law from striking as a means to redress grievances with their employers.2 In addition, many of the terms and conditions of employment of a Federal employee (including pay and benefits for most employees) are set by law and not subject to bargaining. This includes, at most Federal agencies, wages and benefits. Other working conditions are limited in bargaining by a broad management rights provision.3 This includes decisions relating to the right to assign work to employees and the right to determine internal security practices.4 The Statute further specifies that its provisions should be interpreted “in a manner consistent with the requirements of an effective and efficient government.”5
“Official time,” as authorized by 5 U.S.C. § 7131, is a core component of the Federal Government’s carefully crafted collective bargaining system. Official time is time spent by Federal employees performing representational work for a bargaining unit in lieu of their regularly assigned work. It allows unions to satisfy their duty of fair representation to members and non-members alike.
The Statute discusses official time in four sections. First, section 7131(a) discusses official time in the context of collective bargaining agreement negotiations:
[a]ny employee representing an exclusive representative in the negotiation of a collective bargaining agreement under this chapter shall be authorized official time for such purposes, including attendance at impasse proceeding, during the time the employee otherwise would be in a duty status. The number of employees for whom official time is authorized under this subsection shall not exceed the number of individuals designated as representing the agency for such purposes.
1 5 U.S.C. Chapter 71. 2 See 5 U.S.C. § 7116(b)(7). 3 See 5 U.S.C. § 7106(a). 4 See 5 U.S.C. § 7106(a)(2). 5 See 5 U.S.C. § 7101(b).

2
Second, the Statute excludes the use of official time for activities that constitute internal union business which includes solicitation of membership, elections of labor organization officials, and collection of dues.6 Third, section 7131(c) discusses when official time might be authorized for proceedings before the Federal Labor Relations Authority (FLRA), stating, “Except as provided in subsection (a), the Authority shall determine whether any employee participating for, or on behalf of, a labor organization in any phase of proceedings before the Authority shall be authorized official time for such purpose during the time the employee otherwise would be in a duty status.”
Finally, section 7131(d) sets forth the general provisions governing all other requests for official time:
Except as provided in the preceding subsections of this section – (1) any employee representing an exclusive representative, or (2) in connection with any other matter covered by this chapter, any employee in an appropriate unit represented by an exclusive representative, shall be granted official time in any amount the agency and the exclusive representative involved agree to be reasonable, necessary, and in the public interest.
The question of what constitutes what is “reasonable, necessary, and in the public interest” has been interpreted by the FLRA to include:
participation in labor-management workgroups; representation of bargaining unit employees in meetings; negotiation of contracts and other collective bargaining agreements; participation in proceedings before the FLRA; representation of employees in grievances and disciplinary actions; and other matters covered by the Statute, so long as the agency and union agree that the
amount of time is reasonable, necessary, and in the public interest.
Official Time Statistics for Fiscal Year 2014 Labor and management have a shared responsibility to ensure that official time is authorized and used appropriately. Labor and management must develop sensible arrangements for official time that respects the Statute’s goals of promoting collective bargaining but honors the Statute’s command that its provisions be interpreted to promote an effective and efficient government. Labor and management should also ensure that appropriate recordkeeping mechanisms are utilized for tracking and recording official time. While there is no uniform requirement concerning the degree and specificity of records kept for this purpose, OPM provides guidance to agencies to record official time by using the following categories: (1) Term Negotiations; (2) Mid-Term Negotiations; (3) Dispute Resolution; and (4) General Labor-Management Relations. (See Appendix A).
6 See 5 U.S.C. Section § 7131(b)

3
In collecting the official time data for this report, the Office of Personnel Management (OPM) gathered data from automated time and attendance systems via the Enterprise Human Resources Integration (EHRI) system. Agencies that report official time data via EHRI were asked to verify the official time hours used by employee representatives within their organizations, and to validate how those hours were used within the four predefined categories.7 Executive departments and agencies, as well as the Government Printing Office and U.S. Capitol Police, are covered in this report. Non-appropriated fund instrumentalities described in 5 U.S.C. 2105(c) are not covered in this report. Each agency that reported official time data electronically received a consolidated report, encompassing all agency subcomponents, of their official time usage within each of the four categories. For the FY 2014 official time data call, OPM requested explanations for the basis of any discrepancies between OPM’s EHRI data and the data reported by an agency. This change was in accordance with the U.S. Government Accountability Office’s (GAO) recommendations in its report “LABOR RELATIONS ACTIVITIES: Actions Needed to Improve Tracking and Reporting of the Use and Cost of Official Time”.8 In instances where agencies identified corrections to the data reported to OPM’s EHRI system, they were asked to indicate (a) whether the agency is aware of the cause of the discrepancy; (b) what efforts, if any, will be made to correct the data; and (c) what, if anything, will be done to improve the quality of data reported to EHRI in the future. Agencies that do not report official time data via EHRI were asked to submit their official time usage manually for Fiscal Year (FY) 2014.9 FY 2014 Official Time Survey Findings During FY 2014, unions represented 1,203,693 non-Postal Federal civil service bargaining unit employees, a decrease of approximately -1.54% or -18,844 bargaining unit employees compared to FY 2012.10 Agencies reported that bargaining unit employees spent a total of 3,468,170 hours performing representational duties on official time, an increase of 0.84 percent compared to FY 2012. Government-wide, the number of official time hours used per bargaining unit employee on representational matters increased from 2.81 hours in FY 2012 to 2.88 hours during FY 2014. The estimated official time costs represented approximately one tenth of one percent of the total cost of salary and benefits for Federal employees in FY 2014.
7 This verification process is designed to ensure the accuracy of official time that has been entered into EHRI. However, OPM has no means of confirming that official time entered by employees working in a representational capacity is a full and accurate representation of official time actually utilized. 8 http://www.gao.gov/assets/670/666619.pdf 9 Fifty-nine of the 62 agencies covered in this report confirmed or updated their official time data. The official time figures reported in EHRI for the Export-Import Bank, the National Credit Union Administration, and the National Mediation Board were not confirmed by the agencies. 10 Numbers do not include employees of non-appropriated fund instrumentalities, but do include employees of the U.S. Capitol Police (Legislative Branch) and the Government Printing Office.

4
TOTAL OFFICIAL TIME HOURS - FY 2009-2012, 2014 FY 2009 FY 2010 FY 2011 FY 2012 FY 2014
Total Official Time Hours 2,991,378 3,096,018 3,395,187 3,439,449 3,468,170 Rate (Hours per BU Employee per year) 2.58 2.61 2.82 2.81 2.88 Comparison of Hours Reported to Previous Reporting Year The following table shows the hours reported by agency in FY 2012 and FY 2014, and the change in percentage between the two fiscal years. The data show wide variations in official time hours reported among agencies compared to FY 2012. Many of the agencies showing the widest variation from the previous reporting year, however, have a small number of bargaining unit employees. Thus, modest numerical changes in reported hours translate into significant percentage changes for these agencies. Thirty-seven agencies reported reductions in the total number of official time hours used whereas twenty (20) reported increases and four (4) reported no changes in the total number of official time hours used.11
11 The Consumer Financial Protection Bureau was not included in the total number of reductions/increases in official time hours because FY 2014 was their first year reporting to OPM.

5
OFFICIAL TIME HOURS – FY 2014 vs. FY 2012
Department/ Agency
FY 2014 Official
Time Hours
FY 2012 Official
Time Hours
% Change
Department/ Agency
FY 2014 Official
Time Hours
FY 2012 Official
Time Hours
% Change
Agencies with 1,000 or fewer bargaining unit employees
Armed Forces Retirement Home 416.00 336.00 23.81%
National Credit Union Administration 1,263.30 2,874.60 -56.05%
Commission on Civil Rights 0.00 0.00 0.00%
National Endowment for the Arts 14.00 88.75 -84.23%
Commodity Futures Trading Commission 60.50 90.00 -32.78%
National Endowment for the Humanities 461.75 463.50 -0.38%
Consumer Financial Protection Bureau12 6,050.00 N/A N/A
National Gallery of Art 1,859.50 1,450.50 28.20%
Consumer Product Safety Commission 143.25 427.00 -66.45%
National Mediation Board 0.00 0.00 0.00%
Corporation for National and Community Service 173.00 63.50 172.44%
National Science Foundation 1,705.50 448.50 280.27%
Court Services and Offender Supervision Agency 432.25 455.75 -5.16%
National Transportation Safety Board 69.00 221.50 -68.85%
Export-Import Bank 79.00 5.50 1,336.36%
Overseas Private Investment Corporation 169.00 238.00 -28.99%
Federal Election Commission 13.00 463.50 -97.20% Peace Corps 96.00 371.00 -74.12%
12 FY 2014 is the first year the Consumer Financial Protection Bureau reported official time data.

6
OFFICIAL TIME HOURS – FY 2014 vs. FY 2012
Department/ Agency
FY 2014 Official
Time Hours
FY 2012 Official
Time Hours
% Change
Department/ Agency
FY 2014 Official
Time Hours
FY 2012 Official
Time Hours
% Change
Federal Mediation and Conciliation Service 0.00 0.00 0.00%
Pension Benefit Guaranty Corporation 719.25 819.00 -12.18%
Federal Trade Commission 89.50 374.00 -76.07% Presidio Trust 34.00 107.50 -68.37%
Holocaust Memorial Museum 0.00 0.00 0.00%
Pretrial Services Agency for the District of Columbia 1,433.75 1,321.25 8.51%
International Boundary and Water Commission 135.00 21.00 542.86%
Railroad Retirement Board 4,744.90 4,664.20 1.73%
Merit Systems Protection Board 173.00 123.00 40.65%
U.S. International Trade Commission 634.00 838.00 -24.34%
Agencies with 25,000 or fewer bargaining unit employees
Agency for International Development 2,912.00 6,028.00 -51.69% Interior 13,320.25 15,043.25 -11.45%
Broadcasting Board of Governors 9,776.00 10,168.80 -3.86% Labor 43,798.00 55,119.00 -20.54%
Commerce 48,993.50 33,858.00 44.70%
National Aeronautics and Space Administration 14,172.00 18,193.50 -22.10%
Education 6,728.75 7,822.25 -13.98%
National Archives and Records Administration 8,403.70 8,069.90 4.14%
Energy 7,911.00 15,762.50 -49.81% National Labor Relations Board 7,651.66 12,374.00 -38.16%

7
OFFICIAL TIME HOURS – FY 2014 vs. FY 2012
Department/ Agency
FY 2014 Official
Time Hours
FY 2012 Official
Time Hours
% Change
Department/ Agency
FY 2014 Official
Time Hours
FY 2012 Official
Time Hours
% Change
Environmental Protection Agency 41,917.00 42,826.00 -2.12%
Nuclear Regulatory Commission 4,782.75 3,282.25 45.72%
Equal Employment Opportunity Commission 5,023.75 8,417.00 -40.31%
Office of Personnel Management 8,499.89 8,579.00 -0.92%
Federal Communications Commission 1,329.00 1,933.75 -31.27%
Securities and Exchange Commission 6,230.00 4,733.75 31.61%
Federal Deposit Insurance Corporation 4,855.75 4,816.75 0.81%
Small Business Administration 5,615.25 5,883.75 -4.56%
Federal Energy Regulatory Commission 571.00 2,044.50 -72.07% Smithsonian 682.00 1,637.00 -58.34%
General Services Administration 31,750.70 36,089.60 -12.02%
State (includes AFSA unit) 14,675.00 9,785.00 49.97%
Government Printing Office 5,937.00 6,856.00 -13.40%
U.S. Capitol Police 4,850.75 2,629.75 84.46%
Housing and Urban Development 41,464.00 50,606.75 -18.07%
Agencies with more than 25,000 bargaining unit employees
Agriculture 125,852.25 139,336.49 -9.68% Social Security Administration 246,893.00 247,563.00 -0.27%
Defense 335,477.31 336,956.02 -0.44% Transportation 236,246.51 251,695.02 -6.14%
Health and Human Services 21,853.00 18,643.00 17.22% Treasury 504,293.00 580,490.00 -13.13%

8
OFFICIAL TIME HOURS – FY 2014 vs. FY 2012
Department/ Agency
FY 2014 Official
Time Hours
FY 2012 Official
Time Hours
% Change
Department/ Agency
FY 2014 Official
Time Hours
FY 2012 Official
Time Hours
% Change
Homeland Security 275,895.75 211,422.00 30.50% Veterans Affairs
1,093,714.00 1,086,257.00 0.69%
Justice 265,126.25 178,260.50 48.73% Government-
wide 3,468,170 3,439,449 0.84%
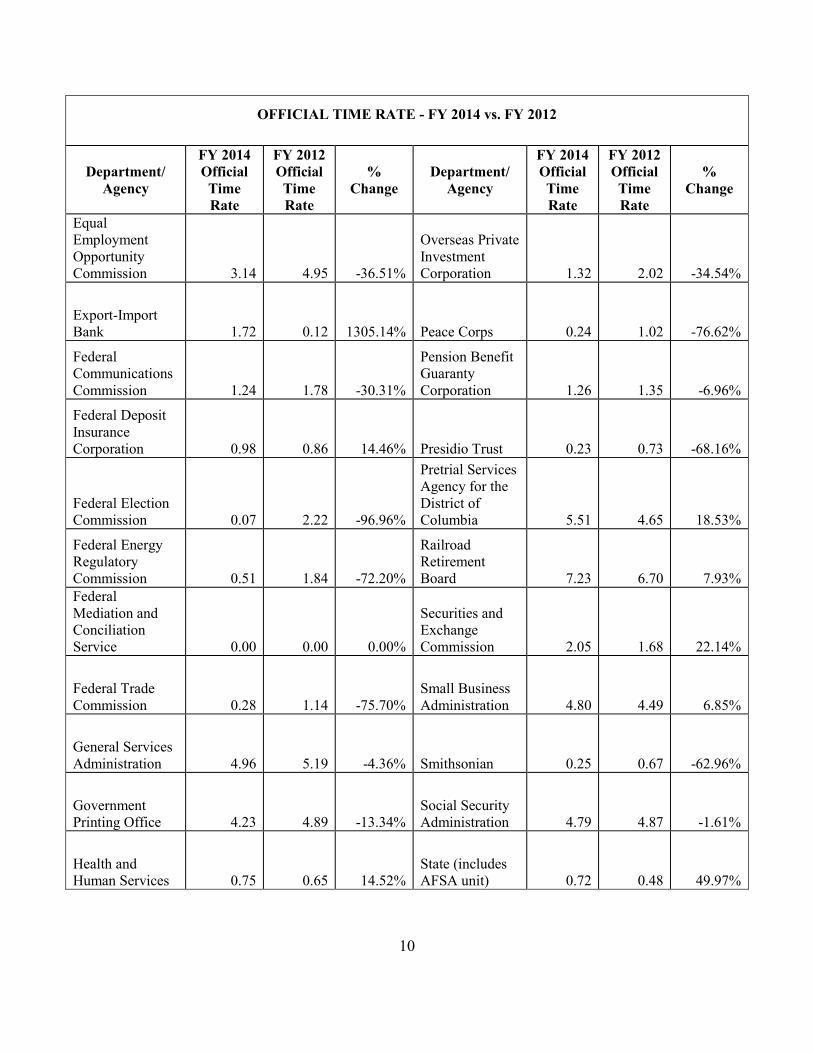
Official Time Rates The official time rate, also referred to as the Hours Per Employee (HPE) rate, which indicates the number of official time hours expended per bargaining unit employee in a fiscal year, allows for meaningful comparisons of official time usage among agencies. The HPE rate may not show a change in total figures due to rounding. Although figures are rounded, slight variations in the HPE rate are reflected in the percentage of change. The average FY 2014 government-wide HPE rate was 2.88 which is an increase from the FY 2012 HPE rate of 2.81.
OFFICIAL TIME RATE - FY 2014 vs. FY 2012
Department/ Agency
FY 2014 Official
Time Rate
FY 2012 Official Time Rate
% Change
Department/ Agency
FY 2014 Official Time Rate
FY 2012 Official Time Rate
% Change
Agency for International Development 1.05 2.05 -48.61% Justice 7.68 5.29 45.30%
Agriculture 3.45 3.42 0.81% Labor 3.89 4.69 -17.03%
Armed Forces Retirement Home 4.95 2.92 69.50%
Merit Systems Protection Board 1.84 1.64 12.22%
Broadcasting Board of Governors 7.60 8.19 -7.15%
National Aeronautics and Space Administration 1.53 1.90 -19.85%

9
OFFICIAL TIME RATE - FY 2014 vs. FY 2012
Department/ Agency
FY 2014 Official
Time Rate
FY 2012 Official Time Rate
% Change
Department/ Agency
FY 2014 Official Time Rate
FY 2012 Official Time Rate
% Change
Commerce 2.33 1.68 38.86%
National Archives and Records Administration 4.60 4.12 11.60%
Commission on Civil Rights 0.00 0.00 0.00%
National Credit Union Administration 1.30 2.99 -56.73%
Commodity Futures Trading Commission 1.03 1.48 -30.50%
National Endowment for the Arts 0.16 0.95 -83.52%
Consumer Financial Protection Bureau 6.15 N/A N/A
National Endowment for the Humanities 6.50 4.83 34.70%
Consumer Product Safety Commission 0.38 1.09 -65.40%
National Gallery of Art 4.92 3.72 32.27%
Corporation for National and Community Service 0.39 0.16 140.89%
National Labor Relations Board 7.57 11.73 -35.47%
Court Services and Offender Supervision Agency 0.62 1.19 -48.02%
National Mediation Board 0.00 0.00 0.00%
Defense 0.84 0.79 6.41%
National Science Foundation 1.83 0.47 290.47%
Education 2.52 3.07 -18.10%
National Transportation Safety Board 0.25 0.76 -67.62%
Energy 1.31 2.41 -45.41%
Nuclear Regulatory Commission 1.86 1.26 46.73%
Environmental Protection Agency 3.79 3.33 13.71%
Office of Personnel Management 6.09 5.81 4.90%
10
OFFICIAL TIME RATE - FY 2014 vs. FY 2012
Department/ Agency
FY 2014 Official
Time Rate
FY 2012 Official Time Rate
% Change
Department/ Agency
FY 2014 Official Time Rate
FY 2012 Official Time Rate
% Change
Equal Employment Opportunity Commission 3.14 4.95 -36.51%
Overseas Private Investment Corporation 1.32 2.02 -34.54%
Export-Import Bank 1.72 0.12 1305.14% Peace Corps 0.24 1.02 -76.62%
Federal Communications Commission 1.24 1.78 -30.31%
Pension Benefit Guaranty Corporation 1.26 1.35 -6.96%
Federal Deposit Insurance Corporation 0.98 0.86 14.46% Presidio Trust 0.23 0.73 -68.16%
Federal Election Commission 0.07 2.22 -96.96%
Pretrial Services Agency for the District of Columbia 5.51 4.65 18.53%
Federal Energy Regulatory Commission 0.51 1.84 -72.20%
Railroad Retirement Board 7.23 6.70 7.93%
Federal Mediation and Conciliation Service 0.00 0.00 0.00%
Securities and Exchange Commission 2.05 1.68 22.14%
Federal Trade Commission 0.28 1.14 -75.70%
Small Business Administration 4.80 4.49 6.85%
General Services Administration 4.96 5.19 -4.36% Smithsonian 0.25 0.67 -62.96%
Government Printing Office 4.23 4.89 -13.34%
Social Security Administration 4.79 4.87 -1.61%
Health and Human Services 0.75 0.65 14.52%
State (includes AFSA unit) 0.72 0.48 49.97%
11
OFFICIAL TIME RATE - FY 2014 vs. FY 2012
Department/ Agency
FY 2014 Official
Time Rate
FY 2012 Official Time Rate
% Change
Department/ Agency
FY 2014 Official Time Rate
FY 2012 Official Time Rate
% Change
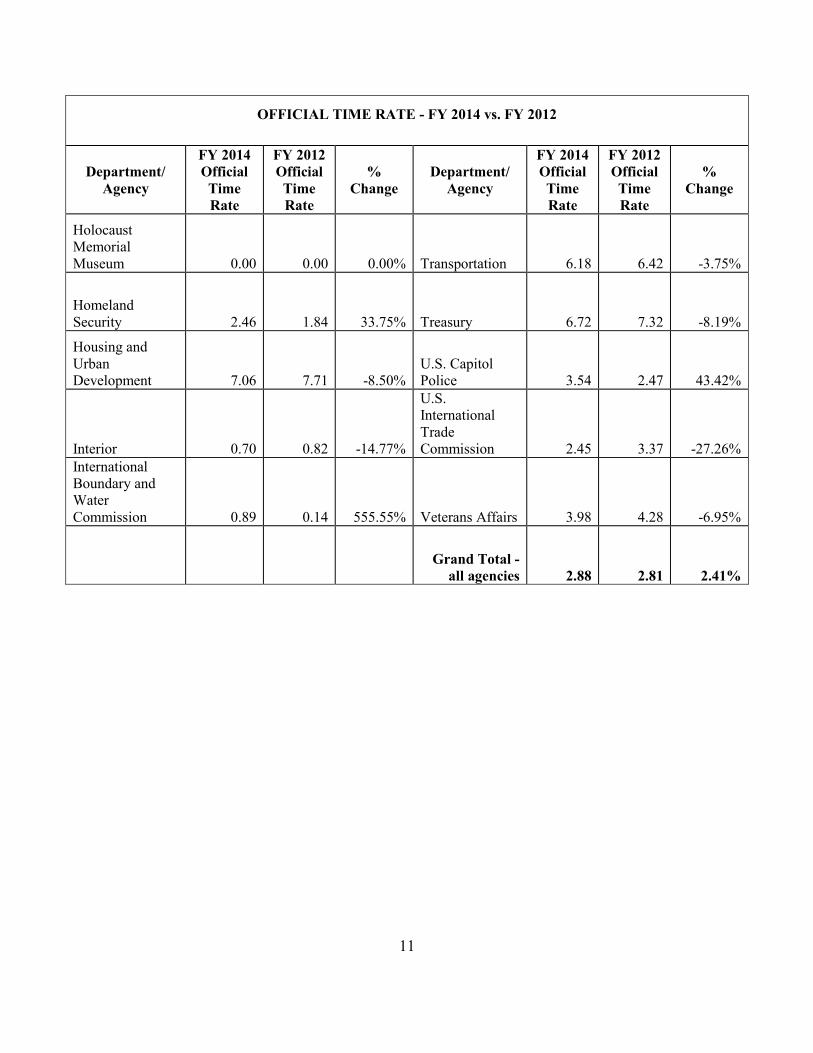
Holocaust Memorial Museum 0.00 0.00 0.00% Transportation 6.18 6.42 -3.75%
Homeland Security 2.46 1.84 33.75% Treasury 6.72 7.32 -8.19%
Housing and Urban Development 7.06 7.71 -8.50%
U.S. Capitol Police 3.54 2.47 43.42%
Interior 0.70 0.82 -14.77%
U.S. International Trade Commission 2.45 3.37 -27.26%
International Boundary and Water Commission 0.89 0.14 555.55% Veterans Affairs 3.98 4.28 -6.95%
Grand Total -
all agencies 2.88 2.81 2.41%

12
Official Time Cost Costs were estimated based on September 2014 wage data provided through the Enterprise Human Resources Integration Statistical Data Mart (EHRI-SDM). The estimated total payroll costs, average salary and benefits, for FY 2014 official time hours were $162,522,763 (See Appendix B). As with all prior reports, we estimate each agency’s official time wage costs by multiplying the reported official time hours by each agency’s average bargaining unit employee hourly wage13 plus fringe benefits. In comparing FY 2012 and FY 2014 data, the estimated cost of official time hours increased by 3.39 percent over this two year period. In response to GAO’s recommendation to consider other approaches to developing our cost estimate, we evaluated alternate methodologies. In our evaluation, we considered the value of maintaining a consistent approach to cost estimates, which permits meaningful comparisons from one year to the next. We also considered the time and resources that would be required to implement alternate methodologies and to produce official time cost estimates for all agencies covered by the report. As a result, we concluded there is greater value in continuing with the cost computation methodology used in the previous official time reports from fiscal years 2002-2012.
OFFICIAL TIME COST BY AGENCY – FY 2014 vs. 2012
Department/ Agency FY 14 Cost FY 12 Cost
Department/ Agency FY 14 Cost FY 12 Cost
Agency for International Development $201,753.28 $404,283.67 Justice $10,587,007.50 $7,081,368.95
Agriculture $4,413,605.06 $4,754,020.31 Labor $2,303,746.00 $2,787,420.47
Armed Forces Retirement Home $11,566.34 $9,647.36
Merit Systems Protection Board $15,294.49 $11,453.49
Broadcasting Board of Governors $601,416.05 $594,424.27
National Aeronautics and Space Administration $1,076,285.99 $1,349,853.50
Commerce $2,921,353.06 $1,908,178.31
National Archives and Records Administration $329,000.84 $309,719.45
Commission on Civil Rights $0.00 $0.00
National Credit Union Administration $80,045.99 $172,686.26
13 To facilitate calculation of official time costs, OPM relies on the agency’s average bargaining unit employee hourly wage as of the last day of the fiscal year, September 30.

13
OFFICIAL TIME COST BY AGENCY – FY 2014 vs. 2012
Department/ Agency FY 14 Cost FY 12 Cost
Department/ Agency FY 14 Cost FY 12 Cost
Commodity Futures Trading Commission $5,568.87 $7,886.13
National Endowment for the Arts $771.20 $4,787.41
Consumer Financial Protection Bureau $432,864.40 N/A
National Endowment for the Humanities $26,432.38 $25,863.32
Consumer Product Safety Commission $9,036.76 $25,608.00
National Gallery of Art $57,821.43 $43,655.79
Corporation for National and Community Service $7,653.84 $2,831.53
National Labor Relations Board $458,944.88 $736,128.55
Court Services and Offender Supervision Agency $22,612.44 $23,574.81
National Mediation Board $0.00 $0.00
Defense $13,825,779.59 $13,471,870.86
National Science Foundation $127,084.44 $32,515.32
Education $429,306.55 $488,108.69
National Transportation Safety Board $5,206.60 $16,114.65
Energy $504,741.46 $969,019.39
Nuclear Regulatory Commission $361,846.38 $242,712.71
Environmental Protection Agency $2,917,601.98 $2,849,965.27
Office of Personnel Management $410,851.64 $385,924.90
Equal Employment Opportunity Commission $266,389.67 $442,562.64
Overseas Private Investment Corporation $10,831.29 $14,481.28
Export-Import Bank $3,602.78 $244.92 Peace Corps $4,218.88 $15,796.09 Federal Communications Commission $102,089.85 $143,665.16
Pension Benefit Guaranty Corporation $45,670.98 $49,832.63
Federal Deposit Insurance Corporation $385,040.65 $351,915.33 Presidio Trust $1,473.87 $4,588.13
Federal Election Commission $763.20 $26,753.50
Pretrial Services Agency for the District of Columbia $75,004.24 $68,344.96

14
OFFICIAL TIME COST BY AGENCY – FY 2014 vs. 2012
Department/ Agency FY 14 Cost FY 12 Cost
Department/ Agency FY 14 Cost FY 12 Cost
Federal Energy Regulatory Commission $40,556.47 $142,944.44
Railroad Retirement Board $227,331.53 $226,488.91
Federal Mediation and Conciliation Service $0.00 $0.00
Securities and Exchange Commission $635,353.17 $456,607.49
Federal Trade Commission $5,230.78 $20,513.40
Small Business Administration $313,648.76 $316,336.48
General Services Administration $1,812,753.99 $1,963,448.82 Smithsonian $26,391.02 $63,586.20
Government Printing Office $291,890.01 $327,272.24
Social Security Administration $10,938,589.43 $10,927,743.37
Health and Human Services $1,173,031.89 $967,248.57
State (includes AFSA unit) $861,571.41 $554,759.69
Holocaust Memorial Museum $0.00 $0.00 Transportation $16,468,928.48 $17,287,858.07
Homeland Security $11,170,157.43 $8,153,212.47 Treasury $23,524,084.62 $25,368,604.46
Housing and Urban Development $2,541,063.29 $2,983,873.68
U.S. Capitol Police $257,608.16 $128,918.20
Interior $506,137.30 $552,458.28
U.S. International Trade Commission $43,408.78 $57,996.68
International Boundary and Water Commission $4,390.10 $639.30 Veterans Affairs $48,640,351.72 $46,868,149.63
Grand Total -
all agencies $162,522,763.18 $157,196,468.40 Conclusion During FY 2014, agencies reported that bargaining unit employees spent a total of 3,468,170 hours performing representational duties on official time, an increase of 0.84 percent compared to FY 2012. Government-wide, the number of official time hours used per bargaining unit employee on representational matters increased from 2.81 hours in FY 2012 to 2.88 hours during FY 2014. For further information regarding this report, please contact Partnership and Labor Relations at [email protected].

1
Appendix A – Official Time Definitions and Terminology
Official Time means all time, regardless of agency nomenclature, granted to an employee by the agency to perform representational functions under 5 U.S.C. Chapter 71 and by collective bargaining agreement when the employee would otherwise be in a duty status. Official Time Reporting Categories— agencies are asked to report four categories of official time use. Term Negotiations— this category for reporting official time hours refers to time used by
union representatives to prepare for and negotiate a basic collective bargaining agreement or its successor.
Mid-Term Negotiations— this category for reporting official time hours refers to time used
to bargain over issues raised during the life of a term agreement. Dispute Resolution— this category for reporting official time hours refers to time used to
process grievances up to and including arbitrations and to process appeals of bargaining unit employees to the various administrative agencies such as the Merit Systems Protection Board (MSPB), FLRA and Equal Employment Opportunity Commission (EEOC) and, as necessary, to the courts.
General Labor-Management Relations— this category for reporting official time hours refers
to time used for activities not included in the above three categories. Examples of such activities include: meetings between labor and management officials to discuss general conditions of employment, labor-management committee meetings, labor relations training for union representatives, and union participation in formal meetings and investigative interviews.
Representational Functions refers to activities undertaken by employees acting on behalf of the labor organization or fulfilling the organization’s responsibility to represent bargaining unit employees in accordance with 5 U.S.C. Chapter 71 and a collective bargaining agreement.
2
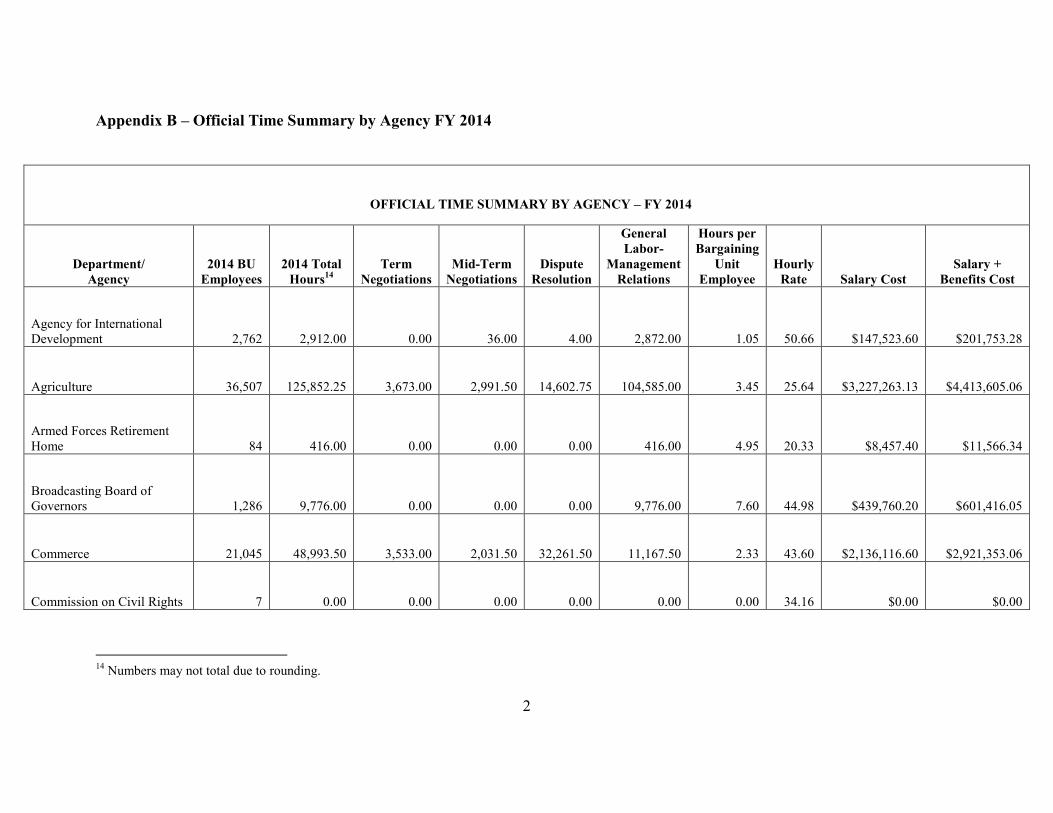
Appendix B – Official Time Summary by Agency FY 2014
OFFICIAL TIME SUMMARY BY AGENCY – FY 2014
Department/ Agency
2014 BU Employees
2014 Total Hours14
Term Negotiations
Mid-Term Negotiations
Dispute Resolution
General Labor-
Management Relations
Hours per Bargaining
Unit Employee
Hourly Rate Salary Cost
Salary + Benefits Cost
Agency for International Development 2,762 2,912.00 0.00 36.00 4.00 2,872.00 1.05 50.66 $147,523.60 $201,753.28
Agriculture 36,507 125,852.25 3,673.00 2,991.50 14,602.75 104,585.00 3.45 25.64 $3,227,263.13 $4,413,605.06
Armed Forces Retirement Home 84 416.00 0.00 0.00 0.00 416.00 4.95 20.33 $8,457.40 $11,566.34
Broadcasting Board of Governors 1,286 9,776.00 0.00 0.00 0.00 9,776.00 7.60 44.98 $439,760.20 $601,416.05
Commerce 21,045 48,993.50 3,533.00 2,031.50 32,261.50 11,167.50 2.33 43.60 $2,136,116.60 $2,921,353.06
Commission on Civil Rights 7 0.00 0.00 0.00 0.00 0.00 0.00 34.16 $0.00 $0.00
14 Numbers may not total due to rounding.

3
OFFICIAL TIME SUMMARY BY AGENCY – FY 2014
Department/ Agency
2014 BU Employees
2014 Total Hours14
Term Negotiations
Mid-Term Negotiations
Dispute Resolution
General Labor-
Management Relations
Hours per Bargaining
Unit Employee
Hourly Rate Salary Cost
Salary + Benefits Cost
Commodity Futures Trading Commission 59 60.50 0.00 0.00 0.00 60.50 1.03 67.31 $4,072.00 $5,568.87
Consumer Financial Protection Bureau 983 6,050.00 1,902.25 0.00 145.25 4,002.50 6.15 52.32 $316,513.89 $432,864.40
Consumer Product Safety Commission 381 143.25 0.00 0.00 4.00 139.25 0.38 46.13 $6,607.75 $9,036.76
Corporation for National and Community Service 449 173.00 88.00 0.00 14.00 71.00 0.39 32.35 $5,596.55 $7,653.84
Court Services and Offender Supervision Agency 697 432.25 201.25 1.50 15.50 214.00 0.62 38.25 $16,534.39 $22,612.44
Defense 401,346 335,477.31 22,223.43 3,393.66 88,826.72 221,033.50 0.84 30.13 $10,109,520.03 $13,825,779.59
Education 2,674 6,728.75 222.00 246.50 1,495.00 4,765.25 2.52 46.65 $313,912.36 $429,306.55
Energy 6,021 7,911.00 309.50 166.00 2,835.00 4,600.50 1.31 46.65 $369,070.97 $504,741.46
Environmental Protection Agency 11,057 41,917.00 877.00 370.00 5,737.00 34,933.00 3.79 50.90 $2,133,373.78 $2,917,601.98
Equal Employment Opportunity Commission 1,599 5,023.75 4.50 5.00 293.50 4,720.75 3.14 38.77 $194,786.25 $266,389.67

4
OFFICIAL TIME SUMMARY BY AGENCY – FY 2014
Department/ Agency
2014 BU Employees
2014 Total Hours14
Term Negotiations
Mid-Term Negotiations
Dispute Resolution
General Labor-
Management Relations
Hours per Bargaining
Unit Employee
Hourly Rate Salary Cost
Salary + Benefits Cost
Export-Import Bank 46 79.00 67.00 2.00 0.00 10.00 1.72 33.35 $2,634.38 $3,602.78
Federal Communications Commission 1,072 1,329.00 0.00 40.00 692.00 597.00 1.24 56.17 $74,648.91 $102,089.85
Federal Deposit Insurance Corporation 4,947 4,855.75 3.00 65.50 1,569.75 3,217.50 0.98 57.98 $281,544.79 $385,040.65
Federal Election Commission 193 13.00 0.00 13.00 0.00 0.00 0.07 42.93 $558.06 $763.20
Federal Energy Regulatory Commission 1,118 571.00 0.00 0.00 379.00 192.00 0.51 51.94 $29,655.21 $40,556.47
Federal Mediation and Conciliation Service 29 0.00 0.00 0.00 0.00 0.00 0.00 33.89 $0.00 $0.00
Federal Trade Commission 322 89.50 0.00 0.00 0.00 89.50 0.28 42.74 $3,824.79 $5,230.78
General Services Administration 6,397 31,750.70 437.80 2,193.40 10,051.00 19,068.50 4.96 41.75 $1,325,500.14 $1,812,753.99
Government Printing Office 1,402 5,937.00 0.00 202.00 2,268.10 3,466.90 4.23 35.95 $213,432.30 $291,890.01
Health and Human Services 29,189 21,853.00 6,245.00 1,015.00 5,475.00 9,118.00 0.75 39.25 $857,730.25 $1,173,031.89

5
OFFICIAL TIME SUMMARY BY AGENCY – FY 2014
Department/ Agency
2014 BU Employees
2014 Total Hours14
Term Negotiations
Mid-Term Negotiations
Dispute Resolution
General Labor-
Management Relations
Hours per Bargaining
Unit Employee
Hourly Rate Salary Cost
Salary + Benefits Cost
Holocaust Memorial Museum 11 0.00 0.00 0.00 0.00 0.00 0.00 28.54 $0.00 $0.00
Homeland Security 111,937 275,895.75 8,917.50 10,578.50 69,079.25 187,320.50 2.46 29.60 $8,167,707.98 $11,170,157.43
Housing and Urban Development 5,874 41,464.00 11,437.75 3,738.00 19,341.50 6,946.75 7.06 44.81 $1,858,045.70 $2,541,063.29
Interior 19,006 13,320.25 748.25 92.00 1,620.00 10,860.00 0.70 27.78 $370,091.62 $506,137.30
International Boundary and Water Commission 152 135.00 0.00 0.00 0.00 135.00 0.89 23.78 $3,210.08 $4,390.10
Justice 34,500 265,126.25 39,490.50 4,603.75 32,254.25 188,777.75 7.68 29.20 $7,741,304.11 $10,587,007.50
Labor 11,250 43,798.00 0.00 415.00 1,124.00 42,259.00 3.89 38.46 $1,684,517.40 $2,303,746.00
Merit Systems Protection Board 94 173.00 0.00 0.00 103.00 70.00 1.84 64.64 $11,183.45 $15,294.49
National Aeronautics and Space Administration 9,287 14,172.00 0.00 461.00 1,106.00 12,605.00 1.53 55.53 $786,988.88 $1,076,285.99
National Archives and Records Administration 1,828 8,403.70 15.10 0.30 1,524.00 6,864.30 4.60 28.63 $240,568.03 $329,000.84

6
OFFICIAL TIME SUMMARY BY AGENCY – FY 2014
Department/ Agency
2014 BU Employees
2014 Total Hours14
Term Negotiations
Mid-Term Negotiations
Dispute Resolution
General Labor-
Management Relations
Hours per Bargaining
Unit Employee
Hourly Rate Salary Cost
Salary + Benefits Cost
National Credit Union Administration 975 1,263.30 430.70 46.90 196.70 589.00 1.30 46.33 $58,530.27 $80,045.99
National Endowment for the Arts 89 14.00 0.00 0.00 0.00 14.00 0.16 40.28 $563.91 $771.20
National Endowment for the Humanities 71 461.75 166.00 1.00 112.75 182.00 6.50 41.86 $19,327.57 $26,432.38
National Gallery of Art 378 1,859.50 171.00 0.00 578.50 1,110.00 4.92 22.74 $42,279.49 $57,821.43
National Labor Relations Board 1,011 7,651.66 1,403.00 312.75 3,035.16 2,900.75 7.57 43.86 $335,584.15 $458,944.88
National Mediation Board 13 0.00 0.00 0.00 0.00 0.00 0.00 35.79 $0.00 $0.00
National Science Foundation 932 1,705.50 20.00 28.00 230.75 1,426.75 1.83 54.49 $92,925.15 $127,084.44
National Transportation Safety Board 280 69.00 0.00 0.00 0.00 69.00 0.25 55.18 $3,807.11 $5,206.60
Nuclear Regulatory Commission 2,578 4,782.75 0.00 12.75 1,185.00 3,585.00 1.86 55.32 $264,584.95 $361,846.38
Office of Personnel Management 1,395 8,499.89 30.27 1,131.70 2,025.50 5,312.42 6.09 35.34 $300,417.99 $410,851.64

7
OFFICIAL TIME SUMMARY BY AGENCY – FY 2014
Department/ Agency
2014 BU Employees
2014 Total Hours14
Term Negotiations
Mid-Term Negotiations
Dispute Resolution
General Labor-
Management Relations
Hours per Bargaining
Unit Employee
Hourly Rate Salary Cost
Salary + Benefits Cost
Overseas Private Investment Corporation 128 169.00 0.00 30.00 16.50 122.50 1.32 46.86 $7,919.93 $10,831.29
Peace Corps 404 96.00 0.00 20.00 30.00 46.00 0.24 32.13 $3,084.88 $4,218.88
Pension Benefit Guaranty Corporation 572 719.25 6.25 101.00 130.75 481.25 1.26 46.43 $33,394.98 $45,670.98
Presidio Trust 147 34.00 13.50 0.00 0.00 20.50 0.23 31.70 $1,077.70 $1,473.87
Pretrial Services Agency for the District of Columbia 260 1,433.75 35.00 66.50 423.75 908.50 5.51 38.25 $54,843.69 $75,004.24
Railroad Retirement Board 656 4,744.90 0.00 1.00 6.00 4,737.90 7.23 35.03 $166,226.62 $227,331.53
Securities and Exchange Commission 3,045 6,230.00 14.00 2,016.00 1,666.25 2,533.75 2.05 74.57 $464,575.29 $635,353.17
Small Business Administration 1,171 5,615.25 324.25 4.00 3,080.25 2,206.75 4.80 40.84 $229,342.47 $313,648.76
Smithsonian 2,767 682.00 0.00 0.00 106.00 576.00 0.25 28.30 $19,297.32 $26,391.02
Social Security Administration 51,506 246,893.00 651.00 5,570.00 9,766.00 230,906.00 4.79 32.40 $7,998,383.61 $10,938,589.43

8
OFFICIAL TIME SUMMARY BY AGENCY – FY 2014
Department/ Agency
2014 BU Employees
2014 Total Hours14
Term Negotiations
Mid-Term Negotiations
Dispute Resolution
General Labor-
Management Relations
Hours per Bargaining
Unit Employee
Hourly Rate Salary Cost
Salary + Benefits Cost
State (includes AFSA unit) 20,300 14,675.00 2,805.00 1,435.00 3,770.00 6,665.00 0.72 42.93 $629,987.87 $861,571.41
Transportation 38,212 236,246.51 1,495.87 2,256.56 10,113.56 222,380.52 6.18 50.97 $12,042,211.53 $16,468,928.48
Treasury 75,061 504,293.00 2,424.00 5,109.00 49,884.00 446,876.00 6.72 34.11 $17,200,997.82 $23,524,084.62
U.S. Capitol Police 1,371 4,850.75 1,113.50 0.00 793.50 2,943.75 3.54 38.81 $188,241.26 $257,608.16
U.S. International Trade Commission 259 634.00 0.00 0.00 0.00 634.00 2.45 50.06 $31,740.84 $43,408.78
Veterans Affairs 274,501 1,093,714.00 46,042.00 44,071.00 132,633.00 870,968.00 3.98 32.52 $35,566,212.14 $48,640,351.72
Grand Total - all agencies 1,203,693
3,468,170.22 157,541.17 94,874.27
512,604.99 2,703,149.79 2.88 41.34 $118,837,813.51 $162,522,763.18

U.S. Office of Personnel Management
Partnership and Labor Relations
1900 E Street, NW, Washington, DC 20415
OPM.GOV


