NREL is a national laboratory of the U.S. Department of Energy, Office of Energy Efficiency & Renewable Energy, operated by the Alliance for Sustainable Energy, LLC. Contract No. DE-AC36-08GO28308 Offshore Code Comparison Collaboration Continuation (OC4), Phase I – Results of Coupled Simulations of an Offshore Wind Turbine with Jacket Support Structure Preprint Jason Jonkman and Amy Robertson (National Renewable Energy Laboratory) Wojciech Popko, Fabian Vorpahl, Adam Zuga, and Martin Kohlmeier (Fraunhofer Institute for Wind Energy and Energy System Technology IWES) Torben J. Larsen and Anders Yde (Technical University of Denmark) Kristian Saetertro and Knut M. Okstad (Fedem Technology AS) James Nichols (Garrad Hassan & Partners Ltd.) Tor A. Nygaard (Institute for Energy Technology) Zhen Gao (Norwegian University of Science and Technology) Dimitris Manolas (National Technical University of Athens) Kunho Kim and Qing Yu (American Bureau of Shipping) Wei Shi and Hyunchul Park (Pohang University of Science and Technology) Andres Vasquez-Rojas and Jan Dubois (Leibniz Universitat Hannover) Daniel Kaufer (Universitat Stuttgart) Paul Thomassen (Norwegian University of Science and Technology) Marten J. de Ruiter (Knowledge Centre WMC) Johan M. Peeringa (Energy Research Centre of the Netherlands) Huang Zhiwen (China General Certification) Heike von Waaden (REpower Systems SE) To be presented at the 22 nd International Society of Offshore and Polar Engineers Conference Rhodes, Greece June 17 – 22, 2012 Conference Paper NREL/CP-5000-54124 March 2012
Transcript
NREL is a national laboratory of the U.S. Department of Energy, Office of Energy Efficiency & Renewable Energy, operated by the Alliance for Sustainable Energy, LLC.
Contract No. DE-AC36-08GO28308
Offshore Code Comparison Collaboration Continuation (OC4), Phase I – Results of Coupled Simulations of an Offshore Wind Turbine with Jacket Support Structure Preprint Jason Jonkman and Amy Robertson (National Renewable Energy Laboratory) Wojciech Popko, Fabian Vorpahl, Adam Zuga, and Martin Kohlmeier (Fraunhofer Institute for Wind Energy and Energy System Technology IWES) Torben J. Larsen and Anders Yde (Technical University of Denmark) Kristian Saetertro and Knut M. Okstad (Fedem Technology AS) James Nichols (Garrad Hassan & Partners Ltd.) Tor A. Nygaard (Institute for Energy Technology) Zhen Gao (Norwegian University of Science and Technology) Dimitris Manolas (National Technical University of Athens) Kunho Kim and Qing Yu (American Bureau of Shipping) Wei Shi and Hyunchul Park (Pohang University of Science and Technology) Andres Vasquez-Rojas and Jan Dubois (Leibniz Universitat Hannover) Daniel Kaufer (Universitat Stuttgart) Paul Thomassen (Norwegian University of Science and Technology) Marten J. de Ruiter (Knowledge Centre WMC) Johan M. Peeringa (Energy Research Centre of the Netherlands) Huang Zhiwen (China General Certification) Heike von Waaden (REpower Systems SE)
To be presented at the 22nd International Society of Offshore and Polar Engineers Conference Rhodes, Greece June 17 – 22, 2012
Conference Paper NREL/CP-5000-54124 March 2012
NOTICE
The submitted manuscript has been offered by an employee of the Alliance for Sustainable Energy, LLC (Alliance), a contractor of the US Government under Contract No. DE-AC36-08GO28308. Accordingly, the US Government and Alliance retain a nonexclusive royalty-free license to publish or reproduce the published form of this contribution, or allow others to do so, for US Government purposes.
This report was prepared as an account of work sponsored by an agency of the United States government. Neither the United States government nor any agency thereof, nor any of their employees, makes any warranty, express or implied, or assumes any legal liability or responsibility for the accuracy, completeness, or usefulness of any information, apparatus, product, or process disclosed, or represents that its use would not infringe privately owned rights. Reference herein to any specific commercial product, process, or service by trade name, trademark, manufacturer, or otherwise does not necessarily constitute or imply its endorsement, recommendation, or favoring by the United States government or any agency thereof. The views and opinions of authors expressed herein do not necessarily state or reflect those of the United States government or any agency thereof.
Available electronically at http://www.osti.gov/bridge
Available for a processing fee to U.S. Department of Energy and its contractors, in paper, from:
U.S. Department of Energy Office of Scientific and Technical Information P.O. Box 62 Oak Ridge, TN 37831-0062 phone: 865.576.8401 fax: 865.576.5728 email: mailto:[email protected]
Available for sale to the public, in paper, from:
U.S. Department of Commerce National Technical Information Service 5285 Port Royal Road Springfield, VA 22161 phone: 800.553.6847 fax: 703.605.6900 email: [email protected] online ordering: http://www.ntis.gov/help/ordermethods.aspx
Offshore Code Comparison Collaboration Continuation (OC4), Phase I – Results of Coupled Simulationsof an Offshore Wind Turbine with Jacket Support Structure
Wojciech Popko 1, Fabian Vorpahl 1, Adam Zuga 1, Martin Kohlmeier 1, Jason Jonkman 2, Amy Robertson 2, Torben J. Larsen 3, Anders Yde 3, Kristian Sætertrø 4, Knut M. Okstad 4, James Nichols 5, Tor A. Nygaard 6, Zhen Gao 7, Dimitris Manolas 8, Kunho Kim 9, Qing
Yu 9, Wei Shi 10, Hyunchul Park 10, Andrés Vásquez-Rojas 11, Jan Dubois 11, Daniel Kaufer 12, Paul Thomassen 13, Marten J. de Ruiter 14, Johan M. Peeringa 15, Huang Zhiwen 16, Heike von Waaden 17
1. Fraunhofer Institute for Wind Energy and Energy System Technology IWES, Bremerhaven, Germany; 2. National Renewable Energy Laboratory, Golden, USA; 3. Technical University of Denmark, Department of Wind Energy, campus Risø, Roskilde, Denmark; 4. Fedem Technology AS,
Trondheim, Norway; 5. Garrad Hassan & Partners Ltd., Bristol, UK; 6. Institute for Energy Technology, Kjeller, Norway; 7. Centre for Ships and Ocean Structures at the Norwegian University of Science and Technology, Trondheim, Norway; 8. National Technical University of Athens, Zografou,
Greece; 9. American Bureau of Shipping, Houston, USA; 10. Pohang University of Science and Technology, Pohang, Korea; 11. Institute of Steel Construction at the Leibniz Universität Hannover, Hannover, Germany; 12. Endowed Chair of Wind Energy at the Institute of Aircraft Design at
Universität Stuttgart, Stuttgart, Germany; 13. Norwegian University of Science and Technology, Trondheim, Norway; 14. Knowledge Centre WMC, Wieringerwerf, The Netherlands; 15. Energy Research Centre of the Netherlands, Petten, The Netherlands; 16. China General Certification, Beijing,
China; 17. REpower Systems SE, Osnabrück, Germany
ABSTRACT
In this paper, the exemplary results of the IEA Wind Task 30 “Offshore Code Comparison Collaboration Continuation” (OC4) Project – Phase I, focused on the coupled simulation of an offshore wind turbine (OWT) with a jacket support structure, are presented. The focus of this task has been the verification of OWT modeling codes through code-to-code comparisons. The discrepancies between the results are shown and the sources of the differences are discussed. The importance of the local dynamics of the structure is depicted in the simulation results. Furthermore, attention is given to aspects such as the buoyancy calculation and methods of accounting for additional masses (such as hydrodynamic added mass). Finally, recommendations concerning the modeling of the jacket are given.
The analysis of offshore wind turbines relies on aero-hydro-servo-elastic simulation codes. These coupled time-domain-based tools take into account an interaction of various environmental conditions and the entire structural assembly of the turbine, including its control system. Due to the complexity of the models, verification and validation of the codes is required. Limited availability of measurement data impedes the valida
tion of these simulation tools. Therefore, there is a need to perform code-to-code comparisons (verification) instead. The first international project dedicated to verification of simulation tools for wind turbines, including hydrodynamic loads, was undertaken within the “Offshore Code Comparison Collaboration” (OC3) Project (Jonkman and Musial, 2010). The cooperation was focused on coupled simulations of an offshore wind turbine supported by a variety of support structures. Further research needs triggered a follow-on project, the “Offshore Code Comparison Collaboration Continuation” (OC4) Project. The OC4 project was formed under the International Energy Agency (IEA) Wind Task 30 in 2010 to investigate wind turbine coupled simulations with a jacket support structure and a semisubmersible platform. Complex hydrodynamics of the latter and local vibration phenomena of the former have not been broadly studied yet, and therefore, their analysis is of interest.
A number of academic and industrial project partners from 10 countries participate in the task. Those actively involved in Phase I are: Fraunhofer Institute for Wind Energy and Energy System Technology IWES (Germany), the National Renewable Energy Laboratory (NREL) (USA), Technical University of Denmark, Department of Wind Energy, campus Risø, Roskilde, Denmark (Risø DTU) (Denmark), Fedem Technology AS (Norway), Garrad Hassan & Partners Ltd. (UK), Institute for Energy Technology (IFE) (Norway), Pohang University of Science and Technology (POSTECH) (Korea), Centre for Ships and Ocean Structures (CeSOS) at the Norwegian University of Science and Technology (NTNU) (Norway), National Technical University of Athens (NTUA) (Greece), Institute of Steel Construction at the Leibniz Universität Hannover (LUH) (Germany), the Endowed Chair of Wind Energy at the Institute of Aircraft Design at Universität Stuttgart (SWE) (Germany),
1
Norwegian University of Science and Technology (NTNU) (Norway), Knowledge Centre WMC (The Netherlands), Energy Research Centre of the Netherlands (ECN) (The Netherlands), American Bureau of Shipping (ABS) (USA), REpower Systems SE (Germany) and China General Certification (CGC) (China). Each one of the participants has their own area of expertise, and therefore, their own unique contribution to the project.
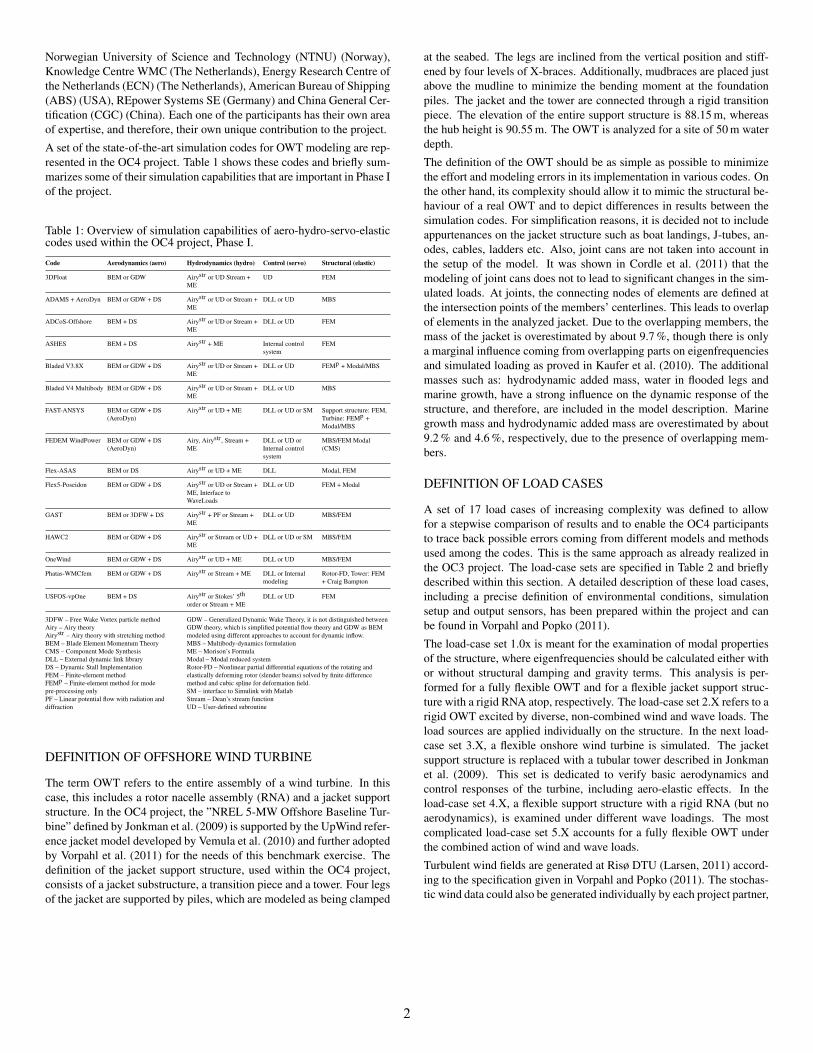
A set of the state-of-the-art simulation codes for OWT modeling are represented in the OC4 project. Table 1 shows these codes and briefly summarizes some of their simulation capabilities that are important in Phase I of the project.
Table 1: Overview of simulation capabilities of aero-hydro-servo-elastic codes used within the OC4 project, Phase I.
Code Aerodynamics (aero) Hydrodynamics (hydro) Control (servo) Structural (elastic)
3DFloat BEM or GDW Airystr or UD Stream + ME
UD FEM
ADAMS + AeroDyn BEM or GDW + DS Airystr or UD or Stream + ME
DLL or UD MBS
ADCoS-Offshore BEM + DS Airystr or UD or Stream + ME
DLL or UD FEM
ASHES BEM + DS Airystr + ME Internal control system
FEM
Bladed V3.8X BEM or GDW + DS Airystr or UD or Stream + ME
DLL or UD FEMp + Modal/MBS
Bladed V4 Multibody BEM or GDW + DS Airystr or UD or Stream + ME
DLL or UD MBS
FAST-ANSYS BEM or GDW + DS (AeroDyn)
Airystr or UD + ME DLL or UD or SM Support structure: FEM, Turbine: FEMp + Modal/MBS
FEDEM WindPower BEM or GDW + DS (AeroDyn)
Airy, Airystr , Stream + ME
DLL or UD or Internal control system
MBS/FEM Modal (CMS)
Flex-ASAS BEM or DS Airystr or UD + ME DLL Modal, FEM
Flex5-Poseidon BEM or GDW + DS Airystr or UD or Stream + ME, Interface to WaveLoads
DLL or UD FEM + Modal
GAST BEM or 3DFW + DS Airystr + PF or Stream + ME
DLL or UD MBS/FEM
HAWC2 BEM or GDW + DS Airystr or Stream or UD + ME
DLL or UD or SM MBS/FEM
OneWind BEM or GDW + DS Airystr or UD + ME DLL or UD MBS/FEM
Phatas-WMCfem BEM or GDW + DS Airystr or Stream + ME DLL or Internal modeling
Rotor-FD, Tower: FEM + Craig Bampton
USFOS-vpOne BEM + DS Airystr or Stokes’ 5th
order or Stream + ME DLL or UD FEM
3DFW – Free Wake Vortex particle method GDW – Generalized Dynamic Wake Theory, it is not distinguished between Airy – Airy theory GDW theory, which is simplified potential flow theory and GDW as BEM Airystr – Airy theory with stretching method modeled using different approaches to account for dynamic inflow. BEM – Blade Element Momentum Theory MBS – Multibody-dynamics formulation CMS – Component Mode Synthesis ME – Morison’s Formula DLL – External dynamic link library Modal – Modal reduced system DS – Dynamic Stall Implementation Rotor-FD – Nonlinear partial differential equations of the rotating and FEM – Finite-element method elastically deforming rotor (slender beams) solved by finite difference FEMp – Finite-element method for mode method and cubic spline for deformation field. pre-processing only SM – interface to Simulink with Matlab PF – Linear potential flow with radiation and Stream – Dean’s stream function diffraction UD – User-defined subroutine
DEFINITION OF OFFSHORE WIND TURBINE
The term OWT refers to the entire assembly of a wind turbine. In this case, this includes a rotor nacelle assembly (RNA) and a jacket support structure. In the OC4 project, the ”NREL 5-MW Offshore Baseline Turbine” defined by Jonkman et al. (2009) is supported by the UpWind reference jacket model developed by Vemula et al. (2010) and further adopted by Vorpahl et al. (2011) for the needs of this benchmark exercise. The definition of the jacket support structure, used within the OC4 project, consists of a jacket substructure, a transition piece and a tower. Four legs of the jacket are supported by piles, which are modeled as being clamped
at the seabed. The legs are inclined from the vertical position and stiffened by four levels of X-braces. Additionally, mudbraces are placed just above the mudline to minimize the bending moment at the foundation piles. The jacket and the tower are connected through a rigid transition piece. The elevation of the entire support structure is 88.15 m, whereas the hub height is 90.55 m. The OWT is analyzed for a site of 50 m water depth.
The definition of the OWT should be as simple as possible to minimize the effort and modeling errors in its implementation in various codes. On the other hand, its complexity should allow it to mimic the structural behaviour of a real OWT and to depict differences in results between the simulation codes. For simplification reasons, it is decided not to include appurtenances on the jacket structure such as boat landings, J-tubes, anodes, cables, ladders etc. Also, joint cans are not taken into account in the setup of the model. It was shown in Cordle et al. (2011) that the modeling of joint cans does not to lead to significant changes in the simulated loads. At joints, the connecting nodes of elements are defined at the intersection points of the members’ centerlines. This leads to overlap of elements in the analyzed jacket. Due to the overlapping members, the mass of the jacket is overestimated by about 9.7 %, though there is only a marginal influence coming from overlapping parts on eigenfrequencies and simulated loading as proved in Kaufer et al. (2010). The additional masses such as: hydrodynamic added mass, water in flooded legs and marine growth, have a strong influence on the dynamic response of the structure, and therefore, are included in the model description. Marine growth mass and hydrodynamic added mass are overestimated by about 9.2 % and 4.6 %, respectively, due to the presence of overlapping members.
DEFINITION OF LOAD CASES
A set of 17 load cases of increasing complexity was defined to allow for a stepwise comparison of results and to enable the OC4 participants to trace back possible errors coming from different models and methods used among the codes. This is the same approach as already realized in the OC3 project. The load-case sets are specified in Table 2 and briefly described within this section. A detailed description of these load cases, including a precise definition of environmental conditions, simulation setup and output sensors, has been prepared within the project and can be found in Vorpahl and Popko (2011).
The load-case set 1.0x is meant for the examination of modal properties of the structure, where eigenfrequencies should be calculated either with or without structural damping and gravity terms. This analysis is performed for a fully flexible OWT and for a flexible jacket support structure with a rigid RNA atop, respectively. The load-case set 2.X refers to a rigid OWT excited by diverse, non-combined wind and wave loads. The load sources are applied individually on the structure. In the next load-case set 3.X, a flexible onshore wind turbine is simulated. The jacket support structure is replaced with a tubular tower described in Jonkman et al. (2009). This set is dedicated to verify basic aerodynamics and control responses of the turbine, including aero-elastic effects. In the load-case set 4.X, a flexible support structure with a rigid RNA (but no aerodynamics), is examined under different wave loadings. The most complicated load-case set 5.X accounts for a fully flexible OWT under the combined action of wind and wave loads.
Turbulent wind fields are generated at Risø DTU (Larsen, 2011) according to the specification given in Vorpahl and Popko (2011). The stochastic wind data could also be generated individually by each project partner,
2
Table 2: Overview of load cases.
Load Case Enabled DOF Wind Conditions Wave Conditions
1.0x1 Support structure or all No air No water
2.1 None No air Still water
2.2 None, Rotor speed and blade Steady, uniform, no shear: No water pitch via controller Vhub = 8 m/s
2.3a None No air Regular Airy: H = 6 m, T = 10s
2.3b None No air Stream function: H = 8 m, T = 10s
2.4a None: Rotor speed and blade NTM (Kaimal): No water pitch via controller Vhub = 11.4 m/s
2.4b None: Rotor speed and blade pitch via controller
NTM (Kaimal): Vhub = 18m/s No water
2.5 None No air Irregular Airy with PM: Hs = 6m, Tp = 10s
3.2 All, Rotor speed and blade pitch Steady, uniform, no shear: No water via controller Vhub = 8 m/s
3.4a All, Rotor speed and blade pitch NTM (Kaimal): No water via controller Vhub = 11.4 m/s
4.3b Support structure No air Stream function: H = 8 m, T = 10s
4.5 Support structure No air Irregular Airy with PM: Hs = 6m, Tp = 10s
5.6 All, Rotor speed and blade pitch Steady, uniform, no shear: Stream function: via controller Vhub = 8 m/s H = 8 m, T = 10s
5.7 All: Rotor speed and blade pitch via controller
NTM – Normal turbulence model T p – peak-spectral wave period PM – Pierson-Moskowitz wave spectrum V hub – average wind speed at the hub height H – wave height x1 – a and b cases without gravity and damping, c and d cases with Hs – significant wave height gravity and damping, a and c cases only support structure DOF T – wave period enabled, b and d cases all DOF enabled
based on the above document. The alternative is given for those participants, whose codes are not able to utilize the provided wind fields due to a different grid format (i.e. Phatas and Flex5 utilize polar grid) or limitations imposed on the grid resolution (i.e. ADCoS-Offshore). The clear advantage of having these two possibilities is that the codes can be broken down into two groups for further comparison. The utilization of not the same time series of wind fields, even though they are based on the same definition of turbulence and stochastic properties, is an interesting source of discrepancies affecting the structural response. However, since only single cases are simulated, it is not possible to distinguish whether differences seen are caused by differences in turbulence modeling or stochastic uncertainty caused by the random seed selection.
Deterministic and stochastic wave loads were generated individually by each project participant. Irregular waves may be generated based on the spectral input or the exact time history of the data could be reproduced. For the latter possibility, 50 wavelets with defined wave number, amplitude, phase angles and angular frequencies are specified in Vorpahl and Popko (2011). The simulation time for the deterministic load cases is 30 s. The stochastic cases are run with one seed and the simulation time of 3600 s to get statistically comparable results.
The load cases with deterministic inputs are compared in terms of time-series outputs, whereas those with stochastic inputs are examined in terms of probability density functions (PDF), power spectral densities (PSD), and damage-equivalent loads (DEL). For each load case, the outputs are recorded at a number of nodal points (called sensors), located on the RNA and the jacket support structure as shown in Fig. 1. Sensor names result from leg numbering, side numbering, height level and joint type. TP stands for Transition Piece. The position of sensors is carefully chosen to provide maximum information regarding the OWT behaviour with the minimal effort necessary for data acquisition and
post-processing. Those sensors located on the RNA are meant to capture aeroelastic response of a turbine and its power production. The support structure sensors are used for capturing global and local dynamics of the jacket. For example, local vibrations of the structure are studied at several places of the lowest X-braces, whereas global bending moments and forces are calculated at the very bottom, mudline points. There are also four additional sensors monitoring the environmental conditions such as the wind speed at the hub height and the sea elevation at the center of the structure.
L3 L4 L1 L2
X4S3
mudbraceL4
X2S3
K1L4
mudbraceL2
X4S2
X2S2
K1L2
mudlineL2
mudlineL3 mudlineL4
mudlineL1
B59 B61
TP
X
Y
Blade 50% span
Tower top
Blade root
Generator
Low-speed shaft at main bearing
High-speed shaft
Blade tip
Fig. 1: Placement of sensors on jacket support structure (left) and wind turbine (modified sketch from GL (2005)) (right).
COMPARISON OF THE RESULTS
This section presents the exemplary results of the coupled simulations. The most interesting load cases and output sensors, according to the authors, are presented herein. Chosen results are meant to give a general overview of code-to-code differences and diverse approaches in modeling, that influence estimation of loads. The results shown herein are the effect of several revisions, which were necessary due to the complexity of models, user errors, the ongoing development of some of the codes etc. These account for corrections at all stages of OWT modeling, its simulation and post-processing of the data. Project participants put some effort into ensuring that their models: (1) are implemented according to the provided specification of the OWT, (2) initial conditions of the simulations are fulfilled and simulation start-up transients are eliminated, (3) use proper coordinate systems for the data outputs. However, some errors caused by a human factor may persist in the results.
Comparison of Mass
Prior to the simulation of the prescribed load cases, a verification of the different implementations of the OWT is conducted in terms of structural and additional masses. The comparison of masses is important, as they are directly related to the structural dynamics. Structural masses encompass the jacket, transition piece, tower and RNA. Additional masses include marine growth, water in flooded legs and the hydrodynamic added mass imposed by water surrounding the structure. The results, obtained from 18 different models, are compared against each other in Fig. 2 and Fig. 3, respectively.
In general, a very good agreement between the implemented models is observed. The achievement of such results involved a widespread discussion about modeling strategies and implementation methods. The differences in RNA masses are mainly a result of discretization of the blade and its mass integration. Dissimilarities in the tower masses are attributed to whether stepped or conical elements are used for its implementation. Standard deviations of blade and tower masses coming from different codes are 0.2 t and 0.4 t, respectively. Discrepancies in the jacket mass are the result of slightly different modeling of the structure in diverse tools, though the standard deviation of 2.3 t is also very small. The transition piece is defined as a point mass of 666 t by most of the participants. Small discrepancies should not have a profound influence on the eigenfrequencies of the OWT.
Hydrodynamic added mass and water in the flooded legs are defined from the mean sea level (MSL) to the seabed at -50 m. Marine growth is only implemented within the range of -40 m to -2 m. The discrepancies in masses mainly arise from the discretization of these threshold regions in the support structure.
Four load cases are defined for eigenmodes analysis. The exemplary results from LC 1.0b are shown in Fig. 4.
0.0
0.5
1.0
1.5
2.0
2.5
3.0
3.5
Fre
qu
en
cy [H
z]
Fraunhofer IWES / ADCoS-Offshore
Risø DTU / HAWC2
GLGH / Bladed V4.0
POSTECH / Bladed V3.85
CGC / Bladed V3.80
IFE / 3Dfloat
Fedem Technology AS / FEDEM WindPower
CeSOS-NTNU / USFOS-vpOne
NTUA / GAST
SWE / Flex5-Poseidon
REpower /ANSYS
LUH / Flex5-Poseidon
ABS / ANSYS-BModes
NTNU / ASHES
ECN-WMC / Phatas-WMCfem
Fig. 4: Exemplary eigenfrequencies, LC 1.0b.
Eigenmodes are identified based on their visualization. Additionally, the energy of the modal components could be used for this purpose. However, such information can be extracted only from a limited number of codes making the comparison rather difficult.
Values of the very first eigenmodes are in a good agreement. Discrepancies increase for higher modes. This is expected, as different codes incorporate a different number of degrees of freedom (DOF) and somewhat dissimilar ways of structural modeling. Besides that, energy of higher modes usually originates from several different DOF, from which it is supplied in a different percentage. Consequently, it is difficult to clearly assess which coupled vibration mode, for the high frequency modes, is induced based on mode visualization. Furthermore, some of the codes use different reduction methods for solving the eigenvalue problem. Phatas-WMCfem and FEDEM WindPower utilize the Craig-Bampton method (with the Guyan Reduction in case of FEDEM), to reduce the size of their FEM models. Flex5-Poseidon calculates frequencies based on a “partly” reduced approach. Flex5 reduces the flexible beam elements of a tower and blades by Modal Decoupling, whereas no reduction of the substructure is performed by Poseidon, described in Böker (2010). Then, both parts are coupled on the synthesis of the equations of motion. In general, modal-based codes predict slightly higher frequencies compared to multibody- or FEM-based tools, which indicates a stiffer behaviour of a structure. Multibody and FEM codes accommodate more DOF and thus allow for more vibrational modes. This results in reduced stiffness of the structure, which should better mimic reality. This is well observed in the case of HAWC2, which predicts slightly higher frequencies than the modal-based Bladed V3.8X. The natural frequency for the fore-aft mode is slightly higher than for the side-to-side mode of the same order. The support structure is symmetric with respect to these modes. The RNA should be the only source of difference in the natural frequencies, as for instance, there are different moments of inertia of the nacelle, hub and rotor around two horizontal axes of symmetry. A number of codes have difficulty in detecting the 1st edgewise
4
collective mode. Those that are able to capture it, show quite distinct frequencies due to the couplings with other modes. Bladed may overestimate the frequency, as the rotor inertia has to be artificially increased during the eigenanalysis to prevent the rotor from idling. This mode is close to the uncoupled edgewise vibration of the rotor. 3DFloat, Flex5 and USFOS-vpOne show significant coupling of the collective edgewise blade motion with the 1st drivetrain mode, while in ADCoS-Offshore, the coupling with the 2nd side-to-side mode is present.
The influence of gravity and damping on the eigenanalysis of the fully flexible OWT is analyzed in LC 1.0d. Gravity and damping terms are taken accounted for in Bladed, GAST, FEDEM WindPower and ANSYS-BModes. Whereas, HAWC2 and Phatas-WMCfem account for the damping term. The remaining codes neglect the influence of these two terms. A very low influence of gravity and damping on the eigenanvalues is observed; in general, much less than 1.5 %. In most of the cases, a slight decrease of frequency occurs. The highest, relative reduction is visible for the global modes such as side-to-side and the fore-aft. This is expected as gravity tends to reduce the bending stiffness of a vertical beam as shown in e.g. Jonkman (2003). A very small increase of frequencies for asymmetric flapwise and edgewise modes is observed. In general, the multibody code HAWC2 is expected to match GAST, Bladed V4.0 and FEDEM WindPower results. However, a much smaller change in the frequencies of global modes is observed, as only the damping term is used in the analysis (results not shown here).
FEM- and multibody-based codes can be used to study higher local vibrational modes of the jacket. Mode-shape based tools might not accurately predict these vibrations due to the limited number of mode shapes used for the model. Local dynamics in the jacket are observed at higher frequencies, where diverse couplings with the RNA and the global structural modes are found by many multibody and FEM tools. Exemplary results are shown in Fig. 5. There is a distinct range of frequencies, where the lowest modes of the local jacket vibrations are detected by different tools. Therefore, more detailed analysis is necessary in the future. The presented modes do not account for hydrodynamic added mass. The presence of hydrodynamic added mass significantly reduces the frequencies of local modes as shown in i.e. Moll et al. (2010), which will bring the local brace bending frequencies closer to the low frequency modes (with higher energy content).
(a) ADCoS (b) USFOS (c) 3DFloat (d) Fedem (e) GAST 5.59 Hz. Offshore VPOne 6.29 Hz. WindPower 2.67 Hz. 5.40 Hz. 4.67 Hz.
Fig. 5: Exemplary eigenmodes including local jacket vibrations and couplings detected by various codes.
Rigid OWT
In the load-case set 2.X, special attention is given to proper calculation of buoyancy. There has been a wide discussion within the OC4 project concerning the modeling strategy for buoyancy and its physical correctness. Buoyancy can be accounted for based on the displaced volume method or the pressure integration method. The former estimates weight of water displaced by submerged elements of the structure. The latter integrates the external pressure acting on the surface of a structure accounting for all pressure forces imposed on individual members. The pressure integration method provides more accurate estimation of buoyancy and should be used in the analysis of jackets. This method accounts for hydrodynamic and hydrostatic pressures. The hydrostatic pressure is associated with pressure exerted by a column of water due to the gravity force. The hydrodynamic pressure refers to kinetic energy of water particles.
The structure modeled within the OC4 project is cut and clamped fixed at the mudline (see Fig. 6a). In such a case, there is no upward buoyant force acting on the bottom, cross sectional area of a pile that is in contact with the seabed, as described in Clauss et al. (1992). As the piles are modeled as cut at the mudline (they do not penetrate the seabed), the pore water pressure in the seabed is also ignored in the modeling.
(a) Pile modeled as cut and fixed at the mudline, arrows indicate the areas where pressure is integrated.
-17200
-17000
-16800
-16600
-16400
-16200
-16000
-15800
-15600
-15400
MudFz
[kN
]
(b) Vertical force at mudline for still water case, LC 2.1.
(c) Vertical force at mudline for Airy wave with Wheeler stretching case, LC 2.3a.
Fig. 6: Resulting vertical force at the base of the structure and modeling strategy of a pile at the mudline.
The resulting vertical forces at the base of the structure, for LC 2.1 and LC 2.3a, are shown in Fig. 6b and Fig. 6c, respectively. The shifts in the mean values of force are due to the diverse modeling approaches in accounting for buoyancy. Those project participants, that considered in their modeling strategies, that the structure is clamped fixed at the seabed, ended up with a mean force at about -16600 kN (a force directed upward) at the mudline. Other participants that did not adapt this approach, ended up with about -15800 kN. In those cases, the buoyancy force was exerted at the bottom surfaces of piles. In Bladed V4.0, there is an additional pressure force applied on the top of the grouted piles that leads to about -17150 kN. In Flex5-Poseidon utilized by SWE, buoyancy of legs was ignored, as the code could not handle hollow tubes at the
5
8.95
9
9.05
9.1
9.15
9.2
9.25
0 5 10 15 20
RotS
pee
d [
rpm
]
Time [s]
1700
1720
1740
1760
1780
1800
1820
1840
0 5 10 15 20
Gen
Pwr
[kW
]
Time [s]
-1000-800-600-400-200
0 200 400 600 800
1000
0 5 10 15 20 25 30
BSX [
kN]
Time [s]
Fraunhofer IWES/ADCoS-OffshoreFEDEM/WindPower
GLGH/Bladed V4POSTECH/Bladed V3.85
SWE/Flex5-Poseidon CeSOS-NTNU/USFOS-vpOne
IFE/3DFloatNTUA/GAST
LUH/Flex5-PoseidonABS/FAST-ANSYSRisø DTU/HAWC2
NTNU/ASHESFraunhofer IWES/OneWind
time this paper was written. Pressure integration was only applied on the surface of sealed braces, which led to the mudline vertical force of about -17100 kN.
Differences in the peak-to-peak amplitude of the vertical forces at the mudline, shown in Fig. 6c, are mainly based on whether the displaced volume or the pressure integration method is used for calculation of buoyancy. The integration of the hydrodynamic pressure results in a reduced buoyancy effect seen at the mudline during the wave crest (higher upward buoyancy force at the wave crest), while it is increased during the wave through (lower upward buoyancy force at the wave through), compared to the displaced volume method. This is observed as smaller peak-to-peak amplitudes of the vertical force at the mudline. In reality, at the relatively deep position, the hydrostatic pressure does not change that much due to the changing water surface elevation. The influence of the hydrodynamic pressure is also small. Therefore, the variation in the vertical force at the mudline should also be small. This is observed in the results obtained with the pressure integration method.
Summing up, the difference between the two furthest outliers is about 9 %. This is acceptable, especially as different modeling assumptions for buoyancy were applied. Also, different masses of marine growth and the jacket substructure contributed to discrepancies.
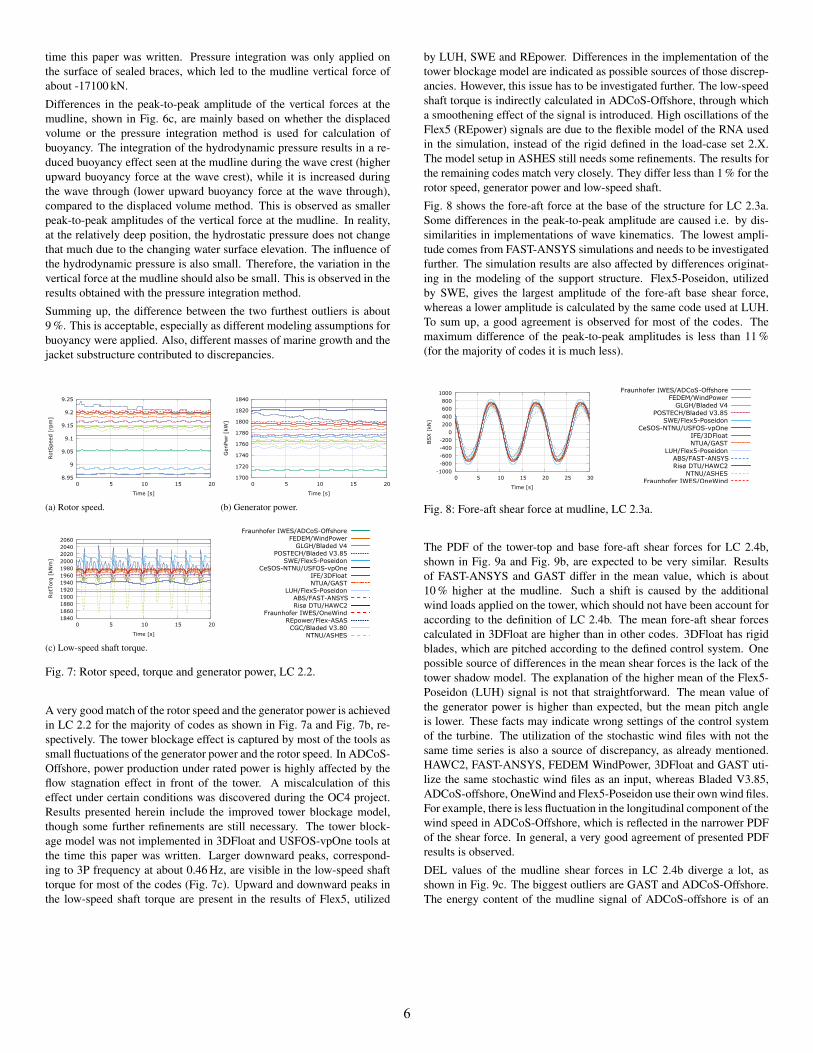
Fig. 7: Rotor speed, torque and generator power, LC 2.2.
A very good match of the rotor speed and the generator power is achieved in LC 2.2 for the majority of codes as shown in Fig. 7a and Fig. 7b, respectively. The tower blockage effect is captured by most of the tools as small fluctuations of the generator power and the rotor speed. In ADCoS-Offshore, power production under rated power is highly affected by the flow stagnation effect in front of the tower. A miscalculation of this effect under certain conditions was discovered during the OC4 project. Results presented herein include the improved tower blockage model, though some further refinements are still necessary. The tower blockage model was not implemented in 3DFloat and USFOS-vpOne tools at the time this paper was written. Larger downward peaks, corresponding to 3P frequency at about 0.46 Hz, are visible in the low-speed shaft torque for most of the codes (Fig. 7c). Upward and downward peaks in the low-speed shaft torque are present in the results of Flex5, utilized
by LUH, SWE and REpower. Differences in the implementation of the tower blockage model are indicated as possible sources of those discrepancies. However, this issue has to be investigated further. The low-speed shaft torque is indirectly calculated in ADCoS-Offshore, through which a smoothening effect of the signal is introduced. High oscillations of the Flex5 (REpower) signals are due to the flexible model of the RNA used in the simulation, instead of the rigid defined in the load-case set 2.X. The model setup in ASHES still needs some refinements. The results for the remaining codes match very closely. They differ less than 1 % for the rotor speed, generator power and low-speed shaft.
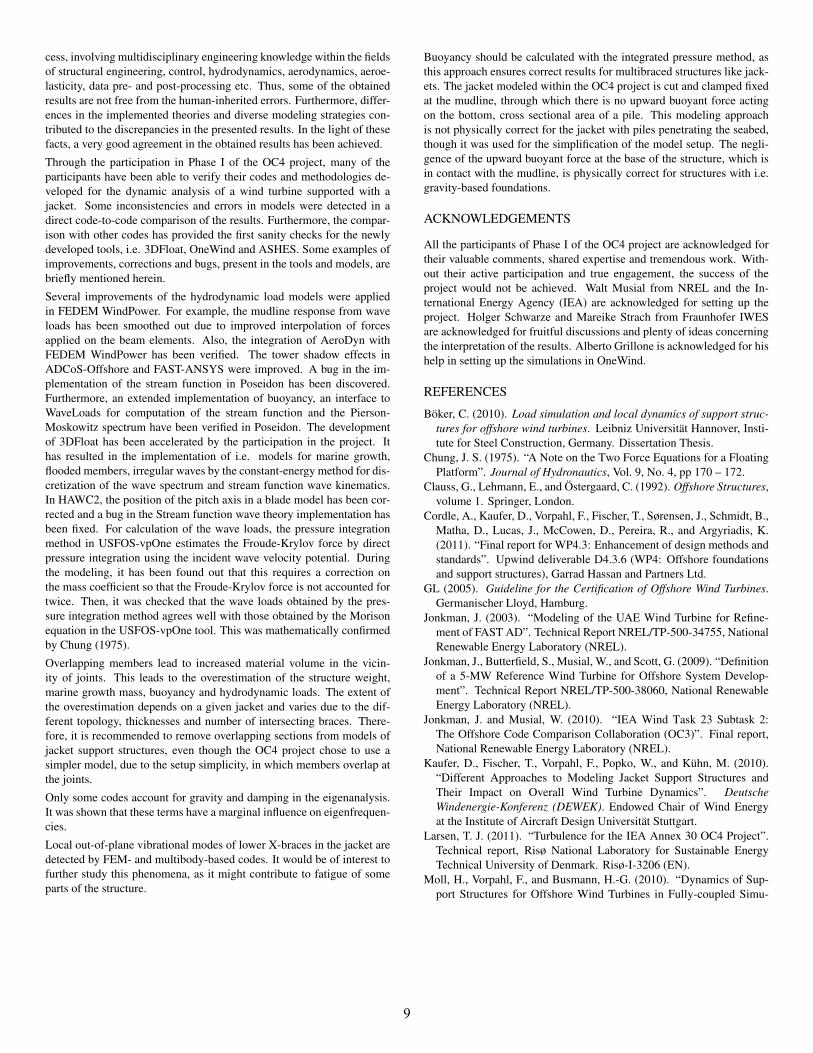
Fig. 8 shows the fore-aft force at the base of the structure for LC 2.3a. Some differences in the peak-to-peak amplitude are caused i.e. by dissimilarities in implementations of wave kinematics. The lowest amplitude comes from FAST-ANSYS simulations and needs to be investigated further. The simulation results are also affected by differences originating in the modeling of the support structure. Flex5-Poseidon, utilized by SWE, gives the largest amplitude of the fore-aft base shear force, whereas a lower amplitude is calculated by the same code used at LUH. To sum up, a good agreement is observed for most of the codes. The maximum difference of the peak-to-peak amplitudes is less than 11 % (for the majority of codes it is much less).
Fig. 8: Fore-aft shear force at mudline, LC 2.3a.
The PDF of the tower-top and base fore-aft shear forces for LC 2.4b, shown in Fig. 9a and Fig. 9b, are expected to be very similar. Results of FAST-ANSYS and GAST differ in the mean value, which is about 10 % higher at the mudline. Such a shift is caused by the additional wind loads applied on the tower, which should not have been account for according to the definition of LC 2.4b. The mean fore-aft shear forces calculated in 3DFloat are higher than in other codes. 3DFloat has rigid blades, which are pitched according to the defined control system. One possible source of differences in the mean shear forces is the lack of the tower shadow model. The explanation of the higher mean of the Flex5Poseidon (LUH) signal is not that straightforward. The mean value of the generator power is higher than expected, but the mean pitch angle is lower. These facts may indicate wrong settings of the control system of the turbine. The utilization of the stochastic wind files with not the same time series is also a source of discrepancy, as already mentioned. HAWC2, FAST-ANSYS, FEDEM WindPower, 3DFloat and GAST utilize the same stochastic wind files as an input, whereas Bladed V3.85, ADCoS-offshore, OneWind and Flex5-Poseidon use their own wind files. For example, there is less fluctuation in the longitudinal component of the wind speed in ADCoS-Offshore, which is reflected in the narrower PDF of the shear force. In general, a very good agreement of presented PDF results is observed.
DEL values of the mudline shear forces in LC 2.4b diverge a lot, as shown in Fig. 9c. The biggest outliers are GAST and ADCoS-Offshore. The energy content of the mudline signal of ADCoS-offshore is of an
6
order less than other codes, and its distribution is narrower, resulting in the lowest DEL value. The opposite behaviour is observed for GAST (the PSD results are not shown herein). Apart from the outliers, the maximum difference between other tools is less than 20 %, which is a good result considering all the mentioned differences in the setup of LC 2.4b.
0
0.001
0.002
0.003
0.004
0.005
0.006
0.007
0.008
0.009
100 200 300 400 500 600
PDF
[kN
]-1
YawBrFxp [kN]
0
0.001
0.002
0.003
0.004
0.005
0.006
0.007
0.008
0.009
100 200 300 400 500 600
PDF
[kN
]-1
BSX [kN]
(a) PDF – Tower-top fore-aft shear force. (b) PDF – Fore-aft shear force at mudline.
100
120
140
160
180
200
220
240
260
280
300
BSX
[kN
]
Fraunhofer IWES/ADCoS-OffshoreFEDEM/WindPower
POSTECH/Bladed V3.85IFE/3DFloatNTUA/GAST
LUH/Flex5-PoseidonABS/FAST-ANSYSRisø DTU/HAWC2
Fraunhofer IWES/OneWind
(c) DEL – Fore-aft shear force at mudline.
Fig. 9: Fore-aft forces at tower-top and mudline of the structure, LC 2.4b.
Flexible Onshore Turbine
In Fig. 10a, tip twist of Blade 1 for LC 3.2 is zero in the FAST, Flex5 and Bladed V3.85 outputs, as these codes do not consider torsion of the blade. USFOS/vpOne considers the torsional degree of freedom for the blade, however there is no output providing a time history of the tip angle. The blade torsion is included in the multibody release of Bladed V4.0 (no results presented herein) and should be soon implemented in FAST. The results of FEDEM WindPower and GAST match closely. The biggest outlier, with the highest peak-to-peak oscillation, is ADCOS-Offshore. This has to be investigated further.
The fluctuations of the low-speed shaft torque in LC 3.2 are mainly caused by the tower blockage effect pronounced as 3P frequency at about 0.46 Hz and its higher harmonics as shown in Fig. 10b. Only the first 10 s of the time series are shown for better clarity. In ADCoS-Offshore, the low-speed shaft torque is calculated indirectly through which a smoothening effect is introduced. The shift of HAWC2 signal corresponds to higher rotational speed of the rotor, achieved by this tool in LC 3.2. The low-speed shaft torque of Flex5, utilized by REpower, is not shown herein due to excessive oscillations of the signal. Further refinements of the model are necessary. In general, mean values of the low-speed shaft torque are close for all the tools.
A very good agreement in the distribution of flapwise and edgewise shear forces at the blade root is observed among the codes in LC 3.4a, as shown in Fig. 11a and Fig. 11b, respectively. The greatest outlier is Flex5 (REpower) due to the incorrect specification of the stochastic wind. Minor shifts in the mean values of the flapwise force distributions are caused by differences in the thrust force. For the spinning-rotor cases, rigid blades are used in 3DFloat. Nevertheless, the distributions of the blade root forces closely match other codes where a flexible rotor is defined.
-1
-0.8
-0.6
-0.4
-0.2
0
0.2
0.4
0 5 10 15 20 25 30
Tw
stD
efl1
[deg
]
Time [s]
1940
1950
1960
1970
1980
1990
2000
2010
2020
0 2 4 6 8 10
RotT
orq
[kN
m]
Time [s]
(a) Blade 1 tip twist. (b) Low-speed shaft torque.
Fraunhofer IWES/ADCoS-OffshoreFEDEM/WindPower
POSTECH/Bladed V3.85 CeSOS-NTNU/USFOS-vpOne
NTUA/GASTABS/FAST-ANSYSRisø DTU/HAWC2
REpower/Flex-ASAS
Fig. 10: Blade deflections and low-speed shaft torque, LC 3.2.
0
0.005
0.01
0.015
0.02
0.025
100 150 200 250 300 350 400
PDF
[kN
]-1
RootFxc1 [kN]
0
0.001
0.002
0.003
0.004
0.005
0.006
0.007
0.008
0.009
-250 -200 -150 -100 -50 0 50 100 150 200
PDF
[kN
]-1
RootFyc1 [kN]
(a) PDF – flapwise shear force at blade root. (b) PDF – edgewise shear force at blade root.
0
0.002
0.004
0.006
0.008
0.01
0.012
-200 -150 -100 -50 0 50 100 150
PDF
[kN
m]-
1
RootMzc1 [kNm]
Fraunhofer IWES/ADCoS-OffshoreFEDEM/WindPower
POSTECH/Bladed V3.85IFE/3DFloatNTUA/GAST
ABS/FAST-ANSYSRisø DTU/HAWC2
REpower/Flex-ASAS
(c) PDF – pitching moment at blade root.
Fig. 11: PDF of blade root forces and pitching moment, LC 3.4a.
The PDF of the pitching moment at the blade root is shown in Fig. 11c. The discrepancies originate from the rate and magnitude of the pitching action, dependent on whether or not a rated speed of the rotor is achieved. HAWC2, FAST, FEDEM WindPower, 3DFloat and GAST utilize the same stochastic wind files as input; only Bladed V3.85 uses its own wind files. Thus, the sources of discrepancies in the pitching moment at the blade root should mainly originate from the implementation of the blade model in various tools. For example, a shift of the blade mass center can affect the distribution of these values. Bladed V3.85 is the biggest outlier. However, such a difference is not caused by the utilization of the wind files with not the same time series, as the PDF of the longitudinal wind component matches very well the same component in the wind files prepared by Risø DTU. The shift of the PDF of the pitching moment suggests incorrect setup of the model. For example the aerodynamic center, relative to the pitch axis, could be specified incorrectly. However, in other stochastic LCs 2.4a, 2.4b and 5.7, PDF of the pitching moment of Bladed V3.85 matches other tools. Summing up, a good agreement of the PDF is observed for the majority of codes.
7
Flexible Support Structure Flexible OWT
The out-of-plane displacement in the fore-aft direction, of the central joint X2S2 of X-brace (see Fig. 1), is shown in Fig. 12 for LC 4.3b. The OWT is excited with a deterministic wave, described by the 9th order stream function wave. The agreement of signal trends is remarkably good, though the peak-to-peak amplitude is very small. A frequency shift of the output of Flex5-Poseidon, utilized by SWE, is caused by a bug in the stream function wave. LUH also uses Flex5-Poseidon. However in their case, the WaveLoads tool was used to compute the stream function wave and then linked to Flex5-Poseidon by a DLL library. The relatively highest oscillation amplitude of 3DFloat requires further attention.
Fig. 12: Out-of-plane deflection at center of X-joint at level 2 on side 2, LC 4.3b.
In LC 4.5, the OWT is excited with a stochastic irregular wave. The axial force of the member B59 at lowest X-brace (location presented in Fig. 1) is shown in Fig. 13. Frequency peaks at about 0.3 Hz, and in ranges of 1.1 to 1.2 Hz and 2.6 to 2.8 Hz correspond to the 1st and 2nd global fore-aft modes and torsion, respectively, as detected in LC 1.0a and LC 1.0c. The results of the distribution of the axial member forces, shown in Fig. 13b, differ in the mean values mainly due to the differences in buoyancy modeling, discretization of the member, and therefore, slight offsets in placement of the output sensors. However, the widths and heights of most PDF are similar, indicating a good agreement in the fluctuation rate of the member axial force.
1.0E-006
1.0E-004
1.0E-002
1.0E+000
1.0E+002
1.0E+004
1.0E+006
1.0E+008
0 0.5 1 1.5 2 2.5 3 3.5 4 4.5 5
B59Ax
[dB/H
z]
Frequency [Hz]
0
0.005
0.01
0.015
0.02
0.025
0.03
-500 -450 -400 -350 -300 -250 -200 -150 -100 -50
PDF
[kN
]-1
B59Ax [kN]
(a) PSD – axial force in B59. (b) PDF– axial force in B59.
FEDEM/WindPowerPOSTECH/Bladed V3.85
SWE/Flex5-Poseidon CeSOS-NTNU/USFOS-vpOne
IFE/3DFloatNTUA/GAST
LUH/Flex5-PoseidonABS/FAST-ANSYSRisø DTU/HAWC2
Fig. 13: Axial force in center of brace 59, LC 4.5.
The DEL of the axial forces, for LC 5.7, from sensors K1L2 and mudbraceL2 (see Fig. 1) from Leg 2 are shown in Fig. 14a and Fig. 14b, respectively. The biggest outlier in the DEL of the axial force at K1L2 located in the splash zone is Flex5-Poseidon utilized by SWE. This is due to the incorrect implementation of the stochastic wave, which is observed in the case of the code used at SWE. The remaining codes ended up with relatively small differences. The discrepancies at mudbraceL2 are relatively high, as many diverse modeling strategies influenced it.
Shifts in the mean values of the PDF of the axial force at the mudbrace shown in Fig. 14c are caused by different approaches in modeling of buoyancy as previously explained. FAST-ANSYS is under further development concerning the modeling of irregular waves, and the results for LC 5.7 are not shown in Fig. 14. However, the preliminary result comparison has provided valuable input to support this development.
800 850 900 950
1000 1050 1100 1150 1200 1250 1300 1350
K1L2
[kN
]
2000
2200
2400
2600
2800
3000
3200
MudbraceL2
[kN
]
(a) DEL – axial force in Leg 2 at K1L2. (b) DEL – axial force in Leg 2 at mudbraceL2.
0
0.0001
0.0002
0.0003
0.0004
0.0005
0.0006
-6000 -4000 -2000 0 2000
PDF
[kN
]-1
MudbraceL2 [kN]
FEDEM/WindPowerPOSTECH/Bladed V3.85
SWE/Flex5-PoseidonIFE/3DFloatNTUA/GAST
LUH/Flex5-PoseidonRisø DTU/HAWC2
(c) PDF – axial force in Leg 2 at mudbrace level.
Fig. 14: Damage equivalent loads at jacket leg, LC 5.7.
CONCLUSION
This paper presents the results of the OC4 project Phase I, focused on the coupled simulation of an offshore wind turbine with a jacket support structure. A detailed description of the support structure model is developed within the project. A set of deterministic and stochastic load cases of increasing complexity is discussed and simulated. The load cases with deterministic inputs are compared in terms of time-series output, and the stochastic cases are compared in terms of probability density functions, power spectral densities, and damage equivalent loads. Exemplary results of the simulations are presented in this paper. The exemplary discrepancies between the codes are shown and sources of differences are discussed. The presence of the local dynamic effects in the structure is depicted in the simulation results. Furthermore, attention is given to aspects like the buoyancy calculation and methods of accounting for additional inertia forces (such as from the hydrodynamic added mass), which were not analyzed extensively in the OC3 project. Finally, recommendations concerning the modeling of the jacket are given.
The setup of coupled OWT simulations is an elaborated and difficult pro
8
cess, involving multidisciplinary engineering knowledge within the fields of structural engineering, control, hydrodynamics, aerodynamics, aeroelasticity, data pre- and post-processing etc. Thus, some of the obtained results are not free from the human-inherited errors. Furthermore, differences in the implemented theories and diverse modeling strategies contributed to the discrepancies in the presented results. In the light of these facts, a very good agreement in the obtained results has been achieved.
Through the participation in Phase I of the OC4 project, many of the participants have been able to verify their codes and methodologies developed for the dynamic analysis of a wind turbine supported with a jacket. Some inconsistencies and errors in models were detected in a direct code-to-code comparison of the results. Furthermore, the comparison with other codes has provided the first sanity checks for the newly developed tools, i.e. 3DFloat, OneWind and ASHES. Some examples of improvements, corrections and bugs, present in the tools and models, are briefly mentioned herein.
Several improvements of the hydrodynamic load models were applied in FEDEM WindPower. For example, the mudline response from wave loads has been smoothed out due to improved interpolation of forces applied on the beam elements. Also, the integration of AeroDyn with FEDEM WindPower has been verified. The tower shadow effects in ADCoS-Offshore and FAST-ANSYS were improved. A bug in the implementation of the stream function in Poseidon has been discovered. Furthermore, an extended implementation of buoyancy, an interface to WaveLoads for computation of the stream function and the Pierson-Moskowitz spectrum have been verified in Poseidon. The development of 3DFloat has been accelerated by the participation in the project. It has resulted in the implementation of i.e. models for marine growth, flooded members, irregular waves by the constant-energy method for discretization of the wave spectrum and stream function wave kinematics. In HAWC2, the position of the pitch axis in a blade model has been corrected and a bug in the Stream function wave theory implementation has been fixed. For calculation of the wave loads, the pressure integration method in USFOS-vpOne estimates the Froude-Krylov force by direct pressure integration using the incident wave velocity potential. During the modeling, it has been found out that this requires a correction on the mass coefficient so that the Froude-Krylov force is not accounted for twice. Then, it was checked that the wave loads obtained by the pressure integration method agrees well with those obtained by the Morison equation in the USFOS-vpOne tool. This was mathematically confirmed by Chung (1975).
Overlapping members lead to increased material volume in the vicinity of joints. This leads to the overestimation of the structure weight, marine growth mass, buoyancy and hydrodynamic loads. The extent of the overestimation depends on a given jacket and varies due to the different topology, thicknesses and number of intersecting braces. Therefore, it is recommended to remove overlapping sections from models of jacket support structures, even though the OC4 project chose to use a simpler model, due to the setup simplicity, in which members overlap at the joints.
Only some codes account for gravity and damping in the eigenanalysis. It was shown that these terms have a marginal influence on eigenfrequencies.
Local out-of-plane vibrational modes of lower X-braces in the jacket are detected by FEM- and multibody-based codes. It would be of interest to further study this phenomena, as it might contribute to fatigue of some parts of the structure.
Buoyancy should be calculated with the integrated pressure method, as this approach ensures correct results for multibraced structures like jackets. The jacket modeled within the OC4 project is cut and clamped fixed at the mudline, through which there is no upward buoyant force acting on the bottom, cross sectional area of a pile. This modeling approach is not physically correct for the jacket with piles penetrating the seabed, though it was used for the simplification of the model setup. The negligence of the upward buoyant force at the base of the structure, which is in contact with the mudline, is physically correct for structures with i.e. gravity-based foundations.
ACKNOWLEDGEMENTS
All the participants of Phase I of the OC4 project are acknowledged for their valuable comments, shared expertise and tremendous work. Without their active participation and true engagement, the success of the project would not be achieved. Walt Musial from NREL and the International Energy Agency (IEA) are acknowledged for setting up the project. Holger Schwarze and Mareike Strach from Fraunhofer IWES are acknowledged for fruitful discussions and plenty of ideas concerning the interpretation of the results. Alberto Grillone is acknowledged for his help in setting up the simulations in OneWind.
REFERENCES
Böker, C. (2010). Load simulation and local dynamics of support structures for offshore wind turbines. Leibniz Universität Hannover, Institute for Steel Construction, Germany. Dissertation Thesis.
Chung, J. S. (1975). “A Note on the Two Force Equations for a Floating Platform”. Journal of Hydronautics, Vol. 9, No. 4, pp 170 – 172.
Clauss, G., Lehmann, E., and Östergaard, C. (1992). Offshore Structures, volume 1. Springer, London.
Cordle, A., Kaufer, D., Vorpahl, F., Fischer, T., Sørensen, J., Schmidt, B., Matha, D., Lucas, J., McCowen, D., Pereira, R., and Argyriadis, K. (2011). “Final report for WP4.3: Enhancement of design methods and standards”. Upwind deliverable D4.3.6 (WP4: Offshore foundations and support structures), Garrad Hassan and Partners Ltd.
GL (2005). Guideline for the Certification of Offshore Wind Turbines. Germanischer Lloyd, Hamburg.
Jonkman, J. (2003). “Modeling of the UAE Wind Turbine for Refinement of FAST AD”. Technical Report NREL/TP-500-34755, National Renewable Energy Laboratory (NREL).
Jonkman, J., Butterfield, S., Musial, W., and Scott, G. (2009). “Definition of a 5-MW Reference Wind Turbine for Offshore System Development”. Technical Report NREL/TP-500-38060, National Renewable Energy Laboratory (NREL).
Jonkman, J. and Musial, W. (2010). “IEA Wind Task 23 Subtask 2: The Offshore Code Comparison Collaboration (OC3)”. Final report, National Renewable Energy Laboratory (NREL).
Kaufer, D., Fischer, T., Vorpahl, F., Popko, W., and Kühn, M. (2010). “Different Approaches to Modeling Jacket Support Structures and Their Impact on Overall Wind Turbine Dynamics”. Deutsche Windenergie-Konferenz (DEWEK). Endowed Chair of Wind Energy at the Institute of Aircraft Design Universität Stuttgart.
Larsen, T. J. (2011). “Turbulence for the IEA Annex 30 OC4 Project”. Technical report, Risø National Laboratory for Sustainable Energy Technical University of Denmark. Risø-I-3206 (EN).
Moll, H., Vorpahl, F., and Busmann, H.-G. (2010). “Dynamics of Support Structures for Offshore Wind Turbines in Fully-coupled Simu
9
lations - Influence of Water Added Mass on Jacket Mode Shapes, Natural Frequencies and Loads”. European Wind Energy Conference (EWEC). Fraunhofer Institute for Wind Energy and Energy Systems Technology IWES.
Vemula, N. K., DeVries, W., Fischer, T., Cordle, A., and Schmidt, B. (2010). “Design solution for the Upwind reference offshore support structure”. Upwind deliverable D4.2.6 (WP4: Offshore foundations and support structures), Rambøll Wind Energy.
Vorpahl, F., Kaufer, D., and Popko, W. (2011). “Description of a Basic Model of the "Upwind Reference Jacket" for Code Comparison in the OC4 Project under IEA
Wind Annex 30”. Technical report, Fraunhofer Institute for Wind Energy and Energy System Technology IWES. http://www.iwes.fraunhofer.de/en/publications/list_of_publication/ publikationen_veroeffentlichungengesamt/2011/description_of_ abasicmodeloftheupwindreferencejacketforcodecompa.html.
Vorpahl, F. and Popko, W. (2011). “Description of the Load Cases and Output Sensors to be Simulated in the OC4 Project under IEA Wind Annex 30”. Technical report, Fraunhofer Institute for Wind Energy and Energy System Technology IWES.