Conference Paper NREL/CP-500-47534 April 2010 Offshore Code Comparison Collaboration within IEA Wind Task 23: Phase IV Results Regarding Floating Wind Turbine Modeling Preprint J. Jonkman National Renewable Energy Laboratory T. Larsen and A. Hansen Riso National Laboratory, Denmark T. Nygaard Institute for Energy Technology, Norway K. Maus Norwegian University of Life Sciences (UMB), Norway M. Karimirad, Z. Gao, and T. Moan Norwegian University of Science and Technology (NTNU), Norway I Fylling . Marintek, Norway J. Nichols Garrad Hassan & Partners Limited, United Kingdom M. Kohlmeier ForWind, Leibniz University of Hannover, Germany J. Pascual Vergara and D. Merino Acciona Energia, Spain W. Shi and H. Park Pohand University of Science and Technology, Korea To be presented at European Wind Energy Conference (EWEC) Warsaw, Poland April 20-23, 2010
Transcript
Conference Paper NREL/CP-500-47534 April 2010
Offshore Code Comparison Collaboration within IEA Wind Task 23: Phase IV Results Regarding Floating Wind Turbine Modeling Preprint J. Jonkman National Renewable Energy Laboratory
T. Larsen and A. Hansen Riso National Laboratory, Denmark
T. Nygaard Institute for Energy Technology, Norway
K. Maus Norwegian University of Life Sciences (UMB), Norway
M. Karimirad, Z. Gao, and T. Moan Norwegian University of Science and Technology (NTNU), Norway
I Fylling .Marintek, Norway
J. Nichols Garrad Hassan & Partners Limited, United Kingdom
M. Kohlmeier ForWind, Leibniz University of Hannover, Germany
J. Pascual Vergara and D. Merino Acciona Energia, Spain
W. Shi and H. Park Pohand University of Science and Technology, Korea To be presented at European Wind Energy Conference (EWEC) Warsaw, Poland April 20-23, 2010
NOTICE
The submitted manuscript has been offered by an employee of the Alliance for Sustainable Energy, LLC (ASE), a contractor of the US Government under Contract No. DE-AC36-08-GO28308. Accordingly, the US Government and ASE retain a nonexclusive royalty-free license to publish or reproduce the published form of this contribution, or allow others to do so, for US Government purposes.
This report was prepared as an account of work sponsored by an agency of the United States government. Neither the United States government nor any agency thereof, nor any of their employees, makes any warranty, express or implied, or assumes any legal liability or responsibility for the accuracy, completeness, or usefulness of any information, apparatus, product, or process disclosed, or represents that its use would not infringe privately owned rights. Reference herein to any specific commercial product, process, or service by trade name, trademark, manufacturer, or otherwise does not necessarily constitute or imply its endorsement, recommendation, or favoring by the United States government or any agency thereof. The views and opinions of authors expressed herein do not necessarily state or reflect those of the United States government or any agency thereof.
Available electronically at http://www.osti.gov/bridge
Available for a processing fee to U.S. Department of Energy and its contractors, in paper, from:
U.S. Department of Energy Office of Scientific and Technical Information P.O. Box 62 Oak Ridge, TN 37831-0062 phone: 865.576.8401 fax: 865.576.5728 email: mailto:[email protected]
Available for sale to the public, in paper, from: U.S. Department of Commerce National Technical Information Service 5285 Port Royal Road Springfield, VA 22161 phone: 800.553.6847 fax: 703.605.6900 email: [email protected] online ordering: http://www.ntis.gov/ordering.htm
Printed on paper containing at least 50% wastepaper, including 20% postconsumer waste
Abstract Offshore wind turbines are designed and analyzed using comprehensive simulation codes that account for the coupled dynamics of the wind inflow, aerodynamics, elasticity, and controls of the turbine, along with the incident waves, sea current, hydrodynamics, and foundation dynamics of the support structure. This paper describes the latest findings of the code-to-code verification activities of the Offshore Code Comparison Collaboration, which operates under Subtask 2 of the International Energy Agency Wind Task 23. In the latest phase of the project, participants used an assortment of codes to model the coupled dynamic response of a 5-MW wind turbine installed on a floating spar buoy in 320 m of water. Code predictions were compared from load-case simulations selected to test different model features. The comparisons have resulted in a greater understanding of offshore floating wind turbine dynamics and modeling techniques, and better knowledge of the validity of various approximations. The lessons learned from this exercise have improved the participants’ codes, thus improving the standard of offshore wind turbine modeling. Keywords: offshore wind turbine, floating, spar buoy, aero-hydro-servo-elastic analysis, code verification
Introduction The vast offshore wind resource represents a potential to use wind turbines installed offshore to power much of the world. Design standardization is difficult, however, because offshore sites vary significantly through differences in water depth, soil type, and wind and wave
severity. To ensure that offshore wind turbine installations are cost effective, the use of a variety of support structure types is required. These types include fixed-bottom monopiles, gravity bases, and space-frames—such as tripods and lattice frames (“jackets”)—and floating structures. In this context, the offshore wind industry faces many new design challenges. Wind turbines are designed and analyzed using simulation tools (i.e., design codes) capable of predicting the coupled dynamic loads and responses of the system. Land-based wind turbine analysis relies on the use of aero-servo-elastic codes, which incorporate wind-inflow, aerodynamic (aero), control system (servo), and structural-dynamic (elastic) models in the time domain in a coupled simulation environment. In recent years, some of these codes have been expanded to include the additional dynamics pertinent to offshore installations, including the incident waves, sea current, hydrodynamics, and foundation dynamics of the support structure [1]. The sophistication of these aero-hydro-servo-elastic codes, and the limited data available with which to validate them, underscore the need to verify their accuracy and correctness. The Offshore Code Comparison Collaboration (OC3), which operates under Subtask 2 of the International Energy Agency (IEA) Wind Task 23, was established to meet this need.
Overview of OC3 To test the newly developed codes, the main activities of OC3 are (1) discussing modeling strategies, (2) developing a suite of benchmark models and simulations, (3) running the simulations and processing the
2
simulation results, and (4) comparing and discussing the results. These activities fall under the much broader objectives of • Assessing the accuracy and reliability of
simulations to establish confidence in their predictive capabilities
• Training new analysts how to run and apply the codes correctly
• Investigating the capabilities and limitations of implemented theories
• Refining applied analysis methodologies • Identifying further research and
development needs. Such verification work, in the past, has led to dramatic improvements in model accuracy as the code-to-code comparisons and lessons learned have helped identify model deficiencies and needed improvements. These results are important because the advancement of the offshore wind industry is closely tied to the development and accuracy of dynamics models.
Participants and Codes The OC3 project is performed through technical exchange among a group of international participants who come from universities, research institutions, and industry across the United States of America, Germany, Denmark, the United Kingdom, Spain, the Netherlands, Norway, Sweden, and Korea. In this paper, specifically, results are presented from participants from the National Renewable Energy Laboratory (NREL), Risø National Laboratory of the Technical University of Denmark (Risø-DTU), MARINTEK, the Norwegian University of Science and Technology (NTNU), the Institute for Energy Technology (IFE), the Norwegian University of Life Sciences
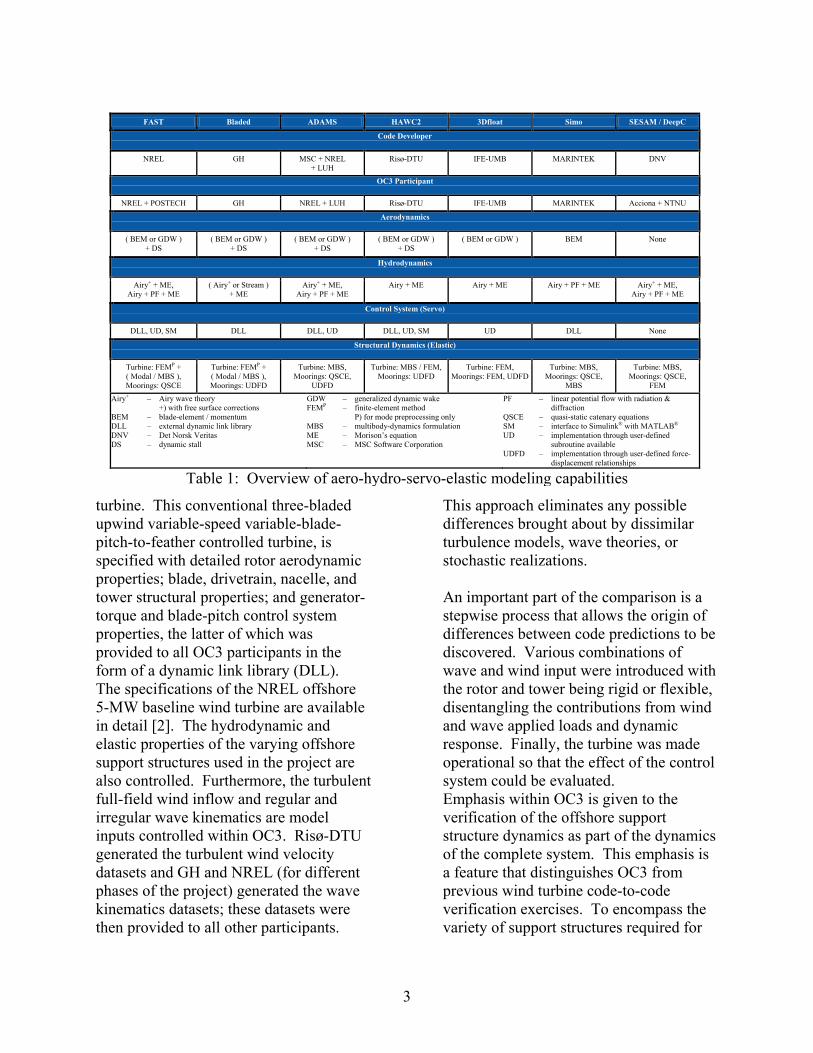
(UMB), Garrad Hassan & Partners Limited (GH), the Leibniz University of Hannover (LUH), Acciona Energia, and the Pohang University of Science and Technology (POSTECH). Most of the aero-hydro-servo-elastic codes that have been developed for modeling the dynamic response of offshore wind turbines are tested within OC3. The existing modeling capabilities of the simulation tools used by (and for some, developed by) each participant are summarized in Table 1. In the cases where Table 1 shows the same code being used by multiple OC3 participants, the model development, simulation runs, and data processing were done independently. Further enhancements of the modeling capabilities are planned in the future.
Project Approach and Phases The simulation of offshore wind turbines under combined stochastic aerodynamic and hydrodynamic loading is very complex. The benchmarking task, therefore, requires a sophisticated approach that facilitates the identification of sources of modeling discrepancies introduced by differing theories and model implementations in the various codes. This is possible only by (1) meticulously controlling all of the inputs to the codes and (2) carefully applying a stepwise verification procedure where model complexity is increased in each step. The fundamental set of inputs to the codes controlled within OC3 relates to the specifications of the wind turbine. The OC3 project uses the publicly available specifications of the 5-MW baseline wind turbine developed by NREL, which is a representative utility-scale multi-megawatt
3
turbine. This conventional three-bladed upwind variable-speed variable-blade-pitch-to-feather controlled turbine, is specified with detailed rotor aerodynamic properties; blade, drivetrain, nacelle, and tower structural properties; and generator-torque and blade-pitch control system properties, the latter of which was provided to all OC3 participants in the form of a dynamic link library (DLL). The specifications of the NREL offshore 5-MW baseline wind turbine are available in detail [2]. The hydrodynamic and elastic properties of the varying offshore support structures used in the project are also controlled. Furthermore, the turbulent full-field wind inflow and regular and irregular wave kinematics are model inputs controlled within OC3. Risø-DTU generated the turbulent wind velocity datasets and GH and NREL (for different phases of the project) generated the wave kinematics datasets; these datasets were then provided to all other participants.
This approach eliminates any possible differences brought about by dissimilar turbulence models, wave theories, or stochastic realizations. An important part of the comparison is a stepwise process that allows the origin of differences between code predictions to be discovered. Various combinations of wave and wind input were introduced with the rotor and tower being rigid or flexible, disentangling the contributions from wind and wave applied loads and dynamic response. Finally, the turbine was made operational so that the effect of the control system could be evaluated. Emphasis within OC3 is given to the verification of the offshore support structure dynamics as part of the dynamics of the complete system. This emphasis is a feature that distinguishes OC3 from previous wind turbine code-to-code verification exercises. To encompass the variety of support structures required for
FAST Bladed ADAMS HAWC2 3Dfloat Simo SESAM / DeepC
FEM Airy+ – Airy wave theory +) with free surface corrections BEM – blade-element / momentum DLL – external dynamic link library DNV – Det Norsk Veritas DS – dynamic stall
GDW – generalized dynamic wake FEMP – finite-element method P) for mode preprocessing only MBS – multibody-dynamics formulation ME – Morison’s equation MSC – MSC Software Corporation
PF – linear potential flow with radiation & diffraction
QSCE – quasi-static catenary equations SM – interface to Simulink® with MATLAB® UD – implementation through user-defined
subroutine available UDFD – implementation through user-defined force-
displacement relationships
Table 1: Overview of aero-hydro-servo-elastic modeling capabilities
4
cost effectiveness at varying offshore sites, different support structures (for the same wind turbine) are investigated in separate phases of OC3: • In Phase I, the NREL offshore 5-MW
wind turbine is installed on a monopile with a rigid foundation in 20 m of water.
• In Phase II, the foundation of the monopile from Phase I is made flexible by applying different models to represent the soil-pile interactions.
• In Phase III, the water depth is changed to 45 m and the monopile is swapped with a tripod substructure, which is one of the common space-frame concepts proposed for offshore installations in water of intermediate depth.
• In Phase IV, the wind turbine is installed on a floating spar buoy in deep water (320 m).
The OC3 project started in fall of 2004 and ended in the winter of 2009. A follow up project to OC3 is being initiated in 2010 through the IEA so that two more phases can be considered, including the analysis of a fixed-bottom jacket and a floating semi-submersible. A description of Phases I, II, and III and their results are presented in detail in [3], [4], and [5], respectively. This paper describes Phase IV and discusses its results.
Review of Results from Earlier Phases Before discussing Phase IV, it is prudent to summarize the key findings from Phases I through III because many of the results have followed through into subsequent phases. The code-to-code comparisons in Phases I through III have agreed very well, in general. The key reasons for the differences that have
remained and the other findings from Phases I through III are discussed below [3, 4, 5].
Phase I – Monopile with Rigid Foundation • The modal-based codes predict slightly
different second and higher coupled eigenmodes than what are predicted by the higher fidelity MBS- and FEM-based codes. This is because the higher eigenmodes in higher-fidelity codes include system couplings that are not accounted for in the lower fidelity modal-based codes. Differences in the dynamic response and energy content, therefore, appear in the higher frequency range.
• The codes that rely on full-field wind available in polar coordinates predict smoother aerodynamic loads (and thus smaller load deviations and smaller damage equivalent loads (DELs)) than codes that rely on rectangular coordinates. This results from the method in which the wind datasets were generated. To ensure that all participants used the same wind inflow, the full-field wind datasets were generated in rectangular coordinates and subsequently interpolated to polar coordinates for the codes that needed it. These differences were mitigated as much as possible by using a fine spatial resolution (32 × 32 points across the rotor disk).
• The differences among the codes relating to the implementation of aerodynamic induction, tower interference, hub and tip loss, and dynamic stall models—and whether or not the aerodynamic loads are applied in the deflected or undeflected blade state—attribute to variations in the mean values of several key wind turbine
5
loads (e.g., blade-root bending moments, rotor torque, and rotor thrust).
• The blade-pitch controller compensates somewhat for variations that might have been caused between codes that do and do not have blade-twist degrees of freedom (DOFs).
• Differing model discretizations for the aerodynamic and hydrodynamic loads lead to differences among the code predictions. This is most apparent in the substructure loads that depend highly on the discretization of hydrodynamic loads near the free surface, such as the bending moments in the pile at the mudline.
• Though every effort has been made to standardize model inputs, user error still occurs. It often takes several revisions before the model is developed and run as intended. It is also possible, in some instances, that errors still remain and account for otherwise inexplicable modeling differences.
Phase II – Monopile with Flexible Foundation • All of the results of Phase I also apply to
the results of Phase II. • All three of the simplified foundation
models—apparent fixity, coupled springs, and distributed springs—can be derived and implemented to ensure that the overall response of the system above the mudline is identical under a given set of loading conditions (at least for the lowest system eigenmodes).
• The descretization problems described for the results of Phase I result in higher excitation in the second eigenmodes of the support structure in Phase II. However, this higher excitation is only visible when the turbine is not operating, because aerodynamic loading tends to
limit the amount of additional excitation (i.e., aerodynamic loading tends to damp out the excitation).
• The differing implementations of the aerodynamic models among the codes have more effect on the mean values of the wind turbine loads than on the power spectra.
Phase III – Tripod • All of the results of Phase I also apply to
the results of Phase III. (The results of Phase II have less bearing on Phase III because Phase III does not use foundation models).
• The most straightforward way to account for buoyancy loads in non-flooded multi-member structures is through direct integration of the hydrostatic pressure that is dependent on the time-varying wave elevation (as opposed to accounting for buoyancy as a displaced volume with corrections for end effects). This is important for non-flooded members that are inclined, tapered, and/or embedded into the seabed (i.e., non-flooded piles). The OC3 code comparisons differed until everyone agreed on this approach.
• The most straightforward way to model a rigid multi-member structure is to increase the Modulus of Elasticity by several orders of magnitude consistently across all members. This permits calculation of how the loads are transmitted through what is a statically indeterminate structure (because of the geometry of the tripod) in the limit of zero deflection. The OC3 code comparisons differed for those load cases that considered a rigid tripod until everyone agreed on this approach.
6
• Differing discretizations for the hydrodynamic and buoyancy loads along tapered members lead to differences among the code predictions. To eliminate the discrepancy, the hydrodynamic and buoyancy loads along tapered members must be finely discretized. Because the hydrodynamic inertia and buoyancy loads depend on the square of the member diameter, having too long a length between nodes can cause a large error in the total load.
• Because of the large diameter members of the tripod, significant surface areas and volumes are duplicated at the joints, which distorts the overall level of loading if the intersection is not accounted for in the mass, stiffness, hydrodynamic loading, and buoyancy loading. This was found to have a large effect on the overall loading and response of the tripod.
• The local shear deflection of the members in a multi-member support structure, which can be modeled with Timoshenko beam elements, was found to have a large effect on the distribution of loads through multi-member structures. This was a surprising finding because all of the beam members of the tripod analyzed in OC3 were thin and slender, such that the Bernoulli-Euler approach, which neglects shear deflection, was thought to be sufficient (and is sufficient in blades, towers, and monopiles). The shear effect was found to be much more important than originally assumed because the beam members are attached rigidly to other members and the relative displacement of each member influences the load distribution. The results of the code comparisons could clearly be grouped between the codes that do and do not
have beam elements with shear deflection models.
• The initial transient solution takes a long time to dissipate due to the small amount of damping in the tripod and the method by which the hydrodynamic loads are initialized at the start of a simulation. The initial transient is longer when the turbine is not operating, because aerodynamic loading tends to damp out the initial solution quickly. Each model initializes its solution differently, so, the code comparisons differed during the start-up transient period.
Overview of Phase IV Numerous floating platform concepts are possible for offshore wind turbines, including spar-buoys, tension leg platforms (TLPs), barges, and hybrid concepts. In OC3 Phase IV, the spar-buoy concept called “Hywind,” developed by Statoil of Norway, was imitated. This concept was chosen for its simplicity in design, suitability to modeling, and the existence of a full-scale prototype. Statoil graciously supplied detailed platform and mooring system data for the conceptual version of the Hywind platform that was developed to support a 5-MW wind turbine, as analyzed in [6, 7, 8]. Per the request of Statoil, the original data was condensed and sanitized to make it suitable for public dissemination. Aspects of the original data were also adapted slightly so that the platform design appropriately supports the NREL 5-MW baseline turbine, which has slightly different properties than the turbine Statoil used to develop their system. The rotor-nacelle assembly of the NREL 5-MW turbine—including the aerodynamic and structural properties—remains the same as in Ref. [2], but the support structure (tower
7
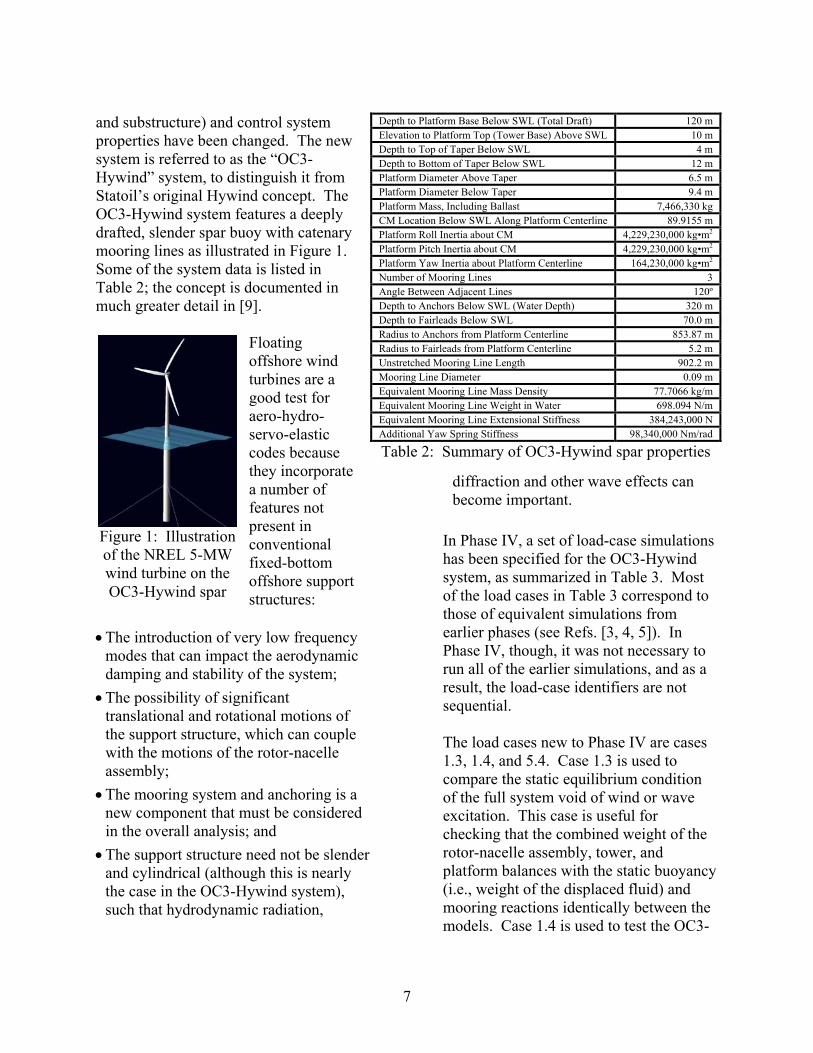
and substructure) and control system properties have been changed. The new system is referred to as the “OC3-Hywind” system, to distinguish it from Statoil’s original Hywind concept. The OC3-Hywind system features a deeply drafted, slender spar buoy with catenary mooring lines as illustrated in Figure 1. Some of the system data is listed in Table 2; the concept is documented in much greater detail in [9].
Floating offshore wind turbines are a good test for aero-hydro-servo-elastic codes because they incorporate a number of features not present in conventional fixed-bottom offshore support structures:
• The introduction of very low frequency modes that can impact the aerodynamic damping and stability of the system;
• The possibility of significant translational and rotational motions of the support structure, which can couple with the motions of the rotor-nacelle assembly;
• The mooring system and anchoring is a new component that must be considered in the overall analysis; and
• The support structure need not be slender and cylindrical (although this is nearly the case in the OC3-Hywind system), such that hydrodynamic radiation,
diffraction and other wave effects can become important.
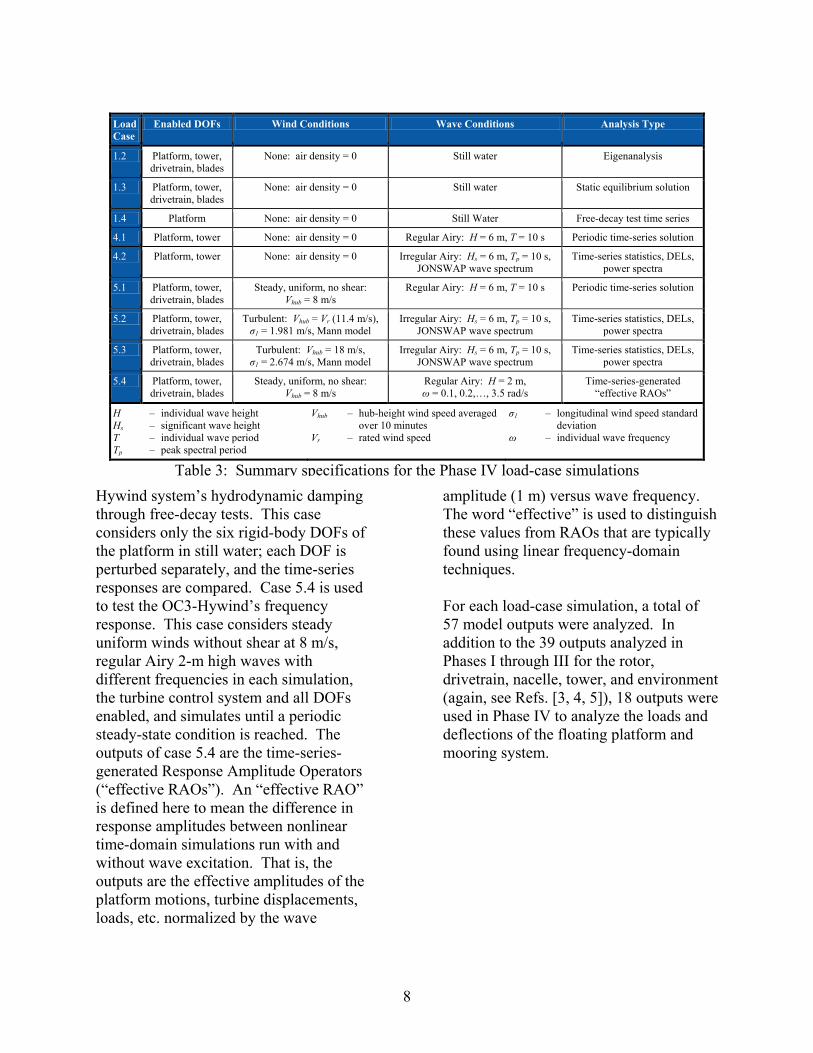
In Phase IV, a set of load-case simulations has been specified for the OC3-Hywind system, as summarized in Table 3. Most of the load cases in Table 3 correspond to those of equivalent simulations from earlier phases (see Refs. [3, 4, 5]). In Phase IV, though, it was not necessary to run all of the earlier simulations, and as a result, the load-case identifiers are not sequential. The load cases new to Phase IV are cases 1.3, 1.4, and 5.4. Case 1.3 is used to compare the static equilibrium condition of the full system void of wind or wave excitation. This case is useful for checking that the combined weight of the rotor-nacelle assembly, tower, and platform balances with the static buoyancy (i.e., weight of the displaced fluid) and mooring reactions identically between the models. Case 1.4 is used to test the OC3-
Figure 1: Illustration of the NREL 5-MW wind turbine on the OC3-Hywind spar
Depth to Platform Base Below SWL (Total Draft) 120 m Elevation to Platform Top (Tower Base) Above SWL 10 m Depth to Top of Taper Below SWL 4 m Depth to Bottom of Taper Below SWL 12 m Platform Diameter Above Taper 6.5 m Platform Diameter Below Taper 9.4 m Platform Mass, Including Ballast 7,466,330 kg CM Location Below SWL Along Platform Centerline 89.9155 m Platform Roll Inertia about CM 4,229,230,000 kg•m2 Platform Pitch Inertia about CM 4,229,230,000 kg•m2 Platform Yaw Inertia about Platform Centerline 164,230,000 kg•m2 Number of Mooring Lines 3 Angle Between Adjacent Lines 120º Depth to Anchors Below SWL (Water Depth) 320 m Depth to Fairleads Below SWL 70.0 m Radius to Anchors from Platform Centerline 853.87 m Radius to Fairleads from Platform Centerline 5.2 m Unstretched Mooring Line Length 902.2 m Mooring Line Diameter 0.09 m Equivalent Mooring Line Mass Density 77.7066 kg/m Equivalent Mooring Line Weight in Water 698.094 N/m Equivalent Mooring Line Extensional Stiffness 384,243,000 N Additional Yaw Spring Stiffness 98,340,000 Nm/rad
Table 2: Summary of OC3-Hywind spar properties
8
Hywind system’s hydrodynamic damping through free-decay tests. This case considers only the six rigid-body DOFs of the platform in still water; each DOF is perturbed separately, and the time-series responses are compared. Case 5.4 is used to test the OC3-Hywind’s frequency response. This case considers steady uniform winds without shear at 8 m/s, regular Airy 2-m high waves with different frequencies in each simulation, the turbine control system and all DOFs enabled, and simulates until a periodic steady-state condition is reached. The outputs of case 5.4 are the time-series-generated Response Amplitude Operators (“effective RAOs”). An “effective RAO” is defined here to mean the difference in response amplitudes between nonlinear time-domain simulations run with and without wave excitation. That is, the outputs are the effective amplitudes of the platform motions, turbine displacements, loads, etc. normalized by the wave
amplitude (1 m) versus wave frequency. The word “effective” is used to distinguish these values from RAOs that are typically found using linear frequency-domain techniques. For each load-case simulation, a total of 57 model outputs were analyzed. In addition to the 39 outputs analyzed in Phases I through III for the rotor, drivetrain, nacelle, tower, and environment (again, see Refs. [3, 4, 5]), 18 outputs were used in Phase IV to analyze the loads and deflections of the floating platform and mooring system.
Load Case
Enabled DOFs Wind Conditions Wave Conditions Analysis Type
1.2 Platform, tower, drivetrain, blades
None: air density = 0 Still water Eigenanalysis
1.3 Platform, tower, drivetrain, blades
None: air density = 0 Still water Static equilibrium solution
1.4 Platform None: air density = 0 Still Water Free-decay test time series
4.1 Platform, tower None: air density = 0 Regular Airy: H = 6 m, T = 10 s Periodic time-series solution
4.2 Platform, tower None: air density = 0 Irregular Airy: Hs = 6 m, Tp = 10 s, JONSWAP wave spectrum
Time-series statistics, DELs, power spectra
5.1 Platform, tower, drivetrain, blades
Steady, uniform, no shear: Vhub = 8 m/s
Regular Airy: H = 6 m, T = 10 s Periodic time-series solution
5.2 Platform, tower, drivetrain, blades
Turbulent: Vhub = Vr (11.4 m/s), σ1 = 1.981 m/s, Mann model
H – individual wave height Hs – significant wave height T – individual wave period Tp – peak spectral period
Vhub – hub-height wind speed averaged over 10 minutes
Vr – rated wind speed
σ1 – longitudinal wind speed standard deviation
ω – individual wave frequency
Table 3: Summary specifications for the Phase IV load-case simulations
9
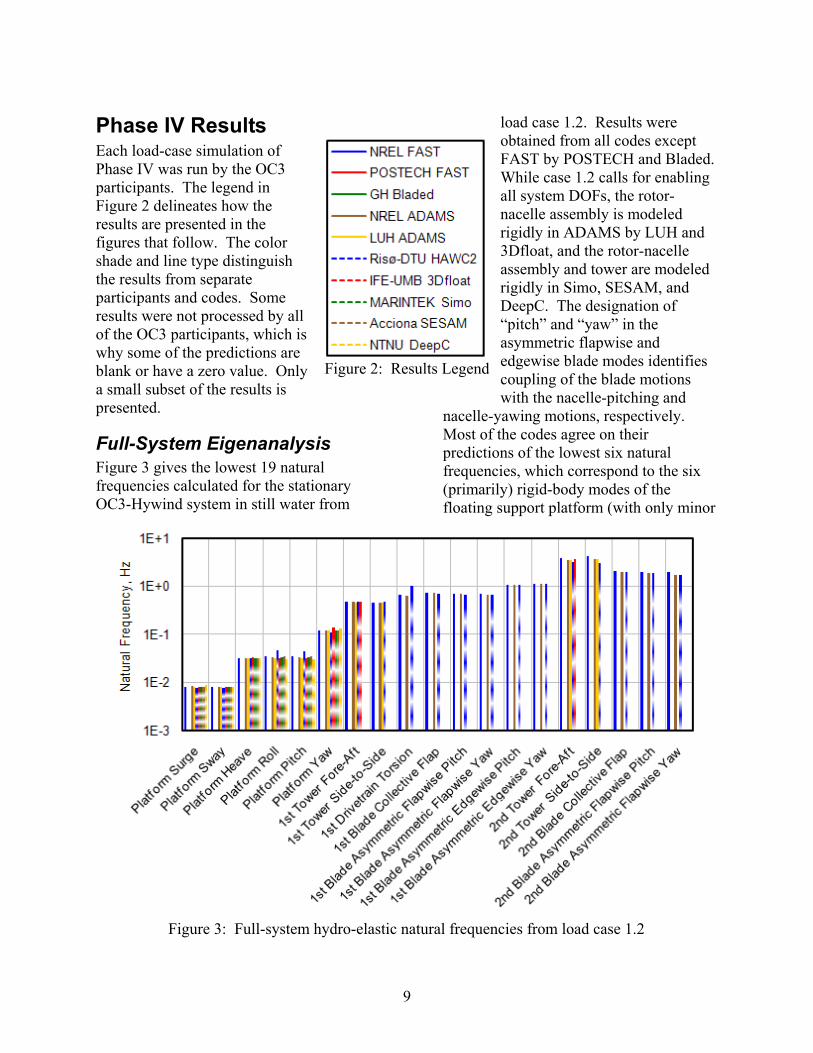
Phase IV Results Each load-case simulation of Phase IV was run by the OC3 participants. The legend in Figure 2 delineates how the results are presented in the figures that follow. The color shade and line type distinguish the results from separate participants and codes. Some results were not processed by all of the OC3 participants, which is why some of the predictions are blank or have a zero value. Only a small subset of the results is presented.
Full-System Eigenanalysis Figure 3 gives the lowest 19 natural frequencies calculated for the stationary OC3-Hywind system in still water from
load case 1.2. Results were obtained from all codes except FAST by POSTECH and Bladed. While case 1.2 calls for enabling all system DOFs, the rotor-nacelle assembly is modeled rigidly in ADAMS by LUH and 3Dfloat, and the rotor-nacelle assembly and tower are modeled rigidly in Simo, SESAM, and DeepC. The designation of “pitch” and “yaw” in the asymmetric flapwise and edgewise blade modes identifies coupling of the blade motions with the nacelle-pitching and
nacelle-yawing motions, respectively. Most of the codes agree on their predictions of the lowest six natural frequencies, which correspond to the six (primarily) rigid-body modes of the floating support platform (with only minor
Figure 2: Results Legend
Figure 3: Full-system hydro-elastic natural frequencies from load case 1.2
10
couplings to the turbine flexibilities). The platform roll and pitch natural frequencies are predicted higher by Risø-DTU with the HAWC2 code. While these differences are still being investigated, one thought is that they are caused by the treatment of gravity in the model linearization process, as gravity has a strong influence on the roll and pitch restoring of a deep-drafted spar. Not all of the codes predict the natural frequencies of the flexible body modes. The codes that model the tower and blade bending and drivetrain torsion modes predict similar natural frequencies, with only slight discrepancies. The discrepancy in the second blade asymmetric flapwise yaw frequency has been seen in earlier phases of OC3, particularly Phase II [4]. In this mode, the vertically positioned blade remains stationary, while the two other blades flap out of phase with each other. These blade motions couple with the torsion of the tower and—in Phase IV—the yaw of the platform (both being rotations about the tower centerline). The codes which do not account for tower torsion (FAST) predict higher natural frequencies—corresponding to the stiffer compliance about the tower centerline—than the codes that do (ADAMS, HAWC2).
Free Decay Figure 4 through Figure 6 give the platform surge, heave, and pitch time series from perturbations in platform surge, heave, and pitch, respectively, from the free-decay tests of load case 1.4.
Results were obtained from all codes except Bladed and DeepC. For the surge free-decay test of Figure 4, all codes except FAST by POSTECH agree on the surge displacement. Both NREL and POSTECH used FAST and their results compare well, except that there is less hydrodynamic damping in POSTECH’s results. This is caused by POSTECH’s FAST model missing one hydrodynamic damping term (the so-called “additional linear damping” specified for the OC3-Hywind spar). When comparing the heave-surge coupling between the codes, 3Dfloat predicts less coupling, HAWC2 predicts more damping, and FAST by POSTECH predict less damping. The pitch-surge coupling can be placed into two groups—FAST by POSTECH and ADAMS by LUH in one, and FAST and ADAMS by NREL, HAWC2, 3Dfloat, and SESAM in another. The pitch offset results from the overhanging mass of the rotor-nacelle assembly from the centerline of the tower and platform. For the heave and pitch-heave coupling responses in the heave free-decay test of Figure 5, all codes agree well except SESAM, which predicts no coupling to pitch, and HAWC2, which has too much heave and pitch damping. All codes agree on the platform-pitch response in the pitch free-decay test of Figure 6, except ADAMS by LUH, which predicts too little damping. HAWC2 predicts different surge-pitch and heave-pitch couplings than the other codes.
11
Figure 7 gives the platform-yaw response from the yaw free-decay test of load case 1.4. All codes agree very well.
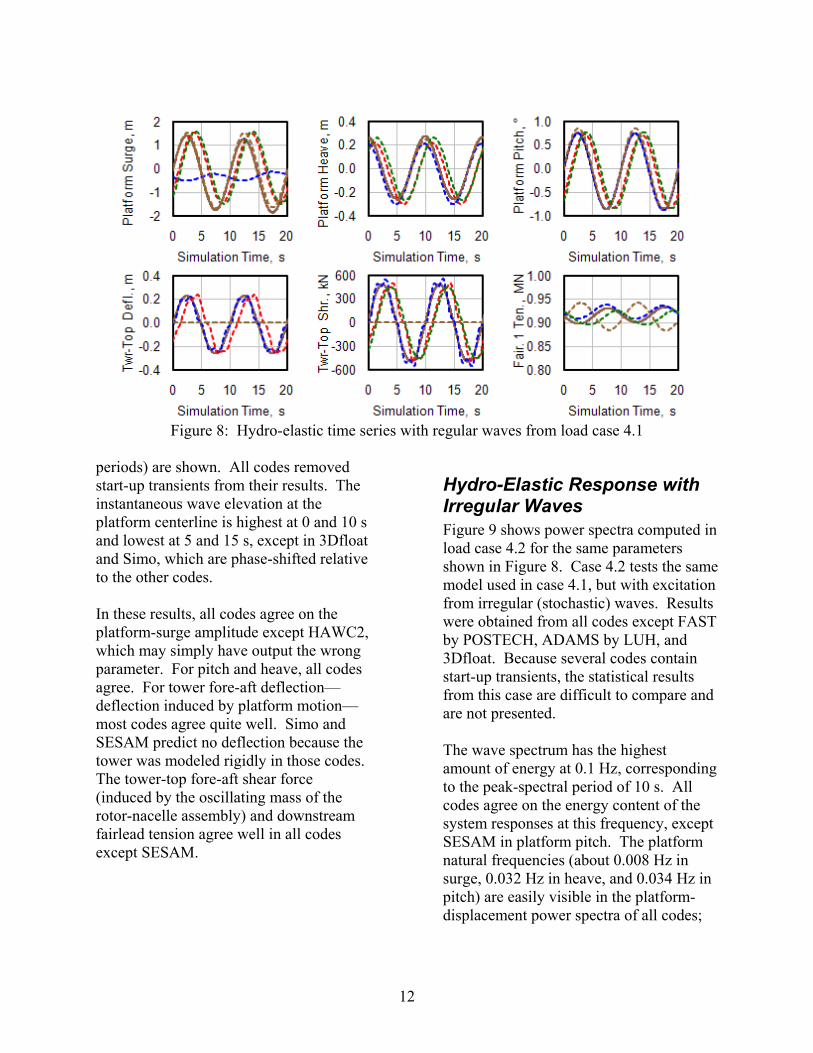
Hydro-Elastic Response with Regular Waves Figure 8 shows time histories of platform surge, heave, and pitch displacements; tower-top fore-aft deflection and shear force; and downstream fairlead tension (from
mooring line #1) from load case 4.1. This case considers the response of the platform and flexible tower (with rigid rotor-nacelle-assembly) excited by regular (i.e., periodic) waves. Results were obtained from NREL with FAST and ADAMS, Risø-DTU with HAWC2, IFE-UMB with 3Dfloat, MARINTEK with
Simo, and Acciona with SESAM. The responses for two wave passages (i.e.,
Figure 4: Free decay in platform surge from load case 1.4
Figure 5: Free decay in platform heave from load case 1.4
Figure 6: Free decay in platform pitch from load case 1.4
Figure 7: Free decay in
platform yaw from case 1.4
12
periods) are shown. All codes removed start-up transients from their results. The instantaneous wave elevation at the platform centerline is highest at 0 and 10 s and lowest at 5 and 15 s, except in 3Dfloat and Simo, which are phase-shifted relative to the other codes. In these results, all codes agree on the platform-surge amplitude except HAWC2, which may simply have output the wrong parameter. For pitch and heave, all codes agree. For tower fore-aft deflection—deflection induced by platform motion—most codes agree quite well. Simo and SESAM predict no deflection because the tower was modeled rigidly in those codes. The tower-top fore-aft shear force (induced by the oscillating mass of the rotor-nacelle assembly) and downstream fairlead tension agree well in all codes except SESAM.
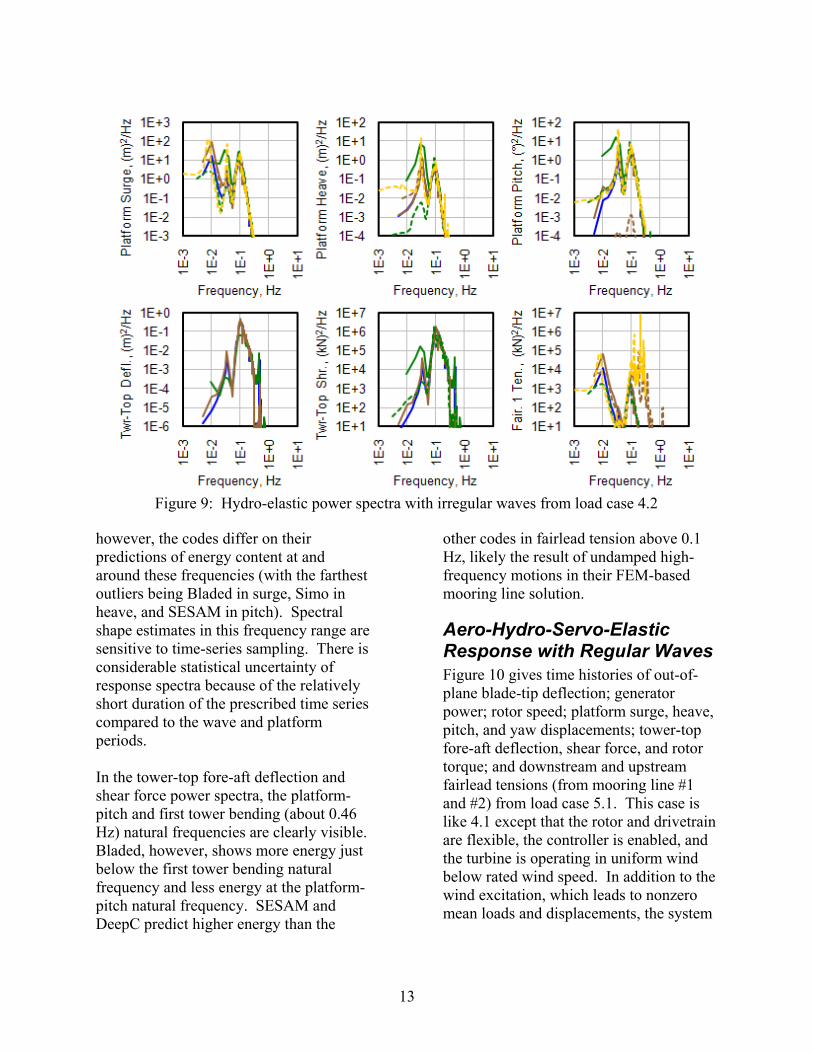
Hydro-Elastic Response with Irregular Waves Figure 9 shows power spectra computed in load case 4.2 for the same parameters shown in Figure 8. Case 4.2 tests the same model used in case 4.1, but with excitation from irregular (stochastic) waves. Results were obtained from all codes except FAST by POSTECH, ADAMS by LUH, and 3Dfloat. Because several codes contain start-up transients, the statistical results from this case are difficult to compare and are not presented. The wave spectrum has the highest amount of energy at 0.1 Hz, corresponding to the peak-spectral period of 10 s. All codes agree on the energy content of the system responses at this frequency, except SESAM in platform pitch. The platform natural frequencies (about 0.008 Hz in surge, 0.032 Hz in heave, and 0.034 Hz in pitch) are easily visible in the platform-displacement power spectra of all codes;
Figure 8: Hydro-elastic time series with regular waves from load case 4.1
13
however, the codes differ on their predictions of energy content at and around these frequencies (with the farthest outliers being Bladed in surge, Simo in heave, and SESAM in pitch). Spectral shape estimates in this frequency range are sensitive to time-series sampling. There is considerable statistical uncertainty of response spectra because of the relatively short duration of the prescribed time series compared to the wave and platform periods. In the tower-top fore-aft deflection and shear force power spectra, the platform-pitch and first tower bending (about 0.46 Hz) natural frequencies are clearly visible. Bladed, however, shows more energy just below the first tower bending natural frequency and less energy at the platform-pitch natural frequency. SESAM and DeepC predict higher energy than the
other codes in fairlead tension above 0.1 Hz, likely the result of undamped high-frequency motions in their FEM-based mooring line solution.
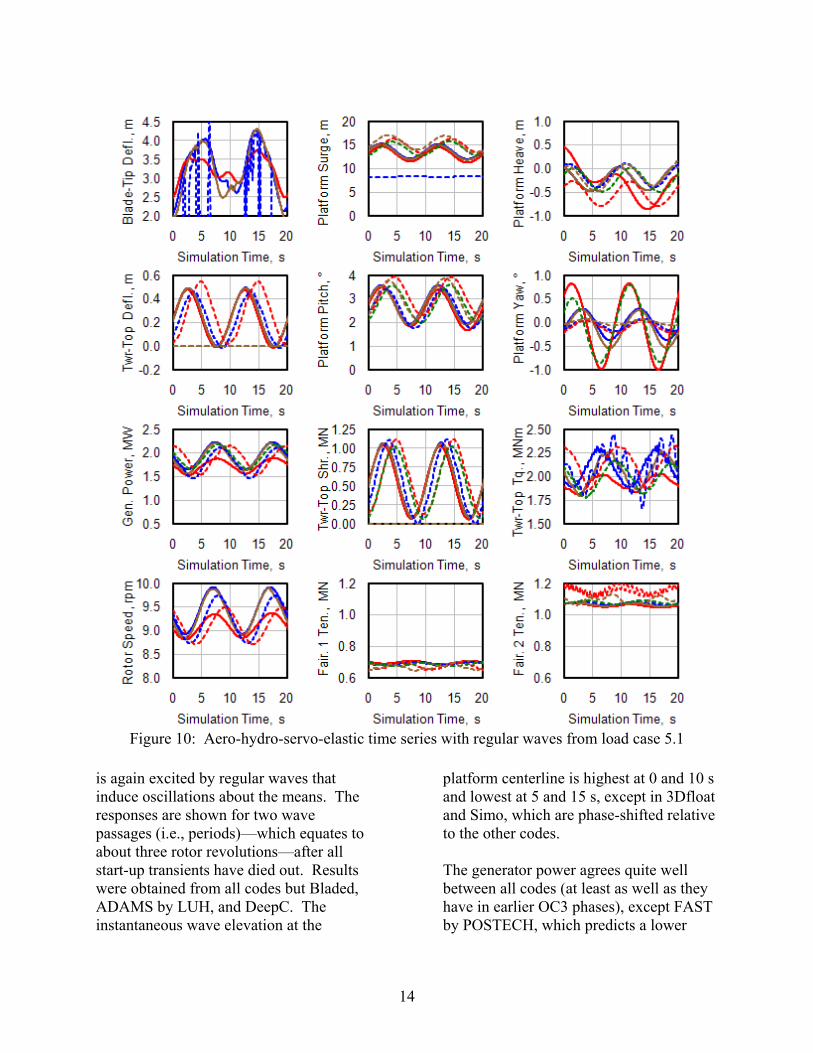
Aero-Hydro-Servo-Elastic Response with Regular Waves Figure 10 gives time histories of out-of-plane blade-tip deflection; generator power; rotor speed; platform surge, heave, pitch, and yaw displacements; tower-top fore-aft deflection, shear force, and rotor torque; and downstream and upstream fairlead tensions (from mooring line #1 and #2) from load case 5.1. This case is like 4.1 except that the rotor and drivetrain are flexible, the controller is enabled, and the turbine is operating in uniform wind below rated wind speed. In addition to the wind excitation, which leads to nonzero mean loads and displacements, the system
Figure 9: Hydro-elastic power spectra with irregular waves from load case 4.2
14
is again excited by regular waves that induce oscillations about the means. The responses are shown for two wave passages (i.e., periods)—which equates to about three rotor revolutions—after all start-up transients have died out. Results were obtained from all codes but Bladed, ADAMS by LUH, and DeepC. The instantaneous wave elevation at the
platform centerline is highest at 0 and 10 s and lowest at 5 and 15 s, except in 3Dfloat and Simo, which are phase-shifted relative to the other codes. The generator power agrees quite well between all codes (at least as well as they have in earlier OC3 phases), except FAST by POSTECH, which predicts a lower
Figure 10: Aero-hydro-servo-elastic time series with regular waves from load case 5.1
15
mean and amplitude. Likewise, all codes agree well in rotor speed, except FAST by POSTECH and 3Dfloat, which predict lower means and amplitudes. The out-of-plane blade-tip deflection agrees reasonably well between all codes except FAST by POSTECH, which has less overall oscillation, and HAWC2, which may simply have output the wrong parameter. 3Dfloat, Simo, and SESAM predict no deflection because their rotors were modeled rigidly. Except for FAST by POSTECH, all codes predict a similar mean value of the tower-top rotor torque (i.e., roll moment), but the oscillations about this mean vary. FAST by POSTECH predicts a lower mean and oscillation amplitude. All codes agree on the tower-top fore-aft shear (thrust) force, but 3Dfloat results in a larger tower-top deflection. Simo and SESAM predict no deflection because the tower was modeled rigidly in those codes. For the platform-surge displacement, all codes but HAWC2 agree on the amplitude of oscillation, but the mean values vary despite the agreement on thrust—Simo, 3Dfloat, and SESAM are a bit higher and HAWC2 is very low (HAWC2 also has less amplitude). The results are similar for platform-pitch displacement, except that HAWC2 matches the majority of codes much better. The nonzero means in these displacements are the result of the nonzero mean rotor thrust. The higher amount of platform-surge and -pitch displacements in 3Dfloat results from the slightly higher mean thrust.
The rotor thrust is counteracted by tensions in the mooring lines, with the downstream mooring line less loaded than the upstream lines. The variations in the fairlead tensions are fairly consistent with the variations in platform displacement. That is, the downstream fairlead has a lower tension and the upstream fairleads have higher tension in 3Dfloat and SESAM than in the other codes. The differing platform-heave displacements imply that the codes differ in how they couple heave with surge and pitch. The slightly negative mean platform-yaw displacement—predicted similarly by most codes—results from the rotor-shaft tilt, which causes some of the rotor torque to act about the yaw axis. The oscillation about this mean—resulting from a gyroscopic moment produced by platform pitching (at the wave period) in combination with spinning rotor inertia—varies a bit between the codes.
Aero-Hydro-Servo-Elastic Response with Irregular Waves Figure 11 shows power spectra computed in load case 5.3 for the same parameters shown in Figure 10. Case 5.3 tests the same model used in case 5.1, but with excitation from stochastic wind above rated wind speed and irregular (stochastic) waves. Results were obtained from NREL and POSTECH with FAST, GH with Bladed, NREL with ADAMS, MARINTEK with Simo, and Acciona with SESAM.
16
Figure 11: Aero-hydro-servo-elastic power spectra with irregular waves from load case 5.3
17
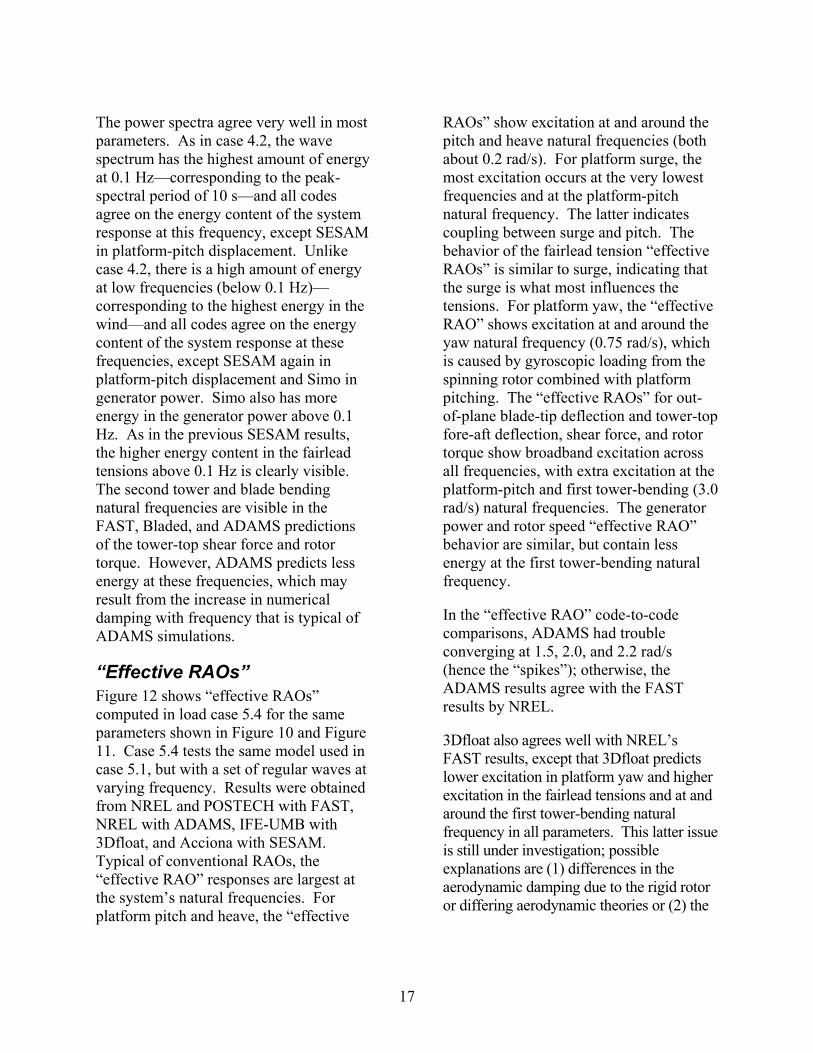
The power spectra agree very well in most parameters. As in case 4.2, the wave spectrum has the highest amount of energy at 0.1 Hz—corresponding to the peak-spectral period of 10 s—and all codes agree on the energy content of the system response at this frequency, except SESAM in platform-pitch displacement. Unlike case 4.2, there is a high amount of energy at low frequencies (below 0.1 Hz)—corresponding to the highest energy in the wind—and all codes agree on the energy content of the system response at these frequencies, except SESAM again in platform-pitch displacement and Simo in generator power. Simo also has more energy in the generator power above 0.1 Hz. As in the previous SESAM results, the higher energy content in the fairlead tensions above 0.1 Hz is clearly visible. The second tower and blade bending natural frequencies are visible in the FAST, Bladed, and ADAMS predictions of the tower-top shear force and rotor torque. However, ADAMS predicts less energy at these frequencies, which may result from the increase in numerical damping with frequency that is typical of ADAMS simulations.
“Effective RAOs” Figure 12 shows “effective RAOs” computed in load case 5.4 for the same parameters shown in Figure 10 and Figure 11. Case 5.4 tests the same model used in case 5.1, but with a set of regular waves at varying frequency. Results were obtained from NREL and POSTECH with FAST, NREL with ADAMS, IFE-UMB with 3Dfloat, and Acciona with SESAM. Typical of conventional RAOs, the “effective RAO” responses are largest at the system’s natural frequencies. For platform pitch and heave, the “effective
RAOs” show excitation at and around the pitch and heave natural frequencies (both about 0.2 rad/s). For platform surge, the most excitation occurs at the very lowest frequencies and at the platform-pitch natural frequency. The latter indicates coupling between surge and pitch. The behavior of the fairlead tension “effective RAOs” is similar to surge, indicating that the surge is what most influences the tensions. For platform yaw, the “effective RAO” shows excitation at and around the yaw natural frequency (0.75 rad/s), which is caused by gyroscopic loading from the spinning rotor combined with platform pitching. The “effective RAOs” for out-of-plane blade-tip deflection and tower-top fore-aft deflection, shear force, and rotor torque show broadband excitation across all frequencies, with extra excitation at the platform-pitch and first tower-bending (3.0 rad/s) natural frequencies. The generator power and rotor speed “effective RAO” behavior are similar, but contain less energy at the first tower-bending natural frequency. In the “effective RAO” code-to-code comparisons, ADAMS had trouble converging at 1.5, 2.0, and 2.2 rad/s (hence the “spikes”); otherwise, the ADAMS results agree with the FAST results by NREL. 3Dfloat also agrees well with NREL’s FAST results, except that 3Dfloat predicts lower excitation in platform yaw and higher excitation in the fairlead tensions and at and around the first tower-bending natural frequency in all parameters. This latter issue is still under investigation; possible explanations are (1) differences in the aerodynamic damping due to the rigid rotor or differing aerodynamic theories or (2) the
18
modeling of the rigid spar with an artificially high stiffness in 3Dfloat.
SESAM predicts higher excitation in the platform-surge and -pitch displacements and fairlead tensions. The latter are
Figure 12: Aero-hydro-servo-elastic “effective RAOs” with regular waves from case 5.4
19
attributed to a lack of convergence in SESAM’s FEM-based mooring line solution. SESAM also predicts lower excitation in platform yaw than does FAST and ADAMS. The “effective RAOs” from FAST by POSTECH differ with those from FAST by NREL over several parameters, including out-of-plane blade-tip deflection; generator power; rotor speed; platform-surge, -heave, and –pitch displacements; and fairlead tensions. The differences in platform displacements and the resulting differences in the fairlead tensions are caused by the lesser amount of hydrodynamic damping in POSTECH’s FAST model, as described earlier. Interestingly, this drop in damping leads to surge displacement and resulting fairlead tensions with negative “effective RAOs,” which means that there is less system motion with waves than in still water. The reason for negative “effective RAOs” is as follows. In simulations with wave excitation, the wave-induced motions occur at the wave-excitation frequency, which brings about (potential-flow-based) wave-radiation damping. The wave-radiation damping in surge is not negligible above 0.2 rad/s (see [9]). In still water, the wave frequency is eliminated from the excitation/response, thereby eliminating the wave-radiation damping, which leads to a minor controller-induced instability of the platform-surge mode. Because of the system’s nonlinearities, this instability leads to a limit-cycle oscillation of the platform-surge mode at the surge natural frequency (where there is negligible hydrodynamic damping) when operating in still water. The wave-radiation damping resulting from wave excitation
reduces or eliminates the platform-surge instability (depending on the wave-excitation frequency) and resulting limit-cycle oscillations, thereby reducing the overall motions considerably. The controller-induced instability and resulting limit-cycle oscillations in still water are largest at rated wind speed and are present in the system even with the proper amount of hydrodynamic damping. Due to the strong influence of the (potential-flow-based) wave-radiation damping in these results, it is noted that neglecting this damping will likely lead to vastly different “effective RAOs” at and around rated wind speed.
Conclusions Offshore wind turbines are designed and analyzed using comprehensive simulation codes that model the systems’ coupled dynamic aero-hydro-servo-elastic response. The OC3 project, which operates under Subtask 2 of the IEA Wind Task 23, has performed work to verify the codes to assess their accuracy and correctness. In Phase IV of OC3, participants used an assortment of codes to model the coupled dynamic response of the NREL 5-MW wind turbine installed on a deeply drafted, slender spar buoy with catenary mooring lines in 320 m of water. Code predictions were compared from load-case simulations selected to test different model features. The comparisons have resulted in a greater understanding of offshore floating wind turbine dynamics and modeling techniques, and better knowledge of the validity of various approximations.
20
The verification activities performed in OC3 are important because the advancement of the offshore wind industry is closely tied to the development and accuracy of dynamic models. Not only have vital experiences and knowledge been exchanged among the project participants, but the lessons learned have helped identify deficiencies in existing codes and needed improvements, which will be used to improve the accuracy of future predictions.
References [1].Passon P and Kühn M. “State-of-the-art and Development Needs of Simulation Codes for Offshore Wind Turbines.” Copenhagen Offshore Wind 2005 Conference and Expedition, 26–28 October, Copenhagen, 2005. (CD-ROM) [2].Jonkman J, Butterfield S, Musial W, and Scott G. Definition of a 5-MW Reference Wind Turbine for Offshore System Development. NREL/TP-500-38060. NREL: Golden, CO, 2009. [3].Passon P, Kühn M, Butterfield S, Jonkman J, Camp T, and Larsen TJ. “OC3—Benchmark Exercise of Aero-Elastic Offshore Wind Turbine Codes.” The Second Conference on The Science of Making Torque From Wind, 28–31 August, Copenhagen, 2007. [Online]. Available: http://iopscience.iop.org/1742-6596/75/1/012071/pdf?ejredirect=.iopscience. [4].Jonkman J, et al. “Offshore Code Comparison Collaboration within IEA Wind Annex XXIII: Phase II Results Regarding Monopile Foundation Modeling.” 2007 European Offshore Wind Conference & Exhibition, 4–6 December,
Berlin, 2007. [Online]. Available: http://www.eow2007 proceedings.info/allfiles2/206_Eow2007 fullpaper.pdf. [5].Nichols J, et al. “Offshore Code Comparison Collaboration within IEA Wind Annex XXIII: Phase III Results Regarding Tripod Support Structure Modeling.” 47th AIAA Aerospace Sciences Meeting Including The New Horizons Forum and Aerospace Exhibition, 5–8 January, Orlando, FL, 2008. (DVD-ROM) [6].Nielsen FG, Hanson TD, and Skaare B. “Integrated Dynamic Analysis of Floating Offshore Wind Turbines.” 25th International Conference on Offshore Mechanics and Arctic Engineering, 4–9 June, Hamburg, 2006. (CD-ROM) [7].Skaare B, Hanson TD, and Nielsen FG. “Importance of Control Strategies on Fatigue Life of Floating Wind Turbines.” 26th International Conference on Offshore Mechanics and Arctic Engineering, 10–15 June, San Diego, CA, 2007. (CD-ROM) [8].Larsen TJ, and Hanson TD. “A Method to Avoid Negative Damped Low Frequent Tower Vibrations for a Floating, Pitch Controlled Wind Turbine.” The Second Conference on The Science of Making Torque From Wind, 28–31 August, Copenhagen, 2007. [Online]. Available: http://iopscience.iop.org/1742-6596/75/1/012073/pdf?ejredirect=.iopscience. [9].Jonkman J. Definition of the Floating System for Phase IV of OC3. NREL: Golden, CO, 2009 (to be published).
F1147-E(10/2008)
REPORT DOCUMENTATION PAGE Form Approved OMB No. 0704-0188
The public reporting burden for this collection of information is estimated to average 1 hour per response, including the time for reviewing instructions, searching existing data sources, gathering and maintaining the data needed, and completing and reviewing the collection of information. Send comments regarding this burden estimate or any other aspect of this collection of information, including suggestions for reducing the burden, to Department of Defense, Executive Services and Communications Directorate (0704-0188). Respondents should be aware that notwithstanding any other provision of law, no person shall be subject to any penalty for failing to comply with a collection of information if it does not display a currently valid OMB control number. PLEASE DO NOT RETURN YOUR FORM TO THE ABOVE ORGANIZATION. 1. REPORT DATE (DD-MM-YYYY)
April 2010 2. REPORT TYPE
Conference Paper 3. DATES COVERED (From - To)
4. TITLE AND SUBTITLE
Offshore Code Comparison Collaboration within IEA Wind Task 23: Phase IV Results Regarding Floating Wind Turbine Modeling; Preprint
5a. CONTRACT NUMBER DE-AC36-08-GO28308
5b. GRANT NUMBER
5c. PROGRAM ELEMENT NUMBER
6. AUTHOR(S) J. Jonkman, T. Larsen, A. Hansen, T. Nygaard, K. Maus, M. Karimirad, Z. Gao, T. Moan, I. Fylling, J. Nichols, M. Kohlmeier, J. Pascual Vergara, D. Merino, W. Shi, and H. Park
5d. PROJECT NUMBER NREL/CP-500-47534
5e. TASK NUMBER WE101211
5f. WORK UNIT NUMBER
7. PERFORMING ORGANIZATION NAME(S) AND ADDRESS(ES) National Renewable Energy Laboratory 1617 Cole Blvd. Golden, CO 80401-3393
8. PERFORMING ORGANIZATION REPORT NUMBER NREL/CP-500-47534
9. SPONSORING/MONITORING AGENCY NAME(S) AND ADDRESS(ES)
10. SPONSOR/MONITOR'S ACRONYM(S) NREL
11. SPONSORING/MONITORING AGENCY REPORT NUMBER
12. DISTRIBUTION AVAILABILITY STATEMENT National Technical Information Service U.S. Department of Commerce 5285 Port Royal Road Springfield, VA 22161
13. SUPPLEMENTARY NOTES
14. ABSTRACT (Maximum 200 Words) Offshore wind turbines are designed and analyzed using comprehensive simulation codes that account for the coupled dynamics of the wind inflow, aerodynamics, elasticity, and controls of the turbine, along with the incident waves, sea current, hydrodynamics, and foundation dynamics of the support structure. This paper describes the latest findings of the code-to-code verification activities of the Offshore Code Comparison Collaboration, which operates under Subtask 2 of the International Energy Agency Wind Task 23. In the latest phase of the project, participants used an assortment of codes to model the coupled dynamic response of a 5-MW wind turbine installed on a floating spar buoy in 320 m of water. Code predictions were compared from load-case simulations selected to test different model features. The comparisons have resulted in a greater understanding of offshore floating wind turbine dynamics and modeling techniques, and better knowledge of the validity of various approximations. The lessons learned from this exercise have improved the participants’ codes, thus improving the standard of offshore wind turbine modeling.