24

E&Ps have been cash flow negative since 2009
• …and consensus expects oil price to be in backwardation
19/09/2014 2
Attention on cash flow has increased as oil price has been flat since 2011
Source: SpareBank 1 Markets, Bloomberg, E&P group consisting of BP, BG, CVX, COP, ENI, XOM, RDSA, STL, FP, APC, HES, LUPE, MRO, NBL, TLM, TLW, BRY, BBG, CNQ, CHK, CWEI, DVN, ERF, XCO, FST, HSE, IMO, MMR, NFX, OXY, PXD, PXP, RRC, SD, SWN, SU, UNT, GTE, OGX, PETR4, ROSN, PTTEP, WPL
-80 000
-60 000
-40 000
-20 000
0
20 000
40 000
60 000
80 000
1992 1994 1996 1998 2000 2002 2004 2006 2008 2010 2012 2014E 2016E
E&P
FC
F p
ost
div
ide
nd
s
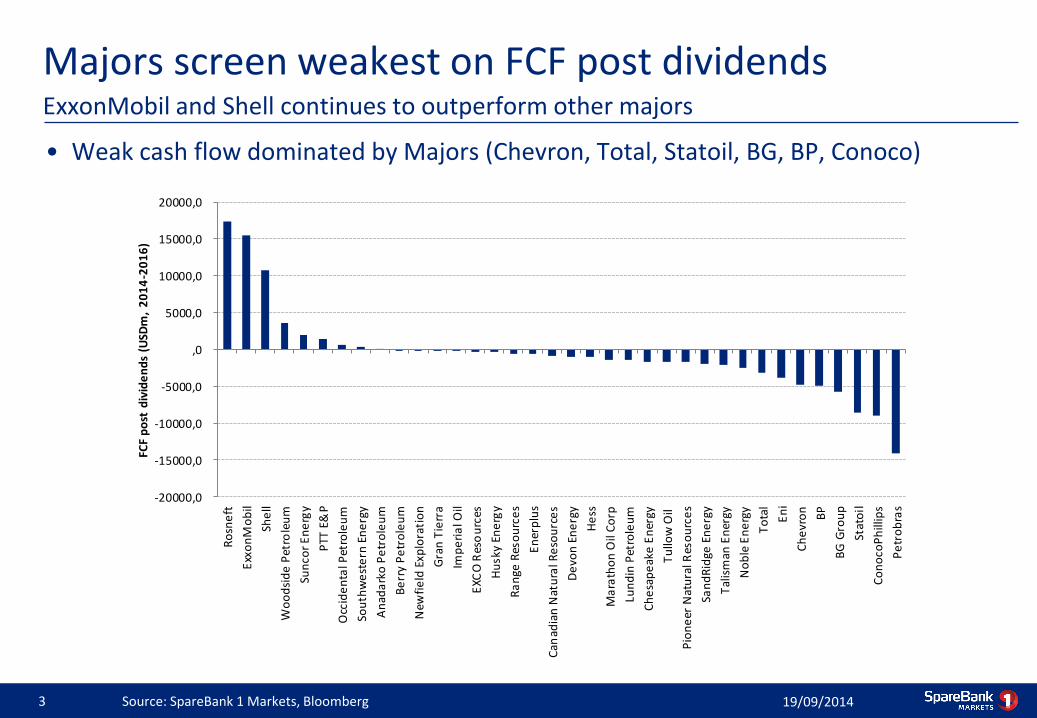
Majors screen weakest on FCF post dividends
• Weak cash flow dominated by Majors (Chevron, Total, Statoil, BG, BP, Conoco)
19/09/2014 3
ExxonMobil and Shell continues to outperform other majors
Source: SpareBank 1 Markets, Bloomberg
-20000,0
-15000,0
-10000,0
-5000,0
,0
5000,0
10000,0
15000,0
20000,0
Ro
sne
ft
Exx
on
Mo
bil
She
ll
Wo
od
sid
e P
etro
leu
m
Sun
cor
En
erg
y
PTT
E&
P
Occ
ide
nta
l Pet
role
um
Sou
thw
est
ern
En
erg
y
An
ada
rko
Pe
tro
leu
m
Be
rry
Pe
tro
leu
m
New
fie
ld E
xplo
rati
on
Gra
n T
ierr
a
Imp
eri
al O
il
EXC
O R
eso
urc
es
Hu
sky
Ene
rgy
Ra
nge
Res
ou
rce
s
En
erp
lus
Can
adia
n N
atu
ral R
eso
urc
es
De
von
En
erg
y
He
ss
Ma
rath
on
Oil
Co
rp
Lun
din
Pet
role
um
Ch
esa
pe
ake
En
ergy
Tu
llow
Oil
Pio
ne
er N
atu
ral R
eso
urc
es
San
dR
idge
En
erg
y
Tal
ism
an E
ner
gy
No
ble
En
erg
y
To
tal
En
i
Ch
evr
on
BP
BG
Gro
up
Stat
oil
Co
no
coP
hill
ips
Pe
tro
bra
s
FCF
po
st d
ivid
en
ds
(USD
m,
20
14
-20
16
)

The main challenge for oilservices
• E&Ps have funded capex growth through increased leverage and asset sales
19/09/2014 4
E&Ps do not make money – even at a relatively high oil price
Source: SpareBank 1 Markets, E&P group consisting of BP, Shell, Total, Eni, Statoil, Chevron, ConocoPhillips, ExxonMobil, Repsol and BG Group
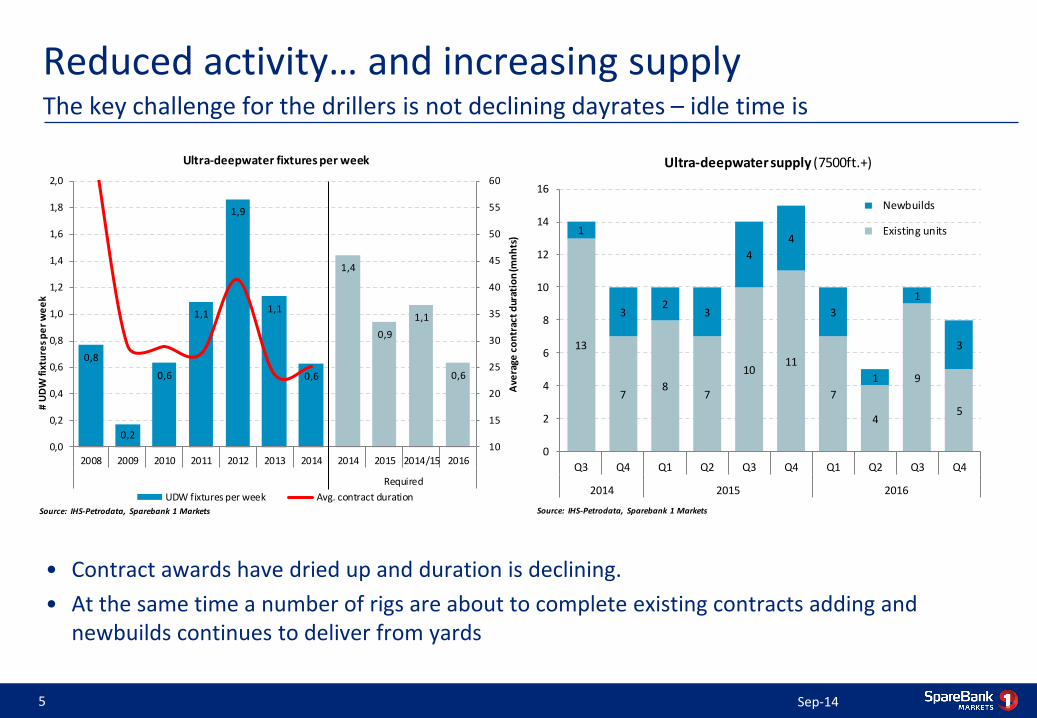
Reduced activity… and increasing supply
• Contract awards have dried up and duration is declining.
• At the same time a number of rigs are about to complete existing contracts adding and newbuilds continues to deliver from yards
Sep-14 5
The key challenge for the drillers is not declining dayrates – idle time is
0,8
0,2
0,6
1,1
1,9
1,1
0,6
1,4
0,9
1,1
0,6
10
15
20
25
30
35
40
45
50
55
60
0,0
0,2
0,4
0,6
0,8
1,0
1,2
1,4
1,6
1,8
2,0
2008 2009 2010 2011 2012 2013 2014 2014 2015 2014/15 2016
Required
Ave
rage
co
ntr
act
dur
atio
n (m
nh
ts)
# U
DW
fixt
ure
s p
er
we
ek
Ultra-deepwater fixtures per week
UDW fixtures per week Avg. contract durationSource: IHS-Petrodata, Sparebank 1 Markets
13
78
7
1011
7
4
9
5
1
32
3
4
4
3
1
1
3
0
2
4
6
8
10
12
14
16
Q3 Q4 Q1 Q2 Q3 Q4 Q1 Q2 Q3 Q4
2014 2015 2016
Ultra-deepwater supply (7500ft.+)
Newbuilds
Existing units
Source: IHS-Petrodata, Sparebank 1 Markets
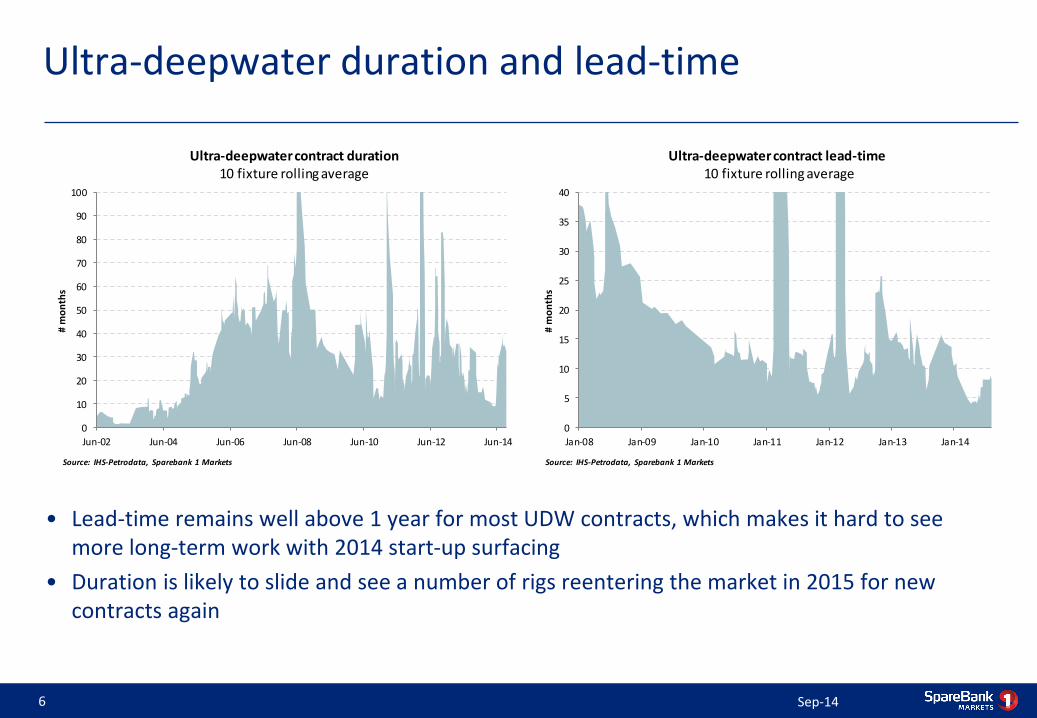
Ultra-deepwater duration and lead-time
• Lead-time remains well above 1 year for most UDW contracts, which makes it hard to see more long-term work with 2014 start-up surfacing
• Duration is likely to slide and see a number of rigs reentering the market in 2015 for new contracts again
Sep-14 6
0
10
20
30
40
50
60
70
80
90
100
Jun-02 Jun-04 Jun-06 Jun-08 Jun-10 Jun-12 Jun-14
# m
on
ths
Ultra-deepwater contract duration10 fixture rolling average
Source: IHS-Petrodata, Sparebank 1 Markets
0
5
10
15
20
25
30
35
40
Jan-08 Jan-09 Jan-10 Jan-11 Jan-12 Jan-13 Jan-14
# m
on
ths
Ultra-deepwater contract lead-time10 fixture rolling average
Source: IHS-Petrodata, Sparebank 1 Markets
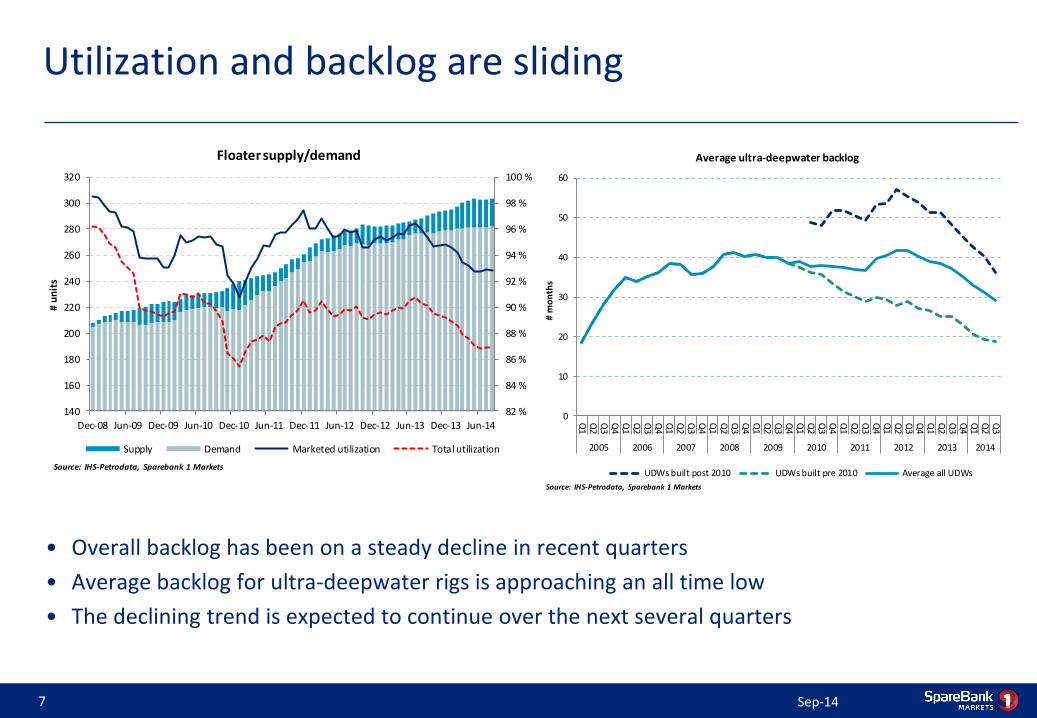
Utilization and backlog are sliding
• Overall backlog has been on a steady decline in recent quarters
• Average backlog for ultra-deepwater rigs is approaching an all time low
• The declining trend is expected to continue over the next several quarters
Sep-14 7
0
10
20
30
40
50
60
Q1
Q2
Q3
Q4
Q1
Q2
Q3
Q4
Q1
Q2
Q3
Q4
Q1
Q2
Q3
Q4
Q1
Q2
Q3
Q4
Q1
Q2
Q3
Q4
Q1
Q2
Q3
Q4
Q1
Q2
Q3
Q4
Q1
Q2
Q3
Q4
Q1
Q2
Q3
2005 2006 2007 2008 2009 2010 2011 2012 2013 2014
# m
on
ths
Average ultra-deepwater backlog
UDWs built post 2010 UDWs built pre 2010 Average all UDWs
Source: IHS-Petrodata, Sparebank 1 Markets
82 %
84 %
86 %
88 %
90 %
92 %
94 %
96 %
98 %
100 %
140
160
180
200
220
240
260
280
300
320
Dec-08 Jun-09 Dec-09 Jun-10 Dec-10 Jun-11 Dec-11 Jun-12 Dec-12 Jun-13 Dec-13 Jun-14
# u
nit
s
Floater supply/demand
Supply Demand Marketed utilization Total utilization
Source: IHS-Petrodata, Sparebank 1 Markets

Softer dayrates expected
Sep-14 8
0
100 000
200 000
300 000
400 000
500 000
600 000
700 000
800 000
May-05 Oct-06 Feb-08 Jul-09 Nov-10 Apr-12 Aug-13 Dec-14 May-16
USD
k/d
ay
Ultra-deepwater fixtures
Built post 2005 Built pre 2005
300
350
400
450
500
550
600
650
H1 H2 H1 H2 H1 H2 H1 H2 H1 H2 H1 H2 H1 H2 H1 H2 H1 H2
2006 2007 2008 2009 2010 2011 2012 2013 2014
USD
k/d
ay
Ultra-deepwater dayrates
Built pre 2005 Built post 2005
• Dayrates have yet to see a meaningful decline – as there has been limited new fixtures
• Older rigs face the largest drop as bifurcation is expected to increase
Most recent fixtures
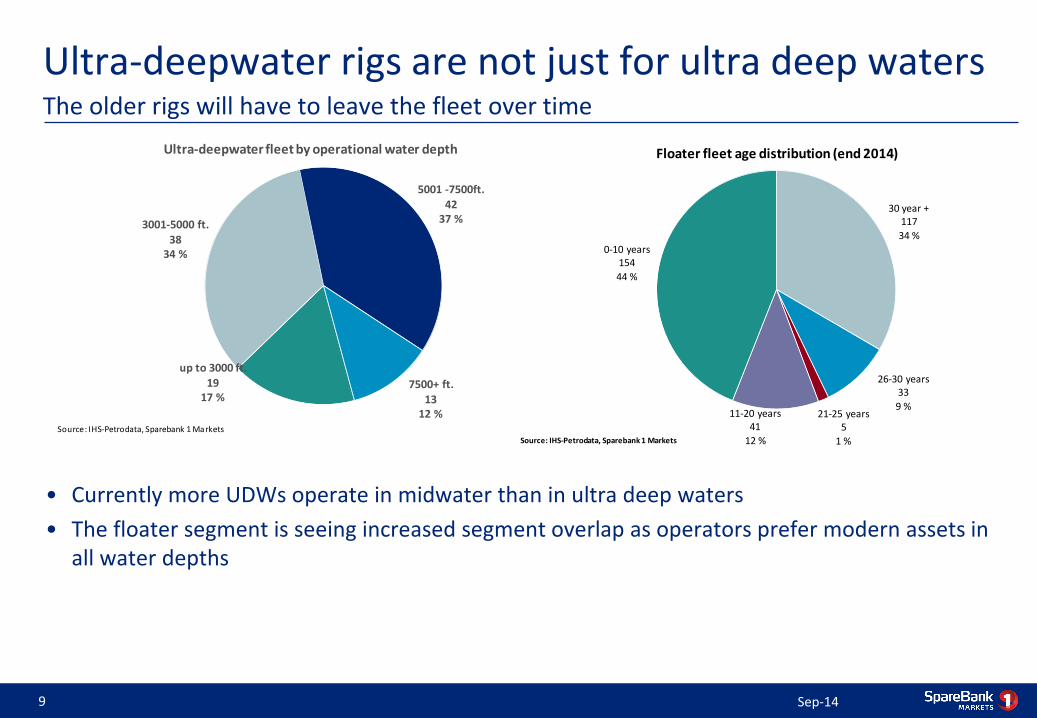
Ultra-deepwater rigs are not just for ultra deep waters
• Currently more UDWs operate in midwater than in ultra deep waters
• The floater segment is seeing increased segment overlap as operators prefer modern assets in all water depths
Sep-14 9
The older rigs will have to leave the fleet over time
up to 3000 ft.19
17 %
3001-5000 ft.38
34 %
5001 -7500ft.42
37 %
7500+ ft.
1312 %
Ultra-deepwater fleet by operational water depth
Source: IHS-Petrodata, Sparebank 1 Markets
30 year +117
34 %
26-30 years33
9 %21-25 years
5
1 %
11-20 years41
12 %
0-10 years154
44 %
Floater fleet age distribution (end 2014)
Source: IHS-Petrodata, Sparebank 1 Markets
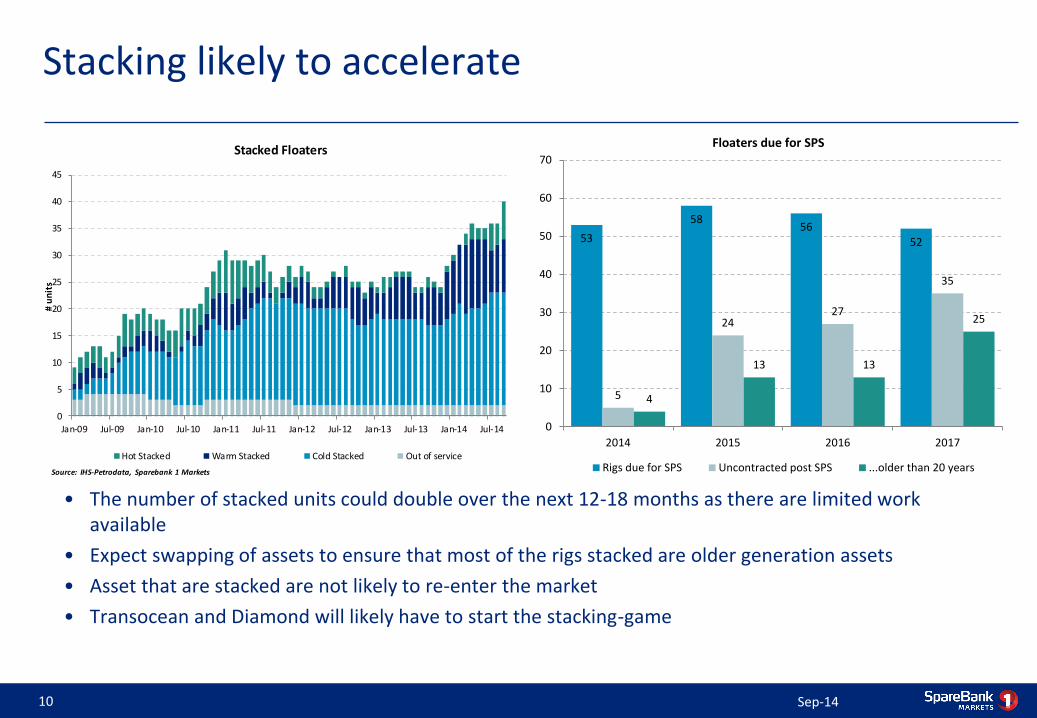
Stacking likely to accelerate
• The number of stacked units could double over the next 12-18 months as there are limited work available
• Expect swapping of assets to ensure that most of the rigs stacked are older generation assets
• Asset that are stacked are not likely to re-enter the market
• Transocean and Diamond will likely have to start the stacking-game
Sep-14 10
0
5
10
15
20
25
30
35
40
45
Jan-09 Jul-09 Jan-10 Jul-10 Jan-11 Jul-11 Jan-12 Jul-12 Jan-13 Jul-13 Jan-14 Jul-14
# u
nit
s
Stacked Floaters
Hot Stacked Warm Stacked Cold Stacked Out of service
Source: IHS-Petrodata, Sparebank 1 Markets
53
5856
52
5
2427
35
4
13 13
25
0
10
20
30
40
50
60
70
2014 2015 2016 2017
Floaters due for SPS
Rigs due for SPS Uncontracted post SPS ...older than 20 years
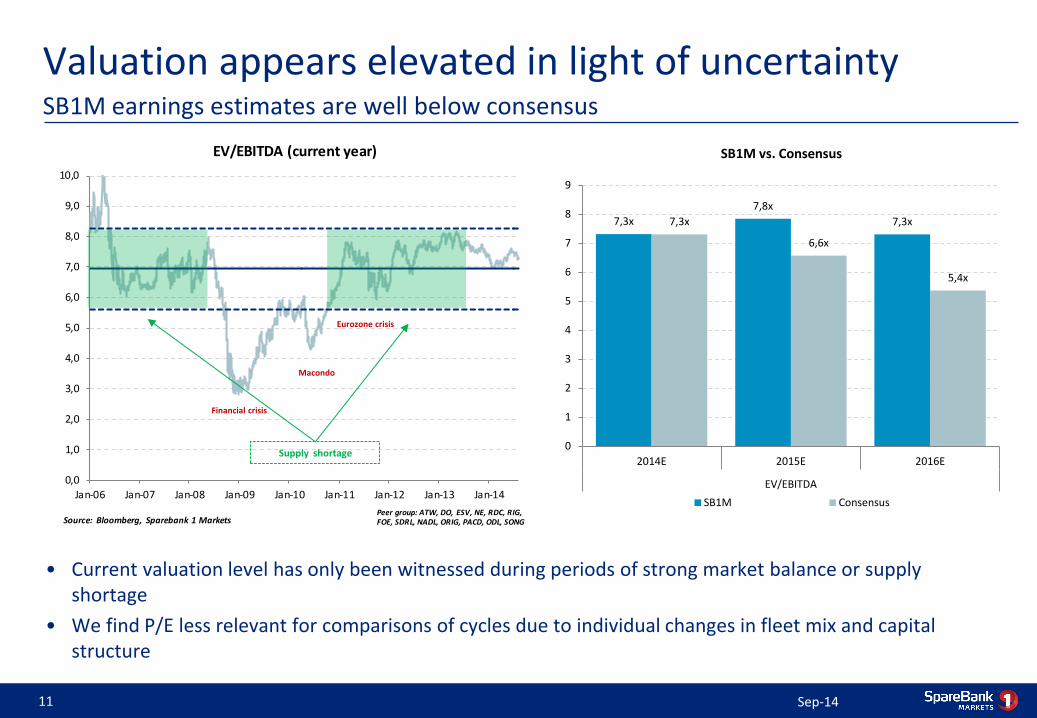
Valuation appears elevated in light of uncertainty
Sep-14 11
SB1M earnings estimates are well below consensus
0,0
1,0
2,0
3,0
4,0
5,0
6,0
7,0
8,0
9,0
10,0
Jan-06 Jan-07 Jan-08 Jan-09 Jan-10 Jan-11 Jan-12 Jan-13 Jan-14
EV/EBITDA (current year)
Source: Bloomberg, Sparebank 1 MarketsPeer group: ATW, DO, ESV, NE, RDC, RIG,FOE, SDRL, NADL, ORIG, PACD, ODL, SONG
• Current valuation level has only been witnessed during periods of strong market balance or supply shortage
• We find P/E less relevant for comparisons of cycles due to individual changes in fleet mix and capital structure
Supply shortage
Financial crisis
Macondo
Eurozone crisis
7,3x
7,8x
7,3x7,3x
6,6x
5,4x
0
1
2
3
4
5
6
7
8
9
2014E 2015E 2016E
EV/EBITDA
SB1M vs. Consensus
SB1M Consensus
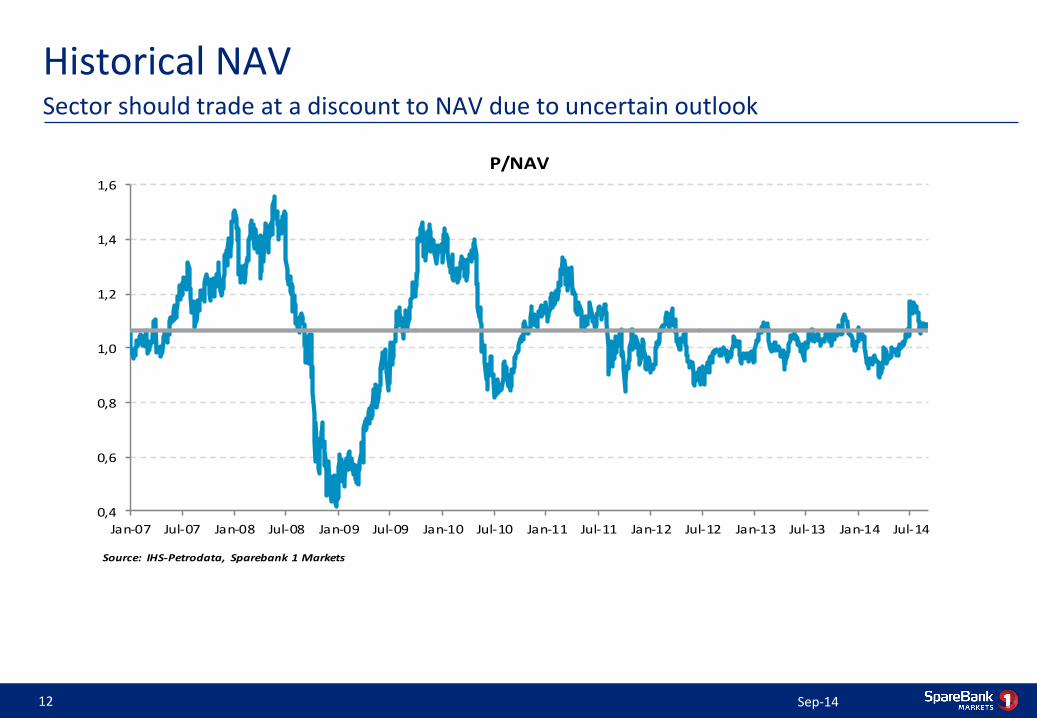
Historical NAV
Sep-14 12
Sector should trade at a discount to NAV due to uncertain outlook
0,4
0,6
0,8
1,0
1,2
1,4
1,6
Jan-07 Jul-07 Jan-08 Jul-08 Jan-09 Jul-09 Jan-10 Jul-10 Jan-11 Jul-11 Jan-12 Jul-12 Jan-13 Jul-13 Jan-14 Jul-14
P/NAV
Source: IHS-Petrodata, Sparebank 1 Markets

Why is NAV to some degree irrelevant in this market?
• Using DCF as a metric increases the average from 1.0x to 1.4x
• Companies with a large portion of legacy assets are more exposed to an increase
• The market is already discounting the value of older assets – just not enough
19/09/2014 13
…because the value of older assets are likely inflated given the lack of work available
1,6x
1,2x 1,2x 1,1x 1,1x 1,1x 1,1x 1,0x 0,9x0,8x 0,8x 0,8x 0,7x 0,6x 0,6x 0,6x 0,6x
1,7x
1,4x
1,2x
1,6x
1,5x
1,3x
1,4x
1,3x
1,0x
1,3x 1,3x
1,6x1,5x
1,1x
1,3x
1,1x
1,4x
0,9x
1,4x
0,0x
0,2x
0,4x
0,6x
0,8x
1,0x
1,2x
1,4x
1,6x
1,8x
2,0x
NADL SDRL AWDR ESV PACD ATW ORIG NE FOE RIG PROS DO SONG RDC SEVDR NOF ODL
P/NAV and P/DCFP/DCF
P/NAV
Source: IHS-Petrodata, Sparebank 1 Markets
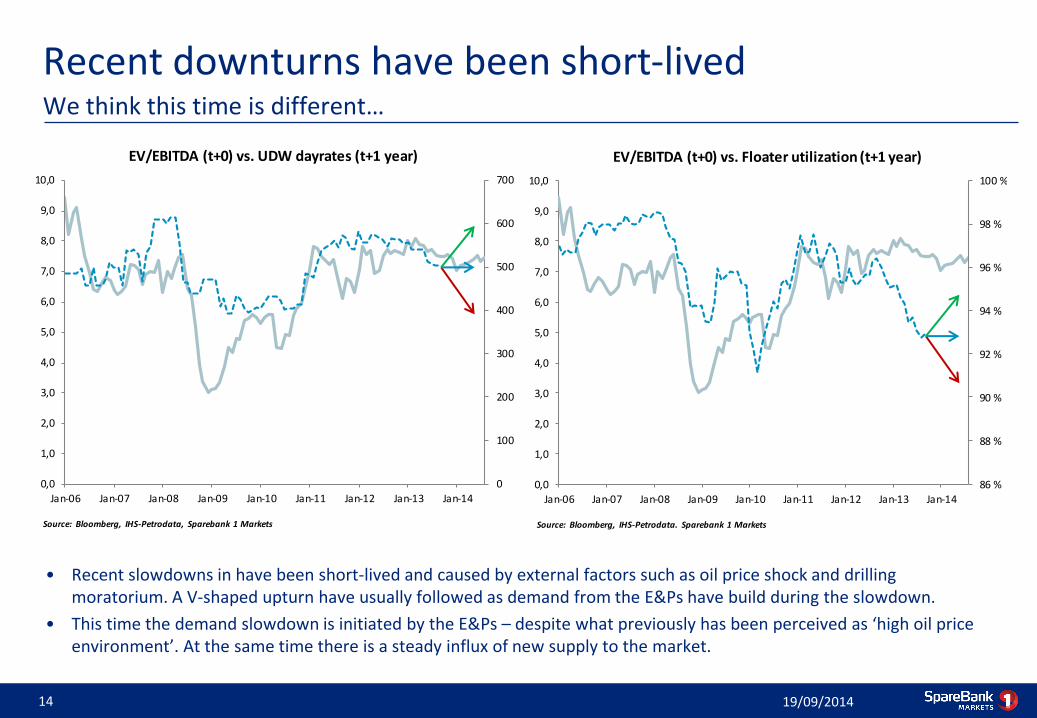
Recent downturns have been short-lived
• Recent slowdowns in have been short-lived and caused by external factors such as oil price shock and drilling moratorium. A V-shaped upturn have usually followed as demand from the E&Ps have build during the slowdown.
• This time the demand slowdown is initiated by the E&Ps – despite what previously has been perceived as ‘high oil price environment’. At the same time there is a steady influx of new supply to the market.
19/09/2014 14
We think this time is different…
0
100
200
300
400
500
600
700
0,0
1,0
2,0
3,0
4,0
5,0
6,0
7,0
8,0
9,0
10,0
Jan-06 Jan-07 Jan-08 Jan-09 Jan-10 Jan-11 Jan-12 Jan-13 Jan-14
EV/EBITDA (t+0) vs. UDW dayrates (t+1 year)
Source: Bloomberg, IHS-Petrodata, Sparebank 1 Markets
86 %
88 %
90 %
92 %
94 %
96 %
98 %
100 %
0,0
1,0
2,0
3,0
4,0
5,0
6,0
7,0
8,0
9,0
10,0
Jan-06 Jan-07 Jan-08 Jan-09 Jan-10 Jan-11 Jan-12 Jan-13 Jan-14
EV/EBITDA (t+0) vs. Floater utilization (t+1 year)
Source: Bloomberg, IHS-Petrodata. Sparebank 1 Markets
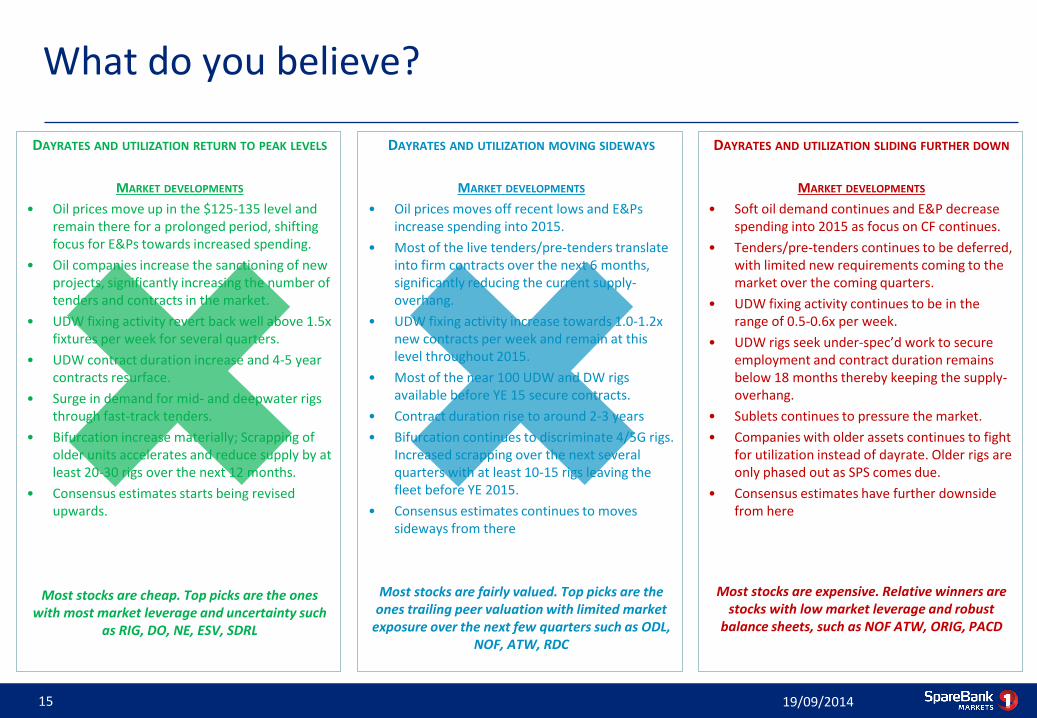
What do you believe?
DAYRATES AND UTILIZATION RETURN TO PEAK LEVELS
MARKET DEVELOPMENTS
• Oil prices move up in the $125-135 level and remain there for a prolonged period, shifting focus for E&Ps towards increased spending.
• Oil companies increase the sanctioning of new projects, significantly increasing the number of tenders and contracts in the market.
• UDW fixing activity revert back well above 1.5x fixtures per week for several quarters.
• UDW contract duration increase and 4-5 year contracts resurface.
• Surge in demand for mid- and deepwater rigs through fast-track tenders.
• Bifurcation increase materially; Scrapping of older units accelerates and reduce supply by at least 20-30 rigs over the next 12 months.
• Consensus estimates starts being revised upwards.
Most stocks are cheap. Top picks are the ones with most market leverage and uncertainty such
as RIG, DO, NE, ESV, SDRL
19/09/2014 15
DAYRATES AND UTILIZATION MOVING SIDEWAYS
MARKET DEVELOPMENTS
• Oil prices moves off recent lows and E&Ps increase spending into 2015.
• Most of the live tenders/pre-tenders translate into firm contracts over the next 6 months, significantly reducing the current supply-overhang.
• UDW fixing activity increase towards 1.0-1.2x new contracts per week and remain at this level throughout 2015.
• Most of the near 100 UDW and DW rigs available before YE 15 secure contracts.
• Contract duration rise to around 2-3 years
• Bifurcation continues to discriminate 4/5G rigs. Increased scrapping over the next several quarters with at least 10-15 rigs leaving the fleet before YE 2015.
• Consensus estimates continues to moves sideways from there
Most stocks are fairly valued. Top picks are the ones trailing peer valuation with limited market
exposure over the next few quarters such as ODL, NOF, ATW, RDC
DAYRATES AND UTILIZATION SLIDING FURTHER DOWN
MARKET DEVELOPMENTS
• Soft oil demand continues and E&P decrease spending into 2015 as focus on CF continues.
• Tenders/pre-tenders continues to be deferred, with limited new requirements coming to the market over the coming quarters.
• UDW fixing activity continues to be in the range of 0.5-0.6x per week.
• UDW rigs seek under-spec’d work to secure employment and contract duration remains below 18 months thereby keeping the supply-overhang.
• Sublets continues to pressure the market.
• Companies with older assets continues to fight for utilization instead of dayrate. Older rigs are only phased out as SPS comes due.
• Consensus estimates have further downside from here
Most stocks are expensive. Relative winners are stocks with low market leverage and robust
balance sheets, such as NOF ATW, ORIG, PACD

Fleet age matters
Sep-14 16
We think P/FCF is more relevant than EV/EBITDA
ATW
DO
ESV
FOE
NE
ORIG
ODL
PACD
RDC
SDRL
SEVDR
SONG
RIG
3,5
4,0
4,5
5,0
5,5
6,0
6,5
7,0
7,5
- 5 10 15 20
EV/E
BIT
DA
Value weighted average fleet age
Value weighted fleet age vs. M2M EV/EBITDA
Source: Sparebank 1 Markets
ATW
DO
ESV
FOE
NADL
NE
ORIG
ODL
PACD
RDC
SDRL
RIG
2,0
3,0
4,0
5,0
6,0
7,0
8,0
9,0
10,0
- 5 10 15 20
P/F
CP
S
Value weighted average fleet age
Value weighted fleet age vs. M2M P/FCPS
Source: Sparebank 1 Markets

Still a large OSV orderbook for PSVs
19/09/2014 17 Source: Sparebank 1 Markets; IHS Petrodata
AHTS PSV
AHTS PSV Total >15,000 bhp >3,000 dwt Total
Current fleet 1818 1445 3263 238 828 1066
On order 19 48 67 2 41 43
Planned 10 19 29 2 8 10
Acceptance testing 0 1 1 0 1 1
Under construction 137 301 438 18 256 274
Total 166 369 535 22 306 328
Growth 9 % 26 % 16 % 9 % 37 % 31 %
0
200
400
600
800
1000
1200
1400
1600
1800
2000
0
50
100
150
200
250
1966 1969 1972 1975 1978 1981 1984 1987 1990 1993 1996 1999 2002 2005 2008 2011 2014
# o
f ve
sse
ls
Year in service
AHTS fleet by construction year
AHTS UC AHTS Accumulated fleet
0
200
400
600
800
1000
1200
1400
1600
0
50
100
150
200
250
1966 1969 1972 1975 1978 1981 1984 1987 1990 1993 1996 1999 2002 2005 2008 2011 2014
# o
f ve
sse
ls
Year in service
PSV fleet by construction year
PSV UC PSV Accumulated fleet (rhs)
However, PSV to rig increases roughly in line with trend
• Assumes no scrapping of existing vessels, and no cancellations or delays in delivery of newbuilds
19/09/2014 18
AHTS to rig declining over the next 2-3 years
Source: Sparebank 1 Markets; IHS Petrodata
Fleet as of
2000A 2001A 2002A 2003A 2004A 2005A 2006A 2007A 2008A 2009A 2010A 2011A 2012A 2013A 2014E 2015E
Drilling rigs
Jackup 393 393 398 401 405 408 418 433 462 485 505 521 535 575 615 680
Semisubmersible 159 167 168 169 171 173 173 173 178 193 205 219 229 230 234 243
Drillship 38 39 39 39 39 40 40 41 44 51 61 78 87 99 127 144
Total # of drilling units 590 599 605 609 615 621 631 647 684 729 771 818 851 904 976 1067
Supply
AHTS 715 725 753 793 826 881 948 1035 1143 1328 1501 1612 1697 1769 1875 1949
PSV 560 578 615 665 697 734 774 818 902 970 1045 1099 1177 1317 1545 1711
Total # of OSV vessels 1275 1303 1368 1458 1523 1615 1722 1853 2045 2298 2546 2711 2874 3086 3420 3660
Growth rate rigs 1,5 % 1,0 % 0,7 % 1,0 % 1,0 % 1,6 % 2,5 % 5,7 % 6,6 % 5,8 % 6,1 % 4,0 % 6,2 % 8,0 % 9,3 %
2,2 % 5,0 % 6,6 % 4,5 % 6,0 % 6,6 % 7,6 % 10,4 % 12,4 % 10,8 % 6,5 % 6,0 % 7,4 % 10,8 % 7,0 %
2,2 2,2 2,3 2,4 2,5 2,6 2,7 2,9 3,0 3,2 3,3 3,3 3,4 3,4 3,5 3,4
1,2 1,2 1,2 1,3 1,3 1,4 1,5 1,6 1,7 1,8 1,9 2,0 2,0 2,0 1,9 1,8
PSV/Rigs 0,9 1,0 1,0 1,1 1,1 1,2 1,2 1,3 1,3 1,3 1,4 1,3 1,4 1,5 1,6 1,6
AHTS/(JU + Semi) 1,3 1,3 1,3 1,4 1,4 1,5 1,6 1,7 1,8 2,0 2,1 2,2 2,2 2,2 2,2 2,1
PSV/Floaters 2,8 2,8 3,0 3,2 3,3 3,4 3,6 3,8 4,1 4,0 3,9 3,7 3,7 4,0 4,3 4,4
Accumulated, including newbuilds (actual and planned) since 1.1. 2000
Growth rate vessels
Vessels/Rigs
AHTS/Rigs
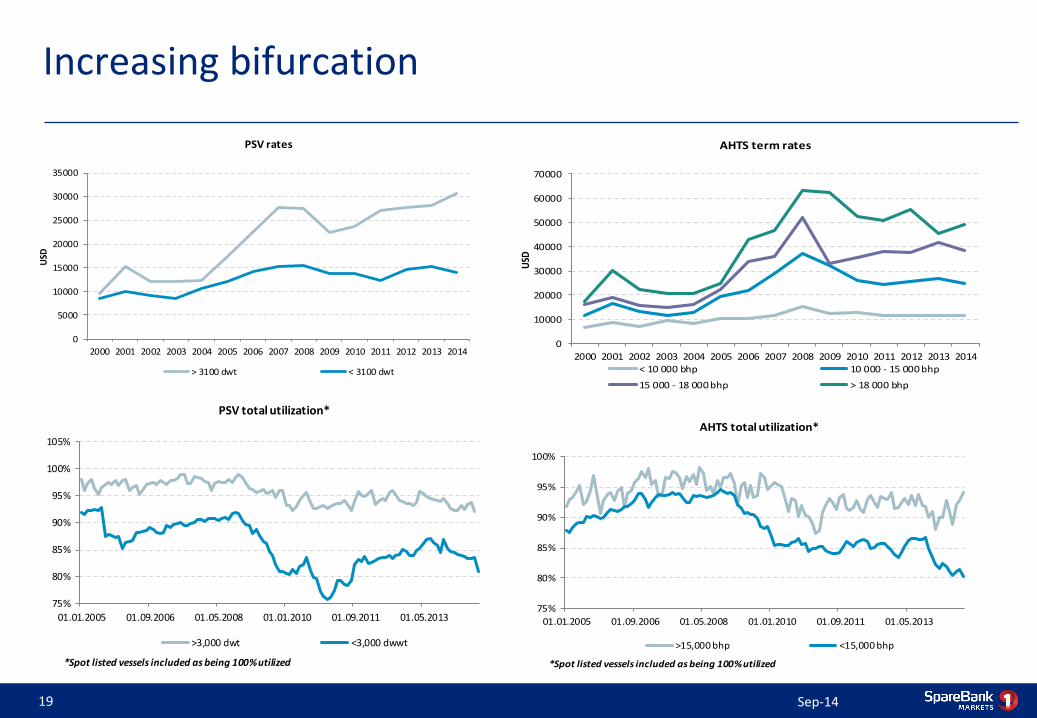
Increasing bifurcation
Sep-14 19
0
5000
10000
15000
20000
25000
30000
35000
2000 2001 2002 2003 2004 2005 2006 2007 2008 2009 2010 2011 2012 2013 2014
USD
PSV rates
> 3100 dwt < 3100 dwt
0
10000
20000
30000
40000
50000
60000
70000
2000 2001 2002 2003 2004 2005 2006 2007 2008 2009 2010 2011 2012 2013 2014
USD
AHTS term rates
< 10 000 bhp 10 000 - 15 000 bhp
15 000 - 18 000 bhp > 18 000 bhp
75%
80%
85%
90%
95%
100%
01.01.2005 01.09.2006 01.05.2008 01.01.2010 01.09.2011 01.05.2013
AHTS total utilization*
>15,000 bhp <15,000 bhp
*Spot listed vessels included as being 100% utilized
75%
80%
85%
90%
95%
100%
105%
01.01.2005 01.09.2006 01.05.2008 01.01.2010 01.09.2011 01.05.2013
PSV total utilization*
>3,000 dwt <3,000 dwwt
*Spot listed vessels included as being 100% utilized
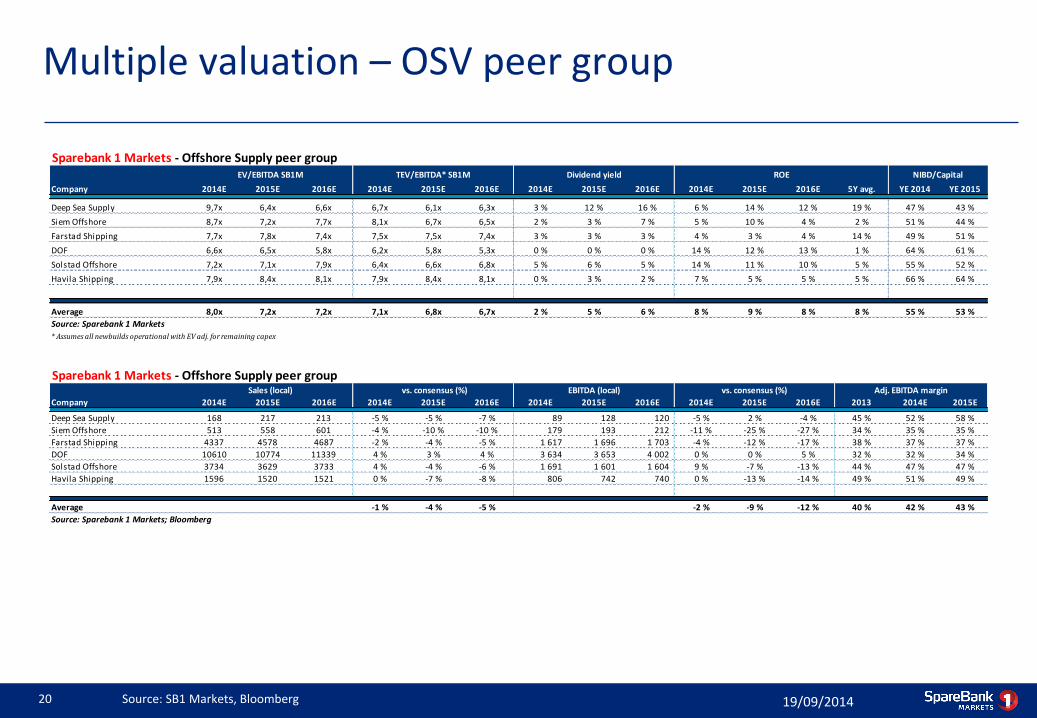
Multiple valuation – OSV peer group
19/09/2014 20 Source: SB1 Markets, Bloomberg
Sparebank 1 Markets - Offshore Supply peer group
Company 2014E 2015E 2016E 2014E 2015E 2016E 2014E 2015E 2016E 2014E 2015E 2016E 5Y avg. YE 2014 YE 2015
Deep Sea Supply 9,7x 6,4x 6,6x 6,7x 6,1x 6,3x 3 % 12 % 16 % 6 % 14 % 12 % 19 % 47 % 43 %
Siem Offshore 8,7x 7,2x 7,7x 8,1x 6,7x 6,5x 2 % 3 % 7 % 5 % 10 % 4 % 2 % 51 % 44 %
Farstad Shipping 7,7x 7,8x 7,4x 7,5x 7,5x 7,4x 3 % 3 % 3 % 4 % 3 % 4 % 14 % 49 % 51 %
DOF 6,6x 6,5x 5,8x 6,2x 5,8x 5,3x 0 % 0 % 0 % 14 % 12 % 13 % 1 % 64 % 61 %
Solstad Offshore 7,2x 7,1x 7,9x 6,4x 6,6x 6,8x 5 % 6 % 5 % 14 % 11 % 10 % 5 % 55 % 52 %
Havila Shipping 7,9x 8,4x 8,1x 7,9x 8,4x 8,1x 0 % 3 % 2 % 7 % 5 % 5 % 5 % 66 % 64 %
Average 8,0x 7,2x 7,2x 7,1x 6,8x 6,7x 2 % 5 % 6 % 8 % 9 % 8 % 8 % 55 % 53 %
Source: Sparebank 1 Markets
* Assumes all newbuilds operational with EV adj. for remaining capex
Sparebank 1 Markets - Offshore Supply peer group
Company 2014E 2015E 2016E 2014E 2015E 2016E 2014E 2015E 2016E 2014E 2015E 2016E 2013 2014E 2015E
Deep Sea Supply 168 217 213 -5 % -5 % -7 % 89 128 120 -5 % 2 % -4 % 45 % 52 % 58 %
Siem Offshore 513 558 601 -4 % -10 % -10 % 179 193 212 -11 % -25 % -27 % 34 % 35 % 35 %
Farstad Shipping 4337 4578 4687 -2 % -4 % -5 % 1 617 1 696 1 703 -4 % -12 % -17 % 38 % 37 % 37 %
DOF 10610 10774 11339 4 % 3 % 4 % 3 634 3 653 4 002 0 % 0 % 5 % 32 % 32 % 34 %
Solstad Offshore 3734 3629 3733 4 % -4 % -6 % 1 691 1 601 1 604 9 % -7 % -13 % 44 % 47 % 47 %
Havila Shipping 1596 1520 1521 0 % -7 % -8 % 806 742 740 0 % -13 % -14 % 49 % 51 % 49 %
Average -1 % -4 % -5 % -2 % -9 % -12 % 40 % 42 % 43 %
Source: Sparebank 1 Markets; Bloomberg
Sales (local)
EV/EBITDA SB1M TEV/EBITDA* SB1M Dividend yield ROE NIBD/Capital
vs. consensus (%) EBITDA (local) vs. consensus (%) Adj. EBITDA margin
Disclaimer IMPORTANT DISCLOSURES AND CERTIFICATIONS
This document provides additional disclosures and disclaimers relevant to research reports and other investment recommendations (“Recommendations”) issued by SpareBank 1 Markets AS (“SpareBank 1 Markets”), cf. the Norwegian Securities Trading Act section 3-10 with further regulations.
Standards and supervisory authorities
SpareBank 1 Markets complies with the standards for recommendations issued by the Norwegian Securities Dealers Association (http://vpff.no/) and the Norwegian Society of Financial Analysts. The lead analyst (see front page) is employed by SpareBank 1 Markets, which is legally responsible for this report and is under the supervision of The Financial Supervisory Authority of Norway (Finanstilsynet).
Previous Recommendations
For an overview of SpareBank 1 Markets research reports and other investment recommendations regarding the financial instruments of the issuer the past 12 months, including data on changes in such research reports and other investment recommendations, please see SpareBank 1 Markets’ website, www.sb1markets.no (log-in required)
Planned updates
Unless explicitly stated otherwise in this report, SpareBank 1 Markets expects, but not undertake, to issue updates to this report following the publication of new figures or forecasts by the issuer covered, or upon the occurrence of other events which could potentially have a material effect on it.
Information sources
Important sources of information: the issuer, including its quarterly and annual reports, Oslo Stock Exchange, Statistics Norway (Statistisk Sentralbyrå). Sources are cited when referred to in the Recommendation. We use only sources we find reliable and accurate, unless otherwise stated.
The Recommendations has not been presented to the issuer/ the issuers of the financial instrument presented before dissemination.
SpareBank 1 Markets’ interests and disclosure of assignments and mandates
Financial instruments held by the analyst(s) and/or close associate in the issuer/ issuers herein: 0 Other material interest (if any): None
SpareBank 1 Markets does not alone or together with related companies or persons, hold a portion of the shares exceeding 5 % of the total share capital in any companies where a recommendation has been produced or distributed by SpareBank 1 Markets, or holds other interest likely to affect the objectivity of a recommendation, except when disclosed, cf. below.
SpareBank 1 Markets may hold financial instruments in companies where a recommendation has been produced or distributed by SpareBank 1 Markets in connection with rendering investment services, including market making.
For important disclosures, such as an overview of all financial instruments in which SpareBank 1 Markets or related companies are market makers or liquidity providers, all financial instruments where SpareBank 1 Markets or related companies have been lead managers or co-lead managers over the previous 12 months, and all issuers of financial instruments to whom SpareBank 1 Markets or related companies have rendered investment banking services over the previous 12 months, please refer to SpareBank 1 Markets equity research website: www.sb1markets.no (login required) Please note that agreements and services subject to confidentiality are excluded.
19/09/2014 21
Disclaimer SpareBank 1 Markets Research Department
Our recommendations are based on a six-month horizon, and on absolute performance. We apply a three-stage recommendation structure where Buy indicates an expected annualized return of greater than +15%; Neutral, from 0% to +10%; Sell, less than 0%.
Current recommendations of the Research Department: (refers to Recommendations published prior to this report and required disclosed in accordance with the Securities Trading Regulations section 3-11 (4)
Standard research disclaimer
All employees of SpareBank 1 Markets are subject to duty of confidentiality towards clients and with respect to inside information.
SpareBank 1 Markets operates a system of “Chinese Walls” and other organizational procedures in order to control the flow of information within the firm and minimize conflicts of interest within SpareBank1 Markets and between clients. The Research Department is part of this system.
The Research Analysts of SpareBank 1 Markets receive salary and are members of the bonus pool. However no part of the analysts’ salaries or compensations relates to the performance of their recommendations, directly to investment banking services or other services provided by SpareBank 1 Markets or related companies to issuers.
Analyst Certification
The views expressed in this research accurately reflect(s) the personal views of the analyst(s) principally responsible for this report about the subject securities or issuers, and no part of the compensation of such analyst(s) was, is, or will be directly or indirectly related to the inclusion of specific recommendations or views in this research. No part of the compensation of the research analyst(s) responsible for the preparation of this report was, is, or will be, directly or indirectly, related to the specific recommendations or views expressed by the research analyst(s) in this report.
Risks
Generally, investments in financial instruments involve risks. For specific risks related to our various recommendations, please see the latest relevant reports. The target prices on companies in the SpareBank 1 Markets Research universe reflect the subjective view of the analyst about the absolute price that financial instruments should trade at, within our six-month recommendation horizon. The target price is based on an absolute valuation approach, which is detailed in our research reports. The target price can differ from the absolute valuation, in accordance with the analyst's subjective view on the trading or cyclical patterns for a particular financial instrument, or a possible discount/premium to reflect factors such as market capitalization, ownership structure and/or changes in the same, and company-specific issues.
This report or summary has been prepared by SpareBank 1 Markets from information obtained from public sources not all of which are controlled by SpareBank 1 Markets. Such information is believed to be reliable and although it has not been independently verified, SpareBank 1 Markets has taken all reasonable care to ensure that the information is true and not misleading. Notwithstanding such reasonable efforts, SpareBank 1 Markets makes no guarantee, representation or warranty as to its accuracy or completeness.
SpareBank 1 Markets assumes no obligation to update the information contained in this report or summary to the extent that it is subsequently determined to be false or inaccurate.
This document contains certain forward-looking statements relating to the business, financial performance and results of the issuer and/or the industry in which it operates. Forward-looking statements concern future circumstances and results and other statements that are not historical facts, sometimes identified by the words “believes”, expects”, “predicts”, “intends”, “projects”, “plans”, “estimates”, “aims”, “foresees”, “anticipates”, “targets”, and similar expressions. The forward-looking statements contained in this document, including assumptions, opinions and views of the issuer or cited from third party sources are solely opinions and forecasts which are subject to risks, uncertainties and other factors that may cause actual events to differ materially from any anticipated development.
19/09/2014 22
Disclaimer No Solicitation
This report or summary is provided for informational purposes only and under no circumstances is it to be used or considered as an offer to sell, or a solicitation of any offer to buy any securities. This report or summary is prepared for general circulation and general information only. It does not have regard to the specific investment objectives, financial situation or the particular needs of any person who may receive this report or summary. Investors should seek financial advice regarding the appropriateness of investing in any securities or investment strategies discussed or recommended in this report or summary and should understand that statements regarding future prospects may not be realized.
Performance in the past is not a guide to future performance. SpareBank 1 Markets accepts no liability whatsoever for any direct or consequential loss arising from the use of this publication or its contents.
These materials may not be reproduced, distributed or published by any recipient for any purpose. Please cite source when quoting.
Notice to U.S. Investors
If this report is being furnished directly to U.S. recipients by a non-U.S. SpareBank 1 Markets entity in reliance on section (a)(2) of Rule 15a-6 under the U.S. Securities Exchange Act of 1934, as amended (each a “direct U.S. recipient”), each such direct U.S. recipient of this report represents and agrees, by virtue of its acceptance thereof, that it is “major U.S. institutional investor” (as such term is defined in section (b)(4) of Rule 15a-6) and that it understands the risks involved in executing transactions in such securities. Any direct U.S. recipient of this report that wishes to discuss or receive additional information regarding any security or issuer mentioned herein, or engage in any transaction to purchase or sell or solicit or offer the purchase or sale of such securities, should contact a registered representative of SpareBank 1 Capital Markets Inc. (“SpareBank 1 Capital Markets”), a registered U.S. broker-dealer and member of FINRA and SIPC.
In certain cases, unless prohibited by the provisions of Regulation S under the U.S. Securities Act of 1933, as amended, this report may be provided by SpareBank 1 Capital Markets to a U.S. recipient (a “SpareBank 1 Capital Markets U.S. recipient”), in which case each such SpareBank 1 Capital Markets U.S. recipient of this report represents and agrees, by virtue of its acceptance thereof, that it is “major U.S. institutional investor” (as such term is defined in section (b)(4) of Rule 15a-6), or that it is a U.S. institutional investor (as such term is defined in section (b)(7) of Rule 15a-6), and that it understands the risks involved in executing transactions in such securities. In such cases, SpareBank 1 Capital Markets accepts responsibility for the content of this report; however, although it has accepted responsibility for the content of this report in such cases, SpareBank 1 Capital Markets did not contribute to the preparation of this report, and the specific authors of the report are not employed by, and are not associated persons of, SpareBank 1 Capital Markets. The SpareBank 1 Markets entity that prepared the report, and the authors of this report, may not be subject to all of the registration, qualification, disclosure, independence and other U.S. regulatory requirements that apply to SpareBank 1 Capital Markets and its employees and associated persons. Any SpareBank 1 Capital Markets U.S. recipient of this report that wishes to discuss or receive additional information regarding any security or issuer mentioned herein, or to engage in any transaction to purchase or sell or solicit or offer the purchase or sale of such securities, should contact a registered representative of SpareBank 1 Capital Markets.
19/09/2014 23
Disclaimer Any transaction in the securities discussed in this report by U.S. persons (other than a registered U.S. broker-dealer or bank acting in a broker-dealer capacity) must be effected with or through SpareBank 1 Capital Markets.
The securities referred to in this report may not be registered under the U.S. Securities Act of 1933, as amended, and the issuer of such securities may not be subject to U.S. reporting and/or other requirements. Available information regarding the issuers of such securities may be limited, and such issuers may not be subject to the same auditing and reporting standards as U.S. issuers.
Such information is provided for informational purposes only and does not constitute a solicitation to buy or an offer to sell any securities under the Securities Act of 1933, as amended, or under any other U.S. federal or state securities laws, rules or regulations. The investment opportunities discussed in this report may be unsuitable for certain investors depending on their specific investment objectives, risk tolerance and financial position. In jurisdictions where SpareBank 1 Capital Markets is not registered or licensed to trade in securities, commodities or other financial products, transactions may be executed only in accordance with applicable law and legislation, which may vary from jurisdiction to jurisdiction and which may require that a transaction be made in accordance with applicable exemptions from registration or licensing requirements.
The information in this publication is based on carefully selected sources believed to be reliable, but SpareBank 1 Capital Markets does not make any representation with respect to its completeness or accuracy. All opinions expressed herein reflect the author’s judgment at the original time of publication, without regard to the date on which you may receive such information, and are subject to change without notice.
The information contained herein may include forward-looking statements as described above within the meaning of U.S. federal securities laws that are subject to risks and uncertainties. Factors that could cause a company’s actual results and financial condition to differ from expectations include, without limitation: political uncertainty, changes in general economic conditions that adversely affect the level of demand for the company’s products or services, changes in foreign exchange markets, changes in international and domestic financial markets and in the competitive environment, and other factors relating to the foregoing. All forward-looking statements contained in this report are qualified in their entirety by this cautionary statement.
19/09/2014 24