24
DNV GL © 2016 02 April 2016 SAFER, SMARTER, GREENER DNV GL © 2016 OIL & GAS Offshore Pipeline Outlook 1 Asle Venas Global Director Pipelines DNV GL

DNV GL © 2016
Ungraded
02 April 2016 SAFER, SMARTER, GREENER DNV GL © 2016
Ungraded
OIL & GAS
Offshore Pipeline Outlook
1
Asle Venas
Asle Venas
Global Director Pipelines
DNV GL

DNV GL © 2016
Ungraded
02 April 2016
Onshore and Offshore (Pipeline and Gas Journal)
3
191901 189829 186939
150520 160182
151568
0 0 0
50000
100000
150000
200000
250000
2011 2012 2013 2014 2015 2016 2017 2018
K
M
o
f
p
i
p
e
l
i
n
e
s
Year
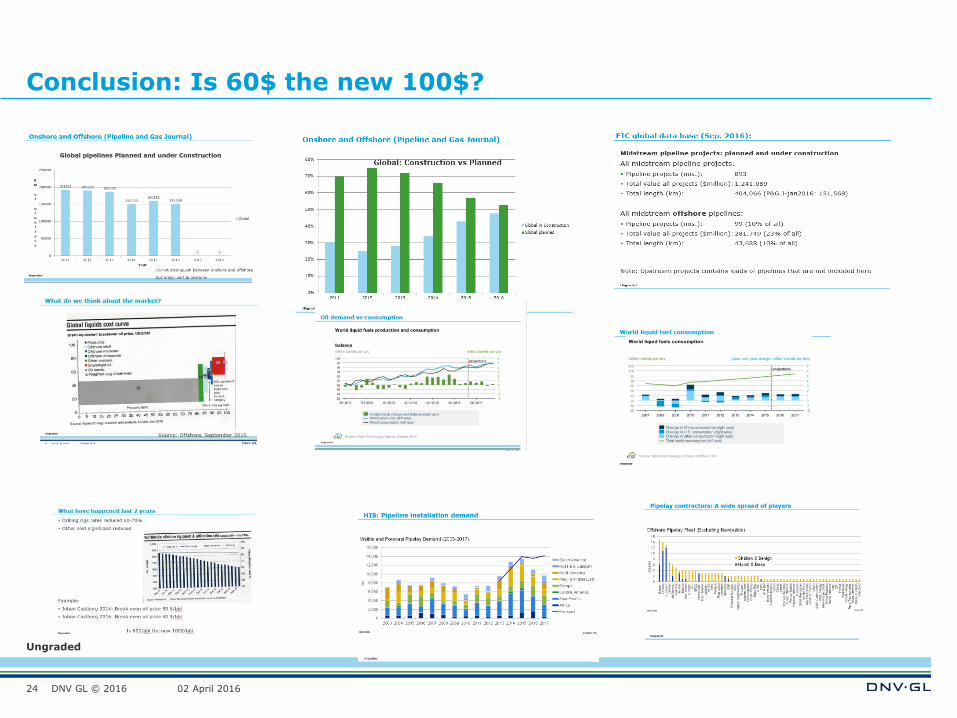
Global pipelines Planned and under Construction
Global
Do not distinguish between onshore and offshore
But major part is onshore
DNV GL © 2016
Ungraded
02 April 2016
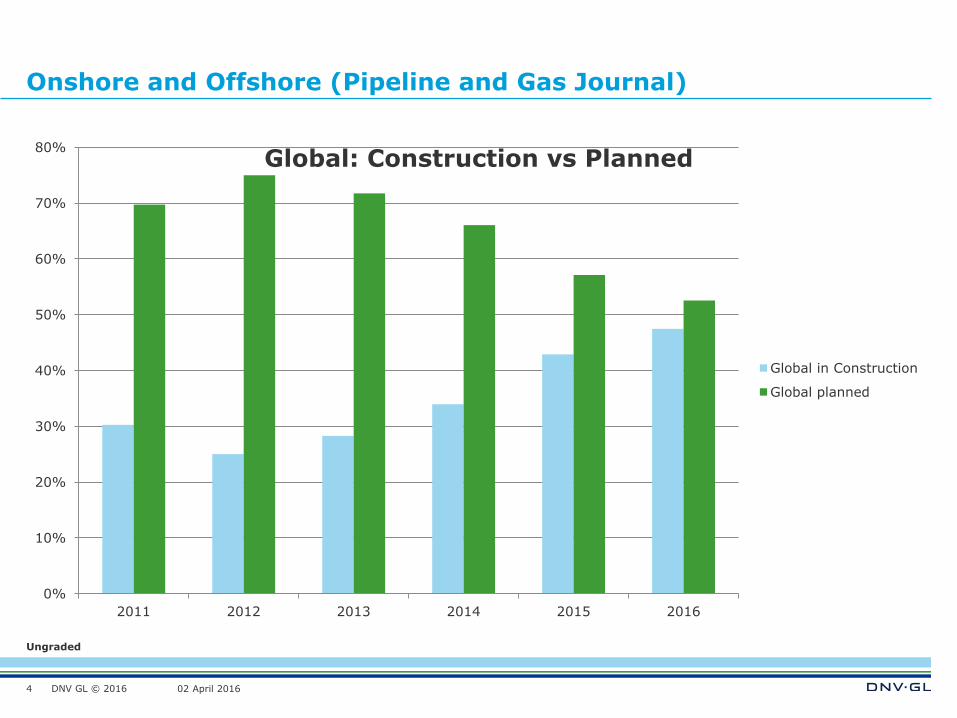
Onshore and Offshore (Pipeline and Gas Journal)
4
0%
10%
20%
30%
40%
50%
60%
70%
80%
2011 2012 2013 2014 2015 2016
Global: Construction vs Planned
Global in Construction
Global planned

DNV GL © 2016
Ungraded
02 April 2016
Onshore and Offshore (Pipeline and Gas Journal)
5
0
10000
20000
30000
40000
50000
60000
70000
80000
2011 2012 2013 2014 2015 2016
Global trends per region
North America
Asia Pacific
South America
Eastern Europe
Africa
Middle East
Western Europe

DNV GL © 2016
Ungraded
02 April 2016
EIC global data base (Sep. 2016):
Midstream pipeline projects: planned and under construction
All midstream pipeline projects:
Pipeline projects (nos.): 893
Total value all projects ($million): 1,241,089
Total length (km): 404,066 (P&G J-jan2016: 151,568)
All midstream offshore pipelines:
Pipeline projects (nos.): 99 (10% of all)
Total value all projects ($million): 281,749 (23% of all)
Total length (km): 43,688 (10% of all)
6
Note: Upstream projects contains loads of pipelines that are not included here

DNV GL © 2016
Ungraded
02 April 2016
EIC - Offshore pipelines - North and South America
Major offshore midstream pipeline projects: 25
Total value: 14,200 $million
Total length: 4,189 Km
Examples:
South Texas - Tuxpan Subsea Natural Gas
Pipeline
Eastern Caribbean Gas Pipeline Network
(Caricom Pipeline)
7
DNV GL © 2016
Ungraded
02 April 2016
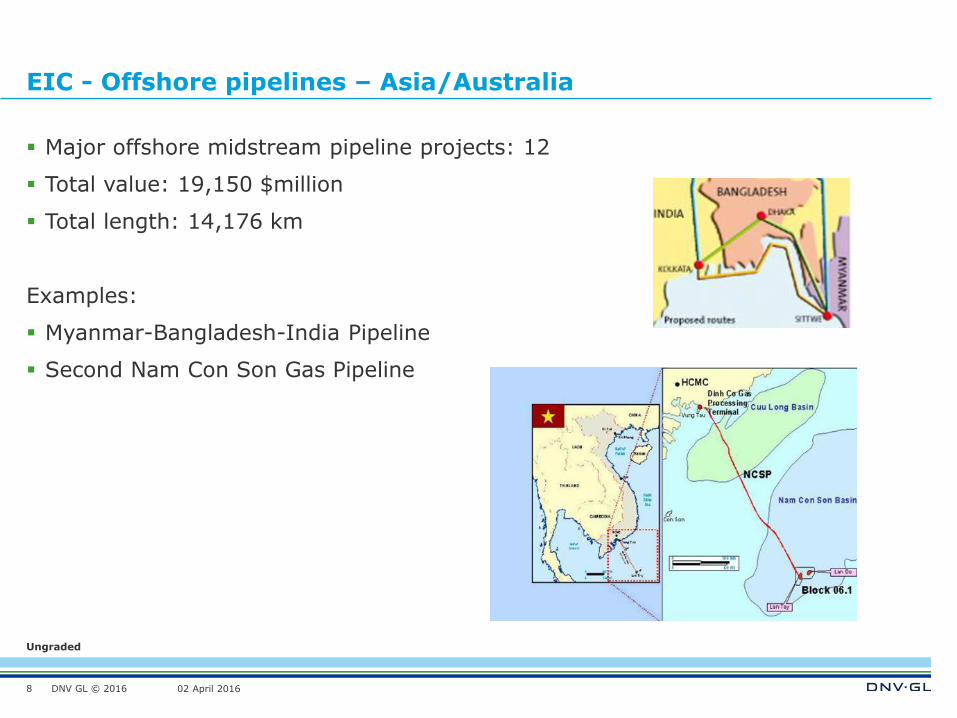
EIC - Offshore pipelines – Asia/Australia
Major offshore midstream pipeline projects: 12
Total value: 19,150 $million
Total length: 14,176 km
Examples:
Myanmar-Bangladesh-India Pipeline
Second Nam Con Son Gas Pipeline
8
DNV GL © 2016
Ungraded
02 April 2016
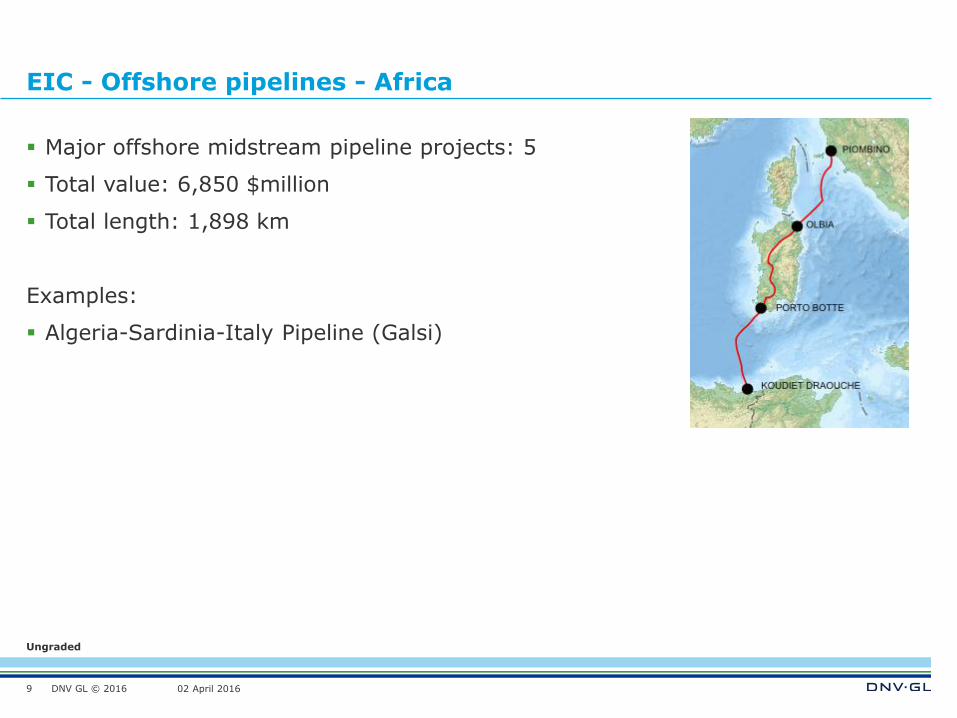
EIC - Offshore pipelines - Africa
Major offshore midstream pipeline projects: 5
Total value: 6,850 $million
Total length: 1,898 km
Examples:
Algeria-Sardinia-Italy Pipeline (Galsi)
9

DNV GL © 2016
Ungraded
02 April 2016
EIC - Offshore pipelines - Europe
Major offshore midstream pipeline projects: 17
Total value: 21,931 $million
Total length: 8,442
Examples:
Johan Sverdrup Oil Export
Trans Adriatic Pipeline
10

DNV GL © 2016
Ungraded
02 April 2016
EIC - Offshore pipelines – Indian sub-continent
Major offshore midstream pipeline projects: 9
Total value: 5,431 $million
Total length: 1,220
Examples:
Colombo - Kolonnawa Oil Pipeline
Kochi-Kayamkulam Subsea Pipeline
11

DNV GL © 2016
Ungraded
02 April 2016
EIC - Offshore pipelines – Middle East
Major offshore midstream pipeline projects: 15
Total value: 25,395 $million
Total length: 6449
Examples:
Iran to Oman Gas Pipeline
Middle East to India Deepwater Gas Pipeline
(SAGE)
12
DNV GL © 2016
Ungraded
02 April 2016
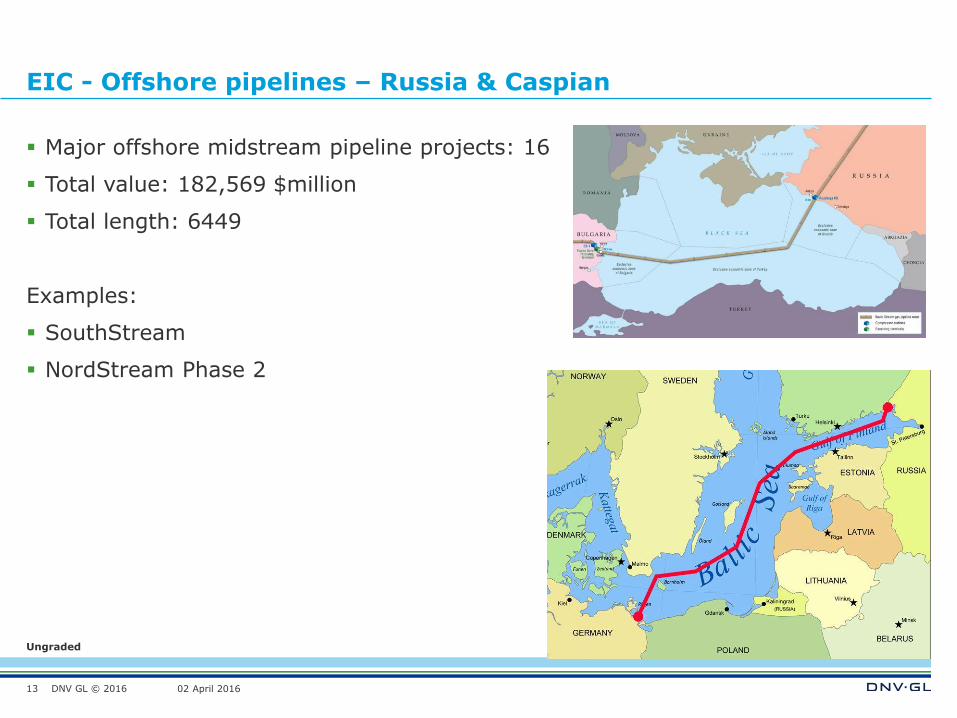
EIC - Offshore pipelines – Russia & Caspian
Major offshore midstream pipeline projects: 16
Total value: 182,569 $million
Total length: 6449
Examples:
SouthStream
NordStream Phase 2
13

DNV GL © 2016
Ungraded
02 April 2016
What can affect future activity
14
DNV GL © 2016
Ungraded
02 April 2016
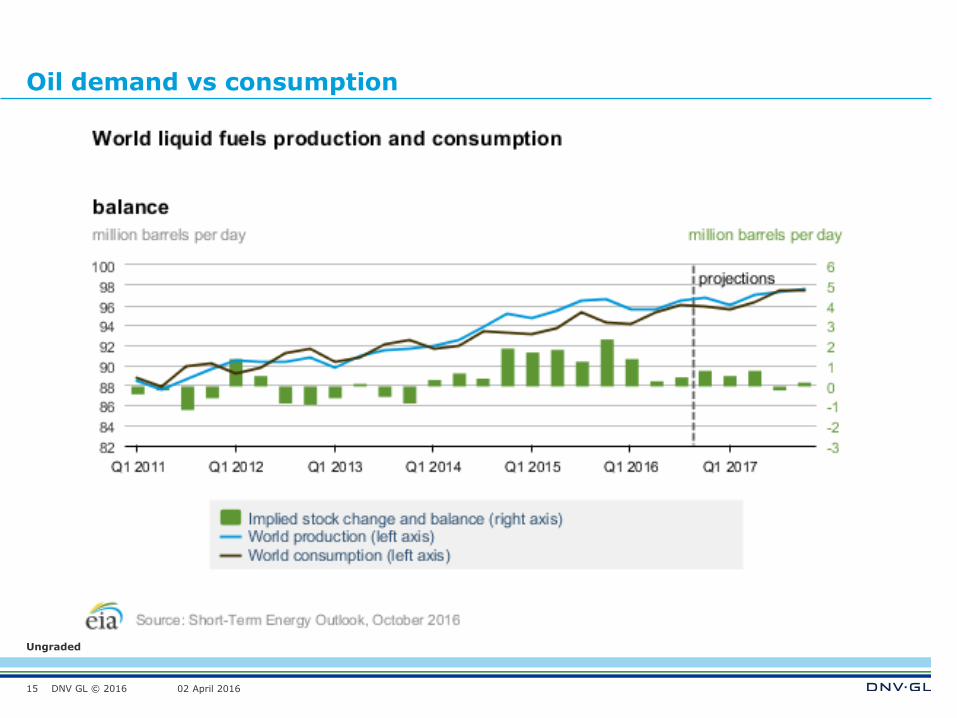
Oil demand vs consumption
15

DNV GL © 2016
Ungraded
02 April 2016
World liquid fuel consumption
16
DNV GL © 2016
Ungraded
02 April 2016
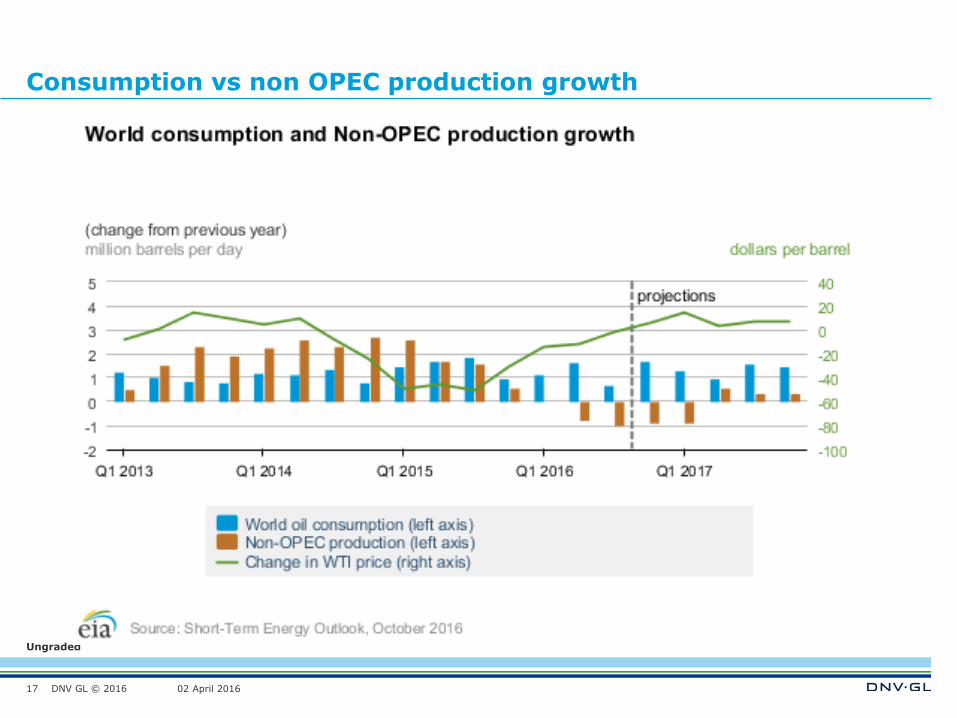
Consumption vs non OPEC production growth
17
DNV GL © 2016
Ungraded
02 April 2016
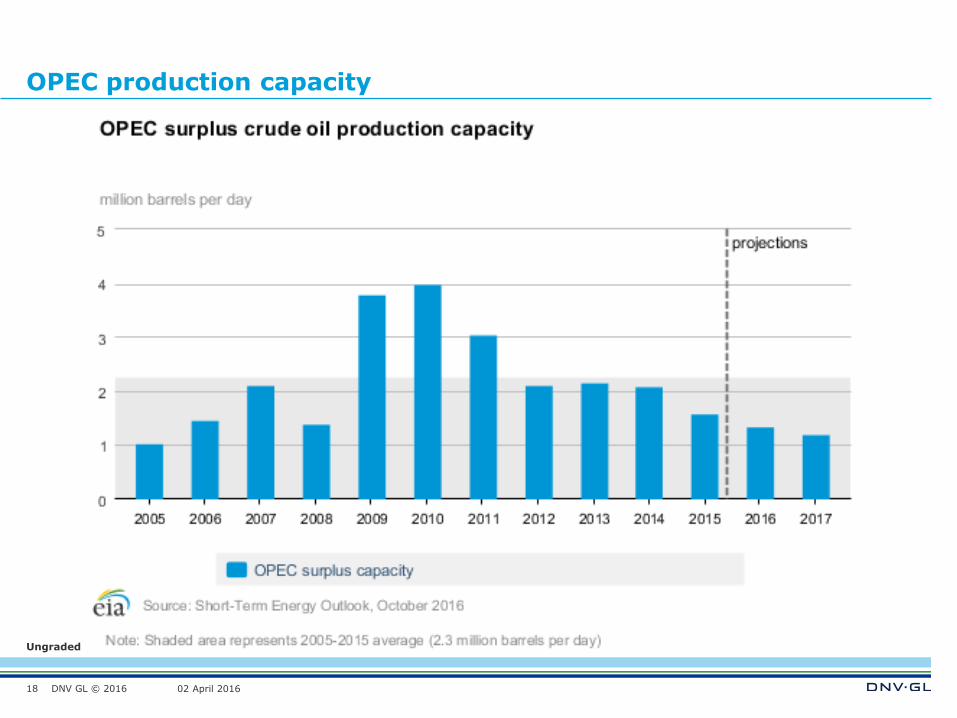
OPEC production capacity
18

DNV GL © 2016
Ungraded
02 April 2016
Where is the oil price going?
19
Source: Offshore, September 2016

DNV GL © 2016
Ungraded
02 April 2016
What have happened last 2 years
Drilling rigs rates reduced 60-70%
Other cost significant reduced
Example:
Johan Castberg 2014: Break even oil price 80 $/bbl
Johan Castberg 2016: Break even oil price 40 $/bbl
20
Is 60$/bbl the new 100$/bbl
DNV GL © 2016
Ungraded
02 April 2016
21
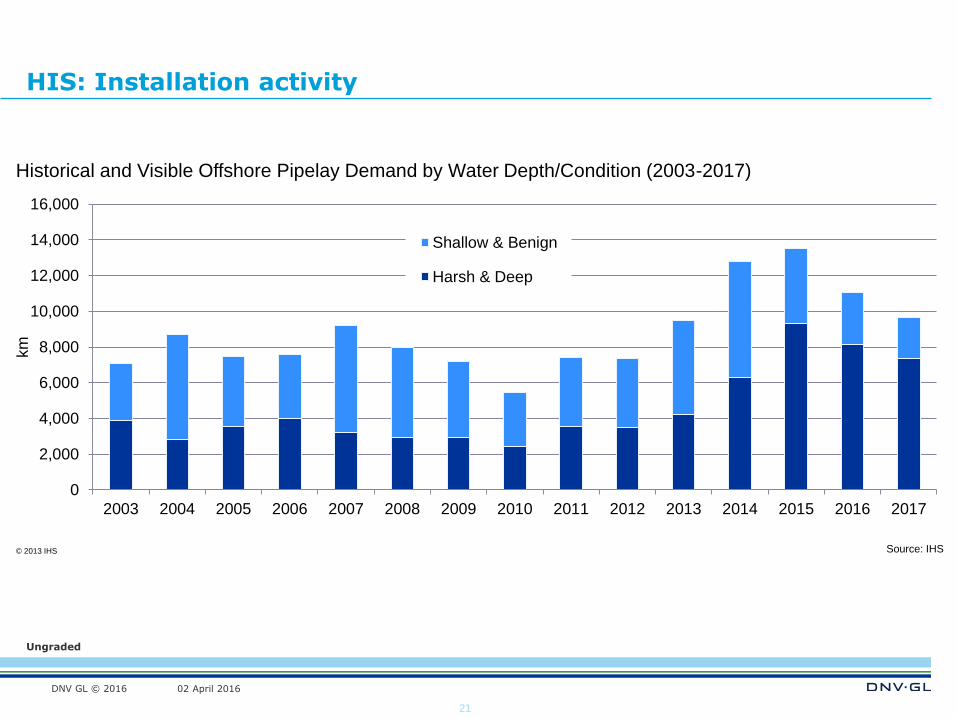
HIS: Installation activity
0
2,000
4,000
6,000
8,000
10,000
12,000
14,000
16,000
2003 2004 2005 2006 2007 2008 2009 2010 2011 2012 2013 2014 2015 2016 2017
km
Historical and Visible Offshore Pipelay Demand by Water Depth/Condition (2003-2017)
Shallow & Benign
Harsh & Deep
© 2013 IHS Source: IHS
DNV GL © 2016
Ungraded
02 April 2016
22
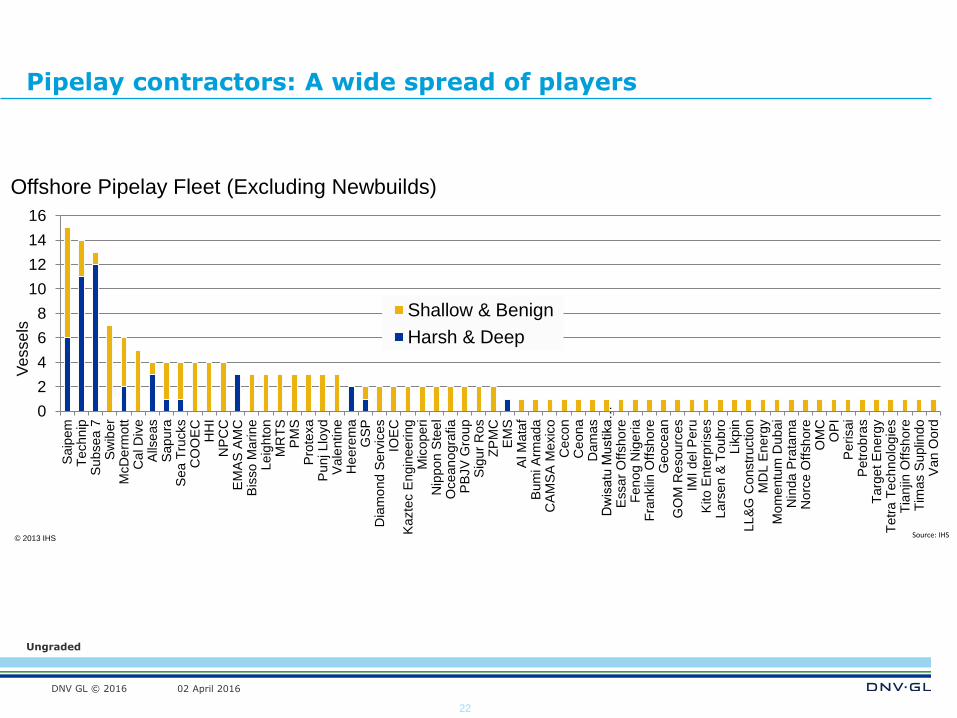
Pipelay contractors: A wide spread of players
0
2
4
6
8
10
12
14
16
Saip
em
Techn
ipS
ubsea
7S
wib
er
McD
erm
ott
Ca
l D
ive
Alls
eas
Sapu
raS
ea T
rucks
CO
OE
CH
HI
NP
CC
EM
AS
AM
CB
isso
Ma
rine
Le
ighto
nM
RT
SP
MS
Pro
texa
Punj Llo
yd
Vale
ntine
He
ere
ma
GS
PD
iam
ond S
erv
ices
IOE
CK
azte
c E
ngin
ee
ring
Mic
ope
riN
ippo
n S
tee
lO
cean
ogra
fia
PB
JV
Gro
up
Sig
ur
Ros
ZP
MC
EM
SA
l M
ata
fB
um
i A
rmada
CA
MS
A M
exic
oC
eco
nC
eona
Da
mas
Dw
isatu
Mustika
…E
ssar
Offsho
reF
en
og N
ige
ria
Fra
nklin
Off
sh
ore
Geo
ce
an
GO
M R
eso
urc
es
IMI de
l P
eru
Kito
En
terp
rise
sLa
rsen
& T
oub
roLik
pin
LL
&G
Co
nstr
uctio
nM
DL E
nerg
yM
om
entu
m D
ub
ai
Nin
da
Pra
tam
aN
orc
e O
ffsh
ore
OM
CO
PI
Perisai
Petr
ob
ras
Ta
rge
t E
nerg
yT
etr
a T
echno
log
ies
Tia
njin
Off
sh
ore
Tim
as S
uplin
do
Van O
ord
Vesse
ls
Offshore Pipelay Fleet (Excluding Newbuilds)
Shallow & Benign
Harsh & Deep
© 2013 IHS Source: IHS

DNV GL © 2016
Ungraded
02 April 2016
23
…although newbuilds will change the picture
0
2
4
6
8
10
12
14
16
18
20
Te
ch
nip
Su
bse
a 7
Sa
pu
ra
Sa
ipe
m
Alls
eas
EM
AS
AM
C
McD
erm
ott
Ce
co
n
He
ere
ma
EM
S
GS
P
Se
a T
rucks
Ce
ona
DO
F S
ub
se
a
Oce
an
Insta
ller
Rie
be
r
Ve
sse
ls
Harsh & Deep Pipelay Fleet (Including Newbuilds)
© 2013 IHS Source: IHS
DNV GL © 2016
Ungraded
02 April 2016
Conclusion: Is 60$ the new 100$?
24
DNV GL © 2016
Ungraded
02 April 2016
SAFER, SMARTER, GREENER
www.dnvgl.com
END
25
Asle Venås
+47-93605054


