37
• ---- • ---- • ---- < Previous Next > Ofwat SIM Survey 2014/15 Annual Report Helen Wilkinson Matt Counsell February 2015 J2668
| Date post: | 11-Apr-2018 |
| Category: |
Documents |
| Upload: | trannguyet |
| View: | 216 times |
| Download: | 1 times |

• ---- • ---- • ----
< Previous Next >
Ofwat SIM Survey 2014/15 Annual Report
Helen Wilkinson
Matt Counsell February 2015
J2668

• ---- • ---- • ----
< Previous Next >
2
Background and Objectives
There are currently 18 water companies operating in England and Wales; these companies are regulated by the Water Services Regulation Authority (Ofwat), whose job is to ensure the industry provides a good quality service at a fair price.
Robust data is needed on an annual basis to explore consumers' views on their direct contact with their water company.
Ofwat introduced the Service Incentive Mechanism (SIM) in 2010 as a way of encouraging water companies to improve their customer service. Following PR14, the adopted approach changed somewhat, as indicated on the following slide.
However, the overall objective of the research remains the same:- to provide a robust comparable measure of consumers' experience and how satisfied they are with the overall handling of an actual recent contact with their water or sewerage supplier.
The research explores:
• How consumers initially contacted the water company (telephone, email, letter, website etc.);
• The reason for them making contact with the water company;
• How satisfied consumers were with their water company’s overall handling of their contact;
• Reasons why they were satisfied or not and what the water company could have done better; and
• Comparing consumers’ experience of contacting their water company to recent experience contacting other sectors.
Combined data for 2015-16 to 2018-19 will be used to support Ofwat's decisions on financial incentives in 2019.

• ---- • ---- • ----
< Previous Next >
3
Changes to the Approach
An industry-wide consultation on modifications to the original measure took place between October 2013 and January 2014.
The current 2014/15 research was a pilot study designed to test the following changes to the established approach:
• Revised questionnaire: A shorter more focussed questionnaire was developed
• Excluding non-households: Non-households are now screened out during the survey and NOT by companies. Therefore the survey sample should contain all contacts from all consumers
• Surveying from all contacts received regardless of whether resolved or not: After processing the sample is sorted by date. Surveying then proceeds from the oldest date and all companies are surveyed simultaneously. Previously the SIM survey focused on resolved contacts only.
• No notice given for the survey: On a Monday, companies will be requested to provide details of all the contacts received during the previous seven days (or 2-4 weeks if this will provide insufficient sample). Sample is required by 5pm the next day
The efficacy of screening out non-households during the survey is also considered by comparing contactee responses to water company information.

• ---- • ---- • ----
< Previous Next >
4
Per Company Per annum (800)
Per wave (200)
Water & Sewerage Companies (WASCs)
Billing 267 66/67
Water Service Operations
267 66/67
Waste Water Service Operations
266 66/67
Water Only Companies (WOCs)
Billing 400 100
Water Service Operations
400 100
Sample Design and Structure
The vast majority of water company enquiries are billing related. However, the survey sample is split evenly between Billing and respective Operational contacts, ensuring that all contact types are treated with equal importance.
For the purpose of comparing overall satisfaction between companies, water and sewerage company (WASC) data is weighted to 50% Billing/25% water operations/25% Waste Water operations. Water only company (WOC) data is weighted 50% billing/50% water operations.
Direct comparisons can be made between companies with regard to billing and respective operational results.

• ---- • ---- • ----
< Previous Next >
5
Sampling Principles
The samples from each of the 18 water companies should be comparable:-
• Samples should be drawn from the same time period, to minimise any risk of any seasonal or short-term factors (fluctuating demand or weather)
Ideally, each wave’s sample should be based on a single week’s worth of contacts.
However, many of the smaller companies (and a few of the bigger companies) include up to 4 weeks’ worth of contacts to provide sufficient volume in each category:
• This applied to Bournemouth, Dee Valley, Portsmouth and Sutton and East Surrey Water on some waves.
• Nevertheless, sufficient sample information was provided to provide an annual sample size of at least 658 interviews which remains robust, with results accurate to ±3.8% (as opposed to ±3.5% ).
Fieldwork is completed within a tight timescale following query resolution. A short timescale keeps the issue fresh in the consumer’s mind.
All customer contacts from the sampling period, whether resolved or not, are included (i.e. contacts by telephone, online, in writing and by visit) to provide a representative view of the customer experience.

• ---- • ---- • ----
< Previous Next >
6
Sample Management
The minimum information requirement was telephone number and reason for contact, with contact name and domestic/commercial flag highly desirable. The following sample management process is followed:-
Data files merged
Sample files de-duplicated
1 in n sample procedure
Missing data tele-matching
Sample files de-duplicated
Companies can provide up to 10 separate data files
De-duplicate on both telephone and account numbers. Other unusable records removed
Ensures a representative sample is extracted for the survey (in terms of contact channel etc.)
Maximises representativeness of the sample
Tele-matched telephone numbers may be duplicates of those already in sample

• ---- • ---- • ----
< Previous Next >
7
Fieldwork
Research was carried out using CATI, from McCallum Layton’s Telephone Unit in Leeds.
Each water company’s interviews were undertaken by multiple interviewers to reduce the possibility of interviewer bias.
Industry comparison questions were asked in Wave 1 to contrast perceptions of the water industry to other, similar service providers.
Demographic and socio-economic questions were asked in Wave 4. While the sample was broadly representative of the UK as a whole, younger age-groups were slightly under-represented compared to older age groups.
The interview averages 7 minutes in length (across all four waves, including the longer surveys in Waves 1 and 4 as described above).
Key dates for each wave in 2014/15 are below:-
Wave Sampling Week Fieldwork Dates
Wave 1 2014/15
15th – 21st September 2014
24th September – 8th October 2014
Wave 2 2014/15
13th – 19th October 2014
23rd October – 10th November 2014
Wave 3 2014/15
17th – 23rd November 2014
27th November – 16th December 2014
Wave 4 2014/15
5th – 11th January 2015
15th January – 3rd February 2015
Companies with limited sample may have had a sampling period beginning up to 4 weeks earlier than the stated sampling week.

• ---- • ---- • ----
< Previous Next >
8
Performance Indicator and Weighting
The survey produces a single comparable performance indicator (Q8) based on customers’ overall satisfaction with their experience.
A mean score is reported between 1 and 5, where 1 means ‘very dissatisfied’ and 5 means ‘very satisfied’
As previously mentioned, to enable comparisons of results between companies, WASC data is weighted to 50% billing/25% water operations/25% Waste Water operations.
Additional weighting is required for Bristol Water and Wessex Water as both companies’ billing enquiries are handled by the same call centre. In total, 167 billing interviews are obtained from customers contacting this call centre each quarter.
800 interviews
per company pa
Per Company pa Unweighted
base Weighted
base
Water And Sewerage Companies
Billing 267 400
Water service operational 267 200
Waste Water service operational
266 200
Water Only Companies
Billing 400 400
Water service operational 400 400

• ---- • ---- • ----
< Previous Next >
9
Total Interviews Completed 2014/15
At the 95% confidence level, these sample sizes provide overall levels of accuracy for individual percentages of at least:
14,400: ± 0.82%
800: ±3.5%
267: ±6.0%
200: ±6.9%
For significant differences between subgroups, the following thresholds apply at the 95% confidence level:
14,400 vs 14,400: ± 1.2%
800 vs 800: ±4.9%
267 vs 267: ±8.5%
267 vs 200: ±9.2%
200 vs 200: ±9.8%
Total Number of Interviews Completed in 2014/15
Affinity Water 800
Anglian Water 800
Bournemouth Water 699
Bristol Water 1,080†
Dee Valley Water 658
Northumbrian Water 800
Portsmouth Water 750
Severn Trent Water 800
South East Water 800
South Staffs Water 800
South West Water 800
Southern Water 802
Sutton & East Surrey Water 777
Thames Water 800
United Utilities Water 800
Welsh Water 800
Wessex Water 1,216†
Yorkshire Water 800
Total 14,102
†NB The same Bristol/Wessex shared billing interviews appear next to both Bristol and Wessex in the table, however these are counted only once for the overall total.

• ---- • ---- • ----
< Previous Next >
10
Sample Quality

• ---- • ---- • ----
< Previous Next >
Total Number of Individual Records Sent
WASC Records Received
Sample received Excl. Duplicates
Thames 371,518 281,112
Severn Trent 223,623 189,697
United Utilities 253,632 179,814
Yorkshire 182,960 144,397
Anglian 144,513 133,153
Southern 134,155 122,618
Northumbrian 108,271 96,931
South West 102,579 85,769
Wessex* 92,461 79,037
Welsh 87,857 73,553
Total number of contacts sent by each company.
*Bristol and Wessex Billing contacts are all shown in both Bristol and Wessex sample figures.
WOC Records Received
Sample received Excl. Duplicates
Affinity 121,345 92,244
Bristol* 94,238 79,823
South East 81,584 62,840
South Staffs 49,673 44,325
Sutton and East Surrey 18,517 16,941
Bournemouth 15,528 13,167
Portsmouth 14,972 13,579
Dee Valley 11,238 9,842

• ---- • ---- • ----
< Previous Next >
12
18%
24%
8%
15% 15% 12%
10% 9%
15%
23%
11%
16%
9% 9%
24%
29%
16% 15%
21%
Proportion of Duplicates in Sample
United Utilities had the highest proportion of duplicate records in the sample provided in 2014/15 while Anglian Water had the lowest.
Duplicate records are not necessarily a sign of poor quality data, they may simply be a by-product of the way in which some systems are configured.
Figures indicate % of duplicate records in the sample prior to tele-matching

• ---- • ---- • ----
< Previous Next >
13
15% 17%
9% 12% 10%
12% 11%
23%
8% 7%
12%
17%
11%
28%
16%
8%
23%
12%
25%
Proportion Sent for Number Matching
The proportion of records without a useable telephone number indicates the quality of sample and how up-to-date company records are.
Sutton and East Surrey Water samples had the highest proportion that had to be sent for number matching as telephone numbers were not present or incomplete.
South East Water’s sample contained the highest proportion of valid telephone numbers.
Figures indicate % of records without useable telephone number.

• ---- • ---- • ----
< Previous Next >
14
7%
5% 6%
8%
6%
8%
4%
9%
6% 6% 6% 7% 7%
12%
5%
8% 6%
3%
6%
Proportion of Unobtainable Numbers
Sutton and East Surrey Water’s sample also contained the highest proportion of unobtainable numbers, while Wessex Water’s contained the lowest.
Figures indicate % of unobtainable records in loaded sample; those records that visually appear correct but are not in service when dialled. This indicates how up-to-date and accurate customer records are.

• ---- • ---- • ----
< Previous Next >
15
80% 80%
86%
82%
85%
82%
86%
71%
87% 88%
84%
78%
84%
68%
80%
85%
73%
86%
72%
Total Proportion of Useable Records
Figures indicate % of useable records (excluding duplicates) after removing those without telephone numbers that cannot be tele-matched and unobtainable numbers. The higher the figure, the more representative the sample is.
The proportion of useable records across the industry was in line with previous years. South East Water had the highest proportion of useable records in the sample and Sutton and East Surrey the lowest.

• ---- • ---- • ----
< Previous Next >
16
1.8% 2.4%
4.0%
2.3% 2.5%
0.7%
3.2%
1.7% 2.2% 2.3%
2.8%
1.2% 0.0%
5.0%
2.7% 1.7%
Proportion of interviews where contact flagged as ‘business’ but were domestic
As a proportion of the overall interviews conducted, Welsh Water had the highest percentage of interviews where the contact was flagged as ‘business’ but the customer defined themselves as ‘domestic’ (5%), followed by Bristol Water (4%).
Anglian Water and Thames Water do not flag their sample as either business or domestic, therefore we cannot ascertain the accuracy of their classification.
No data for Anglian Water or Thames Water Total number of interviews in brackets

• ---- • ---- • ----
< Previous Next >
17
8% 7%
9%
6%
8%
6% 5% 4%
5% 4%
10%
3% 4% 4%
7% 7%
Percentage of contacts flagged as ‘domestic’ that were business (i.e. were screened out)
Southern Water had the highest proportion of contacts who were flagged as ‘domestic’ but who were screened out because they described themselves as ‘business’ customers.
Anglian Water and Thames Water do not flag their sample as business or domestic, therefore we cannot ascertain the accuracy of their classification.
No data for Anglian Water or Thames Water

• ---- • ---- • ----
< Previous Next >
18
Industry Key Annual Results

• ---- • ---- • ----
< Previous Next >
19
Notes To Charts
In the following charts, significant differences in results are indicated by a letter next to the higher of the figures being compared corresponding to the letter in the column description.
For example, on Page 20, the letters ‘h’ and ‘i’ next to the result for Billing signifies that customers contacting their water company with Billing queries are on average significantly more satisfied than those with a Clean water query (column labelled ‘h’) or a Waste Water query (column labelled ‘i’).
The first three charts indicate weighted overall satisfaction scores (to allow a direct comparison between WOCs and WASCs). The remaining results are unweighted.

• ---- • ---- • ----
< Previous Next >
20
Overall Satisfaction (Q8 – Weighted)
WOCs performed significantly better than WASCs overall. Customers tended to be significantly more satisfied with the handling of Billing enquiries than either Clean or Waste Water queries. Those who contacted their water company online were much more positive than those using other means.
4.24 4.22 4.26a 4.25
4.19 4.22
4.29de
4.36hi
4.11 4.14
4.24k
3.93
4.15
4.38jkl
Industry(14086)
WASC(8002)
(a)
WOC(6084)
(b)
Sep 14(3499)
(c)
Oct 14(3529)
(d)
Nov 14(3558)
(e)
Jan 14(3500)
(f)
Billing(7043)
(g)
Water(5042)
(h)
Waste(2001)
(i)
Phone(12795)
(j)
Letter(141)
(k)
Email(372)
(l)
Online(523)(m)
Company Type Survey Wave Contact Type Initial Comms Channel
Satisfaction Mean Score out of 5, where 5 = very satisfied Unweighted Data. Base sizes in brackets

• ---- • ---- • ----
< Previous Next >
21
Overall Satisfaction (Q8 – Weighted)
Unsurprisingly, customers were significantly more likely to be satisfied if their query was resolved or was not considered to be a complaint. The length of time that had elapsed between the initial contact and the date of interviewing had no bearing on overall satisfaction levels, which means that water companies who need to supply more than a week’s worth of sample records are neither advantaged nor disadvantaged by this.
4.24
4.60b
2.95
3.17
4.42c
4.23 4.25 4.25 4.21
Industry(14086)
Yes(10711)
(a)
No(2982)
(b)
Yes(2043)
(c)
No(11949)
(d)
Up to 7days(738)
(e)
8-14 days(6554)
(f)
15-21 days(4128)
(g)
More than21 days(2666)
(h)Resolved Complaint Lapsed Time
Satisfaction Mean Score out of 5, where 5 = very satisfied Unweighted Data. Base sizes in brackets

• ---- • ---- • ----
< Previous Next >
22
4.48 4.45
4.40 4.40 4.39
4.36 4.36
4.34 4.33
4.28 4.24
4.21 4.18
4.13 4.02
3.94 3.94
3.88
Portsmouth WaterWessex Water
Northumbrian WaterWelsh Water
Bournemouth WaterSevern Trent Water
Yorkshire WaterDee Valley Water
South Staffs WaterBristol Water
United Utilities WaterAnglian WaterAffinity Water
Sutton & ES WaterSouth East Water
South West WaterThames Water
Southern Water
Satisfaction by Company (Q8 – Weighted Data)
Portsmouth Water achieved the highest overall satisfaction score, significantly above the industry average of 4.24.
WASCs made up three of the top five companies in 2014/15.
WASC
WOC
Rank
1
2
3
3
5
6
6
8
9
10
11
12
13
14
15
16
16
18
Weighted base: 14,086
Average 4.24

• ---- • ---- • ----
< Previous Next >
23
Satisfaction by Company (Q8 - Weighted Data)
Weighted scores for each company for the four waves in 2014/15 are shown below.
†Confidence intervals are calculated at the 95% confidence level
Company Q8 Confidence Interval Rank Significant Difference
Portsmouth Water 4.48 +/- 0.07 1 Significantly above industry average
Wessex Water 4.45 +/- 0.06 2 Significantly above industry average
Northumbrian Water 4.40 +/- 0.08 3 Significantly above industry average
Welsh Water 4.40 +/- 0.08 3 Significantly above industry average
Bournemouth Water 4.39 +/- 0.08 5 Significantly above industry average
Severn Trent Water 4.36 +/- 0.08 6 Significantly above industry average
Yorkshire Water 4.36 +/- 0.08 6 Significantly above industry average
Dee Valley Water 4.34 +/- 0.08 8 Significantly above industry average
South Staffs Water 4.33 +/- 0.08 9 Significantly above industry average
Bristol Water 4.28 +/- 0.07 10
United Utilities Water 4.24 +/- 0.08 11 In line with industry average
Industry average 4.24 +/- 0.02
Anglian Water 4.21 +/- 0.09 12
Affinity Water 4.18 +/- 0.08 13
Sutton & ES Water 4.13 +/- 0.08 14 Significantly below industry average
South East Water 4.02 +/- 0.09 15 Significantly below industry average
South West Water 3.94 +/- 0.10 16 Significantly below industry average
Thames Water 3.94 +/- 0.09 16 Significantly below industry average
Southern Water 3.88 +/- 0.09 18 Significantly below industry average
• ---- • ---- • ----
< Previous Next >
24
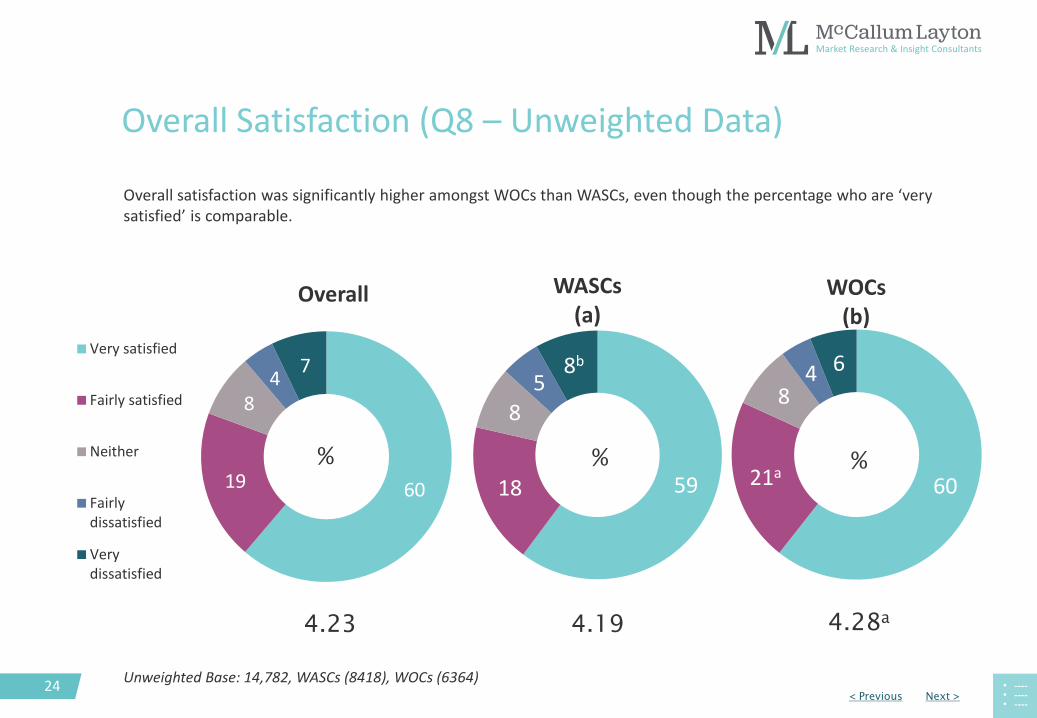
Overall Satisfaction (Q8 – Unweighted Data)
Overall satisfaction was significantly higher amongst WOCs than WASCs, even though the percentage who are ‘very satisfied’ is comparable.
59 18
8 5
8b
WASCs (a)
60 21a
8 4 6
WOCs (b)
60 19
8 4
7
Overall
Very satisfied
Fairly satisfied
Neither
Fairlydissatisfied
Verydissatisfied
% % %
4.23 4.19 4.28a
Unweighted Base: 14,782, WASCs (8418), WOCs (6364)

• ---- • ---- • ----
< Previous Next >
25
Overall Satisfaction (Q8 Unweighted Data)
Customers were significantly more likely to be satisfied with their Billing queries than their Clean Water or Waste Water queries.
Customers with Waste Water queries were significantly more likely to say they were ‘very satisfied’ than those with Clean Water queries.
54
21c
9a
6a 8a
Water (b)
61b 14
8a
5a 10ab
Waste (c)
64bc
20c
7 3 5
Billing (a)
Very satisfied
Fairly satisfied
Neither
Fairlydissatisfied
Verydissatisfied
4.37bc
4.09 4.14
% % %
Unweighted Base: Billing (6744), Water (5384), Waste (2654)

• ---- • ---- • ----
< Previous Next >
26
Reason for Contact
The ten most common reasons for contact are detailed below, grouped into Billing, Clean Water and Waste Water reasons for contact.
Contact regarding a change of address was the primary reason given by customers overall, stated by 11%, followed by a blockage in the sewer/drains, mentioned by 9% of customers. Customers contacting their water company about a move or to make a payment were generally most satisfied.
Number of Respondents
Proportion of Respondents
Proportion Satisfied
Due to a recent move, or planning to move 1647 11% 90%
To make a payment 1199 8% 92%
A query about a bill 695 5% 79%
Because of a water leak/burst on my property 781 5% 72%
Because of a water leak/burst on the road 776 5% 74%
No supply/water gone off 769 5% 83%
About defective/dangerous water equipment (stop taps, manhole covers, hydrants, raised/sunken chambers)
648 4% 75%
Regarding low pressure of tap water 611 4% 77%
About a blockage in the sewer/drains 1316 9% 86%
About flooding with sewage or foul water 537 4% 62%
Unweighted Data
Billing
Water
Waste

• ---- • ---- • ----
< Previous Next >
27
Method of Contact
The vast majority of contacts were made by telephone. Billing queries were significantly more likely to be made online than Clean Water or Waste Water queries.
91% 92% 91% 88%
93%c 95%cd
3% 3% 3% 5%de 2%e 1% 3% 2% 3% 3%e 2% 2% 1% 1% 1% 2%de
0% 0%
Industry(14,782)
WASC(8418)
(a)
WOC(6364)
(b)
Billing(6744)
(c)
Water(5384)
(d)
Waste(2654)
(e)
Phone Online Email Letter
Company Type Contact Type Unweighted Data. Base sizes in brackets

• ---- • ---- • ----
< Previous Next >
28
Proportion Regarding Contact As a Complaint
Overall, 15% of customers regarded their contact with their water company as a complaint. Billing enquiries were significantly less likely to be complaints than either Clean Water or Waste Water queries. Over a quarter of Waste Water queries were complaints.
15% 18%b
11% 8%
19%c
26%cd
Industry(14782)
WASC(8418)
(a)
WOC(6364)
(b)
Billing(6744)
(c)
Water(5384)
(d)
Waste(2654)
(e)
Company Type Contact Type
Unweighted Data. Base sizes in brackets

• ---- • ---- • ----
< Previous Next >
29
75% 73% 78%a 83%de
70%e
65% 71% 74% 77%fg 77%fg
Industry(14782)
WASC(8418)
(a)
WOC(6364)
(b)
Billing(6744)
(c)
Water(5384)
(d)
Waste(2654)
(e)
Up to 7days(799)
(f)
8-14 days(6899) (g)
15-21days
(4355) (h)
Morethan 21
days(2729)
(i)
Proportion Regarding Query As Being Resolved
Overall, three quarters of customers considered their matter to be resolved.
WOC customers were significantly more likely to consider their reason for contact to be resolved than WASC customers. Customers who contacted their water company with Billing queries were significantly more likely to feel the matter was resolved than those with Clean Water or, particularly, Waste Water queries.
Company Type Contact Type
Unweighted Data. Base sizes in brackets
Lapsed Time

• ---- • ---- • ----
< Previous Next >
30
83%
81%
80%
80%
79%
79%
77%
77%
77%
76%
76%
75%
74%
74%
71%
68%
66%
62%
Portsmouth Water
Dee Valley Water
Bristol Water
Wessex Water
Bournemouth Water
South Staffs Water
Affinity Water
Severn Trent Water
Welsh Water
Northumbrian Water
Yorkshire Water
Sutton & ES Water
South East Water
United Utilities Water
Anglian Water
South West Water
Thames Water
Southern Water
Proportion of Resolved Contacts
Portsmouth Water had the highest proportion of customers who felt their query was resolved and Southern Water the lowest.
WASC
WOC
Unweighted base: 14,782
Average 75%

• ---- • ---- • ----
< Previous Next >
31
89%
88%
88%
88%
88%
87%
86%
84%
84%
84%
84%
83%
80%
79%
79%
78%
77%
70%
South Staffs Water
Portsmouth Water
Severn Trent Water
Welsh Water
Yorkshire Water
Dee Valley Water
Wessex Water
Bristol Water
Bournemouth Water
Affinity Water
United Utilities Water
Northumbrian Water
Sutton & ES Water
Anglian Water
Thames Water
South West Water
South East Water
Southern Water
Proportion of Resolved Contacts – Billing Only
South Staffs Water had the highest proportion of customers who felt their billing query was resolved.
WASC
WOC
Unweighted base: 6,744
Average 83%

• ---- • ---- • ----
< Previous Next >
32
Areas Where Water Company Could Have Done Better
Over half of customers could not think of anything that their water company could have done better. This figure was significantly higher amongst those with Billing enquiries.
A quicker response and/or resolution was the main area that customers would like to see improved, followed by being kept informed of progress.
Number of Respondents
Proportion of
Respondents
Billing (a) Water (b) Waste (c)
Nothing 8,129 55% 63%bc 47% 51%b
Quicker response 666 5% 2% 7%a 7%a
Quicker resolution of problem/query 612 4% 2% 7%ac 5%a
Keep in contact/progress reports/ updates/outcome
463 3% 1% 5%a 5%a
Given a full explanation/more information/answers
457 3% 3% 4%ac 2%
Fixed the problem/sorted the query (not necessarily quickly)
433 3% 1% 4%a 6%ab
Better communication 387 3% 2% 4%ac 3%a
Prevent the error/problem happening in the first place/happening again
371 3% 1% 2%a 8%ab
Unweighted Data. Total Base: 14,781

• ---- • ---- • ----
< Previous Next >
33
Areas Where Water Company Did Well
Speed of response and politeness of staff were the key areas highlighted by customers when asked what they thought their water company had done well. Maintaining good communication and providing an informed response were also valued by customers.
Number of Respondents
Proportion of Respondents
Billing (a) Water (b) Waste (c)
Nothing 1,886 13% 16%bc 11%c 9%
Speed of response/prompt/quick to act 2,547 17% 10% 20%a 29%ab
Polite/friendly/good telephone staff 2,040 14% 17%bc 12% 11%
Called me back/kept me informed/good communication
1,837 12% 5% 18%a 18%a
Informative/explained everything/answered questions/ good advice
1,661 11% 11%c 13%ac 8%
Helpful 1,447 10% 11%bc 9%c 8%
Solved the problem quickly/work carried out quickly
1,218 8% 7% 10%a 10%a
Handled the situation/query well/dealt with the issue
992 7% 8%bc 5% 6%
Solved the problem/answered the query (not necessarily quickly)
864 6% 3% 8%a 8%a
Polite/friendly/good workmen 776 5% 1% 7%a 11%ab
Good service/customer service 770 5% 6%b 4% 5%
Efficient 755 5% 6%b 4% 5%
Unweighted Data. Total Base: 14,782

• ---- • ---- • ----
< Previous Next >
34
Industry Comparison
In Wave 1, we asked respondents if they had been in contact with any other, similar service providers during the previous three months. Customer satisfaction with the service received within the water industry is significantly higher than that provided by any of the comparable service providers.
† Where 5=very satisfied Unweighted data. Base sizes in brackets
60
39 37 39 37 32
19
30 30 27 28 30
Water industry(14782)
(a)
Energy company(633)
(b)
Local council(619)
(c)
Mobile Telephonesupplier
(395)(d)
Broadband supplier(425)
(e)
Landline telephonesupplier
(404)(f)
Very Satisfied Fairly Satisfied
Mean Score† 4.23bcdef 3.80f 3.71 3.57 3.70 3.68
% Satisfied 79%bcdef
69%f 67% 62% 66% 65%

• ---- • ---- • ----
< Previous Next >
35
Conclusions

• ---- • ---- • ----
< Previous Next >
36
Due to the changes made to the survey format since the 2013/14 SIM survey, it is not possible to make direct comparisons with previous results. However, it is clear that the inclusion of unresolved contacts has resulted in a slightly reduced customer satisfaction score across the board, with the change having more of an impact on some water companies as opposed to others.
Overall, WOCs achieved a significantly higher SIM score than WASCs. WASCs made up three of the top five companies, but also the bottom three.
The inclusion of unresolved contacts for this survey has inevitably led to a fall in the proportion of customers considering their matter to be resolved, now three quarters of all customers, falling to 65% in the case of Waste Water enquiries.
Customers who consider the matter to be resolved are significantly more satisfied than those who do not. Similarly, respondents who consider their query to be a complaint are significantly less satisfied than those who do not.
Conclusions
Significantly higher SIM scores were seen for Billing queries than either Clean Water or Waste Water queries.
The length of time elapsed between the initial contact and date of interview was found to have no impact on satisfaction levels, therefore we believe there to be no significant advantage or disadvantage to those water companies who are required to provide more than one week’s sampling data. .
A prompt response and keeping customers informed were the areas where customers were most likely to feel their water company had done well. Where customers felt their water company could have handled the matter better, a quicker response, quicker resolution time and keeping customers better informed were mentioned most frequently.
As has been the case in every previous wave of research, customer experience of query handling in the water industry is substantially more positive than in other sectors – 79% of water customers are satisfied compared to a maximum of 69% of those contacting other types of organisations.

• ---- • ---- • ----
< Previous Next >
Defining a clear direction for
McCallum Layton Bramley Grange Skeltons Lane Thorner, Leeds LS14 3DW
Tel: +44 (0)113 237 5590 Fax: +44 (0)113 237 5599
[email protected] www.mccallum-layton.co.uk


![[Theatre, Drama, Acting] Colin Counsell - Stanislavski's System](https://static.documents.pub/doc/80x56/54e96ffb4a79599f4e8b50e8/theatre-drama-acting-colin-counsell-stanislavskis-system.jpg)


