OH formation by HONO photolysis during the BERLIOZ experiment B. Alicke, 1 A. Geyer, 1,3 A. Hofzumahaus, 2 F. Holland, 2 S. Konrad, 2 H. W. Pa ¨tz, 2 J. Scha ¨fer, 2 J. Stutz, 1,3 A. Volz-Thomas, 2 and U. Platt 1 Received 2 March 2001; revised 17 July 2001; accepted 22 October 2001; published 15 January 2003. [1] The photolysis of nitrous acid (HONO) in the early morning hours is an important source of OH radicals, the most important daytime oxidizing species. Although the importance of this mechanism has been recognized for many years, no accurate quantification of this OH source is available, and the role of HONO photolysis is often underestimated. We present measurements of HONO and its precursor NO 2 by Differential Optical Absorption Spectroscopy (DOAS) during the Berliner Ozonexperiment (BERLIOZ) field campaign in July/August 1998 at Pabstthum near Berlin, Germany. HONO concentrations, formation rates, and simultaneously measured HONO photolysis frequencies are used to calculate the total amount of OH formed by HONO photolysis during a full diurnal cycle. A comparison with the OH formation by photolysis of O 3 and HCHO and by the reaction of alkenes with ozone shows that HONO photolysis contributed up to 20% of the total OH formed in a 24 hour period during this campaign. In the morning hours, HONO photolysis was by far the most important OH source during BERLIOZ. INDEX TERMS: 0365 Atmospheric Composition and Structure: Troposphere—composition and chemistry; 0345 Atmospheric Composition and Structure: Pollution—urban and regional (0305); 0394 Atmospheric Composition and Structure: Instruments and techniques; KEYWORDS: HONO, photochemistry, OH, photolysis, HCHO, ozone Citation: Alicke, B., A. Geyer, A. Hofzumahaus, F. Holland, S. Konrad, H. W. Pa ¨tz, J. Scha ¨fer, J. Stutz, A. Volz-Thomas, and U. Platt, OH formation by HONO photolysis during the BERLIOZ experiment, J. Geophys. Res., 108(D4), 8247, doi:10.1029/ 2001JD000579, 2003. 1. Introduction [2] The photolysis of nitrous acid (HONO) has been recognized as a potentially important production mecha- nism of OH radicals in the polluted urban atmosphere more than two decades ago [Calvert et al., 1994; Harris et al., 1982; Jenkin et al., 1988; Platt, 1986; Platt and Perner, 1980]. Upon irradiation with light in the wavelength range from 300 to 405 nm, HONO decomposes forming an OH radical and NO (limiting the HONO lifetime typically to 10 min at noon) [e.g., Stockwell and Calvert, 1978; Stutz et al., 2000]: HONO þ hn ! OH þ NO 300 nm < l < 405 nm ð Þ ð1Þ [3] The OH radical is by far the most important oxidizing species in the daytime atmosphere (see review by Crutzen and Zimmermann [1991]) in both polluted and clean areas. The quantification of OH formation mechanisms is there- fore essential for the understanding of tropospheric chem- istry and the ozone budget. [4] On a global scale, the most important OH production mechanism is most likely the formation of excited O( 1 D) atoms from the photolysis of O 3 at wavelengths below 320 nm (reaction (2)) [e.g., Logan et al., 1981]. The O( 1 D) atoms can react with water vapor to produce OH radicals directly (3) or be quenched by air molecules (4). O 3 þ hn ! O 1 D þ O 2 l < 320 nm ð Þ ð2Þ O 1 D þ H 2 O ! 2 OH ð3Þ O 1 D þ M ! O 3 P þ M M ¼ N 2 or O 2 ð Þ ð4Þ [5] The branching ratio of reactions (3) and (4) (typically of the order of 10%) depends on the concentration of H 2 O in ambient air and therefore also on the temperature (see section 3.5.2). [6] A second source for OH is the photolysis of form- aldehyde at wavelengths below 370 nm followed by rapid reaction of HO 2 with NO [Meller and Moortgart, 2000]: HCHO þ hn ! H þ HCO J HCHO rad ð Þ l < 370 nm ð Þ ð5Þ ! H 2 þ CO J HCHO mol ð Þ ð6Þ H þ O 2 ! HO 2 ð7Þ HCO þ O 2 ! HO 2 þ CO ð8Þ HO 2 þ NO ! OH þ NO 2 ð9Þ JOURNAL OF GEOPHYSICAL RESEARCH, VOL. 108, NO. D4, 8247, doi:10.1029/2001JD000579, 2003 1 Institut fu ¨r Umweltphysik, Universitat Heidelberg, Heidelberg, Ger- many. 2 Stettiner Staatsforst, Forschungszentrum Ju ¨lich, Ju ¨lich, Germany. 3 Department of Atmospheric Sciences, University of California, Los Angeles, Los Angeles, California, USA. Copyright 2003 by the American Geophysical Union. 0148-0227/03/2001JD000579$09.00 PHO 3 - 1
Transcript
OH formation by HONO photolysis during the BERLIOZ experiment
B. Alicke,1 A. Geyer,1,3 A. Hofzumahaus,2 F. Holland,2 S. Konrad,2 H. W. Patz,2
J. Schafer,2 J. Stutz,1,3 A. Volz-Thomas,2 and U. Platt1
Received 2 March 2001; revised 17 July 2001; accepted 22 October 2001; published 15 January 2003.
[1] The photolysis of nitrous acid (HONO) in the early morning hours is an importantsource of OH radicals, the most important daytime oxidizing species. Although theimportance of this mechanism has been recognized for many years, no accuratequantification of this OH source is available, and the role of HONO photolysis is oftenunderestimated. We present measurements of HONO and its precursor NO2 by DifferentialOptical Absorption Spectroscopy (DOAS) during the Berliner Ozonexperiment(BERLIOZ) field campaign in July/August 1998 at Pabstthum near Berlin, Germany.HONO concentrations, formation rates, and simultaneously measured HONO photolysisfrequencies are used to calculate the total amount of OH formed by HONO photolysisduring a full diurnal cycle. A comparison with the OH formation by photolysis of O3 andHCHO and by the reaction of alkenes with ozone shows that HONO photolysiscontributed up to 20% of the total OH formed in a 24 hour period during this campaign. Inthe morning hours, HONO photolysis was by far the most important OH source duringBERLIOZ. INDEX TERMS: 0365 Atmospheric Composition and Structure: Troposphere—composition
and chemistry; 0345 Atmospheric Composition and Structure: Pollution—urban and regional (0305); 0394
Atmospheric Composition and Structure: Instruments and techniques; KEYWORDS: HONO, photochemistry,
OH, photolysis, HCHO, ozone
Citation: Alicke, B., A. Geyer, A. Hofzumahaus, F. Holland, S. Konrad, H. W. Patz, J. Schafer, J. Stutz, A. Volz-Thomas, and
U. Platt, OH formation by HONO photolysis during the BERLIOZ experiment, J. Geophys. Res., 108(D4), 8247, doi:10.1029/
2001JD000579, 2003.
1. Introduction
[2] The photolysis of nitrous acid (HONO) has beenrecognized as a potentially important production mecha-nism of OH radicals in the polluted urban atmosphere morethan two decades ago [Calvert et al., 1994; Harris et al.,1982; Jenkin et al., 1988; Platt, 1986; Platt and Perner,1980]. Upon irradiation with light in the wavelength rangefrom 300 to 405 nm, HONO decomposes forming an OHradical and NO (limiting the HONO lifetime typically to 10min at noon) [e.g., Stockwell and Calvert, 1978; Stutz et al.,2000]:
HONOþ hn ! OHþ NO 300 nm < l < 405 nmð Þ ð1Þ
[3] The OH radical is by far the most important oxidizingspecies in the daytime atmosphere (see review by Crutzenand Zimmermann [1991]) in both polluted and clean areas.The quantification of OH formation mechanisms is there-fore essential for the understanding of tropospheric chem-istry and the ozone budget.
[4] On a global scale, the most important OH productionmechanism is most likely the formation of excited O(1D)atoms from the photolysis of O3 at wavelengths below 320nm (reaction (2)) [e.g., Logan et al., 1981]. The O(1D)atoms can react with water vapor to produce OH radicalsdirectly (3) or be quenched by air molecules (4).
O3 þ hn ! O 1D� �
þ O2 l < 320 nmð Þ ð2Þ
O 1D� �
þ H2O ! 2 OH ð3Þ
O 1D� �
þM ! O 3P� �
þM M ¼ N2 or O2ð Þ ð4Þ
[5] The branching ratio of reactions (3) and (4) (typicallyof the order of 10%) depends on the concentration of H2Oin ambient air and therefore also on the temperature (seesection 3.5.2).[6] A second source for OH is the photolysis of form-
aldehyde at wavelengths below 370 nm followed by rapidreaction of HO2 with NO [Meller and Moortgart, 2000]:
2Stettiner Staatsforst, Forschungszentrum Julich, Julich, Germany.3Department of Atmospheric Sciences, University of California, Los
Angeles, Los Angeles, California, USA.
Copyright 2003 by the American Geophysical Union.0148-0227/03/2001JD000579$09.00
PHO 3 - 1
[7] The reactions of ozone with alkenes also lead to theproduction of OH radicals [Atkinson and Aschmann, 1993;Paulson et al., 1997]. Ozone adds across the double bond toform a primary ozonide, which is not stable and decom-poses to form a Criegee intermediate [Criegee, 1975]. Thisintermediate can either be stabilized or decomposed in avariety of ways (for a recent discussion refer to Finlayson-Pitts and Pitts [2000] and Paulson et al. [1999]). Thereforethe alkene–ozone reaction represents a direct source ofhydroxyl and peroxy radicals (OH + RO2). The OH pro-duction yields of these reactions vary from 7% to 100%depending on the structure and size of the alkene [Paulsonet al., 1999].[8] The reaction of RO2 with NO represents another net
source of OH radicals, if the RO2 is not produced from OHreactions with hydrocarbons, but rather by ozonolysis ofalkenes, or during the night by reactions of NO3 withmonoterpenes and other alkenes [Bey et al., 2001; Geyeret al., 2001, 2003; Platt et al., 1990]. For a detaileddiscussion of the nighttime sources of OH during BerlinerOzonexperiment (BERLIOZ), see the work of Geyer et al.[2003].[9] The contributions of the different mechanisms depend
on the composition of the atmosphere. In remote regionswith low NOx and VOC concentrations, the photolysis ofO3 is probably the dominant source of OH. The importance
of HCHO and HONO photolysis increases with the degreeof pollution, e.g., increasing NOx and VOC concentrations.The role of the ozone + alkene reactions depends on thepresence of larger chain (�C5) alkenes, for example bio-genic VOCs.[10] The importance of the mechanisms also depends on
solar radiation, and therefore the time of day. Due to theirlower dissociation energy thresholds, the photolysis ofHCHO and HONO starts earlier in the morning than thatof O3 (as far as the O(1D)-forming channel is concerned).In contrast to HCHO, which levels are generally highthroughout the day, the HONO concentrations often reacha maximum before or at sunrise. The photolytic lifetime ofHONO is, however, roughly 2 orders of magnitude shorterthan that of HCHO resulting in generally low HONOlevels during day. The combination of elevated HONOconcentrations at sunrise and the fast photolysis cantherefore (in polluted areas) result in a peak productionof OH surpassing all other sources in the morning. Overthe day a steady state of HONO is generally established,and the importance of HONO as an OH source has oftendecreased.[11] In contrast to the above mechanisms, the reactions
of ozone and NO3 with alkenes do not require sunlight.They therefore also proceed during the night (in the case ofNO3 almost exclusively at night) at a rate only depending
5 0 0 W X e -a rclam p h o u se
Q u artz f ib re w ithm o d e-m ix e r
Tran sfe ro p tic s
P C
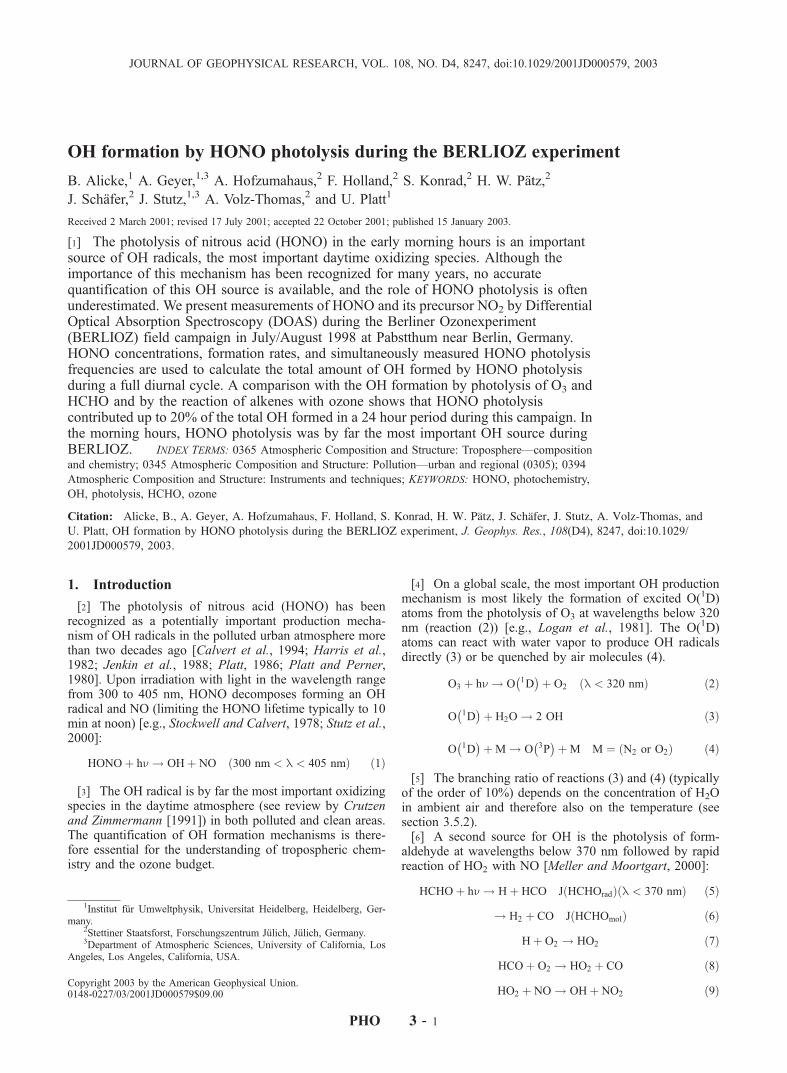
Figure 1. Schematic view of the setup of the DOAS White System used during the BERLIOZcampaign.
PHO 3 - 2 ALICKE ET AL.: OH FORMATION BY HONO PHOTOLYSIS DURING BERLIOZ
on the ozone (or NO3) and alkene concentrations. Inpolluted areas with high nighttime NO emissions near theground, ozone (and NO3) concentrations during the nightand in the early morning are often low. In this casenighttime OH formation mechanisms are inefficient. Butafter the breakup of the nocturnal inversion and the dilutionof the NO and entrainment from ozone aloft ozonolysis canbecome a significant OH source. In the time betweensunrise and the beginning of vertical mixing, however,the photolysis of HCHO and, in particular HONO, fre-quently are the only OH sources.[12] The first identification of HONO in the atmosphere
was made by Perner and Platt [1979] and Platt et al.[1980]. Since then many atmospheric measurements havebeen reported [see Lammel and Cape, 1996; Calvert et al.,1994 for reviews], with maximum mixing ratios of up to 15ppb [Winer and Biermann, 1994] in Los Angeles or 10 ppbin Milan, Italy [Febo et al., 1996]. Generally, HONOconcentrations were found to scale with NO2 concentra-tions, and therefore with the degree of pollution. The diurnalvariation of the mixing ratio of HONO is dominated by itsphotolysis. During the night the concentration increases,showing a maximum before sunrise. The fast photolysisduring sunrise is followed by a period of low concentrationsduring the day.[13] Several studies have investigated the importance of
HONO photolysis as an OH source, and its influence onozone formation. The calculations are mostly based onassumptions about the formation of HONO. Harris et al.[1982] and Sjodin [1988] estimated OH production rates inthe range of (0.1–3) � 107 mol cm�3 s�1 for up to 8 ppb of
HONO (measurement in Los Angeles) in the morninghours. A model study by Harris et al. [1982] found anincrease of the maximum ozone concentration of up to 55%if 10 ppb of HONO are included (Los Angeles case, initialNOx: 0.24 ppm). Another study [Jenkin et al., 1988] foundthat the photolysis of HONO in the early morning results ina fivefold increase of OH at 0600 GMT, a 14% increase inOH present at the daily maximum (noon) and a 16%increase in net photochemical ozone production. Bothstudies agree that the increase of ozone starts much earlierdue to the HONO photolysis in the morning.[14] In order to quantify the importance of HONO as a
precursor of the OH radical, its sources and sinks must bewell investigated. HONO is known to be produced byreaction (10) [Nguyen et al., 1998; Stuhl and Niki, 1972],but as this reaction removes OH, subsequent photolysisdoes not represent a net source of OH radicals.
OHþ NO þMð Þ ! HONO þMð Þ ð10Þ
[15] It is long known that the bulk of urban HONO isformed via other pathways [e.g., Platt, 1986]. Production ofHONO from the mechanisms summarized in reactions (11)or (12) involves only NOx and water vapor. The photolysisof the HONO formed in (11) and (12) therefore represents anet source of OH radicals.
NO2 þ NOþ H2O ! 2HONO ð11Þ
2NO2 þ H2O ! HONOþ HNO3 ð12Þ
0.999
1.000
1.001(3)
E
0.998
0.999
1.000
1.001 (2)
D
C
optic
al d
ensi
ty
0.996
0.998
1.000
1.002(1)
B
A
354 356 358 360 362 364 366 368 370
354 356 358 360 362 364 366 368 370
wavelength [nm]
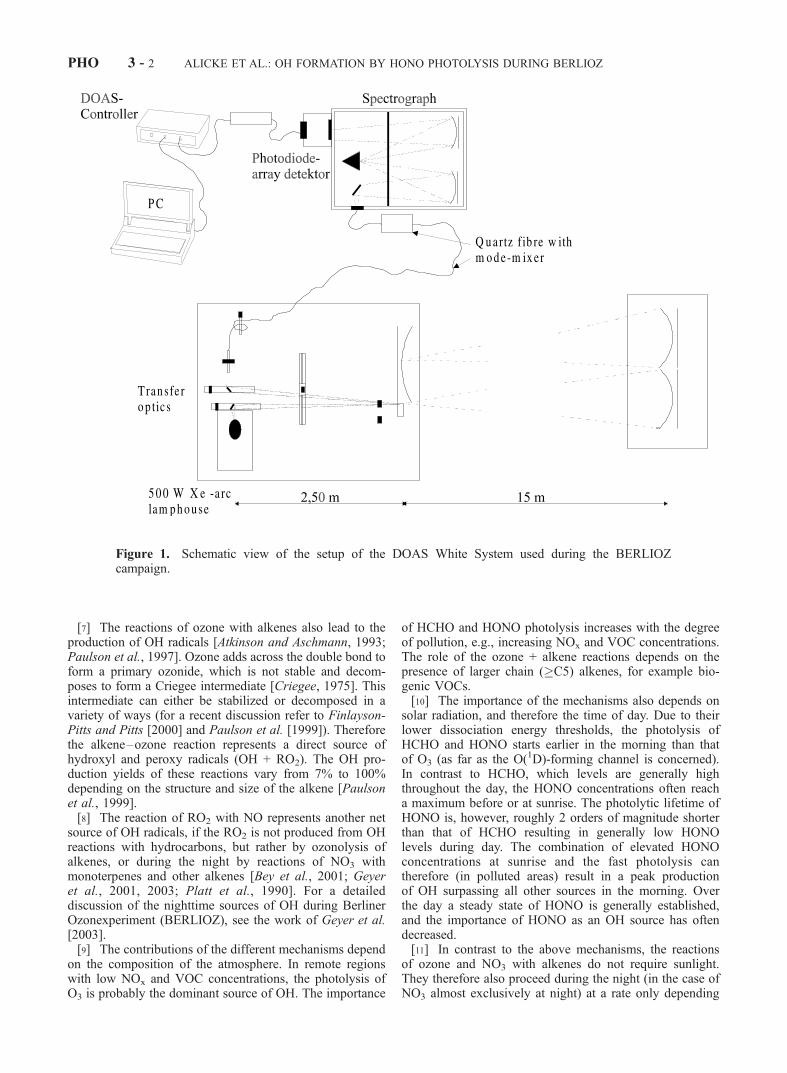
Figure 2. Example spectra for HONO and NO2 analysis with the DOAS White system in Pabstthum.(1) Line A shows the atmospheric spectra, B is a NO2 reference spectrum, which is the main absorber. (2)The residual after fitting all trace gases (except of HONO) to the atmospheric spectrum clearly shows theabsorption structure of HONO (D, C is a HONO reference spectrum) with a concentration of 1.0 ± 0.09ppb. (3) The residual structure of 10�4 (1s) after simultaneous fitting of all trace gases (E).
ALICKE ET AL.: OH FORMATION BY HONO PHOTOLYSIS DURING BERLIOZ PHO 3 - 3
[16] These reactions seem to proceed heterogeneously onsurfaces [Ammann et al., 1998; Goodman et al., 1999;Junkermann and Ibusuki, 1992; Kalberer et al., 1999;Lammel and Perner, 1988; Longfellow et al., 1998; Notholtet al., 1992]. A number of laboratory studies [Jenkin et al.,1988; Pitts et al., 1984; Sakamaki et al., 1983; Svensson etal., 1987] have suggested that reaction (11) is not signifi-cant. Several field observations, where the presence of highozone at night excluded NO or low NO was documented[Harrison and Kitto, 1994; Kessler and Platt, 1984], con-firmed the laboratory results. Reaction (11) may becomesignificant only in polluted air masses where the NOconcentration is large. The exact mechanism of the hetero-geneous formation of HONO summarized in reaction (12) isunknown, but several studies [e.g., Jenkin et al., 1988;Svensson et al., 1987] have shown that it is first order inNO2 and water. The reaction rate seems to depend also onthe type of surface.[17] Other paths producing HONO like the reaction of
NO2 with HO2 have been reported to be of minor impor-tance [Howard, 1977; Tyndall et al., 1995].[18] The most important removal processes for HONO is
its photolysis (1). A few percent of HONO is expected to bedestroyed by OH radicals:
OHþ HONO ! H2Oþ NO2 ð13Þ
[19] The self-reaction of HONO (14) [Chan et al., 1976]and the reaction of HONO with nitric acid (15) [Kaiser andWu, 1977] on surfaces might be important sinks in thenocturnal atmosphere.
[20] The quantification of the OH production by HONOphotolysis in the morning requires fast and precise meas-urement of HONO, especially during sunrise. Most meas-urements were so far performed with instruments of 0.5–12 hour time resolution [Febo et al., 1993; Harrison et al.,1996; Sjodin and Ferm, 1985], which is too slow to followthe decrease of HONO at sunrise. The recent improvementof Differential Optical Absorption Spectroscopy (DOAS)in our laboratory has increased the time resolution to 3–5min, fast enough to determine the OH production atsunrise.[21] Here we present high time resolution measurements
of HONO, its precursor NO2, and the HONO photolysisfrequency during the Berliner Ozonexperiment 1998 (BER-LIOZ). During the campaign other OH precursors like O3,HCHO and alkenes were also measured as well as thephotolysis frequencies and the ambient OH concentration.A quantitative comparison shows the diurnal variation, and
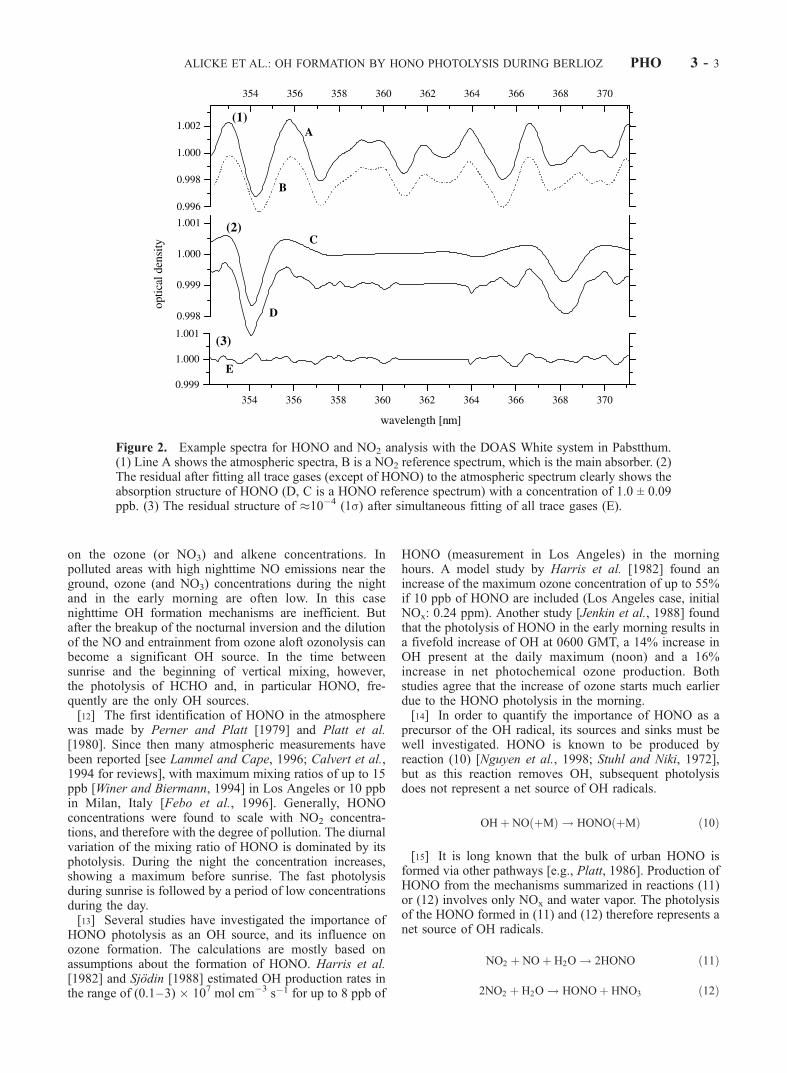
Figure 3. Time series of HONO and NO2 measured by the DOAS White system. The diurnal variationas well as the correlation of both gases can be clearly seen. All error bars refer to the 1s error calculatedaccording to the work of Stutz and Platt [1996]. The dotted lines show the 2s detection limits.
PHO 3 - 4 ALICKE ET AL.: OH FORMATION BY HONO PHOTOLYSIS DURING BERLIOZ
the relative importance of the HONO photolysis and theother OH production pathways.
2. Experimental Methods
2.1. Location
[22] The measurements were performed during the BER-LIOZ from 12 July to 6 August 1998 [Volz-Thomas et al.,2003a]. The station was located at the edge of a 7.5 � 4.5km2 flat meadow in the vicinity of the small village Pabst-thum (12�5602500 E, 52�5101500 N, height: 50 m above sealevel). This rural site has only little traffic and local anthro-pogenic emissions are therefore very small. The metropolisBerlin is situated in SE direction (145�) in a distance of 50km (center) and 35 km (suburbs), respectively. The city ofNeuruppin is located in the NW direction (12 km). Ahighway passes 14 km to the south of the site. The lightpath of a DOAS long path system pointed in an easterlydirection from a height of 1.5 m at the site to the reflector at adistance of 2.5 km and 3.5 m above the ground. A DOASWhite system together with the rest of the scientific instru-ments was mounted on a platform 8 m above ground.
2.2. Analytical Instruments
[23] A number of different instruments were operated atthe station. Here only the DOAS instruments shall be
discussed in detail. More details on the other instrumentscan be found in further publications in this issue.2.2.1. In Situ Monitors for NO2 and O3
[24] Ozone was measured with a commercial short pathUVabsorption instrument (Thermo Instruments, TE49) witha time resolution of 1 min and a detection limit of 1 ppb.NO and NO2 were detected by a gas-phase chemilumines-cence system with a photolytic NO2/NO converter (EcoPhysics CLD 770 AL ppt with photolytic converter PLC770). The measurement frequency of this system was 1 minwith a detection limit of 20 ppt. A detailed description of thein situ monitors is given by Volz-Thomas et al. [2003b].2.2.2. Gas Chromatograph for VOCs[25] The mixing ratios of more than 50 hydrocarbons
(including 27 alkanes, 10 aromatic hydrocarbons, 12 alkenes,isoprene, a-pinene, and the total amount of monoterpenes)were determined by gas chromatography with two differentGC systems (HP-GC 5890 andAirmotecHC1010).Measure-ment procedures and data evaluation techniques aredescribed by Mihelcic et al. [2003] and Konrad and Volz-Thomas [2001].2.2.3. Spectroradiometer for Photolysis FrequencyMeasurements[26] The photolysis frequency of NO2 was measured with
a 4p filter-radiometer (Meteorology Consult, 4p sr J(NO2)Radiometer Nr. 631/632). A spectroradiometer was used to
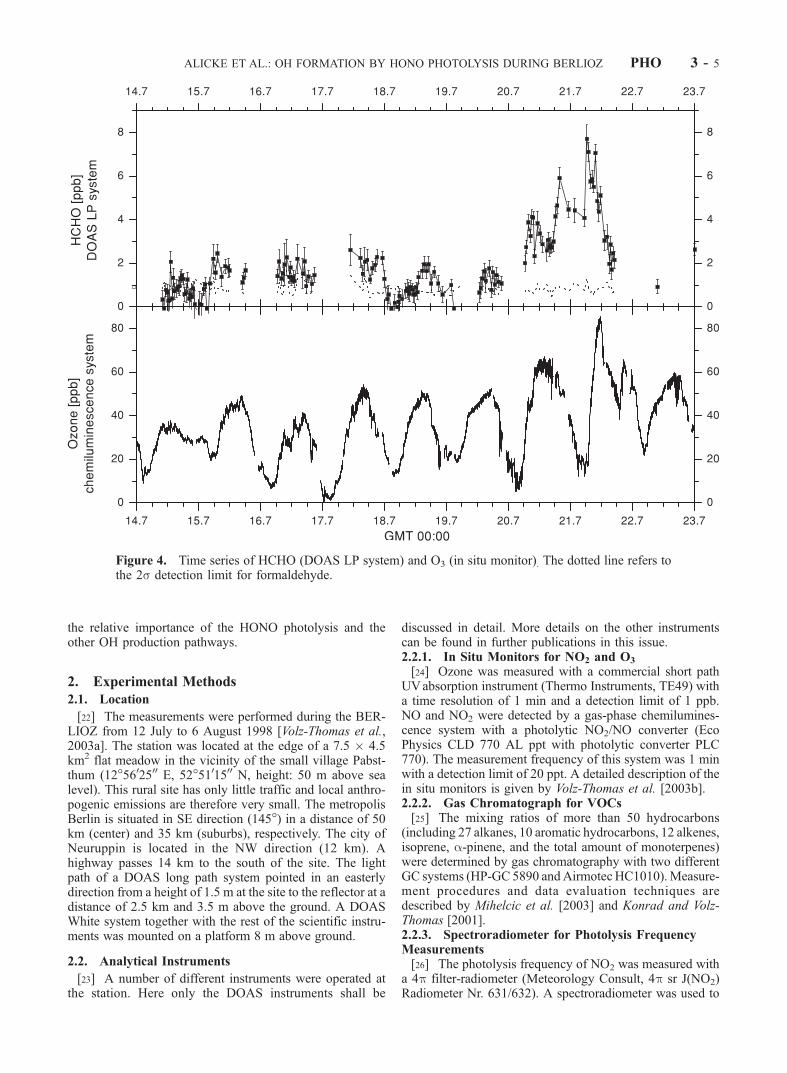
Figure 4. Time series of HCHO (DOAS LP system) and O3 (in situ monitor). The dotted line refers tothe 2s detection limit for formaldehyde.
ALICKE ET AL.: OH FORMATION BY HONO PHOTOLYSIS DURING BERLIOZ PHO 3 - 5
measure the actinic flux (actinic flux spectroradiometer,Bentham DTM300) from which ozone and HCHO photol-ysis frequencies were calculated. These instruments aredescribed in more detail by Hofzumahaus et al. [1999]and Muller et al. [1995].2.2.4. Laser-Induced Fluorescence for OH and HO2
[27] Laser-induced fluorescence (LIF) was used to deter-mine the ambient concentration of OH and HO2 during theBERLIOZ campaign. For a detailed description of the LIFmeasurement technique and evaluation algorithm for OHand HO2 at BERLIOZ, refer to the works of Holland et al.[1998, 2003].2.2.5. The DOAS Instruments[28] DOAS is a technique that identifies and quantifies
trace gases with narrow band absorption structures in thenear UV and visible wavelength region in the open atmos-phere. The fundamental setup of a DOAS instrument consistsof a broadband light source, an optical system to transfer thelight through the atmosphere, and a spectrograph-detectorsystem to record the absorption spectra. These spectra showabsorptions from different trace gases as well as extinctionfrom air molecules and aerosol scattering. To extract theabsorptions, and ultimately the concentration of the tracegases, DOAS separates the trace gas absorption cross sectioninto two parts, one that varies slowly with wavelength, and afast varying differential cross section s0. Applying the samefiltering procedure to the absorption spectrum leads to adifferential absorption spectrum which can then be analyzedbased on Lambert–Beer’s law and s0. For a detailed descrip-tion of DOAS, see the review article by Platt [1994]. Twodifferent DOAS systems were used at Pabstthum:1. A DOAS long path (LP) system consisting of a single
long light path, which is folded once between sending andreceiving telescope. In short, the instrument consists of a
double Newtonian sending and receiving telescope. Thetelescope collimates light of a Xe-arc lamp and sends it ontoa quartz cube-corner retroreflector array, which reflects thebeam back into the receiving telescope. The light is then fedthrough a quartz-fiber mode mixer [Stutz and Platt, 1997]into a spectrograph-detector system. The instrument mea-sures trace gas concentrations averaged over the length ofthe light path. During BERLIOZ this system measured O3,NO2, HCHO, HONO, NO3, and several aromatic hydro-carbons. Here we will concentrate on the formaldehydemeasurements, which were made over a path of 2.5 kmsingle length. A detailed description of the DOAS LPsystem is given by Geyer et al. [1999]. Note that it ispossible that the DOAS LP system occasionally analyzedanother air mass as the in situ instruments.2. The concentrations of HONO and NO2 presented here
were measured with an open White type [White, 1942,1976] f/100 multireflection system (see Figure 1) [Ritz etal., 1992]. The base length of this DOAS White system was15 m. Therefore, the system observed the same air mass asthe in situ monitors, which were located within a few metersof the system. Absorption spectra were measured byalternatingly setting the cell to 16 and 144 traverses,leading to a total path length of 0.24 and 2.16 km,respectively. The White system was mounted inside an openheavy crane cantilever at a height of 8 m. No influence ofthe cantilever surface was expected since the residence timeof the air inside the open cantilever structure was too shortfor any heterogeneous reactions to take place. Light of a Xe-arc lamp was fed into the system via a small Newtoniantelescope. The spectrograph-detector system was coupled tothe White system by another Newtonian telescope and aquartz fiber, which also performed the task of a mode mixer[Stutz and Platt, 1997].
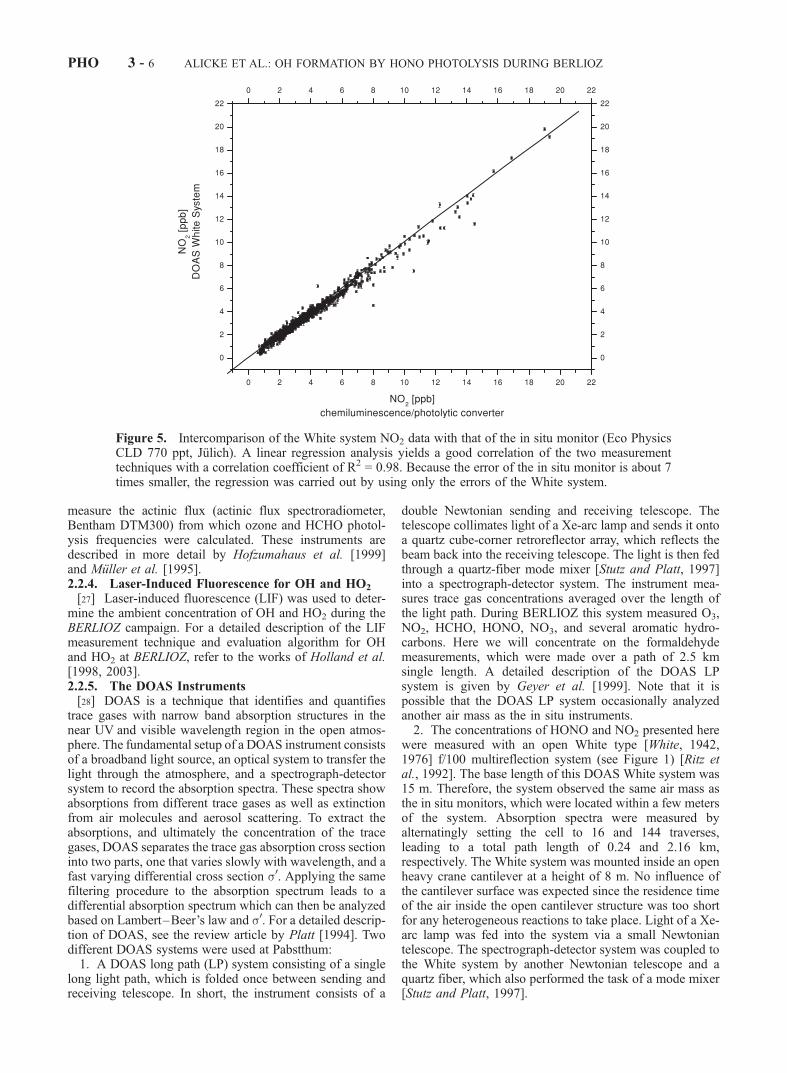
Figure 5. Intercomparison of the White system NO2 data with that of the in situ monitor (Eco PhysicsCLD 770 ppt, Julich). A linear regression analysis yields a good correlation of the two measurementtechniques with a correlation coefficient of R2 = 0.98. Because the error of the in situ monitor is about 7times smaller, the regression was carried out by using only the errors of the White system.
PHO 3 - 6 ALICKE ET AL.: OH FORMATION BY HONO PHOTOLYSIS DURING BERLIOZ
[29] Both DOAS systems used identical Czerny–Turnerspectrographs with focal lengths of 0.5 m and photodiodearray detectors [Stutz and Platt, 1992]. The spectrographswere held at a temperature of (+30 ± 0.3)�C. The detectors(HMT, Rauenberg) use a 1024 diode array (HamamatsuS3904-1024N) of 25 mm center to center spacing and aheight of 2.5 mm. The array was cooled by a Peltierelement to (�30 ± 0.3)�C to reduce the dark current. TheDOAS LP system used a 600 grooves mm�1 grating tomeasure a wavelength interval from 300 to 380 nm with aresolution of 0.54 nm. The DOAS White system observed aspectral interval from 337 to 377 nm, with a 1200 groovesmm�1 grating and 0.27 nm resolution. A UV band passfilter (UG5 Schott) in the light beam reduced stray light inthe spectrograph.
2.3. Measurement Procedure and Analysis
2.3.1. The DOAS Long Path System[30] The DOAS LP system measured different trace
gases, taking alternating measurements on two (during the
day) or three (at night) light paths. The time needed tochange between the light paths and to automatically alignthe telescope determined the HCHO time resolution. Typ-ically, a HCHO measurement was made every 30–90 min.[31] The measurements employed the Multichannel Scan-
ning Technique (MCST) [Brauers et al., 1995; Knoll et al.,1990; Stutz, 1996] to correct the diode to diode variation inthe detector sensitivity. Additionally, spectra measuringscattered solar light and mercury wavelength standards wererecorded frequently.2.3.2. The DOAS White System[32] Measurements of HONO and NO2 were typically
made every 5–20 min. Additionally to the spectra with 16and 144 traverses spectra of the scattered light from the Sunand the light beams were recorded by blocking the lamp orone of the prisms respectively. All spectra were correctedfor scattered sunlight, stray light and dark current. Tocorrect the spectral characteristics of the lamp and thediode-to-diode sensitivity variations, the 144-path spectrumwas divided by the 16-path spectrum.
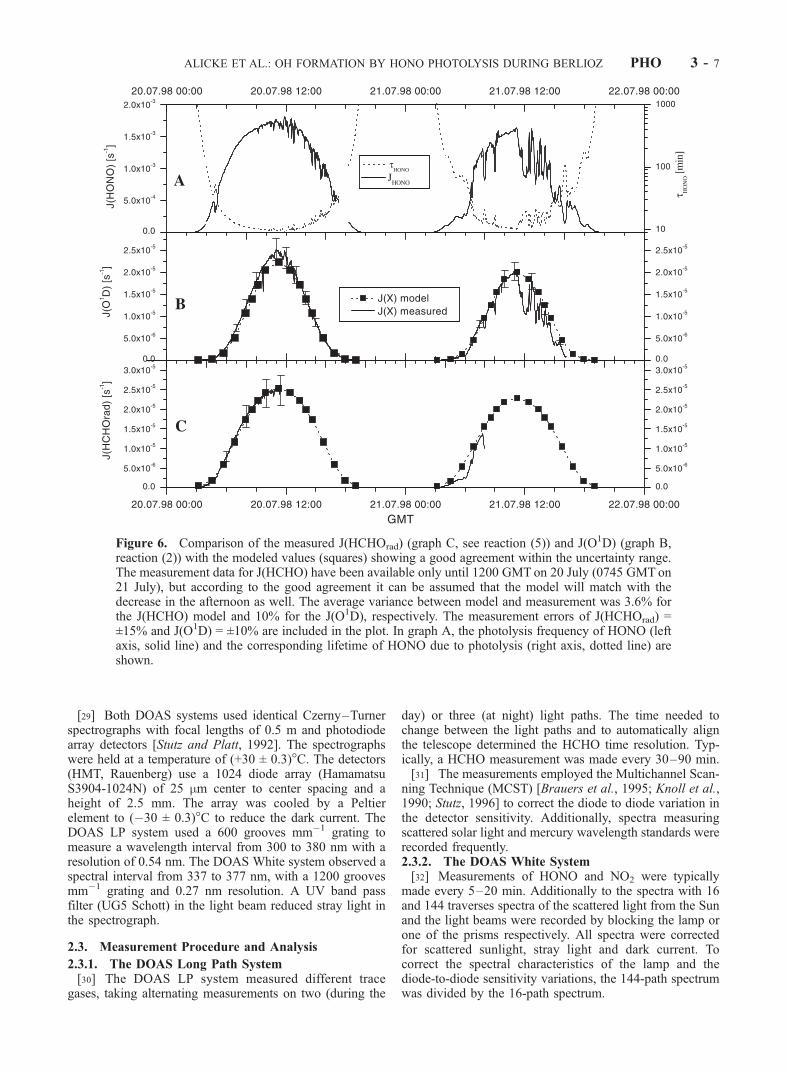
Figure 6. Comparison of the measured J(HCHOrad) (graph C, see reaction (5)) and J(O1D) (graph B,reaction (2)) with the modeled values (squares) showing a good agreement within the uncertainty range.The measurement data for J(HCHO) have been available only until 1200 GMT on 20 July (0745 GMT on21 July), but according to the good agreement it can be assumed that the model will match with thedecrease in the afternoon as well. The average variance between model and measurement was 3.6% forthe J(HCHO) model and 10% for the J(O1D), respectively. The measurement errors of J(HCHOrad) =±15% and J(O1D) = ±10% are included in the plot. In graph A, the photolysis frequency of HONO (leftaxis, solid line) and the corresponding lifetime of HONO due to photolysis (right axis, dotted line) areshown.
ALICKE ET AL.: OH FORMATION BY HONO PHOTOLYSIS DURING BERLIOZ PHO 3 - 7
2.3.3. Data Evaluation[33] The spectra recorded by the two systems were ana-
lyzed with a combined linear/nonlinear least squares algo-rithm [Stutz and Platt, 1996], fitting trace gas referencespectra and a emission spectrum of the lamp, together with apolynomial of 8th order, to the atmospheric spectrum. Theconcentration of the respective trace gases can then bedetermined by the scaling parameters of the reference spectraand the differential absorption cross section. After all knownabsorbers are removed from the measured spectrum bysubtracting their scaled reference spectra, a residual structurewill remain, representing the electronic noise of the instru-ment and unknown absorbers. Figure 2 shows an example ofsuch an evaluation of an atmospheric spectrum (line A)recorded with the White system. The remaining residualstructure after subtracting the reference spectra is shown atthe bottom (line E). To eliminate peak residual structures inthe spectrum between 361 and 364 nm, a rectangularsmoothing function was applied. Over the period of obser-vation presented here the mean size of the residual structurewas 0.5 � 10�3 (peak to peak) for the White system (1.4 �10�3 for the LP system).[34] The error of the concentration determined by the
least squares fitting procedure underestimates the ‘‘true’’statistical error and was therefore multiplied by a factor of 3(all errors in this paper refer to the 1s error) [Stutz and Platt,1996]. During the BERLIOZ campaign, a mean detectionlimit of HCHO of 0.7 ppb was thus determined (we definethe detection limit as twice the 1s error). The detectionlimits for HONO and NO2 were 84 ppt and 0.23 ppbrespectively. The uncertainty of the formaldehyde crosssection is ±5% [Meller and Moortgart, 2000], for HONO±5% [Stutz et al., 2000] and ±8% for the NO2 cross section[Schneider et al., 1987]. The systematic error of the DOASspectrometer was determined by Stutz [1996] as <3%. Thetotal systematic error of the HCHO, HONO, and NO2
concentrations determined by DOAS are therefore <6%,<6%, and <9% respectively.
3. Results
3.1. Time Series of NO2, HONO, O3, and HCHO
[35] Figures 3 and 4 show the time series of the mixingratios of NO2, HONO, O3 and HCHO. Nitrogen dioxidelevels varied from values near the average detection limit of0.24 ± 0.1 ppb of the White System to a maximum of 20.4 ±0.4 ppb in the early morning hours (0640 GMT) of 21 July1998. The high NO2 concentrations on this and the follow-ing day can be explained by southerly winds transportingpolluted air from Berlin to the station, as indicated bytrajectory analysis. The ozone concentration varied fromthe detection limit of 1–85.2 ppb during 21 July. Similarly,HCHO reached its maximum of 7.7 ppb in the morning of21 July 1998. It should be noted that the formaldehydemeasurements carried out at a height of 8 m with a Hantzschmonitor [see Grossmann et al., 2003] yielded roughly twotimes smaller values. The cause of this discrepancy couldnot be resolved yet and is discussed by Grossmann et al.[2003]. HONO mixing ratios were below 500 ppt through-out the beginning of the campaign. The HONO daytimevalues never exceeded the average daytime detection limitof 0.11 ± 0.05 ppb (except for the early morning hours).
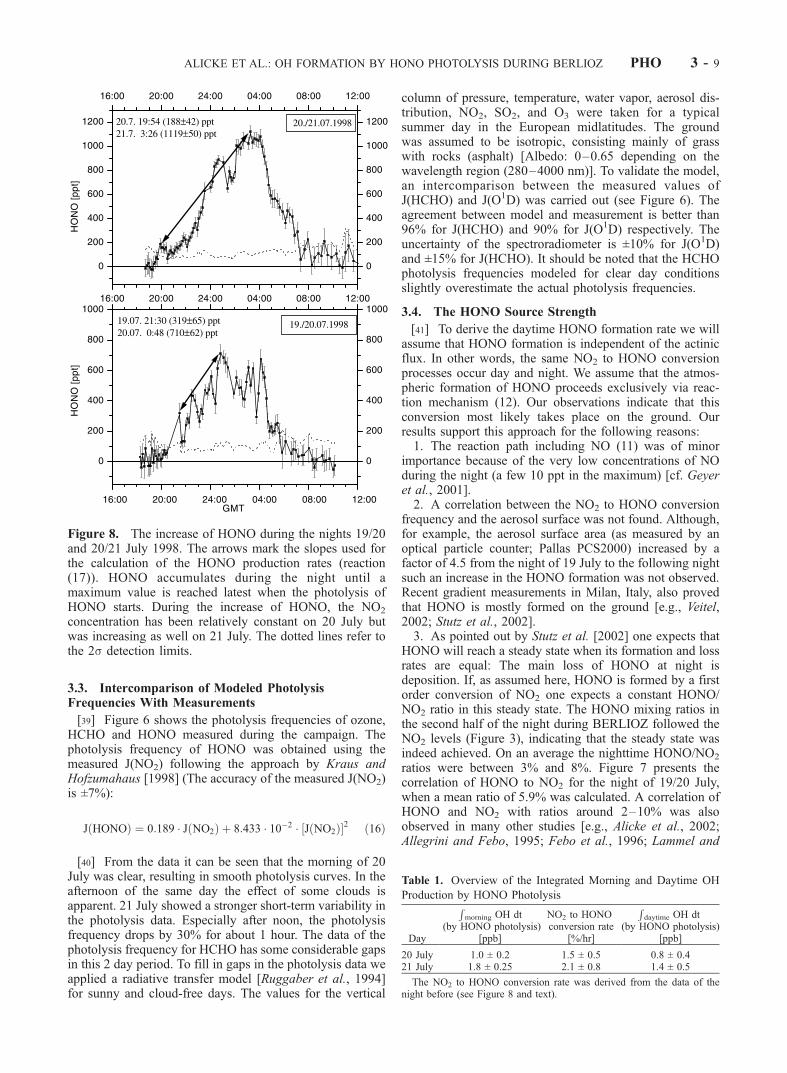
Higher levels were observed during the nights of 19/20 and20/21 July 1998, when also the NO2 levels were highest(see Figure 3). HONO shows the typical diurnal cycle withincreasing concentrations during the night, reaching thehighest values shortly before sunrise (e.g., 1.11 ± 0.05ppb at 0315 GMT on the 21 July).[36] In the following we will concentrate on the period
from the evening of 19 July to the evening of 21 July 1998,the days with the highest photochemical activity and ozoneformation rates.
3.2. Intercomparison of the NO2 Measurements
[37] To control the performance of the two NO2 instru-ments at Pabstthum an intercomparison of the DOAS andthe chemiluminescence/photolytic-converter system datawas made. Due to the different measurement intervals, themore frequent NO2 chemiluminescence data were integratedover the longer measurement interval of the DOAS Whitesystem. A total of 1043 simultaneous data points werecalculated by this method (Figure 5). A linear regressionweighted by the error of the DOAS system yields a slope of1.006 ± 0.005 (White system against chemiluminescencesystem) and a statistically insignificant intercept of 36 ± 19ppt (see Figure 5). The square of the correlation coefficientwas R2 = 0.98. The error of the regression is dominated bythe random error of the DOAS data, which is about 6 timeshigher compared to the uncertainty of the in situ monitor(typically 20 ppt).[38] This agreement is surprisingly good considering that
the systematic error of the DOAS data, which is mainlydetermined by the uncertainty of the literature cross section[Schneider et al., 1987], is about 9%. The excellent agree-ment between the DOAS system and the in situ monitorsuggest that either the cross section by Schneider et al.[1987] is more precise than the uncertainty suggests, or thatby coincidence the systematic errors of the systems canceleach other. Nevertheless, the comparison demonstrates thehigh reliability and quality of the NO2 data obtained by bothsystems.
Figure 7. Correlation of HONO to NO2 for the night 19/20July 1998. An average slope of 5.9% (3–8%) can be derivedfrom the data.
PHO 3 - 8 ALICKE ET AL.: OH FORMATION BY HONO PHOTOLYSIS DURING BERLIOZ
3.3. Intercomparison of Modeled PhotolysisFrequencies With Measurements
[39] Figure 6 shows the photolysis frequencies of ozone,HCHO and HONO measured during the campaign. Thephotolysis frequency of HONO was obtained using themeasured J(NO2) following the approach by Kraus andHofzumahaus [1998] (The accuracy of the measured J(NO2)is ±7%):
[40] From the data it can be seen that the morning of 20July was clear, resulting in smooth photolysis curves. In theafternoon of the same day the effect of some clouds isapparent. 21 July showed a stronger short-term variability inthe photolysis data. Especially after noon, the photolysisfrequency drops by 30% for about 1 hour. The data of thephotolysis frequency for HCHO has some considerable gapsin this 2 day period. To fill in gaps in the photolysis data weapplied a radiative transfer model [Ruggaber et al., 1994]for sunny and cloud-free days. The values for the vertical
column of pressure, temperature, water vapor, aerosol dis-tribution, NO2, SO2, and O3 were taken for a typicalsummer day in the European midlatitudes. The groundwas assumed to be isotropic, consisting mainly of grasswith rocks (asphalt) [Albedo: 0–0.65 depending on thewavelength region (280–4000 nm)]. To validate the model,an intercomparison between the measured values ofJ(HCHO) and J(O1D) was carried out (see Figure 6). Theagreement between model and measurement is better than96% for J(HCHO) and 90% for J(O1D) respectively. Theuncertainty of the spectroradiometer is ±10% for J(O1D)and ±15% for J(HCHO). It should be noted that the HCHOphotolysis frequencies modeled for clear day conditionsslightly overestimate the actual photolysis frequencies.
3.4. The HONO Source Strength
[41] To derive the daytime HONO formation rate we willassume that HONO formation is independent of the actinicflux. In other words, the same NO2 to HONO conversionprocesses occur day and night. We assume that the atmos-pheric formation of HONO proceeds exclusively via reac-tion mechanism (12). Our observations indicate that thisconversion most likely takes place on the ground. Ourresults support this approach for the following reasons:1. The reaction path including NO (11) was of minor
importance because of the very low concentrations of NOduring the night (a few 10 ppt in the maximum) [cf. Geyeret al., 2001].2. A correlation between the NO2 to HONO conversion
frequency and the aerosol surface was not found. Although,for example, the aerosol surface area (as measured by anoptical particle counter; Pallas PCS2000) increased by afactor of 4.5 from the night of 19 July to the following nightsuch an increase in the HONO formation was not observed.Recent gradient measurements in Milan, Italy, also provedthat HONO is mostly formed on the ground [e.g., Veitel,2002; Stutz et al., 2002].3. As pointed out by Stutz et al. [2002] one expects that
HONO will reach a steady state when its formation and lossrates are equal: The main loss of HONO at night isdeposition. If, as assumed here, HONO is formed by a firstorder conversion of NO2 one expects a constant HONO/NO2 ratio in this steady state. The HONO mixing ratios inthe second half of the night during BERLIOZ followed theNO2 levels (Figure 3), indicating that the steady state wasindeed achieved. On an average the nighttime HONO/NO2
ratios were between 3% and 8%. Figure 7 presents thecorrelation of HONO to NO2 for the night of 19/20 July,when a mean ratio of 5.9% was calculated. A correlation ofHONO and NO2 with ratios around 2–10% was alsoobserved in many other studies [e.g., Alicke et al., 2002;Allegrini and Febo, 1995; Febo et al., 1996; Lammel and
Figure 8. The increase of HONO during the nights 19/20and 20/21 July 1998. The arrows mark the slopes used forthe calculation of the HONO production rates (reaction(17)). HONO accumulates during the night until amaximum value is reached latest when the photolysis ofHONO starts. During the increase of HONO, the NO2
concentration has been relatively constant on 20 July butwas increasing as well on 21 July. The dotted lines refer tothe 2s detection limits.
Table 1. Overview of the Integrated Morning and Daytime OH
The NO2 to HONO conversion rate was derived from the data of thenight before (see Figure 8 and text).
ALICKE ET AL.: OH FORMATION BY HONO PHOTOLYSIS DURING BERLIOZ PHO 3 - 9
Cape, 1996; Platt, 1986]. We therefore feel confident thatthe conversion of NO2 on the ground is indeed themechanism responsible for the formation of HONO duringBERLIOZ.[42] To estimate the strength of HONO formation by
reaction (12) during the day we extrapolated this NO2 toHONO conversion during the first half of the night todaytime conditions. Figure 8 shows that the HONO mixingratio increases steadily after sunset and reaches a maximumsometime after midnight. Taking the individual nights, wedetermined the HONO formation by assuming a linearincrease of its mixing ratio during a time interval (t2 �t1). Because of the conversion should be first order in NO2,we scaled the HONO formation rate with the average NO2
concentration. This largely compensates the dependences ofthe HONO concentration toward both its formation fromNO2 and its dilution by vertical mixing (Since both NO2
and HONO are formed near the ground any transportprocess like vertical dilution will not alter the HONO/NO2
ratio).[43] The average nighttime HONO conversion frequency
(HONO production rate scaled with the average NO2
mixing ratio) was then determined for the nights of 19/20and 20/21 July by:
CHONO;night ¼HONO½ t2ð Þ � HONO½ t1ð Þ
t2 � t1ð Þ � NO2½ nightð17Þ
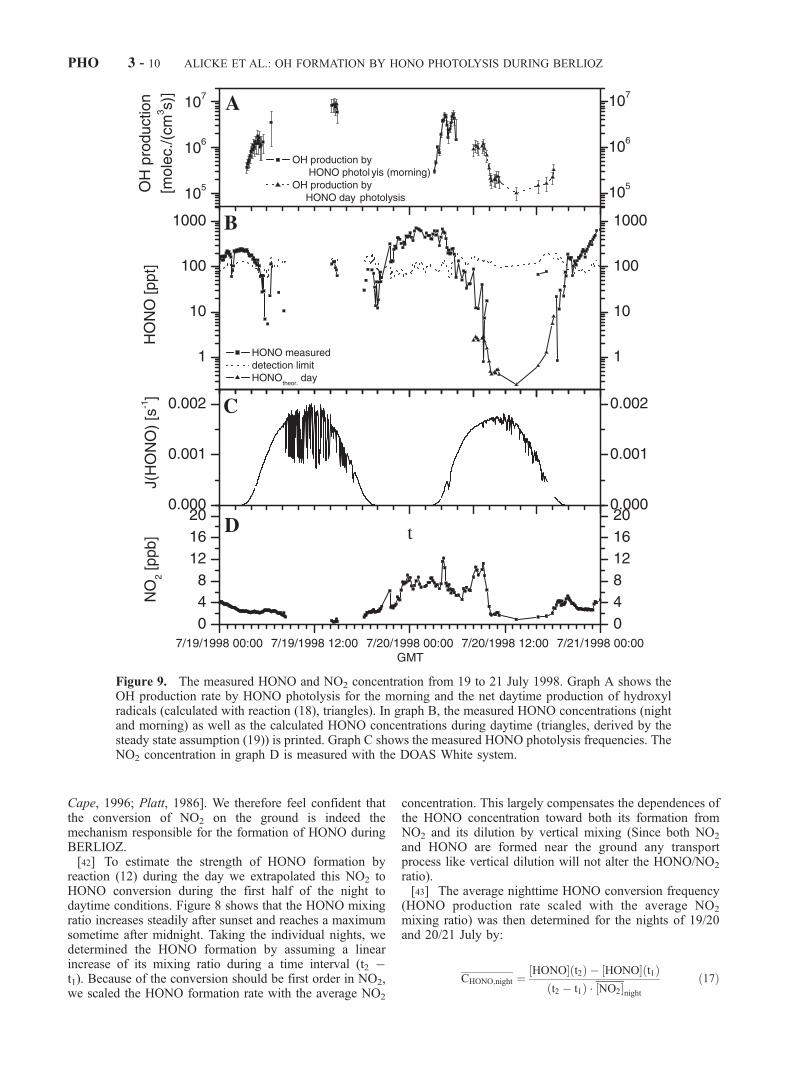
Figure 9. The measured HONO and NO2 concentration from 19 to 21 July 1998. Graph A shows theOH production rate by HONO photolysis for the morning and the net daytime production of hydroxylradicals (calculated with reaction (18), triangles). In graph B, the measured HONO concentrations (nightand morning) as well as the calculated HONO concentrations during daytime (triangles, derived by thesteady state assumption (19)) is printed. Graph C shows the measured HONO photolysis frequencies. TheNO2 concentration in graph D is measured with the DOAS White system.
PHO 3 - 10 ALICKE ET AL.: OH FORMATION BY HONO PHOTOLYSIS DURING BERLIOZ
[44] The results of this calculation are shown in Figure 8and Table 1. Assuming that HONO is formed during the dayby the same mechanisms as during the night, the productionrate at any time t can then be determined by:
PHONO;day tð Þ ¼ CHONO;night � NO2½ tð Þ ð18Þ
[45] Regarding the steady state between OH, NO andHONO due to reactions (10) and (1), this additionalHONO formation will lead to a net OH production rate
during the day, with POH(t) = PHONO,day(t). The simulta-neous measurements of NO, OH, J(HONO), and ourestimation of the daytime production of HONO by reaction(18), makes it possible to estimate the steady state con-centration of HONO during day. Figure 9 shows thedaytime HONO concentrations calculated by a steady stateapproach using:
HONO½ ¼k 10ð Þ � OH½ � NO½ þ PHONO;day
J HONOð Þ ð19Þ
Table 2. Comparison of the Different OH Production Rates During BERLIOZ
VOC + O3 see Table 3 0.7 ± 0.3aEstimated, no LP-DOAS HCHO data at 0520.
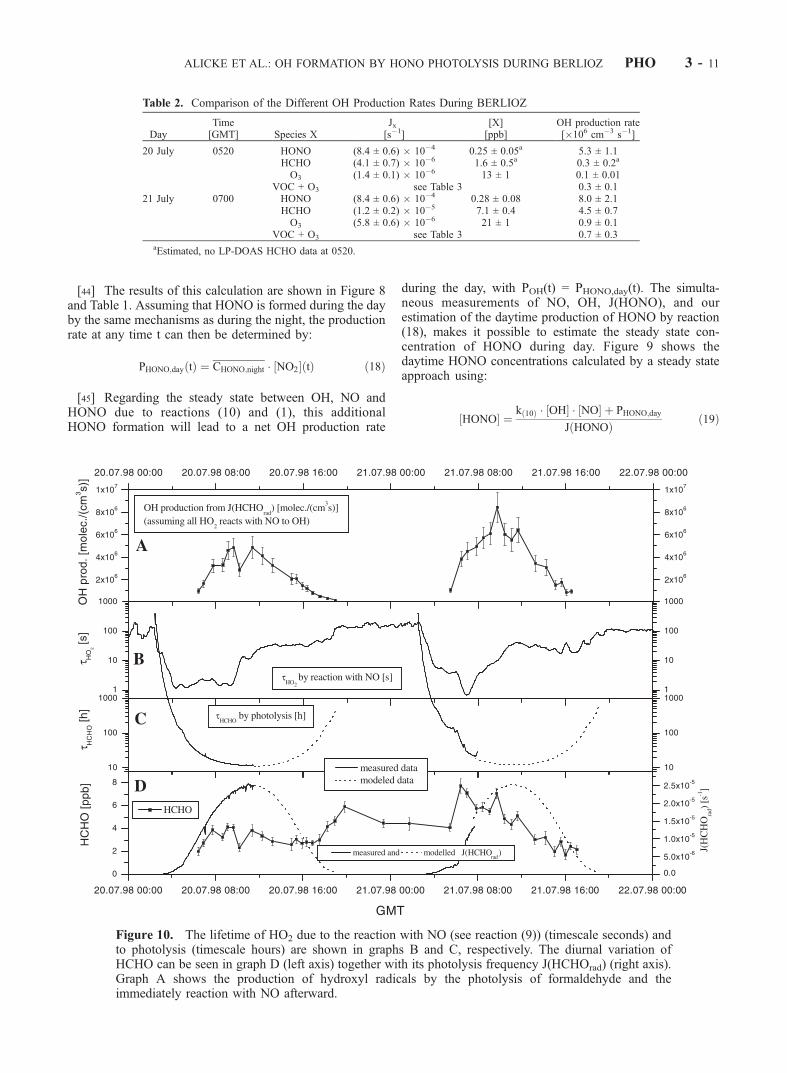
Figure 10. The lifetime of HO2 due to the reaction with NO (see reaction (9)) (timescale seconds) andto photolysis (timescale hours) are shown in graphs B and C, respectively. The diurnal variation ofHCHO can be seen in graph D (left axis) together with its photolysis frequency J(HCHOrad) (right axis).Graph A shows the production of hydroxyl radicals by the photolysis of formaldehyde and theimmediately reaction with NO afterward.
ALICKE ET AL.: OH FORMATION BY HONO PHOTOLYSIS DURING BERLIOZ PHO 3 - 11
[46] At noon the lowest mixing ratios of around 5 pptwere calculated (at this time NO2 was typically around1 ppb). These values are well below the detection limit ofour instruments.
3.5. Quantification of the OH Production Rates
3.5.1. OH Production by HONO Photolysis[47] The amount of OH formed by HONO photolysis was
estimated in two parts. The first uses the available morningdata of HONO and J(HONO). The second estimates theproduction rate of HONO from our nighttime measurementsand extrapolates them to derive daytime OH productionrates (as discussed above, reactions (17)–(19)). To derivethe 24 hour integrated OH production these two terms wereadded.[48] The time series of the OH production rates for the
two selected days are shown in Figure 9. Starting at sunriseHONO is photolyzed into NO and OH and yields a peak inthe early morning OH production rate. The maximum OHproduction rate during this period was (8.0 ± 2.1) � 106
cm�3 s�1 at 0700 GMT on 21 July. The different values forthe 2 days discussed here are summarized in Tables 1 and 2.3.5.2. OH Production by Ozone Photolysis[49] To calculate the OH production rate by ozone pho-
tolysis we used relative humidity data and temperature toderive absolute water concentrations. Together with the
measured O3 concentration and the photolysis frequencythe amount of OH produced according to reactions (2)(3)–(4) is calculated. The average fraction of O(1D) reactingwith water to OH over the complete campaign was 10.3%with variations from 6 to almost 15%. The OH productionrate by ozone photolysis was, as expected, highest duringthe highest UV radiation around noon and negligible duringthe night due to the lack of photolysis.3.5.3. OH Production by HCHO Photolysis[50] The OH production rate by the photolysis of form-
aldehyde was calculated assuming that the produced HO2
by the reaction schemes (5), (7), and (8) is immediatelyconverted into NO2 by reaction (9). Figure 10B comparesthe lifetime of HO2 for the NO concentrations observedduring BERLIOZ. In the morning with concentrations ofNO in the range of 1–9 ppb tHO2 is 5–0.5 s. In theafternoon NO mixing ratios of about 0.2 ppb lead to anHO2 lifetime of 25 s. The photolysis of formaldehyde with alifetime of about 10 hours at noon (Figure 10) is muchslower than the conversion of HO2 to OH, which thereforewas the rate-determining step for the production of OHradicals from HCHO photolysis. The OH production ratefrom HCHO photolysis followed closely the solar radiationand showed a maximum of (8.4 ± 1.4) � 106 cm�3 s�1 at0945 GMT (see Figure 10).3.5.4. OH Production of the Reaction of VOCs WithOzone[51] The OH production rate from the reaction of ozone
with alkenes, as recently reviewed by Paulson et al. [1999],was calculated by taking the OH formation yield of eachreaction into account (see Table 3). Due to the rural site,high amounts of biogenic VOCs were present. Since onlya-pinene was measured directly, we used the calculationspublished by Geyer et al. [2001] to estimate the concen-trations of other monoterpenes. These calculations werebased on emission factors of the surrounding vegetation.Table 3 also lists the rate constants of the reaction of theVOCs with O3 and the yield of OH. Based on this data wecalculated the formation of OH radicals from ozonolysisthroughout the day. The last column in Table 3 shows therelative contribution of the individual VOCs from 19 to 21July 1998, at Pabstthum. During BERLIOZ a-pinene and 2-methyl-2-butene were the most important compounds. Sinceour measurements and calculations did not consider allVOCs, which might be present, our calculation only repre-sents a lower limit of this mechanism.
Table 3. Overview of the VOCs Used to Derive the OH
Production by Ozonolysis During BERLIOZ Including Their
Reaction Constants [Atkinson, 1997] and OH Formation Yields
PHO 3 - 12 ALICKE ET AL.: OH FORMATION BY HONO PHOTOLYSIS DURING BERLIOZ
[52] This OH production mechanism is independent ofsolar radiation. It therefore proceeded throughout the day.At night it was the most important OH formation mecha-nism producing about 106 OH cm�3 s�1 on 21 July at night.During the day, with lower terpene concentrations, theformation was lower. With the exception of NO3 + VOC
this was the only source of hydroxyl radicals during thenight [see Geyer et al., 2001, 2003].3.5.5. Reaction of NO3 With Monoterpenes[53] Hydroxyl radicals can also be formed by the reaction
of the nitrate radical with alkenes. The importance of thismechanism was modeled by Geyer et al. [2003] and
103
104
105
106
107
103
104
105
106
107
103
104
105
106
107
103
104
105
106
107
GMT
from J(O1D) J(HONO) J(HONO
day)
VOC's + O3
J(HCHOrad
)
OH
pro
duct
ion
[mol
ec./
(cm
3 s)]
00:00 04:00 08:00 12:00 16:00 20:00 24:00
00:00 04:00 08:00 12:00 16:00 24:00
21.07.1998
20.07.1998
00:00 04:00 08:00 12:00 16:00 20:00 24:00
20:00
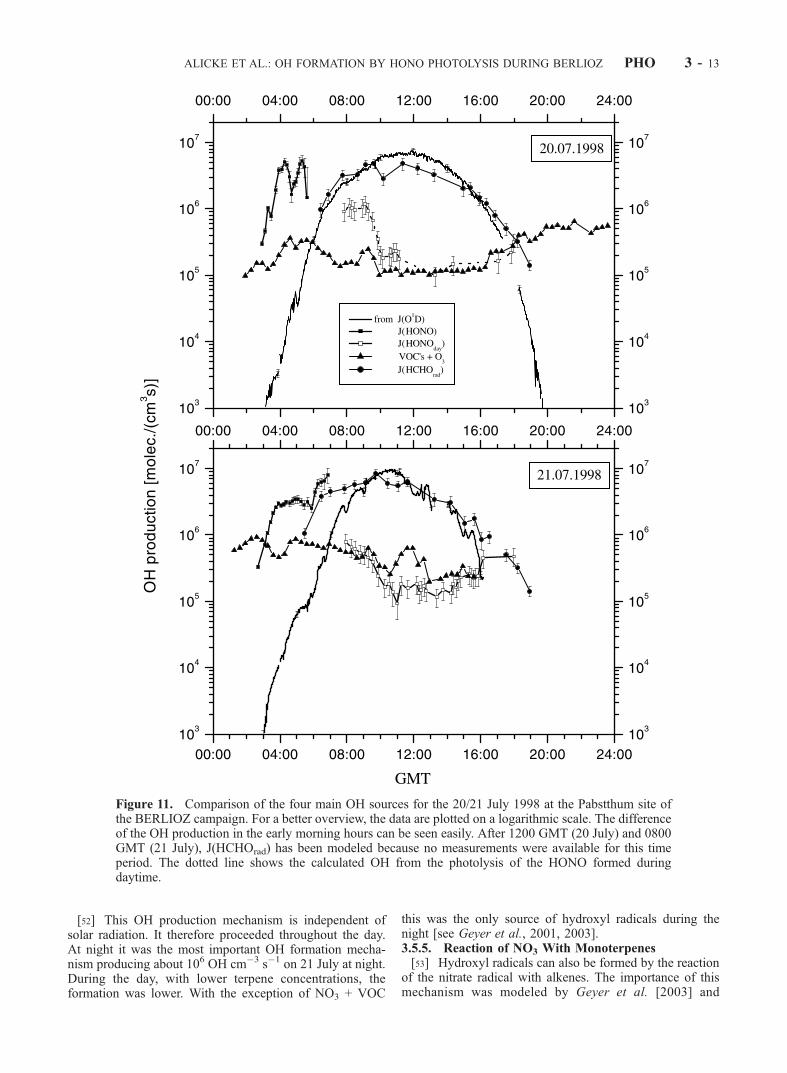
Figure 11. Comparison of the four main OH sources for the 20/21 July 1998 at the Pabstthum site ofthe BERLIOZ campaign. For a better overview, the data are plotted on a logarithmic scale. The differenceof the OH production in the early morning hours can be seen easily. After 1200 GMT (20 July) and 0800GMT (21 July), J(HCHOrad) has been modeled because no measurements were available for this timeperiod. The dotted line shows the calculated OH from the photolysis of the HONO formed duringdaytime.
ALICKE ET AL.: OH FORMATION BY HONO PHOTOLYSIS DURING BERLIOZ PHO 3 - 13
represented an additional OH source during the night ofabout 25% compared to the ozone + alkene reaction.Integrated over 24 hours, this source contributed to lessthan 2% of the total OH production mechanisms.
3.6. Comparison of the Contribution of the DifferentOH Production Mechanisms
[54] Figure 11 summarizes and compares the differentOH formation mechanisms discussed above. Before sunrise
only the reactions of ozone with alkenes and the reaction ofNO with RO2 from NO3 reactions produce OH radicals.This changes at sunrise when, for about 3–4 hours, HONOphotolysis is by far the most important source, with peakformation rates of (5.3 ± 1.1) � 106 and (8.0 ± 2.1) � 106
cm�3 s�1 on 20 and 21 July, respectively. The only othernonnegligible process at this time of the day was thereaction of ozone with alkenes, which produced up to (1.8± 0.7) � 106 cm�3 s�1 at 0323 GMT on 21 July. As
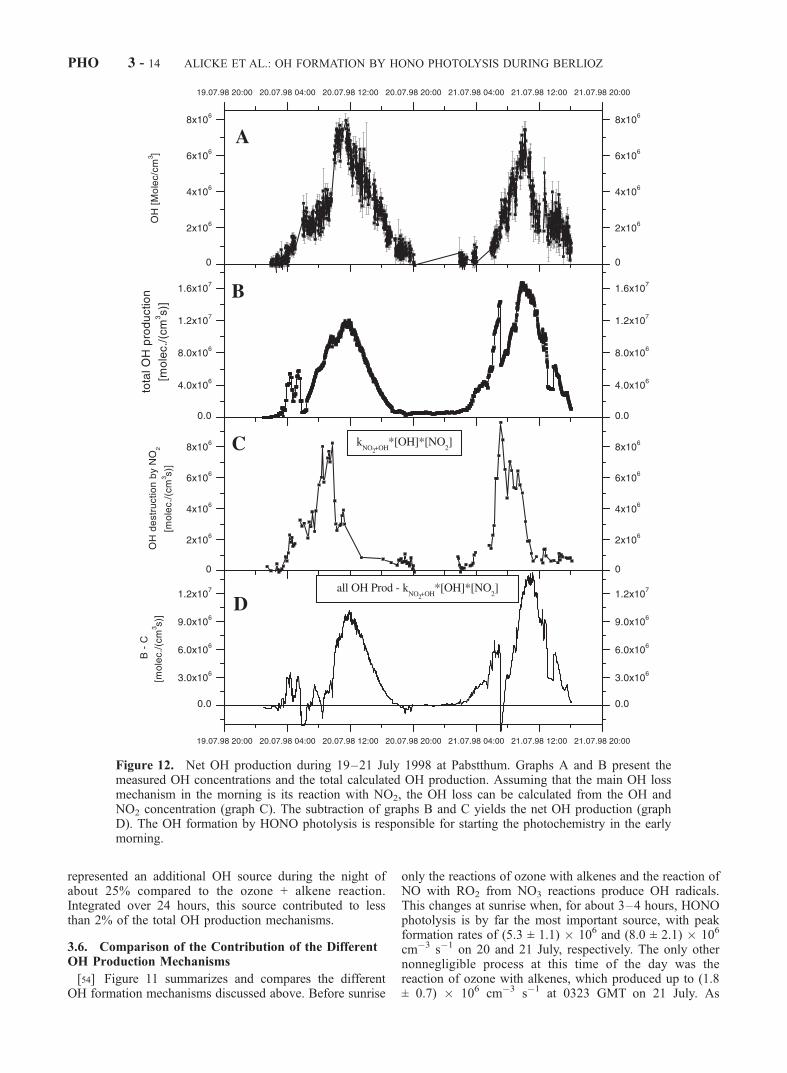
Figure 12. Net OH production during 19–21 July 1998 at Pabstthum. Graphs A and B present themeasured OH concentrations and the total calculated OH production. Assuming that the main OH lossmechanism in the morning is its reaction with NO2, the OH loss can be calculated from the OH andNO2 concentration (graph C). The subtraction of graphs B and C yields the net OH production (graphD). The OH formation by HONO photolysis is responsible for starting the photochemistry in the earlymorning.
PHO 3 - 14 ALICKE ET AL.: OH FORMATION BY HONO PHOTOLYSIS DURING BERLIOZ
discussed above, the HCHO photolysis becomes importantonly after most of the nighttime HONO has been photo-lyzed, around 7–8 GMT. Considering the error in ourHCHO measurements, the formaldehyde photolysis consti-tutes an OH source comparable in magnitude to ozonephotolysis. Both pathways follow solar radiation, showinga maximum around noon. The peak formation rates for bothprocesses are in the range of 6 � 106 cm�3 s�1. During theday the HONO photolysis and O3 + alkene reactions onlyplay a minor role compared to the much stronger ozone andHCHO photolysis pathways.[55] To estimate the role of the different pathways for the
total OH production over the day we integrated the OHyielding processes (see Figure 11 and Table 4) over 24 hours.The highest value is provided by the O3 photolysis (reaction(2)) with 6.0 ± 0.7 ppb (5.2 ± 0.6 ppb for 21 July) of OHduring 24 hours. The photolysis of formaldehyde (reaction(5) + (7) � (9)) plays a major role at the Pabstthum site,as previously postulated by Ehhalt et al. [1998] andKleinman et al. [1995]. The OH production integratedover a 24 hour period is 4.6 ± 0.9 ppb (6.4 ± 1.2 ppb for21 July).[56] As noted above, the formaldehyde measurements
carried out at a height of 8 m with the Hantzsch monitorshow about two times smaller values. Calculating withthese concentrations, the maximum of OH produced byHCHO is 3.2 ± 0.5 ppb for 20 July and 4.4 ± 0.7 ppb ofOH production on 21 July. By these values, the impor-tance of HONO for the total OH budget even becomesmore significant.
3.7. Comparison With OH and HO2 Measurements
[57] On a first view the direct comparison of the calcu-lated OH production rate by HONO photolysis with meas-ured OH concentrations [Holland et al., 2003] at theBERLIOZ site Pabstthum gives no direct evidence for theadditional OH source by photolysis of HONO (Figure 12).Note, however, that there is a gap in the morning OHmeasurement data during the highest peak of OH productionfrom J(HONO) on 20 July and for a few hours on 21 July1998 as well. Nevertheless there is some evidence for therole of HONO photolysis for OH production: The OH levelsstart to increase around 0400 GMTwhile its earliest increaseis expected at 0600 GMT from pure ozone photolysis. At0500 GMT the OH concentration surpasses 106 cm�3
(Figure 12). Although the OH production at 0500 GMT issimilar to noon values, the OH concentration of 106 cm�3
is clearly below the noon level.[58] It was recently suggested that the HONO production
of OH in the morning is absorbed by the elevated NO2
concentrations that are simultaneously present. The OHformed by HONO photolysis can react with NO2 and formHNO3:
OHþ NO2 ! HNO3 ð20Þ
[59] To calculate the production of OH radicals availableto the oxidation of hydrocarbons we subtracted the rate ofOH destruction by reaction (20) from the total OH forma-tion by all mechanisms described above. Figure 12 showsthat, particularly in the late morning hours when the NO2
concentration is still high, the destruction of OH by NO2 is
important. Nevertheless we found a positive OH productionon both days, mainly by HONO photolysis in the earlymorning (see Figure 12D). Only later in the morning anoverall net OH destruction is observed for about 1–2 hours.We therefore conclude that HONO photolysis represents anOH source in the early morning hours, which starts theozone production by oxidizing hydrocarbons.[60] A first attempt to compare the measured OH data
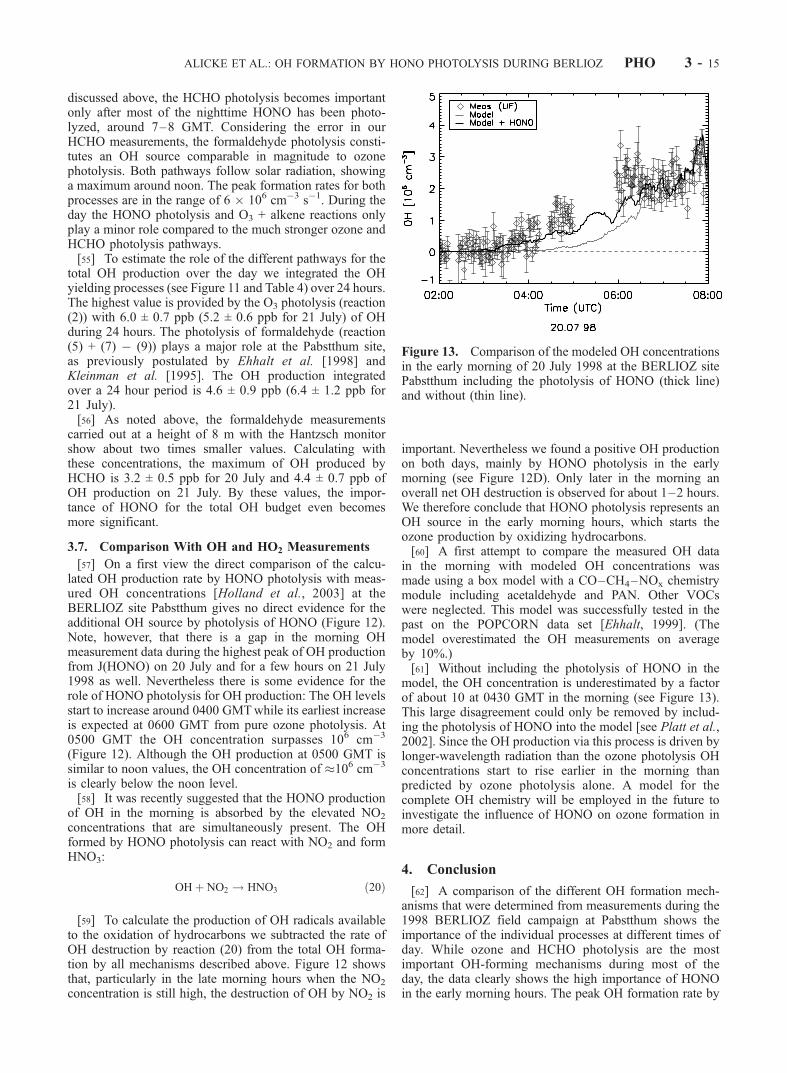
in the morning with modeled OH concentrations wasmade using a box model with a CO–CH4–NOx chemistrymodule including acetaldehyde and PAN. Other VOCswere neglected. This model was successfully tested in thepast on the POPCORN data set [Ehhalt, 1999]. (Themodel overestimated the OH measurements on averageby 10%.)[61] Without including the photolysis of HONO in the
model, the OH concentration is underestimated by a factorof about 10 at 0430 GMT in the morning (see Figure 13).This large disagreement could only be removed by includ-ing the photolysis of HONO into the model [see Platt et al.,2002]. Since the OH production via this process is driven bylonger-wavelength radiation than the ozone photolysis OHconcentrations start to rise earlier in the morning thanpredicted by ozone photolysis alone. A model for thecomplete OH chemistry will be employed in the future toinvestigate the influence of HONO on ozone formation inmore detail.
4. Conclusion
[62] A comparison of the different OH formation mech-anisms that were determined from measurements during the1998 BERLIOZ field campaign at Pabstthum shows theimportance of the individual processes at different times ofday. While ozone and HCHO photolysis are the mostimportant OH-forming mechanisms during most of theday, the data clearly shows the high importance of HONOin the early morning hours. The peak OH formation rate by
Figure 13. Comparison of the modeled OH concentrationsin the early morning of 20 July 1998 at the BERLIOZ sitePabstthum including the photolysis of HONO (thick line)and without (thin line).
ALICKE ET AL.: OH FORMATION BY HONO PHOTOLYSIS DURING BERLIOZ PHO 3 - 15
HONO photolysis is comparable to the one by ozonephotolysis at noon, but the formation only lasts for about3–4 hours. Although HONO is only found in the presenceof elevated NO2 concentrations, which can remove the OHvia the formation of HNO3, we found a net OH productionrate available for VOC oxidation from HONO photolysis.This shows that HONO photolysis can indeed start andaccelerate the oxidation processes in the morning.[63] The integrated morning OH formation of 1.0 ± 0.2
ppb (1.8 ± 0.3 ppb for 21 July) from HONO photolysis hasto be compared to the 24h integrals of the other OH sources(J(HCHOrad) + J(O1D) + OH from the VOCs) which formtogether 11.4 ± 1.9 ppb of OH (13.4 ± 2.5 ppb for 21 July).The morning HONO peak alone constitutes around 10–15% of the total daily OH formation. Calculating theHONO source strength from the increase of HONO duringthe night, we get an additional OH production duringdaytime of 0.8±0.4 ppb (1.4 ± 0.5 ppb for 21 July) forthe measured photolysis frequencies and NO2 concentra-tions on the example day 20 July 1998. The integrated OHproduction over 24 hours shows that the photolysis ofHONO contributed up to 20% of the total hydroxyl radicalamount during these days at Pabstthum.
[64] Acknowledgments. This project was supported by the BMBF inthe framework of TFS-LT3 (contract 422-4007-07TFS 31/H.B.3). Wewould like to thank two anonymous referees for their careful revision ofthe manuscript and their helpful comments to improve the paper.
ReferencesAlicke, B., U. Platt, and J. Stutz, Impact of nitrous acid photolysis on thetotal hydroxyl radical budget during the Limitation of Oxidant Produc-tion/Pianura Padana Produzione di Ozono study in Milan, J. Geophys.Res., 107(D22), 8196, doi:10.1029/2000JD000075, 2002.
Allegrini, I., and A. Febo, Role of nitrous acid on the oxidation processes inthe Mediterranean urban areas, Ann. Chim., 85(7–8), 471–485, 1995.
Ammann, M., M. Kalberer, D. T. Jost, L. Tobler, E. Rossler, D. Piguet,H. W. Gaggeler, and U. Baltensperger, Heterogeneous production ofnitrous acid on soot in polluted air masses, Nature, 395, 157–160, 1998.
Atkinson, R., Gas-phase tropospheric chemistry of volatile organic com-pounds, 1, Alkanes and alkenes, J. Phys. Chem. Ref. Data, 26, 215–290,1997.
Atkinson, R., and S. M. Aschmann, OH radical production from the gas-phase reactions of O3 with a series of alkenes under atmospheric condi-tions, Environ. Sci. Technol., 27, 1357–1363, 1993.
Bey, I., G. Aumont, and G. Toupance, A modelling study of the nighttimeradical chemistry in the lower continental troposphere, 2, Origin andevolution of HOx, J. Geophys. Res., 106, 9991–10001, 2001.
Brauers, T., M. Hausmann, U. Brandenburger, and H. P. Dorn, Improve-ment of differential optical absorption spectroscopy with a multichannelscanning technique, Appl. Opt., 34(21), 4472–4479, 1995.
Brauers, T., U. Aschmutat, U. Brandenburger, H. P. Dorn, M. Hausmann,M. Hessling, A. Hofzumahaus, F. Holland, C. Plassdulmer, and D. H.Ehhalt, Intercomparison of tropospheric OH radical measurements bymultiple folded long-path laser absorption and laser induced fluores-cence, Geophys. Res. Lett., 23, 2545–2548, 1996.
Calvert, J. G., G. Yarwood, and A. M. Dunker, An evaluation of themechanism of nitrous acid formation in the urban atmosphere, Res.Chem. Intermed., 20(3–5), 463–502, 1994.
Chan, W. H., R. J. Nordstrom, J. G. Calvert, and J. H. Shaw, Kinetic studyof HONO formation and decay reactions in gaseous mixtures of HONO,NO, NO2, H2O, and N2, Environ. Sci. Technol., 10, 674–682, 1976.
Criegee, R., Mechanisms of ozonolysis, Angew. Chem. Int. Ed. Engl., 14,745–752, 1975.
Crutzen, P. J., and P. H. Zimmermann, The changing photochemistry of thetroposphere, Tellus, 43, 136–151, 1991.
Ehhalt, D. H., Photooxidation of trace gases in the troposphere, Phys.Chem. Chem. Phys., 1, 5401–5408, 1999.
Ehhalt, D. H., F. Rohrer, A. Wahner, M. J. Prather, and D. R. Blake, On theuse of hydrocarbons for the determination of tropospheric OH concentra-tions, J. Geophys. Res., 103, 18,981–18,997, 1998.
Eisele, F. L., G. H. Mount, D. Tanner, A. Jefferson, R. Shetter, J. W. Harder,and E. J. Williams, Understanding the production and interconversion ofthe hydroxyl radical during the Tropospheric OH Photochemistry Experi-ment, J. Geophys. Res., 102, 6457–6465, 1997.
Febo, A., C. Perrino, and I. Allegrini, Measurement of nitrous acid inMilan, Italy, by DOAS and diffusion denuders, Atmos. Environ., 30,3599–3609, 1996.
Febo, A., C. Perrino, and M. Cortiello, A denuder technique for the mea-surement of nitrous acid in urban atmospheres, Atmos. Environ., 27,1721–1728, 1993.
Finlayson-Pitts, B. J. and J. N. Pitts, Chemistry of the Upper and LowerAtmosphere: Theory, Experiments and Applications, xxii, 969 pp., Aca-demic, San Diego, Calif., 2000.
Geyer, A., B. Alicke, D. Mihelcic, J. Stutz, and U. Platt, Comparison oftropospheric NO3 radical measurements by differential optical absorptionspectroscopy and matrix isolation electron spin resonance, J. Geophys.Res., 104, 26,097–26,105, 1999.
Geyer, A., B. Alicke, S. Konrad, T. Schmitz, J. Stutz, and U. Platt, Chem-istry and oxidation capacity of the nitrate radical in the continentalboundary layer near Berlin, J. Geophys. Res., 106, 8013–8025, 2001.
Geyer, A., et al., Nighttime formation of peroxy and hydoxyl radicalsduring the BERLIOZ campaign: Observations and modeling studies,J. Geophys. Res., 108, doi:10.1029/2001JD000656, in press, 2003.
Goodman, A. L., G. M. Underwood, and V. H. Grassian, Heterogeneousreaction of NO2: Characterization of gas-phase and adsorbed productsfrom the reaction, 2 NO2(g) + H2O(a) ! HONO(g) + NO3(a) on hy-drated silica particles, J. Phys. Chem. A, 103, 7217–7223, 1999.
Grossmann, D., G. Moortgat, M. Kibler, S. Schlomski, K. Bachmann,B. Alicke, A. Geyer, U. Platt, M. Hammer, and B. Vogel, Hydrogenperoxide, organic peroxides, carbonyl compounds and organic acids mea-sured in Pabstthum during BERLIOZ, J. Geophys. Res., 108, doi:10.1029/2001JD001096, in press, 2003.
Harder, J. W., J. W. Brault, P. V. Johnston, and G. H. Mount, Temperaturedependent NO2 cross section at high spectral resolution, J. Geophys. Res.,102, 3861–3879, 1997.
Harris, G. W., W. P. L. Carter, A. M. Winer, J. N. Pitts, U. Platt, and D.Perner, Observations of nitrous acid in the Los Angeles atmosphere andimplications for the predictions of ozone–precursor relationships, Envir-on. Sci. Technol., 16, 414–419, 1982.
Harrison, R. M., and A. M. N. Kitto, Evidence for a surface source ofatmospheric nitrous acid, Atmos. Environ., 28, 1089–1094, 1994.
Harrison, R. M., J. D. Peak, and G. M. Collins, Tropospheric cycle ofnitrous acid, J. Geophys. Res., 101, 14,429–14,439, 1996.
Hofzumahaus, A., A. Kraus, and M. Muller, Solar actinic flux spectrora-diometry: A technique for measuring photolysis frequencies in the atmo-sphere, Appl. Opt., 38(21), 4443–4460, 1999.
Holland, F., U. Aschmutat, M. Hessling, A. Hofzumahaus, and D. H.Ehhalt, Highly time resolved measurements of OH during POPCORNusing laser-induced fluorescence spectroscopy, J. Atmos. Chem., 31,205–225, 1998.
Holland, F., A. Hofzumahaus, J. Schafer, A. Kraus, and H.-W. Patz,Measurements of OH and H2O radical concentrations and photolysisfrequencies during BERLIOZ, J. Geophys. Res., 108, doi:10.1029/2001JD001393, in press, 2003.
Howard, C. J., Kinetics of the reaction of HO2 with NO2, J. Chem. Phys.,67, 5258–5263, 1977.
Jenkin, M. I., R. A. Cox, and D. J. Williams, Laboratory studies of thekinetics of formation of nitrous acid from the thermal reaction of nitrogendioxide and water vapour, Atmos. Environ., 22, 487–498, 1988.
Junkermann, W., and T. Ibusuki, FTIR spectroscopic measurements of sur-face bond products of nitrogen oxides on aerosol surfaces: Implicationsfor heterogeneous HNO2 production, Atmos. Environ., 26, 3099–3103,1992.
Kaiser, E.W., and C. H.Wu, Measurement of the rate constant of the reactionof nitrous acid with nitric acid, J. Phys. Chem., 81, 187–190, 1977.
Kalberer, M., M. Ammann, F. Arens, H. W. Gaggeler, and U. Baltensperger,Heterogeneous formation of nitrous acid (HONO) on soot aerosol parti-cles, J. Geophys. Res., 104, 13,825–13,832, 1999.
Kessler, C. and U. Platt, Nitrous acid in polluted air masses: Sources andformation pathways, Proceeding on the 3rd Eur. Symp. on Phys. Chem.Behav. of Atmos. Pollut., Varese, Italia, 10–12 Apr., pp. 412–422, D.Reidell, Norwell, Mass., 1984.
Kleinman, L., L. Yin-Nan, S. R. Springston, J. H. Lee, L. Nunnermacker,J. Weinstein-Lloyd, Z. Xianliang, and L. Newman, Peroxy radical con-centration and ozone formation rate at a rural site in the southeasternUnited States, J. Geophys. Res., 100, 7263–7273, 1995.
Knoll, P., R. Singer, and W. Kiefer, Improving spectroscopic techniques bya scanning multichannel method, Appl. Spectrosc., 44, 776–782, 1990.
Konrad, S., and A. Volz-Thomas, Characterization of a commercial gaschromatography– flame ionization detection system for the in situ deter-
PHO 3 - 16 ALICKE ET AL.: OH FORMATION BY HONO PHOTOLYSIS DURING BERLIOZ
mination of C5–C10 hydrocarbons in ambient air, J. Chromatogr. A,872(2), 215–234, 2001.
Kraus, A., and A. Hofzumahaus, Field measurements of atmospheric photo-lysis frequencies for O3, NO2, HCHO, CH3CHO, H2O2, and HONO byUV spectroradiometry, J. Atmos. Chem., 31, 161–180, 1998.
Lammel, G., and J. N. Cape, Nitrous acid and nitrite in the atmosphere,Chem. Soc. Rev., 25(5), 361, 1996.
Lammel, G., and D. Perner, The atmospheric aerosol as a source of nitrousacid in the polluted atmosphere, J. Aerosol Sci., 19, 1199–1202, 1988.
Logan, J. I., M. J. Prather, S. C. Wofsy, and M. B. McElroy, Troposphericchemistry: A global perspective, J. Geophys. Res., 86, 7210–7254, 1981.
Longfellow, C. A., T. Imamura, A. R. Ravishankara, and D. R. Hanson,HONO solubility and heterogeneous reactivity on sulfuric acid surfaces,J. Phys. Chem. A, 102, 3323–3332, 1998.
Meller, R., and G. K. Moortgart, Temperature dependence of the absorptioncross sections of formaldehyde between 223 and 323 K in the wavelengthrange 225–375 nm, J. Geophys. Res., 201, 7089–7101, 2000.
Mihelcic, D., F. Holland, A. Hofzumahaus, L. Hoppe, S. Konrad, P.Musgen, H.-W. Patz, H.-J. Schafer, T. Schmitz, and A. Volz-Thomas,Peroxy radicals during BERLIOZ at Pabstthum: Measurements, radical,budgets, and ozone production,, J. Geophys. Res., 108, doi:10.1029/2001JD001014, in press, 2003.
Muller, M., A. Kraus, and A. Hofzumahaus, O-3-P O(D-1) Photolysisfrequencies determined from spectroradiometric measurements of solaractinic UV-radiation: Comparison with chemical actinometer measure-ments, Geophys. Res. Lett., 22, 679–682, 1995.
Nguyen, M. T., R. Sumathi, D. Sengupta, and J. Peeters, Theoretical ana-lysis of reactions related to the HNO2 energy surface: OH + NO and H +NO2, Chem. Phys., 230(1), 1–11, 1998.
Notholt, J., J. Hjorth, and F. Raes, Formation of HNO2 on aerosol surfacesduring foggy periods in the presence of NO and NO2, Atmos. Environ.,26A, 211–217, 1992.
Paulson, S. E., A. D. Sen, L. Ping, J. D. Fenske, and M. J. Fox, Evidencefor formation of OH radicals from the reaction of O3 with alkenes in thegas phase, Geophys. Res. Lett., 24, 3193–3196, 1997.
Paulson, S. E., M. Y. Chung, and A. S. Hasson, OH radical formation fromthe gas-phase reaction of ozone with terminal alkenes and the relationshipbetween structure and mechanism, J. Phys. Chem. A, 103, 8125–8138,1999.
Perner, D., and U. Platt, Detection of nitrous acid in the atmosphere bydifferential optical absorption, Geophys. Res. Lett., 6, 917–920, 1979.
Pitts, J. N., E. Sanhueza, R. Atkinson, W. P. L. Carter, A. M. Winer, G. W.Harris, and C. N. Plum, An investigation of the dark formation of nitrousacid in environmental chambers, Int. J. Chem. Kinet., XVI, 919–939,1984.
Platt, U., The Origin of Nitrous and Nitric Acid in the Atmosphere, editedby W. Jaeschke, pp. 299–319, Springer-Verlag, New York, 1986.
Platt, U., Differential Optical Absorption Spectroscopy (DOAS), in Mon-itoring by Spectroscopic Techniques, edited by M. W. Sigrist, pp. 27–84,John Wiley, New York, 1994.
Platt, U., and D. Perner, Direct measurements of atmospheric CH2O,HNO2, O3, NO2, and SO2 by differential optical absorption in the nearUV, J. Geophys. Res., 85, 7453–7458, 1980.
Platt, U., D. Perner, G. W. Harris, A. M. Winer, and J. N. Pitts, Observa-tions of nitrous acid in an urban atmosphere by differential optical ab-sorption, Nature, 285, 312–314, 1980.
Platt, U., G. Lebras, G. Poulet, J. P. Burrows, and G. Moortgat, Peroxyradicals from night-time reaction of NO3 with organic compounds, Nat-ure, 348, 147–149, 1990.
Platt, U., et al., Free radicals and fast photochemistry during BERLIOZ,J. Atmos. Chem., 42, 359–394, 2002.
Prinn, R. G., R. F. Weiss, B. R. Miller, J. Huang, F. N. Alyea, D. M.Cunnold, P. J. Fraser, D. E. Hartley, and P. G. Simmonds, Atmospherictrends and lifetime of CH3CCl2 and global OH concentrations, Science,269(5221), 187–192, 1995.
Ritz, D., M. Hausmann, and U. Platt, An improved open multi-path reflec-tion cell for the measurement of NO2 and NO3, in Optical Methods inAtmospheric Chemistry, edited by H. Schiff and U. Platt, Proc. SPIE Int.Soc. Opt. Eng. 1715, 200–211, 1992.
Ruggaber, A., R. Dlugi, and T. Nakajima, Modelling radiation quantitiesand photolysis frequencies in the troposphere, J. Atmos. Chem., 18, 171–210, 1994.
Sakamaki, F., S. Hatakeyama, and H. Akimoto, Formation of nitrous acidand nitric oxide in the heterogeneous dark reaction of nitrogen dioxideand water vapor in a smog chamber, Int. J. Chem. Kinet., XV, 1013–1029, 1983.
Schneider, W., G. K. Moortgat, G. S. Tyndall, and J. P. Burrows, Absorp-tion cross-sections of NO2 in the UV and visible region (200–700 nm) at298 K, J. Photochem. Photobiol., 40, 195–217, 1987.
Sjodin, A., Studies of the diurnal variation of nitrous acid in urban air,Environ. Sci. Technol., 22, 1086–1089, 1988.
Sjodin, A., and M. Ferm, Measurement of nitrous acid in an urban area,Atmos. Environ., 19, 985–992, 1985.
Stockwell, R. W., and J. G. Calvert, The near ultraviolet absorption spec-trum of gaseous HONO and N2O3, J. Photochem., 8, 193–203, 1978.
Stuhl, F., and H. Niki, Flash photochemical study of the reaction OH + NO+ M using resonance fluorescent detection of OH, J. Chem. Phys., 57,3677–3679, 1972.
Stutz, J., Messung der Konzentration tropospharischer Spurenstoffe mittelsDifferentieller Optischer Absorptionspektroskopie: Eine neue Gernera-tion von Geraten und Algorithmen, Ph.D. thesis, Univ. Heidelberg, Hei-delberg, 1996.
Stutz, J., and U. Platt, Problems in using diode arrays for open pathDOAS measurements of atmospheric species, in Optical Methods inthe Atmospheric Chemistry, Proc. SPIE Int. Soc. Opt. Eng. 1715,329–340, 1992.
Stutz, J., and U. Platt, Numerical analysis and estimation of the statisticalerror of differential optical absorption spectroscopy measurements withleast-squares methods, Appl. Opt., 35(30), 6041–6053, 1996.
Stutz, J., and U. Platt, Improving long-path differential optical absorptionspectroscopy with a quartz-fiber mode mixer, Appl. Opt., 36(6), 1105–1115, 1997.
Stutz, J., E. S. Kim, U. Platt, P. Bruno, C. Perrino, and A. Febo, UV-visibleabsorption cross section of nitrous acid, J. Geophys. Res., 105, 14,585–14,592, 2000.
Stutz, J., B. Alicke, and A. Neftel, Nitrous acid formation in the urbanatmosphere: Gradient measurements of NO2 and HONO over grassin Milan, Italy, J. Geophys. Res., 107(D22), 8192, doi:10.1029/2001JD000390, 2002.
Svensson, R., E. Ljungstrom, and O. Lindqvist, Kinetics of the reactionbetween nitrogen dioxide and water vapour, Atmos. Environ., 21, 1529–1539, 1987.
Tyndall, G. S., J. J. Orlando, and J. G. Calvert, Upper limit for the ratecoefficient for the reaction HO2 + NO2 ! HONO + O2, Environ. Sci.Technol., 29, 202–206, 1995.
Veitel, H., Vertical profiles of NO2 and HONO in the planetary boundarylayer, Ph.D. thesis, Univ. Heidelberg, Heidelberg, Germany, 2002.
Volz-Thomas, A., H. Geiss, A. Hofzumahaus, and K.-H. Becker, Fastphotochemistry experiment in BERLIOZ (PHOEBE): An introduction,J. Geophys. Res., 108, doi:10.1029/2001JD002029 in press, 2003a.
Volz-Thomas, A., H.-W. Patz, N. Houben, S. Konrad, D. Mihelcic,T. Klupfel, and D. Perner, Inorganic trace gases and peroxy radicalsduring BERLIOZ at Pabstthum: An investigation of the photostationarystate of NOx and O3, J. Geophys. Res., 108, doi:10.1029/2001JD001255in press, 2003b.
White, J. U., Long optical paths of large aperture, J. Opt. Soc. Am., 32,285–288, 1942.
White, J. U., Very long optical paths in air, J. Opt. Soc. Am., 66, 411–416,1976.
Winer, A. M., and H. W. Biermann, Long pathlength Differential OpticalAbsorption Spectroscopy (DOAS) measurements of gaseous HONO,NO2 and HCHO in the California South Coast Air Basin, Res. Chem.Intermed., 20(3–5), 423–445, 1994.
�����������������������B. Alicke and U. Platt, Institut fur Umweltphysik, Universitat
Heidelberg, INF 229, D-69120 Heidelberg, Germany. ([email protected])A. Hofzumahaus, F. Holland, S. Konrad, H. W. Patz, J. Schafer, and A.
Volz-Thomas, Stettiner Staatsforst, Forschungszentrum Julich, D-52425Julich, Germany.J. Stutz and A. Geyer, Department of Atmospheric Sciences, University
of California, Los Angeles, 7172 Math Sciences, Box 951565, LosAngeles, CA 90095-1565, USA.
ALICKE ET AL.: OH FORMATION BY HONO PHOTOLYSIS DURING BERLIOZ PHO 3 - 17


![Impacts of aerosols and clouds on photolysis frequencies and ... of aerosols and cloud… · [2] Photolysis reactions play a very important role in atmospheric chemistry. Ozone photolysis](https://static.documents.pub/doc/80x56/5f07e35b7e708231d41f41d6/impacts-of-aerosols-and-clouds-on-photolysis-frequencies-and-of-aerosols-and.jpg)


