This analysis of the 2013 licensure renewal data was supported by funds from the State Implementation Program (SIP) of the Ohio Action Coalition
funded by the Robert Wood Johnson Foundation.
1
Ohio Action Coalition 2015
IntroductionWelcome to a landmark report from the Ohio Action Coalition (OAC) analyzing the registered nurse workforce in Ohio. The goal of the report is to help policymakers, researchers, and others advance Ohio’s health care system in general and the crucial field of nursing in particular.
The Ohio Action Coalition is one of 50 state-based coalitions working to implement recommendations from the Institute of Medicine’s 2010 report, The Future of Nursing: LEADING CHANGE, ADVANCING HEALTH. The Ohio Action Coalition is co-led by the Ohio League for Nursing, a constituent of the National League for Nursing, and the Ohio Hospital Association, representing the more than 220 hospitals and health systems across Ohio. A number of other health care organizations and individuals, each committed to the strength and success of nursing, serve on the OAC’s steering committee and workgroups.
This report provides a comprehensive picture of the registered nurse (RN) and advanced practice reg-istered nurse (APRN) workforce in Ohio based upon responses to RN and APRN data collected during licensure renewal in 2013. This is the first report based on nurse licensure renewal since 1981, (Inven-tory of Registered Nurses and Licensed Practical Nursing, Ohio 1980-81).
Other random-sample surveys have been published using data collected: in 1986 (Ohio’s Nurses: Demand vs Supply, Ohio Commission on Nursing, 1991); in 2000 (Nursing Workforce Supply, Ohio Collaborative Project, December 2000); in 2003-2004 (Ohio Nursing Supply, Ohio Board of Nursing); and in 2011, (Ohio RN Workforce Survey, Ohio Board of Nursing). This report provides new, detailed, comprehensive insights into the demographics and specialty distribution of Ohio’s nursing workforce.
Thank you to the Ohio Board of Nursing and the OAC Data and Research Workgroup as well as Patricia J. Cirillo, PhD, Cypress Research Group for all of their support and work.
On behalf of the Steering Committee of the Ohio Action Coalition, we are proud to present this report about the RN and APRN workforce in Ohio.
Sincerely,
Jane F. Mahowald, BSN, MA, RN, ANEF Co-Lead, Ohio Action CoalitionExecutive DirectorOhio League for Nursing
Jonathan ArcheyCo-Lead, Ohio Action CoalitionDirector of Government AffairsOhio Hospital Association
“By virtue of its numbers and capacity, the nursing profession has the potential to effect wide-reaching changes in the health care system…Nurses thus are poised to help bridge the gap between coverage and access, to coordinate increasingly complex care for a wide range of patients, to fulfill their potential as primary care providers to the full extent of their education and training, and to enable the full economic value of their contributions across practice settings to be realized.”
Institute of Medicine (IOM) report, “The Future of Nursing: Leading Change, Advancing Health”
Workforce Age .........................................................................................................................................8
Ohio Action Coalition Data Work Group ................................................................................................35
3
Ohio Action Coalition 2015
Executive Summary Beginning in 2013, the Ohio Board of Nursing enhanced the information collected from registered nurses (RN) and advanced practice registered nurses (APRNs) during the process of licensure renewal. This new robust data source for the first time allows a more complete understanding of Ohio’s RN and APRN workforce.
In 2013, the process of nurse licensure renewal in Ohio was completed in one of two ways: online by secure data entry, or using a mail-in application. A total of 182,589 RNs and APRNs renewed their licenses, including both online and mail-in renewals. This report provides an analysis primarily of the data submitted through online renewal. This accounts for 91.3 percent of renewing licensees. Of the 166,766 total online renewals, 156,131 are RNs and 10,635 are APRNs.
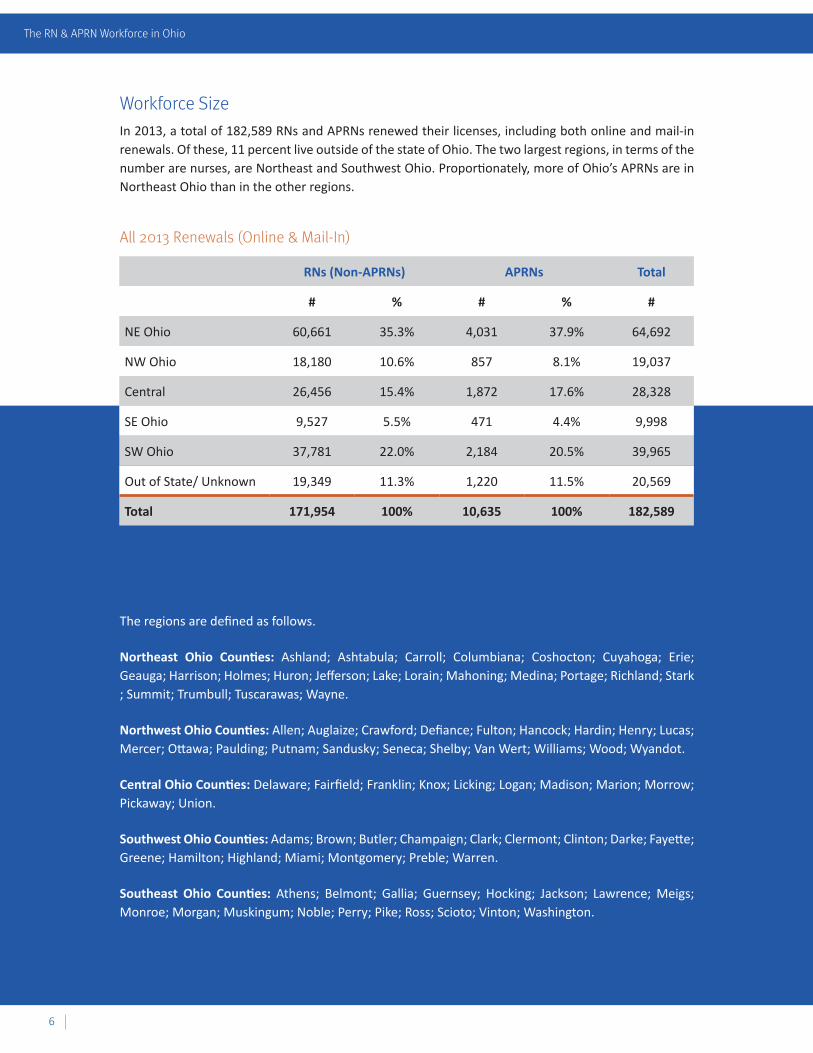
Of all renewals, including both mail-in and online, 11 percent live outside of the state of Ohio. Of the 166,766 online renewals, 144,352 (86.6 percent) are working as nurses. Of those working as nurses, 90 percent, or a total of 129,949, are recorded as living and working as a nurse in Ohio. The two largest regions, in terms of the number are nurses, are Northeast and Southwest Ohio. Proportionately, more of Ohio’s APRNs are in Northeast Ohio than in the other regions.
Workforce Demographics
Statewide, the median ages for RNs and APRNs are similar at 47 and 48 respectively. The RN/APRN workforce in Ohio is slightly older than that of the nation. In Ohio, about 15 percent of nurses are over age 60, a bit higher than the 8.5 percent of nurses over 60 in the country as a whole. About 22 percent, or more than 11,600 licensed RNs and APRNs, have more than 40 years of experience, and 54 percent of them are still working as nurses.
Of all RNs and APRNs renewing online, 92 percent are female and 8 percent are male. Regarding diversity of race and ethnicity, in Ohio those of African-American and Hispanic descent are under-represented in the nursing workforce. While 83 percent of the general population of the state is Caucasian/White, 90 percent of RNs/APRNs are Caucasian. Of the remaining nurses, half are African American. Fewer than 1 percent are Hispanic/Latino. Nationwide, about 75 percent of the RN/APRN workforce is Caucasian/White, almost 10 percent is African American and just under 5 percent is Hispanic/Latino.
The demographics of today’s nursing workforce suggest that it will become increasingly diverse in time. Both males and racial and ethnic minorities are represented in higher numbers in the younger cohorts of the nursing workforce, suggesting that, if these trends continue, they will become better represented in the workforce as time goes on.
Education
Almost half (45 percent) of renewals have a bachelor’s or higher nursing degree. The prevalence of the baccalaureate degree as a nurse’s initial degree has grown. For those over age 50, 20 percent reported their initial degree was a baccalaureate in nursing, compared to 53 percent of those ages 30 and younger.
182,589 RNs & APRNs renewed their licenses in 2013
4
The RN & APRN Workforce in Ohio
When it comes to nurses’ plans for future educational advancement, 6.4 percent of licensees reported they are currently enrolled in a Bachelor’s of Science in Nursing (BSN) program and are working toward that degree. About a quarter (26.5 percent) have no plans to obtain a BSN. The remaining 20 percent plan to obtain a BSN sometime in the future, with about half of those expecting to do so within the next five years.
Almost all (96 percent) of RNs without a BSN aged 25 or below intend to obtain a BSN, and 90 percent of those ages 26 to 30 intend to do so. Lack of access to a BSN program is not a significant barrier for Ohio nurses. Lack of desire to advance their level of practice (30 percent), personal and work schedules (almost 17 percent), and tuition costs (almost 17 percent) are.
Employment
About 5 percent (fewer than 8,000) of the RN/APRN workforce in Ohio is unemployed. Nearly half of them (46.5 percent) cited ‘caring for home or family’ as the reason. About 46 percent of unemployed nurses – or just over 2 percent of the total licensed RN/APRN workforce – are seeking a job as a nurse. Comparatively, this is a very low rate of unemployment. Throughout 2013, the year represented by the RN/APRN licensure data, the overall unemployment rate in Ohio was over 7 percent, with monthly unemployment rates ranging from 7.1 to as much as 7.5 percent that year, according to the U.S. Bureau of Labor Statistics.
Among all unemployed nurses, about 12 percent reported difficulty in finding a nursing position. Those showing the highest levels of having difficulty are those with the least experience (1 year or less). However, only just over 2 percent of licensed RNs with a year or less of experience reported being unemployed and are having a difficult time finding a position.
More than three-quarters – 76.7 percent – of nurses work full time. Male nurses are more likely to be working full time than female nurses, 89.9 percent and 75.5 percent, respectively. As nurses age they are increasingly less likely to be employed full time. The majority of nurses – 87.8 percent – work for only one employer, but 10.6 percent reported working for two employers and 1.3 percent reported working for three or more.
Practice Settings
By far, the largest segment of the nursing workforce is employed in a hospital setting. About 60 percent of Ohio RN and APRN licensees who are working as nurses are doing so in a hospital. Another 7 percent are working in nursing homes or other assisted living or extended care facilities; about 5 percent are working in medical offices; and another 5 percent in home care. Almost 3 percent work in an academic setting and 4.6 percent in ambulatory care.
Among APRNs overall, 55 percent report their primary practice is as a certified nurse practitioner and 25 percent are certified registered nurse anesthetists (CRNA). Overall, 62.6 percent of APRNs licensed in Ohio have some level of prescriptive authority. Nurse midwives are the most likely to have prescriptive authority (80.9 percent) followed by nurse practitioners (76.1 percent). By law, CRNAs do not have prescriptive authority.
60% of RN & APRN licensees work in a hospital
5
Ohio Action Coalition 2015
Study Background Beginning in 2013, the Ohio Board of Nursing enhanced the information collected from registered nurses (RN) and advanced practice registered nurses (APRNs) during the process of license renewal. The data collected is based on:
• The nursing minimum data set begun by the Robert Wood Johnson Foundation-initiated Colleagues in Caring Project and finalized by the National Forum of State Nursing Workforce Centers,
• Core data questions developed by the U.S. Health Resources and Services Administration (HRSA) National Center for Health Workforce Analysis, and
• The joint 2013 survey conducted by the National Forum of State Nursing Workforce Centers and the National Council of State Boards of Nursing (NCSBN).
This robust data source for the first time allows a more complete understanding of Ohio’s RN and APRN workforce and aligns with recommendations made by the Institute of Medicine in its 2010 report The Future of Nursing: Leading Change, Advancing Health. In that report, the IOM identified data collection as a vital component for health care planning and policymaking.
In 2013, the process of nurse licensure renewal in Ohio was completed in one of two ways: online by secure data entry, or using a mail-in application. This report provides an overview primarily of the 2013 licensure data submitted by RNs and APRNs who utilized the online renewal. This accounts for a great majority – 91.3 percent – of the 182,589 renewing licensees. Of the 166,766 total online renewals, 156,131 are RNs and 10,635 are APRNs.
Please note that for the purposes of this report, the term RNs refers exclusively to the non-APRN segment of the registered nurse workforce.
The full data analysis, which was completed by Cypress Research Group for the Ohio Action Coalition, can be accessed online at www.ohioleaguefornursing.org, www.ohiocenterfornursing.org and www.ohanet.org.
6
The RN & APRN Workforce in Ohio
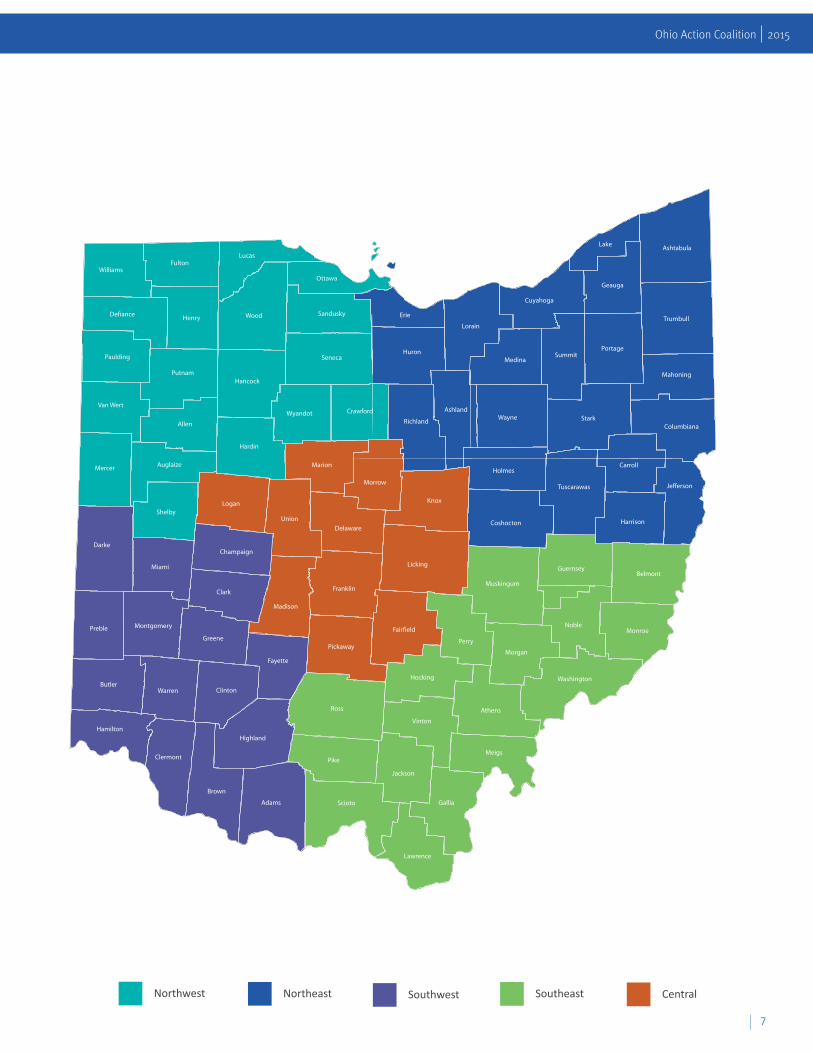
Workforce Size In 2013, a total of 182,589 RNs and APRNs renewed their licenses, including both online and mail-in renewals. Of these, 11 percent live outside of the state of Ohio. The two largest regions, in terms of the number are nurses, are Northeast and Southwest Ohio. Proportionately, more of Ohio’s APRNs are in Northeast Ohio than in the other regions.
Out of State/ Unknown 19,349 11.3% 1,220 11.5% 20,569
Total 171,954 100% 10,635 100% 182,589
All 2013 Renewals (Online & Mail-In)
7
Ohio Action Coalition 2015
Northwest
Northeast
Central
Southeast
Southwest
Northwest
Northeast
Central
Southeast
Southwest
Northwest
Northeast
Central
Southeast
Southwest
Northwest
Northeast
Central
Southeast
Southwest
Northwest
Northeast
Central
Southeast
Southwest
Northwest
Northeast
Central
Southeast
Southwest
8
The RN & APRN Workforce in Ohio
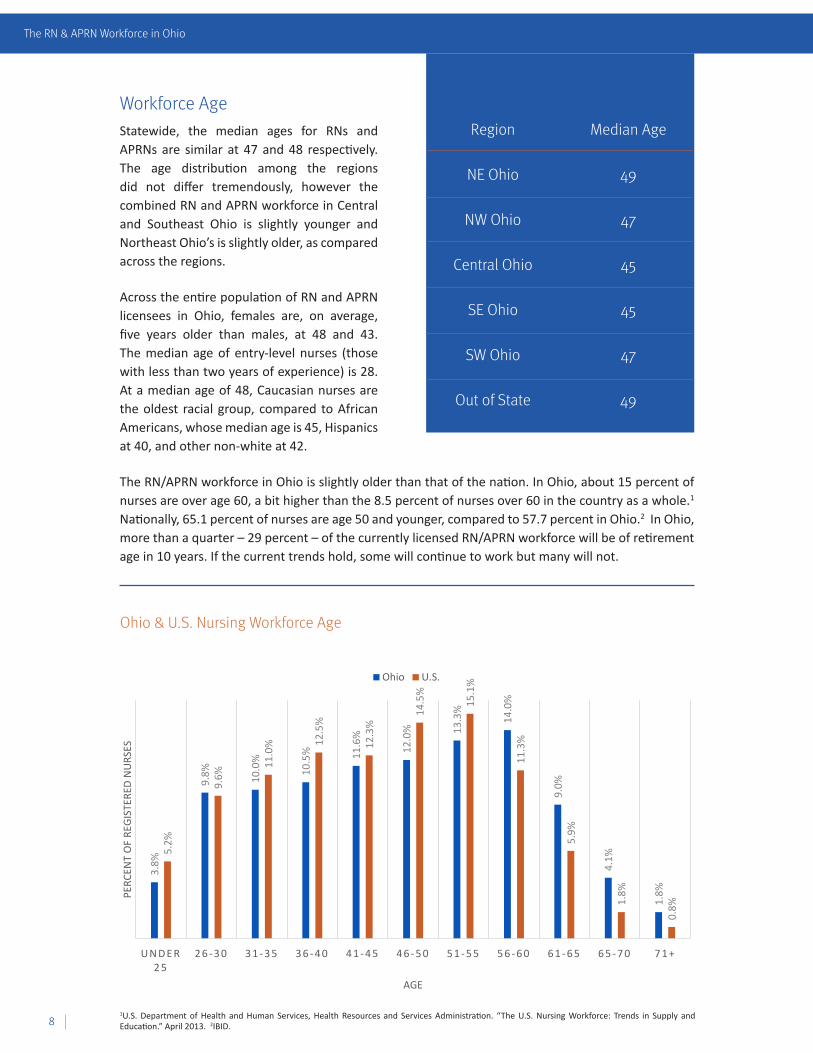
Workforce AgeStatewide, the median ages for RNs and APRNs are similar at 47 and 48 respectively. The age distribution among the regions did not differ tremendously, however the combined RN and APRN workforce in Central and Southeast Ohio is slightly younger and Northeast Ohio’s is slightly older, as compared across the regions.
Across the entire population of RN and APRN licensees in Ohio, females are, on average, five years older than males, at 48 and 43. The median age of entry-level nurses (those with less than two years of experience) is 28. At a median age of 48, Caucasian nurses are the oldest racial group, compared to African Americans, whose median age is 45, Hispanics at 40, and other non-white at 42.
The RN/APRN workforce in Ohio is slightly older than that of the nation. In Ohio, about 15 percent of nurses are over age 60, a bit higher than the 8.5 percent of nurses over 60 in the country as a whole.1 Nationally, 65.1 percent of nurses are age 50 and younger, compared to 57.7 percent in Ohio.2 In Ohio, more than a quarter – 29 percent – of the currently licensed RN/APRN workforce will be of retirement age in 10 years. If the current trends hold, some will continue to work but many will not.
1U.S. Department of Health and Human Services, Health Resources and Services Administration. “The U.S. Nursing Workforce: Trends in Supply and Education.” April 2013. 2IBID.
9
Ohio Action Coalition 2015
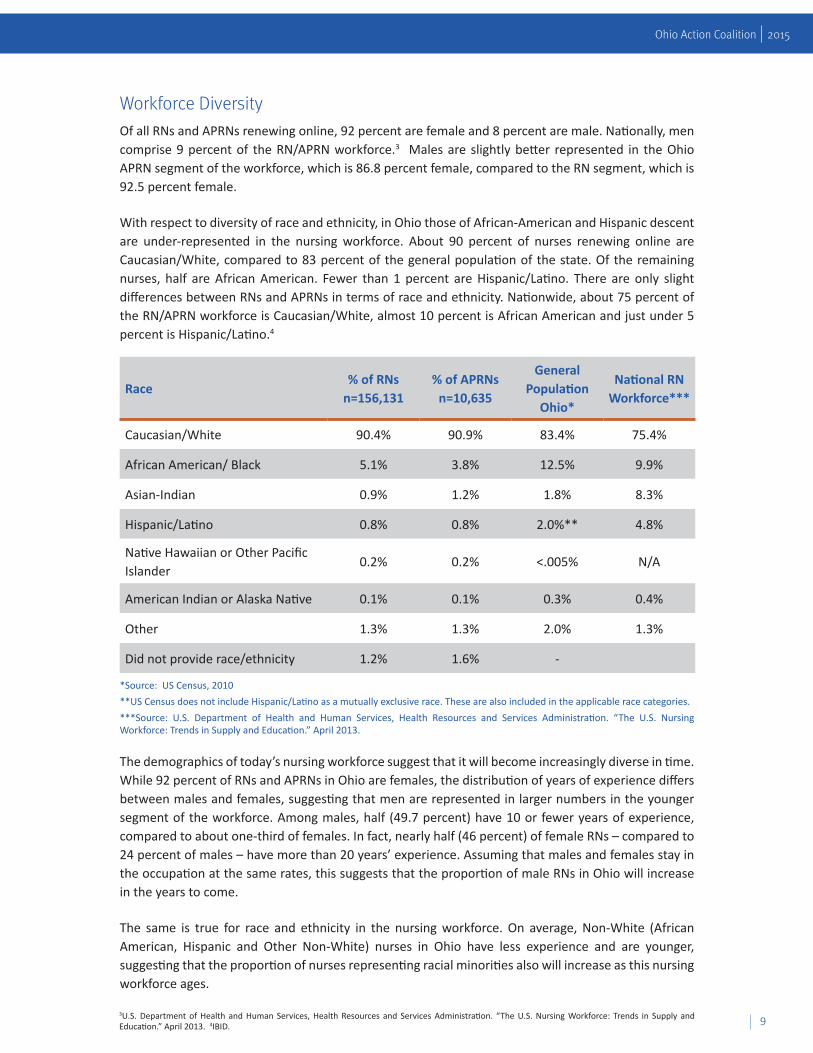
Workforce DiversityOf all RNs and APRNs renewing online, 92 percent are female and 8 percent are male. Nationally, men comprise 9 percent of the RN/APRN workforce.3 Males are slightly better represented in the Ohio APRN segment of the workforce, which is 86.8 percent female, compared to the RN segment, which is 92.5 percent female.
With respect to diversity of race and ethnicity, in Ohio those of African-American and Hispanic descent are under-represented in the nursing workforce. About 90 percent of nurses renewing online are Caucasian/White, compared to 83 percent of the general population of the state. Of the remaining nurses, half are African American. Fewer than 1 percent are Hispanic/Latino. There are only slight differences between RNs and APRNs in terms of race and ethnicity. Nationwide, about 75 percent of the RN/APRN workforce is Caucasian/White, almost 10 percent is African American and just under 5 percent is Hispanic/Latino.4
Race% of RNs
n=156,131% of APRNs
n=10,635
General Population
Ohio*
National RN Workforce***
Caucasian/White 90.4% 90.9% 83.4% 75.4%
African American/ Black 5.1% 3.8% 12.5% 9.9%
Asian-Indian 0.9% 1.2% 1.8% 8.3%
Hispanic/Latino 0.8% 0.8% 2.0%** 4.8%
Native Hawaiian or Other Pacific Islander
0.2% 0.2% <.005% N/A
American Indian or Alaska Native 0.1% 0.1% 0.3% 0.4%
Other 1.3% 1.3% 2.0% 1.3%
Did not provide race/ethnicity 1.2% 1.6% -
The demographics of today’s nursing workforce suggest that it will become increasingly diverse in time. While 92 percent of RNs and APRNs in Ohio are females, the distribution of years of experience differs between males and females, suggesting that men are represented in larger numbers in the younger segment of the workforce. Among males, half (49.7 percent) have 10 or fewer years of experience, compared to about one-third of females. In fact, nearly half (46 percent) of female RNs – compared to 24 percent of males – have more than 20 years’ experience. Assuming that males and females stay in the occupation at the same rates, this suggests that the proportion of male RNs in Ohio will increase in the years to come.
The same is true for race and ethnicity in the nursing workforce. On average, Non-White (African American, Hispanic and Other Non-White) nurses in Ohio have less experience and are younger, suggesting that the proportion of nurses representing racial minorities also will increase as this nursing workforce ages.
*Source: US Census, 2010**US Census does not include Hispanic/Latino as a mutually exclusive race. These are also included in the applicable race categories.***Source: U.S. Department of Health and Human Services, Health Resources and Services Administration. “The U.S. Nursing Workforce: Trends in Supply and Education.” April 2013.
3U.S. Department of Health and Human Services, Health Resources and Services Administration. “The U.S. Nursing Workforce: Trends in Supply and Education.” April 2013. 4IBID.
0 - 1 Y E A R S 2 - 5 Y E A R S 6 - 1 0 Y E A R S 1 1 - 2 0 Y E A R S 2 1 - 3 0 Y E A R S 3 1 - 4 0 Y E A R S 4 1 + Y E A R S
PERC
ENT
OF
ON
LIN
E RE
NEW
ALS
YEARS OF EXPERIENCE
White Median Age=49 African American Median Age=46
Hispanic Median Age=41 Other Non-White Median Age=43
11
Ohio Action Coalition 2015
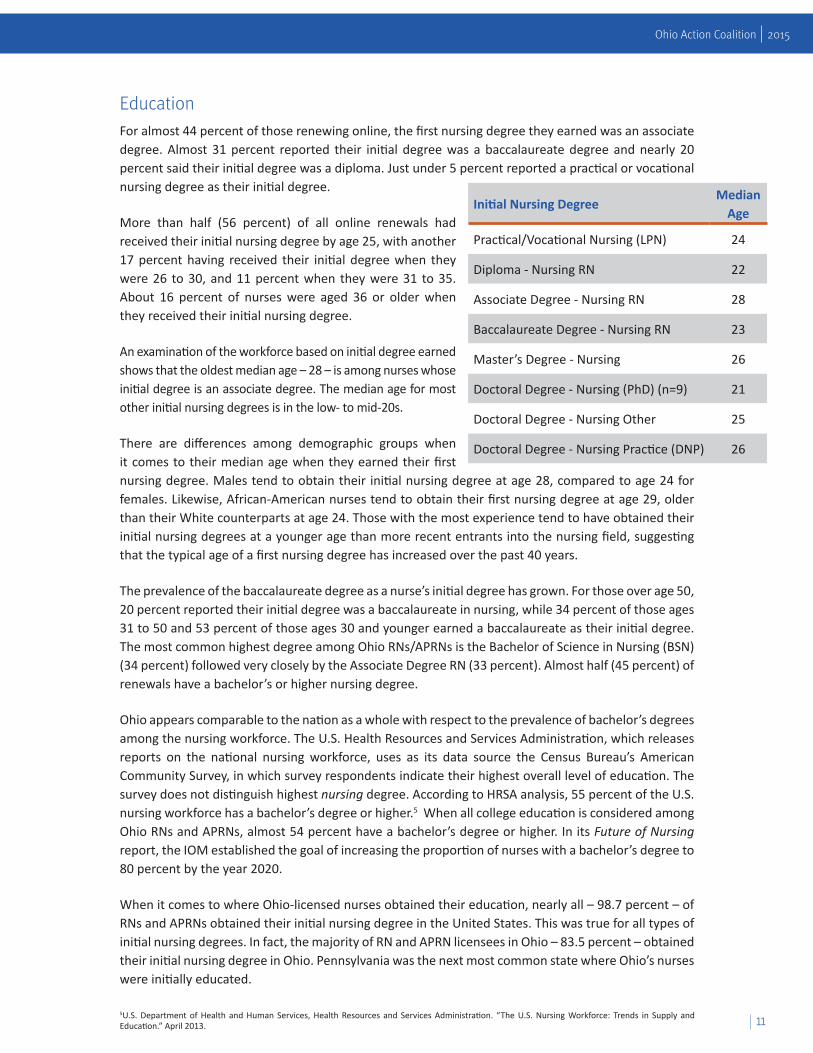
EducationFor almost 44 percent of those renewing online, the first nursing degree they earned was an associate degree. Almost 31 percent reported their initial degree was a baccalaureate degree and nearly 20 percent said their initial degree was a diploma. Just under 5 percent reported a practical or vocational nursing degree as their initial degree.
More than half (56 percent) of all online renewals had received their initial nursing degree by age 25, with another 17 percent having received their initial degree when they were 26 to 30, and 11 percent when they were 31 to 35. About 16 percent of nurses were aged 36 or older when they received their initial nursing degree.
An examination of the workforce based on initial degree earned shows that the oldest median age – 28 – is among nurses whose initial degree is an associate degree. The median age for most other initial nursing degrees is in the low- to mid-20s.
There are differences among demographic groups when it comes to their median age when they earned their first nursing degree. Males tend to obtain their initial nursing degree at age 28, compared to age 24 for females. Likewise, African-American nurses tend to obtain their first nursing degree at age 29, older than their White counterparts at age 24. Those with the most experience tend to have obtained their initial nursing degrees at a younger age than more recent entrants into the nursing field, suggesting that the typical age of a first nursing degree has increased over the past 40 years.
The prevalence of the baccalaureate degree as a nurse’s initial degree has grown. For those over age 50, 20 percent reported their initial degree was a baccalaureate in nursing, while 34 percent of those ages 31 to 50 and 53 percent of those ages 30 and younger earned a baccalaureate as their initial degree. The most common highest degree among Ohio RNs/APRNs is the Bachelor of Science in Nursing (BSN) (34 percent) followed very closely by the Associate Degree RN (33 percent). Almost half (45 percent) of renewals have a bachelor’s or higher nursing degree.
Ohio appears comparable to the nation as a whole with respect to the prevalence of bachelor’s degrees among the nursing workforce. The U.S. Health Resources and Services Administration, which releases reports on the national nursing workforce, uses as its data source the Census Bureau’s American Community Survey, in which survey respondents indicate their highest overall level of education. The survey does not distinguish highest nursing degree. According to HRSA analysis, 55 percent of the U.S. nursing workforce has a bachelor’s degree or higher.5 When all college education is considered among Ohio RNs and APRNs, almost 54 percent have a bachelor’s degree or higher. In its Future of Nursing report, the IOM established the goal of increasing the proportion of nurses with a bachelor’s degree to 80 percent by the year 2020.
When it comes to where Ohio-licensed nurses obtained their education, nearly all – 98.7 percent – of RNs and APRNs obtained their initial nursing degree in the United States. This was true for all types of initial nursing degrees. In fact, the majority of RN and APRN licensees in Ohio – 83.5 percent – obtained their initial nursing degree in Ohio. Pennsylvania was the next most common state where Ohio’s nurses were initially educated.
Initial Nursing DegreeMedian
Age
Practical/Vocational Nursing (LPN) 24
Diploma - Nursing RN 22
Associate Degree - Nursing RN 28
Baccalaureate Degree - Nursing RN 23
Master’s Degree - Nursing 26
Doctoral Degree - Nursing (PhD) (n=9) 21
Doctoral Degree - Nursing Other 25
Doctoral Degree - Nursing Practice (DNP) 26
5U.S. Department of Health and Human Services, Health Resources and Services Administration. “The U.S. Nursing Workforce: Trends in Supply and Education.” April 2013.
12
The RN & APRN Workforce in Ohio
Educational DevelopmentEducational advancement is common in Ohio. Nearly one-third (31.9 percent) of licensed RNs and APRNs in Ohio obtained an additional degree beyond their initial nursing degree. Of those who initially obtained a BSN as a licensed nurse, 16 percent went on to obtain an MSN. Of those who initially obtained an Associate Degree Nursing RN, nearly 15 percent obtained a BSN and 5 percent obtained a Master’s of Science in Nursing (MSN). Another 8 percent obtained a non-nursing bachelor’s degree. Almost 20 percent of licensed RNs in Ohio obtained a Diploma nursing RN as their initial nursing degree; for 61 percent of them, that was their highest nursing degree, but 15 percent later obtained a BSN and 9 percent a MSN.
There were some regional variations with respect to nurses’ educational achievements. At about 48 percent, Central Ohio has the highest proportion of nurses whose highest nursing degree is a baccalaureate or higher, while Southeast Ohio has the smallest proportion, at about 30 percent.
MS Degree-Nursing PhD & Other Doctoral Other Non-Nurse Degrees
13
Ohio Action Coalition 2015
When it comes to nurses’ plans for future educational advancement, 6.4 percent of licensees reported they are currently enrolled in a BSN program and are working toward that degree. About a quarter (26.5 percent) have no plans to obtain a BSN. About 20 percent plan to obtain a BSN sometime in the future, with about half of those expecting to do so within the next five years. The remaining nurses already have a BSN or higher.
Lack of intent to obtain a BSN is not related to gender, and only somewhat to race. African-American and Hispanic RNs are more likely to intend to obtain a BSN than their White counterparts. Current enrollment in a BSN program and/or plans to enroll in a program is extremely high among nurses without a BSN who are 30 years old or younger. Almost all (96 percent) of RNs without a BSN aged 25 or below intend to obtain a BSN, and 90 percent of those ages 26 to 30 intend to do so. Lack of access to a BSN program is not a significant barrier for Ohio nurses. Lack of desire to advance their level of practice (30 percent), personal and work schedules (almost 17 percent), and tuition costs (almost 17 percent) are.
Years of ExperienceMore than 40 percent of the APRN and RN workforce in Ohio has between 11 and 30 years of experience, with another 30 percent with two to 10 years of experience. About 22 percent, or more than 11,600 licensed RNs and APRNs, have more than 40 years of experience, and 54 percent of these very experienced nurses are still working as nurses.
Not surprisingly, APRNs have more experience than RNs. About 35 percent of RNs have 10 or fewer years of experience compared to about 22 percent of APRNs. By contrast, about 43 percent of RNs and more than 51 percent of APRNs have more than 20 years of experience.
Years of Experience, All Online Renewals
0-1 years5%
2-5 years16%
6-10 years14%
11-20 years22%
21-30 years20%
31-40 years17%
41+ years7%
0-1 years 2-5 years 6-10 years 11-20 years 21-30 years 31-40 years 41+ years
14
The RN & APRN Workforce in Ohio
EmploymentIn total, 144,352 of the 166,766 online renewals (86.6 percent) are working as nurses. Of those working as nurses, 90 percent, or a total of 129,949, are recorded as living and working as a nurse in Ohio. Those new to nursing are more likely than the most experienced nurses to work in Ohio. About 88 percent of nurses with more than 30 years of experience work in the state compared to 96 percent of those with fewer than two years of experience. APRNs are also less likely to work in the state compared to RNs, with nearly 86 percent of APRNs and almost 91 percent of RNs working in Ohio. Among those currently working as a nurse, just over one-third (51,743 or 34.5 percent) are in Northeast Ohio. Southwest Ohio holds the second largest segment of the state’s working nurses (31,993 or 22.2 percent).
Males are more likely to be in a paid nursing position than females (90.5 percent of males and 86.2 percent of females). The data also show that the percentage of licensees working as a nurse decreases with age, as indicated by years of experience. A very large proportion (94.3 percent) of new entrants (those with less than 1 year of experience) are working as nurses for pay.
Residential Region# Working as a Nurse
# Not Working as a Nurse
Total #
NE Ohio 51,743 7,988 59,731
NW Ohio 15,407 2,271 17,678
Central Ohio 22,712 3,373 26,085
SE Ohio 8,094 1,082 9,176
SW Ohio 31,993 5,133 37,126
Total Ohio: 129,949 19,847 149,796
Out of State 14,403 2,567 16,970
Total 144,352 22,414 166,766
Job Status, All Online Renewals
86.6%
3.0%0.6%
5.1%4.7%
In paid nursing position
Paid position not requiringnursing license
Volunteer as a nurse
Unemployed
Retired
15
Ohio Action Coalition 2015
Nearly 5 percent of RN/APRN licensees are retired and another 3 percent are working in a paid position that does not require a nursing license. About 5 percent of nurses in Ohio are unemployed, and approximately half of those – 2.2 percent of the total licensed RN/APRN workforce in the state – are unemployed by choice.
APRNs are more likely than RNs to be working in a paid nursing position (95 percent compared to 86 percent) and are also less likely to be un-/non-employed (2.2 percent of APRNs and 5.3 percent of RNs) or retired (1.5 percent and 4.9 percent, respectively).
There is little differentiation among the regions regarding the total percentage nurses that are working in paid nursing positions.
Job Status % of RNs (Non-APRN) % of APRNs
In a paid nursing position 86.0% 95.2%
Paid position that does not require nursing license 3.1% 0.9%
Volunteer as a nurse 0.7% 0.3%
Un- or Non-employed 5.3% 2.2%
Retired 4.9% 1.5%
16
The RN & APRN Workforce in Ohio
UnemploymentA total of nearly 8,000 licensed RNs and APRNs in Ohio are unemployed. Nearly half of them (46.5 percent) cited ‘caring for home or family’ as the reason. About 46 percent of unemployed nurses – or just over 2 percent of the total licensed RN/APRN workforce – are seeking a job as a nurse. Comparatively, this is a very low rate of unemployment. Throughout 2013, the year represented by the RN/APRN licensure data, the overall unemployment rate in Ohio was over 7 percent, with monthly unemployment rates ranging from 7.1 to as much as 7.5 percent that year, according to the U.S. Bureau of Labor Statistics.
Among all unemployed nurses, about 12 percent reported difficulty in finding a nursing position. Those showing the highest levels of having difficulty finding a nursing position are those with the least experience (1 year or less). However, only just over 2 percent of licensed RNs with a year or less of experience reported being unemployed and are having a difficult time finding a position.
Unemployment rates are similar among the various regions of Ohio. In terms of sheer numbers, Northeast Ohio is the region with the most nurses who are seeking and having difficulty finding work, followed by Southwest Ohio, but these are the regions with the largest numbers of nurses overall.
RegionPercent of Unemployed Nurses
Seeking & Having Difficulty Finding Employment
Number of Unemployed Nurses Seeking & Having Difficulty
Finding Employment
NE Ohio 0.7% 411
NW Ohio 0.7% 130
Central Ohio 0.9% 237
SE Ohio 0.9% 78
SW Ohio 0.9% 326
Out of state 0.1% 17
Full-Time vs Part-TimeMore than three-quarters – 76.7 percent – of nurses work full time, with about 17 percent employed part time and just under 6 percent working per diem. About two-thirds, or 67.6 percent, of nurses reported working 50 or more weeks per year, with about 10 percent working fewer than 36 weeks per year.
APRNs are more likely than RNs to be working full time, with 81.8 percent of APRNs and 76.3 percent of RNs reporting full-time working status. APRNs also more frequently report working more than 40 hours per week compared to RNs. About 40 percent of APRNs and 24 percent of RNs work 41 to 50 hours per week, and just over 9 percent of APRNs and fewer than 4 percent of RNs work 51 to 60 hours per week.
Male nurses are more likely to be working full time than female nurses, with 89.9 percent and 75.5 percent, respectively. In fact, male nurses are much more likely than female nurses to work more than 40 hours per week. Of males, 40.3 percent reported working more than 40 hours per week, compared to 28.5 percent of females. Seven percent of males and almost 20 percent of females worked less than 20 hours per week.
17
Ohio Action Coalition 2015
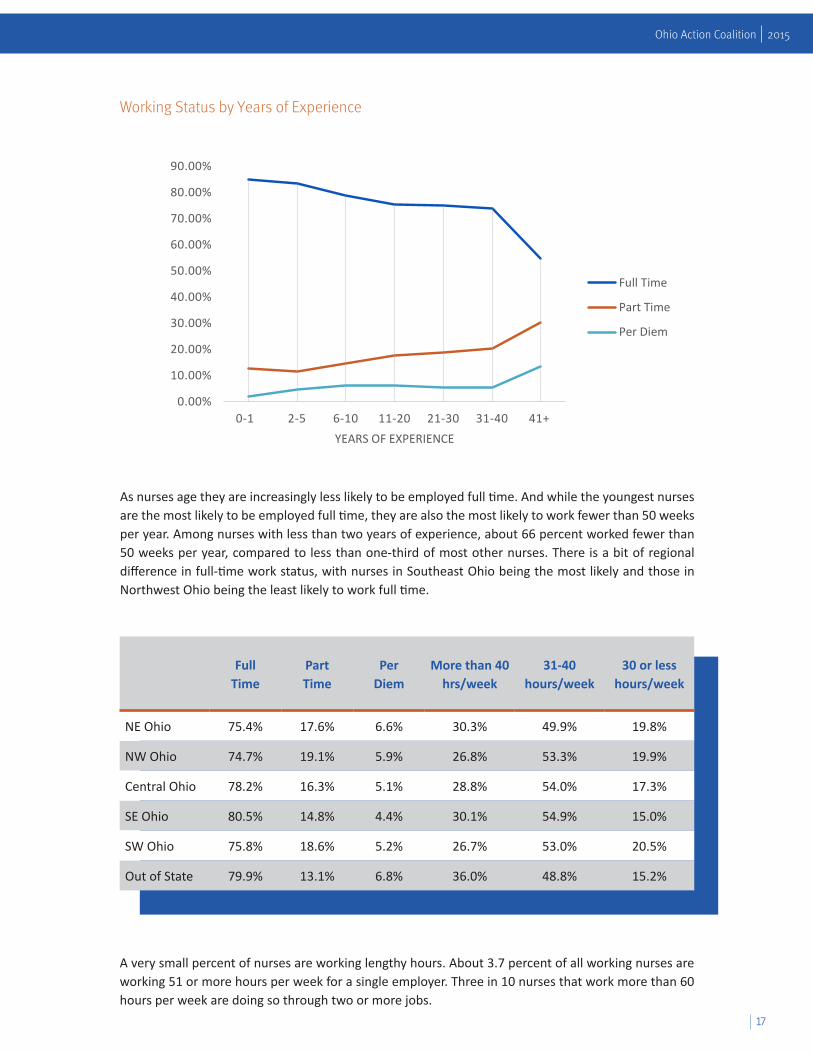
As nurses age they are increasingly less likely to be employed full time. And while the youngest nurses are the most likely to be employed full time, they are also the most likely to work fewer than 50 weeks per year. Among nurses with less than two years of experience, about 66 percent worked fewer than 50 weeks per year, compared to less than one-third of most other nurses. There is a bit of regional difference in full-time work status, with nurses in Southeast Ohio being the most likely and those in Northwest Ohio being the least likely to work full time.
A very small percent of nurses are working lengthy hours. About 3.7 percent of all working nurses are working 51 or more hours per week for a single employer. Three in 10 nurses that work more than 60 hours per week are doing so through two or more jobs.
Working Status by Years of Experience
0.00%
10.00%
20.00%
30.00%
40.00%
50.00%
60.00%
70.00%
80.00%
90.00%
0-1 2-5 6-10 11-20 21-30 31-40 41+ YEARS OF EXPERIENCE
Full Time
Part Time
Per Diem
Full Time
Part Time
Per Diem
More than 40 hrs/week
31-40 hours/week
30 or less hours/week
NE Ohio 75.4% 17.6% 6.6% 30.3% 49.9% 19.8%
NW Ohio 74.7% 19.1% 5.9% 26.8% 53.3% 19.9%
Central Ohio 78.2% 16.3% 5.1% 28.8% 54.0% 17.3%
SE Ohio 80.5% 14.8% 4.4% 30.1% 54.9% 15.0%
SW Ohio 75.8% 18.6% 5.2% 26.7% 53.0% 20.5%
Out of State 79.9% 13.1% 6.8% 36.0% 48.8% 15.2%
18
The RN & APRN Workforce in Ohio
Workplace SettingBy far, the largest segment of the nursing workforce is employed in a hospital setting. About 60 percent of Ohio RN and APRN licensees who are working as nurses are doing so in a hospital. This compares to about 63 percent of nurses nationwide.6 Another 7 percent of Ohio nurses are working in nursing homes or other assisted living or extended care facilities; about 5 percent are working in medical offices; and another 5 percent in home care. Almost 3 percent work in an academic setting and 4.6 percent in ambulatory care.
Compared to RNs, a smaller proportion of the APRN workforce is employed in a hospital setting and a larger proportion works in medical offices. About 61 percent of RNs and 55 percent of APRNs work in a hospital, while 4 percent of RNs and 17 percent of APRNs work in medical offices. Significantly fewer APRNs (3.5 percent) work in nursing home/extended care/assisted living settings compared to RNs (7.3 percent). The same is true for hospice (2.5 percent of RNs and 0.7 percent of APRNs) and home care (5.6 percent of RNs and 1.0 percent of APRNs). The settings with the highest proportion of APRNs among employed nurses are clinical partnership medical offices and office solo practices (27.7 percent and 25.6 percent, respectively).
The workplace settings with the largest proportion of male nurses are hospital emergency departments, where more than 17 percent of nurses are male, and federal government hospitals, where more than 18 percent of nurses are male. Medical offices had the lowest representation of males, ranging from 2.6 to 3.4 percent depending upon the type of office. Hospital inpatient settings are 90.7 percent female and 9.3 percent male.
The racial/ethnic distribution is similar in most settings. The setting where African American nurses are in higher proportion than average is federal government hospitals, where they comprise 17 percent of the workforce.
Workplace Settings
60%
7%
5%
5%
5%
3%
2%
13%
Hospital
Nursing Home
Medical Office
Home Care
Ambulatory care
Academic
Hospice care
Other*
*Other includes insurance, public health, school health, occupational health, correctional facility, research, urgent care, patient centered medical home, policy/planning/regulatory, APRN-owned/operated practice, other health related, and other non-health
related.
6U.S. Department of Health and Human Services, Health Resources and Services Administration. “The U.S. Nursing Workforce: Trends in Supply and Education.” April 2013.
19
Ohio Action Coalition 2015
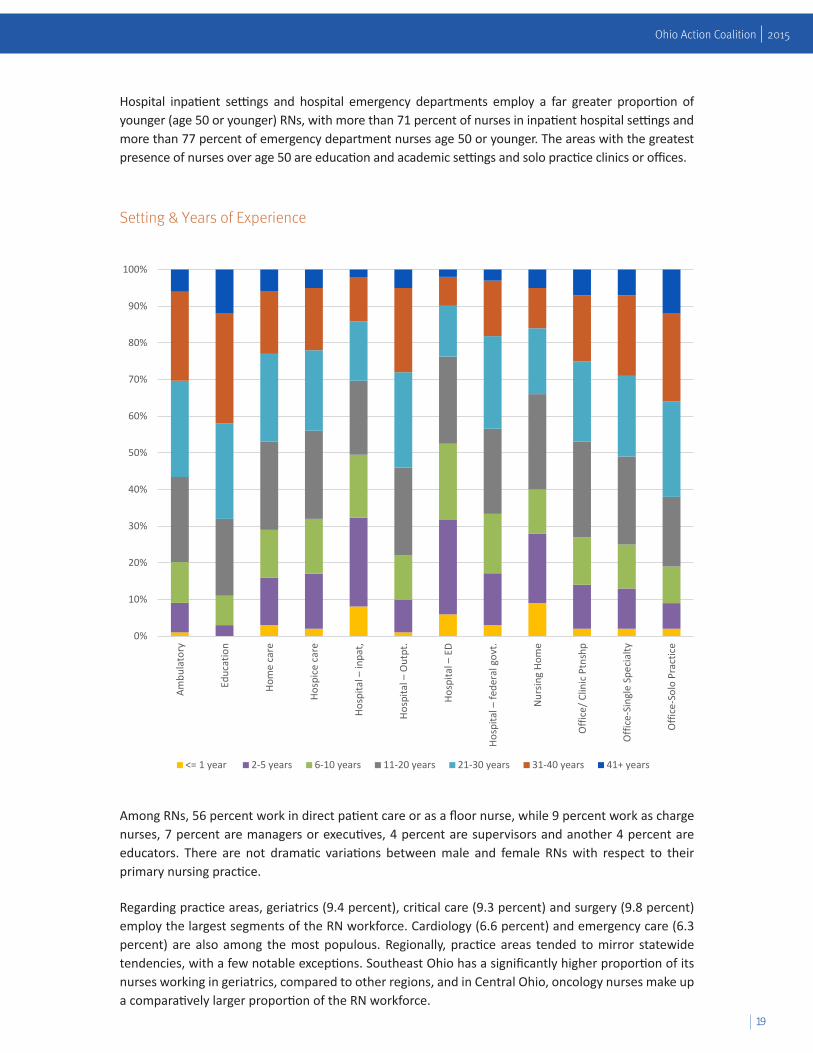
Hospital inpatient settings and hospital emergency departments employ a far greater proportion of younger (age 50 or younger) RNs, with more than 71 percent of nurses in inpatient hospital settings and more than 77 percent of emergency department nurses age 50 or younger. The areas with the greatest presence of nurses over age 50 are education and academic settings and solo practice clinics or offices.
Setting & Years of Experience
Among RNs, 56 percent work in direct patient care or as a floor nurse, while 9 percent work as charge nurses, 7 percent are managers or executives, 4 percent are supervisors and another 4 percent are educators. There are not dramatic variations between male and female RNs with respect to their primary nursing practice.
Regarding practice areas, geriatrics (9.4 percent), critical care (9.3 percent) and surgery (9.8 percent) employ the largest segments of the RN workforce. Cardiology (6.6 percent) and emergency care (6.3 percent) are also among the most populous. Regionally, practice areas tended to mirror statewide tendencies, with a few notable exceptions. Southeast Ohio has a significantly higher proportion of its nurses working in geriatrics, compared to other regions, and in Central Ohio, oncology nurses make up a comparatively larger proportion of the RN workforce.
0%
10%
20%
30%
40%
50%
60%
70%
80%
90%
100%
Ambu
lato
ry
Educ
atio
n
Hom
e ca
re
Hosp
ice
care
Hosp
ital –
inpa
t,
Hosp
ital –
Out
pt.
Hosp
ital –
ED
Hosp
ital –
fede
ral g
ovt.
Nur
sing
Hom
e
Offi
ce/ C
linic
Ptn
shp
Offi
ce-S
ingl
e Sp
ecia
lty
Offi
ce-S
olo
Prac
tice
<= 1 year 2-5 years 6-10 years 11-20 years 21-30 years 31-40 years 41+ years
20
The RN & APRN Workforce in Ohio
One or Multiple EmployersMost nurses – 87.8 percent – work for only one employer, but 10.6 percent reported working for two employers and 1.3 percent reported working for three or more. There was little variation among the regions in the proportions of the workforce working for one or more employers.
The very most and very least experienced nurses were the least likely to work for more than one employer. Of those with less than two years of experience, 92.0 percent work only for one employer, and 91.5 percent of those with more than 40 years of experience work for a single employer. Among racial and ethnic groups, African Americans were the most likely to work for multiple employers, with 19.1 percent working for two and 2.4 percent working for three or more. APRNs were also more likely to work for more than one employer, with 15.8 percent working for two employers – compared to 10.2 percent of RNs – and 2.8 percent working for three or more, as opposed to 1.2 percent of RNs. Those nurses working in education/academia are the most likely to have more than one position (27.4 percent).
Among RNs, 8.8 percent reported having a secondary work setting. The most common secondary settings are hospital inpatient (25.9 percent of all RNs with a secondary nurse setting, or 2.3 percent of all working RNs), education/academic (13.8 percent of those with a secondary setting and 1.2 of all RNs), home care (11.2 percent and 1.0 percent) and nursing home/extended care/assisted living (8.0 percent and 0.7 percent).
Note: For additional detail on practice areas, please refer to the complete data analysis available online at www.ohioleaguefornursing.org, www.ohiocenterfornursing.org, and www.ohanet.org.
21
Ohio Action Coalition 2015
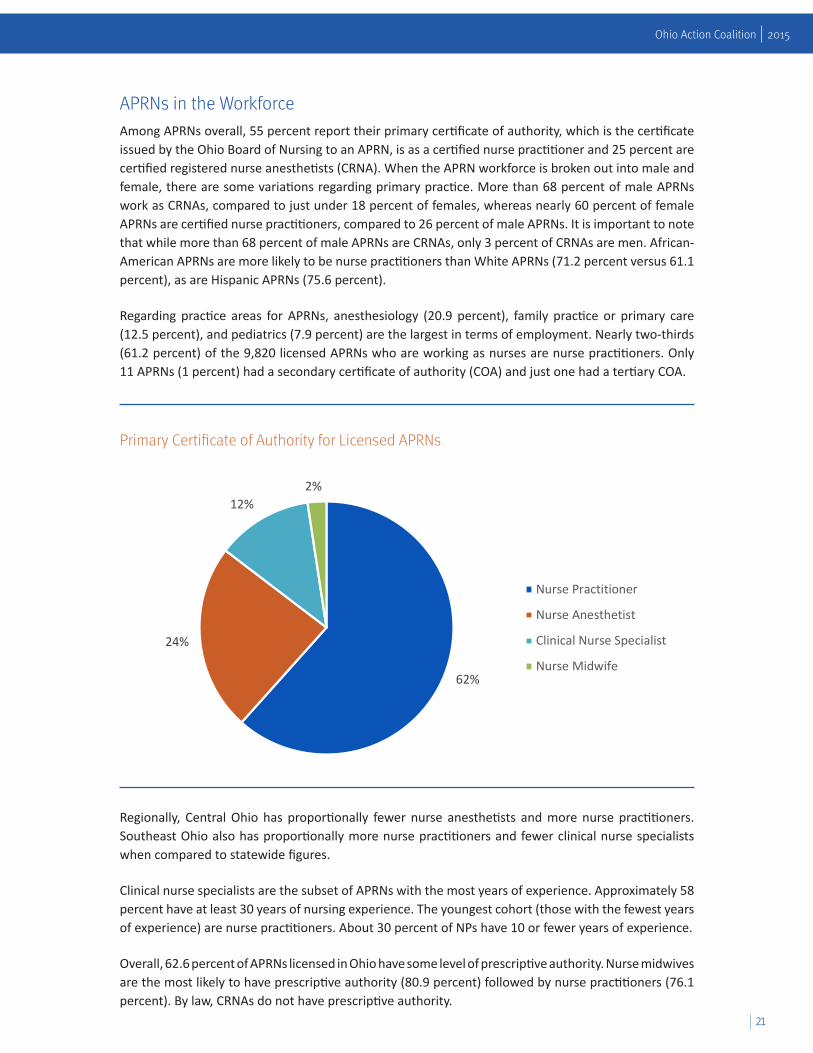
APRNs in the WorkforceAmong APRNs overall, 55 percent report their primary certificate of authority, which is the certificate issued by the Ohio Board of Nursing to an APRN, is as a certified nurse practitioner and 25 percent are certified registered nurse anesthetists (CRNA). When the APRN workforce is broken out into male and female, there are some variations regarding primary practice. More than 68 percent of male APRNs work as CRNAs, compared to just under 18 percent of females, whereas nearly 60 percent of female APRNs are certified nurse practitioners, compared to 26 percent of male APRNs. It is important to note that while more than 68 percent of male APRNs are CRNAs, only 3 percent of CRNAs are men. African-American APRNs are more likely to be nurse practitioners than White APRNs (71.2 percent versus 61.1 percent), as are Hispanic APRNs (75.6 percent).
Regarding practice areas for APRNs, anesthesiology (20.9 percent), family practice or primary care (12.5 percent), and pediatrics (7.9 percent) are the largest in terms of employment. Nearly two-thirds (61.2 percent) of the 9,820 licensed APRNs who are working as nurses are nurse practitioners. Only 11 APRNs (1 percent) had a secondary certificate of authority (COA) and just one had a tertiary COA.
Regionally, Central Ohio has proportionally fewer nurse anesthetists and more nurse practitioners. Southeast Ohio also has proportionally more nurse practitioners and fewer clinical nurse specialists when compared to statewide figures.
Clinical nurse specialists are the subset of APRNs with the most years of experience. Approximately 58 percent have at least 30 years of nursing experience. The youngest cohort (those with the fewest years of experience) are nurse practitioners. About 30 percent of NPs have 10 or fewer years of experience.
Overall, 62.6 percent of APRNs licensed in Ohio have some level of prescriptive authority. Nurse midwives are the most likely to have prescriptive authority (80.9 percent) followed by nurse practitioners (76.1 percent). By law, CRNAs do not have prescriptive authority.
Primary Certificate of Authority for Licensed APRNs
62%
24%
12%2%
Nurse Practitioner
Nurse Anesthetist
Clinical Nurse Specialist
Nurse Midwife
22
The RN & APRN Workforce in Ohio
Appendix A: Demographic SnapshotsIn its 2010 report, The Future of Nursing: Leading Change, Advancing Health, the Institute of Medicine urges that greater emphasis be placed on increasing the diversity of the nursing workforce, including diversity of both gender and race/ethnicity. Included among the IOM’s key recommendations is a sharpened focus on increasing the diversity of nursing students so that the future workforce will have the ability to meet the needs of a diverse population and to provide culturally relevant care.
As nursing leadership throughout Ohio continues to work toward this goal, it is important to understand the dynamics of the current nursing workforce, including how the demographics of the workforce compare to the state’s population as a whole as well as the characteristics of various subsets of the workforce.
Men in the Nursing Workforce
In Ohio, men comprise 48.9 percent of the population and 8 percent of the RN/APRN workforce. They are represented in a slightly greater proportion among APRNs, where they make up 13.2 percent of the workforce, compared to RNs, of which they are 7.5 percent.
At a median age of 43, men are five years younger than women in nursing. About half of men and one-third of women have fewer than 10 years’ experience, whereas about a quarter of men and half of women have more than 20 years of experience. On average, men obtained their first nursing degree at age 28, compared to women at age 24.
Hospital emergency departments and federal government hospitals are the settings where men are represented in the highest proportions (17 percent and 18 percent, respectively). Medical offices are the settings in which men are represented in the smallest proportions, between 2.6 and 3.4 percent, depending on the type of office.
About the same percentages of men and women have their BSN, but a larger proportion of men (31 percent) are either currently or planning to obtain their BSN compared to women (26 percent).
Among APRNs, about 67 percent of men are CRNAs (compared to 17 percent of women) and 30 percent are NPs (compared to 67 percent of women).
Race & Ethnicity in Nursing
About 12.5 percent of the population of Ohio is African American/Black, while 5.1 percent of the RN workforce and 3.8 percent of the APRN workforce is African American/Black. The population of Ohio is 2.0 percent Hispanic/Latino, compared to 0.8 percent of each of the RN and APRN workforces.
At 40, Hispanic nurses have the youngest median age, compared to 45 for African-American nurses and 48 for Whites. However, the median age of nurses when they obtained their initial degree is slightly older for African Americans (29) and Hispanics (27) compared to Whites (24).
Slightly higher percentages of African-American and Hispanic nurses have baccalaureate or master’s degrees in nursing compared to Caucasians.
23
Ohio Action Coalition 2015
African-American nurses are more likely to have two or more employers (21.5 percent compared to 14 percent of Hispanics and 11.3 percent of Whites). It isn’t surprising, then, that African-American nurses work more hours per week.
While African Americans make up 5 percent of nurses overall, they are 17 percent of nurses working in federal government hospitals, 9 percent of home care nurses and 8 percent of nursing home/extended care facility nurses. They make up just 1 to 3 percent of nurses in offices, depending upon the type of office. Hispanic nurses are represented at equivalent proportions across nearly all practice settings.
At 51 percent and 50 percent, respectively, African-American and Hispanic nurses are slightly more likely than White nurses (47 percent) to have a BSN or higher.
African-American nurses are slightly more likely, at 1.2 percent, to be unemployed, seeking and having difficulty finding a nursing position compared to Hispanic (0.8 percent) and white (0.8 percent) nurses.
Among APRNs, African-American and Hispanic nurses are more likely to be nurse practitioners and less likely to be CRNAs compared to White nurses.
Bacc. Degree-Nursing RN MS Degree-Nursing
White 33.6% 9.8%
African American 35.0% 11.0%
Hispanic 36.5% 10.2%
Worked > 40 Hours per week
Worked 31-40 Hours
per week
Worked 30 or Less per week
White 29.2% 51.4% 19.4%
African American 33.7% 54.2% 12.1%
Hispanic 28.7% 57.3% 14.0%
Primary Certificate of Authority
Nurse Anesthetist
Nurse MidwifeNurse
PractitionerClinical Nurse
Specialist
White 24.1% 2.5% 60.9% 12.3%
African American 14.0% 1.1% 69.2% 15.1%
Hispanic 18.6% 1.3% 74.4% 5.1%
24
The RN & APRN Workforce in Ohio
Appendix B: Regional Snapshots
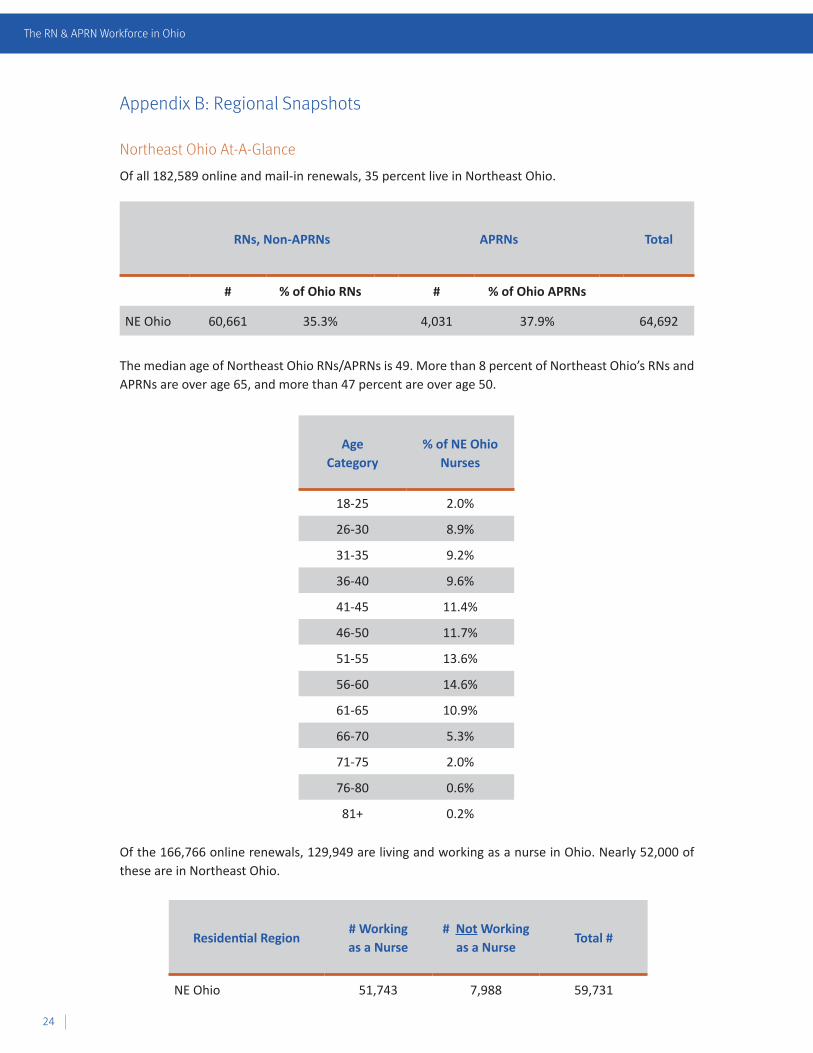
Northeast Ohio At-A-Glance
Of all 182,589 online and mail-in renewals, 35 percent live in Northeast Ohio.
Of the 166,766 online renewals, 129,949 are living and working as a nurse in Ohio. Nearly 52,000 of these are in Northeast Ohio.
The median age of Northeast Ohio RNs/APRNs is 49. More than 8 percent of Northeast Ohio’s RNs and APRNs are over age 65, and more than 47 percent are over age 50.
RNs, Non-APRNs APRNs Total
# % of Ohio RNs # % of Ohio APRNs
NE Ohio 60,661 35.3% 4,031 37.9% 64,692
Age Category
% of NE Ohio Nurses
18-25 2.0%
26-30 8.9%
31-35 9.2%
36-40 9.6%
41-45 11.4%
46-50 11.7%
51-55 13.6%
56-60 14.6%
61-65 10.9%
66-70 5.3%
71-75 2.0%
76-80 0.6%
81+ 0.2%
Residential Region# Working as a Nurse
# Not Working as a Nurse
Total #
NE Ohio 51,743 7,988 59,731
25
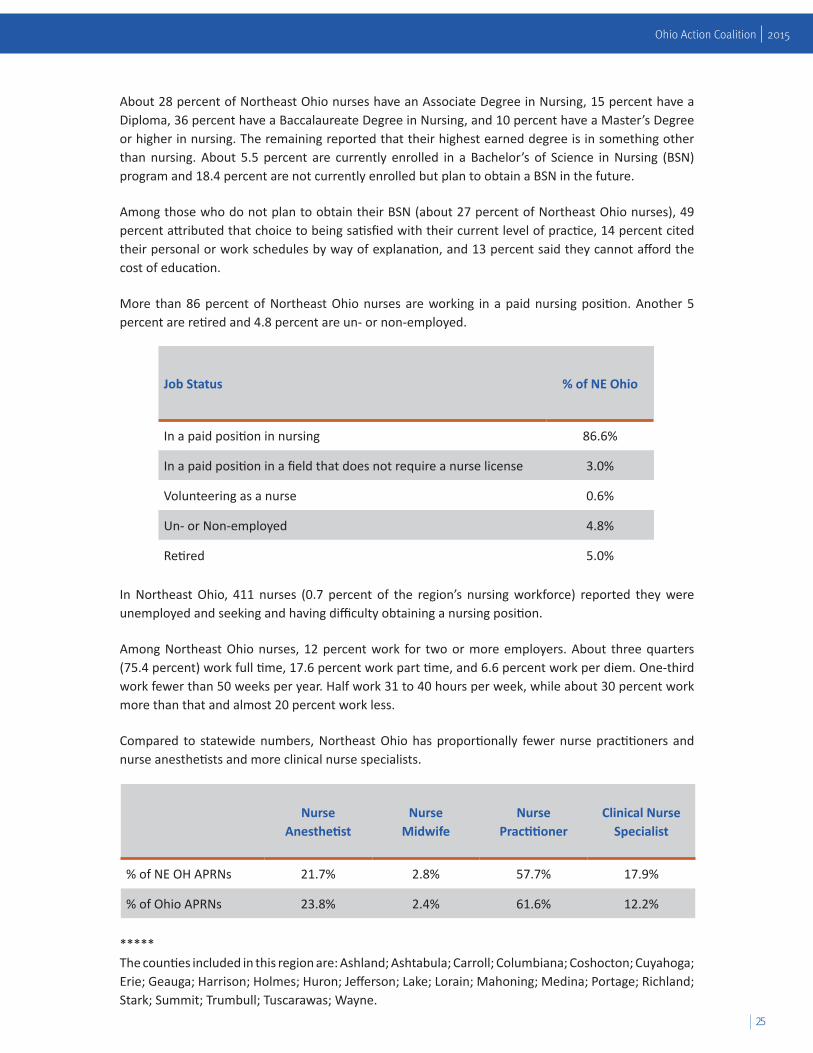
Ohio Action Coalition 2015
About 28 percent of Northeast Ohio nurses have an Associate Degree in Nursing, 15 percent have a Diploma, 36 percent have a Baccalaureate Degree in Nursing, and 10 percent have a Master’s Degree or higher in nursing. The remaining reported that their highest earned degree is in something other than nursing. About 5.5 percent are currently enrolled in a Bachelor’s of Science in Nursing (BSN) program and 18.4 percent are not currently enrolled but plan to obtain a BSN in the future.
Among those who do not plan to obtain their BSN (about 27 percent of Northeast Ohio nurses), 49 percent attributed that choice to being satisfied with their current level of practice, 14 percent cited their personal or work schedules by way of explanation, and 13 percent said they cannot afford the cost of education.
More than 86 percent of Northeast Ohio nurses are working in a paid nursing position. Another 5 percent are retired and 4.8 percent are un- or non-employed.
Job Status % of NE Ohio
In a paid position in nursing 86.6%
In a paid position in a field that does not require a nurse license 3.0%
Volunteering as a nurse 0.6%
Un- or Non-employed 4.8%
Retired 5.0%
In Northeast Ohio, 411 nurses (0.7 percent of the region’s nursing workforce) reported they were unemployed and seeking and having difficulty obtaining a nursing position.
Among Northeast Ohio nurses, 12 percent work for two or more employers. About three quarters (75.4 percent) work full time, 17.6 percent work part time, and 6.6 percent work per diem. One-third work fewer than 50 weeks per year. Half work 31 to 40 hours per week, while about 30 percent work more than that and almost 20 percent work less.
Compared to statewide numbers, Northeast Ohio has proportionally fewer nurse practitioners and nurse anesthetists and more clinical nurse specialists.
Nurse Anesthetist
Nurse Midwife
Nurse Practitioner
Clinical Nurse Specialist
% of NE OH APRNs 21.7% 2.8% 57.7% 17.9%
% of Ohio APRNs 23.8% 2.4% 61.6% 12.2%
*****The counties included in this region are: Ashland; Ashtabula; Carroll; Columbiana; Coshocton; Cuyahoga; Erie; Geauga; Harrison; Holmes; Huron; Jefferson; Lake; Lorain; Mahoning; Medina; Portage; Richland; Stark; Summit; Trumbull; Tuscarawas; Wayne.
26
The RN & APRN Workforce in Ohio
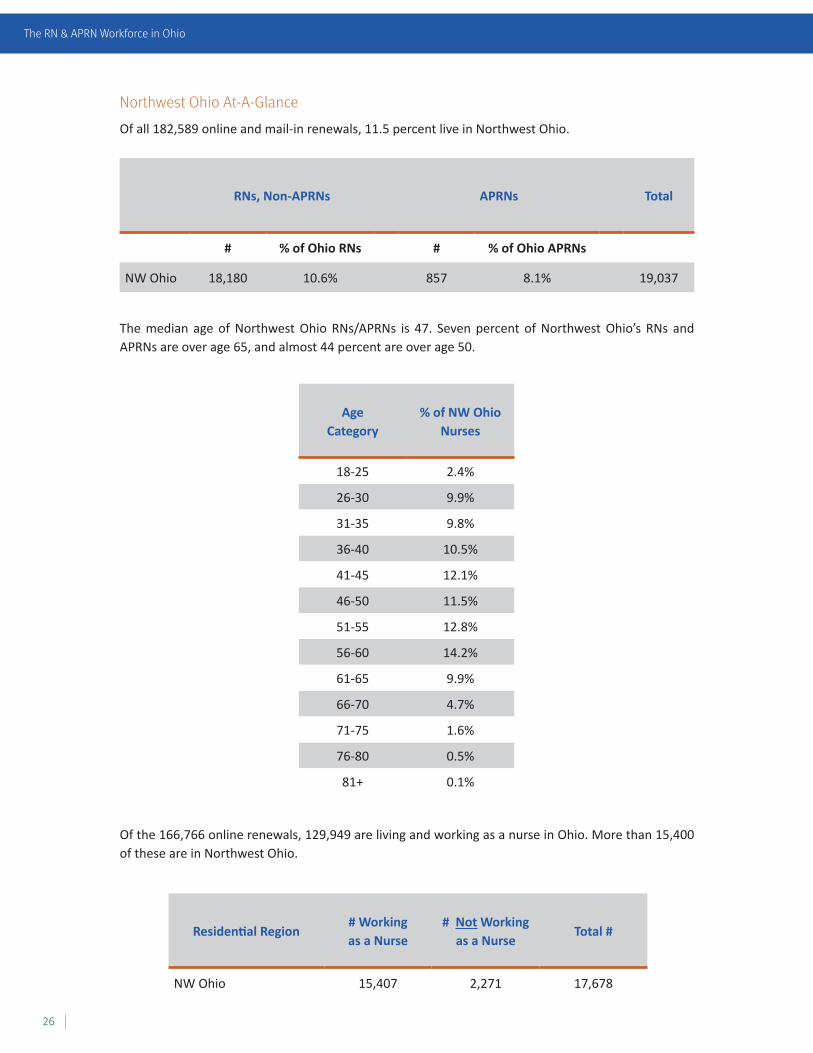
Northwest Ohio At-A-Glance
Of all 182,589 online and mail-in renewals, 11.5 percent live in Northwest Ohio.
The median age of Northwest Ohio RNs/APRNs is 47. Seven percent of Northwest Ohio’s RNs and APRNs are over age 65, and almost 44 percent are over age 50.
Of the 166,766 online renewals, 129,949 are living and working as a nurse in Ohio. More than 15,400 of these are in Northwest Ohio.
RNs, Non-APRNs APRNs Total
# % of Ohio RNs # % of Ohio APRNs
NW Ohio 18,180 10.6% 857 8.1% 19,037
Age Category
% of NW Ohio Nurses
18-25 2.4%
26-30 9.9%
31-35 9.8%
36-40 10.5%
41-45 12.1%
46-50 11.5%
51-55 12.8%
56-60 14.2%
61-65 9.9%
66-70 4.7%
71-75 1.6%
76-80 0.5%
81+ 0.1%
Residential Region# Working as a Nurse
# Not Working as a Nurse
Total #
NW Ohio 15,407 2,271 17,678
27
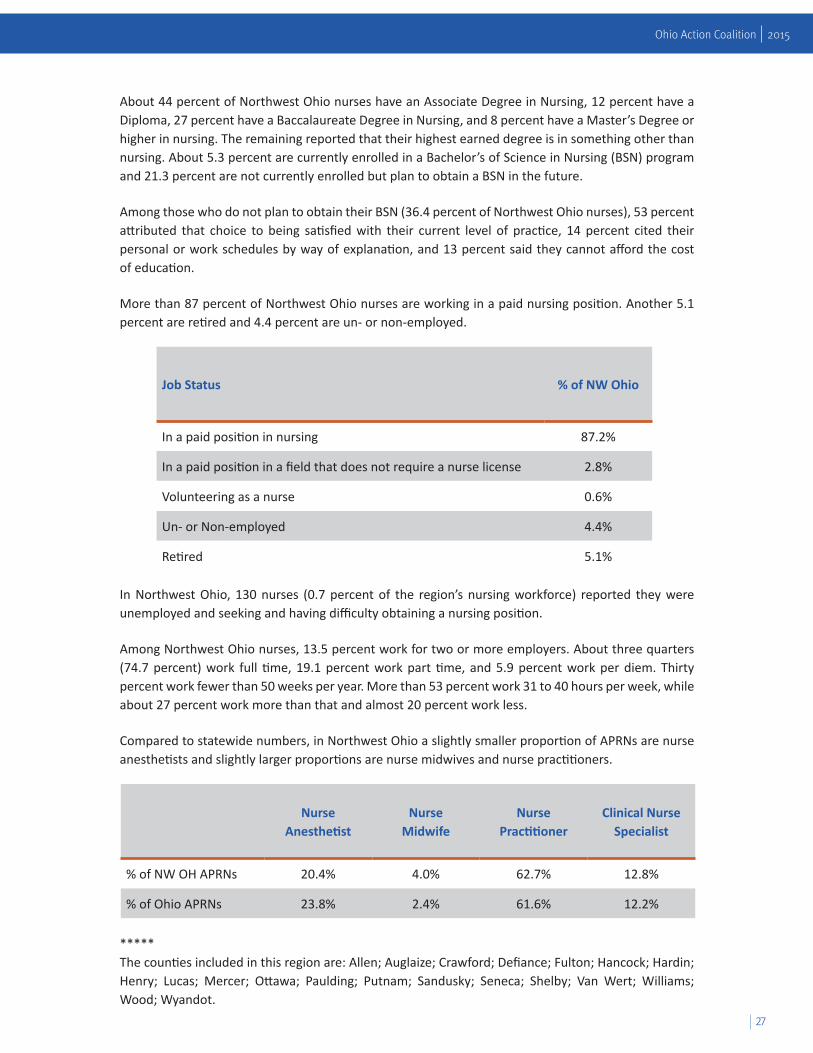
Ohio Action Coalition 2015
About 44 percent of Northwest Ohio nurses have an Associate Degree in Nursing, 12 percent have a Diploma, 27 percent have a Baccalaureate Degree in Nursing, and 8 percent have a Master’s Degree or higher in nursing. The remaining reported that their highest earned degree is in something other than nursing. About 5.3 percent are currently enrolled in a Bachelor’s of Science in Nursing (BSN) program and 21.3 percent are not currently enrolled but plan to obtain a BSN in the future.
Among those who do not plan to obtain their BSN (36.4 percent of Northwest Ohio nurses), 53 percent attributed that choice to being satisfied with their current level of practice, 14 percent cited their personal or work schedules by way of explanation, and 13 percent said they cannot afford the cost of education.
More than 87 percent of Northwest Ohio nurses are working in a paid nursing position. Another 5.1 percent are retired and 4.4 percent are un- or non-employed.
In Northwest Ohio, 130 nurses (0.7 percent of the region’s nursing workforce) reported they were unemployed and seeking and having difficulty obtaining a nursing position.
Among Northwest Ohio nurses, 13.5 percent work for two or more employers. About three quarters (74.7 percent) work full time, 19.1 percent work part time, and 5.9 percent work per diem. Thirty percent work fewer than 50 weeks per year. More than 53 percent work 31 to 40 hours per week, while about 27 percent work more than that and almost 20 percent work less.
Compared to statewide numbers, in Northwest Ohio a slightly smaller proportion of APRNs are nurse anesthetists and slightly larger proportions are nurse midwives and nurse practitioners.
Job Status % of NW Ohio
In a paid position in nursing 87.2%
In a paid position in a field that does not require a nurse license 2.8%
Volunteering as a nurse 0.6%
Un- or Non-employed 4.4%
Retired 5.1%
*****The counties included in this region are: Allen; Auglaize; Crawford; Defiance; Fulton; Hancock; Hardin; Henry; Lucas; Mercer; Ottawa; Paulding; Putnam; Sandusky; Seneca; Shelby; Van Wert; Williams; Wood; Wyandot.
Nurse Anesthetist
Nurse Midwife
Nurse Practitioner
Clinical Nurse Specialist
% of NW OH APRNs 20.4% 4.0% 62.7% 12.8%
% of Ohio APRNs 23.8% 2.4% 61.6% 12.2%
28
The RN & APRN Workforce in Ohio
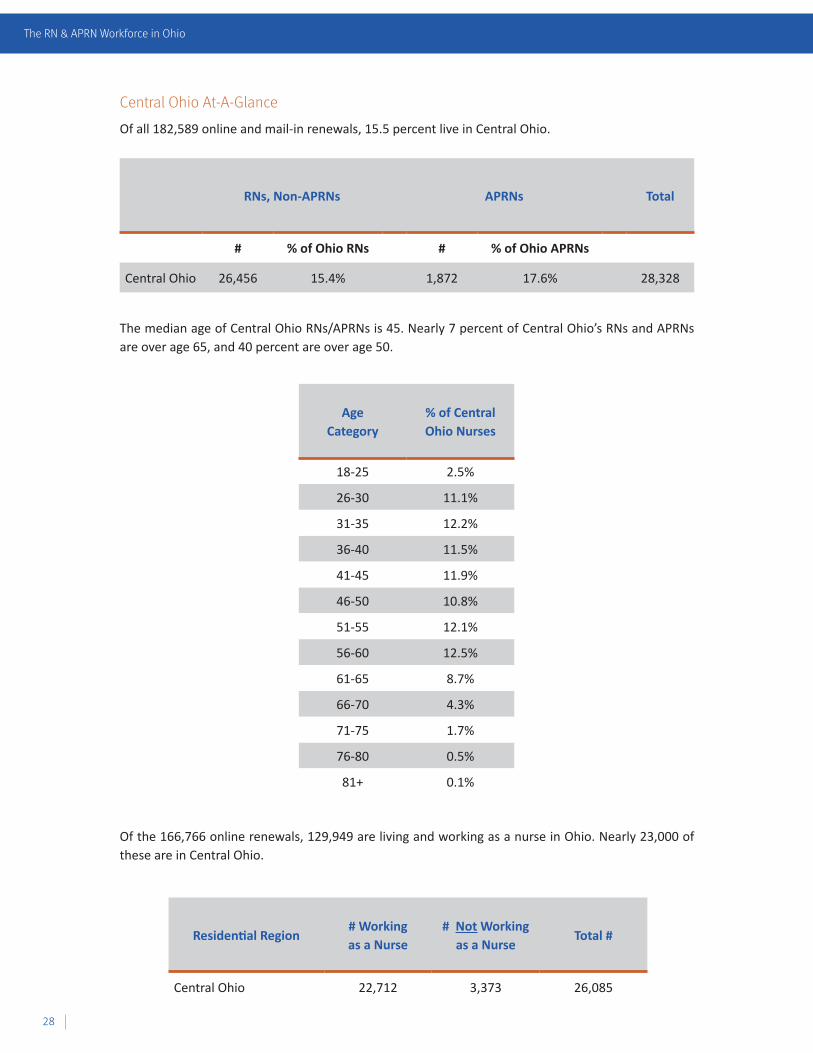
Central Ohio At-A-Glance
Of all 182,589 online and mail-in renewals, 15.5 percent live in Central Ohio.
The median age of Central Ohio RNs/APRNs is 45. Nearly 7 percent of Central Ohio’s RNs and APRNs are over age 65, and 40 percent are over age 50.
Of the 166,766 online renewals, 129,949 are living and working as a nurse in Ohio. Nearly 23,000 of these are in Central Ohio.
RNs, Non-APRNs APRNs Total
# % of Ohio RNs # % of Ohio APRNs
Central Ohio 26,456 15.4% 1,872 17.6% 28,328
Age Category
% of Central Ohio Nurses
18-25 2.5%
26-30 11.1%
31-35 12.2%
36-40 11.5%
41-45 11.9%
46-50 10.8%
51-55 12.1%
56-60 12.5%
61-65 8.7%
66-70 4.3%
71-75 1.7%
76-80 0.5%
81+ 0.1%
Residential Region# Working as a Nurse
# Not Working as a Nurse
Total #
Central Ohio 22,712 3,373 26,085
29
Ohio Action Coalition 2015
Nearly 32 percent of Central Ohio nurses have an Associate Degree in Nursing, almost 9 percent have a Diploma, more than 37 percent have a Baccalaureate Degree in Nursing, and nearly 11 percent have a Master’s Degree or higher in nursing. The remaining reported that their highest earned degree is in something other than nursing. About 7 percent are currently enrolled in a Bachelor’s of Science in Nursing (BSN) program and 19.3 percent are not currently enrolled but plan to obtain a BSN in the future.
Among those who do not plan to obtain their BSN (21.5 percent of Central Ohio nurses), about half attributed that choice to being satisfied with their current level of practice, 13.7 percent cited their personal or work schedules by way of explanation, and 11.5 percent said they cannot afford the cost of education.
About 87 percent of Central Ohio nurses are working in a paid nursing position. Another 4.6 percent are retired and 5 percent are un- or non-employed.
In Central Ohio, 237 nurses (0.9 percent of the region’s nursing workforce) reported they were unemployed and seeking and having difficulty obtaining a nursing position.
Among Central Ohio nurses, 11.9 percent work for two or more employers. More than three quarters (78.2 percent) work full time, 16.3 percent work part time, and 5.1 percent work per diem. Just over 31 percent work fewer than 50 weeks per year. About 54 percent work 31 to 40 hours per week, while almost 29 percent work more than that and about 17 percent work less.
Compared to statewide numbers, in Central Ohio proportionally fewer APRNs are nurse anesthetists, while more are nurse practitioners.
*****The counties included in this region are: Delaware; Fairfield; Franklin; Knox; Licking; Logan; Madison; Marion; Morrow; Pickaway; Union.
Job Status% of
Central Ohio
In a paid position in nursing 87.1%
In a paid position in a field that does not require a nurse license 2.4%
Volunteering as a nurse 0.6%
Un- or Non-employed 5.0%
Retired 4.6%
Nurse Anesthetist
Nurse Midwife
Nurse Practitioner
Clinical Nurse Specialist
% of Central OH APRNs 16.1% 2.4% 71.3% 10.2%
% of Ohio APRNs 23.8% 2.4% 61.6% 12.2%
30
The RN & APRN Workforce in Ohio
Southeast Ohio At-A-Glance
Of all 182,589 online and mail-in renewals, 5.4 percent live in Southeast Ohio.
The median age of Southeast Ohio RNs/APRNs is 45. More than 6 percent of Southeast Ohio’s RNs and APRNs are over age 65, and almost 41 percent are over age 50.
Of the 166,766 online renewals, 129,949 are living and working as a nurse in Ohio. About 8,000 of these are in Southeast Ohio.
RNs, Non-APRNs APRNs Total
# % of Ohio RNs # % of Ohio APRNs
SE Ohio 9,527 5.5% 471 4.4% 9,998
Age Category
% of SE Ohio Nurses
18-25 2.9%
26-30 9.4%
31-35 10.6%
36-40 12.2%
41-45 13.0%
46-50 11.0%
51-55 12.5%
56-60 13.1%
61-65 9.2%
66-70 4.2%
71-75 1.4%
76-80 0.4%
81+ 0.1%
Residential Region# Working as a Nurse
# Not Working as a Nurse
Total #
SE Ohio 8,094 1,082 9,176
31
Ohio Action Coalition 2015
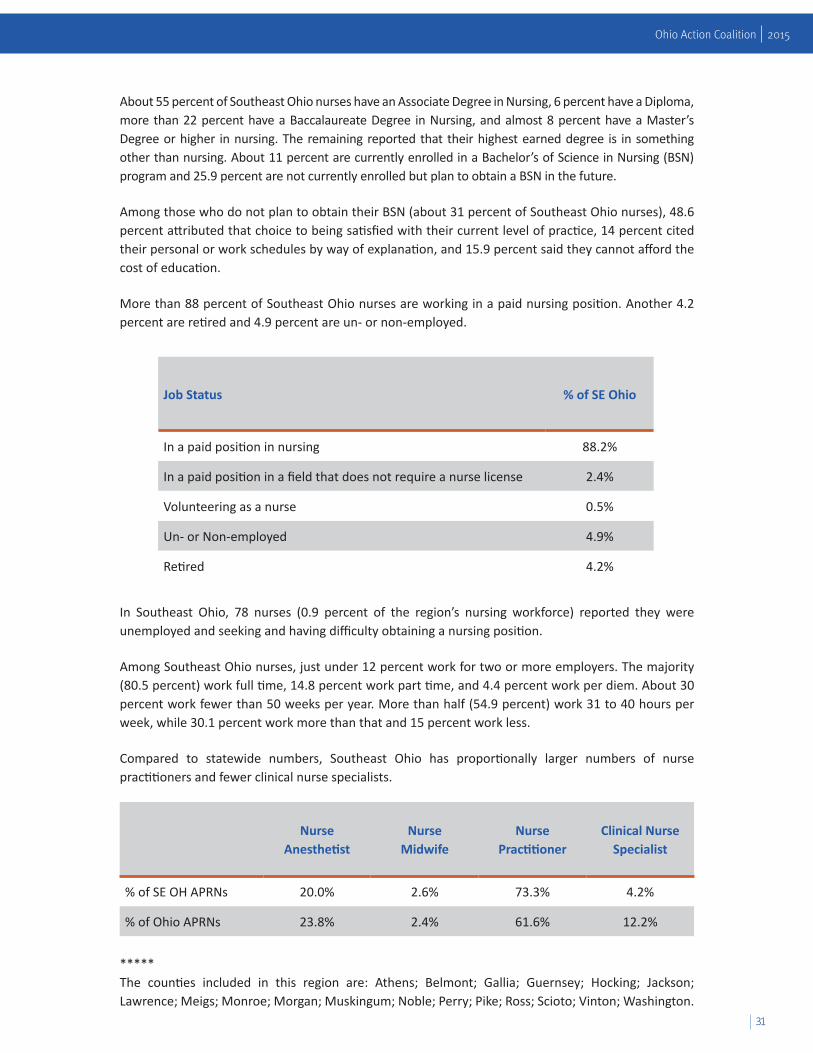
About 55 percent of Southeast Ohio nurses have an Associate Degree in Nursing, 6 percent have a Diploma, more than 22 percent have a Baccalaureate Degree in Nursing, and almost 8 percent have a Master’s Degree or higher in nursing. The remaining reported that their highest earned degree is in something other than nursing. About 11 percent are currently enrolled in a Bachelor’s of Science in Nursing (BSN) program and 25.9 percent are not currently enrolled but plan to obtain a BSN in the future.
Among those who do not plan to obtain their BSN (about 31 percent of Southeast Ohio nurses), 48.6 percent attributed that choice to being satisfied with their current level of practice, 14 percent cited their personal or work schedules by way of explanation, and 15.9 percent said they cannot afford the cost of education.
More than 88 percent of Southeast Ohio nurses are working in a paid nursing position. Another 4.2 percent are retired and 4.9 percent are un- or non-employed.
In Southeast Ohio, 78 nurses (0.9 percent of the region’s nursing workforce) reported they were unemployed and seeking and having difficulty obtaining a nursing position.
Among Southeast Ohio nurses, just under 12 percent work for two or more employers. The majority (80.5 percent) work full time, 14.8 percent work part time, and 4.4 percent work per diem. About 30 percent work fewer than 50 weeks per year. More than half (54.9 percent) work 31 to 40 hours per week, while 30.1 percent work more than that and 15 percent work less.
Compared to statewide numbers, Southeast Ohio has proportionally larger numbers of nurse practitioners and fewer clinical nurse specialists.
*****The counties included in this region are: Athens; Belmont; Gallia; Guernsey; Hocking; Jackson; Lawrence; Meigs; Monroe; Morgan; Muskingum; Noble; Perry; Pike; Ross; Scioto; Vinton; Washington.
Job Status % of SE Ohio
In a paid position in nursing 88.2%
In a paid position in a field that does not require a nurse license 2.4%
Volunteering as a nurse 0.5%
Un- or Non-employed 4.9%
Retired 4.2%
Nurse Anesthetist
Nurse Midwife
Nurse Practitioner
Clinical Nurse Specialist
% of SE OH APRNs 20.0% 2.6% 73.3% 4.2%
% of Ohio APRNs 23.8% 2.4% 61.6% 12.2%
32
The RN & APRN Workforce in Ohio
Southwest Ohio At-A-Glance
Of all 182,589 online and mail-in renewals, almost 22 percent live in Southwest Ohio.
The median age of Southwest Ohio RNs/APRNs is 47. About 7.6 percent of Southwest Ohio’s RNs and APRNs are over age 65, and about 45 percent are over age 50.
Of the 166,766 online renewals, 129,949 are living and working as a nurse in Ohio. Nearly 32,000 of these are in Southwest Ohio.
RNs, Non-APRNs APRNs Total
# % of Ohio RNs # % of Ohio APRNs
SW Ohio 37,781 22.0% 2,184 20.5% 39,965
Age Category
% of SW Ohio Nurses
18-25 2.2%
26-30 9.4%
31-35 10.4%
36-40 9.8%
41-45 11.6%
46-50 11.6%
51-55 13.2%
56-60 14.2%
61-65 10.0%
66-70 5.0%
71-75 1.9%
76-80 0.5%
81+ 0.1%
Residential Region# Working as a Nurse
# Not Working as a Nurse
Total #
SW Ohio 31,993 5,133 37,126
33
Ohio Action Coalition 2015
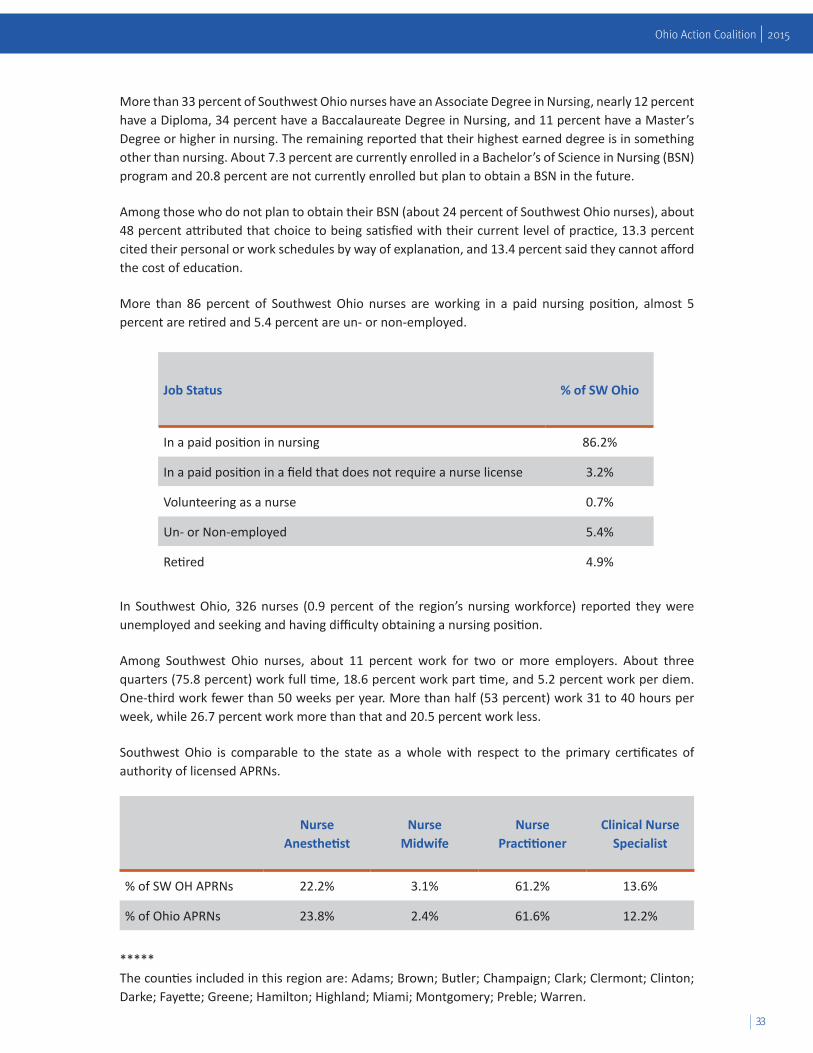
More than 33 percent of Southwest Ohio nurses have an Associate Degree in Nursing, nearly 12 percent have a Diploma, 34 percent have a Baccalaureate Degree in Nursing, and 11 percent have a Master’s Degree or higher in nursing. The remaining reported that their highest earned degree is in something other than nursing. About 7.3 percent are currently enrolled in a Bachelor’s of Science in Nursing (BSN) program and 20.8 percent are not currently enrolled but plan to obtain a BSN in the future.
Among those who do not plan to obtain their BSN (about 24 percent of Southwest Ohio nurses), about 48 percent attributed that choice to being satisfied with their current level of practice, 13.3 percent cited their personal or work schedules by way of explanation, and 13.4 percent said they cannot afford the cost of education.
More than 86 percent of Southwest Ohio nurses are working in a paid nursing position, almost 5 percent are retired and 5.4 percent are un- or non-employed.
In Southwest Ohio, 326 nurses (0.9 percent of the region’s nursing workforce) reported they were unemployed and seeking and having difficulty obtaining a nursing position.
Among Southwest Ohio nurses, about 11 percent work for two or more employers. About three quarters (75.8 percent) work full time, 18.6 percent work part time, and 5.2 percent work per diem. One-third work fewer than 50 weeks per year. More than half (53 percent) work 31 to 40 hours per week, while 26.7 percent work more than that and 20.5 percent work less.
Southwest Ohio is comparable to the state as a whole with respect to the primary certificates of authority of licensed APRNs.
*****The counties included in this region are: Adams; Brown; Butler; Champaign; Clark; Clermont; Clinton; Darke; Fayette; Greene; Hamilton; Highland; Miami; Montgomery; Preble; Warren.
Job Status % of SW Ohio
In a paid position in nursing 86.2%
In a paid position in a field that does not require a nurse license 3.2%