16
SNAP SHOT O F OH I O’ S DEMO GRA PH I CS Alison D. Goebel, PhD Associate Director Greater Ohio Policy Center July 9, 2015
| Date post: | 05-Aug-2015 |
| Category: |
Government & Nonprofit |
| Upload: | greaterohio |
| View: | 26 times |
| Download: | 0 times |

SNAPS
HOT OF
OHIO’S
DEMOGRAPH
ICS
Alison D. Goebel, PhDAssociate DirectorGreater Ohio Policy Center
July 9, 2015

ABOUT GREATER OHIO POLICY CENTER
An outcome-oriented statewide non-profit that champions revitalization and sustainable redevelopment in Ohio:
• Revitalize Ohio’s urban cores and metropolitan regions
• Achieve sustainable land reuse and economic growth
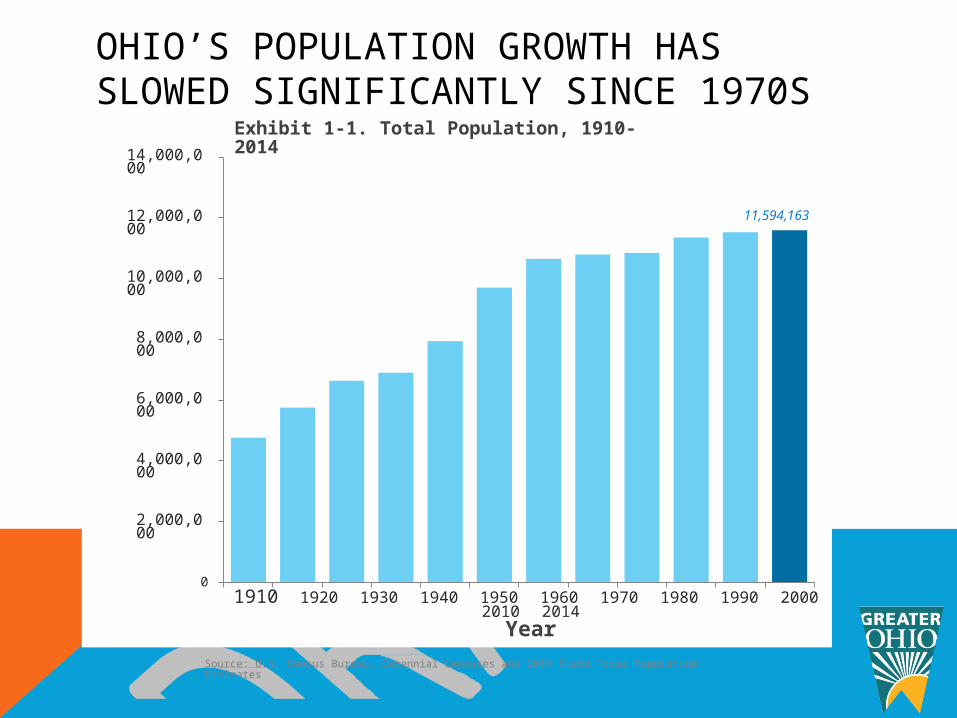
OHIO’S POPULATION GROWTH HAS SLOWED SIGNIFICANTLY SINCE 1970S
Exhibit 1-1. Total Population, 1910-201414,000,000
12,000,000
11,594,163
10,000,000
8,000,000
6,000,000
4,000,000
2,000,000
01910 1920 1930 1940 1950 1960 1970 1980 1990 2000 2010
2014Year
Source: U.S. Census Bureau, Decennial Censuses and 2014 State Total Population Estimates

OHIO’S PROJECTED POPULATION GROWTH FOR NEXT 25 YEARS IS MINIMAL
2015-2040: Population growth
Ohio: expected to grow 0.04% per year (bringing state’s total population to ~11,678,970 by 2040)
• Ohio 2014 population: 11,594,163• Net gain of ~85,000 residents by 2040
United States: expected to grow 0.69% per year (adding nearly 60 million people to the populace)
• US 2014 population: 318,857,056

THERE HAS BEEN OVERALL POPULATION LOSS IN OHIO’S LARGE LEGACY CITIES
Akron
Cant
on
Cinc
inna
ti
Clev
elan
d
Colu
mbu
s
Dayto
n
Tole
do
Youn
gsto
wn
0
200,000
400,000
600,000
800,000
Population Change in Ohio Cities, 1970-2013
Population in 1970 Population in 2013
Source: 2009-2013 American Community Survey 5-Year Estimates

CHANGE IN POPULATION FROM 2000 TO 2013 FOR OHIO’S SMALL AND MEDIUM SIZED CITIES
Canto
n
Hamilt
onLim
a
Lora
in
Man
sfiel
d
Mid
dlet
own
Ports
mou
th
Sprin
field
Youn
gsto
wn
Ohio
-20.00%
-15.00%
-10.00%
-5.00%
0.00%
5.00%
-9.63%
2.74%
-3.77%
-6.75%
-4.02%
-5.70%
-2.64%
-7.55%-18.91%
-1.59%

IN 2013 RESIDENTIAL VACANCY RATES EXCEEDED 10% IN OHIO’S MAJOR CITIES
Akron
Canto
n
Cincinn
ati
Cleve
land
Colum
bus
Day
ton
Tole
do
Young
stow
nOhi
o US
0.0%
5.0%
10.0%
15.0%
20.0%
25.0%
Source: 2009-2013 American Community Survey 5-Year Estimates

RESIDENTIAL VACANCY RATES EXCEEDED 10% IN OHIO’S MID- AND SMALL-SIZED CITIES, IN 2013
Ham
ilton
Lim
a
Lora
in
Man
sfiel
d
Mid
dlet
own
Sprin
gfiel
d
War
ren
0.0%
2.0%
4.0%
6.0%
8.0%
10.0%
12.0%
14.0%
16.0%
18.0%
20.0%
Source: 2009-2013 American Community Survey 5-Year Estimates

OHIO IS AGING; OLDER COUNTIES ARE NOT EXPECTING YOUNGER COHORTS TO REPLACE AGING RESIDENTS2015: population age 55+ Projected overall population
growth 2015-2040

OHIO’S MILLENNIALS (AGES 25-34)
91% of Ohio’s millennials with college degrees live in the state’s 8 largest metros

OHIO IS BECOMING MORE RACIALLY/ETHNICALLY DIVERSE: THIS IS A GOOD TREND

OHIO’S IMMIGRANT POPULATION TRENDS
Akron
Canto
n
Cincinn
ati
Cleve
land
Colum
bus
Dayto
n
Tole
do
Young
stow
n0
10,00020,00030,00040,00050,00060,00070,00080,00090,000
100,000
Foreign-Born Population Total
20002013
Source: 2000 SF3 Sample Data and 2009-2013 ACS 5-Year Estimates

OHIO’S FOREIGN-BORN POPULATION
461,339 foreign born •4.25% of state population
•~50% naturalized; ~50% not US citizen

OHIO’S FOREIGN-BORN POPULATION
Largest foreign born population groups in Ohio:
1. Mexican (50,843) 6. British (14,233)
2. Indian (47,150) 7. Korean (12,345)
3. Chinese (28,543) 8. Filipino (13,867)
4. German (17,677) 9. Vietnamese (10,597)
5. Canadian (15,291) 10. Russian (9,856)

GOPC’S STATE POLICY RECOMMENDATIONS
1. Create a loan program that links small business lending with neighborhood improvement efforts
2. Develop programming the connects entrepreneurs with vacant commercial buildings
3. Establish innovative financing programs that support infrastructure modernization and fund brownfield redevelopment
4. Increase state funding and federal funds flexed for transit
5. Implement a statewide Safe Streets policy to ensure safety of all users and encourage economic development
QUESTIONS?
Alison D. Goebel, PhD
Associate Director
Greater Ohio Policy Center
[email protected]@alisongoebelOH
www.greaterohio.org614-224-0187@greaterohio


