83
Ohio EPP Process Evaluation Final Report Prepared for the Ohio Office of Energy Efficiency July 2005

Ohio EPP Process Evaluation
Final Report
Prepared for the Ohio Office of Energy Efficiency
July 2005

www.appriseinc.org Table of Contents
Table of Contents
Executive Summary ................................................................................................................... i
Introduction.................................................................................................................... i
Evaluation Activities...................................................................................................... i
Summary of Findings.................................................................................................... ii
Summary of Recommendations................................................................................... vi
I. Introduction ............................................................................................................................1
A. Electric Partnership Program ...................................................................................1
B. Evaluation ................................................................................................................1
C. Organization of the Report.......................................................................................2
II. Electric Partnership Program ................................................................................................3
A. Program Mandate.....................................................................................................3
B. Program Goals .........................................................................................................3
C. Program Design and Implementation ......................................................................3
D. Changes and Enhancements to the EPP in Fiscal Year 2005 ................................15
E. Program Changes for Fiscal Year 2006 .................................................................17
III. Evaluation Activities and Findings....................................................................................19
A. Administrative Interviews......................................................................................19
B. Review of Program Statistics.................................................................................22
C. Client Interviews....................................................................................................29
D. Program Data .........................................................................................................42
E. Agency Survey.......................................................................................................45
F. Light Bulb Research ..............................................................................................58
IV. Summary of Findings and Recommendations...................................................................67
A. Improvements in the Fourth Year of the EPP........................................................67
B. Additional Advances Expected in Next Year ........................................................68
C. Program Administration.........................................................................................69
D. Service Delivery.....................................................................................................69
APPRISE Incorporated

www.appriseinc.org Table of Contents
E. Technology ............................................................................................................71
APPRISE Incorporated

www.appriseinc.org Executive Summary
Executive Summary
Ohio's Electric Restructuring Act, passed in July 1999, created the Universal Service Fund (USF) to ensure that low-income households retain access to electric service. The Act seeks to better coordinate the Home Energy Assistance Program (HEAP), the Home Weatherization Assistance Program (HWAP), the Ohio Energy Credits Program (OEC), and the Ohio Electric Percentage of Income Payment Program (PIPP),1 and creates an Electric Partnership Program (EPP) that provides baseload, weatherization, and energy education services. This report presents the findings from the fourth year of the Process Evaluation of the Electric Partnership Program.
Introduction
The Electric Partnership Program (EPP) aims to reduce electric energy consumption of PIPP eligible households, and reduce the growth of PIPP clients' arrears and the USF rider. To accomplish this objective, the EPP provides energy services that vary with the client's usage level, and education services that vary with the client's usage and payment. The basis of the Program is the installation of cost-effective energy conservation measures. Education is an important component of the Program to help clients to understand the Program, to improve measure performance, and to take energy-saving actions.
Evaluation Activities
This report presents the findings and recommendations from the fourth year of the Process Evaluation of the Electric Partnership Program. During this time period, the following evaluation activities were undertaken.
• Administrative Interviews: APPRISE conducted administrative interviews with OEE staff. The purpose of these interviews was to document the changes made to the Program and to document Program operations, including quality control findings.
• Review of Program Statistics: APPRISE reviewed production data from SMOC~ERS and financial data from OEE. The purpose of this review was to understand trends in production and to determine whether there were areas in which production should be increased.
• Client Interviews: APPRISE conducted the fourth round of the client interviews in Fall 2004 and the fifth round of the client interviews in Winter 2005. The purpose of these interviews was to document education provided to clients, client retention of educational information, changes in client behavior, and client satisfaction with the Program.
1 The gas PIPP continues to be administered by the utility companies.
APPRISE Incorporated Page i
www.appriseinc.org Executive Summary
• Program Data: APPRISE collected data from the providers on other programs provided to EPP participants since the delivery of EPP services. After each round of the client survey, agencies were contacted to obtain information on other programs provided to clients who completed the interviews. These data will help to distinguish the impact of the EPP from other services that Program recipients may have received.
• Agency Survey: APPRISE conducted the fourth round of the agency survey in Fall/Winter 2004. The purpose of the survey was to document agency adherence to prescribed Program procedures, services delivered, and need for assistance in implementing the Program.
• Light Bulb Research: APPRISE conducted research to provide insight on the high bulb failure rate. This research consisted of a provider survey to document the types of bulbs installed, and a client survey to document installation, removal, and failure rates by provider.
Summary of Findings
Significant improvements were made in the design and implementation of the Electric Partnership Program in the fourth year of operation. Some of the key accomplishments over the last year have been:
• Program production continued to increase in the fourth year of the EPP.
• Additional improvements were made to SMOC~ERS.
• A Tablet PC was adopted by all of the agencies.
• Program marketing was enhanced.
• Requirements were set for the number of days of EPP monitoring.
• Procedures were developed for Comprehensive Services.
The principal suggestions for continued improvements to the Program include requiring agencies to replace bulbs that fail in the first year, providing incentives to increase refrigerator removal rates, providing incentives or penalties to increase the rate of custom measures and fuel switches, re-examining the cost-effectiveness of air conditioning measures, increased production in Cinergy’s service territory, additional education and baseload training, and increased quality control.
Improvements in the Fourth Year of the EPP
Several changes have been made to improve the EPP in the fourth year of the Program. Each of these changes is described below.
APPRISE Incorporated Page ii
www.appriseinc.org Executive Summary
• Tablet PC: All of the agencies are now using the Tablet PC as a replacement for the PDA. There are many benefits to this switch.
o Auditors report that it is easier to use and can store information on a much larger number of jobs. This allows auditors to find replacements when they have a client who does not show up for an appointment.
o Auditors have not lost data, as they did with the PDA.
o Auditors can put the refrigerator cut sheets, the policies and procedures manual, and the client education notebook on the tablet.
o The movement to the Tablet PC eliminated the need for programming SMOC~ERS in a new language. This allows for much easier and less costly updates to the software.
• EPP Brochure:A brochure was developed for the EPP and distributed to agencies in July 2004. Agencies can mail the brochure to potential clients.
• EPP Letter: OEE sent out mass mailing letters to clients about the EPP in August and October 2004. In each mailing, 2,000 letters were sent to clients from six of the nine authorized providers. OEE received positive feedback that the letters motivated some clients to call the agency and raised awareness about the EPP in others.
• Limited Light Bulb Installations: OEE has revised the formula for light bulb replacements. This revision effectively limits light bulb replacements to those bulbs that are used approximately two hours or more per day. However, OEE will not limit the number of bulbs that can be installed in a home, as they do not want to eliminate cost-effective installations.
• Monitoring: There are three monitors for the EPP and each monitor is now responsible for spending ten days on site at each of three (of the nine total) authorized providers each year. Monitors are working to observe each auditor at least once per year. There were 99 units visited (observed or inspected) between July 1, 2004 and May 31, 2005. Monitoring forms have been loaded into the Tablet PC so that monitors can enter data while they are on site.
• No Provider RFP: OEE did not issue a new RFP for providers for FY 2006. Instead, they exercised their option that was contained in the 2004 EPP RFP to extend the funding agreement for a year. This extended existing contracts until June 30, 2006. The purpose of this extension was to allow OEE to concentrate on responding to evaluation recommendations and improving the program, and to provide extra stability to the authorized providers that provide EPP services.
APPRISE Incorporated Page iii

www.appriseinc.org Executive Summary
• Additional SMOC~ERS Enhancements:Additional improvements were made to the SMOC~ERS software, and training was conducted in June 2005. Changes in this release included:
o Refrigerator 2-for-1 swap now includes the use of both refrigerators in the cost-effectiveness calculation
o The refrigerator cost-effectiveness calculation adjusts correctly for ambient temperature
o Auditors can delete measures out of the weatherization module
o Auditors no longer have to put the install date for every measure in the weatherization module, as the date is entered automatically
o Invoicing changes
o Clients are listed in alphabetical order by last name instead of first name
• Comprehensive Service Policies and Procedures: OEE developed policies and procedures for Comprehensive Services. HWDMC and COAD have begun to work on their plans for providing Comprehensive Services.
Additional Advances Expected in the Next Year
There are many additional advances that are planned for the next year including:
• Baseload 201 Training: OEE has developed a set of topics that they feel are necessary for advanced training. These topics include:
o Listening to clients
o Continuing client conversations
o Discussing action plans
o Custom measures
o Fuel switching
o Heating units, heat pumps, and air conditioners
o Water measures
o Custom bulbs
APPRISE Incorporated Page iv

www.appriseinc.org Executive Summary
OEE hoped to provide this training during FY 2005, but was not able to do so. They are now working to provide this training in FY 2006.
• Formal Price List: OEE is considering the use of a formal price list for the next provider RFP. This would provide all agencies with one price for the measures (with the probable exception of refrigerators). This may provide agencies with the incentive to obtain lower prices and an opportunity to obtain revenue from the program. This may also make it easier for OEE to bring on new agencies and expand the program, as it would streamline the provider application process.
• Low-Use Client Pilot: OEE hoped to introduce a low use client pilot to target PIPP clients with usage below 4,000 kWh annually in FY 2005, but did not determine a means to make such a pilot cost-effective. OEE will make a decision as to whether to offer this pilot in FY 2006.
• SMOC~ERS Version 3: OEE needs to make a decision as to whether to move to SMOC~ERS Version 3. This version would integrate the appliance and weatherization audit, and would move to a web-based system. Such a system would provide OEE with real-time access to service delivery data and would allow for easier invoicing. However, this move would involve training costs and additional software costs.
• Implementation of Comprehensive Services: OEE will work with agencies to begin providing Comprehensive Services in FY 2006.
Program Administration
Areas for review in program administration include quality control and air conditioning measures.
• Monitoring Has Increased, But is Still Not Sufficient: OEE requires that each of three monitors spends ten days at three agencies, for a total of 90 days of observations, inspections, and technical assistance. However, over the past year only 99 jobs were observed or inspected. 2 OEE staff members report that staff do not have time for additional monitoring, and that they cannot hire additional staff.
• Air Conditioning Measures Have Not Been Implemented: Monitors report that air conditioning is one big electric use that has not been addressed by the Program.
Service Delivery
Areas for improvement in service delivery include increased production in some utility service territories and improved education delivery. Providers need additional training on CFL protocols, field measures, and fuel switches.
2 Through the end of May 2005.
APPRISE Incorporated Page v
www.appriseinc.org Executive Summary
• Refrigerator Removal and Custom Measure Installation Is Still Low: SMOC~ERS data show that only about two percent of jobs receive these measures.
• Production in Cinergy’s Service Territory Is Still Low: The analyses of OEE financial statistics showed that only 19 percent of the funds in Cinergy’s service territory had been spent as of the end of March.
• Education Still Needs Improvement: Monitors reported that the education component of the audit is still the weak point. Many auditors are still not doing an adequate job of explaining the Program, establishing and confirming the partnership, reviewing the clients’ bills, explaining what will be done during the visit, and reviewing the reports at the end of the visit.
• Some Agencies Do Not Print Out All SMOC~ERS Reports: Monitors reported that there are still some agencies that do not print out all of the SMOC~ERS reports while they are in the clients’ homes because of the cost of the ink for the portable printers. They report that agencies mail the reports to the clients’ homes after the visit. This is inconsistent with program protocols.
• Providers Are Not Following CFL Protocols: Nearly 30 percent of clients reported that the provider left bulbs for them to install after the provider left the home. This practice is inconsistent with Program protocols, and it may lead to CFLs not being installed or not being installed in cost-effective locations.3
• CFL Failure Rate is High: Based on the light bulb survey, we estimated that six percent of CFLs that are replaced fail within six months and nine percent fail within one year.
• Managers and Auditors are Not Comfortable with Field Measures and Fuel Switches: Managers and auditors were likely to report in the agency survey that more training was needed on field measures and fuel switches. Many also reported that they had not implemented these measures because of the need for a better understanding of the procedures.
Technology
The use of technology has improved considerably. All service providers have begun using the Tablet PC, a significant improvement over the PDA. SMOC~ERS is now functioning well, and providers have gotten better at using the software.
Summary of Recommendations
Recommendations in the areas of Program administration, training, technology, and service delivery are made below.
3 OEE staff noted that some of these bulbs may have been provided by the CEI program.
APPRISE Incorporated Page vi

www.appriseinc.org Executive Summary
Program Administration
• Additional Staff or Consultant Time Allocated to Monitoring and On-Site Training: OEE reported that monitors observed or inspected 99 homes this year. Findings from these observations indicate that additional observations and on-site training are needed to improve the quality of the audits and increase the potential savings from the Program. If hiring additional staff is not an option, OEE needs to hire a contractor who can provide additional quality control.
• Work to Increase Production in Cinergy Service Territory: OEE should work with the agencies in this service territory to ramp up production. If necessary, additional providers should be recruited for this area.
• Investigate Cost-Effectiveness of Air Conditioner Replacement: Air conditioners have dropped in price since OEE last investigated the potential cost-effectiveness of this measure. OEE should re-examine this measure and potentially pilot it with one agency.
Training
• Provide Additional Education Training: Findings from the on-site observations conducted by the monitors and findings from the client survey point to a need for additional education training.
• Provide Additional Baseload Training: Surveys and review of SMOC~ERS data show that additional baseload training is needed.
• Provide Additional Training on Field Measures and Fuel Switches: Auditors have not implemented these measures and report that they are not comfortable with the procedures. Additional training is needed in these areas.
• Review EPP Protocols with Providers: Providers are still not following protocols related to bulb replacement. These protocols should be reviewed with the providers.
Service Delivery
• Require Providers to Replace Failed Bulbs: The light bulb survey estimated a six percent failure rate for CFLs within the first six months after service delivery and a nine percent failure rate within one year after service delivery. Providers should be required to return to homes and replace bulbs that fail in the first year. OEE should investigate whether it would be cost-effective for agencies to return to deliver bulbs to homes with bulbs that burn out after one year.
• Provide Incentives for Increased Two-For-One Refrigerator Replacements and Custom Measures: OEE needs to provide agencies with incentives to increase these measures. The incentives can be through rewards to agencies that install these
APPRISE Incorporated Page vii

www.appriseinc.org Executive Summary
measures in a certain percentage of the jobs, or a new clause in the next contract that reduces agencies’ fees if they do not install these measures in a targeted percentage of jobs.
• Provide Penalties for Agencies That Do Not Print Out Reports in the Clients’ Homes: Auditors must print out the reports while in the home and review the reports with the clients. OEE should not pay the full audit fee if they observe an auditor who does not print the SMOC~ERS reports while at the client’s home.
APPRISE Incorporated Page viii
www.appriseinc.org Introduction
I. Introduction
Ohio's Electric Restructuring Act, passed in July 1999, created the Universal Service Fund (USF) to ensure that low-income households retain access to electric service. The Act seeks to better coordinate the Home Energy Assistance Program (HEAP), the Home Weatherization Assistance Program (HWAP), the Ohio Energy Credits Program (OEC), and the Ohio Electric Percentage of Income Payment Program (PIPP),4 and creates an Electric Partnership Program (EPP) that provides baseload, weatherization, and energy education services. This report presents the findings from the fourth year of the Process Evaluation of the Electric Partnership Program.
A. Electric Partnership Program
The Electric Partnership Program (EPP) aims to reduce electric energy consumption of PIPP eligible households, and reduce the growth of PIPP clients' arrears and the USF rider. To accomplish this objective, the EPP provides energy services that vary with the client's usage level, and education services that vary with the client's usage and payment. The basis of the Program is the installation of cost-effective energy conservation measures. Education is an important component of the Program to help clients to understand the Program, to improve measure performance, and to take energy-saving actions.
B. Evaluation
This report presents the findings and recommendations from the fourth year of the Process Evaluation of the Electric Partnership Program. During this time period, the following evaluation activities were undertaken.
• Administrative Interviews: APPRISE conducted administrative interviews with OEE staff. The purpose of these interviews was to document the changes made to the Program and to document Program operations, including quality control findings.
• Review of Production Statistics: APPRISE reviewed production statistics from the SMOC~ERS database and financial data from OEE. The purpose of this review was to understand how production has grown and stabilized since the introduction of the Program and how production is distributed between the different types of services and between the utility service territories.
• Client Interviews: APPRISE conducted the fourth round of the client interviews in Fall 2004 and the fifth round of the client interviews in Winter 2005. The purpose of these interviews was to document education provided to clients, client retention of educational information, changes in client behavior, and client satisfaction with the Program.
4 The gas PIPP continues to be administered by the utility companies.
APPRISE Incorporated Page 1

www.appriseinc.org Introduction
• Program Data: APPRISE collected data from the providers on other programs provided to EPP participants since the delivery of EPP services. After each round of the client survey, agencies were contacted to obtain information on other programs provided to clients who completed the interviews. These data will help to distinguish the impact of the EPP from other services that Program recipients may have received.
• Agency Survey: APPRISE conducted the fourth round of the agency survey in Fall/Winter 2004. The purpose of the survey was to document agency adherence to prescribed Program procedures, services delivered, and need for assistance in implementing the Program.
• Light Bulb Research: Client interviews and on site observations conducted as part of the technical evaluation found higher than expected light bulb failure rates. APPRISE conducted additional research to provide data on these failures. This research has consisted of a provider survey to document the types of bulbs installed, and a client survey to document installation, removal, and failure rates by provider.
C. Organization of the Report
Three sections follow this introduction.
1) Section II – Electric Partnership Program: This section provides a description of the Electric Partnership Program.
2) Section III – Evaluation Activities and Findings: This section describes the evaluation activities undertaken and the findings and recommendations from these evaluation activities.
3) Section IV – Summary of Findings and Recommendations: This section summarizes the findings and recommendations made in this report.
APPRISE prepared this report under contract to the Office of Energy Efficiency. OEE facilitated this report by furnishing Program data and information to APPRISE. Blasnik and Associates facilitated this report by providing Program data to APPRISE. Any errors or omissions in this report are the responsibility of APPRISE. Further, the statements, findings, conclusions, and recommendations are solely those of analysts from APPRISE and do not necessarily reflect the views of the Office of Energy Efficiency.
APPRISE Incorporated Page 2

www.appriseinc.org Electric Partnership Program
II. Electric Partnership Program
The Electric Partnership Program (EPP) aims to reduce electric energy consumption of PIPP households and reduce the growth of the PIPP participants' arrears and the USF rider. To accomplish this objective, the EPP provides energy services that vary with the client's usage level, and education services that vary with the client's usage and payment. The basis of the Program is the installation of cost-effective energy conservation measures. Education is a second important component of the Program to help clients understand the Program to improve measure performance and take energy-saving actions that will achieve savings.
The EPP's mandate, goal, and design, as well as the changes made to the Program in the fourth year of implementation, are described below.
A. Program Mandate
Ohio's Electric Restructuring Act, passed in July 1999, created the Universal Service Fund to control the cost of PIPP for the ratepayers and to ensure access for low-income households to electric service. The Act seeks to better coordinate the Home Energy Assistance Program (HEAP), the Home Weatherization Assistance Program (HWAP), the Ohio Energy Credits Program (OEC), and the Ohio Electric Percentage of Income Payment Program (PIPP), and creates an Electric Partnership Program (EPP) that provides baseload, weatherization, and energy education services.
According to the Act, "The Director of Development shall establish an energy efficiency and weatherization program targeted, to the extent practicable, to high-cost, high-volume use structures occupied by clients eligible for the Percentage of Income Payment Plan Program, with the goal of reducing the energy bills of the occupants. Acceptance of energy efficiency and weatherization services provided by the program shall be a condition for the eligibility of any such client to participate in the Percentage of Income Payment Plan Program."
The annual funding for the Program is $14.9 million.
B. Program Goals
The goal of the EPP is to "decrease fuel consumption of Percentage of Income Payment Plan (PIPP) participants." Such a decrease in consumption will lead to a reduction in the growth of PIPP participants' arrears and over time reduce the revenues needed from the USF rider.
C. Program Design and Implementation
The EPP consists of an audit component using the SMOC~ERS software, an installation of measures component, and a quality control component. Energy conservation measures are to be installed to meet Ohio Weatherization Program Standards (WPS).
APPRISE Incorporated Page 3
www.appriseinc.org Electric Partnership Program
This section of the report documents the design of each component of the Program, as well as the current status of Program development and implementation.
1. Program Administration
The Ohio EPP is managed by the Ohio Department of Development (ODOD) Office of Energy Efficiency (OEE). Programs are delivered by 9 authorized providers and 29 sub-agencies.
a) Office of Energy Efficiency (OEE)
The OEE is responsible for the development and implementation of the EPP.5 These responsibilities included an RFQ and an RFP process for selecting the agencies to provide services under the Program. Agencies were selected based upon geographic area of service, cost of administering the Program and serving clients, capacity, and previous experience. The Office of Energy Efficiency is also responsible for client screening and targeting clients into the different Program components. The purpose of the screening is to direct services toward those PIPP clients with the highest usage and who therefore have the greatest potential for achieving cost-effective energy savings. The purpose of targeting is to channel clients into the services that will maximize energy savings. Once clients have been screened and targeted into the different Programs, OEE sends lists of clients to the providers. These lists are provided based upon location and usage characteristics. After agencies have served clients, they send their SMOC~ERS data to OEE. These data provide OEE with all the information needed to determine that cost-effective measures have been installed and to remit payment for the services that the agencies provided. SMOC~ERS reports also allow OEE to perform a limited amount of quality control. The following checks can be made on the data. • OEE can ensure that all measures installed are cost-effective according to the
SMOC~ERS software and the data entered by the provider. • OEE can determine the extent to which providers are matching up actual usage
with the usage in the software or from a more recent bill that was entered into SMOC~ERS, both average monthly usage and seasonal usage.
• OEE can check that all data that should be collected are included in the
SMOC~ERS data.
5 An important component of the EPP design for OEE was to streamline service delivery to clients to allow for cost-effective service delivery.
APPRISE Incorporated Page 4

www.appriseinc.org Electric Partnership Program
• OEE can determine if there are auditors who are outliers in terms of estimated electric end uses, or who are providing unreasonable estimates of usage.
OEE is also responsible for ensuring that training is available for providers and for documenting Program procedures. Additionally, OEE provides in-field monitoring and training, where field staff can determine whether providers are finding all cost-effective opportunities for measures, as well as educating clients on energy saving actions. Where deficiencies are seen, they can provide supplemental training.
b) Provider Agencies
Nine authorized providers are currently responsible for providing services under the EPP. Some of these agencies have subagencies working for them and are responsible for reporting and invoicing for these agencies as well. Provider agencies, as part of the RFP for Program services, were asked to provide a high, moderate, and low baseload audit fee, and a weatherization audit fee. The audit fee, charged for each household served, includes all costs for managing the project, as well as the cost of auditing the home and installing measures. Measure costs include both materials and labor. The management activities include oversight of partner agencies and subcontractors, receiving the referral from OEE, contacting and scheduling visits with the clients and landlords, securing contributions from the landlords, processing paperwork, scheduling crews or contractors, final quality control, insurance, equipment, materials management and storage, and submitting invoices. The service delivery responsibilities include the collection of site-specific usage information, the audit procedures, confirmation of installed measures, and assurance of client satisfaction. (Training is included in a separate budget item, along with software and hardware.) Providers were also asked to bid on costs for the Comprehensive Services initial visit, a follow-up visit, a follow-up phone contact, and a follow-up mail contact. Based upon the number of eligible customers and authorized funds, agencies were allocated a dollar figure for the amount of services that could be performed. Agencies were told that if they utilized their allotment, and if funds were available, they could obtain more Program funds to serve additional clients. Table II-1 displays provider budgets (including amendments) for delivery by type of service delivery and visit, and by utility service territory for the fourth year of the Program.
APPRISE Incorporated Page 5

www.appriseinc.org Electric Partnership Program
Table II-1 Provider Budgets Fiscal Year 2005
Service Territory Provider Funding
CHN $2,676,347
COAD $94,110 Honeywell $1,389,966
Mahoning Youngstown $469,742 NCS of Barberton $883,463
Ohio Heartland $158,168 Portage $167,921
FirstEnergy
Wayne Medina $215,988
COAD $48,750 Honeywell $682,500 DP&L
PWC $243,750
COAD $1,967,430 Honeywell $1,704,716
NCS of Barberton $207,910 Ohio Heartland $54,237
AEP
Wayne-Medina $152,845
COAD $96,332 Honeywell $29,268 CINERGY
PWC $1,874,400
Allegheny COAD $25,000
TOTAL $13,142,843
Agencies are responsible for delivering Program services. The steps involved in this process include: 1. Recruiting PIPP clients on the lists provided by OEE 2. Scheduling a home visit 3. Conducting a home visit 4. Performing follow-up or case management 5. Conducting quality control 6. Providing OEE with electronic SMOC~ERS data
APPRISE Incorporated Page 6

www.appriseinc.org Electric Partnership Program
2. Screening and Targeting
OEE obtains usage data on a quarterly basis from the electric utilities in Ohio for all clients participating in PIPP. These data are analyzed to determine which clients should be served and which clients should be targeted to baseload and weatherization services.
The following targeting standards have been implemented:
• Clients with annual baseload usage of 6,000 kWh or more are targeted for baseload services.
• Clients with annual heating or annual cooling usage of 6,000 kWh or more are targeted for weatherization services.
• In November 2002, a moderate use component was introduced. Clients with annual baseload usage between 4,000 and 6,000 kWh are targeted for these services.
3. Outreach and Intake
After OEE targets clients into different services, they send files to the agencies with client information, demographic data, usage data, and targeting data. As all clients on the list are PIPP participants and they have already been screened for eligibility by OEE, the provider is not responsible for screening clients. The Provider is responsible for contacting the client and scheduling the audit and any required follow-up visits.
4. Energy Services
The Electric Partnership Program (EPP) planned for three levels of energy service to be provided based on the client's electric energy consumption. The three levels of service are high use, moderate use, and weatherization. The high use and weatherization services, and the moderate use component, have been implemented. In the next year, OEE will determine whether a low-use pilot can be cost-effective.
a) Baseload Efficiency
Baseload usage is defined as energy used for purposes other than heating and cooling, such as refrigeration, lighting, domestic hot water, cooking, and appliances. The Baseload Efficiency Program focuses on the provision of energy conservation measures that reduce only baseload usage. Measures included in this Program are: Water Measures • Hot water tank insulation • Reducing hot water temperature • Energy-efficient showerheads
APPRISE Incorporated Page 7

www.appriseinc.org Electric Partnership Program
• Energy-efficient faucet aerators • Water line insulation • Fuel-switching of hot water tanks Lighting Measures • Compact fluorescent lights • Replacement of a halogen torchiere lamp with a fluorescent torchiere • Hard wired fluorescent fixtures Refrigerator/Freezer Measures • Refrigerator/Freezer replacement • Removal of secondary refrigerator or freezer • Two-for-one refrigerator swaps Waterbed Measures • Waterbed mattress replacement • Insulation blanket on waterbed Other Measures • Custom measures • Fuel switches
b) Moderate Use
A moderate use component, serving clients with 4,000 to 6,000 kWh annual baseload usage, under 6,000 kWh annual heating usage, and under 6,000 kWh annual cooling usage has been implemented. The moderate use audit focuses on explaining the Program and developing a partnership with the client; analyzing lighting, refrigerator, freezer, and waterbed usage; and developing an action plan with the client. Major differences from the baseload efficiency services provided to higher use clients include: • The auditor is required to collect usage data only for appliances that will have
measures and actions associated with them, not for all electrical appliances in the home, as in the high use component.
• The auditor is not required to get estimated usage within ten percent of the
actual usage on the analysis report, as in the high use component.
• Only a one-hour metering of the refrigerator is required (if the refrigerator is not in the database), as opposed to a two-hour metering for the high use component.
APPRISE Incorporated Page 8
www.appriseinc.org Electric Partnership Program
c) Weatherization
This Program addresses heating and cooling electric usage as well as baseload usage. In addition to installing the cost-effective baseload measures included in the list above, this Program installs weatherization measures aimed at reducing heating and cooling usage. These measures may include: • Insulation • Air sealing • Heating and cooling equipment repair • Heating and cooling equipment upgrades • Heating and cooling equipment replacements • Distribution system repairs
5. Education Services
The goal of the client education component is to reduce the electric energy use of PIPP households to a level that is affordable and to maximize the benefits of the energy conservation measures and other services received. The level of education received by the client will vary with the level of energy use and the client's payment behavior. Two levels of education may be provided: the audit visit with follow-up and in-home case management.
a) Audit Visit
Most clients will receive only one in-home visit. This visit will include an introduction to the Program, an analysis of the client's usage, an energy tour, and an action plan. It was originally planned that in homes with higher usage, the educator would not install measures and that a separate visit would be provided for measure installation. However, Program plans have been altered to include education and measure installation in one visit for all participants. The steps of the in-home education visit are described below. 1) Introduction: The objectives of the introduction are to set the tone for
participation, explain the Program, obtain client commitment, and obtain Program data.
• Purpose of the visit: The provider is to explain that the purpose is to develop an action plan with the client of strategies that he/she can use to reduce usage.
• Program overview and steps: The provider is to explain the services of the Program, the responsibilities of the client and the provider, and the benefits to the client and the provider.
APPRISE Incorporated Page 9

www.appriseinc.org Electric Partnership Program
• Partnership agreement: The provider should communicate the fact that the Program is a partnership and that there are responsibilities and benefits for both the provider and the client. The provider should review the commitments of the provider and the client.
• Action plan as goal of the visit
• Use of educator teaching notebook
2) Usage analysis: The purpose of this section of the visit is to review the client's energy usage.
• Explain the client’s usage and how it varies by season
• Explain baseload versus heating and cooling usage
• Explain how to read the meter if the client has estimated readings
• Educate the client on how to read the bill and look for changes in usage
• Educate the client on how to look for changes in arrearages
• Give the client a clipboard to write down actions that he/she will consider during the house tour
3) Conduct an energy tour: The objectives of the tour are to determine what work needs to be done in the home and to identify the five biggest opportunities for reducing usage.
• Review biggest user electric appliances for the household
• Estimate costs per appliance using the client's habits
• Create suggested actions
4) Action plan
• Review list of suggested actions from software
• Get client's commitment for three to five actions
• Complete energy savings action plan
• Reinforce consequences of each action
APPRISE Incorporated Page 10

www.appriseinc.org Electric Partnership Program
5) Conclusion
• Complete and sign action plan
• Complete paperwork, including list of measures installed
• Provide client with folders and forms
• Review next steps and time frame
• Provide referral information
• Establish follow-up procedures
b) In-Home Case Management
In-home case management includes the initial education visit described above, as well as another home visit and monthly follow-up by mail, phone, or in person. The form of this follow-up will depend on the client's need.6 The objectives of the case management energy education session are to: 1) Help the client to increase control over energy costs, decrease energy use, and
improve his/her ability to pay electricity bills.
2) Develop three new actions for the client.
An important component of the case management session is budget counseling. The goals of the budget counseling component are to:
1) Keep accurate records of income and expenses for six months.
2) Develop a spending plan.
3) Place the electric bill as the third or fourth spending priority.
4) Provide a payment to the electric company each month for the next year.
5) Contact the utility company if the client needs to discuss his/her payments.
Topics covered during the budget counseling session will include income, expenses, a spending plan, the utility bill, and the benefits of paying the utility bill.
The steps of the energy case management visit are outlined below:
6 The format for case management has been substantially changed since this initial plan was created.
APPRISE Incorporated Page 11

www.appriseinc.org Electric Partnership Program
1) Introduction
• Purpose of the session
• Benefits of the Program
• Steps of the process
2) Review action plan
3) Review energy efficiency measures
• Tour home
• Review results/benefits
• Discuss proper use and maintenance of measures
• Problem solving
4) Utility bill analysis
5) Budget counseling
6) Referrals including energy assistance
7) Update action plan
8) Discuss next steps
c) Follow-up
In addition to receipt of one of the education programs described above, all clients will receive at least one follow-up contact. The follow-up contact can be via mail, phone, or in person, based on an assessment of which would be of most benefit to the client. The purpose of this follow-up is to remind clients of their responsibilities and to review the benefits of the Program. It was originally planned that for one year following the home visit, the provider would check the client's monthly payment and usage patterns. Usage tracking was planned to determine if savings are being achieved and to discuss solutions if the projected savings are not being met. Payment tracking was planned to determine if clients are meeting their commitments to make payments and to help the client prioritize energy payments as the third or fourth spending priority.
APPRISE Incorporated Page 12

www.appriseinc.org Electric Partnership Program
6. Service Delivery
Two methods of service delivery were planned. Cost-share and stand-alone service delivery are described below.
a) Cost-Share
With this method of service delivery, the EPP is delivered in conjunction with other low-income weatherization and/or housing repair/rehabilitation programs. Because the provider can divide the cost of contacting the client, scheduling the visit, and traveling to the home between the different programs, the cost of administering the cost-share program should be lower than the cost of administering the stand-alone component. The cost-share approach was eliminated beginning in Fiscal Year 2004.
b) Stand-Alone
With this method of service delivery, the EPP is delivered on its own and must bear all the costs of outreach and delivery. The EPP must perform stand-alone work, as the annual service delivery for this Program will be much higher than the combined delivery of existing programs. Therefore, the intent of the stand-alone delivery was to address the shortfall of homes that could not be addressed by the cost-share program.
7. Technology
OEE decided to utilize a new technology in the implementation of the EPP. This technology consisted of an audit software tool, a Personal Digital Assistant (PDA) that allows the provider to collect data in the field, and transfer software that allows the provider to upload data to the desktop. The technology aims to serve many purposes, including to:
• Enable OEE to send client demographic and usage data for the targeted clients that can be easily used in the field to the providers,
• Allow providers to collect all of the information they need in the home and enter the data directly into the database,
• Allow providers to determine the source of electric usage and match the usage to historical usage data,
• Allow providers to calculate which measures are cost-effective (those with a savings to investment ratio [SIR] of one or greater) and how much the measures should save the client,
• Allow providers to promote possible actions should be taken and assign a probable savings to each action,
APPRISE Incorporated Page 13
www.appriseinc.org Electric Partnership Program
• Allow providers to invoice different funding sources, so that all measures can identified on cost-share jobs,
• Allow providers to send all data to OEE so that OEE can pay providers for services delivered, perform quality control, and send data to evaluators for analysis purposes.
Given the products available on the market, and the requirement for the ability to bill multiple funding sources, OEE decided to purchase the SMOC~ERS software, developed and used by SMOC, an agency in Massachusetts. While the South Middlesex Opportunity Council (SMOC) had previously implemented the software on laptops, OEE decided to use PDAs in the field because of their ease of use and their increased durability over the laptop. The PDA uses a cradle and transfer software to send the data collected in the field to the provider's desktop machine. These data are then sent to OEE each month on a disc. OEE uses the data to perform quality control, pay providers for clients served, and send data to evaluators.
During the last Program year, providers gradually transitioned from the PDA to a Tablet PC. The Tablet PC requires one less step when updating the SMOC~ERS software, is able to store information on a much larger number of clients, and is less prone to malfunction.
8. Material Procurement
OEE sent out an RFP for bulk procurement of refrigerators and freezers. Products acquired through this bid process were available to all providers.7 Additionally, providers were given the opportunity to bid to supply refrigerators and freezers. All refrigerators and freezers are required to be recycled in an environmentally sound manner. The point of the bulk procurement process is to reduce the costs for the provision and removal of refrigerators and to enable providers to arrange for refrigerator delivery and removal with one phone call.
Providers are responsible for procuring compact fluorescent light bulbs. Providers submitted prices for these bulbs and their installation as part of their response to the RFP for service providers.
Other measures that providers are responsible for procuring include showerheads, faucet aerators, water heater tank wraps, waterbed pads, building shell and mechanical measures, insulation measures, air sealing measures, and HVAC measures.
9. Landlord Contributions
Landlords are required to make a contribution in the form of a cash payment or in the form of an in-kind health and safety-related repair if necessary for conservation work that will improve or stay on the property to be performed. If appliances being replaced,
7 This method was primarily used in the first program year.
APPRISE Incorporated Page 14
www.appriseinc.org Electric Partnership Program
such as the refrigerator or the water tank, are owned by the landlord, the landlord is required to contribute 50 percent of the costs of the materials and labor.
D. Changes and Enhancements to the EPP in Fiscal Year 2005
Several changes have been made to improve the EPP in the fourth year of the Program. The Tablet PC has been implemented by all of the agencies, an EPP Brochure has been developed, OEE has sent outreach letters, SMOC~ERS has been updated to fix an error that allowed for non cost-effective CFL installations, monitoring standards have been set, and additional changes were made to SMOC~ERS. Each of these changes is described below.
1. Tablet PC
All of the agencies are now using the Tablet PC as a replacement for the PDA. There are many benefits to this switch.
• Auditors report that it is easier to use and can store information on a much larger number of jobs. This allows auditors to find replacements when they have a client who does not show up for an appointment.
• Auditors have not lost data, as they did with the PDA.
• Auditors can put the refrigerator cut sheets, the policies and procedures manual, and the client education notebook on the tablet.
• The movement to the Tablet PC eliminated the need for programming SMOC~ERS in a new language. This allows for much easier and less costly updates to the software.
2. EPP Brochure
A brochure was developed for the EPP and distributed to agencies in July 2004. Agencies can mail the brochure to potential clients.
3. EPP Letter
OEE sent out mass mailing letters to clients about the EPP in August and October 2004. In each mailing, 2,000 letters were sent to clients from six of the nine authorized providers. OEE received positive feedback that the letters motivated some clients to call the agency and raised awareness about the EPP in others.
APPRISE Incorporated Page 15

www.appriseinc.org Electric Partnership Program
4. Correction to CFL Installation Formula
OEE has revised the formula for light bulb replacements. This revision effectively limits light bulb replacements to those bulbs that are used approximately two hours or more per day. However, OEE will not limit the number of bulbs that can be installed in a home, as they do not want to eliminate cost-effective installations.
5. Monitoring
There are three monitors for the EPP and each monitor is now responsible for spending ten days on site at each of three authorized providers. Monitors are working to observe each auditor at least once per year. There were 99 units visited (observed or inspected) between July 1, 2004 and May 31, 2005. Monitoring forms have been loaded into the Tablet PC so that monitors can enter data while they are on site.
6. No Provider RFP
OEE did not issue a new RFP for providers for FY 2006. Instead, they exercised their option that was contained in the 2004 EPP RFP to extend the funding agreement for a year. This extended existing contracts until June 30, 2006. The purpose of this extension was to allow OEE to concentrate on responding to evaluation recommendations and improving the program, and to provide extra stability to the authorized providers that provide EPP services.
7. Additional SMOC~ERS Enhancements
Additional improvements were made to the SMOC~ERS software, and training was conducted in June 2005. Changes in this release included:
• Refrigerator 2-for-1 swap now includes the electric usage of both refrigerators in the cost-effectiveness calculation
• The refrigerator cost-effectiveness calculation adjusts correctly for ambient temperature
• Auditors can delete measures out of the weatherization module • Auditors no longer have to put the install date for every measure in the
weatherization module, as the date is entered automatically • Invoicing changes • Clients are listed in alphabetical order by last name instead of first name
8. Comprehensive Services Policies and Procedures
OEE developed policies and procedures for Comprehensive Services. HWDMC and COAD have begun to work on their plans for providing Comprehensive Services.
APPRISE Incorporated Page 16

www.appriseinc.org Electric Partnership Program
E. Program Changes for Fiscal Year 2006
Many Program changes are planned or are being considered for the following year, including additional training, changes to the RFP process, a low use pilot, upgrading to SMOC~ERS Version 3, and implementation of Comprehensive Services. These changes are described below.
1. Baseload 201 Training
OEE has developed a set of topics that they feel are necessary for advanced training. These topics include:
• Listening to clients • Continuing client conversations • Discussing action plans • Field measures • Fuel switching • Heating units, heat pumps, and air conditioners • Water measures • Custom bulbs
OEE hoped to provide this training during FY 2005, but was not able to do so. They are now working to provide this training in FY 2006.
2. Formal Price List
OEE is considering the use of a formal price list for the next provider RFP. This would provide all agencies with one price for the measures (with the probable exception of refrigerators). This may provide agencies with the incentive to obtain lower prices and an opportunity to obtain revenue from the program. This may also make it easier for OEE to bring on new agencies and expand the program, as it would streamline the provider application process.
3. Low Use Client Pilot
OEE hoped to introduce a low use client pilot to target PIPP clients with usage below 4,000 kWh annually in FY 2005, but did not did not determine a cost-effective means to do so. OEE will make a decision as to whether to offer this pilot in FY 2006.
4. SMOC~ERS Version 3
OEE needs to make a decision as to whether to move to SMOC~ERS Version 3. This version would integrate the appliance and weatherization audit, and would move to a web-based system. Such a system would provide OEE with real-time access to service
APPRISE Incorporated Page 17

www.appriseinc.org Electric Partnership Program
delivery data and would allow for easier invoicing. However, this move would involve training costs and additional software costs.
5. Implementation of Comprehensive Services
OEE will work with agencies to begin providing Comprehensive Services in FY 2006.
APPRISE Incorporated Page 18

www.appriseinc.org Evaluation Activities and Findings
III. Evaluation Activities and Findings
This section of the report describes the evaluation activities conducted during the fourth year of the EPP Process Evaluation, the findings from these evaluation activities, and recommendations for the EPP. During the fourth Program year, APPRISE conducted interviews with OEE staff responsible for the EPP, reviewed EPP production statistics, conducted interviews with recipients of EPP services, conducted an agency survey, and conducted light bulb research. Each of the activities, and related findings and recommendations, is described below.
A. Administrative Interviews
APPRISE conducted administrative interviews with OEE staff. While administrative interviews during the first Program year focused on Program design and initial implementation, interviews in the second, third, and fourth Program years focused more on Program operations.
1. Goals of the Evaluation Activity
The purpose of these interviews was to document the changes made to the Program and to document Program operations, including quality control findings. The goal was to provide accurate documentation of the evolution of the Program.
2. Design/Rationale
Interviews were conducted with OEE staff to obtain updates on Program implementation and Program changes.
3. Evaluation Findings
The administrative interviews provided information on changes being implemented in the Program, as well as findings from the monitoring visits.
a) Monitoring Staff Is Insufficient
Three monitors from OEE have been assigned to provide quality control for the EPP. These monitors have had other responsibilities related to the EPP and to the Home Weatherization Assistance Program (HWAP) and have not been able to devote all of their time to Program data review and monitoring. These monitors are now required to spend ten days at each of the nine authorized providers, an improvement over last year when there were no formal guidelines. However, there
APPRISE Incorporated Page 19

www.appriseinc.org Evaluation Activities and Findings
are no goals as to the number of observations or post-completion inspections, and only 99 homes were observed or inspected in the past year.8
b) Monitoring Forms Are Implemented on the Tablet PC
Monitors reported that they now enter data directly into the monitoring forms on the Tablet PC. They feel that this is an improvement to the monitoring process.
c) Metering of Appliances has Increased
Monitors report that more of the auditors are metering the appliances to determine the usage, rather than using the default value.
d) Education Component Is Still Weak
Monitors reported that the education component of the audit is still the weak point, but there was great variability between the findings of the monitors. Two reported improvements over last year. One monitor reported that most clients now describe an action they have taken to save electricity as a result of the visit.
• Explaining the Program: Monitors reported that 50, 75, and 80 percent of auditors explain the Program adequately.
• Establishing and confirming the partnership: Monitors reported that about
10, 30, and 55 percent of auditors are developing the partnership.
• Reviewing the clients’ bills: Monitors reported that 10, 60, and 95 percent of the auditors are reviewing the bills, but that most are not discussing the client’s arrearages.
• Explaining what will be done during the visit: Monitors reported that 50,
60, and 80 percent of the auditors explain what will happen during the visit.
• Asking the client what he/she thinks are the high users: Monitors reported that most of the auditors are not discussing this with the client.
• Adding actions to the action report and providing a copy of the report to the
client: Monitors reported that all auditors add actions to the report and provide a copy of the report to the client.
• Reviewing the reports with the client at the end of the visit: Monitors
reported that 45, 75, and 80 percent of the auditors review the reports with the client at the end of the visit. One monitor reported that the auditors do not print out the reports other than the actions report while in the client’s home.
8 Through the end of May 2005.
APPRISE Incorporated Page 20

www.appriseinc.org Evaluation Activities and Findings
• Education cards and notebook: Monitors reported that they have not seen
the auditors use the education cards. Monitors report that 20, 50, and 80 percent of the auditors use the education notebook.
e) Auditors Unlikely to Use Paper to Record Data
Most of the agencies are now using the Tablet PC. Monitors reported that there are only a few auditors at one of the agencies that still record usage data on paper before entering the data into SMOC~ERS.
f) Air Conditioning is the Major Use that is Not Addressed through Measures
Monitors reported that air conditioning is a major electric use that is not addressed through the EPP measures.
g) Infrequent, but Important Refrigerator Replacement Problem
A handful of clients have reported that their refrigerators have malfunctioned after the one-year warranty has expired. Low-income households cannot afford to pay for repair of these new appliances, and it is unacceptable for the program to leave these households in a worse off condition than before they were served. Furthermore, these problems can create an image problem for the EPP.
h) Education Follow-Up Visits Focus on Quality Control Rather than Education
OEE monitors and staff have the perception that agency follow-up concentrates on client satisfaction, rather than on providing additional education and reinforcement on electric usage reduction.
i) Custom Measures and Fuel Switches are Still Rare
The EPP is still predominantly a refrigerator and light bulb program. This is not surprising given the fee structure and incentives that are inherent in the program. Agencies receive an administrative fee that is meant to cover their costs for providing services and procuring refrigerators and other measures. However, agencies do not receive penalties for not providing custom measures, nor do they receive incentives to provide these measures.
4. Recommendations
Below are recommendations based on findings from the administrative interviews.
a) Additional Staff Time Allocated to Monitoring and On-Site Training
A total of 99 observations and post completion inspections were conducted by monitors in FY 2005.9 Additional observations and on-site training are needed to
9 Through the end of May, 2005.
APPRISE Incorporated Page 21

www.appriseinc.org Evaluation Activities and Findings
improve the quality of the audits and increase the potential savings from the Program.
b) Additional Education and Baseload Training
Findings from the on-site observations conducted by the monitors point to a need for additional education and baseload training. The Baseload 201 training should be a priority for next year.
c) Air Conditioning Measures Should be Investigated
OEE should re-examine the cost-effectiveness of replacing old window and/or wall air conditioners. This is a major electric use that is not currently addressed by program measures. Air conditioner prices have fallen in the past few years, and this measure may now be cost-effective.
d) Refrigerator Problem Should Be Addressed
OEE should develop a policy to deal with refrigerators that break down shortly after the warranty expires.
e) Develop Program Monitoring Reports
OEE should develop reports that can be generated from the SMOC~ERS database to monitor the progress of the program.
f) Instruct Agencies on Follow-up Education
The purpose of the follow-up education, to reinforce the actions discussed during the visit and provide additional guidance on reducing electric use, should be reinforced with the agencies.
g) Provide Incentives for Agencies to do Custom Measures
Agencies should either receive penalties for failing to install custom measures, or rewards for installing these measures. If OEE cannot or will not provide incentives or additional compensation for these measures, OEE should include a clause in the next contract that instructs agencies that their administrative fee will be reduced if they do not meet a target for the minimum percentage of jobs that receive custom measures.
B. Review of Program Statistics
The SMOC~ERS database contains detailed information on each job completed, including date completed, service delivery agency, utility service territory, and type of job. A review of these data provided important information as to Program accomplishments and the characteristics of the jobs that have been completed. A review of OEE financial data provided information on the level of grants provided to each service territory, and the extent to which those grants had been utilized.
APPRISE Incorporated Page 22
www.appriseinc.org Evaluation Activities and Findings
1. Goals of the Evaluation Activity
The purpose of this review was to understand how production has grown and stabilized since the introduction of the Program and how production is distributed between the different types of services and between the utility service territories.
2. Design/Rationale
Michael Blasnik provided summary statistics from the SMOC~ERS database for APPRISE to review and analyze. OEE provided grant and expenditure statistics by utility and agency to APPRISE.
3. Evaluation Findings
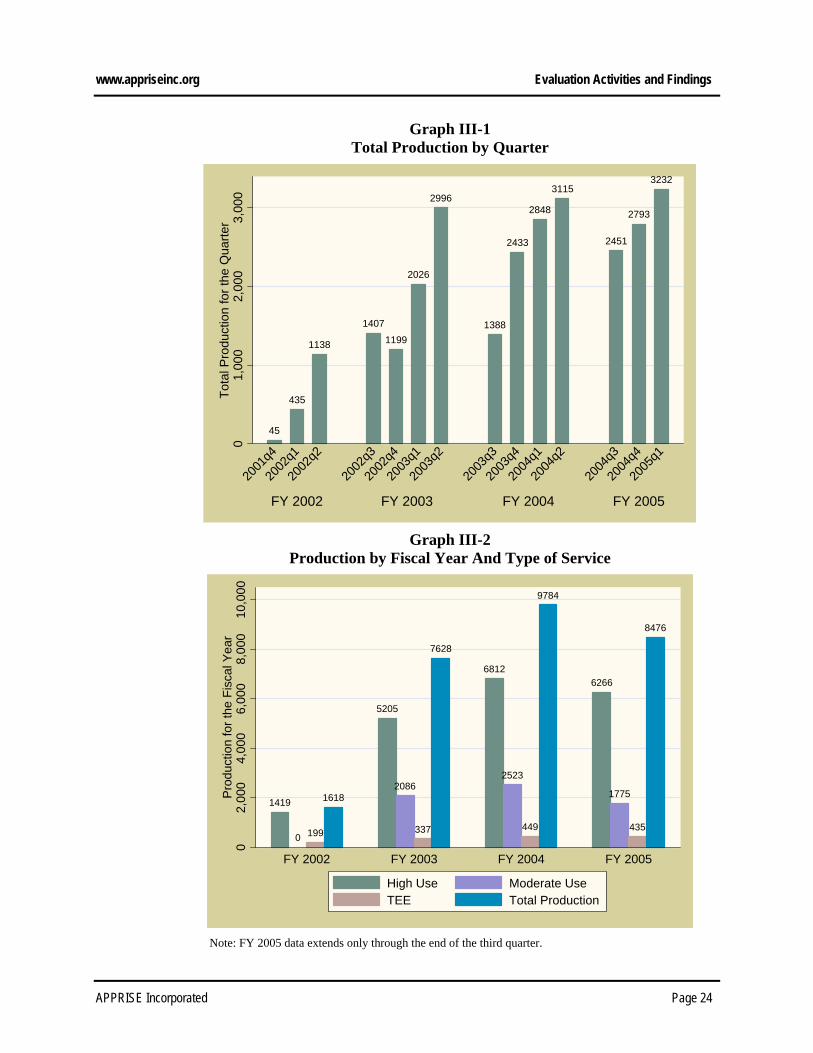
a) Total Production
EPP production has grown steadily as the Program matured. Graph III-1 displays production by quarter. There was a large decline at the beginning of the third fiscal year of the Program when the number of authorized providers declined from 18 to nine. However, production has since rebounded. Graph III-2 displays total production by fiscal year and type of service. Production in the first year of the Program was mainly high use, with a few TEE jobs. Production in the second, third, and fourth Program years was about three quarters high use, and most of the remainder was moderate use. Table III-1 displays production by quarter and type of service. A total of 27,506 jobs were completed from the start of the program through the end of the third quarter of FY 2005.
APPRISE Incorporated Page 23
www.appriseinc.org Evaluation Activities and Findings
Graph III-1 Total Production by Quarter
45
435
1138
1407
1199
2026
2996
1388
2433
2848
3115
2451
2793
3232
01,
000
2,00
03,
000
Tota
l Pro
duct
ion
for t
he Q
uarte
r
FY 2002 FY 2003 FY 2004 FY 2005
2001
q4
2002
q1
2002
q2
2002
q3
2002
q4
2003
q1
2003
q2
2003
q3
2003
q4
2004
q1
2004
q2
2004
q3
2004
q4
2005
q1
Graph III-2
Production by Fiscal Year And Type of Service
1419
0 199
1618
5205
2086
337
7628
6812
2523
449
9784
6266
1775
435
8476
02,
000
4,00
06,
000
8,00
010
,000
Pro
duct
ion
for t
he F
isca
l Yea
r
FY 2002 FY 2003 FY 2004 FY 2005
High Use Moderate UseTEE Total Production
Note: FY 2005 data extends only through the end of the third quarter.
APPRISE Incorporated Page 24

www.appriseinc.org Evaluation Activities and Findings
Table III-1 Production by Quarter and Type of Service
Program
Year Quarter High Use Moderate Use TEE Total Program
Year Total Q4 2001 45 0 0 45
Q1 2002 400 0 35 435 FY 2002
Q2 2002 974 0 164 1,138
1,618
Q3 2002 1,343 0 64 1,407
Q4 2002 1,138 0 61 1,199
Q1 2003 1,410 515 101 2,026 FY 2003
Q2 2003 1,314 1,571 111 2,996
7,628
Q3 2003 831 497 60 1,388
Q4 2003 1,704 589 140 2,433
Q1 2004 1,997 722 129 2,848 FY 2004
Q2 2004 2,280 715 120 3,115
9,784
Q3 2004 1,884 481 86 2,451
Q4 2004 2,027 570 196 2,793 FY 2005
Q1 2005 2,355 724 153 3,232
8,476
TOTAL 19,702 6,384 1,420 27,506
b) Production by Agencies
Table III-2 displays production by fiscal year, lead agency, and service type. This table shows that CHN, COAD, and HWDMC together have produced nearly 75 percent of the jobs completed in the EPP. The other largest producers were ACCAA, EANDC, and CMACAO. Over 75 percent of the TEE jobs were completed by COAD.
Table III-2 Production by Fiscal Year, Lead Agency, and Service Type
Lead
Agency Fiscal Year High Use Moderate
Use TEE Total Lead Agency Total
2002 90 0 46 136
2003 96 106 49 251
2004 305 100 9 414 ACCAA
2005 2 1 0 3
804
APPRISE Incorporated Page 25

www.appriseinc.org Evaluation Activities and Findings
Lead Agency
Fiscal Year High Use Moderate
Use TEE Total Lead Agency Total
2002 2 0 0 2
2003 84 19 0 103
2004 110 24 4 138 CAWM
2005 227 26 0 253
496
2002 10 0 0 10 CCDD
2003 17 0 0 17 27
2002 17 0 0 17 CHCCAA
2003 196 1 2 199 216
2002 236 0 13 249
2003 1,193 889 2 2,084
2004 1,119 882 0 2,001 CHN
2005 1,435 623 1 2,059
6,393
2002 347 0 53 400 CMACAO
2003 437 84 40 561 961
2002 12 0 84 96
2003 1,129 63 236 1,428
2004 1,572 46 390 2,008 COAD
2005 1,093 36 358 1,487
5,019
2002 64 0 0 64
2003 254 146 0 400
2004 584 329 0 913 EANDC
2005 13 3 0 16
1,393
HHWP 2003 53 18 0 71 71
2002 522 0 0 522
2003 913 491 0 1,404
2004 2,684 942 43 3,669 HWDMC
2005 2,337 624 72 3,033
8,628
2002 38 0 0 38 MORPC
2003 256 50 0 306 344
NCSB 2005 431 167 0 598 592
2002 3 0 0 3 NHST
2003 67 45 0 112 115
APPRISE Incorporated Page 26
www.appriseinc.org Evaluation Activities and Findings
Lead Agency
Fiscal Year High Use Moderate
Use TEE Total Lead Agency Total
2002 45 0 0 45
2003 131 73 0 204
2004 105 40 0 145 OHCAC
2005 126 34 1 161
555
2002 2 0 0 2
2003 37 51 1 89
2004 92 56 3 151 PORT
2005 80 30 2 112
354
PWC 2005 296 71 1 368 368
2002 1 0 0 1
2003 94 0 0 94 SCOPE
2004 190 47 0 237
332
2002 10 0 0 10 SOURCE
2003 5 0 0 5 15
2002 20 0 3 23 WSOS
2003 43 50 7 100 123
2003 200 0 0 200
2004 51 57 0 108 YACAC
2005 225 160 0 385
693
TOTAL 19,702 6,384 1,420 27,506
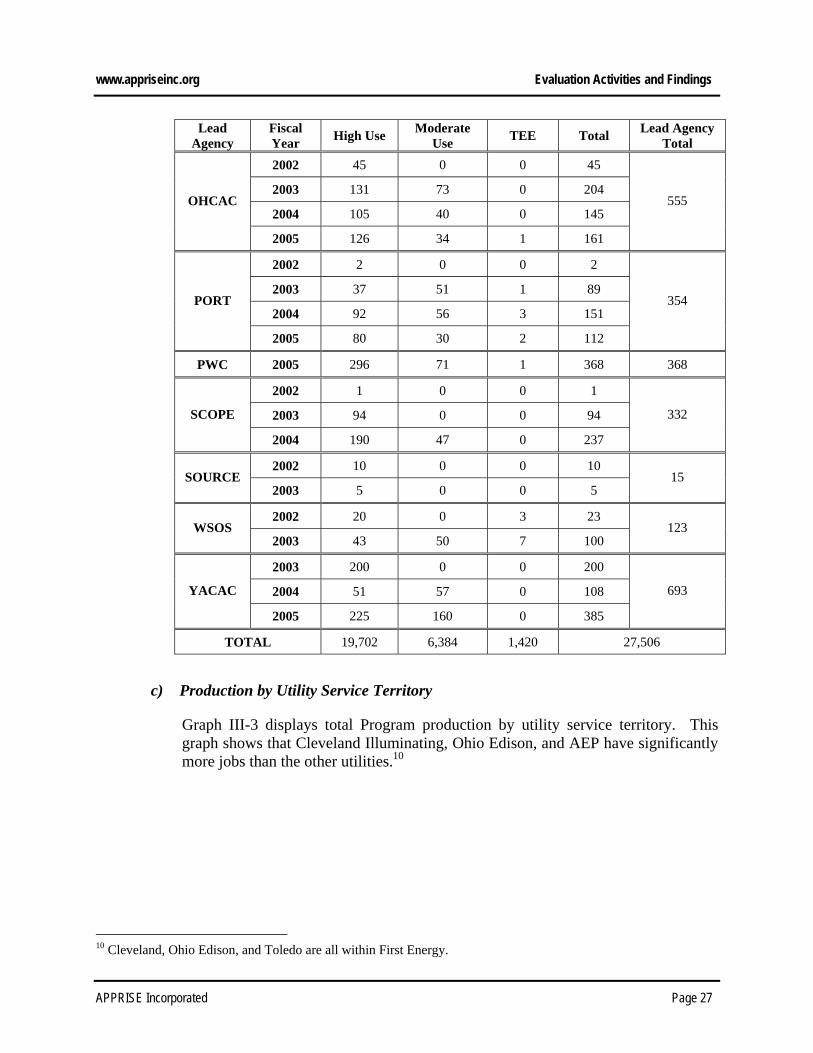
c) Production by Utility Service Territory
Graph III-3 displays total Program production by utility service territory. This graph shows that Cleveland Illuminating, Ohio Edison, and AEP have significantly more jobs than the other utilities.10
10 Cleveland, Ohio Edison, and Toledo are all within First Energy.
APPRISE Incorporated Page 27
www.appriseinc.org Evaluation Activities and Findings
Graph III-3 Total Program Production By Utility Service Territory
9643
73
1151
6590
1329
7815
1191
02,
000
4,00
06,
000
8,00
010
,000
Tota
l Pro
duct
ion
AEP Allegheny Cinergy Cleveland DP&L OH Edison Toledo
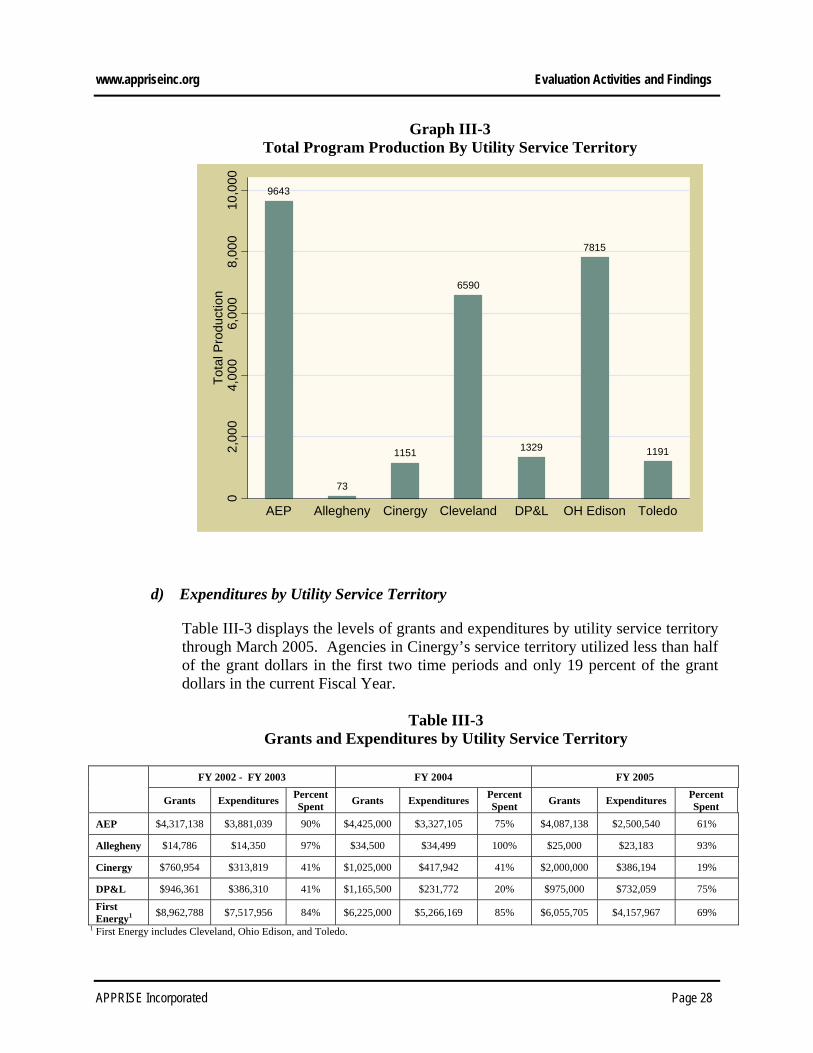
d) Expenditures by Utility Service Territory
Table III-3 displays the levels of grants and expenditures by utility service territory through March 2005. Agencies in Cinergy’s service territory utilized less than half of the grant dollars in the first two time periods and only 19 percent of the grant dollars in the current Fiscal Year.
Table III-3 Grants and Expenditures by Utility Service Territory
FY 2002 - FY 2003 FY 2004 FY 2005
Grants Expenditures Percent
Spent Grants Expenditures Percent Spent Grants Expenditures Percent
Spent AEP $4,317,138 $3,881,039 90% $4,425,000 $3,327,105 75% $4,087,138 $2,500,540 61%
Allegheny $14,786 $14,350 97% $34,500 $34,499 100% $25,000 $23,183 93%
Cinergy $760,954 $313,819 41% $1,025,000 $417,942 41% $2,000,000 $386,194 19%
DP&L $946,361 $386,310 41% $1,165,500 $231,772 20% $975,000 $732,059 75%
First Energy1 $8,962,788 $7,517,956 84% $6,225,000 $5,266,169 85% $6,055,705 $4,157,967 69%
1 First Energy includes Cleveland, Ohio Edison, and Toledo.
APPRISE Incorporated Page 28

www.appriseinc.org Evaluation Activities and Findings
4. Recommendations
The analyses above showed that Cinergy continues to utilize a small percentage of the funding that is available. OEE should work with the agencies in this service territory to ramp up production. If necessary, additional providers should be recruited in this area.
C. Client Interviews
APPRISE conducted the first round of the client interviews in Spring 2003. The second and third rounds of the client survey were completed in Fall 2003 and Spring 2004. The fourth and fifth rounds were completed in Fall 2004 and Winter 2005. In each round of the survey, Program recipients were interviewed about EPP services received, changes in electric uses, and satisfaction with the Program.11
1. Goals of the Evaluation Activity
The purpose of these interviews was to document education provided to clients, client retention of educational information, changes in client behavior, and client satisfaction with the Program.
2. Design/Rationale
The five rounds of the survey were planned to measure changes in Program implementation over the first few years of the EPP.
• Round 1 – Spring 2003: This survey documented services provided July 2002 through December 2002. 129 clients were interviewed.
• Round 2 – Fall 2003: This survey documented services provided January 2003 through June 2003. 149 clients were interviewed.
• Round 3 – Spring 2004: This survey documented services provided July 2003 through December 2003. 159 clients were interviewed.
• Round 4 – Fall 2004: This survey documented services provided January 2004 through June 2004. 143 clients were interviewed.
• Round 5 – Spring 2004: This survey documented services provided July 2004 through September 2004.12 144 clients were interviewed.
These five rounds of the survey allowed for a total sample size of 724 clients, large enough to analyze results by subgroups, including utility area and for large providers.
11 For more details on the client survey, see “Ohio EPP Client Survey – Round 5”. 12 Clients served between October and December 2004 were not included in this round, as data for these clients were not available at the time of the survey.
APPRISE Incorporated Page 29
www.appriseinc.org Evaluation Activities and Findings
The time-series nature of the survey allows for an analysis of how the Program evolved over time.
3. Evaluation Findings
This section provides findings from all rounds of the client survey. It also provides an analysis of how findings differ by provider and utility service territory.
a) Survey Respondents Profile
Households who received services under the EPP Program between July 2002 and September 2004 were likely to have vulnerable members. Nearly half of households are all elderly, all disabled, or single-parent households.
• Other programs and services: Most of the clients reported that they had not received other programs or services aimed to improve their homes.
• Income: Respondents were asked for the range of their annual household
income. Over the five rounds of the survey, 42 percent of all clients had an annual income of $10,000 or less, 34 percent of clients had an annual income between $10,001 and $20,000, and 14 percent of clients had an annual income of $20,001 or more.
• Type of Income: Clients served by CHN were less likely than clients served by
other lead agencies to receive employment income and respondents from EANDC were more likely than those from other agencies to report that they received employment income.
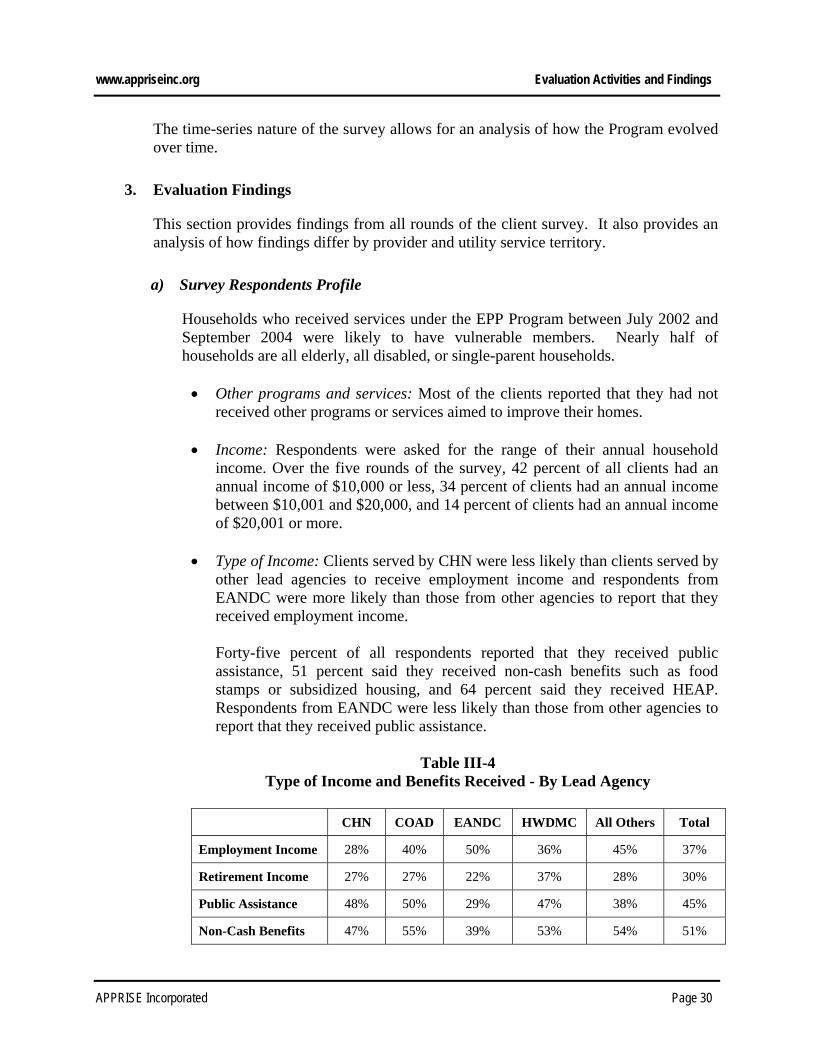
Forty-five percent of all respondents reported that they received public assistance, 51 percent said they received non-cash benefits such as food stamps or subsidized housing, and 64 percent said they received HEAP. Respondents from EANDC were less likely than those from other agencies to report that they received public assistance.
Table III-4
Type of Income and Benefits Received - By Lead Agency
CHN COAD EANDC HWDMC All Others Total
Employment Income 28% 40% 50% 36% 45% 37%
Retirement Income 27% 27% 22% 37% 28% 30%
Public Assistance 48% 50% 29% 47% 38% 45%
Non-Cash Benefits 47% 55% 39% 53% 54% 51%
APPRISE Incorporated Page 30

www.appriseinc.org Evaluation Activities and Findings
CHN COAD EANDC HWDMC All Others Total
HEAP 65% 65% 69% 64% 60% 64%
b) Understanding of the Program
Clients reported that they have a good understanding of the EPP. Eighty-eight percent of Cohort Five respondents reported that they understand the Program, and 87 percent reported that they feel like a partner in the Program.
Table III-5 Understanding of the Program
Cohort Five Cohort Four Cohort Three Cohort Two Cohort One
Understand the EPP 88% 93% 84% 87% 90%
Feel like a partner in the Program 87% 88% 75% 73%
Understand partnership nature of the Program 72%
Clients were asked, “What is your understanding of the service provider’s responsibility as a partner in this Program?” Overall, 52 percent of all clients surveyed reported that the service provider’s responsibility is to reduce energy use or bills. Clients served by EANDC were more likely than those served by other lead agencies to say that the service provider’s responsibility is to reduce energy use or bills.
Table III-6
Service Provider’s Responsibility
CHN COAD EANDC HWDMC All Others Total Reduce energy use or bills 52% 45% 62% 54% 53% 52%
Unrelated to reducing energy use or bills
48% 55% 38% 47% 47% 48%
Clients were asked, “What is your understanding of your responsibility as a partner in this Program?” Fifty-four percent of Cohort Five clients reported that their responsibility is to reduce energy use or follow provider recommendations.
APPRISE Incorporated Page 31

www.appriseinc.org Evaluation Activities and Findings
Table III-7 Client’s Responsibility
Cohort
Five Cohort Four
Cohort Three
Cohort Two
Cohort One
Reduce energy use/ Follow recommendations 54% 55% 39% 55% 40%
Unrelated to reducing energy usage 46% 45% 61% 45% 60%
Table III-8 displays answers to the question “What do you feel are the benefits of participating in the Program?” Answers total to more than 100 percent, as respondents could provide more than one answer to the question. Fifty-six percent of clients said that the benefits of participation in the Program are to reduce energy use or bills and to save money, 15 percent said the benefit is to receive education, 12 percent said the benefit is to receive a new refrigerator or freezer, and 12 percent said the benefit is to receive services or products other than refrigerators or freezers. A greater percentage of clients in Cohort Five than in the four previous cohorts said that the benefit is to receive education.
Table III-8 Benefits of Participation in the EPP
Cohort
Five Cohort Four
Cohort Three
Cohort Two
Cohort One
Reduce energy use or bills/Save money 56% 64% 65% 67% 63%
Receive education 15% 5% 8% 9% 11%
Receive new refrigerator/freezer 12% 18% 14% 25% 16%
Receive services/products (other than refrigerator and freezer) 12% 16% 13% 17% 14%
Receive help/assistance 9% 6% 5% 7% 11%
Make home safer/more comfortable 1% 3% 3% 2% 7%
Can recommend program to others 0% 0% 0% 1% 0%
Other 0% 2% 3% 1% 0%
Don’t know 8% 11% 5% 6% 8%
Not answered on mail survey 5% 0% 2% 0%
APPRISE Incorporated Page 32
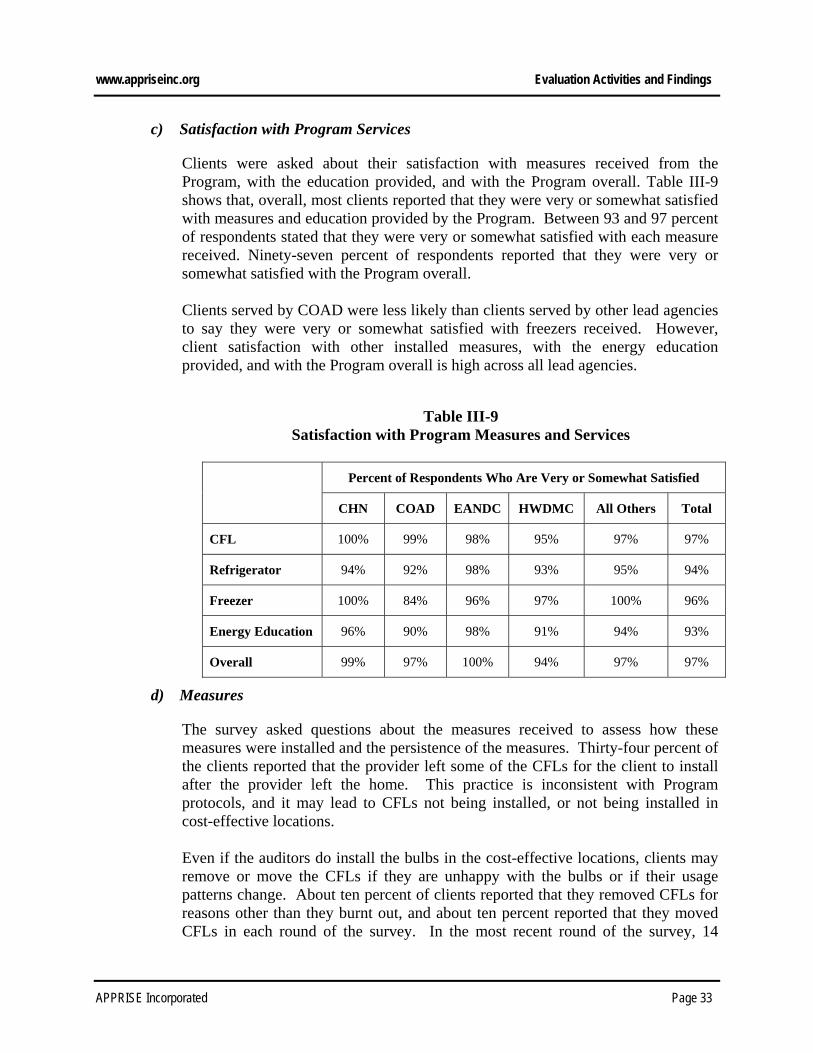
www.appriseinc.org Evaluation Activities and Findings
c) Satisfaction with Program Services
Clients were asked about their satisfaction with measures received from the Program, with the education provided, and with the Program overall. Table III-9 shows that, overall, most clients reported that they were very or somewhat satisfied with measures and education provided by the Program. Between 93 and 97 percent of respondents stated that they were very or somewhat satisfied with each measure received. Ninety-seven percent of respondents reported that they were very or somewhat satisfied with the Program overall. Clients served by COAD were less likely than clients served by other lead agencies to say they were very or somewhat satisfied with freezers received. However, client satisfaction with other installed measures, with the energy education provided, and with the Program overall is high across all lead agencies.
Table III-9 Satisfaction with Program Measures and Services
Percent of Respondents Who Are Very or Somewhat Satisfied
CHN COAD EANDC HWDMC All Others Total
CFL 100% 99% 98% 95% 97% 97%
Refrigerator 94% 92% 98% 93% 95% 94%
Freezer 100% 84% 96% 97% 100% 96%
Energy Education 96% 90% 98% 91% 94% 93%
Overall 99% 97% 100% 94% 97% 97%
d) Measures
The survey asked questions about the measures received to assess how these measures were installed and the persistence of the measures. Thirty-four percent of the clients reported that the provider left some of the CFLs for the client to install after the provider left the home. This practice is inconsistent with Program protocols, and it may lead to CFLs not being installed, or not being installed in cost-effective locations. Even if the auditors do install the bulbs in the cost-effective locations, clients may remove or move the CFLs if they are unhappy with the bulbs or if their usage patterns change. About ten percent of clients reported that they removed CFLs for reasons other than they burnt out, and about ten percent reported that they moved CFLs in each round of the survey. In the most recent round of the survey, 14
APPRISE Incorporated Page 33

www.appriseinc.org Evaluation Activities and Findings
percent of clients reported that they moved CFLs. Clients were most likely to remove CFLs because they were not bright enough. This points to the importance of the auditor installing all bulbs and discussing the room’s illumination with the client. Respondents were asked how many CFLs had burnt out. Table III-10 shows that 15 percent of respondents reported that one light bulb burnt out. The maximum reported number of bulbs that burnt out was 10. Overall, six percent of all the bulbs received were reported to have burnt out. This compares to six percent in Cohort Four, two percent in Cohort Three, one percent in Cohort Two, and seven percent in Cohort One.
Table III-10 Number of CFLs Burned Out
Cohort
Five Cohort Four
Cohort Three
Cohort Two
Cohort One
1 15% 18% 16% 11% 14%
2 3% 11% 8% 2% 9%
3 3% 6% 4% 2% 2%
4 2% 2% 4% 2% 2%
5 or more 4% 1% 4% 0% 5%
Not asked 73% 62% 64% 69% 69%
Overall percent of CFLs burned out 6% 6% 2% 1% 7%
Table III-11 displays the number of bulbs that burned out by lead agency over all five rounds of the client survey. This table shows that overall, four percent of all the bulbs received were reported to have burnt out. This percentage was fairly consistent across the lead agencies.
Table III-11 Percent of CFLs Burned Out
CHN COAD EANDC HWDMC All Others Total
1 10% 22% 24% 15% 10% 15%
2 7% 7% 8% 8% 4% 7%
3 3% 5% 12% 3% 3% 4%
4 4% 2% 2% 2% 1% 2%
APPRISE Incorporated Page 34
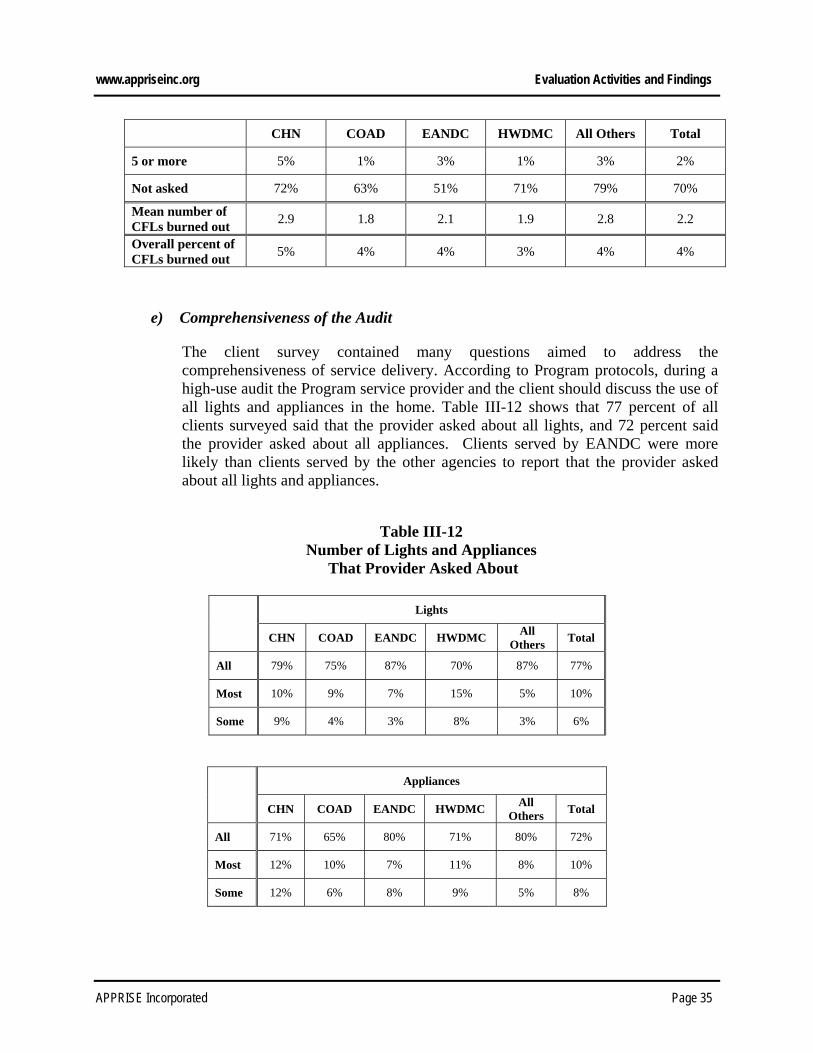
www.appriseinc.org Evaluation Activities and Findings
CHN COAD EANDC HWDMC All Others Total
5 or more 5% 1% 3% 1% 3% 2%
Not asked 72% 63% 51% 71% 79% 70%
Mean number of CFLs burned out 2.9 1.8 2.1 1.9 2.8 2.2
Overall percent of CFLs burned out 5% 4% 4% 3% 4% 4%
e) Comprehensiveness of the Audit
The client survey contained many questions aimed to address the comprehensiveness of service delivery. According to Program protocols, during a high-use audit the Program service provider and the client should discuss the use of all lights and appliances in the home. Table III-12 shows that 77 percent of all clients surveyed said that the provider asked about all lights, and 72 percent said the provider asked about all appliances. Clients served by EANDC were more likely than clients served by the other agencies to report that the provider asked about all lights and appliances.
Table III-12 Number of Lights and Appliances
That Provider Asked About
Lights
CHN COAD EANDC HWDMC All Others Total
All 79% 75% 87% 70% 87% 77%
Most 10% 9% 7% 15% 5% 10%
Some 9% 4% 3% 8% 3% 6%
Appliances
CHN COAD EANDC HWDMC All Others Total
All 71% 65% 80% 71% 80% 72%
Most 12% 10% 7% 11% 8% 10%
Some 12% 6% 8% 9% 5% 8%
APPRISE Incorporated Page 35
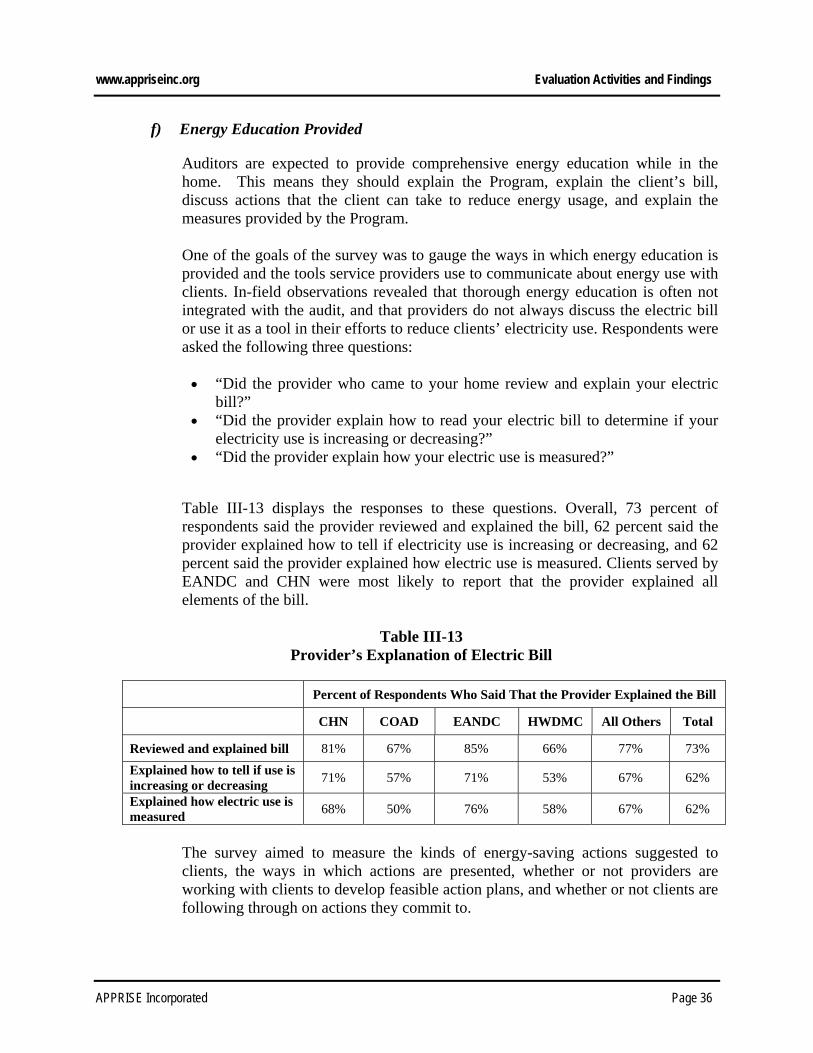
www.appriseinc.org Evaluation Activities and Findings
f) Energy Education Provided
Auditors are expected to provide comprehensive energy education while in the home. This means they should explain the Program, explain the client’s bill, discuss actions that the client can take to reduce energy usage, and explain the measures provided by the Program. One of the goals of the survey was to gauge the ways in which energy education is provided and the tools service providers use to communicate about energy use with clients. In-field observations revealed that thorough energy education is often not integrated with the audit, and that providers do not always discuss the electric bill or use it as a tool in their efforts to reduce clients’ electricity use. Respondents were asked the following three questions:
• “Did the provider who came to your home review and explain your electric bill?”
• “Did the provider explain how to read your electric bill to determine if your electricity use is increasing or decreasing?”
• “Did the provider explain how your electric use is measured?”
Table III-13 displays the responses to these questions. Overall, 73 percent of respondents said the provider reviewed and explained the bill, 62 percent said the provider explained how to tell if electricity use is increasing or decreasing, and 62 percent said the provider explained how electric use is measured. Clients served by EANDC and CHN were most likely to report that the provider explained all elements of the bill.
Table III-13 Provider’s Explanation of Electric Bill
Percent of Respondents Who Said That the Provider Explained the Bill
CHN COAD EANDC HWDMC All Others Total
Reviewed and explained bill 81% 67% 85% 66% 77% 73%Explained how to tell if use is increasing or decreasing 71% 57% 71% 53% 67% 62%
Explained how electric use is measured 68% 50% 76% 58% 67% 62%
The survey aimed to measure the kinds of energy-saving actions suggested to clients, the ways in which actions are presented, whether or not providers are working with clients to develop feasible action plans, and whether or not clients are following through on actions they commit to.
APPRISE Incorporated Page 36
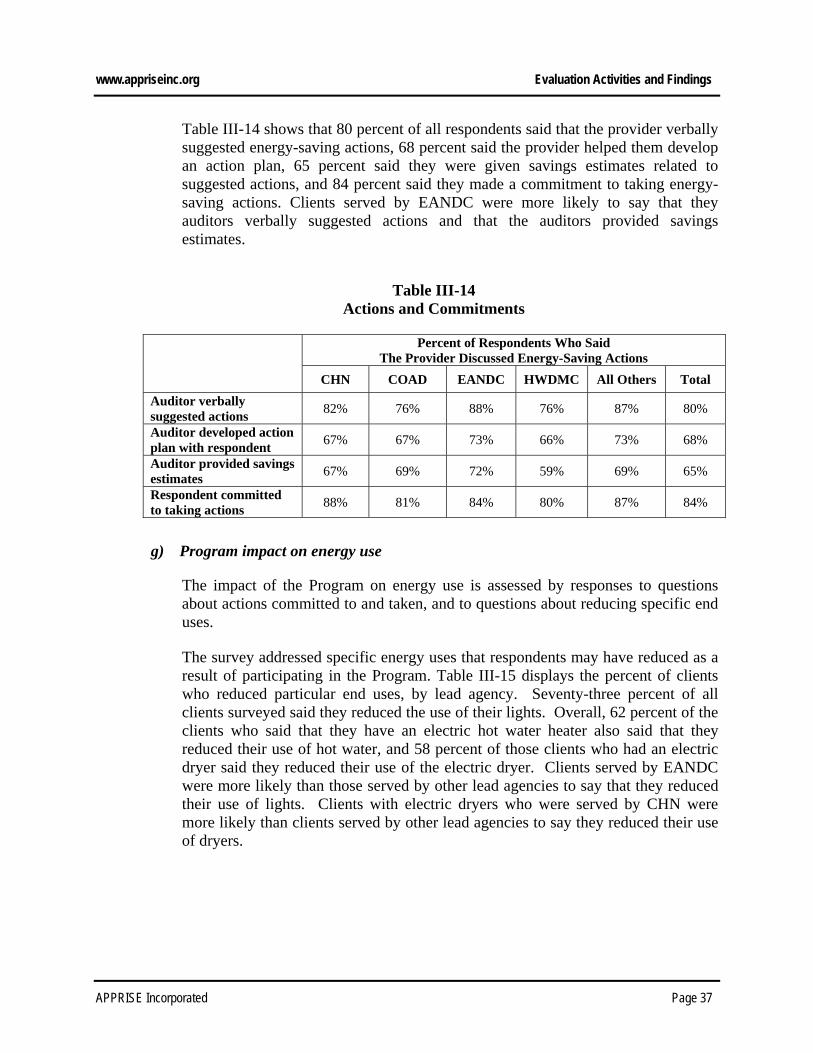
www.appriseinc.org Evaluation Activities and Findings
Table III-14 shows that 80 percent of all respondents said that the provider verbally suggested energy-saving actions, 68 percent said the provider helped them develop an action plan, 65 percent said they were given savings estimates related to suggested actions, and 84 percent said they made a commitment to taking energy-saving actions. Clients served by EANDC were more likely to say that they auditors verbally suggested actions and that the auditors provided savings estimates.
Table III-14 Actions and Commitments
Percent of Respondents Who Said
The Provider Discussed Energy-Saving Actions CHN COAD EANDC HWDMC All Others Total
Auditor verbally suggested actions 82% 76% 88% 76% 87% 80%
Auditor developed action plan with respondent 67% 67% 73% 66% 73% 68%
Auditor provided savings estimates 67% 69% 72% 59% 69% 65%
Respondent committed to taking actions 88% 81% 84% 80% 87% 84%
g) Program impact on energy use
The impact of the Program on energy use is assessed by responses to questions about actions committed to and taken, and to questions about reducing specific end uses.
The survey addressed specific energy uses that respondents may have reduced as a result of participating in the Program. Table III-15 displays the percent of clients who reduced particular end uses, by lead agency. Seventy-three percent of all clients surveyed said they reduced the use of their lights. Overall, 62 percent of the clients who said that they have an electric hot water heater also said that they reduced their use of hot water, and 58 percent of those clients who had an electric dryer said they reduced their use of the electric dryer. Clients served by EANDC were more likely than those served by other lead agencies to say that they reduced their use of lights. Clients with electric dryers who were served by CHN were more likely than clients served by other lead agencies to say they reduced their use of dryers.
APPRISE Incorporated Page 37
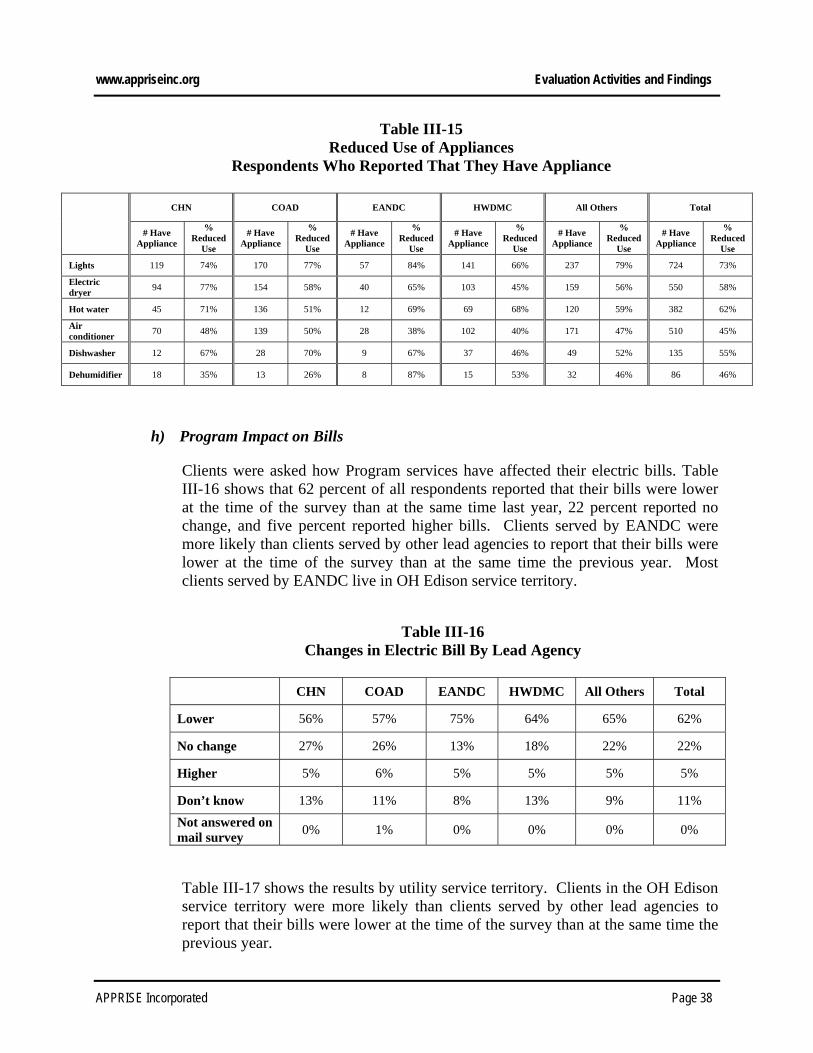
www.appriseinc.org Evaluation Activities and Findings
Table III-15 Reduced Use of Appliances
Respondents Who Reported That They Have Appliance
CHN COAD EANDC HWDMC All Others Total
# Have
Appliance
% Reduced
Use
# Have Appliance
% Reduced
Use
# Have Appliance
% Reduced
Use
# Have Appliance
% Reduced
Use
# Have Appliance
% Reduced
Use
# Have Appliance
% Reduced
Use
Lights 119 74% 170 77% 57 84% 141 66% 237 79% 724 73%
Electric dryer 94 77% 154 58% 40 65% 103 45% 159 56% 550 58%
Hot water 45 71% 136 51% 12 69% 69 68% 120 59% 382 62%
Air conditioner 70 48% 139 50% 28 38% 102 40% 171 47% 510 45%
Dishwasher 12 67% 28 70% 9 67% 37 46% 49 52% 135 55%
Dehumidifier 18 35% 13 26% 8 87% 15 53% 32 46% 86 46%
h) Program Impact on Bills
Clients were asked how Program services have affected their electric bills. Table III-16 shows that 62 percent of all respondents reported that their bills were lower at the time of the survey than at the same time last year, 22 percent reported no change, and five percent reported higher bills. Clients served by EANDC were more likely than clients served by other lead agencies to report that their bills were lower at the time of the survey than at the same time the previous year. Most clients served by EANDC live in OH Edison service territory.
Table III-16 Changes in Electric Bill By Lead Agency
CHN COAD EANDC HWDMC All Others Total
Lower 56% 57% 75% 64% 65% 62%
No change 27% 26% 13% 18% 22% 22%
Higher 5% 6% 5% 5% 5% 5%
Don’t know 13% 11% 8% 13% 9% 11% Not answered on mail survey 0% 1% 0% 0% 0% 0%
Table III-17 shows the results by utility service territory. Clients in the OH Edison service territory were more likely than clients served by other lead agencies to report that their bills were lower at the time of the survey than at the same time the previous year.
APPRISE Incorporated Page 38

www.appriseinc.org Evaluation Activities and Findings
Table III-17 Changes in Electric Bill By Utility Service Territory
AEP Cleveland OH Edison All Others Total
Lower 59% 55% 71% 59% 62%
No change 25% 25% 15% 22% 22%
Higher 4% 6% 5% 10% 5%
Don’t know 12% 14% 10% 10% 11% Not answered on mail survey 1% 0% 0% 0% 0%
i) PDA and SMOC~ERS Reports
Observations in the field and interviews with providers revealed that many auditors were not using the PDA and reports as specified by Program protocols. The survey included many questions that addressed the use of these tools. Respondents were asked if they received SMOC~ERS reports listing their usage by appliance, their top-ten electric uses, and an action plan. Table III-18 displays the responses to these questions. Sixty-nine percent of all clients surveyed said they received a report showing their usage by appliance, 66 percent said they received a report showing their top-ten electric uses, and 67 percent said they received an action plan. Clients served by EANDC were more likely than those served by other agencies to say they received reports with usage by appliance and action plans.
Table III-18
SMOC~ERS Reports Provided to the Client
Percent of Respondents who Reported That They Received SMOC~ERS Reports
CHN COAD EANDC HWDMC All Others Total
Usage by appliance 69% 70% 78% 63% 76% 69%
Top-ten electric uses 69% 61% 68% 62% 76% 66%
Action plan 65% 61% 82% 64% 74% 67%
Table III-19 shows the percentage of clients who reported that they received each report by type of service. This table shows that the percentage of moderate use
APPRISE Incorporated Page 39
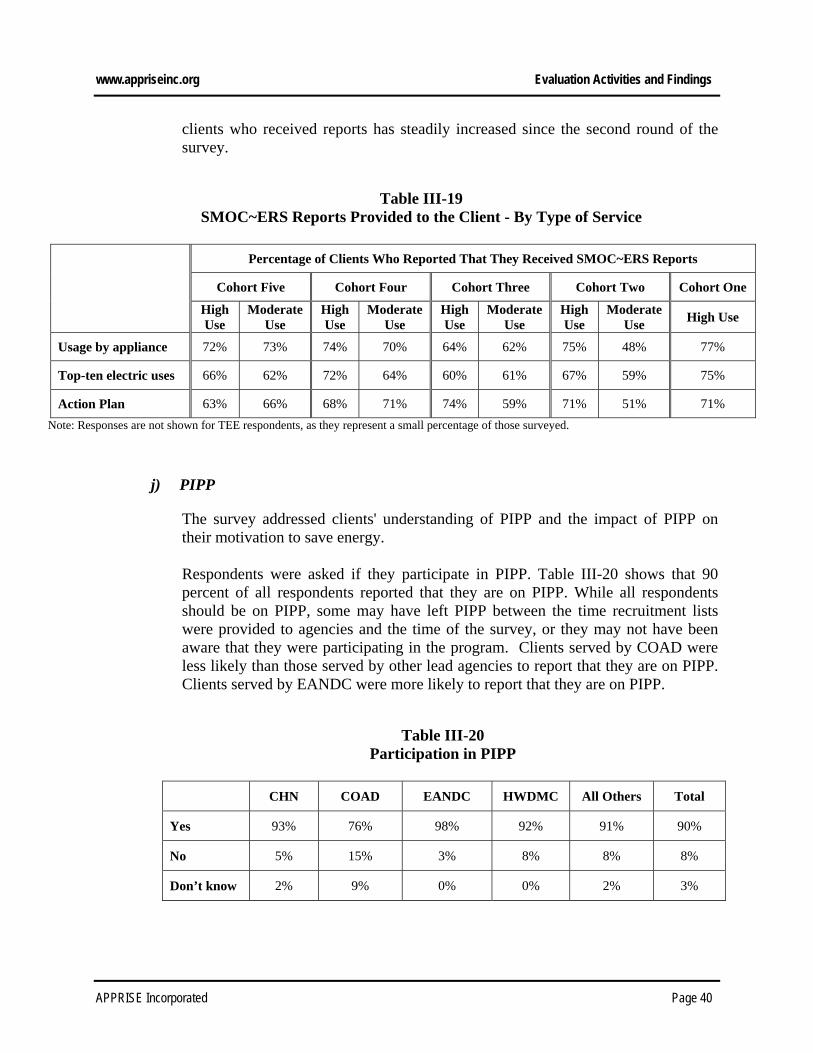
www.appriseinc.org Evaluation Activities and Findings
clients who received reports has steadily increased since the second round of the survey.
Table III-19 SMOC~ERS Reports Provided to the Client - By Type of Service
Percentage of Clients Who Reported That They Received SMOC~ERS Reports
Cohort Five Cohort Four Cohort Three Cohort Two Cohort One High Use
Moderate Use
High Use
Moderate Use
High Use
Moderate Use
High Use
Moderate Use High Use
Usage by appliance 72% 73% 74% 70% 64% 62% 75% 48% 77%
Top-ten electric uses 66% 62% 72% 64% 60% 61% 67% 59% 75%
Action Plan 63% 66% 68% 71% 74% 59% 71% 51% 71% Note: Responses are not shown for TEE respondents, as they represent a small percentage of those surveyed.
j) PIPP
The survey addressed clients' understanding of PIPP and the impact of PIPP on their motivation to save energy. Respondents were asked if they participate in PIPP. Table III-20 shows that 90 percent of all respondents reported that they are on PIPP. While all respondents should be on PIPP, some may have left PIPP between the time recruitment lists were provided to agencies and the time of the survey, or they may not have been aware that they were participating in the program. Clients served by COAD were less likely than those served by other lead agencies to report that they are on PIPP. Clients served by EANDC were more likely to report that they are on PIPP.
Table III-20 Participation in PIPP
CHN COAD EANDC HWDMC All Others Total
Yes 93% 76% 98% 92% 91% 90%
No 5% 15% 3% 8% 8% 8%
Don’t know 2% 9% 0% 0% 2% 3%
APPRISE Incorporated Page 40

www.appriseinc.org Evaluation Activities and Findings
PIPP participants were asked about their participation in the Program. Most respondents reported that they had been on PIPP for three years or more. Respondents were asked how much they owed the electric company when they started on PIPP and how much they owed at the time of the survey. Table III-21 displays the responses to these questions. Overall, 22 percent reported that they owed more than $500 when starting on PIPP, and 48 percent reported that at the time of the survey they owed more than $500. Clients in AEP service territory were less likely than those in other utility service territories to report that at the time of the survey they owed more than $500.
Table III-21 Initial and Current Arrearages
Arrearages When Started on PIPP Current Level of Arrearages
AEP Cleveland OH
Edison All
Others Total AEP Cleveland OH Edison
All Others Total
$0 12% 9% 15% 11% 12% 4% 3% 3% 2% 3%
$1 - $100 5% 4% 6% 8% 5% 12% 10% 4% 2% 8%
$101 - $500 17% 19% 14% 18% 17% 15% 10% 16% 13% 14%
$501 - $1000 6% 8% 8% 12% 8% 9% 14% 12% 11% 12%
$1001 - $2000 6% 8% 8% 12% 8% 14% 17% 18% 25% 18%
> $2000 3% 9% 6% 6% 6% 12% 25% 21% 16% 18%
Don’t know 35% 32% 40% 21% 34% 16% 15% 21% 18% 18%
Not answered on mail survey 1% 0% 0% 0% 0% 0% 0% 0% 0% 0%
Not asked 18% 8% 5% 13% 11% 18% 8% 5% 13% 11%
Except during the summer, PIPP clients’ electric bills are based on their income rather than on their actual usage. The survey aimed to measure clients’ motivation to reduce electricity usage while on PIPP, even though their bills for most of the year are not dependent on their usage. Clients were asked if there were any benefits of reducing their usage while on PIPP. Sixty-five percent said that there are benefits to reducing usage. Respondents were asked specifically if reducing their usage would help reduce their summer electric bills or help prevent them from owing more money to the electric company. Table III-22 shows that 74 percent of all clients surveyed reported that reducing usage would help reduce summer electric bills, and 77 percent reported that reducing usage would help prevent them from owing more
APPRISE Incorporated Page 41
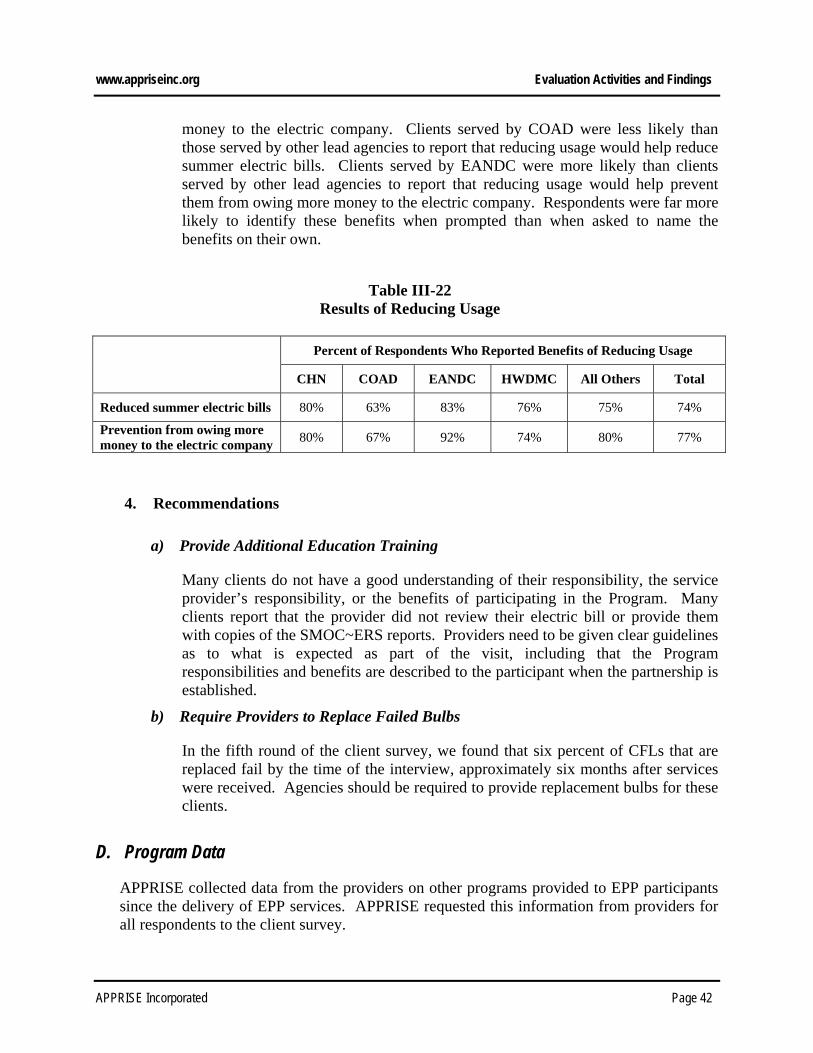
www.appriseinc.org Evaluation Activities and Findings
money to the electric company. Clients served by COAD were less likely than those served by other lead agencies to report that reducing usage would help reduce summer electric bills. Clients served by EANDC were more likely than clients served by other lead agencies to report that reducing usage would help prevent them from owing more money to the electric company. Respondents were far more likely to identify these benefits when prompted than when asked to name the benefits on their own.
Table III-22 Results of Reducing Usage
Percent of Respondents Who Reported Benefits of Reducing Usage
CHN COAD EANDC HWDMC All Others Total
Reduced summer electric bills 80% 63% 83% 76% 75% 74%
Prevention from owing more money to the electric company 80% 67% 92% 74% 80% 77%
4. Recommendations
a) Provide Additional Education Training
Many clients do not have a good understanding of their responsibility, the service provider’s responsibility, or the benefits of participating in the Program. Many clients report that the provider did not review their electric bill or provide them with copies of the SMOC~ERS reports. Providers need to be given clear guidelines as to what is expected as part of the visit, including that the Program responsibilities and benefits are described to the participant when the partnership is established.
b) Require Providers to Replace Failed Bulbs
In the fifth round of the client survey, we found that six percent of CFLs that are replaced fail by the time of the interview, approximately six months after services were received. Agencies should be required to provide replacement bulbs for these clients.
D. Program Data
APPRISE collected data from the providers on other programs provided to EPP participants since the delivery of EPP services. APPRISE requested this information from providers for all respondents to the client survey.
APPRISE Incorporated Page 42
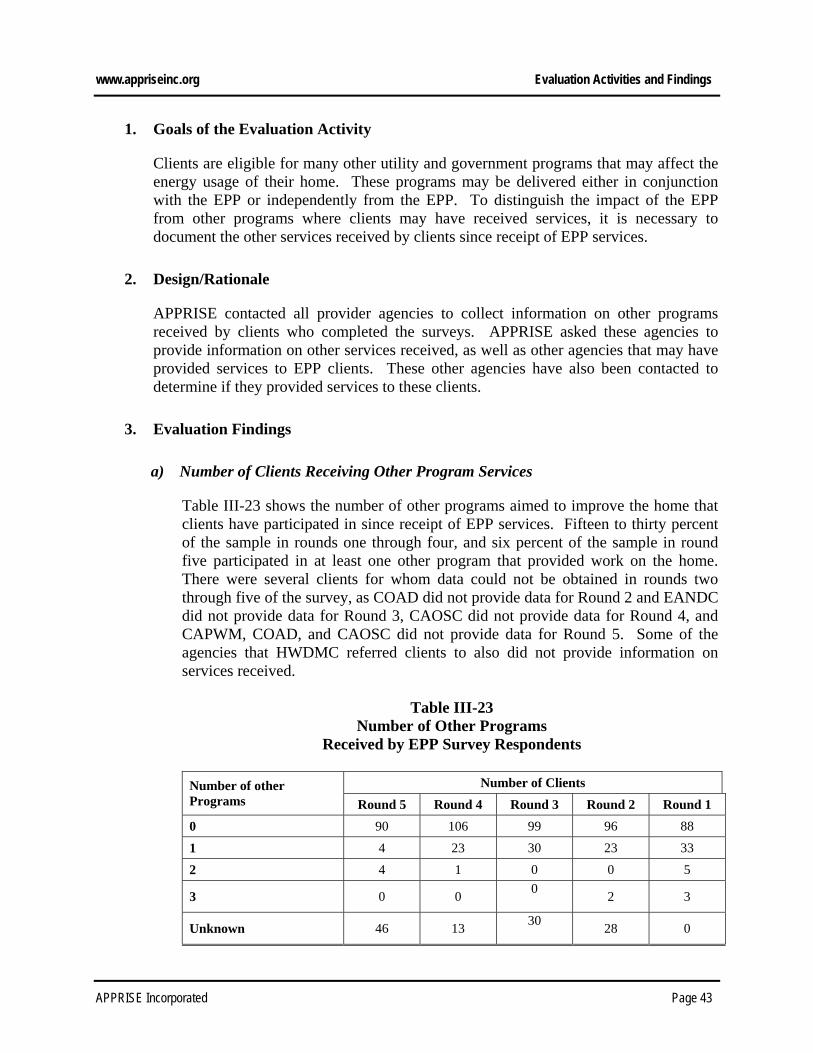
www.appriseinc.org Evaluation Activities and Findings
1. Goals of the Evaluation Activity
Clients are eligible for many other utility and government programs that may affect the energy usage of their home. These programs may be delivered either in conjunction with the EPP or independently from the EPP. To distinguish the impact of the EPP from other programs where clients may have received services, it is necessary to document the other services received by clients since receipt of EPP services.
2. Design/Rationale
APPRISE contacted all provider agencies to collect information on other programs received by clients who completed the surveys. APPRISE asked these agencies to provide information on other services received, as well as other agencies that may have provided services to EPP clients. These other agencies have also been contacted to determine if they provided services to these clients.
3. Evaluation Findings
a) Number of Clients Receiving Other Program Services
Table III-23 shows the number of other programs aimed to improve the home that clients have participated in since receipt of EPP services. Fifteen to thirty percent of the sample in rounds one through four, and six percent of the sample in round five participated in at least one other program that provided work on the home. There were several clients for whom data could not be obtained in rounds two through five of the survey, as COAD did not provide data for Round 2 and EANDC did not provide data for Round 3, CAOSC did not provide data for Round 4, and CAPWM, COAD, and CAOSC did not provide data for Round 5. Some of the agencies that HWDMC referred clients to also did not provide information on services received.
Table III-23 Number of Other Programs
Received by EPP Survey Respondents
Number of Clients Number of other Programs Round 5 Round 4 Round 3 Round 2 Round 1 0 90 106 99 96 88
1 4 23 30 23 33
2 4 1 0 0 5
3 0 0 0 2 3
Unknown 46 13 30 28 0
APPRISE Incorporated Page 43

www.appriseinc.org Evaluation Activities and Findings
Number of Clients Number of other Programs Round 5 Round 4 Round 3 Round 2 Round 1
TOTAL 144 143 159 149 129
b) Types of Programs That Clients Have Received
Table III-24 displays the programs that clients have received. Seventy-three clients received WAP services since participating in EPP. Clients also received services from utility programs, including Community Connections, a program that provides roofing, light bulbs, and electrical wiring, and other utility weatherization programs.
Table III-24 Types of Other Programs
Received by EPP Survey Respondents
Number of Clients
Round 5 Round 4 Round 3 Round 2 Round 1 WAP 2 16 25 7 23 Community Connections – First Energy 1 0 0 9 20
Cleveland Electric Illuminating 0 2 0 5 0
Warm Choice – Columbia Gas 1 3 2 3 6
Housewarming – Dominion East Ohio 0 2 1 3 1
ODOD Cooling Program 0 0 0 1 0
Ohio Housing Trust – Project Hope 3 0 0
Cinergy Weatherization 3 0 0 1 0 City of Cincinnati Emergency Home Repair 0 0 0 1 0
Toledo Edison 0 0 0 0 1 Water Conservation – Cleveland Division of Water 0 1 0 0 0
Emergency Home Repair Program – TANF 1 0 0 0 0
Volunteer Improvement Program 1 0 0 0 0
4. Recommendations
a) Use Program Data in Impact Analysis
In addition to WAP, many utility programs are available for low-income households in Ohio. These data should be used in the impact analysis to control for other work done in the home that will impact energy savings.
APPRISE Incorporated Page 44

www.appriseinc.org Evaluation Activities and Findings
E. Agency Survey
APPRISE conducted the first round of the agency survey in Spring 2003, the second round in Fall 2003, the third round in Spring 2004, and the fourth round in Winter 2005. While the first round of the survey was only targeted to agency managers at the 18 authorized providers, the other rounds were targeted to managers at the nine authorized providers (several providers in the first round were no longer providers) and a sample of approximately 30 auditors at the authorized providers and their sub-agencies. The surveys were conducted by mail, fax, and e-mail.
1. Goals of the Evaluation Activity
The purpose of the survey was to document agency adherence to prescribed Program procedures, services delivered by the agencies, and agencies’ need for assistance in implementing the Program.
2. Design/Rationale
The survey was designed in rounds to capture data from the agencies as the Program evolved. Each round of the survey addressed slightly different issues.
• Round 1 – Spring 2003: This survey provided data on the high use component of the EPP.
• Round 2 – Fall 2003: This survey provided data on the moderate use component and the updated SMOC~ERS software.
• Round 3 – Spring 2004: This survey provided data on how the Program is working, and the extent to which certain Program elements have been introduced.
• Round 4 – Winter 2005: This survey provided data on how the Program is working and specific program measures.
These rounds of the survey allowed for an analysis of all elements of the Program that were introduced and developed over the first four years of the Program. The time-series nature of the survey also allowed for an analysis of how the Program evolved over time.
3. Evaluation Findings
a) Client Recruitment
Table III-25 shows the mean ratings of the OEE recruitment lists across three rounds of the survey. These questions were not asked in Round 1 of the survey.
APPRISE Incorporated Page 45
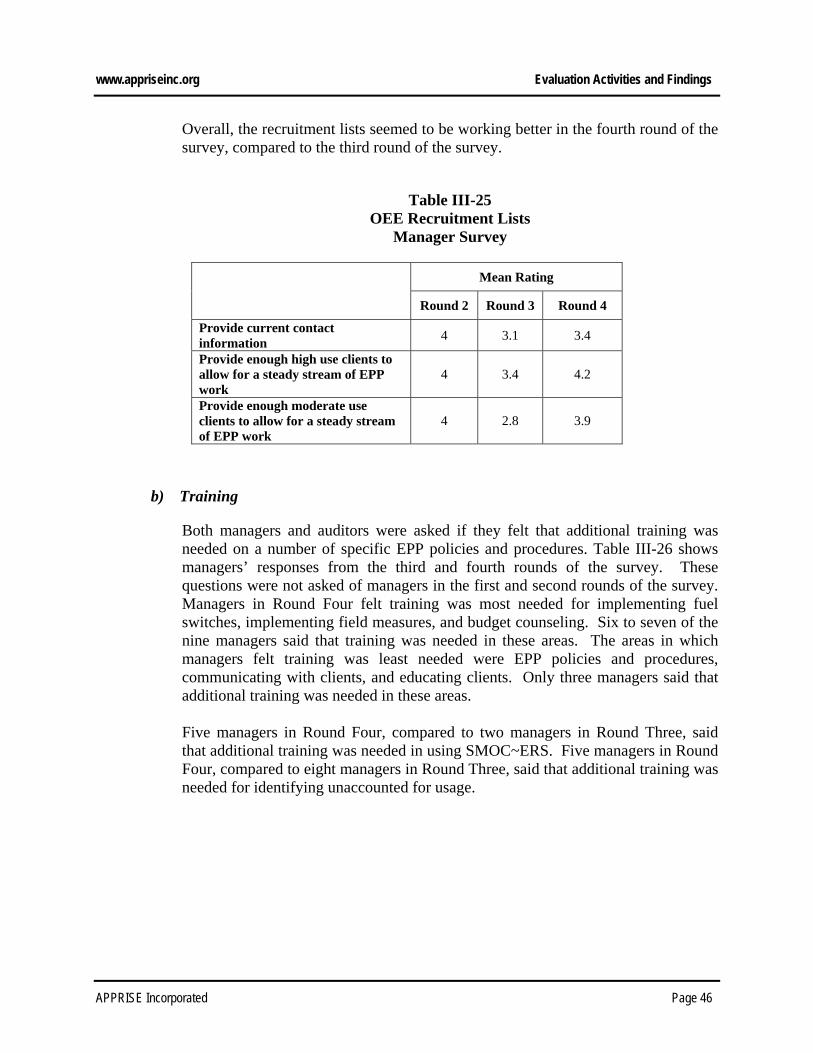
www.appriseinc.org Evaluation Activities and Findings
Overall, the recruitment lists seemed to be working better in the fourth round of the survey, compared to the third round of the survey.
Table III-25 OEE Recruitment Lists
Manager Survey
Mean Rating
Round 2 Round 3 Round 4
Provide current contact information 4 3.1 3.4
Provide enough high use clients to allow for a steady stream of EPP work
4 3.4 4.2
Provide enough moderate use clients to allow for a steady stream of EPP work
4 2.8 3.9
b) Training
Both managers and auditors were asked if they felt that additional training was needed on a number of specific EPP policies and procedures. Table III-26 shows managers’ responses from the third and fourth rounds of the survey. These questions were not asked of managers in the first and second rounds of the survey. Managers in Round Four felt training was most needed for implementing fuel switches, implementing field measures, and budget counseling. Six to seven of the nine managers said that training was needed in these areas. The areas in which managers felt training was least needed were EPP policies and procedures, communicating with clients, and educating clients. Only three managers said that additional training was needed in these areas. Five managers in Round Four, compared to two managers in Round Three, said that additional training was needed in using SMOC~ERS. Five managers in Round Four, compared to eight managers in Round Three, said that additional training was needed for identifying unaccounted for usage.
APPRISE Incorporated Page 46
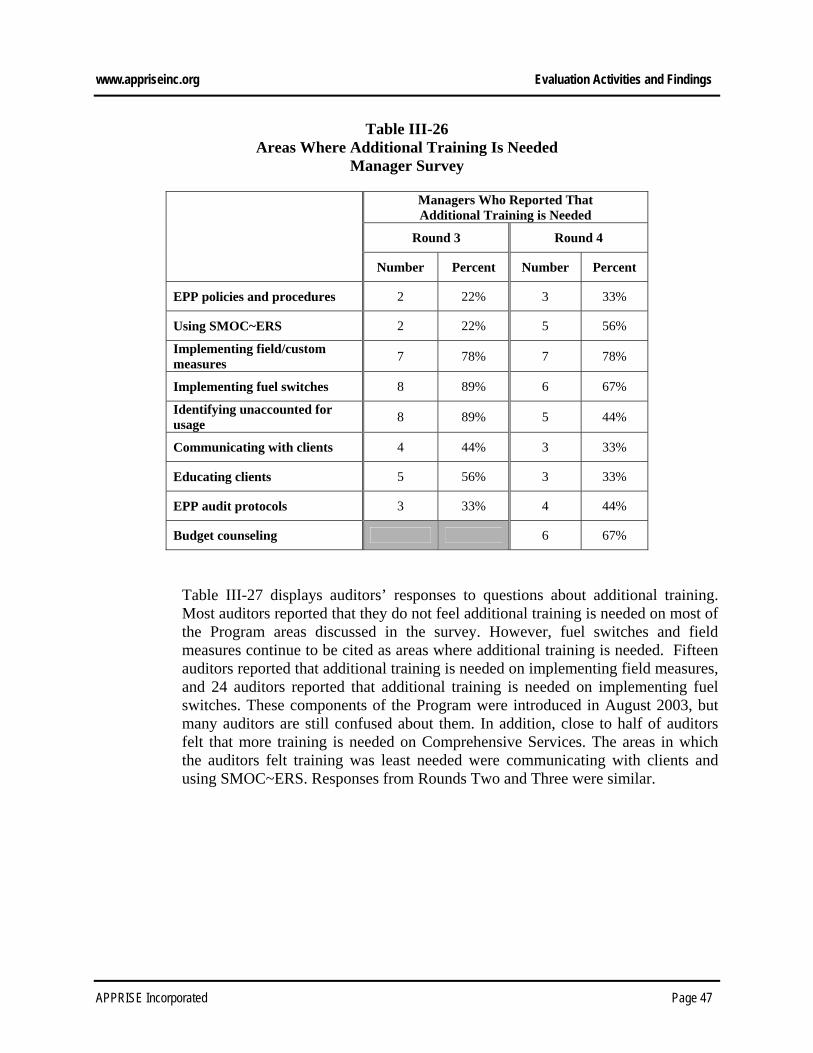
www.appriseinc.org Evaluation Activities and Findings
Table III-26 Areas Where Additional Training Is Needed
Manager Survey Managers Who Reported That Additional Training is Needed
Round 3 Round 4
Number Percent Number Percent
EPP policies and procedures 2 22% 3 33%
Using SMOC~ERS 2 22% 5 56%
Implementing field/custom measures 7 78% 7 78%
Implementing fuel switches 8 89% 6 67%
Identifying unaccounted for usage 8 89% 5 44%
Communicating with clients 4 44% 3 33%
Educating clients 5 56% 3 33%
EPP audit protocols 3 33% 4 44%
Budget counseling 6 67%
Table III-27 displays auditors’ responses to questions about additional training. Most auditors reported that they do not feel additional training is needed on most of the Program areas discussed in the survey. However, fuel switches and field measures continue to be cited as areas where additional training is needed. Fifteen auditors reported that additional training is needed on implementing field measures, and 24 auditors reported that additional training is needed on implementing fuel switches. These components of the Program were introduced in August 2003, but many auditors are still confused about them. In addition, close to half of auditors felt that more training is needed on Comprehensive Services. The areas in which the auditors felt training was least needed were communicating with clients and using SMOC~ERS. Responses from Rounds Two and Three were similar.
APPRISE Incorporated Page 47

www.appriseinc.org Evaluation Activities and Findings
Table III-27 Additional Training Needed
Auditor Survey
Auditors Who Reported that Additional Training is Needed
Round Two Round Three Round Four
Number Percent Number Percent Number Percent
EPP policies and procedures 5 17% 4 13% 4 11%
Using SMOC~ERS 7 23% 3 9% 3 8% Implementing field/custom measures 9 31% 12 39%5 15 42%
Implementing fuel switches 18 64% 21 68% 24 67%
Communicating with clients 2 7% 4 13% 1 3%
Educating clients 3 10% 6 19% 4 11%
EPP audit protocols 5 17% 6 19% 6 17%
Comprehensive services 10 31% 16 44%
Follow-ups 6 19% 6 17%
Budget counseling 14 39%
c) Auditor Compensation
Table III-28 shows types and rates of payment for EPP audits. Five agencies paid EPP auditors an hourly wage, with a mean rate of pay of about $14. Hourly rates varied widely by agency, from less than $9 to more than $17. Four agencies paid auditors for each completed EPP audit, with a mean rate of $75 per high use audit, $46 for each moderate use audit, and $50 per TEE audit. Some agencies also reported that they pay auditors for the installation of measures, including light bulbs, torchieres, and aerators. Four agencies reported that they pay auditors for each light bulb installed, with payments ranging from $5.00 to $5.50.
Table III-28 Auditor Compensation
Manager Survey
Number of
Agencies Using Payment Type
Mean Rate of Pay
Minimum Rate of Pay
Maximum Rate of Pay
Hourly wage 5 $13.95 $8.64 $17.32
High use audit 4 $75.00 $50.00 $100.00
APPRISE Incorporated Page 48

www.appriseinc.org Evaluation Activities and Findings
Number of
Agencies Using Payment Type
Mean Rate of Pay
Minimum Rate of Pay
Maximum Rate of Pay
Moderate use audit 4 $46.25 $35.00 $50.00
TEE audit 1 $50.00 $50.00 $50.00
Light bulb installed 4 $5.13 $5.00 $5.50
Torchiere removed 1 $10.00 $10.00 $10.00
Aerator installed 1 $5.00 $5.00 $5.00
d) Fuel Switches
Both auditors and managers were asked to identify how many domestic hot water tank, heating system, and dryer fuel switches they or their agencies have implemented. Table III-29 shows that heating system and dryer fuel switches have been performed by only one agency, and domestic hot water tank fuel switches have been performed by two agencies. A total of 15 fuel switches have been performed, as reported by managers. (Only a sample of auditors was surveyed, which explains why auditors report a lower total number of fuel switches.) Only three agencies have done fuel switches: CAWM has done one hot water heater switch, CHN has done three dryer switches, and HWDMC has done nine hot water heater switches, two heating system switches, and one other switch. Only two auditors reported that they performed fuel switches: one auditor performed one hot water heater switch, and the other performed three heating system switches, one hot water heater and one other switch.
Table III-29
Number of Fuel Switches Completed Manager and Auditor Surveys
Managers Auditors
# Agencies Have
Completed Switch
# Switches Completed
# Auditors Have Completed
Switch
# Switches Completed
DHW 2 10 2 2
Heating system 1 2 1 3
Dryer 1 3 0 0
APPRISE Incorporated Page 49

www.appriseinc.org Evaluation Activities and Findings
e) Field/Custom Measures
Both auditors and managers were asked if they or their agencies had implemented any field/custom measures. Table III-30 shows that one manager reported that his agency has implemented field/custom measures. None of the auditors surveyed reported that they have implemented field/custom measures.
Table III-30
Field/Custom Measures Implemented Manager and Auditor Surveys
Managers Auditors
Round Two
Round Three
Round Four
Round Two
Round Three
Round Four
Yes, have implemented field/ custom measures 2 4 1 4 4 0
No, have not implemented field/ custom measures 7 5 8 23 27 36
.
f) 2 For 1 Refrigerator and Freezer Replacements
Recent analysis of SMOC~ERS data showed that only a few percent of clients had two-for-one refrigerator or freezer replacements, despite the fact that many clients had several appliances. This is a highly cost-effective measure that appears to provide opportunities for additional savings. As such, the surveys attempted to determine whether there may be an opportunity to increase the incentives for auditors to provide these measures and for clients to accept these measures. Auditors were asked to describe the following:
• Incentives that currently exist for auditors to encourage clients to agree to 2-
for-1 replacements • Incentives for clients to agree to 2-for-1 replacements • Barriers to 2-for-1 replacements.
Table III-31 shows that 12 auditors reported that saving clients money was an incentive for them to encourage clients to agree to 2-for-1 replacements, and five auditors said that improving their SIRs was an incentive. Eleven auditors said that there were no incentives for auditors to encourage clients to agree to 2-for-1 replacements. Answers total to more than 100 percent, as respondents could provide more than one answer.
Table III-31 Auditor Incentives for Two-For-One Appliance Replacement
Auditor Survey
APPRISE Incorporated Page 50
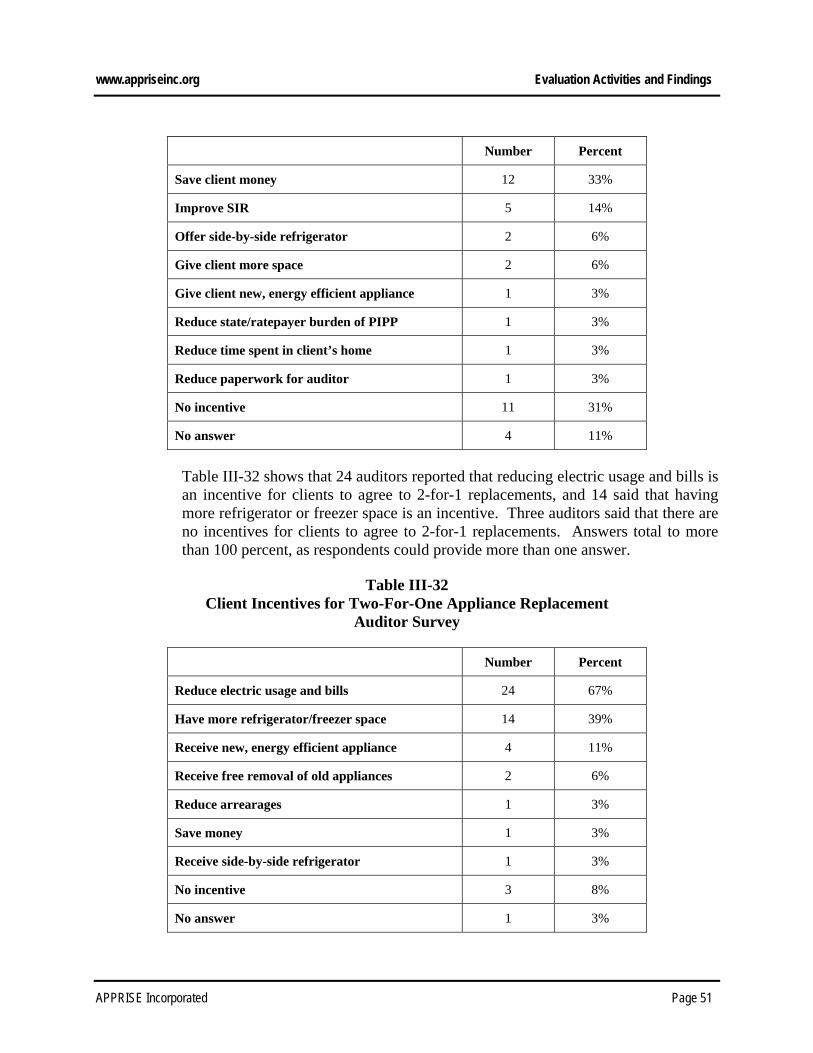
www.appriseinc.org Evaluation Activities and Findings
Number Percent
Save client money 12 33%
Improve SIR 5 14%
Offer side-by-side refrigerator 2 6%
Give client more space 2 6%
Give client new, energy efficient appliance 1 3%
Reduce state/ratepayer burden of PIPP 1 3%
Reduce time spent in client’s home 1 3%
Reduce paperwork for auditor 1 3%
No incentive 11 31%
No answer 4 11%
Table III-32 shows that 24 auditors reported that reducing electric usage and bills is an incentive for clients to agree to 2-for-1 replacements, and 14 said that having more refrigerator or freezer space is an incentive. Three auditors said that there are no incentives for clients to agree to 2-for-1 replacements. Answers total to more than 100 percent, as respondents could provide more than one answer.
Table III-32
Client Incentives for Two-For-One Appliance Replacement Auditor Survey
Number Percent
Reduce electric usage and bills 24 67%
Have more refrigerator/freezer space 14 39%
Receive new, energy efficient appliance 4 11%
Receive free removal of old appliances 2 6%
Reduce arrearages 1 3%
Save money 1 3%
Receive side-by-side refrigerator 1 3%
No incentive 3 8%
No answer 1 3%
APPRISE Incorporated Page 51

www.appriseinc.org Evaluation Activities and Findings
Table III-33 shows auditors were most likely to state the following barriers to acceptance of the measure: • Clients wanting more refrigerator space • Clients believing they are losing an appliance (that they may have an
emotional attachment to) • Clients wanting to stock up on food, especially when it is on sale • Extra appliances being used seasonally for holidays or hunting.
One auditor said that PIPP program benefits are a barrier to clients agreeing to 2-for-1 replacements. Two auditors said that no barriers existed. Answers total to more than 100 percent, as respondents could provide more than one answer.
Table III-33 Barriers to Two-For-One Appliance Replacement
Auditor Survey
Number Percent
Client wants more space in refrigerator 7 19%
Client thinks he/she is losing an appliance 6 17%
Client wants to stock up on food 6 17%
Extra appliances are used seasonally 5 14%
Client has a big family in the household 4 11%
Extra appliance is sentimental to client 4 11%
Client wants a back-up appliance 3 8%
Replacement does not fit in space 2 6%
Client wants to keep ice maker 1 3%
PIPP 1 3%
Refrigerator is rented 1 3%
Client wants to sell appliances 1 3%
Client does not understand benefits 1 3%
No barriers 2 6%
No answer 2 6%
APPRISE Incorporated Page 52

www.appriseinc.org Evaluation Activities and Findings
Managers and auditors were asked to rate how effective proposed incentives would be in encouraging clients to agree to 2-for-1 replacements, using the scale shown in Table III-34.
Table III-34
Proposed 2-for-1 Replacement Incentives Rating Scale
Rating Scale
1 Not at all effective
3 Somewhat effective
5 Very effective
Managers were asked to rate how effective a nicer refrigerator and an incentive payment would be to convince clients to agree to a two-for-one replacement. Table III-35 shows how managers rated these proposed incentives. Managers gave a mean rating of about three to three and a half to both potential incentives, meaning that they thought each proposed incentive would be somewhat effective in encouraging clients to agree to 2-for-1 replacements. One manager said that offering arrearage forgiveness to clients would be very effective in encouraging them to agree to 2-for-1 replacements.
Table III-35
Proposed 2-for-1 Incentives Manager Survey
Number Who Provided
Rating Number Who
Provided Response 1-2 3 4-5
Mean Rating
Refrigerator with nicer features 9 3 4 2 2.9
Incentive payment, ranging from $25-75 9 2 2 5 3.6
Arrearage forgiveness 1 0 0 1 5
Table III-36 shows how auditors rated the proposed incentives. Auditors gave a mean rating of about three to offering a refrigerator with nicer features, meaning that they thought the proposed incentive would be somewhat effective in encouraging clients to agree to 2-for-1 replacements. Auditors gave a mean rating of about four to offering an incentive payment to clients of $25 to $75, meaning that the incentive would be very effective. Four auditors said that offering larger refrigerators would be very effective, and three auditors said that offering arrearage
APPRISE Incorporated Page 53
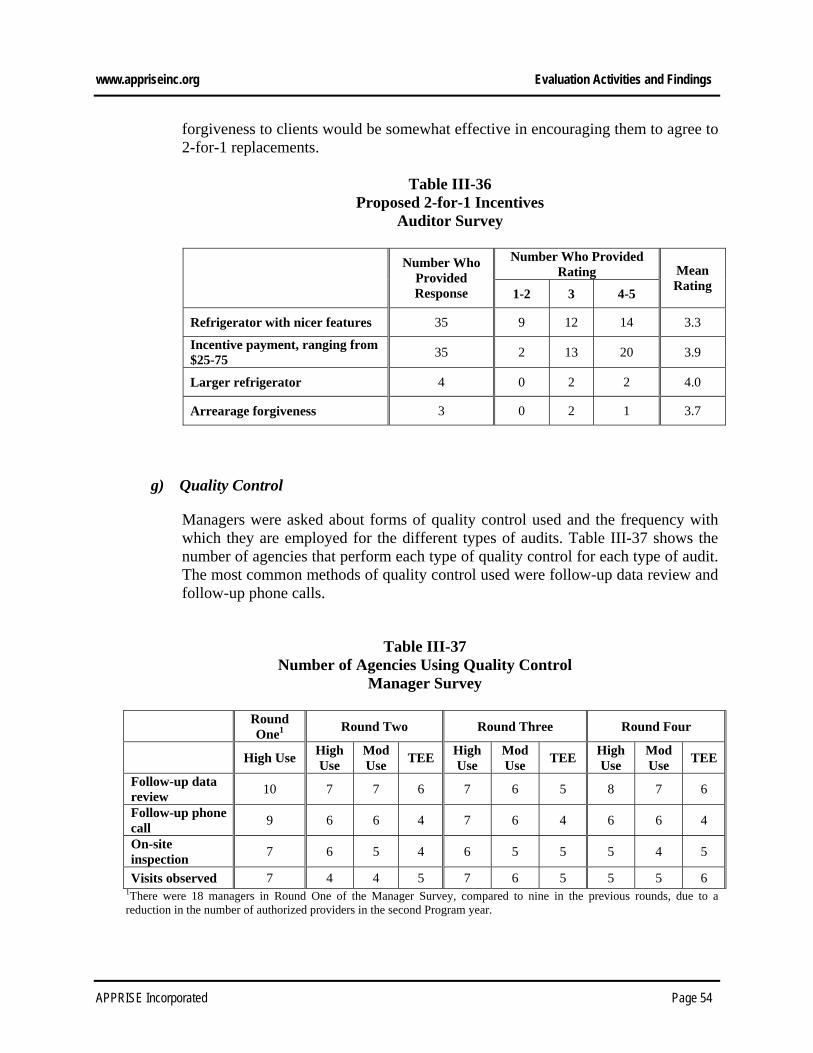
www.appriseinc.org Evaluation Activities and Findings
forgiveness to clients would be somewhat effective in encouraging them to agree to 2-for-1 replacements.
Table III-36 Proposed 2-for-1 Incentives
Auditor Survey
Number Who Provided Rating
Number Who Provided Response 1-2 3 4-5
Mean Rating
Refrigerator with nicer features 35 9 12 14 3.3
Incentive payment, ranging from $25-75 35 2 13 20 3.9
Larger refrigerator 4 0 2 2 4.0
Arrearage forgiveness 3 0 2 1 3.7
g) Quality Control
Managers were asked about forms of quality control used and the frequency with which they are employed for the different types of audits. Table III-37 shows the number of agencies that perform each type of quality control for each type of audit. The most common methods of quality control used were follow-up data review and follow-up phone calls.
Table III-37
Number of Agencies Using Quality Control Manager Survey
Round
One1 Round Two Round Three Round Four
High Use High Use
Mod Use TEE High
Use Mod Use TEE High
Use Mod Use TEE
Follow-up data review 10 7 7 6 7 6 5 8 7 6
Follow-up phone call 9 6 6 4 7 6 4 6 6 4
On-site inspection 7 6 5 4 6 5 5 5 4 5
Visits observed 7 4 4 5 7 6 5 5 5 6 1There were 18 managers in Round One of the Manager Survey, compared to nine in the previous rounds, due to a reduction in the number of authorized providers in the second Program year.
APPRISE Incorporated Page 54

www.appriseinc.org Evaluation Activities and Findings
Auditors were asked to report the frequencey and forms of feedback that auditors receive from their managers regarding the quality of their EPP audits. Table III-38 shows that 28 auditors reported that they received feedback monthly from their managers, 14 said they received feedback quarterly, and 15 said they received feedback annually. Four auditors reported that they did not receive feedback from their managers. Answers total to more than 100 percent, as respondents could provide more than one answer.
Table III-38 Frequency of Feedback Received
Auditor Survey
Number of Auditors Percent
Monthly 28 78%
Quarterly 14 39%
Annually 15 42%
Does not receive feedback 4 11%
Auditors were asked to rate the helpfulness of the feedback received from their managers using the scale shown in Table II-39.
Table III-39
Helpfulness of Feedback - Rating Scale Auditor Survey
Rating Scale
1 Not at all helpful
3 Somewhat helpful
5 Very helpful
Table III-40 shows that auditors gave the feedback that they received from their managers a mean rating of about four and a half, meaning that the feedback was very helpful.
Table III-40 Helpfulness of Feedback Received
Auditor Survey
Number of Auditors Who Provided Each Rating
Mean Rating
APPRISE Incorporated Page 55

www.appriseinc.org Evaluation Activities and Findings
1-2 3 4-5
Feedback received from manager 0 8 24 4.4
h) Overall Program Ratings
Respondents were asked to rate how well certain components of the Program are working based on the scale in Table III-41.
Table III-41
Overall Rating of Program Components Rating Scale
Rating Scale
1 Not at all well
3 Somewhat well
5 Very well
Table III-42 shows that managers gave SMOC~ERS, the client education component of the Program, the ability of Program policies and procedures to facilitate Program administration, and the Program in general a mean rating of about four, meaning that the Program is operating very well overall.
Table III-42 Overall Rating of Program Components
Manager Survey
Number of Managers Who Provided Each Rating And Mean Rating
Round Two Round Three Round Four
1-2 3 4-5 Mean 1-2 3 4-5 Mean 1-2 3 4-5 Mean
How well SMOC~ERS works 1 2 6 4.0 0 2 7 4.0 2 0 7 4.0
How well the client education component of the Program works
1 1 7 3.8 0 3 6 3.9 1 4 4 3.7
How well EPP policies and procedures facilitate administration of Program services
0 3 6 4.0 0 4 5 3.8
How well the Program is running 0 2 7 4.3 0 2 7 4.2 0 2 7 4.0
APPRISE Incorporated Page 56

www.appriseinc.org Evaluation Activities and Findings
Table III-43 shows that auditors also gave each component of the Program asked about in the survey a mean rating of about four. These results suggest that, overall, both managers and auditors are satisfied with the way the Program is running.
Table III-43 Overall Rating of Program Components
Auditor Survey
Number of Auditors Who Provided Each Rating And Mean Rating
Round Two Round Three Round Four
1-2 3 4-5 Mean 1-2 3 4-5 Mean 1-2 3 4-5 Mean
How well SMOC~ERS works 1 8 20 3.9 2 11 19 3.8 1 10 25 4.0
How well the client education component of the Program works
1 5 23 4.2 3 14 15 3.6 0 16 20 3.9
How well EPP policies and procedures facilitate administration of Program services
2 8 22 3.9 2 15 19 3.8
How well the Program is running 1 4 25 4.2 2 6 24 4.1 0 13 23 4.1
4. Recommendations
a) Provide Additional Training on Field Measures and Fuel Switches
Managers and auditors were likely to report that additional training was needed on field measures and fuel switches. Many also reported that they had not implemented these measures because of the need for a better understanding of the procedures. OEE should provide additional training in these areas.
b) Provide Additional Baseload Training
More than half of the managers who were surveyed responded that additional training was needed on identifying sources of high electric usage. Auditors need more training to provide measures beyond light bulbs and refrigerators.
c) Provide Incentives for Two-For-One Refrigerator Replacement
OEE should provide incentives for auditors to find these opportunities and for clients to accept the measure. Agencies could receive extra fees for these measures and clients could receive special options on the refrigerators.
APPRISE Incorporated Page 57
www.appriseinc.org Evaluation Activities and Findings
d) Require Agencies to Provide Additional Quality Control
A few agencies still do not provide data review, follow-up phone-calls, inspections of completed work, and on-site observation of audits. OEE should specify the type and level of quality control that should be conducted by agencies.
F. Light Bulb Research
A large component of the electric savings from the EPP is achieved through the installation of compact fluorescent light bulbs. Analysis of the Program’s database shows that participants receive an average of 16 light bulbs. Client surveys and post completion inspections conducted by evaluators have indicated that light bulb failure rates are higher than expected. However, this research has not been extensive enough to determine whether failure rates vary by provider and type of bulb.
1. Goals of the Evaluation Activity
APPRISE has conducted additional research to provide more data on the bulb failures. This research has consisted of a provider survey to document the types of bulbs installed, and a client survey to document installation, removal, and failure rates by provider.
2. Design/Rationale
The client survey was conducted in April and May 2005, with 1,618 program participants. The EPP client light bulb survey was designed to measure the following:
• Provider installation of CFLs • Bulb failure • Replacement of burned out bulbs • Removal of bulbs • Bulbs currently installed • Client satisfaction with bulbs
The provider survey, conducted in February 2005, aimed to collect information about the brands and models of bulbs provided to EPP clients from October 2002 through August 2004. Ten current and previous lead agencies were sent the surveys via email. Seven lead agencies provided complete information about the light bulbs provided to EPP clients. YACAC reported that it did not have bulb information for the specified time period because it was a sub-agency of CHN during that time. Two lead agencies, EANDC and SCOPE, did not provide responses to the provider survey.
The survey asked providers to provide the following information about the CFLs that they provided to EPP clients between October 2002 and September 2004:
APPRISE Incorporated Page 58
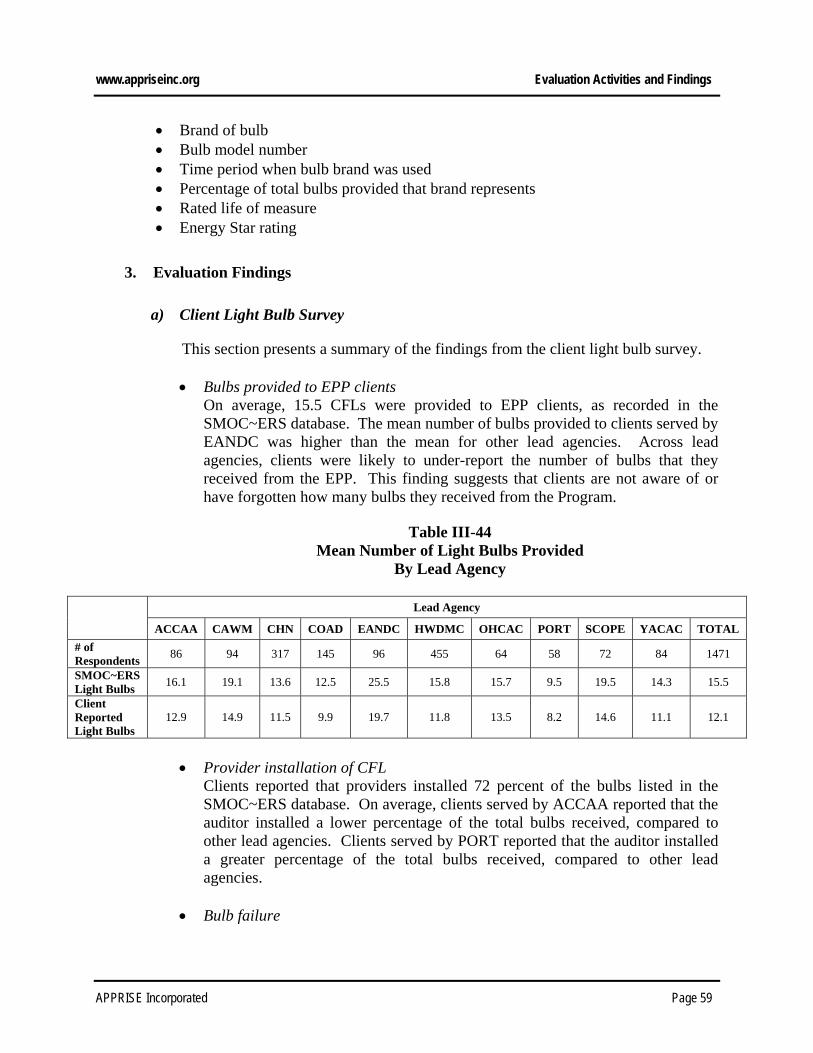
www.appriseinc.org Evaluation Activities and Findings
• Brand of bulb • Bulb model number • Time period when bulb brand was used • Percentage of total bulbs provided that brand represents • Rated life of measure • Energy Star rating
3. Evaluation Findings
a) Client Light Bulb Survey
This section presents a summary of the findings from the client light bulb survey.
• Bulbs provided to EPP clients On average, 15.5 CFLs were provided to EPP clients, as recorded in the SMOC~ERS database. The mean number of bulbs provided to clients served by EANDC was higher than the mean for other lead agencies. Across lead agencies, clients were likely to under-report the number of bulbs that they received from the EPP. This finding suggests that clients are not aware of or have forgotten how many bulbs they received from the Program.
Table III-44
Mean Number of Light Bulbs Provided By Lead Agency
Lead Agency
ACCAA CAWM CHN COAD EANDC HWDMC OHCAC PORT SCOPE YACAC TOTAL
# of Respondents 86 94 317 145 96 455 64 58 72 84 1471
SMOC~ERS Light Bulbs 16.1 19.1 13.6 12.5 25.5 15.8 15.7 9.5 19.5 14.3 15.5
Client Reported Light Bulbs
12.9 14.9 11.5 9.9 19.7 11.8 13.5 8.2 14.6 11.1 12.1
• Provider installation of CFL
Clients reported that providers installed 72 percent of the bulbs listed in the SMOC~ERS database. On average, clients served by ACCAA reported that the auditor installed a lower percentage of the total bulbs received, compared to other lead agencies. Clients served by PORT reported that the auditor installed a greater percentage of the total bulbs received, compared to other lead agencies.
• Bulb failure
APPRISE Incorporated Page 59

www.appriseinc.org Evaluation Activities and Findings
Table III-45 shows the percent of SMOC~ERS bulbs that burned out, by lead agency and number of months since audit date. Overall, 11 percent of the bulbs burned out. As expected, clients that were served longer ago have a greater percentage of bulbs that failed. Clients who received EPP services 4-6 months prior to the survey reported that six percent burned out, compared to eight percent for the 7-9 month cohort, nine percent for the 10-12 month cohort, 13 percent for the 13-15 month cohort, and 17 percent for the 16-19 month cohort.
Table III-45
Percentage of Light Bulbs Burned Out By Lead Agency and Months Since Audit Date
Months Since Audit Date
4-6
Months 7-9
Months 10-12
Months 13-15
Months 16-19
Months TOTAL
# of Respondents 208 398 382 362 258 1608
ACCAA -- -- 8% 12% 9% 10%
CAWM -- 10% 13% 15% 14% 12%
CHN 8% 13% 14% 21% 22% 14%
COAD 2% 4% 10% 10% 12% 8%
EANDC -- 0% 10% 12% 14% 11%
HWDMC 17% 4% 7% 11% 17% 9%
OHCAC -- 2% 7% 10% 14% 7%
PORT -- 6% 6% 9% 28% 12%
SCOPE -- -- 6% 11% 11% 9%
YACAC -- 11% 21% 13% 15% 13%
TOTAL 6% 8% 9% 13% 17% 11% • Replacement of burned out bulbs
Overall, clients reported that they replaced 22 percent of the failed bulbs, and that providers replaced another 13 percent of the failed bulbs. Clients served by CHN reported that they replaced a greater percentage of the failed bulbs, compared to clients served by other agencies. Clients served by OHCAC reported that OHCAC replaced a greater percentage of the failed bulbs, compared to other lead agencies.
• Removal of bulbs
Overall, clients reported that they removed one percent of the bulbs for a reason other than that they burned out. Respondents who reported that one or more bulbs were removed were most likely to report that they were removed because they broke, or because they did not fit or work in the specific fixture.
APPRISE Incorporated Page 60

www.appriseinc.org Evaluation Activities and Findings
• Bulbs currently installed Table III-46 shows the percentage of SMOC~ERS light bulbs currently installed, by lead agency and number of months since audit date. Clients in more recent cohorts reported that a greater percentage of bulbs were still installed. Clients served 4-6 months prior to the survey reported that 76 percent of CFLs were still installed at the time of the survey, compared to 71 percent of bulbs for the 7-9 month cohort, 67 percent of bulbs for the 10-12 month cohort, 64 percent of bulbs for the 13-15 months cohort, and 56 percent of bulbs for the 16-19 month cohort. Clients served by OHCAC who received services 6-9 months prior to the survey and 13-15 months prior to the survey reported that a greater percentage of the bulbs were still installed, compared to other clients in their respective cohorts.
Table III-46
Percentage of Light Bulbs Currently Installed By Lead Agency and Months Since Audit Date
Months Since Audit Date
4-6 Months 6-9 Months 10-12 Months 13-15 Months 16-19 Months TOTAL
# of Respondents 199 373 359 341 232 1504
ACCAA -- -- 67% 62% 66% 65%
CAWM -- 71% 63% 61% 58% 66%
CHN 72% 68% 71% 69% 53% 67%
COAD 84% 78% 68% 65% 66% 71%
EANDC -- 73% 59% 67% 63% 63%
HWDMC 79% 70% 67% 58% 55% 67%
OHCAC -- 85% 70% 76% 48% 73%
PORT -- 77% 71% 64% 70% 71%
SCOPE -- -- 68% 61% 54% 62%
YACAC -- 68% 61% 61% 46% 62%
TOTAL 76% 71% 67% 64% 56% 67% • Bulbs Used More than One Hour Per Day
Table III-47 shows the percentage of SMOC~ERS bulbs currently installed that were used for at least one hour per day, by lead agency and number of months since audit date. The percentage of SMOC~ERS bulbs currently installed that were used for at least one hour per day is calculated as the number of bulbs that the client reports are used for at least one hour per day divided by the number of bulbs received, as recorded in SMOC~ERS. As expected, clients from the more recent cohorts reported that a greater percentage of bulbs were still installed and were used for at least one hour per day.
APPRISE Incorporated Page 61

www.appriseinc.org Evaluation Activities and Findings
Table III-47 Percent of Light Bulbs Currently Installed That Are Used
For One Hour Per Day By Lead Agency and Months Since Audit Date
Months Since Audit Date
4-6 Months
6-9 Months
10-12 Months
13-15 Months
16-19 Months TOTAL
# of Respondents 198 372 359 347 238 1514
ACCAA -- -- 45% 41% 44% 43%
CAWM -- 50% 38% 40% 27% 44%
CHN 50% 45% 49% 52% 36% 47%
COAD 55% 59% 40% 47% 33% 48%
EANDC -- 33% 34% 54% 30% 43%
HWDMC 55% 55% 45% 34% 36% 47%
OHCAC -- 58% 35% 51% 30% 45%
PORT -- 60% 52% 52% 46% 53%
SCOPE -- -- 39% 37% 43% 40%
YACAC -- 52% 44% 66% 19% 54%
TOTAL 53% 53% 43% 48% 35% 46% • Light Bulb Statistics Summary
Table III-48 presents a summary of light bulb statistics. Percentages in the table represent the percentage of SMOC~ERS bulbs that are represented by a particular characteristic (i.e. Percent Installed by Auditor is calculated as the percentage of SMOC~ERS bulbs that were installed by the auditor).
Table III-48
Light Bulb Statistics By Lead Agency
Lead Agency
ACCAA CAWM CHN COAD EANDC HWDMC OHCAC PORT SCOPE YACAC TOTAL
# of Respondents 77 89 294 142 94 432 61 56 70 77 1392
SMOC~ERS Light Bulbs 16.0 18.9 13.7 12.4 25.7 15.6 15.5 9.3 19.4 14.2 15.4
Client Reported Light Bulbs
12.7 15.0 11.3 9.9 19.1 11.6 13.3 8.1 14.5 11.2 12.0
% Installed by Auditor 60% 74% 75% 75% 70% 71% 72% 81% 69% 74% 72%
% Left for Client 23% 6% 10% 9% 3% 7% 10% 3% 7% 3% 8%
APPRISE Incorporated Page 62
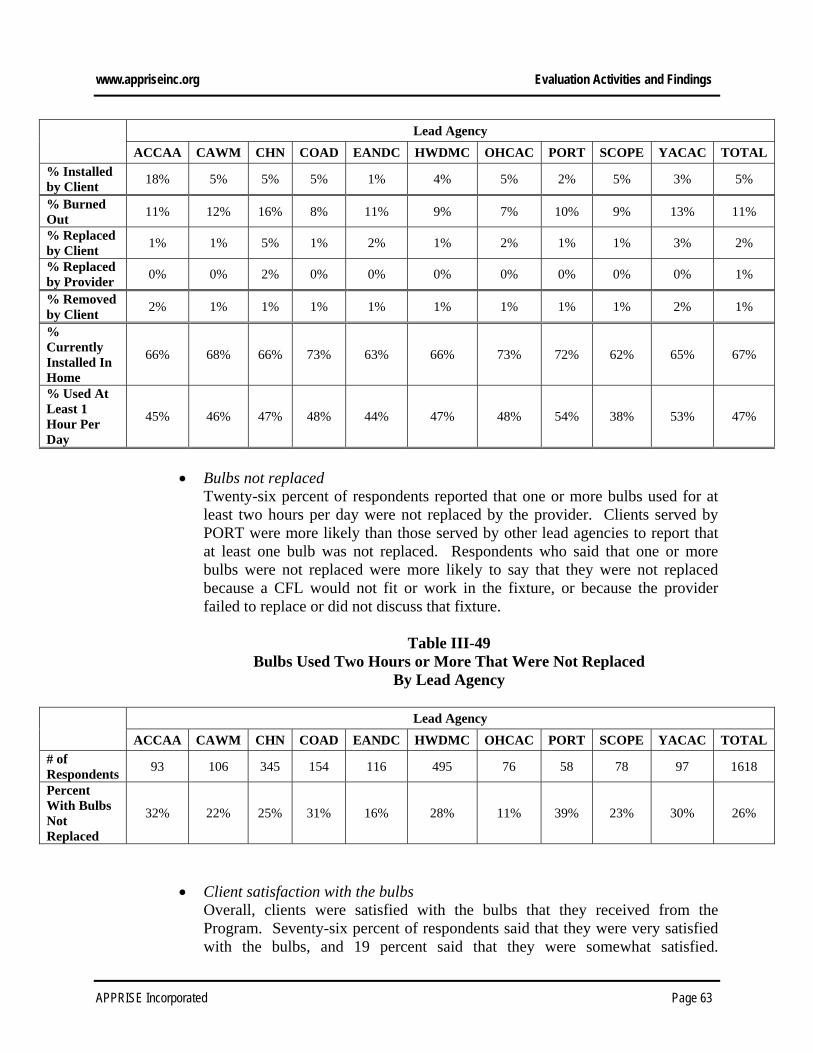
www.appriseinc.org Evaluation Activities and Findings
Lead Agency
ACCAA CAWM CHN COAD EANDC HWDMC OHCAC PORT SCOPE YACAC TOTAL % Installed by Client 18% 5% 5% 5% 1% 4% 5% 2% 5% 3% 5%
% Burned Out 11% 12% 16% 8% 11% 9% 7% 10% 9% 13% 11%
% Replaced by Client 1% 1% 5% 1% 2% 1% 2% 1% 1% 3% 2%
% Replaced by Provider 0% 0% 2% 0% 0% 0% 0% 0% 0% 0% 1%
% Removed by Client 2% 1% 1% 1% 1% 1% 1% 1% 1% 2% 1%
% Currently Installed In Home
66% 68% 66% 73% 63% 66% 73% 72% 62% 65% 67%
% Used At Least 1 Hour Per Day
45% 46% 47% 48% 44% 47% 48% 54% 38% 53% 47%
• Bulbs not replaced
Twenty-six percent of respondents reported that one or more bulbs used for at least two hours per day were not replaced by the provider. Clients served by PORT were more likely than those served by other lead agencies to report that at least one bulb was not replaced. Respondents who said that one or more bulbs were not replaced were more likely to say that they were not replaced because a CFL would not fit or work in the fixture, or because the provider failed to replace or did not discuss that fixture.
Table III-49
Bulbs Used Two Hours or More That Were Not Replaced By Lead Agency
Lead Agency
ACCAA CAWM CHN COAD EANDC HWDMC OHCAC PORT SCOPE YACAC TOTAL
# of Respondents 93 106 345 154 116 495 76 58 78 97 1618
Percent With Bulbs Not Replaced
32% 22% 25% 31% 16% 28% 11% 39% 23% 30% 26%
• Client satisfaction with the bulbs Overall, clients were satisfied with the bulbs that they received from the Program. Seventy-six percent of respondents said that they were very satisfied with the bulbs, and 19 percent said that they were somewhat satisfied.
APPRISE Incorporated Page 63

www.appriseinc.org Evaluation Activities and Findings
Moreover, 75 percent of clients reported that they would buy replacement CFLS when the bulbs they received from the Program burn out.
Table III-50
Overall Satisfaction with CFLs By Lead Agency
Lead Agency
ACCAA CAWM CHN COAD EANDC HWDMC OHCAC PORT SCOPE YACAC TOTAL
# of Respondents 93 106 345 154 116 495 76 58 78 97 1618
Very Satisfied 66% 70% 73% 76% 63% 80% 80% 76% 69% 70% 76%
Somewhat Satisfied 28% 23% 22% 19% 27% 16% 16% 15% 26% 21% 19%
Somewhat Dissatisfied 2% 6% 2% 4% 8% 3% 2% 6% 4% 6% 3%
Very Dissatisfied 3% 0% 3% 1% 1% 1% 3% 4% 0% 2% 2%
Don’t Know 0% 1% 0% 0% 0% 1% 0% 0% 0% 0% 1%
b) Agency Light Bulb Survey
Table III-51 shows the brands of bulbs and types of bulbs used by providers, with their respective rated life and Energy Star rating. Clients served by COAD, OHCAC, and SCOPE reported that a somewhat smaller percentage of bulbs failed, compared to clients served by other lead agencies. However, Table III-51 shows that there is not a distinct difference between the brands of bulbs used by COAD and OHCAC (SCOPE did not provide bulb information) and the brands of bulbs used by other lead agencies.
Table III-51
Light Bulbs Used by Providers
Brands Bulb Types Life Energy Star? Sunrise 40W 10,000 Yes
Energetic 40W, 60W, 100W 10,000 Yes
Niagara Conserv. 60W, 100W 10,000 Yes
Lumacoil 100W 10,000 Yes
ACCAA
GE 100W 10,000 Yes
60W, 50/100/150, 40W Globe 8,000 Yes TCP
60W, 75W, 75W Outdoor 10,000 Yes CAWM
AutoCell 75W, 100W 10,000 Yes
APPRISE Incorporated Page 64

www.appriseinc.org Evaluation Activities and Findings
Brands Bulb Types Life Energy Star?
15W Globe, 25W Candelabra, 25W 6,000 Yes TCP 40W, 60W, 75W, 90W, 100W, 3-Way Torch, Torch
Dim, 60W Globe 10,000 Yes
Link 25W 6,000 Yes
Energetic 40W, 60W, 75W, 100W 10,000 Yes
Greenlite 90W Dim 8,000 Yes
Philips 75W Outdoor 10,000 Yes
25W Candelabra 6,000 Yes
60W Globe 8,000 Yes
CHN
Maxlite
Torch Dim 10,000 Yes
Philips Marathon 60W Tube, 75W Tube, 100W Tube, 60W Outdoor, 75W Outdoor 10,000 Yes
Energetic 60W, 75W, 100W 10,000 Yes COAD
GE 50/100/150 10,000 Yes
EANDC No information provided
60W Tube 8,000 Yes Niagara
3-Way Torch 10,000 Not known 25W Candelabra 8,000 No
40W 10,000 Yes Energetic
75W, 100W Not known Not known 60W 10,000 Yes
Harmony Lightwiz 75W, 100W Not known Not known
60W Globe, 75W Floodlight 8,000 Yes TCP
60/90/150, 75W Outdoor, 3-Way Torch 10,000 Yes Lights of America 60/90/150 10,000 Not known
Philips 75W Outdoor 10,000 Yes
HWDMC
LimeLite .03W Nightlight Lifetime No
Sunrise 60W 10,000 Yes Energetic 25W, 40W, 60W, 75W, 100W 10,000 Yes
Link 40W 8,000 Yes TCP 75W Outdoor 8,000 Yes
OHCAC
Philips 75W Outdoor 10,000 Yes
Energetic 25W, 40W, 60W, 75W, 100W 10,000 Yes PORT
TCP 40W, 60W, 75W, 100W 10,000 Yes
SCOPE No information provided
YACAC Not a lead agency from 10/02-9/04
APPRISE Incorporated Page 65

www.appriseinc.org Evaluation Activities and Findings
4. Recommendations
a) Review Protocols With Providers
Clients reported that only 72 percent of the SMOC~ERS bulbs were installed by the auditors. OEE should reinforce the requirement that providers install all bulbs that they provide to clients while they are in the home.
b) Require Providers to Replace Bulbs
Clients reported that six percent of the bulbs burned out within six months after service delivery and nine percent burnt out within one year after service delivery. OEE should require providers to replace bulbs that burn out prior to one year after service delivery. OEE should investigate whether it would be cost-effective to pay providers to replace bulbs that burn out more than one year after service delivery.
APPRISE Incorporated Page 66

www.appriseinc.org Summary of Findings and Recommendations
IV. Summary of Findings and Recommendations
There have been significant improvements in the design and implementation of the Electric Partnership Program in the fourth year of operation. Some of the key accomplishments over the last year have been:
• Program production continued to increase in the fourth year of the EPP.
• Additional improvements were made to SMOC~ERS.
• A Tablet PC was adopted by all of the agencies.
• Program marketing was enhanced.
• Requirements were set for the number of days of EPP monitoring.
• Procedures were developed for Comprehensive Services.
The principal suggestions for continued improvements to the Program include requiring agencies to replace bulbs that fail in the first year, providing incentives to increase refrigerator removal rates, providing incentives or penalties to increase custom measures and fuel switches, re-examining the cost effectiveness of air conditioning measures, increasing production in Cinergy’s service territory, providing additional education and baseload training, and increasing quality control.
A. Improvements in the Fourth Year of the EPP
Following a slow start and vast improvements in the third year of Program implementation, the fourth year has seen increased improvement and accomplishments.
• Production has continued to increase: Following the decrease in authorized providers from 18 to nine, there was a significant drop in production in the first quarter of the third fiscal year. However, production rebounded quickly. Production for the first three quarters of the fourth year of the Program was 8,476 jobs, compared to 6,669 in the first three quarters of the third Program year.
• Tablet PC: All of the agencies are now using the Tablet PC as a replacement for the PDA. There are many benefits to this switch.
• EPP Brochure: A brochure was developed for the EPP and distributed to agencies in July 2004. Agencies can mail the brochure to potential clients.
• EPP Letter: OEE sent out mass mailing letters to clients about the EPP in August and October 2004. In each mailing, 2,000 letters were sent to clients from six of the nine
APPRISE Incorporated Page 67
www.appriseinc.org Summary of Findings and Recommendations
authorized providers. OEE received positive feedback that the letters motivated some clients to call the agency and raised awareness about the EPP in others.
• Limited Light Bulb Installations: OEE has revised the formula for light bulb replacements. This revision effectively limits light bulb replacements to those bulbs that are used approximately two hours or more per day. However, OEE will not limit the number of bulbs that can be installed in a home, as they do not want to eliminate cost-effective installations.
• Monitoring: There are three monitors for the EPP and each monitor is now responsible for spending ten days on site at each of three authorized providers. Monitors are working to observe each auditor at least once per year. Monitoring forms have been loaded into the Tablet PC so that monitors can enter data while they are on site.
• No Provider RFP: OEE did not issue a new RFP for providers for FY 2006. Instead, they exercised their option that was contained in the 2004 EPP RFP to extend the funding agreement for a year. This extended existing contracts until June 30, 2006. The purpose of this extension was to allow OEE to concentrate on responding to evaluation recommendations and improving the program, and to provide extra stability to the authorized providers that provide EPP services.
• Additional SMOC~ERS Enhancements: Additional improvements were made to the SMOC~ERS software, and training was conducted in June 2005.
• Comprehensive Service Policies and Procedures: OEE developed policies and procedures for Comprehensive Services. HWDMC and COAD have begun to work on their plans for providing Comprehensive Services.
B. Additional Advances Expected in Next Year
There are many additional improvements planned for the EPP in the next year.
• Baseload 201 Training: OEE has developed a set of topics that they feel are necessary for advanced training. They plan to provide this training in the next year.
• Formal Price List: OEE is considering the use of a formal price list for the next provider RFP.
• Low-Use Client Pilot: OEE hoped to introduce a low use client pilot to target PIPP clients with usage below 4,000 kWh annually in FY 2005, but did not have the time to do so. OEE will make a decision as to whether to offer this pilot in FY 2006.
• SMOC~ERS Version 3: OEE needs to make a decision as to whether to move to SMOC~ERS Version 3. This version would integrate the appliance and
APPRISE Incorporated Page 68
www.appriseinc.org Summary of Findings and Recommendations
weatherization audit, and would move to a web-based system. Such a system would provide OEE with real-time access to service delivery data, and would allow for easier invoicing.
• Implementation of Comprehensive Services: OEE will work with agencies to begin providing Comprehensive Services in FY 2006.
C. Program Administration
OEE has increased the amount of quality control provided by OEE monitors. However, the number of visits observed and inspections completed is still not sufficient. OEE should re-examine the cost-effectiveness of air conditioner measures.
1. Monitoring Has Increased, But is Still Not Sufficient
OEE requires that each of three monitors spends three days at three agencies, for a total of 90 days of observations, inspections, and technical assistance. However, over the past year only 99 jobs were observed or inspected.13
Recommendation: OEE needs to increase the level of quality control with internal or external monitors. OEE reports that they cannot hire additional staff, so they should concentrate on working with external consultants to increase quality control.
2. Air Conditioning Measures Have Not Been Implemented
Monitors report that air conditioning is one big electric use that has not been addressed by the Program.
Recommendation: OEE should analyze what other programs are providing in the way of air conditioning replacements and determine if air conditioning replacements could be a cost-effective component of the EPP.
D. Service Delivery
Areas for improvement in service delivery include increased production in Cinergy’s service territory and improved education delivery. Providers need additional training on CFL protocols, field measures, and fuel switches.
1. Refrigerator Removal and Custom Measure Installation is Still Low
SMOC~ERS data show that only about two percent of jobs receive these measures.
13 Through May 2005.
APPRISE Incorporated Page 69
www.appriseinc.org Summary of Findings and Recommendations
Recommendation: OEE should work to increase this removal rate, by providing additional incentives for removal, or by setting removal targets for agencies in the next provider RFP.
Recommendation: As the current contracts are structured, agencies do not have an incentive to install custom measures. For these measures, agencies are only reimbursed for measure expenses. Administrative costs that are incurred when installing custom measures are included in the agencies’ overall administrative fees. The provider RFP stipulated that the analyses required to determine if custom measures are cost effective is part of the agencies’ responsibilities. However, there is currently no penalty to agencies for ignoring opportunities to install custom measures. OEE should determine a reasonable target for these measures, and explicitly define a custom measure target and penalty structure if the target is not reached. These requirements should be included in the next provider RFP.
2. Production in Cinergy’s Service Territory is Still Low
The 2004 Process Evaluation report found that production should be increased in Cinergy and DP&L service territories, as only 40 and 20 percent of the funding in these areas had been expended and the percent of eligible clients served was only 11 percent and 8 percent. Analysis of FY 2005 data shows that production in Cinergy’s service territory is still low. As of March 2005, only 19 percent of the funds awarded for this territory had been expended.
Recommendation: OEE should work to find additional service providers who can serve Cinergy’s service territory.
3. Education Still Needs Improvement
Monitors reported that the education component of the audit is still the weak point. Many auditors are still not doing an adequate job of explaining the Program, establishing and confirming the partnership, reviewing the clients’ bills, explaining what will be done during the visit, and reviewing the reports at the end of the visit.
Client surveys, impact evaluation results, evaluator observations and inspections, also show that client education needs to be improved. While it is apparent that auditors need to improve their client communication skills, it is also clear that auditors are not fulfilling some of the basic requirements of the program. These elements include program explanations, bill explanations, and report explanations. One OEE monitor reported that some providers do not print out the SMOC~ERS top ten electric uses and usage by appliance reports because of the expense of the ink for the portable printers.
Recommendation: OEE should require that these reports be printed at the clients’ home and withhold administrative fees from agencies who continue to ignore this requirement. Additional education training and monitoring should be conducted.
APPRISE Incorporated Page 70

www.appriseinc.org Summary of Findings and Recommendations
4. Providers are not Following CFL Protocols
Nearly 30 percent of clients reported that the provider left bulbs for them to install after the provider left the home. This practice is inconsistent with Program protocols, and it may lead to CFLs not being installed or not being installed in cost-effective locations.
Recommendation: When OEE monitors determine that auditors have left bulbs without installing them, OEE should not reimburse agencies for the cost of these bulbs.
5. CFL Failure Rate is High
Based on the light bulb survey, we estimated that six percent of CFLs that are replaced fail within six months and nine percent fail within one year.
Recommendation: OEE should require agencies to replace bulbs that fail within one year after installation. OEE should determine whether it would be cost-effective to return to homes after a certain time period to determine if replacements and/or additional installations needed to be made.
6. Managers and Auditors are Not Comfortable with Field Measures and Fuel Switches
Managers and auditors were likely to report in the agency survey that more training was needed on field measures and fuel switches. Many also reported that they had not implemented these measures because of the need for a better understanding of the procedures.
Recommendation: OEE should provide additional training on these measures.
E. Technology
The use of technology has improved considerably. All service providers have begun using the Tablet PC, a significant improvement over the PDA. SMOC~ERS is now functioning well, and providers have gotten better at using the software.
APPRISE Incorporated Page 71

www.appriseinc.org Appendix
Appendix
APPRISE Incorporated Appendix


