11
OHIO
OHIO

Suggested Citation:
Institute for Research on Higher Education. (2016). College Affordability Diagnosis: Ohio. Philadelphia, PA: Institute for Research on Higher Education, Graduate School of Education, University of Pennsylvania. http://www2.gse.upenn.edu/irhe/affordability-diagnosis
Image by twenty20.com/@michellehaha
1
COLLEGE AFFORDABILITY DIAGNOSIS
Visit www2.gse.upenn.edu/irhe/affordability-diagnosis for interactive map.
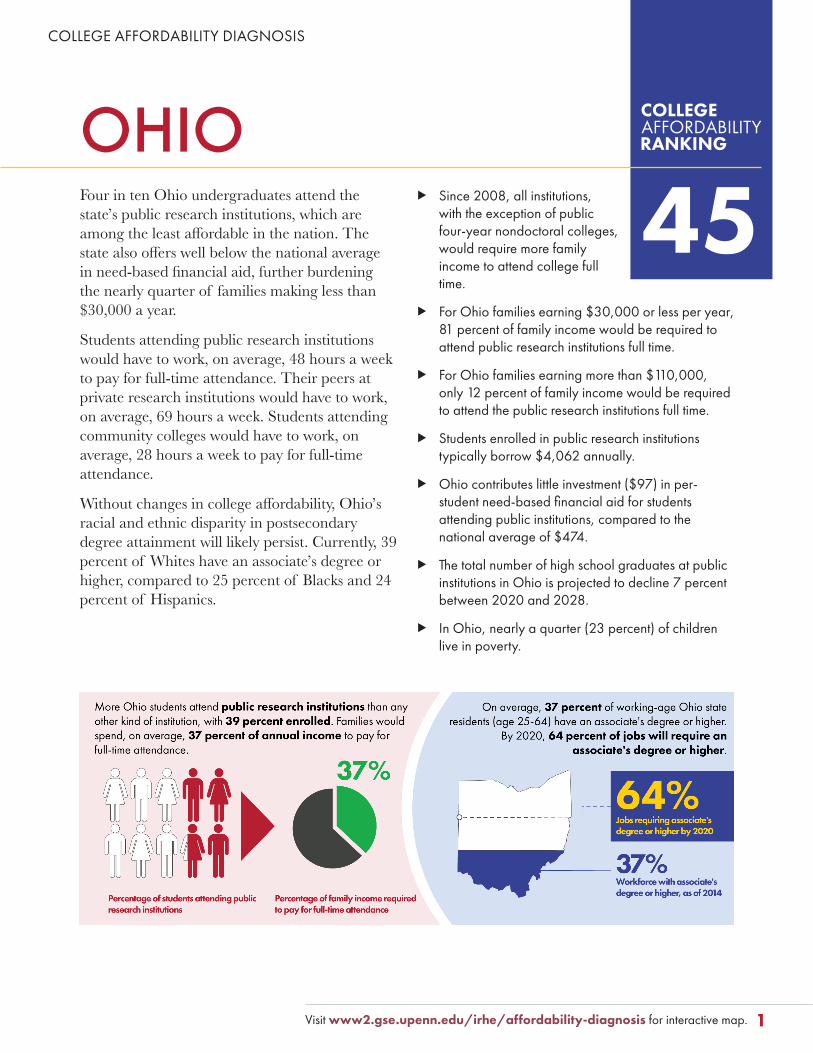
45 OHIOFour in ten Ohio undergraduates attend the state’s public research institutions, which are among the least affordable in the nation. The state also offers well below the national average in need-based financial aid, further burdening the nearly quarter of families making less than $30,000 a year.
Students attending public research institutions would have to work, on average, 48 hours a week to pay for full-time attendance. Their peers at private research institutions would have to work, on average, 69 hours a week. Students attending community colleges would have to work, on average, 28 hours a week to pay for full-time attendance.
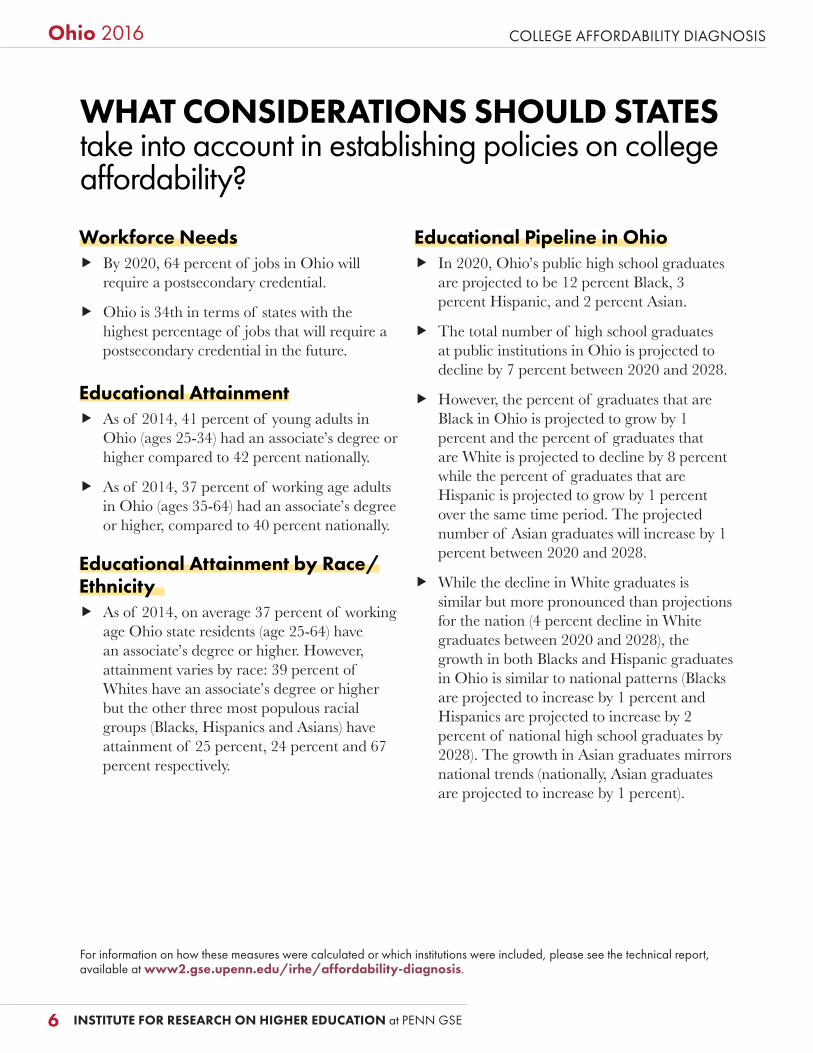
Without changes in college affordability, Ohio’s racial and ethnic disparity in postsecondary degree attainment will likely persist. Currently, 39 percent of Whites have an associate’s degree or higher, compared to 25 percent of Blacks and 24 percent of Hispanics.
� Since 2008, all institutions, with the exception of public four-year nondoctoral colleges, would require more family income to attend college full time.
� For Ohio families earning $30,000 or less per year, 81 percent of family income would be required to attend public research institutions full time.
� For Ohio families earning more than $110,000, only 12 percent of family income would be required to attend the public research institutions full time.
� Students enrolled in public research institutions typically borrow $4,062 annually.
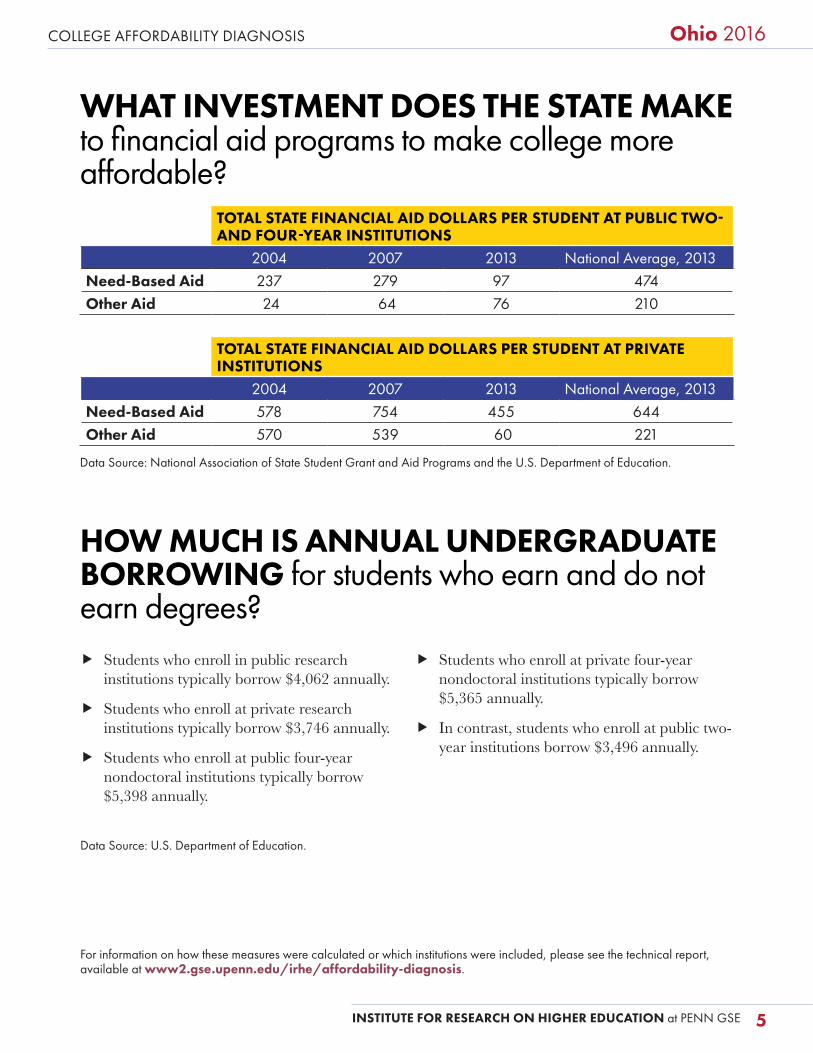
� Ohio contributes little investment ($97) in per-student need-based financial aid for students attending public institutions, compared to the national average of $474.
� The total number of high school graduates at public institutions in Ohio is projected to decline 7 percent between 2020 and 2028.
� In Ohio, nearly a quarter (23 percent) of children live in poverty.
Ohio 2016
INSTITUTE FOR RESEARCH ON HIGHER EDUCATION at PENN GSE2
COLLEGE AFFORDABILITY DIAGNOSIS
For information on how these measures were calculated or which institutions were included, please see the technical report, available at www2.gse.upenn.edu/irhe/affordability-diagnosis.
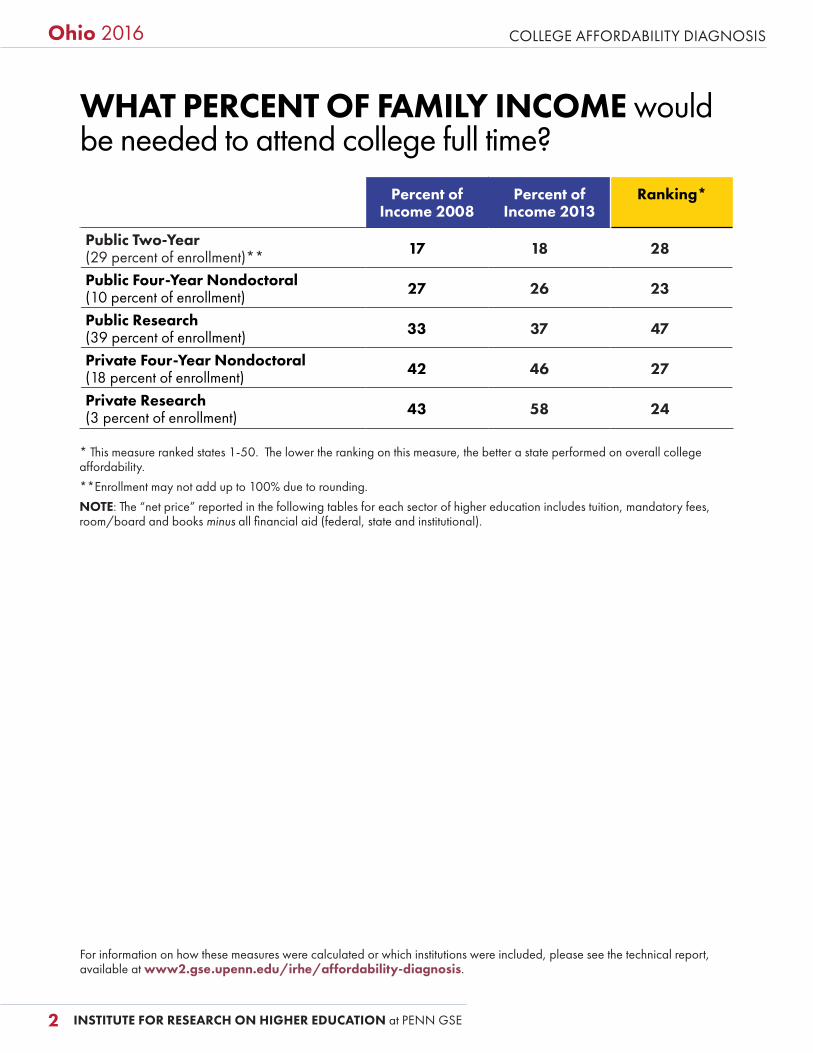
WHAT PERCENT OF FAMILY INCOME would be needed to attend college full time?
Percent of Income 2008
Percent of Income 2013
Ranking*
Public Two-Year (29 percent of enrollment)** 17 18 28
Public Four-Year Nondoctoral(10 percent of enrollment) 27 26 23
Public Research(39 percent of enrollment) 33 37 47
Private Four-Year Nondoctoral(18 percent of enrollment) 42 46 27
Private Research(3 percent of enrollment) 43 58 24
* This measure ranked states 1-50. The lower the ranking on this measure, the better a state performed on overall college affordability.
**Enrollment may not add up to 100% due to rounding.
NOTE: The “net price” reported in the following tables for each sector of higher education includes tuition, mandatory fees, room/board and books minus all financial aid (federal, state and institutional).
Ohio 2016
3INSTITUTE FOR RESEARCH ON HIGHER EDUCATION at PENN GSE
For information on how these measures were calculated or which institutions were included, please see the technical report, available at www2.gse.upenn.edu/irhe/affordability-diagnosis.
COLLEGE AFFORDABILITY DIAGNOSIS
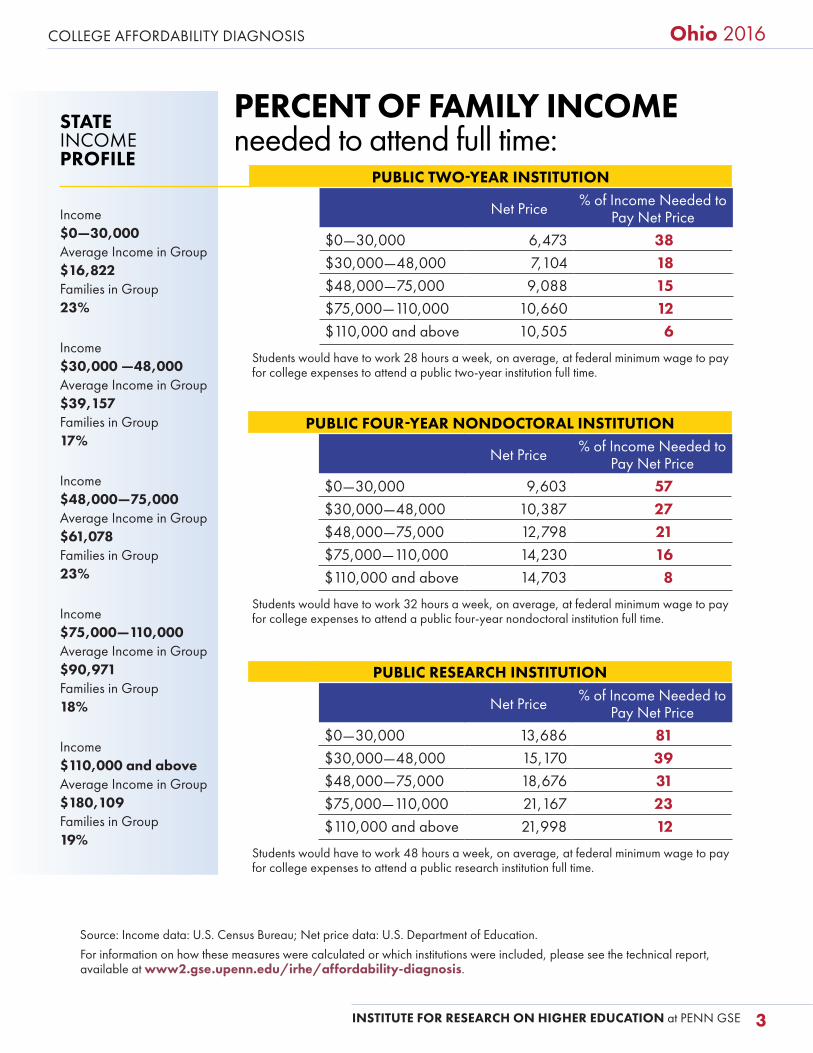
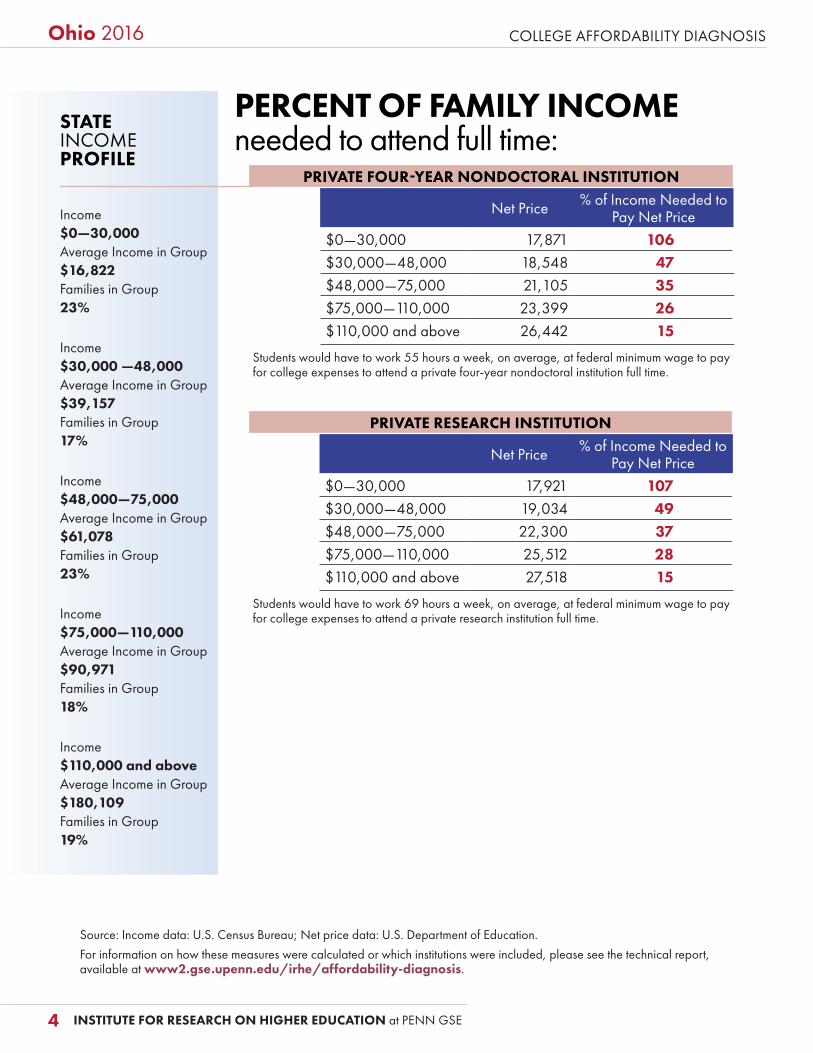
PERCENT OF FAMILY INCOME needed to attend full time:
PUBLIC FOUR-YEAR NONDOCTORAL INSTITUTION
Net Price % of Income Needed to Pay Net Price
$0—30,000 9,603 57$30,000—48,000 10,387 27$48,000—75,000 12,798 21$75,000—110,000 14,230 16$110,000 and above 14,703 8
Students would have to work 32 hours a week, on average, at federal minimum wage to pay for college expenses to attend a public four-year nondoctoral institution full time.
PUBLIC RESEARCH INSTITUTION
Net Price % of Income Needed to Pay Net Price
$0—30,000 13,686 81$30,000—48,000 15,170 39$48,000—75,000 18,676 31$75,000—110,000 21,167 23$110,000 and above 21,998 12
Students would have to work 48 hours a week, on average, at federal minimum wage to pay for college expenses to attend a public research institution full time.
STATE INCOME PROFILE
Income$0—30,000Average Income in Group$16,822Families in Group23%
Income$30,000 —48,000Average Income in Group$39,157Families in Group17%
Income$48,000—75,000Average Income in Group$61,078Families in Group23%
Income$75,000—110,000Average Income in Group$90,971Families in Group18%
Income$110,000 and aboveAverage Income in Group$180,109Families in Group19%
PUBLIC TWO-YEAR INSTITUTION
Net Price % of Income Needed to Pay Net Price
$0—30,000 6,473 38$30,000—48,000 7,104 18$48,000—75,000 9,088 15$75,000—110,000 10,660 12$110,000 and above 10,505 6
Students would have to work 28 hours a week, on average, at federal minimum wage to pay for college expenses to attend a public two-year institution full time.
Source: Income data: U.S. Census Bureau; Net price data: U.S. Department of Education.
Ohio 2016
INSTITUTE FOR RESEARCH ON HIGHER EDUCATION at PENN GSE4
COLLEGE AFFORDABILITY DIAGNOSIS
For information on how these measures were calculated or which institutions were included, please see the technical report, available at www2.gse.upenn.edu/irhe/affordability-diagnosis.
PERCENT OF FAMILY INCOME needed to attend full time:
PRIVATE RESEARCH INSTITUTION
Net Price % of Income Needed to Pay Net Price
$0—30,000 17,921 107$30,000—48,000 19,034 49$48,000—75,000 22,300 37$75,000—110,000 25,512 28$110,000 and above 27,518 15
Students would have to work 69 hours a week, on average, at federal minimum wage to pay for college expenses to attend a private research institution full time.
PRIVATE FOUR-YEAR NONDOCTORAL INSTITUTION
Net Price % of Income Needed to Pay Net Price
$0—30,000 17,871 106$30,000—48,000 18,548 47$48,000—75,000 21,105 35$75,000—110,000 23,399 26$110,000 and above 26,442 15
Students would have to work 55 hours a week, on average, at federal minimum wage to pay for college expenses to attend a private four-year nondoctoral institution full time.
Source: Income data: U.S. Census Bureau; Net price data: U.S. Department of Education.
STATE INCOME PROFILE
Income$0—30,000Average Income in Group$16,822Families in Group23%
Income$30,000 —48,000Average Income in Group$39,157Families in Group17%
Income$48,000—75,000Average Income in Group$61,078Families in Group23%
Income$75,000—110,000Average Income in Group$90,971Families in Group18%
Income$110,000 and aboveAverage Income in Group$180,109Families in Group19%
Ohio 2016
5
COLLEGE AFFORDABILITY DIAGNOSIS
INSTITUTE FOR RESEARCH ON HIGHER EDUCATION at PENN GSE
For information on how these measures were calculated or which institutions were included, please see the technical report, available at www2.gse.upenn.edu/irhe/affordability-diagnosis.
WHAT INVESTMENT DOES THE STATE MAKE to financial aid programs to make college more affordable?
TOTAL STATE FINANCIAL AID DOLLARS PER STUDENT AT PUBLIC TWO- AND FOUR-YEAR INSTITUTIONS
2004 2007 2013 National Average, 2013Need-Based Aid 237 279 97 474Other Aid 24 64 76 210
TOTAL STATE FINANCIAL AID DOLLARS PER STUDENT AT PRIVATE INSTITUTIONS
2004 2007 2013 National Average, 2013Need-Based Aid 578 754 455 644Other Aid 570 539 60 221
Data Source: National Association of State Student Grant and Aid Programs and the U.S. Department of Education.
HOW MUCH IS ANNUAL UNDERGRADUATE BORROWING for students who earn and do not earn degrees?
� Students who enroll in public research institutions typically borrow $4,062 annually.
� Students who enroll at private research institutions typically borrow $3,746 annually.
� Students who enroll at public four-year nondoctoral institutions typically borrow $5,398 annually.
� Students who enroll at private four-year nondoctoral institutions typically borrow $5,365 annually.
� In contrast, students who enroll at public two-year institutions borrow $3,496 annually.
Data Source: U.S. Department of Education.
Ohio 2016
INSTITUTE FOR RESEARCH ON HIGHER EDUCATION at PENN GSE6
COLLEGE AFFORDABILITY DIAGNOSIS
For information on how these measures were calculated or which institutions were included, please see the technical report, available at www2.gse.upenn.edu/irhe/affordability-diagnosis.
WHAT CONSIDERATIONS SHOULD STATES take into account in establishing policies on college affordability?
Workforce Needs � By 2020, 64 percent of jobs in Ohio will
require a postsecondary credential.
� Ohio is 34th in terms of states with the highest percentage of jobs that will require a postsecondary credential in the future.
Educational Attainment � As of 2014, 41 percent of young adults in
Ohio (ages 25-34) had an associate’s degree or higher compared to 42 percent nationally.
� As of 2014, 37 percent of working age adults in Ohio (ages 35-64) had an associate’s degree or higher, compared to 40 percent nationally.
Educational Attainment by Race/Ethnicity
� As of 2014, on average 37 percent of working age Ohio state residents (age 25-64) have an associate’s degree or higher. However, attainment varies by race: 39 percent of Whites have an associate’s degree or higher but the other three most populous racial groups (Blacks, Hispanics and Asians) have attainment of 25 percent, 24 percent and 67 percent respectively.
Educational Pipeline in Ohio � In 2020, Ohio’s public high school graduates
are projected to be 12 percent Black, 3 percent Hispanic, and 2 percent Asian.
� The total number of high school graduates at public institutions in Ohio is projected to decline by 7 percent between 2020 and 2028.
� However, the percent of graduates that are Black in Ohio is projected to grow by 1 percent and the percent of graduates that are White is projected to decline by 8 percent while the percent of graduates that are Hispanic is projected to grow by 1 percent over the same time period. The projected number of Asian graduates will increase by 1 percent between 2020 and 2028.
� While the decline in White graduates is similar but more pronounced than projections for the nation (4 percent decline in White graduates between 2020 and 2028), the growth in both Blacks and Hispanic graduates in Ohio is similar to national patterns (Blacks are projected to increase by 1 percent and Hispanics are projected to increase by 2 percent of national high school graduates by 2028). The growth in Asian graduates mirrors national trends (nationally, Asian graduates are projected to increase by 1 percent).
7
Ohio 2016
INSTITUTE FOR RESEARCH ON HIGHER EDUCATION at PENN GSE
For information on how these measures were calculated or which institutions were included, please see the technical report, available at www2.gse.upenn.edu/irhe/affordability-diagnosis.
COLLEGE AFFORDABILITY DIAGNOSIS
Children in Poverty � The percent of children living in poverty in
Ohio increased between 2005 and 2013, from 19 percent to 23 percent.
� In 2013 Ohio was ranked 31st in terms of percent of children living in poverty. Rank order is from lowest to highest percentages of poverty.
Student Share of Total State and Tuition Revenues for Public Higher Education
� In Ohio, total student share of state and net tuition revenues per full time student was 38 percent in 1989, 41 percent in 2000, and 63 percent in 2014, adjusted for inflation. This pattern shows that net tuition revenues were increasing as a share of higher education funding from 1989 to 2000 but after the 2007-08 recession net tuition revenues increased even more rapidly.
INSTITUTE FOR RESEARCH ON HIGHER EDUCATION at PENN GSE8
Ohio 2016
For information on how these measures were calculated or which institutions were included, please see the technical report, available at www2.gse.upenn.edu/irhe/affordability-diagnosis.
COLLEGE AFFORDABILITY DIAGNOSIS
POLICY QUESTIONS FOR STATE LEADERS
� In what types of higher education institutions (sectors) has the state lost ground in college affordability?
� What are the economic circumstances of families in the state (by income quintiles, by different regions of the state, etc.)? What are the implications for college affordability?
� What is the projected demand for an educated workforce in the state? How far is your state from addressing this demand? To what extent is college affordability one of the barriers in educating more state residents?
� What are the gaps in college attainment between Whites and minority groups in your state? How can state policies on college affordability help to narrow these gaps?
� How is tuition policy related, if at all, to the income of the students and families that the state must educate?
� If tuition policy is delegated to public institutions, how does the state provide oversight to ensure that tuition and other educational costs are affordable for students and families?
� In what ways can state policies related to tuition be more tightly coupled with state policies on institutional appropriations and financial aid to address college affordability?
� To what extent do tuition policies encourage access to higher education and completion of certificates and degrees? How do financial aid policies address the needs of both young and working-age students?
� In what ways has the state provided incentives for institutions to improve efficiency and productivity in order to reduce the overall costs to students?
� Research shows that students who work more than 20 hours a week are less likely to make progress toward or complete their certificate or degree programs. How is the state alleviating the need for students to work more than 20 hours a week so that they can focus more on earning their certificates and degrees?
� How much are students borrowing relative to the percent of family income needed to pay for postsecondary education?
� Are all state policies that influence college affordability inadvertently stratifying higher education by income or race?


