23
2011 Ohio Oil and Gas Summary Division of Oil and Gas Resources Management
2011Ohio Oil and Gas Summary
Division of Oil and Gas Resources Management

Division of Oil and Gas Resources Management
In October 2011, the Oil and Gas Program, formerly under the Division of Mineral Resources Management, became a stand-alone division within the Ohio Department of Natural Resources. Since 1965, staff has effectively regulated oil and gas production in this state.
The division is responsible for regulating the permitting, drilling and production of Ohio’s oil and natural gas resources. The division also plugs abandoned oil and gas wells, ensures protection of freshwater resources, and maintains a comprehensive database of Ohio’s production wells.
Expertise is provided by a professional staff of geologists, soil scientists and hydrogeologists. Program support services include permitting, hydrology, bonding, field inspection and enforcement, and administration support.
As Ohio celebrates the 150th anniversary of the first oil and gas well drilled in the state, the division is preparing for the future of oil and gas development in Ohio—exploration of the Utica and Marcellus shale formations. Senate Bill 165, effective in June 2010, significantly updated the state’s oil and gas laws. The legislation focused on three areas: updating oil and gas law to improve protection of public health, safety and the environment; improving the state’s urban drilling regulations; and providing a stable source of funding for the oil and gas program.
Cover photo - Division of Oil and Gas Resources ManagementInset photos - Ohio Oil and Gas Energy Education Program
Introduction
This forty-seventh edition of the Ohio Oil & Gas Summary (The McCormac Report) remains dedicated to accurately presenting statistics that may reflect trends important to Ohio’s oil and gas industry, citizens and other govermental agencies. This report includes data submitted through March 2, 2012.
You may also note that some 2010 statistics have been adjusted to include well completion reports received after last year’s cut-off date. The 2010 report estimated 431 wells were drilled; the total number has been revised to 427. There are no major revisions in this year’s report.
Highlights include:
• 5,722 registered well owners, including 4,283 domestic owners operating 64,481 wells.
• Issued 1,533 permits, including 690 drilling permits.
• Issued 131 urbanized area permits in 19 counties.
• Drilled an estimated 460 oil and gas wells in 42 of Ohio’s 88 counties.
• Knox and Stark counties were the most active with 43 wells drilled.
• Horizontal well drilled to a record-setting length of 14,445 feet in Carroll County.
• 355 wells were plugged, including 15 contracted by the Orphan Well Program.
• Produced 4,852,964 barrels of crude oil, at an average price of $90.06 per barrel.
• Produced more than 73 billion cubic feet of natural gas, at an average price of $4.28 per mcf.
• The combined market value of crude oil and natural gas production was $747,714,808.
To make oil and gas well data more accessible, the division:
• Distributed 242 copies of RBDMS, its oil and gas well database.
Mike McCormacManager, Oil and Gas Permitting Program
i
TABLE OF CONTENTS
Page
Introduction .....................................................................................................................................................i
Oil & Gas Industry Activities ..........................................................................................................................
Permitting ........................................................................................................................................1 Bonding/Ownership ........................................................................................................................1 Drilling ............................................................................................................................................2 Completions ....................................................................................................................................2 Formation Highlights ......................................................................................................................2 Wells Completed by Month and Owner ..........................................................................................2 Wells Completed by Type of Tool ...................................................................................................2 Plug-back and Deepen Operations ..................................................................................................3 Ten Most Active Counties ...............................................................................................................4 Directional Drilling .........................................................................................................................4 Exploratory Wells ...........................................................................................................................4 County Drilling Depth Records ......................................................................................................8 Production .......................................................................................................................................9 Market Value .................................................................................................................................10 Plugging Activity ..........................................................................................................................10
Figures..............................................................................................................................................................
(1) Oil & Gas Permits Issued 2009 - 2011 ................................................................................1 (2) Drill Permits vs. Wells Drilled 2002 - 2011 .........................................................................2 (3) Wells Drilled and Completions Received by County ..........................................................3 (4) Wells Completed by Month 20010 - 2011 ...........................................................................7 (5) Wells Completed by Owner .................................................................................................7 (6) Development vs. Exploratory Wells ....................................................................................8 (7) Oil & Gas Production 2002 - 2011 ......................................................................................9 (8) Dollar Value of Oil & Gas 2002 - 2011 .............................................................................10 (9) Wells Plugged vs. Wells Drilled 2002 - 2011 ....................................................................11(10) Wells Plugged by County ..................................................................................................11
Tables ...............................................................................................................................................................
(I) Drilling Operations by Type of Well ....................................................................................4 (II) Oil and Gas Completion Statistics by County .....................................................................5(III) Oil and Gas Completion Statistics by Producing Zone .......................................................6(IV) Ten Most Active Counties....................................................................................................8 (V) Crude Oil & Natural Gas Production, Reserves & Consumption 2002 - 2011 ...................9(VI) Average Wellhead Price of Oil & Gas 2002 - 2011 ...........................................................10
Appendix ..........................................................................................................................................................
(I) Wells Drilled in Ohio 1888 - 2011 .....................................................................................12 (II) County Drilling Depth Records .........................................................................................16
ii
Permitting
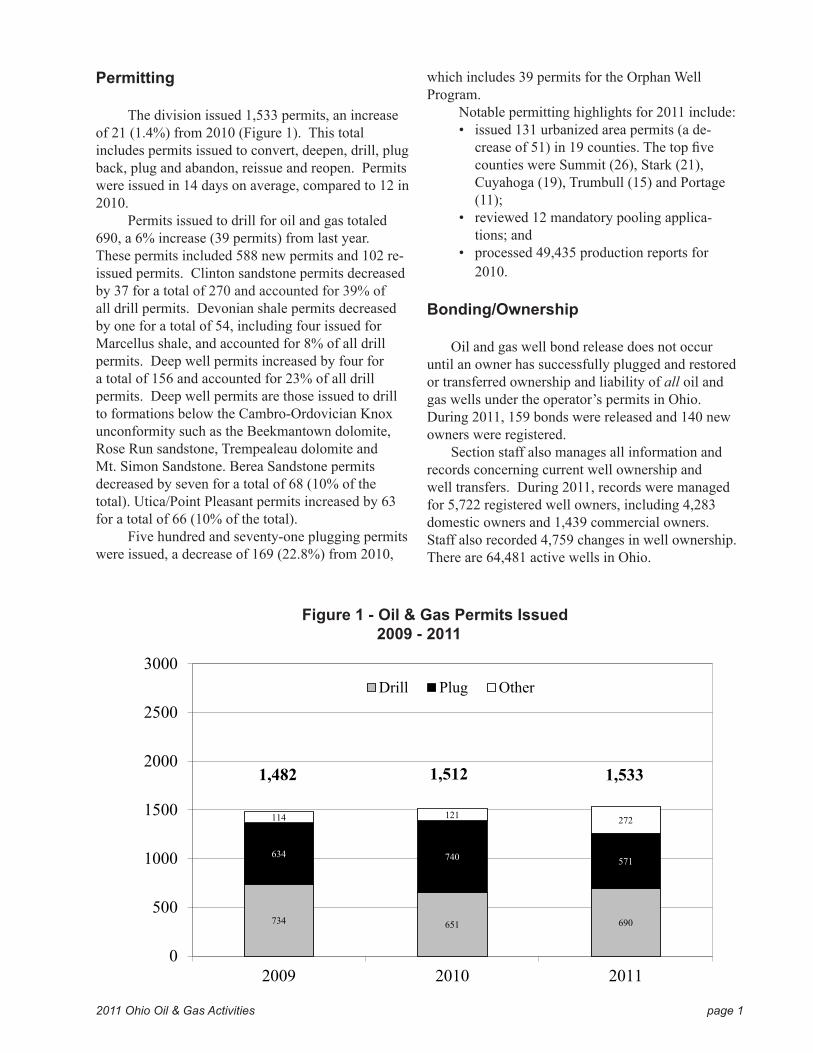
The division issued 1,533 permits, an increase of 21 (1.4%) from 2010 (Figure 1). This total includes permits issued to convert, deepen, drill, plug back, plug and abandon, reissue and reopen. Permits were issued in 14 days on average, compared to 12 in 2010.
Permits issued to drill for oil and gas totaled 690, a 6% increase (39 permits) from last year. These permits included 588 new permits and 102 re- issued permits. Clinton sandstone permits decreased by 37 for a total of 270 and accounted for 39% of all drill permits. Devonian shale permits decreased by one for a total of 54, including four issued for Marcellus shale, and accounted for 8% of all drill permits. Deep well permits increased by four for a total of 156 and accounted for 23% of all drill permits. Deep well permits are those issued to drill to formations below the Cambro-Ordovician Knox unconformity such as the Beekmantown dolomite, Rose Run sandstone, Trempealeau dolomite and Mt. Simon Sandstone. Berea Sandstone permits decreased by seven for a total of 68 (10% of the total). Utica/Point Pleasant permits increased by 63 for a total of 66 (10% of the total).
Five hundred and seventy-one plugging permits were issued, a decrease of 169 (22.8%) from 2010,
which includes 39 permits for the Orphan Well Program.
Notable permitting highlights for 2011 include:• issued 131 urbanized area permits (a de-
crease of 51) in 19 counties. The top five counties were Summit (26), Stark (21), Cuyahoga (19), Trumbull (15) and Portage (11);
• reviewed 12 mandatory pooling applica- tions; and
• processed 49,435 production reports for 2010.
Bonding/Ownership
Oil and gas well bond release does not occur until an owner has successfully plugged and restored or transferred ownership and liability of all oil and gas wells under the operator’s permits in Ohio. During 2011, 159 bonds were released and 140 new owners were registered. Section staff also manages all information and records concerning current well ownership and well transfers. During 2011, records were managed for 5,722 registered well owners, including 4,283 domestic owners and 1,439 commercial owners. Staff also recorded 4,759 changes in well ownership. There are 64,481 active wells in Ohio.
2011 Ohio Oil & Gas Activities page 1
Figure 1 - Oil & Gas Permits Issued 2009 - 2011
734 651 690
634 740 571
114 121 272
0
500
1000
1500
2000
2500
3000
2009 2010 2011
Drill Plug Other
1,533 1,482 1,512
Drilling
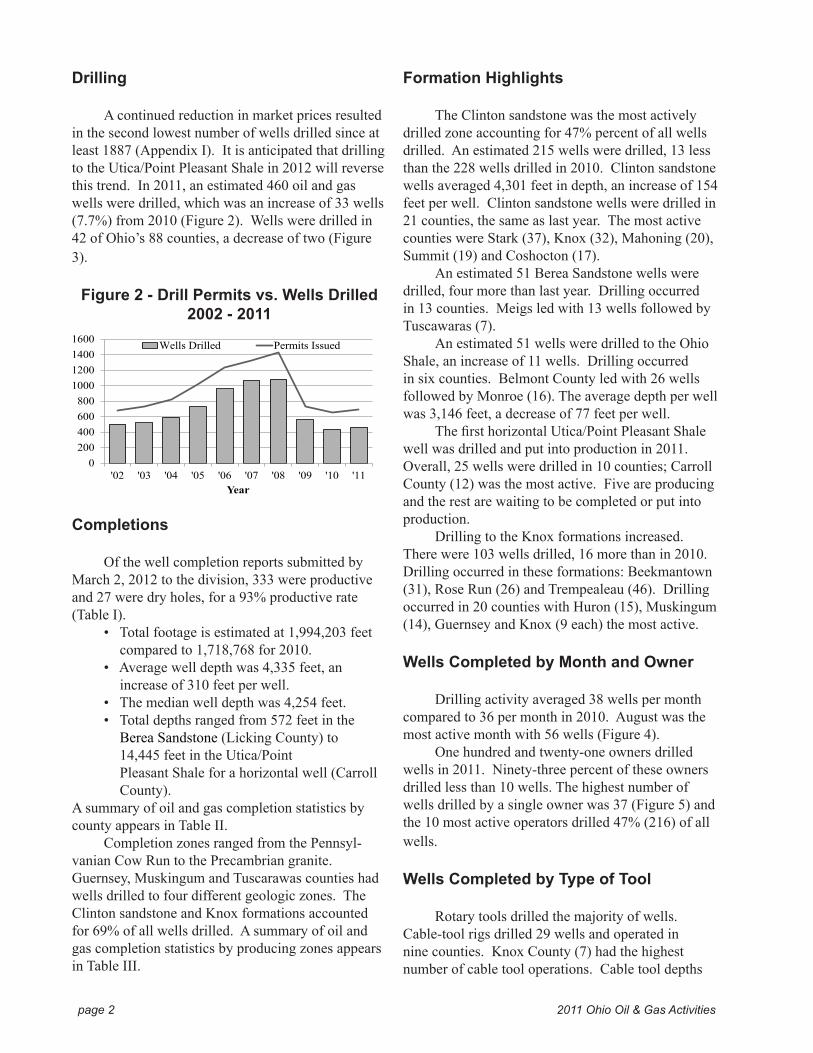
A continued reduction in market prices resulted in the second lowest number of wells drilled since at least 1887 (Appendix I). It is anticipated that drilling to the Utica/Point Pleasant Shale in 2012 will reverse this trend. In 2011, an estimated 460 oil and gas wells were drilled, which was an increase of 33 wells (7.7%) from 2010 (Figure 2). Wells were drilled in 42 of Ohio’s 88 counties, a decrease of two (Figure 3).
Figure 2 - Drill Permits vs. Wells Drilled 2002 - 2011
Completions
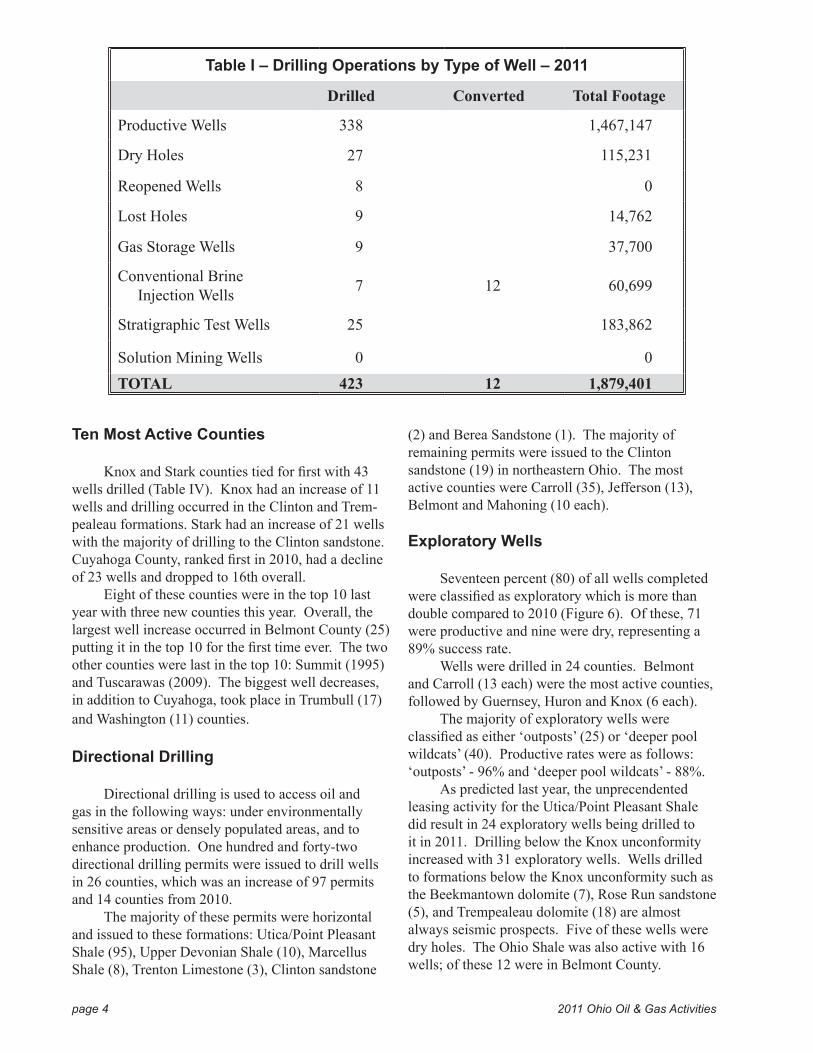
Of the well completion reports submitted by March 2, 2012 to the division, 333 were productive and 27 were dry holes, for a 93% productive rate (Table I).
• Total footage is estimated at 1,994,203 feet compared to 1,718,768 for 2010.
• Average well depth was 4,335 feet, an increase of 310 feet per well.• The median well depth was 4,254 feet.• Total depths ranged from 572 feet in the
Berea Sandstone (Licking County) to 14,445 feet in the Utica/Point Pleasant Shale for a horizontal well (Carroll County). A summary of oil and gas completion statistics by county appears in Table II.
Completion zones ranged from the Pennsyl-vanian Cow Run to the Precambrian granite. Guernsey, Muskingum and Tuscarawas counties had wells drilled to four different geologic zones. The Clinton sandstone and Knox formations accounted for 69% of all wells drilled. A summary of oil and gas completion statistics by producing zones appears in Table III.
page 2 2011 Ohio Oil & Gas Activities
Formation Highlights
The Clinton sandstone was the most active ly drilled zone accounting for 47% percent of all wells drilled. An estimated 215 wells were drilled, 13 less than the 228 wells drilled in 2010. Clinton sandstone wells averaged 4,301 feet in depth, an increase of 154 feet per well. Clinton sandstone wells were drilled in 21 counties, the same as last year. The most active counties were Stark (37), Knox (32), Mahoning (20), Summit (19) and Coshocton (17).
An estimated 51 Berea Sandstone wells were drilled, four more than last year. Drilling occurred in 13 counties. Meigs led with 13 wells followed by Tuscawaras (7).
An estimated 51 wells were drilled to the Ohio Shale, an increase of 11 wells. Drilling occurred in six counties. Belmont County led with 26 wells followed by Monroe (16). The average depth per well was 3,146 feet, a decrease of 77 feet per well.
The first horizontal Utica/Point Pleasant Shale well was drilled and put into production in 2011. Overall, 25 wells were drilled in 10 counties; Carroll County (12) was the most active. Five are producing and the rest are waiting to be completed or put into production.
Drilling to the Knox formations increased. There were 103 wells drilled, 16 more than in 2010. Drilling occurred in these formations: Beekmantown (31), Rose Run (26) and Trempealeau (46). Drilling occurred in 20 counties with Huron (15), Muskingum (14), Guernsey and Knox (9 each) the most active.
Wells Completed by Month and Owner
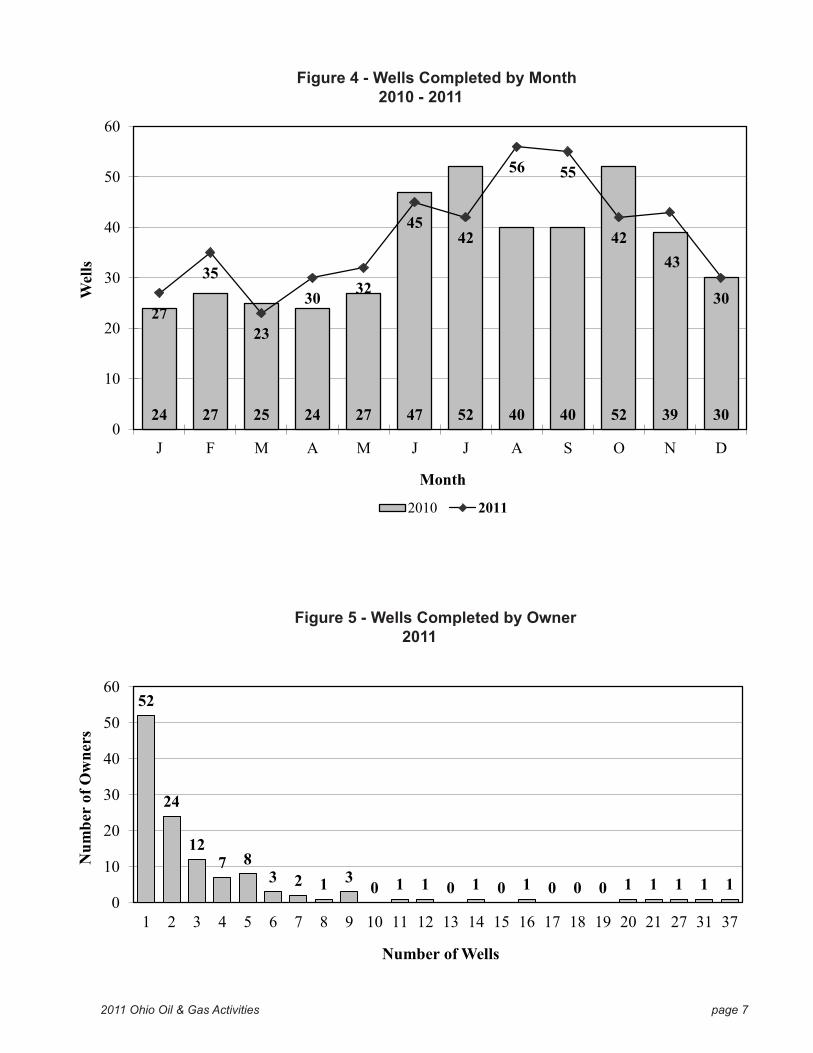
Drilling activity averaged 38 wells per month compared to 36 per month in 2010. August was the most active month with 56 wells (Figure 4).
One hundred and twenty-one owners drilled wells in 2011. Ninety-three percent of these owners drilled less than 10 wells. The highest number of wells drilled by a single owner was 37 (Figure 5) and the 10 most active operators drilled 47% (216) of all wells.
Wells Completed by Type of Tool
Rotary tools drilled the majority of wells. Cable-tool rigs drilled 29 wells and operated in nine counties. Knox County (7) had the highest number of cable tool operations. Cable tool depths
0200400600800
1000120014001600
'02 '03 '04 '05 '06 '07 '08 '09 '10 '11Year
Wells Drilled Permits Issued

ranged from 572 feet (Licking County) to 3,316 feet (Coshocton County). The average depth per well drilled by cable tool was 1,872 feet, a decrease of 36 feet; rotary-drilled wells averaged 4,500 feet, an increase of 270 feet per well.
2011 Ohio Oil & Gas Activities page 3
Figure 3 - Wells Drilled and Completions Received by County 2011
Plug-back and Deepen Operations
Four wells were dry in their permitted formation but plugged back to produce a shallower zone. Another 31 existing wells were plugged back to producing zones; no wells were drilled to a deeper formation.
page 4 2011 Ohio Oil & Gas Activities
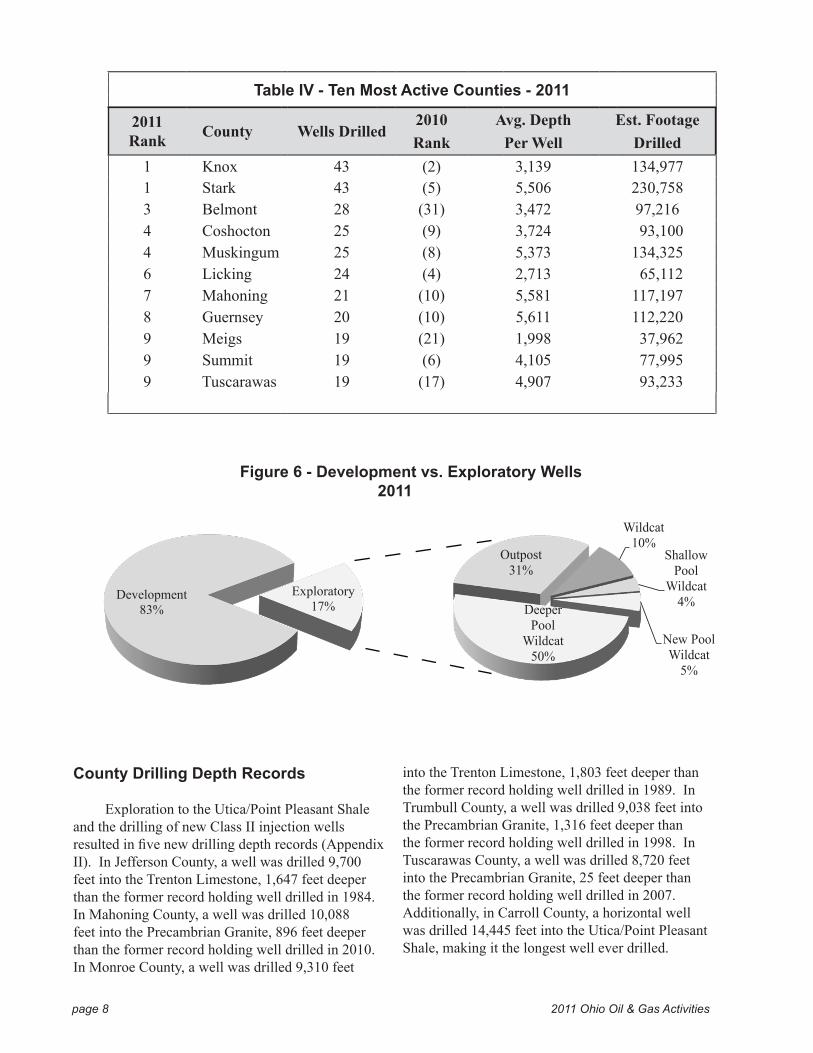
Ten Most Active Counties
Knox and Stark counties tied for first with 43 wells drilled (Table IV). Knox had an increase of 11 wells and drilling occurred in the Clinton and Trem-pealeau formations. Stark had an increase of 21 wells with the majority of drilling to the Clinton sandstone. Cuyahoga County, ranked first in 2010, had a decline of 23 wells and dropped to 16th overall.
Eight of these counties were in the top 10 last year with three new counties this year. Overall, the largest well increase occurred in Belmont County (25) putting it in the top 10 for the first time ever. The two other counties were last in the top 10: Summit (1995) and Tuscarawas (2009). The biggest well decreases, in addition to Cuyahoga, took place in Trumbull (17) and Washington (11) counties.
Directional Drilling
Directional drilling is used to access oil and gas in the following ways: under environmentally sensitive areas or densely populated areas, and to enhance production. One hundred and forty-two directional drilling permits were issued to drill wells in 26 counties, which was an increase of 97 permits and 14 counties from 2010.
The majority of these permits were horizontal and issued to these formations: Utica/Point Pleasant Shale (95), Upper Devonian Shale (10), Marcellus Shale (8), Trenton Limestone (3), Clinton sandstone
(2) and Berea Sandstone (1). The majority of remaining permits were issued to the Clinton sandstone (19) in northeastern Ohio. The most active counties were Carroll (35), Jefferson (13), Belmont and Mahoning (10 each).
Exploratory Wells
Seventeen percent (80) of all wells completed were classified as exploratory which is more than double compared to 2010 (Figure 6). Of these, 71 were productive and nine were dry, representing a 89% success rate.
Wells were drilled in 24 counties. Belmont and Carroll (13 each) were the most active counties, followed by Guernsey, Huron and Knox (6 each).
The majority of exploratory wells were classified as either ‘outposts’ (25) or ‘deeper pool wildcats’ (40). Productive rates were as follows: ‘outposts’ - 96% and ‘deeper pool wildcats’ - 88%.
As predicted last year, the unprecendented leasing activity for the Utica/Point Pleasant Shale did result in 24 exploratory wells being drilled to it in 2011. Drilling below the Knox unconformity increased with 31 exploratory wells. Wells drilled to formations below the Knox unconformity such as the Beekmantown dolomite (7), Rose Run sandstone (5), and Trempealeau dolomite (18) are almost always seismic prospects. Five of these wells were dry holes. The Ohio Shale was also active with 16 wells; of these 12 were in Belmont County.
Table I – Drilling Operations by Type of Well – 2011
Drilled Converted Total Footage
Productive Wells 338 1,467,147
Dry Holes 27 115,231
Reopened Wells 8 0
Lost Holes 9 14,762
Gas Storage Wells 9 37,700
Conventional Brine Injection Wells 7 12 60,699
Stratigraphic Test Wells 25 183,862
Solution Mining Wells 0 0TOTAL 423 12 1,879,401
2011 Ohio Oil & Gas Activities page 5
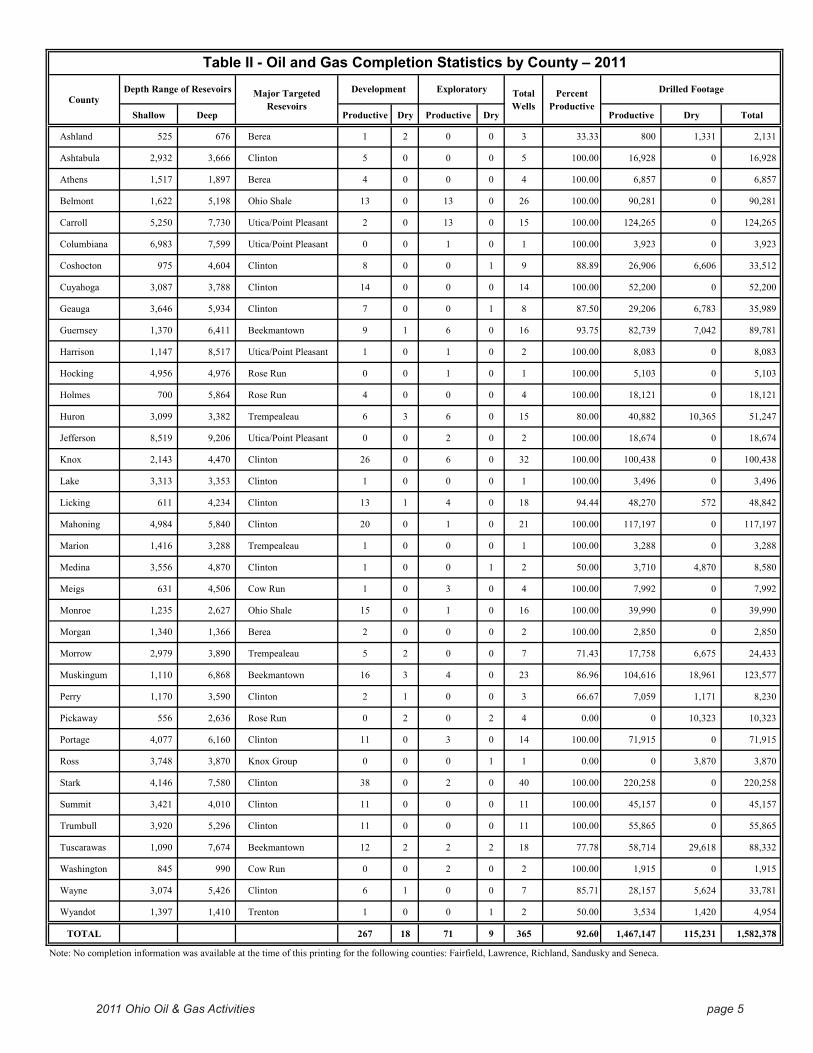
Shallow Deep Productive Dry Productive Dry Productive Dry Total
Ashland 525 676 Berea 1 2 0 0 3 33.33 800 1,331 2,131
Ashtabula 2,932 3,666 Clinton 5 0 0 0 5 100.00 16,928 0 16,928
Athens 1,517 1,897 Berea 4 0 0 0 4 100.00 6,857 0 6,857
Belmont 1,622 5,198 Ohio Shale 13 0 13 0 26 100.00 90,281 0 90,281
Carroll 5,250 7,730 Utica/Point Pleasant 2 0 13 0 15 100.00 124,265 0 124,265
Columbiana 6,983 7,599 Utica/Point Pleasant 0 0 1 0 1 100.00 3,923 0 3,923
Coshocton 975 4,604 Clinton 8 0 0 1 9 88.89 26,906 6,606 33,512
Cuyahoga 3,087 3,788 Clinton 14 0 0 0 14 100.00 52,200 0 52,200
Geauga 3,646 5,934 Clinton 7 0 0 1 8 87.50 29,206 6,783 35,989
Guernsey 1,370 6,411 Beekmantown 9 1 6 0 16 93.75 82,739 7,042 89,781
Harrison 1,147 8,517 Utica/Point Pleasant 1 0 1 0 2 100.00 8,083 0 8,083
Hocking 4,956 4,976 Rose Run 0 0 1 0 1 100.00 5,103 0 5,103
Holmes 700 5,864 Rose Run 4 0 0 0 4 100.00 18,121 0 18,121
Huron 3,099 3,382 Trempealeau 6 3 6 0 15 80.00 40,882 10,365 51,247
Jefferson 8,519 9,206 Utica/Point Pleasant 0 0 2 0 2 100.00 18,674 0 18,674
Knox 2,143 4,470 Clinton 26 0 6 0 32 100.00 100,438 0 100,438
Lake 3,313 3,353 Clinton 1 0 0 0 1 100.00 3,496 0 3,496
Licking 611 4,234 Clinton 13 1 4 0 18 94.44 48,270 572 48,842
Mahoning 4,984 5,840 Clinton 20 0 1 0 21 100.00 117,197 0 117,197
Marion 1,416 3,288 Trempealeau 1 0 0 0 1 100.00 3,288 0 3,288
Medina 3,556 4,870 Clinton 1 0 0 1 2 50.00 3,710 4,870 8,580
Meigs 631 4,506 Cow Run 1 0 3 0 4 100.00 7,992 0 7,992
Monroe 1,235 2,627 Ohio Shale 15 0 1 0 16 100.00 39,990 0 39,990
Morgan 1,340 1,366 Berea 2 0 0 0 2 100.00 2,850 0 2,850
Morrow 2,979 3,890 Trempealeau 5 2 0 0 7 71.43 17,758 6,675 24,433
Muskingum 1,110 6,868 Beekmantown 16 3 4 0 23 86.96 104,616 18,961 123,577
Perry 1,170 3,590 Clinton 2 1 0 0 3 66.67 7,059 1,171 8,230
Pickaway 556 2,636 Rose Run 0 2 0 2 4 0.00 0 10,323 10,323
Portage 4,077 6,160 Clinton 11 0 3 0 14 100.00 71,915 0 71,915
Ross 3,748 3,870 Knox Group 0 0 0 1 1 0.00 0 3,870 3,870
Stark 4,146 7,580 Clinton 38 0 2 0 40 100.00 220,258 0 220,258
Summit 3,421 4,010 Clinton 11 0 0 0 11 100.00 45,157 0 45,157
Trumbull 3,920 5,296 Clinton 11 0 0 0 11 100.00 55,865 0 55,865
Tuscarawas 1,090 7,674 Beekmantown 12 2 2 2 18 77.78 58,714 29,618 88,332
Washington 845 990 Cow Run 0 0 2 0 2 100.00 1,915 0 1,915
Wayne 3,074 5,426 Clinton 6 1 0 0 7 85.71 28,157 5,624 33,781
Wyandot 1,397 1,410 Trenton 1 0 0 1 2 50.00 3,534 1,420 4,954
TOTAL 267 18 71 9 365 92.60 1,467,147 115,231 1,582,378
Note: No completion information was available at the time of this printing for the following counties: Fairfield, Lawrence, Richland, Sandusky and Seneca.
Table II - Oil and Gas Completion Statistics by County – 2011
CountyDepth Range of Resevoirs Major Targeted
Resevoirs
Development Exploratory Total Wells
Percent Productive
Drilled Footage

Shal
low
Deep
Prod
uctiv
eDr
yPr
oduc
tive
Dry
Prod
uctiv
eDr
yTo
tal
Penn
sylv
ania
n (
Cow
Run)
588
990
00
40
410
0.00
3,47
20
3,47
2
Miss
issip
pian
(
Keen
er)
1,23
51,
250
10
00
110
0.00
1,27
50
1,27
5
Miss
issip
pian
(
1st &
2nd
Ber
ea)
525
1,78
423
40
027
85.1
929
,974
3,07
433
,048
Devo
nian
(
Ohio
Sha
le)1,
622
4,01
228
016
044
100.
0013
8,44
00
138,
440
Silu
rian
(Cl
into
n - M
edin
a)2,
202
5,84
017
40
20
176
100.
0075
6,89
00
756,
890
Ordo
vici
an
(Ut
ica/
Poin
t Plea
sant
)7,
602
7,82
00
024
024
100.
0017
5,72
00
175,
720
Ordo
vici
an
(Tr
ento
n - G
ull R
iver
)1,
397
6,70
42
00
35
40.0
06,
822
10,3
4517
,167
Ordo
vici
an
(Be
ekm
anto
wn)
5,81
47,
674
174
70
2885
.71
168,
120
27,6
9319
5,81
3
Cam
bro-
Ordo
vici
an
(Ro
se R
un)
2,61
77,
580
64
32
1560
.00
60,7
2031
,593
92,3
13
Cam
bria
n (
Trem
peale
au)
2,32
85,
573
166
153
4077
.50
125,
714
33,8
0615
9,52
0
PreC
ambr
ian
8,45
08,
720
00
01
10.
000
8,72
08,
720
TOTA
L26
718
719
365
92.6
01,
467,
147
115,
231
1,58
2,37
8
Tabl
e III
- O
il an
d G
as C
ompl
etio
n St
atis
tics
by P
rodu
cing
Zon
e –
2011
Prod
ucin
g Zo
nes
Dept
h Ra
nge o
f Res
evoi
rsDe
velo
pmen
tEx
plor
ator
yTo
tal
Wel
lsPe
rcen
t Pr
oduc
tive
Drill
ed F
oota
ge
page 6 2011 Ohio Oil & Gas Activities
2011 Ohio Oil & Gas Activities page 7
Figure 4 - Wells Completed by Month 2010 - 2011
Figure 5 - Wells Completed by Owner 2011
Chart1
Page 1
24 27 25 24 27 47 52 40 40 52 39 30
27
35
23
30 32
4542
56 55
4243
30
0
10
20
30
40
50
60
J F M A M J J A S O N D
Wel
ls
Month
2010 2011
52
24
127 8
3 2 1 3 0 1 1 0 1 0 1 0 0 0 1 1 1 1 10
10
20
30
40
50
60
1 2 3 4 5 6 7 8 9 10 11 12 13 14 15 16 17 18 19 20 21 27 31 37
Num
ber
of O
wne
rs
Number of Wells
Number of Owners
page 8 2011 Ohio Oil & Gas Activities
Table IV - Ten Most Active Counties - 2011
2011Rank County Wells Drilled
2010Rank
Avg. DepthPer Well
Est. FootageDrilled
1 Knox 43 (2) 3,139 134,9771 Stark 43 (5) 5,506 230,7583 Belmont 28 (31) 3,472 97,2164 Coshocton 25 (9) 3,724 93,1004 Muskingum 25 (8) 5,373 134,3256 Licking 24 (4) 2,713 65,1127 Mahoning 21 (10) 5,581 117,1978 Guernsey 20 (10) 5,611 112,2209 Meigs 19 (21) 1,998 37,9629 Summit 19 (6) 4,105 77,9959 Tuscarawas 19 (17) 4,907 93,233
Figure 6 - Development vs. Exploratory Wells 2011
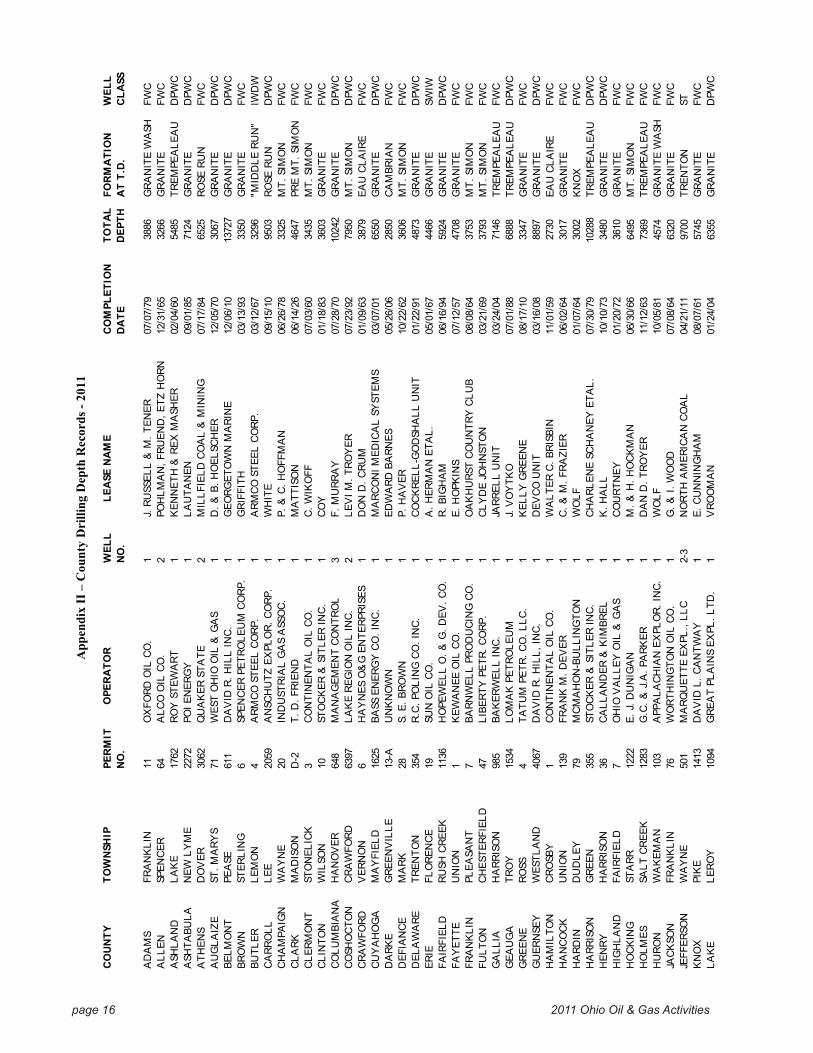
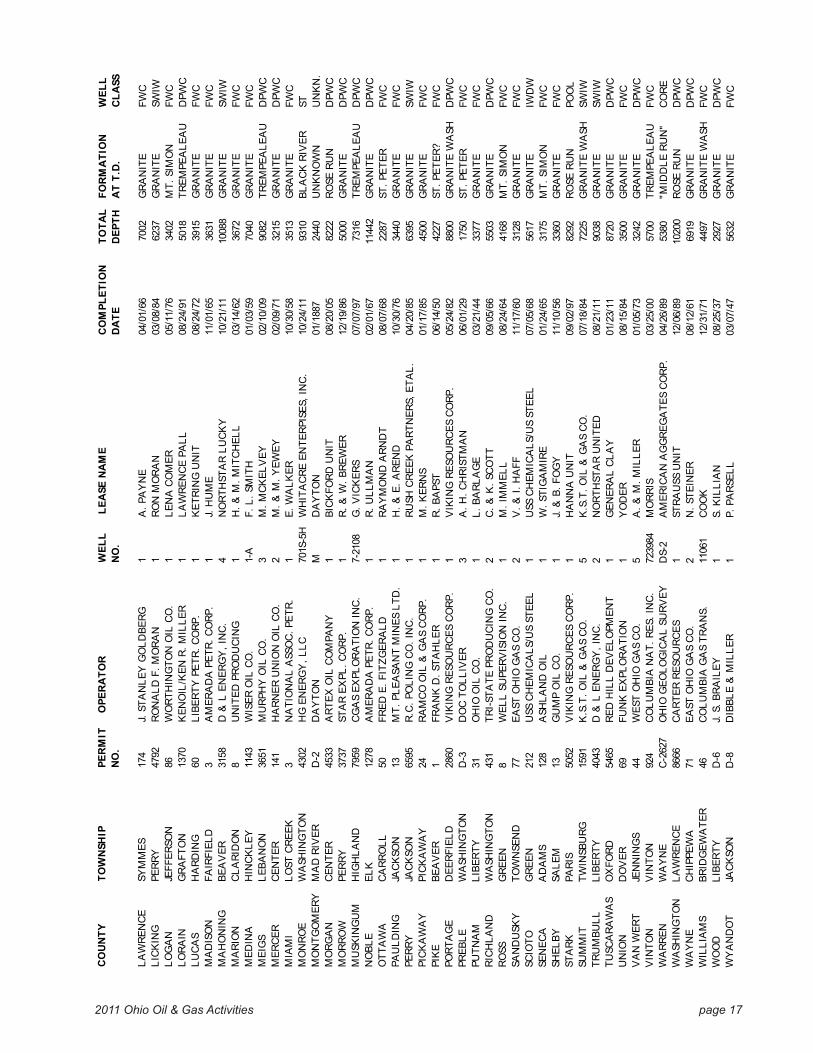
County Drilling Depth Records
Exploration to the Utica/Point Pleasant Shale and the drilling of new Class II injection wells resulted in five new drilling depth records (Appendix II). In Jefferson County, a well was drilled 9,700 feet into the Trenton Limestone, 1,647 feet deeper than the former record holding well drilled in 1984. In Mahoning County, a well was drilled 10,088 feet into the Precambrian Granite, 896 feet deeper than the former record holding well drilled in 2010. In Monroe County, a well was drilled 9,310 feet
into the Trenton Limestone, 1,803 feet deeper than the former record holding well drilled in 1989. In Trumbull County, a well was drilled 9,038 feet into the Precambrian Granite, 1,316 feet deeper than the former record holding well drilled in 1998. In Tuscarawas County, a well was drilled 8,720 feet into the Precambrian Granite, 25 feet deeper than the former record holding well drilled in 2007. Additionally, in Carroll County, a horizontal well was drilled 14,445 feet into the Utica/Point Pleasant Shale, making it the longest well ever drilled.
Development83%
Exploratory17%
Sheet2
Page 1
Outpost31%
Wildcat10%
Shallow Pool
Wildcat4%
New Pool Wildcat
5%
Deeper Pool
Wildcat50%
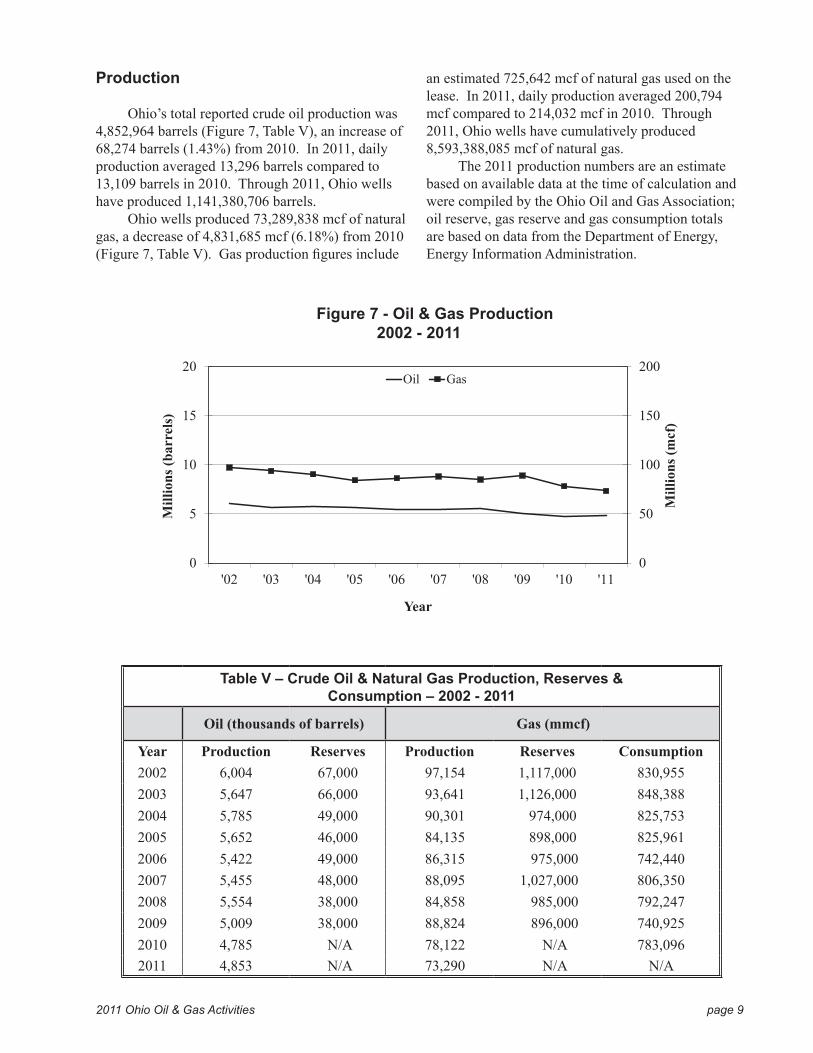
Chart1
Page 1
0
50
100
150
200
0
5
10
15
20
'02 '03 '04 '05 '06 '07 '08 '09 '10 '11
Mill
ions
(mcf
)
Mill
ions
(bar
rels
)
Year
Oil Gas
Figure 7 - Oil & Gas Production 2002 - 2011
2011 Ohio Oil & Gas Activities page 9
Production
Ohio’s total reported crude oil production was 4,852,964 barrels (Figure 7, Table V), an increase of 68,274 barrels (1.43%) from 2010. In 2011, daily production averaged 13,296 barrels compared to 13,109 barrels in 2010. Through 2011, Ohio wells have produced 1,141,380,706 barrels.
Ohio wells produced 73,289,838 mcf of natural gas, a decrease of 4,831,685 mcf (6.18%) from 2010 (Figure 7, Table V). Gas production figures include
an estimated 725,642 mcf of natural gas used on the lease. In 2011, daily production averaged 200,794 mcf compared to 214,032 mcf in 2010. Through 2011, Ohio wells have cumulatively produced 8,593,388,085 mcf of natural gas.
The 2011 production numbers are an estimate based on available data at the time of calculation and were compiled by the Ohio Oil and Gas Association; oil reserve, gas reserve and gas consumption totals are based on data from the Department of Energy, Energy Information Administration.
Table V – Crude Oil & Natural Gas Production, Reserves & Consumption – 2002 - 2011
Oil (thousands of barrels) Gas (mmcf)
Year Production Reserves Production Reserves Consumption2002 6,004 67,000 97,154 1,117,000 830,9552003 5,647 66,000 93,641 1,126,000 848,3882004 5,785 49,000 90,301 974,000 825,7532005 5,652 46,000 84,135 898,000 825,9612006 5,422 49,000 86,315 975,000 742,4402007 5,455 48,000 88,095 1,027,000 806,3502008 5,554 38,000 84,858 985,000 792,2472009 5,009 38,000 88,824 896,000 740,9252010 4,785 N/A 78,122 N/A 783,0962011 4,853 N/A 73,290 N/A N/A
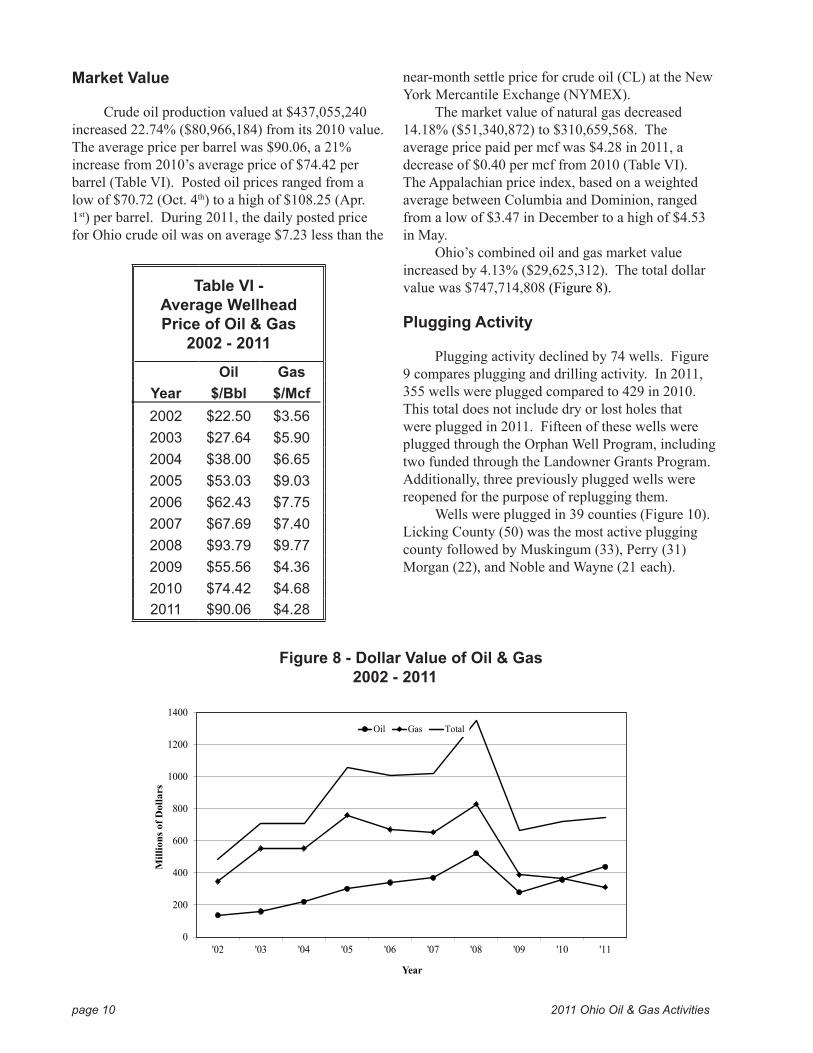
Figure 8 - Dollar Value of Oil & Gas 2002 - 2011
page 10 2011 Ohio Oil & Gas Activities
Market Value
Crude oil production valued at $437,055,240 increased 22.74% ($80,966,184) from its 2010 value. The average price per barrel was $90.06, a 21% increase from 2010’s average price of $74.42 per barrel (Table VI). Posted oil prices ranged from a low of $70.72 (Oct. 4th) to a high of $108.25 (Apr. 1st) per barrel. During 2011, the daily posted price for Ohio crude oil was on average $7.23 less than the
near-month settle price for crude oil (CL) at the New York Mercantile Exchange (NYMEX).
The market value of natural gas decreased 14.18% ($51,340,872) to $310,659,568. The average price paid per mcf was $4.28 in 2011, a decrease of $0.40 per mcf from 2010 (Table VI). The Appalachian price index, based on a weighted average between Columbia and Dominion, ranged from a low of $3.47 in December to a high of $4.53 in May.
Ohio’s combined oil and gas market value increased by 4.13% ($29,625,312). The total dollar value was $747,714,808 (Figure 8).
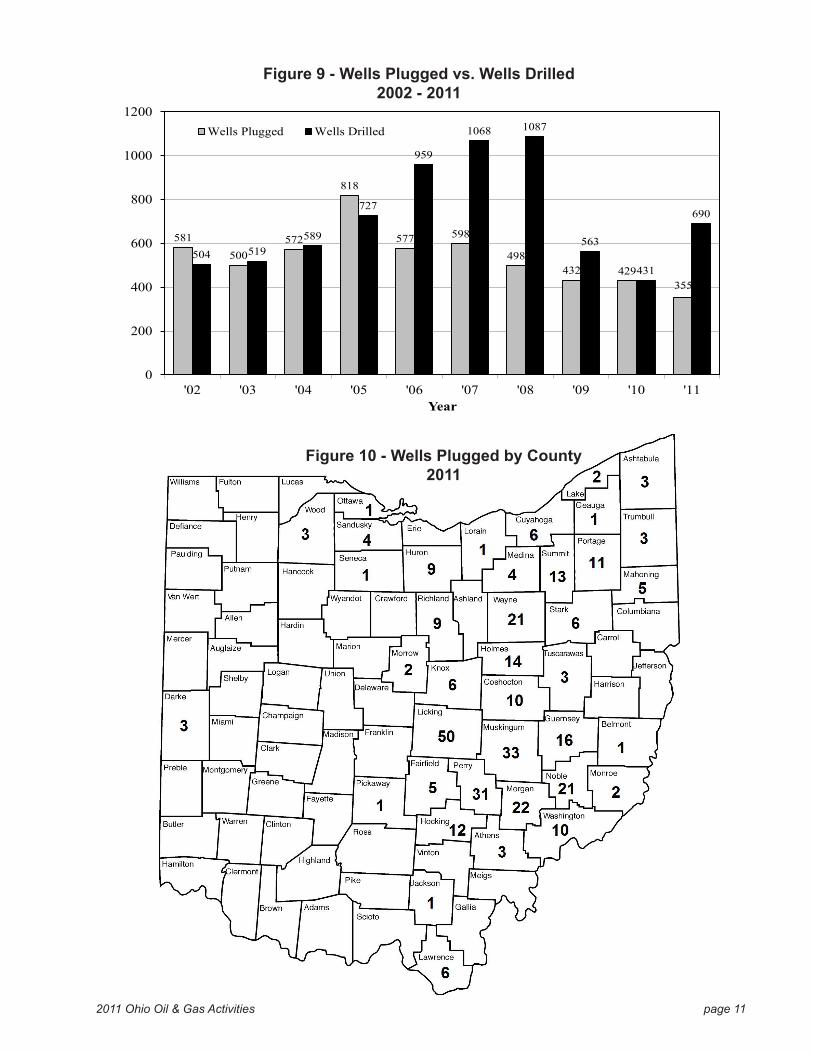
Plugging Activity
Plugging activity declined by 74 wells. Figure 9 compares plugging and drilling activity. In 2011, 355 wells were plugged compared to 429 in 2010. This total does not include dry or lost holes that were plugged in 2011. Fifteen of these wells were plugged through the Orphan Well Program, including two funded through the Landowner Grants Program. Additionally, three previously plugged wells were reopened for the purpose of replugging them.
Wells were plugged in 39 counties (Figure 10). Licking County (50) was the most active plugging county followed by Muskingum (33), Perry (31) Morgan (22), and Noble and Wayne (21 each).
Table VI - Average Wellhead Price of Oil & Gas
2002 - 2011
Oil GasYear $/Bbl $/Mcf2002 $22.50 $3.562003 $27.64 $5.902004 $38.00 $6.652005 $53.03 $9.032006 $62.43 $7.752007 $67.69 $7.402008 $93.79 $9.772009 $55.56 $4.362010 $74.42 $4.682011 $90.06 $4.28
Chart1
Page 1
0
200
400
600
800
1000
1200
1400
'02 '03 '04 '05 '06 '07 '08 '09 '10 '11
Mill
ions
of D
olla
rs
Year
Oil Gas Total
581500
572
818
577 598
498432 429
355
504 519589
727
959
1068 1087
563
431
690
0
200
400
600
800
1000
1200
'02 '03 '04 '05 '06 '07 '08 '09 '10 '11Year
Wells Plugged Wells Drilled
2011 Ohio Oil & Gas Activities page 11
Figure 9 - Wells Plugged vs. Wells Drilled2002 - 2011
Figure 10 - Wells Plugged by County 2011
page 12 2011 Ohio Oil & Gas ActivitiesPage 2009 Ohio Oil & Gas Activities
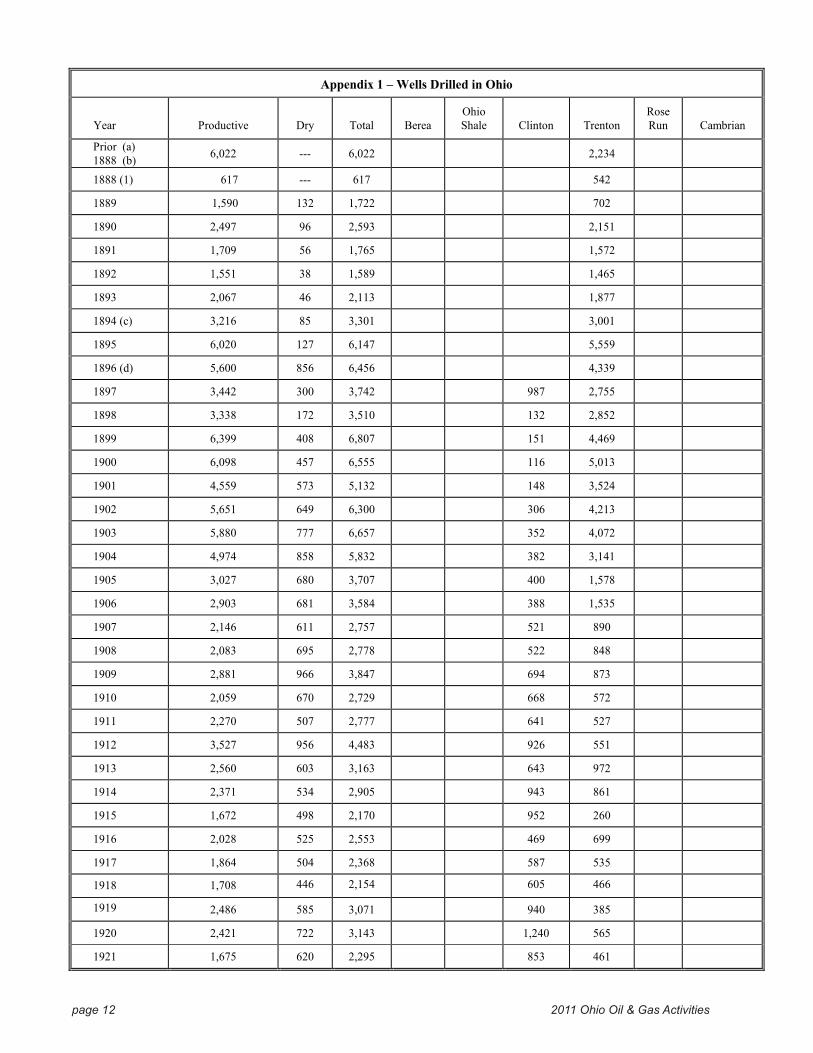
Appendix 1 – Wells Drilled in Ohio
Year Productive Dry Total BereaOhioShale Clinton Trenton
RoseRun Cambrian
Prior (a)1888 (b) 6,022 --- 6,022 2,234
1888 (1) 617 --- 617 542
1889 1,590 132 1,722 702
1890 2,497 96 2,593 2,151
1891 1,709 56 1,765 1,572
1892 1,551 38 1,589 1,465
1893 2,067 46 2,113 1,877
1894 (c) 3,216 85 3,301 3,001
1895 6,020 127 6,147 5,559
1896 (d) 5,600 856 6,456 4,339
1897 3,442 300 3,742 987 2,755
1898 3,338 172 3,510 132 2,852
1899 6,399 408 6,807 151 4,469
1900 6,098 457 6,555 116 5,013
1901 4,559 573 5,132 148 3,524
1902 5,651 649 6,300 306 4,213
1903 5,880 777 6,657 352 4,072
1904 4,974 858 5,832 382 3,141
1905 3,027 680 3,707 400 1,578
1906 2,903 681 3,584 388 1,535
1907 2,146 611 2,757 521 890
1908 2,083 695 2,778 522 848
1909 2,881 966 3,847 694 873
1910 2,059 670 2,729 668 572
1911 2,270 507 2,777 641 527
1912 3,527 956 4,483 926 551
1913 2,560 603 3,163 643 972
1914 2,371 534 2,905 943 861
1915 1,672 498 2,170 952 260
1916 2,028 525 2,553 469 699
1917 1,864 504 2,368 587 535
1918 1,708 446 2,154 605 466
1919 2,486 585 3,071 940 385
1920 2,421 722 3,143 1,240 565
1921 1,675 620 2,295 853 461
2011 Ohio Oil & Gas Activities page 13 Page 2009 Ohio Oil & Gas Activities
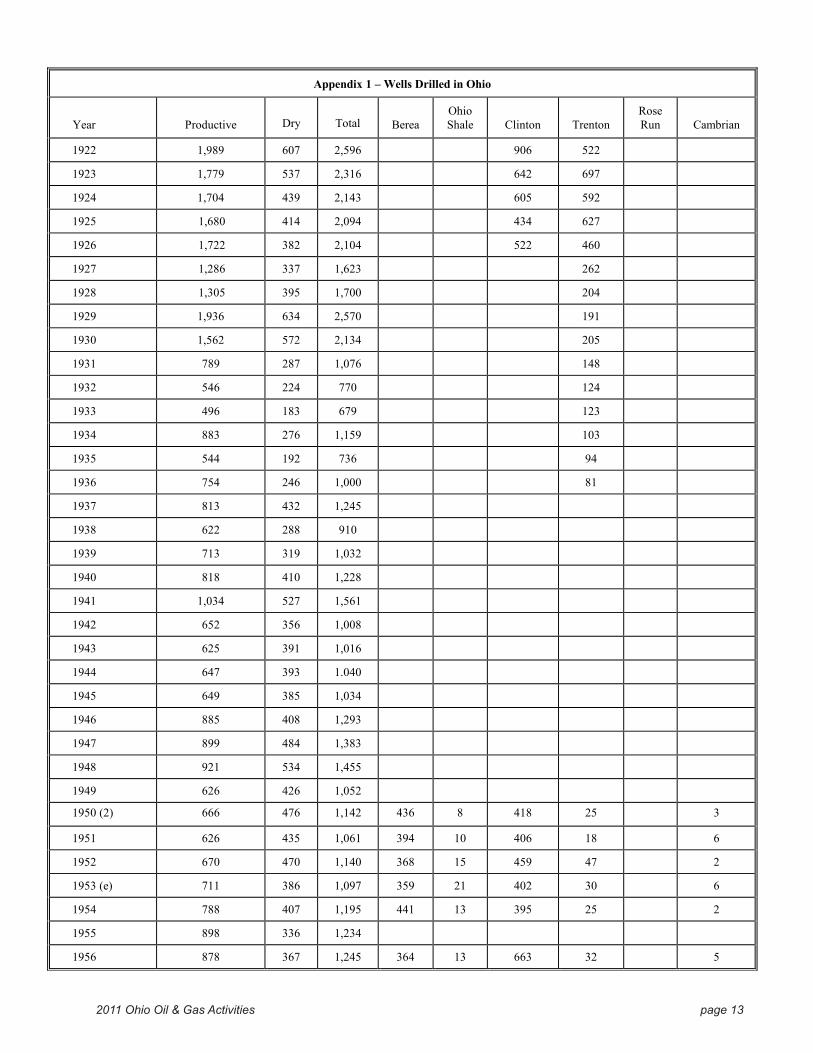
Appendix 1 – Wells Drilled in Ohio
Year Productive Dry Total BereaOhioShale Clinton Trenton
RoseRun Cambrian
1922 1,989 607 2,596 906 522
1923 1,779 537 2,316 642 697
1924 1,704 439 2,143 605 592
1925 1,680 414 2,094 434 627
1926 1,722 382 2,104 522 460
1927 1,286 337 1,623 262
1928 1,305 395 1,700 204
1929 1,936 634 2,570 191
1930 1,562 572 2,134 205
1931 789 287 1,076 148
1932 546 224 770 124
1933 496 183 679 123
1934 883 276 1,159 103
1935 544 192 736 94
1936 754 246 1,000 81
1937 813 432 1,245
1938 622 288 910
1939 713 319 1,032
1940 818 410 1,228
1941 1,034 527 1,561
1942 652 356 1,008
1943 625 391 1,016
1944 647 393 1.040
1945 649 385 1,034
1946 885 408 1,293
1947 899 484 1,383
1948 921 534 1,455
1949 626 426 1,052
1950 (2) 666 476 1,142 436 8 418 25 3
1951 626 435 1,061 394 10 406 18 6
1952 670 470 1,140 368 15 459 47 2
1953 (e) 711 386 1,097 359 21 402 30 6
1954 788 407 1,195 441 13 395 25 2
1955 898 336 1,234
1956 878 367 1,245 364 13 663 32 5
Page 2009 Ohio Oil & Gas Activities
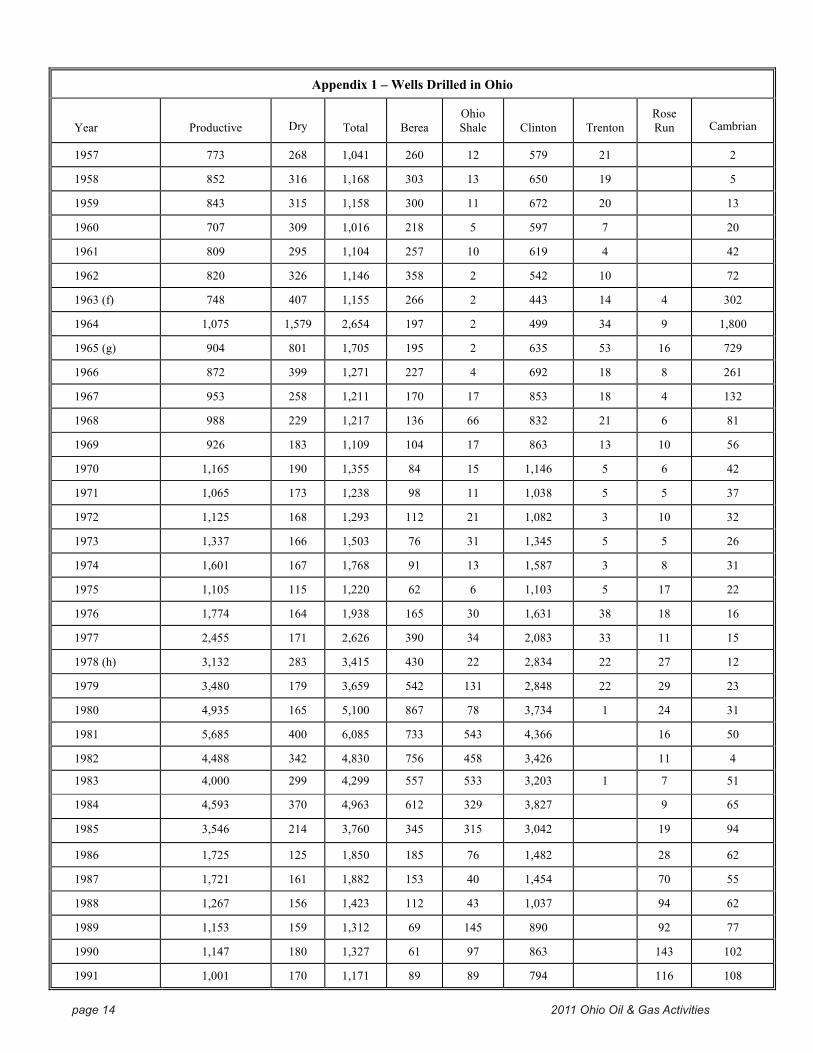
Appendix 1 – Wells Drilled in Ohio
Year Productive Dry Total BereaOhioShale Clinton Trenton
RoseRun Cambrian
1957 773 268 1,041 260 12 579 21 2
1958 852 316 1,168 303 13 650 19 5
1959 843 315 1,158 300 11 672 20 13
1960 707 309 1,016 218 5 597 7 20
1961 809 295 1,104 257 10 619 4 42
1962 820 326 1,146 358 2 542 10 72
1963 (f) 748 407 1,155 266 2 443 14 4 302
1964 1,075 1,579 2,654 197 2 499 34 9 1,800
1965 (g) 904 801 1,705 195 2 635 53 16 729
1966 872 399 1,271 227 4 692 18 8 261
1967 953 258 1,211 170 17 853 18 4 132
1968 988 229 1,217 136 66 832 21 6 81
1969 926 183 1,109 104 17 863 13 10 56
1970 1,165 190 1,355 84 15 1,146 5 6 42
1971 1,065 173 1,238 98 11 1,038 5 5 37
1972 1,125 168 1,293 112 21 1,082 3 10 32
1973 1,337 166 1,503 76 31 1,345 5 5 26
1974 1,601 167 1,768 91 13 1,587 3 8 31
1975 1,105 115 1,220 62 6 1,103 5 17 22
1976 1,774 164 1,938 165 30 1,631 38 18 16
1977 2,455 171 2,626 390 34 2,083 33 11 15
1978 (h) 3,132 283 3,415 430 22 2,834 22 27 12
1979 3,480 179 3,659 542 131 2,848 22 29 23
1980 4,935 165 5,100 867 78 3,734 1 24 31
1981 5,685 400 6,085 733 543 4,366 16 50
1982 4,488 342 4,830 756 458 3,426 11 4
1983 4,000 299 4,299 557 533 3,203 1 7 51
1984 4,593 370 4,963 612 329 3,827 9 65
1985 3,546 214 3,760 345 315 3,042 19 94
1986 1,725 125 1,850 185 76 1,482 28 62
1987 1,721 161 1,882 153 40 1,454 70 55
1988 1,267 156 1,423 112 43 1,037 94 62
1989 1,153 159 1,312 69 145 890 92 77
1990 1,147 180 1,327 61 97 863 143 102
1991 1,001 170 1,171 89 89 794 116 108
page 14 2011 Ohio Oil & Gas Activities
2011 Ohio Oil & Gas Activities page 15
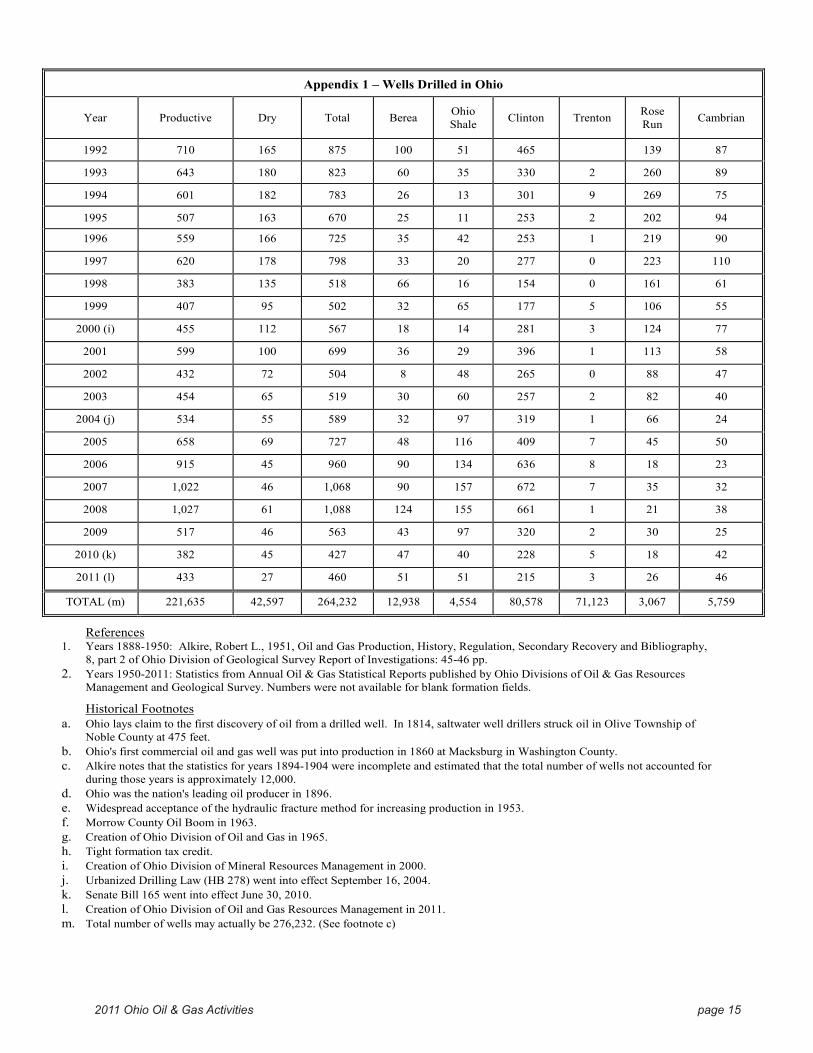
Appendix 1 – Wells Drilled in Ohio
Year Productive Dry Total Berea OhioShale Clinton Trenton Rose
Run Cambrian
1992 710 165 875 100 51 465 139 87
1993 643 180 823 60 35 330 2 260 89
1994 601 182 783 26 13 301 9 269 75
1995 507 163 670 25 11 253 2 202 94
1996 559 166 725 35 42 253 1 219 90
1997 620 178 798 33 20 277 0 223 110
1998 383 135 518 66 16 154 0 161 61
1999 407 95 502 32 65 177 5 106 55
2000 (i) 455 112 567 18 14 281 3 124 77
2001 599 100 699 36 29 396 1 113 58
2002 432 72 504 8 48 265 0 88 47
2003 454 65 519 30 60 257 2 82 40
2004 (j) 534 55 589 32 97 319 1 66 24
2005 658 69 727 48 116 409 7 45 50
2006 915 45 960 90 134 636 8 18 23
2007 1,022 46 1,068 90 157 672 7 35 32
2008 1,027 61 1,088 124 155 661 1 21 38
2009 517 46 563 43 97 320 2 30 25
2010 (k) 382 45 427 47 40 228 5 18 42
2011 (l) 433 27 460 51 51 215 3 26 46
TOTAL (m) 221,635 42,597 264,232 12,938 4,554 80,578 71,123 3,067 5,759
References1. Years 1888-1950: Alkire, Robert L., 1951, Oil and Gas Production, History, Regulation, Secondary Recovery and Bibliography,
8, part 2 of Ohio Division of Geological Survey Report of Investigations: 45-46 pp.2. Years 1950-2011: Statistics from Annual Oil & Gas Statistical Reports published by Ohio Divisions of Oil & Gas Resources
Management and Geological Survey. Numbers were not available for blank formation fields.
Historical Footnotesa. Ohio lays claim to the first discovery of oil from a drilled well. In 1814, saltwater well drillers struck oil in Olive Township of
Noble County at 475 feet.b. Ohio's first commercial oil and gas well was put into production in 1860 at Macksburg in Washington County.c. Alkire notes that the statistics for years 1894-1904 were incomplete and estimated that the total number of wells not accounted for
during those years is approximately 12,000.d. Ohio was the nation's leading oil producer in 1896.e. Widespread acceptance of the hydraulic fracture method for increasing production in 1953.f. Morrow County Oil Boom in 1963.g. Creation of Ohio Division of Oil and Gas in 1965.h. Tight formation tax credit.i. Creation of Ohio Division of Mineral Resources Management in 2000.j. Urbanized Drilling Law (HB 278) went into effect September 16, 2004.k. Senate Bill 165 went into effect June 30, 2010.l. Creation of Ohio Division of Oil and Gas Resources Management in 2011.m. Total number of wells may actually be 276,232. (See footnote c)
page 16 2011 Ohio Oil & Gas Activities
App
endi
x II
–C
ount
y D
rilli
ng D
epth
Rec
ords
- 201
1
CO
UN
TY
AD
AM
S
A
LLEN
ASH
LAN
D
A
SHTA
BULA
A
THEN
S
A
UG
LAIZ
E
BELM
ON
T
BRO
WN
BUTL
ER
C
ARR
OLL
CH
AM
PAIG
N
CLA
RK
C
LERM
ON
T
CLI
NTO
N
C
OLU
MBI
AN
A
CO
SHO
CTO
N
CRA
WFO
RD
CU
YA
HO
GA
D
ARK
E
D
EFIA
NC
E
DEL
AW
ARE
ER
IE
FAIR
FIEL
D
FAY
ETTE
FRA
NK
LIN
FU
LTO
N
G
ALL
IA
G
EAU
GA
GRE
ENE
GU
ERN
SEY
H
AM
ILTO
N
HA
NC
OC
K
H
ARD
IN
H
ARR
ISO
N
HEN
RY
H
IGH
LAN
D
HO
CK
ING
HO
LMES
HU
RON
JAC
KSO
N
JE
FFER
SON
K
NO
X
LAK
E
TOW
NSH
IP
FRA
NK
LIN
SPEN
CER
LAK
EN
EW L
YM
ED
OV
ERST
. MA
RYS
PEA
SEST
ERLI
NG
LEM
ON
LEE
WA
YN
EM
AD
ISO
NST
ON
ELIC
KW
ILSO
NH
AN
OV
ERC
RAW
FORD
VER
NO
NM
AY
FIEL
DG
REEN
VIL
LEM
ARK
TREN
TON
FLO
REN
CE
RUSH
CRE
EKU
NIO
NPL
EASA
NT
CH
ESTE
RFIE
LDH
ARR
ISO
NTR
OY
ROSS
WES
TLA
ND
CRO
SBY
UN
ION
DU
DLE
YG
REEN
HA
RRIS
ON
FAIR
FIEL
DST
ARR
SALT
CRE
EKW
AK
EMA
NFR
AN
KLI
NW
AY
NE
PIK
ELE
ROY
PER
MIT
NO
.
11
64
1762
22
72
3062
71
611
6
4
20
59
20
D
-2
3
10
648
63
97
6
16
25
13-A
28
354
19
1136
1
7
47
98
5
1534
4
40
67
1
13
9
79
35
5
36
7
1222
12
83
103
76
501
14
13
1094
OPE
RA
TOR
OX
FORD
OIL
CO
.
A
LCO
OIL
CO
.
ROY
STE
WA
RT
PO
I EN
ERG
Y
Q
UA
KER
STA
TE
WES
T O
HIO
OIL
& G
AS
D
AV
ID R
. HIL
L IN
C.
SPEN
CER
PET
ROLE
UM
CO
RP.
ARM
CO
STE
EL C
ORP
.
AN
SCH
UTZ
EX
PLO
R. C
ORP
. IN
DU
STRI
AL
GA
S A
SSO
C.
T. D
. FRI
END
C
ON
TIN
ENTA
L O
IL C
O.
STO
CK
ER &
SIT
LER
INC
. M
AN
AG
EMEN
T C
ON
TRO
L
LAK
E RE
GIO
N O
IL IN
C.
HA
YN
ES O
&G
EN
TERP
RISE
S BA
SS E
NER
GY
CO
. IN
C.
UN
KN
OW
N
S. E
. BRO
WN
R.C
. PO
LIN
G C
O. I
NC
. SU
N O
IL C
O.
H
OPE
WEL
L O
. & G
. DEV
. CO
. K
EWA
NEE
OIL
CO
.
BA
RNW
ELL
PRO
DU
CIN
G C
O.
LIBE
RTY
PET
R. C
ORP
. BA
KER
WEL
L IN
C.
LOM
AK
PET
ROLE
UM
TATU
M P
ETR.
CO
. LLC
.
DA
VID
R. H
ILL,
INC
. C
ON
TIN
ENTA
L O
IL C
O.
FRA
NK
M. D
EVER
M
CM
AH
ON
-BU
LLIN
GTO
N
STO
CK
ER &
SIT
LER
INC
. C
ALL
AN
DER
& K
IMBR
EL
OH
IO V
ALL
EY O
IL &
GA
S E.
J. D
UN
IGA
N
G.C
. & J
.A. P
ARK
ER
APP
ALA
CH
IAN
EX
PLO
R. IN
C.
WO
RTH
ING
TON
OIL
CO
. M
ARQ
UET
TE E
XPL
., LL
CD
AV
ID L
. CA
NTW
AY
GRE
AT
PLA
INS
EXPL
. LTD
.
WEL
LN
O.
1
2
1
1
2
1
1
1
1
1
1
1
1
1
3
2
1
1
1
1
1
1
1
1
1
1
1
1
1
1
1
1
1
1
1
1
1
1
1
1
2-3
1
1
L
EASE
NA
ME
J. R
USS
ELL
& M
. TEN
ER
POH
LMA
N, F
RUEN
D, E
TZ H
ORN
K
ENN
ETH
& R
EX M
ASH
ER
LAU
TAN
EN
MIL
LFIE
LD C
OA
L &
MIN
ING
D
. & B
. HO
ELSC
HER
GEO
RGET
OW
N M
ARI
NE
GRI
FFIT
H
ARM
CO
STE
EL C
ORP
.
WH
ITE
P.
& C
. HO
FFM
AN
MA
TTIS
ON
C
. WIK
OFF
CO
Y
F.
MU
RRA
Y
LE
VI M
. TRO
YER
D
ON
D. C
RUM
MA
RCO
NI M
EDIC
AL
SYST
EMS
EDW
ARD
BA
RNES
P.
HA
VER
C
OC
KRE
LL-G
OD
SHA
LL U
NIT
A. H
ERM
AN
ETA
L.
R. B
IGH
AM
E.
HO
PKIN
S
O
AK
HU
RST
CO
UN
TRY
CLU
B C
LYD
E JO
HN
STO
N
JARR
ELL
UN
ITJ.
VO
YTK
O
K
ELLY
GRE
ENE
DEV
CO
UN
IT
W
ALT
ER C
. BRI
SBIN
C. &
M. F
RAZI
ER
W
OLF
CH
ARL
ENE
SCH
AN
EY E
TAL.
K
. HA
LL
CO
URT
NEY
M
. & H
. HO
CK
MA
N
D
AN
D. T
ROY
ER
WO
LF
G
. & I.
WO
OD
N
ORT
H A
MER
ICA
N C
OA
LE.
CU
NN
ING
HA
M
VRO
OM
AN
CO
MPL
ETIO
ND
ATE
07/0
7/79
12/3
1/65
02/0
4/60
09/0
1/85
07/1
7/84
12/0
5/70
12/0
6/10
03/1
3/93
03/1
2/67
09/1
5/10
06/2
6/78
06/1
4/26
07/0
3/60
01/1
8/83
07/2
8/70
07/2
3/92
01/0
9/63
03/0
7/01
05/2
6/06
10/2
2/62
01/2
2/91
05/0
1/67
06/1
6/94
07/1
2/57
08/0
8/64
03/2
1/69
03/2
4/04
07/0
1/88
08/1
7/10
03/1
6/08
11/0
1/59
06/0
2/64
01/0
7/64
07/3
0/79
10/1
0/73
01/2
0/72
06/3
0/66
11/1
2/63
10/0
5/81
07/0
8/64
04/2
1/11
08/0
7/61
01/2
4/04
TOTA
LD
EPTH
3886
3266
5485
7124
6525
3067
1372
733
5032
9695
0333
2546
4734
3536
0310
242
7950
3879
6550
2850
3606
4873
4466
5924
4708
3753
3793
7146
6888
3347
8897
2730
3017
3002
1028
834
8036
1064
9573
6945
7463
2097
0057
4563
55
FOR
MA
TIO
NA
T T.
D.
GRA
NIT
E W
ASH
G
RAN
ITE
TREM
PEA
LEA
U
GRA
NIT
E
RO
SE R
UN
GRA
NIT
E
G
RAN
ITE
GRA
NIT
E
"M
IDD
LE R
UN
"RO
SE R
UN
MT.
SIM
ON
PRE
MT.
SIM
ON
MT.
SIM
ON
GRA
NIT
E
G
RAN
ITE
MT.
SIM
ON
EAU
CLA
IRE
G
RAN
ITE
C
AM
BRIA
N
M
T. S
IMO
N
G
RAN
ITE
GRA
NIT
E
G
RAN
ITE
GRA
NIT
E
M
T. S
IMO
N
M
T. S
IMO
N
TR
EMPE
ALE
AU
TREM
PEA
LEA
U
GRA
NIT
EG
RAN
ITE
EAU
CLA
IRE
G
RAN
ITE
KN
OX
TR
EMPE
ALE
AU
G
RAN
ITE
GRA
NIT
E
M
T. S
IMO
N
TR
EMPE
ALE
AU
G
RAN
ITE
WA
SH
GRA
NIT
E
TR
ENTO
N
GRA
NIT
E
G
RAN
ITE
WEL
LC
LASS
FWC
FW
C
DPW
CD
PWC
FWC
DPW
CD
PWC
FWC
IWD
WD
PWC
FWC
FWC
FWC
FWC
DPW
CD
PWC
FWC
DPW
CFW
CFW
CD
PWC
SWIW
DPW
CFW
CFW
CFW
CFW
CD
PWC
FWC
DPW
CFW
CFW
CFW
CD
PWC
DPW
CFW
CFW
CFW
C
FWC
FWC
ST FWC
DPW
C
2011 Ohio Oil & Gas Activities page 17
CO
UN
TY
LAW
REN
CE
LIC
KIN
GLO
GA
N
LO
RAIN
LUC
AS
MA
DIS
ON
MA
HO
NIN
G
MA
RIO
N
M
EDIN
A
M
EIG
S
M
ERC
ER
M
IAM
I
M
ON
ROE
MO
NTG
OM
ERY
M
ORG
AN
MO
RRO
W
M
USK
ING
UM
N
OBL
E
O
TTA
WA
PAU
LDIN
G
PERR
Y
PI
CK
AW
AY
PI
KE
PORT
AG
E
PREB
LE
PU
TNA
M
RI
CH
LAN
D
ROSS
SA
ND
USK
Y
SCIO
TO
SE
NEC
A
SH
ELBY
STA
RK
SU
MM
IT
TR
UM
BULL
TU
SCA
RAW
AS
UN
ION
VA
NW
ERT
V
INTO
N
W
ARR
EN
W
ASH
ING
TON
W
AY
NE
WIL
LIA
MS
W
OO
D
WY
AN
DO
T
TOW
NSH
IP
SYM
MES
PERR
YJE
FFER
SON
G
RAFT
ON
H
ARD
ING
FA
IRFI
ELD
BE
AV
ERC
LARI
DO
N
HIN
CK
LEY
LE
BAN
ON
CEN
TER
LOST
CRE
EKW
ASH
ING
TON
MA
D R
IVER
C
ENTE
R
PERR
Y
H
IGH
LAN
DEL
K
CA
RRO
LL
JAC
KSO
N
JAC
KSO
N
PIC
KA
WA
Y
BEA
VER
DEE
RFIE
LD
WA
SHIN
GTO
N
LI
BERT
Y
WA
SHIN
GTO
N
G
REEN
TOW
NSE
ND
G
REEN
AD
AM
S
SA
LEM
PARI
STW
INSB
URG
LI
BERT
YO
XFO
RD
D
OV
ER
JE
NN
ING
S
VIN
TON
WA
YN
E
LA
WRE
NC
E
CH
IPPE
WA
BR
IDG
EWA
TER
LIBE
RTY
JA
CK
SON
PER
MIT
NO
.
174
4792
86
13
70
60
3
3158
8
1143
36
51
141
3
4302
D-2
45
33
3737
79
59
1278
50
13
65
95
24
1
2860
D
-3
31
43
1
8
77
212
12
8
13
50
5215
91
4043
5465
69
44
924
C
-262
786
66
71
46
D-6
D
-8
O
PER
ATO
R
J. S
TAN
LEY
GO
LDBE
RGRO
NA
LD F
. MO
RAN
WO
RTH
ING
TON
OIL
CO
. K
ENO
IL/K
EN R
. MIL
LER
LI
BERT
Y P
ETR.
CO
RP.
AM
ERA
DA
PET
R. C
ORP
. D
& L
EN
ERG
Y, I
NC
. U
NIT
ED P
ROD
UC
ING
WIS
ER O
IL C
O.
MU
RPH
Y O
IL C
O.
HA
RNER
UN
ION
OIL
CO
. N
ATI
ON
AL
ASS
OC
. PET
R.
HG
EN
ERG
Y, L
LCD
AY
TON
A
RTEX
OIL
CO
MPA
NY
ST
AR
EXPL
. CO
RP.
C
GA
S EX
PLO
RATI
ON
INC
.A
MER
AD
A P
ETR.
CO
RP.
FRED
E. F
ITZG
ERA
LD
MT.
PLE
ASA
NT
MIN
ES L
TD.
R.C
. PO
LIN
G C
O. I
NC
. RA
MC
O O
IL &
GA
S C
ORP
. FR
AN
K D
. STA
HLE
R
V
IKIN
G R
ESO
URC
ES C
ORP
. D
OC
TO
LLIV
ER
OH
IO O
IL C
O.
TR
I-STA
TE P
ROD
UC
ING
CO
. W
ELL
SUPE
RVIS
ION
INC
. EA
ST O
HIO
GA
S C
O.
U
SS C
HEM
ICA
LS/U
S ST
EEL
ASH
LAN
D O
IL
G
UM
P O
IL C
O.
V
IKIN
G R
ESO
URC
ES C
ORP
.K
.S.T
. OIL
& G
AS
CO
. D
& L
EN
ERG
Y, I
NC
.RE
D H
ILL
DEV
ELO
PMEN
TFU
NK
EX
PLO
RATI
ON
WES
T O
HIO
GA
S C
O.
C
OLU
MBI
A N
AT.
RES
. IN
C.
OH
IO G
EOLO
GIC
AL
SURV
EY
CA
RTER
RES
OU
RCES
EAST
OH
IO G
AS
CO
.
CO
LUM
BIA
GA
S TR
AN
S.
J. S
. BRA
ILEY
D
IBBL
E &
MIL
LER
WEL
LN
O.
1 1 1
1
1
1
4
1
1-A
3
2
1
701S
-5H
M
1
1
7-
2108
1
1
1
1
1
1
1
3
1
2
1
2
1
1
1
1
5
2 1
1
5
7239
84D
S-2
1
2
11
061
1
1
LEA
SE N
AM
E
A. P
AY
NE
RON
MO
RAN
LEN
A C
OM
ER
LA
WRE
NC
E PA
LL
KET
RIN
G U
NIT
J.
HU
ME
N
ORT
HST
AR
LUC
KY
H. &
M. M
ITC
HEL
L
F.
L. S
MIT
H
M
. MC
KEL
VEY
M. &
M. Y
EWEY
E.
WA
LKER
WH
ITA
CRE
EN
TERP
ISES
, IN
C.
DA
YTO
N
BIC
KFO
RD U
NIT
R. &
W. B
REW
ER
G. V
ICK
ERS
R. U
LLM
AN
RAY
MO
ND
ARN
DT
H
. & E
. ARE
ND
RU
SH C
REEK
PA
RTN
ERS,
ETA
L.M
. KER
NS
R. B
APS
T
V
IKIN
G R
ESO
URC
ES C
ORP
. A
. H. C
HRI
STM
AN
L. B
ARL
AG
E
C
. & K
. SC
OTT
M
. IM
MEL
L
V
. & I.
HA
FF
USS
CH
EMIC
ALS
/US
STEE
L W
. STI
GA
MIR
E
J. &
B. F
OG
Y
HA
NN
A U
NIT
K
.S.T
. OIL
& G
AS
CO
. N
ORT
HST
AR
UN
ITED
GEN
ERA
L C
LAY
YO
DER
A. &
M. M
ILLE
R
M
ORR
ISA
MER
ICA
N A
GG
REG
ATE
S C
ORP
. ST
RAU
SS U
NIT
N
. STE
INER
CO
OK
S. K
ILLI
AN
P. P
ARS
ELL
CO
MPL
ETIO
ND
ATE
04/0
1/66
03/0
8/84
05/1
1/76
08/2
4/91
08/2
4/72
11/0
1/65
10/2
1/11
03/1
4/62
01/0
3/59
02/1
0/09
02/0
9/71
10/3
0/58
10/2
4/11
01/1
887
08
/20/
0512
/19/
8607
/07/
9702
/01/
6708
/07/
6810
/30/
7604
/20/
8501
/17/
8506
/14/
5005
/24/
8206
/01/
2903
/21/
4409
/05/
6608
/24/
6411
/17/
6007
/05/
6801
/24/
6511
/10/
5609
/02/
9707
/18/
8408
/21/
1101
/23/
1108
/15/
8401
/05/
7303
/25/
0004
/26/
89
12/0
6/89
08
/12/
6112
/31/
7108
/25/
3703
/07/
47
TOTA
LD
EPTH
7002
6237
3402
5018
3915
3631
1008
836
7270
4090
8232
1535
1393
1024
4082
2250
0073
1611
442
2287
3440
6395
4500
4227
8800
1750
3377
5503
4168
3128
5617
3175
3360
8292
7225
9038
8720
3500
3242
5700
5380
1020
069
1944
9729
2756
32
FOR
MA
TIO
N
AT
T.D
.
GRA
NIT
EG
RAN
ITE
MT.
SIM
ON
TREM
PEA
LEA
U
GRA
NIT
E
G
RAN
ITE
GRA
NIT
E G
RAN
ITE
GRA
NIT
E
TR
EMPE
ALE
AU
GRA
NIT
E
G
RAN
ITE
BLA
CK
RIV
ER
U
NK
NO
WN
ROSE
RU
N
GRA
NIT
E
TR
EMPE
ALE
AU
G
RAN
ITE
ST. P
ETER
GRA
NIT
E
G
RAN
ITE
GRA
NIT
E
ST
. PET
ER?
G
RAN
ITE
WA
SH
ST. P
ETER
GRA
NIT
E
G
RAN
ITE
MT.
SIM
ON
GRA
NIT
E
G
RAN
ITE
MT.
SIM
ON
GRA
NIT
E
RO
SE R
UN
GRA
NIT
E W
ASH
G
RAN
ITE
GRA
NIT
EG
RAN
ITE
GRA
NIT
E
TR
EMPE
ALE
AU
"MID
DLE
RU
N"
ROSE
RU
N
G
RAN
ITE
GRA
NIT
E W
ASH
G
RAN
ITE
GRA
NIT
E
WEL
LC
LASS
FWC
SWIW
FWC
DPW
CFW
CFW
CSW
IWFW
CFW
CD
PWC
DPW
CFW
CST U
NK
N.
DPW
CD
PWC
D
PWC
DPW
CFW
CFW
CSW
IWFW
CFW
CD
PWC
FWC
FWC
DPW
CFW
CFW
CIW
DW
FWC
FWC
POO
LSW
IWSW
IWD
PWC
FWC
DPW
CFW
CC
ORE
DPW
C
DPW
CFW
CD
PWC
FWC
Revised October 2011
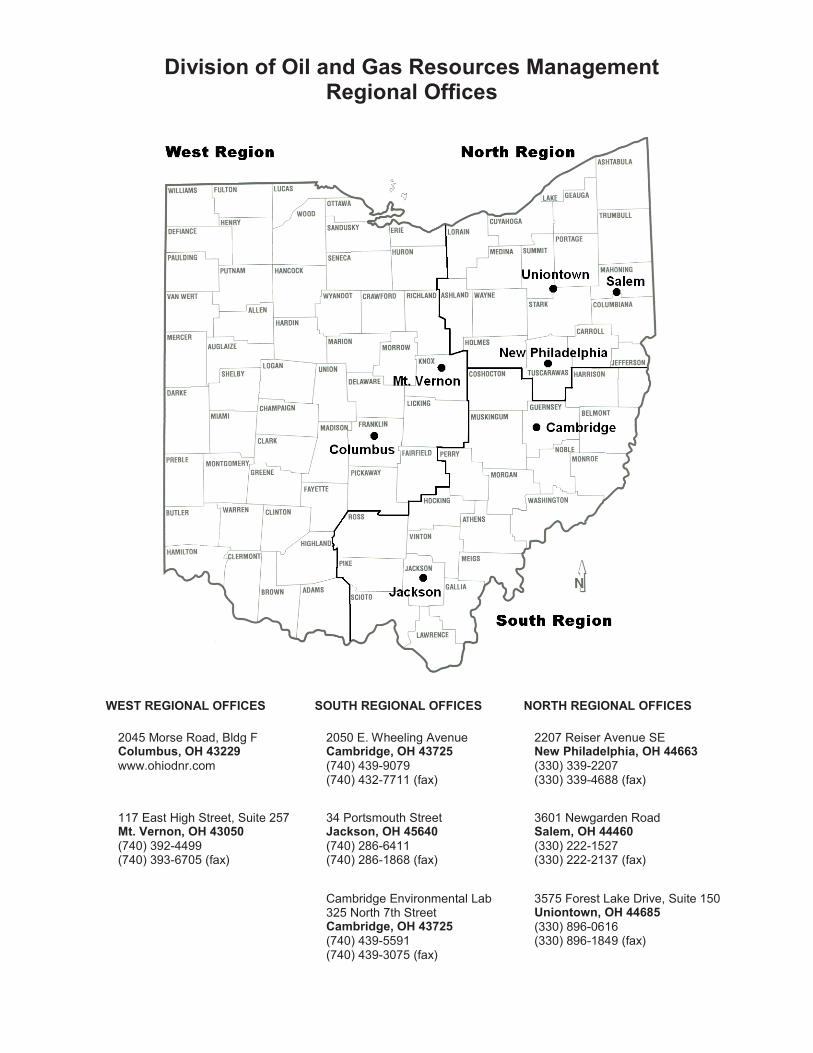
Division of Oil and Gas Resources ManagementRegional Offices
WEST REGIONAL OFFICES SOUTH REGIONAL OFFICES NORTH REGIONAL OFFICES
2045 Morse Road, Bldg FColumbus, OH 43229www.ohiodnr.com
2050 E. Wheeling AvenueCambridge, OH 43725(740) 439-9079 (740) 432-7711 (fax)
2207 Reiser Avenue SENew Philadelphia, OH 44663(330) 339-2207(330) 339-4688 (fax)
117 East High Street, Suite 257Mt. Vernon, OH 43050(740) 392-4499(740) 393-6705 (fax)
34 Portsmouth StreetJackson, OH 45640(740) 286-6411(740) 286-1868 (fax)
3601 Newgarden RoadSalem, OH 44460(330) 222-1527(330) 222-2137 (fax)
Cambridge Environmental Lab325 North 7th StreetCambridge, OH 43725(740) 439-5591(740) 439-3075 (fax)
3575 Forest Lake Drive, Suite 150Uniontown, OH 44685(330) 896-0616(330) 896-1849 (fax)
OHIO DEPARTMENT OF NATURAL RESOURCESDIVISION OF OIL AND GAS RESOURCES MANAGEMENT
2045 Morse Road, Building F-2Columbus, Ohio 43229-6693
www.ohiodnr.com
An equal opportunity employer—M/F/HPrinted on recycled paper


