Service Assessment OHIO RIVER VALLEY FLOOD OF MARCH 1997 August 1998 U.S. Department of Commerce National Oceanic and Atmospheric Administration National Weather Service Office of Hydrology Silver Spring, Maryland
Transcript
Service Assessment
OHIO RIVER VALLEY FLOOD OFMARCH 1997
August 1998
U.S. Department of CommerceNational Oceanic and Atmospheric AdministrationNational Weather ServiceOffice of HydrologySilver Spring, Maryland
Service Assessment
OHIO RIVER VALLEY FLOOD OF MARCH 1997
August 1998
U.S. DEPARTMENT OF COMMERCEWilliam M. Daley, Secretary
National Oceanic and Atmospheric AdministrationD. James Baker, Administrator
National Weather ServiceJohn J. Kelly, Jr., Assistant Administrator
ii
PREFACE
The National Weather Service (NWS), a line office of the Department of Commerce’s (DOC)National Oceanic and Atmospheric Administration (NOAA) is responsible for providing publicforecasts and warnings of weather and river conditions for the protection of life and property andto enhance the Nation’s economy. The NWS conducts a survey of significant weather events tothoroughly assess the performance of the forecast system.
A NWS evaluation team was sent to the Ohio River Valley following severe weather events inearly March of 1997 that produced extensive flash flooding and record river flooding across theregion. The team focused on the hardest hit areas in the Ohio Valley including north central Kentucky and southwest Ohio. The team met with staff members of NWS offices in Louisville,Kentucky, and Wilmington, Ohio, the Ohio River Forecast Center (OHRFC), and the NationalCenters for Environmental Prediction’s (NCEP) Hydrometeorological Prediction Center (HPC),as well as with State Emergency Management Agencies (EMAs) in both Kentucky and Ohio.
The survey provides an evaluation of the NWS weather forecasting and warning program andoffers recommendations for improvements in products and services. The survey team wishes tothank all of the NWS personnel and state EMA officials that contributed information to the team.
We wish to express our sympathy for the losses experienced by the survivors of the floods andextend our deepest regards to the friends and families of the ones lost to the disaster.
John J. Kelly, Jr. Assistant Administrator for Weather Services
iii
FOREWORD
The commitment to excellence was demonstrated in the products and services provided by thestaffs at NWS offices throughout the Ohio Valley Flood of March 1997. These talented anddedicated NWS teams were honored by being recipients of important achievement awards in themonths following the event. NWSFO Louisville, NWSO Jackson, and NWSO Paducah each received the 1997 NOAA BronzeMedal Awards. NWS Ohio River Forecast Center and NWSO Wilmington were each presentedthe 1997 DOC Silver Medal.
The outstanding performance of these offices serves as examples for all of us.
Glenn S. Austin, Survey Team LeaderDeputy Chief, Hydrologic Operations DivisionNational Weather Service
iv
SERVICE ASSESSMENT TEAM
Following a major storm in which there has been a loss of life or extensive damage, a serviceassessment team may be assigned by the NWS to provide an objective appraisal of products andservices and to make findings and recommendations for improving service. Such a team wasassembled to survey The Ohio Valley Flood of March 1997.
TEAM MEMBERS
Team Leader Glenn Austin Deputy Chief, Hydrologic Operations Division, Office of Hydrology, NWS
Headquarters, Silver Spring, Maryland
Kenneth Rizzo Meteorologist in Charge, NWSFO Milwaukee, Wisconsin
Al Matte IFLOWS Program Manager, NWS Eastern Region Headquarters,Bohemia, New York
Bryce Finnerty (former) Research Hydrologist, River Forecast Systems Group, Office ofHydrology, NWS Headquarters, Silver Spring, Maryland. Currently, Special Projects Section Leader, Dewberry & Davis Inc., Fairfax, Virginia
v
TABLE OF CONTENTS
Page
Preface......................................................................................................................... ii
Foreword..................................................................................................................... iii
Service Assessment Team............................................................................................. iv
Acronyms and Abbreviations........................................................................................ vi
Executive Summary..................................................................................................... ix
Findings and Recommendations................................................................................... 1Ohio River Forecast Center.............................................................................. 1NWSFO Louisville, Kentucky.......................................................................... 1NWSO Wilmington, Ohio................................................................................ 1Emergency Management.................................................................................. 2Observational Data.......................................................................................... 3Dissemination.................................................................................................. 3
Appendix A - Hydrometeorological Summary.............................................................. A-1Antecedent Conditions..................................................................................... A-1Hydrometeorological Discussion...................................................................... A-1
Appendix C - Data Collection Systems......................................................................... C-1Background ..................................................................................................... C-2Automated Flood Warning Systems.................................................................. C-2
Appendix D - Office Summaries................................................................................... D-1Ohio River Forecast Center............................................................................... D-1NWSFO Louisville............................................................................................ D-4NWSO Wilmington.......................................................................................... D-5
vi
ACRONYMS AND ABBREVIATIONS
AFOS Automation of Field Operations and ServicesAFWS Automated Flood Warning SystemAHPS Advanced Hydrologic Prediction SystemAPI Antecedent Precipitation IndexAWIPS Advanced Weather Interactive Processing SystemCOMET Cooperative Program for Operational Meteorology and Educational TrainingCSI Critical Success IndexCWA County Warning AreaDAPM Data Acquisition Program ManagerDCP Data Collection PlatformDES Department of Emergency ServicesDWOPER Operational Dynamic Wave ModelEM Emergency ManagersEMA Emergency Management AgencyEOC Emergency Operation CentersESF Flood Potential StatementFEMA Federal Emergency Management AgencyFFA Flash Flood WatchFFW Flash Flood WarningFLDWAV Flood Wave (Dynamic Routing Model in NWSRFS)FLW River Flood WarningGUI Graphical User InterfaceHAS Hydrometeorological Analysis and SupportHPC Hydrometeorological Prediction CenterHSA Hydrologic Service AreaICP Interactive Calibration ProgramIFLOWS Integrated Flood Observing and Warning SystemKDES Kentucky Disaster and Emergency ServicesKEWS Kentucky Emergency Warning SystemMAP Mean Areal PrecipitationMIC Meteorologist in ChargeNCEP National Centers for Environmental PredictionNEXRAD NEXt Generation RADarNOAA National Oceanic and Atmospheric AdministrationNWR NOAA Weather RadioNWSFO NEXRAD Weather Service Forecast OfficeNWSO NEXRAD Weather Service OfficeNWSRFC National Weather Service River Forecast SystemNWS National Weather ServiceNWW NOAA Weather Wire
vii
OFS Operational Forecast SystemOHRFC Ohio River Forecast CenterPQPF Probabilistic Quantitative Precipitation ForecastsQPF Quantitative Precipitation ForecastsRFC River Forecast CenterRVF River Forecast GuidanceSOO Science and Operations OfficerSTORMS State of Ohio Rain Monitoring SystemUSACE U.S. Army Corps of EngineersUTC Coordinated Universal TimeWCM Warning Coordination MeteorologistWFO Weather Forecast OfficeWSR-88D Weather Service Radar-1988 Doppler
viii
ix
EXECUTIVE SUMMARY
Introduction: A record event
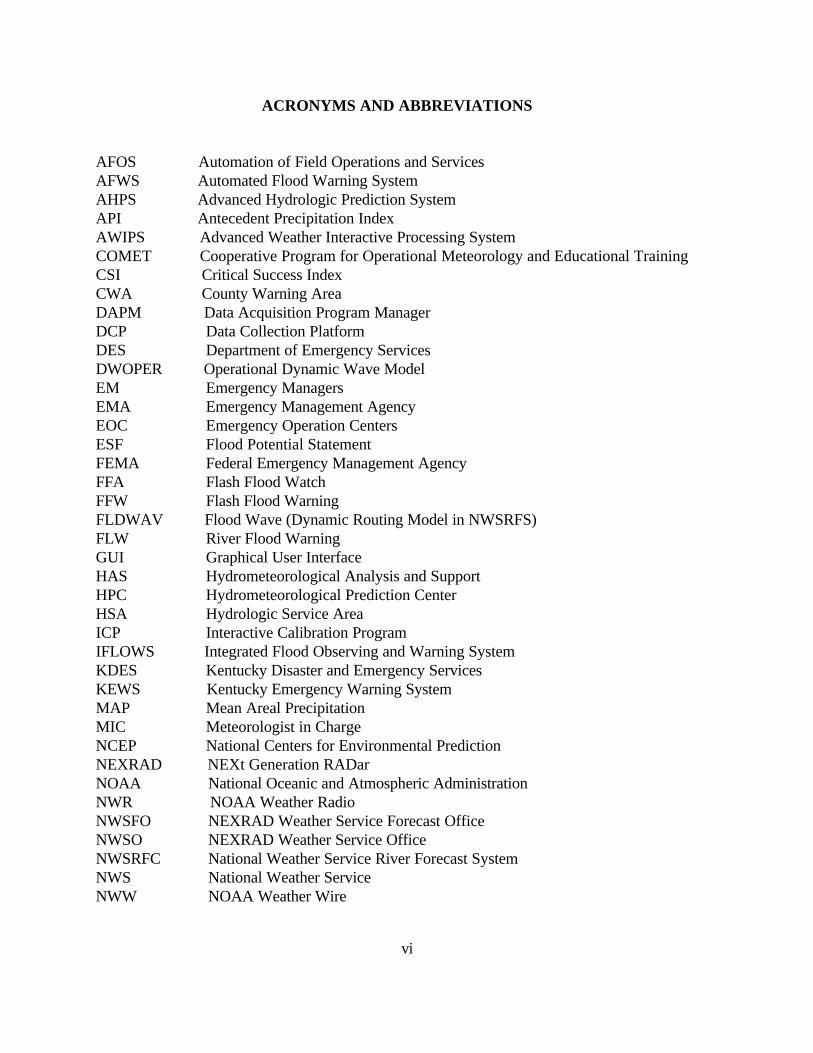
The Ohio Valley is frequented by floods on an annual basis. However, flooding of the magnitudecomparable to the floods of March 1997 is a rare occurrence. Between March 1 and 3 , as much as6 to 12 inches of rain fell in parts of northern Kentucky and southern Ohio. (See Figure 1.) Thisproduced a variety of flooding ranging from flash flooding in hilly terrain and poorly drained areas,to small stream flooding in rural and urban areas, followed by very serious flooding that developedalong the Ohio River as well as many of its tributaries.
Record flooding resulted along many rivers in northern Kentucky including the Rolling Fork Riverat Boston, South Fork of the Licking River at Cynthiana, and the Licking River at Blue Licks Springand Falmouth. Record, or near record, flooding also occurred in Ohio with the most serious floodingreported along Brush Creek and the Scioto and Great Miami Rivers. Levels on the main stem of theOhio were the highest in over 30 years.
Impact: Damages and fatalities
Disastrous flooding inundated dozens of river towns and cities forcing evacuations of thousands ofpeople. Most of the town of Falmouth in Pendleton County, Kentucky, with over 2,400 residents,was evacuated. Flooding also inundated several other towns across the region including Boston,Kentucky, where the water level reached the rooftops of many homes and smaller businesses.
Several communities along the Ohio River were given notice to prepare for flooding a day or morein advance. This helped reduce damages significantly. Early warning of the flood allowed the cityengineers in Louisville to make use of the 45 flood gates, installed after the historic floods of 1937,that protected all but the lowest elevations. Meanwhile, upstream, the NWS was given partial creditfor saving Opening Day of the Cincinnati Reds Baseball season. Forecasts from the OHRFC wereused in the flood warnings issued by NWSO Wilmington and relayed to the management at CinergyField. Flood gates were closed and pumps activated that kept the flood water out of the stadium.The flood warnings not only saved opening day, but also kept a new $2 million astroturf installationfrom being ruined.
Major flooding impacted a total of six states across the region. The most severe flooding occurredin Ohio and Kentucky with dozens of counties in each state declared natural disaster areas. Close to14,000 homes were damaged or destroyed. Over 20,000 home and business owners applied fordisaster relief. Damage estimates totaled more than $500 million.
Although effective lead time was provided by the NWS in the form of river flood and flash floodwarnings, a total of 33 people lost their lives due to flooding, including 21 in Kentucky, 5 in Ohio,4 in Tennessee, and 3 in West Virginia. Hundreds of injuries were also reported. Many of these
x
Figure 1. Storm Total Rainfall March 1-3, 1997.
losses may have been preventable. A dozen deaths were caused by drowning associated with vehiclesbeing swept away by flood currents. One university professor drowned while kayaking on a floodedriver, two drowned in a canoeing accident during the height of the floods, and another reportedly drowned while floating in a flooded stream in an inner tube. Five other victims of the floods weresafely evacuated but became worried about their property and returned home only to be trapped byrising water and drowned. The specifics on the remaining deaths were not available.
xi
Modernized NWS Forecast and Warning Services - An Operational Assessment
The NWS offices involved in this flood event produced literally hundreds of flood watches, warnings,and follow-up statements. NWSFOs at Cleveland, Indianapolis, Louisville, and Charleston issuedflash flood watches for their respective forecast areas 4-8 hours ahead of the first occurrenceflooding. New “spin-up” offices (e.g., NWSOs in Paducah and Jackson, Kentucky, and Wilmington,Ohio) were tested during this major event. Although many of their staffs had little or no previousexperience dealing with a flood event of this magnitude, the service assessment revealed that eachoffice performed admirably by providing timely and effective flood warnings for their service areas.Ironically, Jackson, Kentucky, assumed responsibility for their hydrologic service area (HSA) onMarch 1, 1997, the first day of the flood.
NWS modernization and restructuring includes the transferring of forecast and warning services fromthe original 52 weather service forecast offices (approximately one per state) to 121 “advanced”Weather Forecast Offices across the country. The transition for hydrologic services to the spin-upoffices in the Ohio Basin was completed prior to the timing of the event. This produced manypositive effects on field operations and services, as demonstrated during this flood. For example, theNWSFO Louisville office previously was responsible for 80 specific river forecast points. Thisnumber has now been reduced to 23 with the remaining sites distributed to several of the new offices;such as, Paducah, Jackson, and Wilmington.
Having the workload distributed to all of these offices helped make the job more manageable andhelped the staffs produce more timely flood watches and warnings. One negative effect the transitionhas produced is that by dividing some of the river basins between two or more HSAs, it now makesdata collection and forecasting more complex requiring the River Forecast Center and emergencymanagers (and other customers) to coordinate with more local NWS offices.
The implementation of a National quantitative precipitation forecasting (QPF) program was anotherNWS modernization milestone that helped NWS meteorologists and hydrologists perform moreeffectively. Forecasters are now able to use a combination of hydrometeorological tools providedby NWS modernization (e.g., mesoscale models, WSR-88D radar, and satellite estimates ofprecipitation, etc.) along with specialized training to predict the location and timing of significantrainfall.
The OHRFC has been engaged in a Modernization Risk Reduction Exercise that was initiated in 1991to evaluate the interaction of the RFC HAS function in the production of QPF through theassimilation of QPF input from NCEP and the NWSFOs/NWSOs serving the Ohio Basin. As a resultof this effort, two interactive operational software components (HASQPF and WINQPF) weredeveloped. These were used effectively during this major event to create QPFs, produce an RFCmosaic of the QPF, and process the basin average QPFs into the OHRFC forecast model.
While the production of QPF is somewhat new to many local NWS offices (NWSO Wilmingtonstarted producing routine QPF in October 1996), the Hydrometeorologic Prediction Center (HPC)
xii
has been involved in producing National scale QPF for 20 years. Their expertise and leadership havebeen instrumental in helping develop similar abilities at the local offices.
The HPC QPF products are used as guidance by the local offices. Despite only modest success withthe 24-hour QPFs, there was considerably more important information relayed to the field officesthrough the HPC 6-hourly forecasts and excessive rainfall forecasts. A special excessive rainfalldiscussion issued at 10:00 p.m. Friday, February 28 indicated a potential for flood producing rainsin the Ohio Valley, and, as early as 2:00 a.m. Saturday, March 1st, the HPC sent messages to thefield offices raising the concern of a very serious flood threat for the region. This was 6-12 hoursbefore the first significant flooding developed.
Internal and External Coordination
A review of the official logs indicated that coordination of critical information (e.g., QPF gage data,etc.) was effectively accomplished between National, regional, and local NWS offices. Interviewswith users revealed the transfer of forecast and warning information to state and local emergencymanagement was performed with sufficient time to permit life-saving evacuations in many cases andproperty-saving emergency actions in several others.
The local NWS offices as well as regional public affairs specialists handled large volumes of queriesfrom the media on national and local levels concerned about the flooding. Contacts included: ABC,CBS, and NBC television networks, Jim Lehrer News Hour, World News Tonight, DiscoveryChannel, NBC Dateline, Associated Press, “The Washington Post”, “USA Today”, and almost all ofthe local newspaper, radio and television outlets. A media advisory prepared by Eastern Region anddistributed over the NOAA Fax Board and Internet system listed NWS personnel the media couldcontact for information in the Eastern, Southern, and Central Regions. Also included were NWSInternet addresses for online information.
Summary
The Assessment Team reports that NWS forecasts and warnings, along with extensive preparednessefforts, resulted in substantial savings in flood damages and helped reduce the number of deaths andinjuries caused by the floods. Effective use of new technologies; such as, the WSR-88D radars andSTORMS and IFLOWS raingage networks significantly helped forecasters monitor conditions andproduce early flood watches and warnings. When equipment and communications failures did occur,NWS offices worked effectively to minimize the impact on operations.
xiii
Current efforts to implement more sophisticated river forecasting procedures were not in place duringthis event. This brings hope that these improvements will lead to even more timely and accurateforecasts of future floods. Restoration of stream gages that have been closed; such as, the onediscontinued at McKinneysburg, Kentucky, will continue to be a high priority, especially for thosegages located upstream of flood prone areas. Certainly, timely data from these gages would alsoimprove the timeliness and accuracy of our forecasts and warnings.
However, the larger challenge for the NWS is to continue to develop the capability to predict largerainfall events that produce excessive amounts of rain and cause devastating floods. In order toadvance our capabilities, we need improved science, modeling, operational enhancements, real-timeautomated data, and the ability to portray the uncertainties in the forecast data in a way the public andother NWS customers can understand and use. In addition, outreach efforts to better educateemergency managers, media, and the general public regarding the dangers associated with floodingneed to be increased in order to help reduce the number of lives lost and damages incurred duringfloods like the Ohio Valley Flood of March 1997.
1
FINDINGS AND RECOMMENDATIONS
Ohio River Forecast Center Finding A-1: Ohio EMA expressed interest in probabilistic river stage forecasts and urban floodinundation maps in order to assess the “worst case” scenarios and the magnitude of high, medium,and low-risk events.
Recommendation A-1: The OHRFC should implement procedures which can be used to createthe types of river products Ohio EMA has requested.
Finding A-2: River forecasts are created by OHRFC and intended for the use of the local NWSoffices it supports, as well as some special cooperators. Improper redistribution by somecooperators has made these “internal” products accessible to the public via the Internet.
Recommendation A-2: Appropriate labeling and disclaimer information should be used in theseproducts and on webpages to eliminate any potential confusion between the content of the riverforecasts issued by the OHRFC and the River Flood Warnings and Statements issued by the localNWS offices. OHRFC should coordinate with the USACE to ensure that river forecasts are notdistributed, to the extent permitted by law..NWSFO Louisville, Kentucky
Finding B-1: During the flooding, NWSFO Louisville was involved with multiple severeweather threats as well as the flood threat. All fatalities in the Louisville service area, however,were flood related.
Recommendation B-1: NWS Louisville should increase the visibility of the dangers associatedwith flooding in their weather education programs, and to the extent possible, increase theiroutreach efforts on flood preparedness.
NWSO Wilmington, Ohio
Finding C-1: NWR coverage is poor in Scioto County, Ohio, and the surrounding area.
Recommendation C-1: The NWS should continue to work with the Ohio EMA and others ongetting the necessary equipment installed and operating in the Portsmouth, Ohio, area.
2
Emergency Management
Finding D-1: Kentucky and Ohio emergency operations centers (EOCs) have a tremendousworkload during severe weather and flooding events as they become inundated with numerouswatches, warnings, and follow-up statements from several different NWS offices. The EOC has adifficult time assimilating this information and relaying it to the county EMs.
Recommendation D-1: Changes should be considered in NWS products to make them easier tounderstand and use by customers such as the EOCs.
Finding D-2: Kentucky Emergency Management Officials were not fully aware of moderninformation technologies; such as, the Internet and the Emergency Management WeatherInformation Network (EMWIN), that can provide them with access to important NWS weatherforecasts and warnings.
Recommendation D-2: NWSFO Louisville should inform and educate Kentucky EmergencyManagement on these information technologies.
Finding D-3: There is a high turnover rate at the local (county) offices of emergencymanagement. These people play a critical role in disseminating important weather warnings andinformation in their communities.
Recommendation D-3: The local NWS should become more active in working with the stateand county emergency management officials in Kentucky and help plan and conduct periodictraining workshops.
Finding D-4: Emergency management officials experienced added levels of complexity ininterpreting NWS products issued under different regional policies.
Recommendation D-4: Recognizing that products are tailored to meet the needs of severaldifferent local customers, NWS headquarters and regional offices must address productuniformity and standardization to reduce impact on users; such as, state EMs, who rely onproducts from several different NWS offices.
Finding D-5: A valuable supplemental service was provided to the emergency managementcommunity by the use of pagers to alert EMs in Ohio of the issuance of watches and warnings. Pagers have been particularly useful in areas where NWR coverage is poor or when EM directorsare away from their homes or offices.
Recommendation D-5: EMs should take advantage of commercial pager services that currentlydeliver NWS watches and warnings available from EMWIN or NWW.
Finding D-6: The video “Low Water Crossing - The Hidden Danger” that was produced by theNWS Office of Hydrology (OH) has become a very popular tool in revealing the dangers thatdevelop when roads and bridges become covered by flood water. (Over one-third of the fatalitiescaused by the severe flooding during this event were operators or passengers of vehicles that were swept away by flood waters.) The Kentucky DES would like to get sufficient copies of the videoto provide one to each of their 120 county EMs.
Recommendation D-6: OH should provide copies of the video to Kentucky DES.
Observational Data
Finding E-1: Weather Service Radar-88D (WSR-88D) precipitation estimates were theinvaluable tool that most flash flood warnings were based on. Radar precipitation estimates werewithin an inch of reliable ground truth measurements. The WSR-88D performed superbly duringthe event.
Recommendation E-1: None.
Finding E-2: The rain gage network in many parts of Kentucky (including the Licking RiverBasin) is not adequate to provide a good estimate of the areal rainfall.
Recommendation E-2: NWS officials at local, regional, and National levels, as well as the EMcommunity, need to remain focused on reducing this problem. If funding becomes available, theKentucky IFLOWS Network should be expanded to include these data-sparse areas. Also, allefforts should be made to expand and complete the STORMS system in Ohio as originallyplanned.
Finding E-3: Many manually read stream gages (including those located at Falmouth and BlueLicks Spring, Kentucky) were inaccessible due to high water during the flooding.
Recommendation E-3: NWS should produce a prioritized list of sites that could be automatedand continue to work with cooperators to establish a more effective stream gage network asfunding permits.
Dissemination
Finding F-1: The Internet played an important and significant role supplementing NOAAWeather Wire (NWW) and NOAA Weather Radio (NWR) in the warning information dissemination process. However, not all NWS products are currently available over the Internet.
Recommendation F-1: The Interactive Weather Information Network (IWIN) should beenhanced and become a reliable database that includes access to all NWS public products.
A-1
APPENDIX A
HYDROMETEOROLOGICAL SUMMARY
Antecedent Conditions
Soil moisture was near normal across the Ohio Valley prior to the March floods. Whileprecipitation had been at, or above, normal in the fall, the winter months of December throughFebruary saw precipitation amounts averaging nearly 200 percent of normal. The growing seasonhad not started. Therefore, once heavy rain developed, greater runoff volumes were produced than would have occurred had the vegetation been active. Stream levels were well within theirbanks and the main stem rivers, including the Ohio River were at seasonal levels. There was nosnowpack in the Ohio River Basin on the last day of February, the day before the heavy rainsstarted to fall.
Hydrometeorological Discussion
Large scale mechanisms provided all of the right ingredients to produce excessive rainfall. Anupper level ridge was positioned over the east coast with a longwave trough located just east ofthe Rocky Mountains at 00Z Coordinated Universal Time (UTC) on Saturday, March 1, 1997. This produced a southwest flow aloft over the Ohio Valley throughout the first weekend inMarch. Perturbations were ejected out of the base of the trough and traveled over the OhioValley producing an unstable atmosphere. A low level jet with wind maximums of 50 knotsdeveloped and persisted for more than 24 hours. The low level jet helped transport abundantmoisture and warm temperatures northward into the region Friday night and Saturday. Precipitable water values increased to nearly 200 percent with surface dew-points in the regionreaching into the mid-60s.
A warm front proceeded to move slowly northward during the day reaching north of the OhioRiver by Saturday night. Widespread moderate to heavy rainfall developed over Arkansas andMissouri then spread northeast across the Ohio Valley. Extremely strong storms over the mid-south produced destructive tornadoes with the greatest devastation occurring in Arkansas whereover 20 deadly twisters developed during the day.
The instability axis shifted northeast and intersected with an outflow boundary over Kentucky lateSaturday. Steady rainfall conditions developed over northern Kentucky, as well as adjacent partsof southern Indiana and Ohio, and western West Virginia, fed by a persistent influx of Gulf moisture transported northward by the low level jet. Copious rainfall continued Saturday nightand into Sunday morning as numerous thunderstorms repeatedly tracked over the same area. The rain temporarily subsided Sunday but reintensified as the main upper level storm system kickedout and traversed the region Sunday night and early Monday.
B-1
APPENDIX B
FOCUS AREAS
QPF
QPF is a future basin average precipitation forecast product which is input directly to rainfallrunoff models for river forecasting. The end-to-end QPF process starts with the issuance of QPFfrom NCEP’s HPC. These National-scale QPF products are used as guidance by the WeatherForecast Office (WFOs) and RFCs. WFOs issue local-scale QPF based on several factors,including HPC products, atmospheric model output, current hydrometeorological factors,including remote-sensed data (e.g. satellite, sounding, and radar information, etc.), and knowledgeof local climatology. All the WFOs in the OHRFC area send their QPF to the RFC where it ismosaicked together, and significant inconsistencies between adjacent areas are resolved usingverbal communications or with software tools. In this particular event, the HAS forecasters calledHPC and the WFOs to coordinate on the final QPF estimates before using them as input to thehydrologic models.
Figures 2a, 2b, and 2c, show QPF from the HPC, WFOs (NWSFOs and NWSOs), and OHRFC,respectively, spanning from 12Z on March 1 through 12Z on March 2. Figure 2d shows theobserved mean areal precipitation (MAP) for the event. Figure 2a shows the HPC QPF forecastsattempted to resolve the large-scale temporal and spatial character of the precipitation andgenerally predicted the rainfall pattern to be in an elongated southwest to northeast pattern.
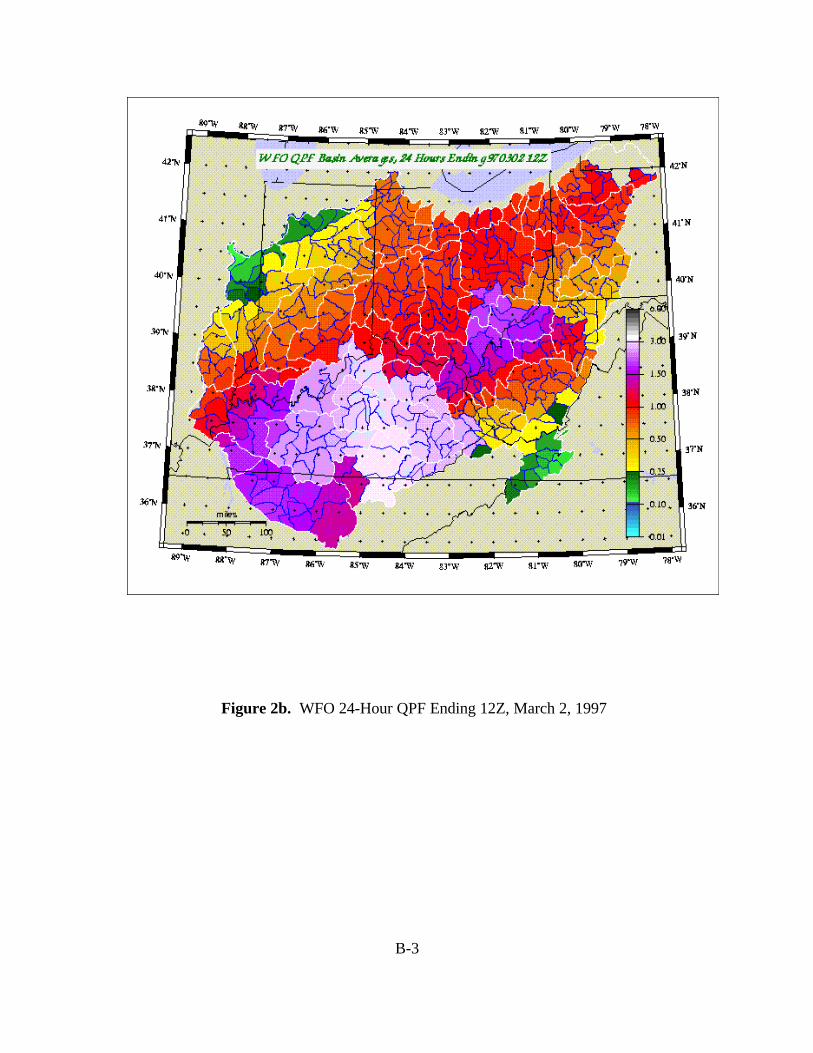
WFO QPF attempted to resolve these same precipitation characteristics at a much finerresolution. Figure 2b is a composite of QPF forecasts issued by several NWS offices in theOHRFC area of responsibility. As these forecasts were issued a couple of hours after the HPCguidance, it is clear that forecasters made some adjustments moving the area of greatest rainfallexpected northward and closer to the forecast position of the warm front. The magnitude of theexpected maximum rainfall was increased as well. The figure also illustrates significant spatialdifferences in forecasts that can occur between different offices. (For example, notice 3 inches(light purple) v.s. 1 inch (red) in northern Kentucky.)
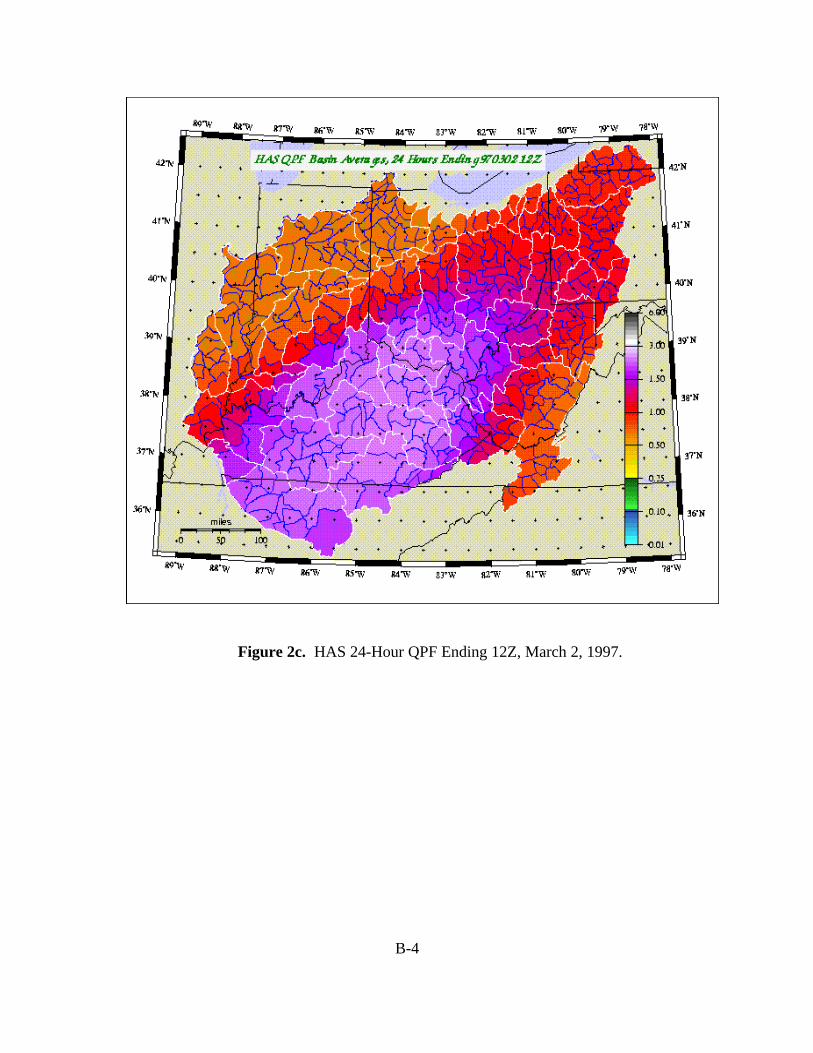
Figure 2c depicts how the Hydrometeorological Analysis and Support (HAS) forecaster at theRFC eliminated these sharp differences by smoothing the spatial variability of the QPF into anRFC-wide product. Figure 2d shows the observed basin average rainfall for the 24-hour period.The figure identifies the sharp spatial boundaries and variability of the observed rainfall. Although the mosaicked QPF did not capture the small scale differences and maximum rainfallthat occurred in these sub-basins, it was accurate at depicting the basins where the rainfall wasconcentrated. Updated QPF was used in later model runs as forecasters and hydrologistscontinued to produce forecasts and warnings of the rising river levels.
B-2
Figure 2a. HPC 24-hour QPF ending 12Z, March 2, 1997
B-3
Figure 2b. WFO 24-Hour QPF Ending 12Z, March 2, 1997
B-4
Figure 2c. HAS 24-Hour QPF Ending 12Z, March 2, 1997.
B-5
Figure 2d. Actual 24-Hour Basin Avg. Rainfall Ending 12Z, March 2, 1997
B-6
Significant training (i.e., repetition of heavy showers over the same area) occurred overnumerous river basins in parts of north central Kentucky and southern Ohio. One of thehardest hit areas included the Licking River Basin in which lies the town of Falmouth,Kentucky that was evacuated of its approximately 2,400 residents. Figure 3 shows thelocation of the Licking River Basin, towns, and NWS offices. A comparison of this mapwith the previous QPF charts clearly shows the difficulty presented to forecasters andhydrologists who are challenged with predicting the timing and amount of heavy rain overbasins of this small a scale.
Stream Gage Reduction
Up until 1994, an automated stream gage and data collection platform (DCP) was maintainedby the USGS upstream of Falmouth at McKinneysburg, Kentucky. The site was fundedunder a cooperative agreement between the U.S. Army Corps of Engineers, U.S. GeologicalSurvey, and the state of Kentucky. The gage was removed due to loss of funding in the fallof 1994. The NWS strongly opposed the closure of the site and made unsuccessful attemptsto keep it active.
A wire-weight gage exists at Falmouth, Kentucky. Cooperative observers take manualreadings and report river stage levels to the NWS typically once a day. During high waterepisodes, the cooperative observers can be relied upon to provide updates to the NWS morethan once a day. Darkness and extreme flooding make reporting difficult or impossible. Thiswas the case during the March 1997 flood event.
The lack of telemetered stream level information delayed critical information from beingrelayed to NWS forecasters and hydrologists. However, the impact on the timeliness andaccuracy of the river stage forecast at Falmouth is not exactly known as the river forecastsystem could not be reproduced during the service assessment.
External Coordination
The emergency management agencies of both Kentucky and Ohio reported being verysatisfied with the levels of coordination experienced during the event. They had high praisefor the responsiveness of NWS offices to meeting their needs and the levels of interactionthat occurred between the NWS and their own agencies. Two issues that were raised were1) the complexity of dealing with the large volume of products issued during the floodingevent from multiple offices and 2) non-standardization of product content and format.
During the event, Ohio EMA received volumes of flood bulletins from NWS offices in threestates. The EMA reported that efforts to ingest information coming from different officesand decipher it all into a single composite increased the difficulty of their tasks. Kentucky
B-7
Figure 3. Licking River Basin Flood Area.
Department of Emergency Services (KDES), which was involved with products from NWSoffices in two different states (in two different NWS regions), reported similar experiencesand expressed a desire for the NWS to provide some relief from their information recompos-iting and mosaicking requirements.
Ohio EMA, which, unlike Kentucky, does not have a watch officer on duty at the state EOC24 hours a day, also expressed being very pleased with pager notification of watch andwarning issuances by NWS offices within the state. They reported receiving excellent “headsup” information from the NWS state liaison office (NWSO Wilmington) in order to spin uptheir operations and follow up on information as the event developed. They requested thatNWS offices located outside the state boundaries that serve Ohio counties provide a similarservice. Pager notifications, however, could become a significant work load issue for localoffices if not controlled in some manner under some consistent policy. Automating theentire procedure to eliminate any extra steps by a forecaster would help address thispotential.
C-1
APPENDIX C
DATA COLLECTION SYSTEMS
Background
Most automated data collection networks that provided river stage and rainfall information tothe NWS and EMs performed well during the event. However, the frequency of informationfrom automated DCPs was limited to the 4-hour reporting criteria established by the U.S.Army Corps on Engineers (USACE). Automated networks; such as, the STORMS andIFLOWS provided near real-time reporting updating every 15 minutes. A computer failureat NWSO Wilmington did, for a time, compromise the availability of STORMS andIFLOWS data to the Wilmington office (see below). There were also a few stream gageslost during the flood, but most operated reliably throughout the event.
Manual coop observer networks were significantly degraded at critical times during the event as observers became increasingly involved in efforts to protect their own lives and property. NWSFO Louisville lost about 30 percent of all its observers as the event unfolded. Losseswere greatest in areas where rain fell the heaviest and from which the information was mostneeded. While NWSO Wilmington lost the input from only a few manually collectedobservations, one of those lost was from Falmouth, Kentucky. The last stage reading NWSOWilmington received from Falmouth, taken by a dedicated observer using a wire-weightgage, was about 12:00 noon on Saturday, after which the observer was evacuated. Policeand emergency management personnel attempted to continue to keep the Wilmington officeinformed of river stage; but as the gage site became increasingly inaccessible, and eventuallytotally submerged, only crude estimates from a distance could be provided.
WSR-88D doppler radar estimates of rainfall were very accurate and were the primary toolby which both NWSFO Louisville and NWSO Wilmington issued their flash flood warnings. While extreme catches of rainfall at specific gages (13.42 inches for IFLOWS and 9.18 inchesfor STORMS) did exceed radar estimates, the WSR-88D depicted rainfall distribution andaverage intensities very accurately and was indispensable in keeping forecasters appraised ofthe developing situation.
Automated Flood Warning Systems
Automated flood warning systems (AFWS) utilize real-time event-initiated precipitationgages, stream gages, and other automated sensors to provide the NWS and emergencymanagement (EM) community time-critical information on flash flood threats. Information isprovided on a time frame, at a frequency, and from locations at which it otherwise might notbe available. Whether used independently or in conjunction with WSR-88D radar
C-2
information and other modernized NWS technologies, such systems can be a very effectivetool for forecasters to use in maximizing lead times for flash flood watches and warnings andto provide input into river forecast models for the preparation of main stem river forecasts.
Kentucky IFLOWS
The Kentucky IFLOWS is operated under a cooperative program administered by the Stateof Kentucky and the NWS. As one of the original IFLOWS states, Kentucky operates andmaintains the system while costs of capital infrastructure replacement are funded through theNWS.
Kentucky IFLOWS is a combined broadcast and polled system. As one of the earliestimplementations of the IFLOWS concept, only local NWS offices, the state EmergencyOperations Center (EOC) in Frankfort, and five state emergency operations centers are fullynetworked with full two-way communications capability. The 37 Kentucky county basestations that are also part of the system operate in a receive only (broadcast) mode. The statecomputer system in Frankfort controls information on the Kentucky network and distributesdata and message traffic to all computers attached to the network including machines atNWS offices in Jackson, Louisville, and Wilmington. Information is passed on furtherthrough gateways to other IFLOWS networks including those of Virginia and West Virginia.
The Kentucky Emergency Warning System (KEWS), a state-wide microwave network, isused extensively for many of these connections. The NWS Automation of Field Operationsand Services (AFOS) network connection to Kentucky IFLOWS is at NWSFO Louisville. With the integration of a USACE flood mitigation project in Harlan County, Kentucky, thereare now 165 precipitation gages and four streamgages in Kentucky available to the NWS andEM personnel over this network. All are located in the eastern portion of the state and, withone exception, in the service areas of NWSFO Charleston, NWSO Wilmington, and NWSOJackson. NWSFO Louisville has one IFLOWS gage located in its warning area.
Ohio STORMS
STORMS is a cooperative effort by the State of Ohio and the NWS and fully funded throughthe State of Ohio. The state supplies all equipment and maintenance for the system. Ohioplans to install STORMS precipitation gages in at least 44 of its counties and has begunimplementation with its most flash-flood-prone counties first.
STORMS presently uses a modified version of NWS IFLOWS software to collectprecipitation data via a state-operated microwave system which passes it on to base stationsat the state emergency operations center in Columbus and NWSFO Cleveland. Informationis then passed via the IFLOWS AFWS network to Weather Service Offices in Wilmington,
C-3
Charleston, and Pittsburgh. Ohio counties dial into the state emergency managementcomputer site at Columbus for information on rainfall, flash flood guidance, etc., in their ownareas. Ohio STORMS data enters AFOS at NWSFO Cleveland. Together with a City ofCincinnati and Hamilton County data system, which has been integrated into the STORMSand IFLOWS networks, there are now 105 precipitation gages and 4 stream gages installedin 23 Ohio counties. At the time of the event, a computer at NWSO Wilmington wascontrolling the exchange of information between NWSO Wilmington, NWSFO Cleveland,and the state EMA in Columbus.
System Performance
IFLOWS and STORMS data were characterized as being extremely valuable, and practicallyindispensable, by offices having parts of these gaging networks in their service areas. Thisinformation was used by offices to keep ahead of the event as it progressed from urbanflooding to flash flooding to small stream flooding and, finally, to river flooding. Theinformation helped forecasters make critical and timely decisions to warn as the eventunfolded.
The excellent performance of the WSR-88D in this event offset, to some extent, NWSFOLouisville’s absence of real-time gage data. Extensive coordination between Louisville andoffices with IFLOWS and STORMS information under their radar umbrellas (e.g.,Wilmington, Jackson, and Cleveland), appears to have also increased and verified theconfidence Louisville staff placed in the high values the WSR-88D was reporting for rainfallintensity during the event.
At approximately 8:34 UTC on February 27, the NWSO Wilmington computer which is theoffice’s link to both the Kentucky IFLOWS and the Ohio STORMS networks, stoppedcommunicating. Initial efforts to restart the system and reestablish communications wereunsuccessful. Since Wilmington was the controlling system among the three networkedoffices in Ohio, information exchange over this network ceased between NWSO Wilmington,the state EOC at Columbus, and NWSFO Cleveland. However, both the state EOC atColumbus and NWSFO Cleveland continued to receive STORMS information over theirdirect connections to the state microwave system. NWSFO Cleveland continued to pass information on to other NWS offices over the AFWS system. The time intensive task ofrebuilding Wilmington’s computer system files was later undertaken and the system broughtback into the networks at approximately 14:34 UTC on March 1.
During the time the computer was off line, NWSO Wilmington relied on AFOS for hourlySTORMS and IFLOWS information. Wilmington also dialed into the state STORMScomputer at Columbus for STORMS graphical applications and data of increased frequency. There was some initial confusion involving a 12-hour time shift on time stamping for theonset of the event, and data representation, on the state STORMS computers. The Ohio
C-4
EMA is continuing to investigate what may have caused this. They are now of the opinionthat it was a software problem which had not manifested itself previously because of thenature of this event. It was of such intensity that it was the first time so many reports fromso many of the increasing numbers of STORMS gages were processed at the same time. The state is taking steps to address such scenarios in the future. These irregularities werelimited to STORMS computers and were not reported in Ohio STORMS gage data that wasprocessed by NWS IFLOWS computers and passed into the AFWS network.
With regard to the Wilmington computer failure, it does appear the problem was atWilmington and was specific to the machine and not with the communication links to it. Rebuilding the files to get it back up and running, however, destroyed much of theinformation on the status of the system when it failed and may make the ultimate conclusionsas to what actually caused the failure speculative.
NWSO Wilmington has responsibility for 12 Kentucky counties, but only four have IFLOWSdata. Gage data was not available in the Kentucky area where the NWS believes the heaviestrain fell (based on radar analysis). There is an active co-operative observer program in thisarea, but their gages were destroyed, or they were unable to report due to personal need toevacuate.
The State of Ohio is in the process of expanding STORMS coverage to five gages per OhioCounty. The NWSO Wilmington is very satisfied with the support from the State of Ohio forthe STORMS network.
Alternative Data Collection/Dissemination Sources
Approximately one week prior to the event, NWSFO Louisville implemented the transfer of Kentucky IFLOWS information to an office Internet Web page. Since then, data from otherstates has been added. This serves as a secondary source of precipitation information on afrequency greater than that which is transferred over AFOS for data from Ohio as well asthat from Kentucky in the event of a future systems failure. In addition, the State of Ohiointends to link NWSO Wilmington to the STORMS data collection network with a dedicatedline in order to provide NWSO Wilmington with direct access to unfiltered STORMS data. While failure of communications links has not been identified as a cause of any data flowinterruption during this event, the additional connectivity would further ensure Wilmington’saccess to the STORMS data stream in the future.
D-1
APPENDIX D OFFICE SUMMARIES
Ohio River Forecast Center
Hydrologic Modeling and Transition Status
River forecasts produced by the OHRFC, in particular those on the main stem of the OhioRiver, were both accurate and timely and provided excellent lead-time for users. TheOHRFC used a locally developed river forecast system called the Interactive Forecast Model(IFM), which was developed in 1988 and designed specifically for the Ohio Basin. Thisunique IFM system is DOS based and runs on a personal computer . It was started withearly versions of the NWS River Forecast System (NWSRFS).
The latest version of NWSRFS is a nationally supported Unix workstation based modularforecasting system which allows an RFC to: process radar data for flood forecasting, changemodel time step output to a shorter time step; such as, 3 hours, uses the Sacramento modelwhich is the cornerstone of NWS hydrologic forecasting; calibrate both runoff and snow meltmodels; generate probabilistic ensemble forecasts; perform reservoir modeling; andimplement the advanced dynamic channel routing techniques in Operational Dynamic WaveModel (DWOPER) and Flood Wave Dynamic Routing Model in NWSRFS (FLDWAV).
The OHRFC transition to modernized operations was initiated in 1995 but was side-trackeddue to a shortage of staffing and extensive flooding that occurred in the Ohio Valley in 1996and 1997. The transition includes a conversion from IFM to the Interactive ForecastProgram (IFP) which consists of the proven hydrologic physical process modeling of theNWSRFS's Operational Forecast System (OFS) combined with a graphical user interface(GUI) to provide river forecasters with: (1) the information needed to make decisions aboutthe correctness of data or model results, and (2) the capability to easily and quickly put thosedecisions into action to produce forecasts reflecting their best judgement about current andfuture hydrometeorologic conditions.
Completion of the transition plan will provide the foundation for advanced hydrologicmodeling techniques; such as, flood inundation mapping, distributed modeling, and theprocessing of probabilistic quantitative precipitation forecasts (PQPF) required to produceprobabilistic river stage forecasts (PRSF). The computer hardware required to perform the transition plan to NWSRFS is already inplace at the OHRFC. Training of the OHRFC staff has been given in the areas of NWSRFS,the operational forecasts system (OFS), the Sacramento model and snow model calibration,and the interactive calibration program (ICP).
D-2
HAS Activities
The HAS program was implemented at OHRFC in 1989 (see reference to Risk Reductionexercise mentioned in the Executive Summary.) Three HAS forecasters on staff are joinedby HAS-qualified hydrologists to assist with the workload when necessary. Routinely, theywork two shifts covering 7:00 a.m. to 10:00 p.m. seven days a week. The HAS functionwent on 24 hours a day shift work starting at 5:30 a.m. on Saturday, March 1, and continueduntil March 10.
There are many demands on the person performing the HAS function; such as, qualitycontrol of the multi-sensor precipitation estimations (Stage III) and coordinating QPF withall the forecast offices in the RFC boundary. The HAS function is ultimately responsible forfinalizing QPF for input into the hydrologic models. OHRFC HAS forecasters specificallymentioned the possibility of heavy rain as early as 6 days prior to the flood event and did anexcellent job of coordinating with local offices and the HPC during the event.
During the flooding, WFOs are generally updated QPF twice a day and submitted it to theOHRFC. The OHRFC produced a mosaicked version of the QPF input from the WFOs thatwas then used as input to river forecasts.
Radar Precipitation Estimates - Stage III
Stage III is an hourly gridded precipitation product which mosaics together all the variousradars in the RFC area and optimally merges them with the gage precipitation estimates. TheHAS forecaster reviews the hourly Stage III products for problems. This manual qualitycontrol procedure is very time consuming.
Stage III has been running at the OHRFC since 1995 but was not used directly as input tohydrologic models during the flood. HAS forecasters experienced extended periods of timewhere Stage III products did not get reviewed because attention was concentrated onmonitoring the event at hand, updating QPF, and coordinating with WFOs.
When Stage III was run, and when the Post Analysis was produced, it was helpful andprovided accurate hourly precipitation estimates. The 1-hour precipitation estimates werevery helpful when 6-hour gages had not reached their reporting times and for assessing theprecipitation fields at odd synoptic times. Figure 4 shows a Post Analysis product whichcompares 24-hour storm totals from the Stage III hybrid precipitation estimates with that ofthe gage-only precipitation estimates. The figure shows that Stage III performed very well.
D-3
Figure 4. Stage III Precipitation Estimate Ending 12Z, March 2, 1997
Operations at OHRFC During a Record Flood Event Hydrologic forecast shifts are staffed at OHRFC from 6:00 a.m. to 10:00 p.m. However,once the radar and ground based gage networks observed significant precipitation developingin the Ohio Valley, OHRFC began 24-hour staffing starting 5:30 a.m. Saturday, March 1,1997, and continuing for 10 days until midnight on Monday, March 10, 1997.
Using precipitation data and QPF, the RFC created numerous river forecasts that were usedby local weather offices who issued dozens of critical flood warnings that helped savehundreds of lives. One such area was Falmouth, Kentucky, where an accurate and timelyflood forecast and warning was instrumental in helping to initiate the evacuation of thetown’s residents.
OHRFC had a tremendous number of telephone calls to deal with. The media contributed adisproportionately large volume of calls to the RFC workload. Even the public was callingthe RFC for information without going through the established channels. Barge operators onthe Ohio River were reported to have called from their towboats using cellular phones inorder to get the most up-to-date river information.
D-4
NWSFO LOUISVILLE
Operations at a Forecast Office During a Record Flood Event
Residents across northern Kentucky and southern Ohio all had the same thing to say aboutthis event. They never saw it rain that hard in their entire lives. It rained, and it rained, thenit rained harder. Storm drains failed to handle the excessive runoff rates. Highways becamechannels for handling storm water surpluses. Cars and trucks became amphibious vehicles,many with passengers trapped within.
The NWSFO Louisville hydrologic service area (HSA) stretches from southern Indianacounties located across the Ohio River from Louisville south to the Tennessee border. Asfrequently happens, portions of the HSA were under Severe Weather Watches and Warningswhile the forecaster was busy issuing the first Flash Flood Watch for the area before dawnSaturday. Flash flood warnings quickly followed before the midnight shift had a chance to berelieved that morning. Rainfall of 1 to 3 inches was already measured in some areas by 12:00UTC Saturday, March 1.
The threat of severe weather persisted all day over Kentucky. However, actual severestorms remained isolated and primarily developed over the south central and southeast partsof the state. Before noon, forecasters shifted their focus to the heavy, persistent rainfall butstill didn’t know what kind of a flood fight they were getting into. Additional rainfall duringthe day on Saturday averaged about 1 to 2 inches.
River gages and cooperative observers began to signal that the excessive runoff was reachingmany of the smaller streams and tributaries by early that afternoon. The first of the riverflood warnings were issued while flash flood warnings continued to be reissued and updatedfor nearly every county in the NWSFO Louisville area of responsibility. The precipitationestimates from the new WSR-88D Doppler radars compared well with “ground truth”reports. Point maximums were exceeding 6 inches with basin averages amounting to morethan a few inches.
The Louisville HSA includes 23 official river forecast points. Before the end of the day, theforecast office staff had issued river flood warnings with lead times ranging from 0.5 hour toas much as 30 hours for all but one of the 23 locations. (The gage was reading 0.1 footabove flood stage when the warning was issued for the 23rd site.)
A new 24-hour rainfall record was established on March 1, 1997, for Louisville as 10.48inches of rain occurred. The previous rainfall record for Louisville was 6.97 inches set backon March 9, 1964. This also establishes a new state-wide record for 24-hour rainfallbreaking the previous 24-hour rainfall record for Kentucky which was set at Dunmor inMuhlenberg County on June 27-28, 1960, when 10.40 inches were recorded. Although therain finally diminished, the flood fight lasted for days. Storm total rainfall estimates from the
D-5
multi-sensor Stage III processing at OHRFC indicated a maximum of 12-13 inches centeredover northern Kentucky close to the capital city of Frankfurt. A large swath of 10+ inchescovered over 100 square miles.
QPF Activities
NWSFO Louisville has been issuing QPF on a routine basis for over 5 years. QPFs aretypically prepared once per day by the midnight public forecaster and issued around 6:00 a.m. Updates were provided whenever requests were received from the OHRFC HAS forecasters. The NWS Central Region has instituted a QPF verification program. Also, the Science andOperations Officer at Louisville has initiated a Cooperative Program for OperationalMeteorology Education and Training (COMET) partnership with St. Louis University with agoal to develop improved QPF forecasting methodologies.
NWSO WILMINGTON
Operations at a Spin-up NWSO During a Record Flood Event
NWSO Wilmington is a spin-up office that was commissioned on October 1, 1994. It serves36 counties in the southwest half of Ohio, 12 counties in north central Kentucky, and eightcounties in Southeast Indiana. NWSO Wilmington assumed HSA responsibility onDecember 1, 1994.
On the evening of Friday, February 28, 1997, a Flood Potential Statement (ESF) was issuedjust before 2000 UTC emphasizing the possibility of flooding on Saturday night in West Central Ohio. A follow-up telephone call was made to the State Emergency ManagementOffice by the service hydrologist. After coordination with NWSFO Cleveland, Ohio, a FlashFlood Watch (FFA) was issued around midnight and included the Ohio portion of NWSO'sWilmington's HSA. Flash Flood Watches were issued by NWSFOs Louisville andIndianapolis for the Indiana and Kentucky portion of NWSO Wilmington county warningarea before daybreak the next morning.
NWSO Wilmington began issuing Flash Flood and Flood warnings between 1200 and 1300UTC Saturday, based on WSR-88D radar precipitation estimates and precipitationmeasurements based on STORMS rain gages. Data supplied by both systems proved to behighly reliable. At 1310 UTC a Flood Warning (FFW) was issued for Pendleton County(Falmouth) for urban and small streams. This was followed by a River Flood Warning(FLW) for the Licking River at Falmouth issued at 1524 UTC predicting that river floodingwould begin in the late afternoon. Another FFW for Pendleton County issued at 2105 UTCwarned that the serious flash flooding was going to continue into Saturday evening. It isestimated the Licking River at Falmouth reached flood stage sometime early Saturdayafternoon and crested approximately 24 feet above flood stage Sunday afternoon.
D-6
A total of 62 flash flood warnings were issued on March 1-2, 1997. Two of the initial floodwarnings were based on RFC headwater advisory tables. Thirteen forecast points flooded. There were two new record flood stages established. The average lead time to flood wasbetween 5 and 6 hours, with the longest lead time over 36 hours. Sixty-five river floodproducts (warnings and statements) were issued. An important aspect of NWSOWilmington's operations during the event were human resources. All readily available staff(seven people) worked extra duty during that period. The heavy workload associated withthe event pushed the limits of staff's physical and mental ability.
QPF Activities
Prior to this flood event, NWSO Wilmington had been issuing QPF on a routine basis foronly 5 months. It was the first spin-up office in the NWS Eastern Region to begin issuingQPF. A QPF training session was given to the staff in September 1996. There is no QPFperformance feedback to the forecast staff at this time.
QPFs are typically prepared once per day by the midnight forecaster and issued around 6:00 a.m. For significant rainfalls, additional QPFs are issued in the evening between 6:00 a.m.and 8:00 p.m. NWSO Wilmington contributed to each request for updated QPF inputduring the event.
Special Coordination Activities with Emergency Managers
NWSO Wilmington maintains a very proactive hydrologic preparedness program incooperation with the Ohio EMA. Letters were sent to each county Emergency Manager(EM) concerning hydrologic preparedness as part of the annual Ohio Severe Weather andFlood Safety Week. Preparedness activities in Kentucky included individual letters sent toeach county explaining hydrologic watches and warnings. Additionally, in 1996, a letter wassent to each county emergency management supervisor requesting information on flash floodprone areas.
Specific briefings to the Ohio EMA began on the afternoon of Friday, February 28, 1997, forpotential heavy rain on March 1-2, 1997. Additional telephone calls were made to individualcounties as warnings were being issued on March 1, 1997. Additional subsequent briefings to the Ohio EMA were conducted during the late morning and early evening Saturday,March 1, 1997. Daily briefings then continued through March 10, 1997.
Watch and warning information was also distributed by the Wilmington staff through apocket paging system. This paging system provided information to rural areas not covered by NOAA Weather Radio. Flood information, but no flood warnings, was also posted on theNWSO Wilmington (and OHRFC) homepage.


![hNI) T]RUMBULL COUNTY OHIO - Defense Technical … · flood plain itn for mat1ot gp/\hni) rive r7 t]rumbull county ohio 0f -. ig') ~ .a qv pfifirred for ohio departmsnt of na1vrai0](https://static.documents.pub/doc/80x56/5ad0290a7f8b9ad24f8d5b94/hni-trumbull-county-ohio-defense-technical-plain-itn-for-mat1ot-gphni.jpg)


