27
Oil and Gas Emission Inventories for the Western States James Russell Alison Pollack Greg Yarwood ENVIRON International Corporation
| Date post: | 18-Jan-2019 |
| Category: |
Documents |
| Upload: | phungquynh |
| View: | 212 times |
| Download: | 0 times |
Oil and Gas Emission Inventories for the Western States
James RussellAlison PollackGreg Yarwood
ENVIRON International Corporation

Today’s Presentation
• Background• 2002 Inventory Methodology• 2018 Inventory Methodology• Oil and Gas Controls• Additional Projects

Additional Projects
Oil and Gas Controls
2018 Inventory Methodology
2002 Inventory Methodology
Background
• Evaluate existing inventories• Develop consistent oil and gas
inventory methodology• Update the baseline (2002) inventory• Project emissions for future year
(2018) inventory
Project Goals

Previous Inventory Coverage, Point• Facilities extracted:
– Compressor stations– Gas plants– Storage tanks– Other smaller sources
depending upon inventory thresholds
• Inventory thresholds from 1 tpy to 100 tpy
• IrregularitiesWell locations were not obtained for California as CARB provided county-level emissions estimates
Additional Projects
Oil and Gas Controls
2018 Inventory Methodology
2002 Inventory Methodology
Background
Previous Inventory Coverage, Area• Covered
– California and Wyoming– Colorado and Alaska point source
inventories include most sources• Not covered
– New Mexico, Montana, Utah, etc…– Sources such as drill rigs and pump
engines are not included in the existing 2002 inventories
Additional Projects
Oil and Gas Controls
2018 Inventory Methodology
2002 Inventory Methodology
Background

Base Year (2002) Inventory Procedure• Adopt point source emissions from existing
state inventories• Estimate area source emissions for:
– Important NOx sources• Drill rig engines• Natural gas compressor engines• CBM pump engines
– Minor NOx and VOC wellhead processes• Incorporate emission controls• Reconcile point and area inventories
Additional Projects
Oil and Gas Controls
2018 Inventory Methodology
2002 Inventory Methodology
Background

Drill Rig EnginesData Collection
• Drilling companies contacted• Oil and gas commission data
– Well depth– Spud date – date drilling begins– Completion date – date well
preparation is finalized
• WYDEQ survey of drilling emissions in Jonah-Pinedale– 13.5 tons NOx/well– 3.3 tons SO2/well
Additional Projects
Oil and Gas Controls
2018 Inventory Methodology
2002 Inventory Methodology
Background

Drill Rig EnginesEmissions Calculation
EFA = EFJ x ( DA / DJ) x ( TA / TJ ) where:
EFA = The emission factor for another formation EFJ = The Jonah-Pinedale emission factor DA = The average depth of wells drilled in another area Dj = The average depth of wells drilled in Jonah-Pinedale TA = The duration of drilling in another area
Tj = The duration of drilling in Jonah-Pinedale
E = EF x W
where: E = The 2002 emission for a given formation EF = The formation specific emission factor W = The number of wells drilled in the formation in 2002.
1. Adjust emission factor based on the characteristics of a formation
2. Estimate emissions using formation-specific emission factors
Additional Projects
Oil and Gas Controls
2018 Inventory Methodology
2002 Inventory Methodology
Background
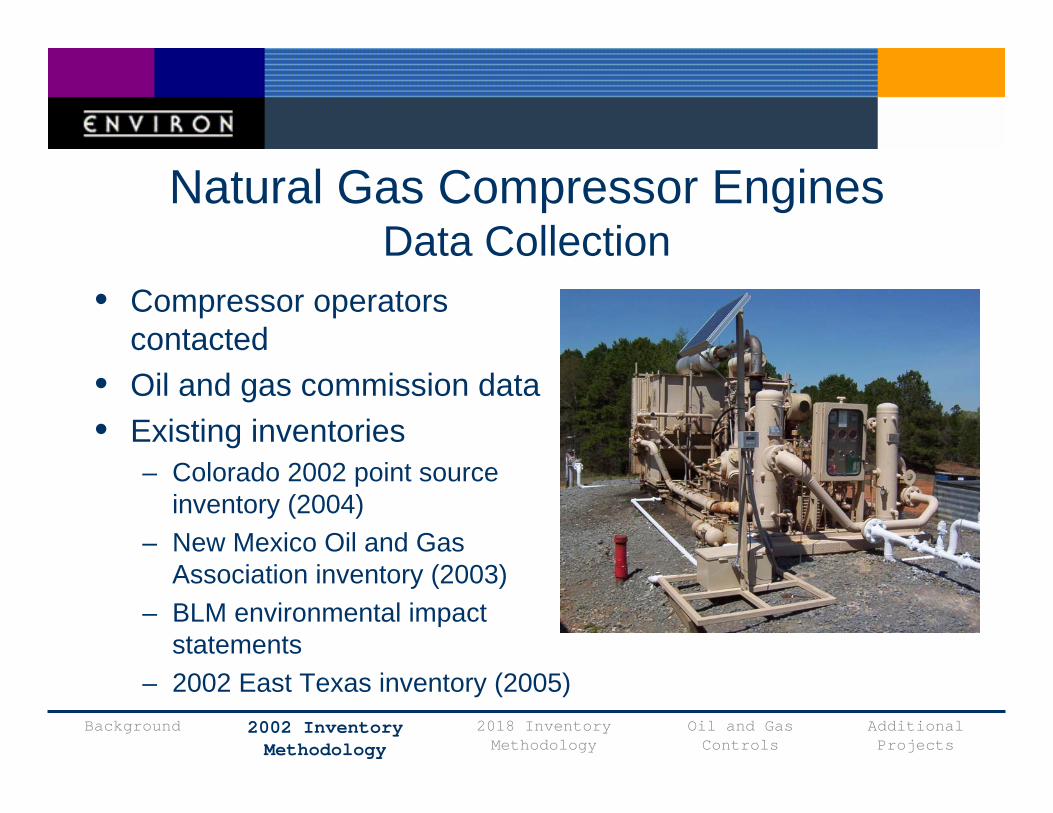
Natural Gas Compressor EnginesData Collection
• Compressor operators contacted
• Oil and gas commission data• Existing inventories
– Colorado 2002 point source inventory (2004)
– New Mexico Oil and Gas Association inventory (2003)
– BLM environmental impact statements
– 2002 East Texas inventory (2005)Additional Projects
Oil and Gas Controls
2018 Inventory Methodology
2002 Inventory Methodology
Background

Natural Gas Compressor EnginesEmissions Calculation
• Emission factor: 2.3x10⁻⁵ tons NOx/MCF, derived from NMOGA inventory
• Activity data: Gas production obtained from oil and gas commissions
Emission Calculation
E = P x EF
Where: E = 2002 NOx emission P = 2002 gas production (MCF) EF = Emission factor, 2.3x10⁻⁵ tons NOx / MCF
Additional Projects
Oil and Gas Controls
2018 Inventory Methodology
2002 Inventory Methodology
Background

CBM Pump EnginesData Collection
• Wyoming Generator databases
• Field power supply• Pertinent oil and gas
commission data– Well depth– Water produced
Additional Projects
Oil and Gas Controls
2018 Inventory Methodology
2002 Inventory Methodology
Background

CBM Pump Engines1: Estimate Engine Activity
• First estimate used scaling of WY activity
• Improved estimate uses engineering calculations and water production
• Assumptions– Pump operation– Well design
gPzHH
gPz LP 22
222
2
211
1ν
γν
γ++=−+++
LP HdH +=
gV
DLfH L 2
2
×=17.185.1
85.1
)318.1( RCLVH
HL ××=
550/γ××= QHP P
GPE PP εε //=
1. Energy in System
2. Calculate Frictional Losses
or
3. Calculate Pump Power4. Calculate Engine
Power
Modified Bernoulli
Darcy-Weisbach Hazen-Williams equation
Additional Projects
Oil and Gas Controls
2018 Inventory Methodology
2002 Inventory Methodology
Background

CBM Pump Engines2: Estimate Engine Emissions
∑ ∗+∗∗=w IwAw HAHAEFE )*1.0(
Where:E = 2002 county NOx emission EF = Emission factor, see table below (g/hp-hr) Aw = Engine power for pumping at county well w (hp) HA = Hours of pumping (4,380 hr) HI = Hours of idling (4,380 hr)
WY DEQ6.1 g/hp-hr*WyomingNONROAD 200412 g/hp-hrColorado & New Mexico
SourceEngine EFStates
*Natural gas engines in Wyoming are controlled
Additional Projects
Oil and Gas Controls
2018 Inventory Methodology
2002 Inventory Methodology
Background

Minor NOx & VOC Wellhead ProcessesData Collection
• WYDEQ emission factors– Glycol dehydrators– Completions, flaring & venting– Heaters– Tanks– Pneumatic devices
• State control requirements• Alternative local emission factors• Oil and gas commission production data
Additional Projects
Oil and Gas Controls
2018 Inventory Methodology
2002 Inventory Methodology
Background
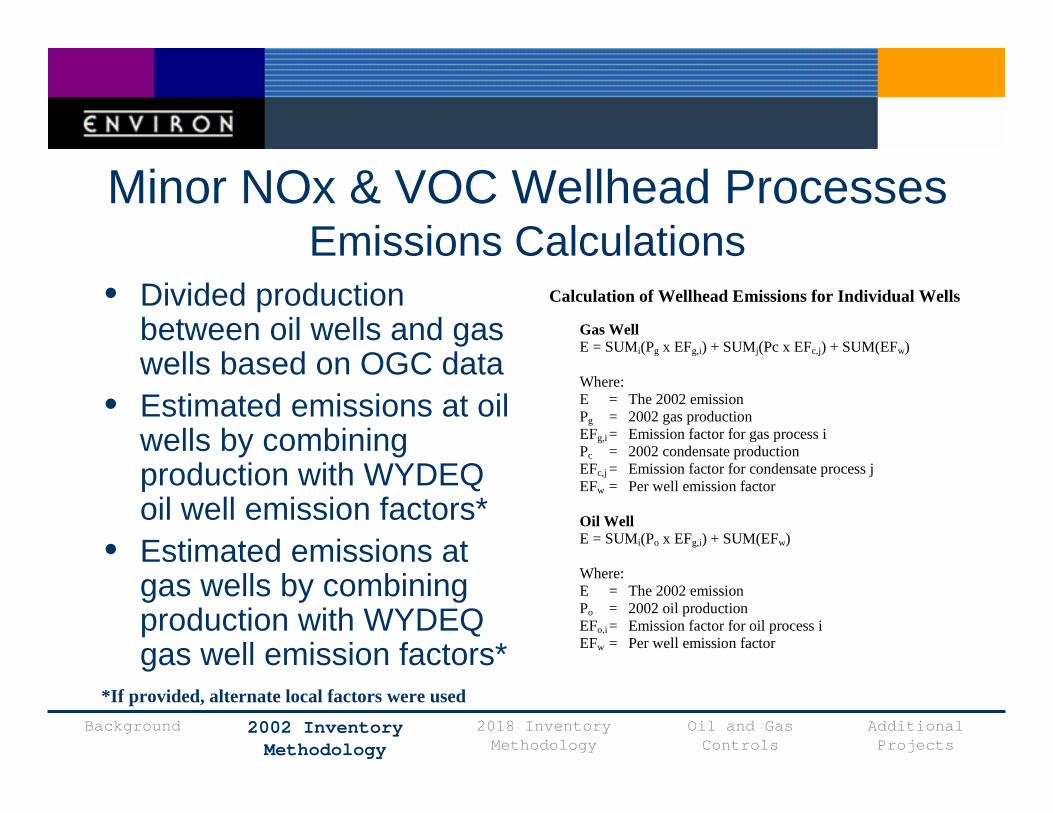
Minor NOx & VOC Wellhead ProcessesEmissions Calculations
• Divided production between oil wells and gas wells based on OGC data
• Estimated emissions at oil wells by combining production with WYDEQ oil well emission factors*
• Estimated emissions at gas wells by combining production with WYDEQ gas well emission factors*
Calculation of Wellhead Emissions for Individual Wells
Gas Well E = SUMi(Pg x EFg,i) + SUMj(Pc x EFc,j) + SUM(EFw)
Where: E = The 2002 emission Pg = 2002 gas production EFg,i = Emission factor for gas process i Pc = 2002 condensate production EFc,j = Emission factor for condensate process j EFw = Per well emission factor
Oil Well E = SUMi(Po x EFg,i) + SUM(EFw)
Where: E = The 2002 emission Po = 2002 oil production EFo,i = Emission factor for oil process i EFw = Per well emission factor
*If provided, alternate local factors were usedAdditional Projects
Oil and Gas Controls
2018 Inventory Methodology
2002 Inventory Methodology
Background
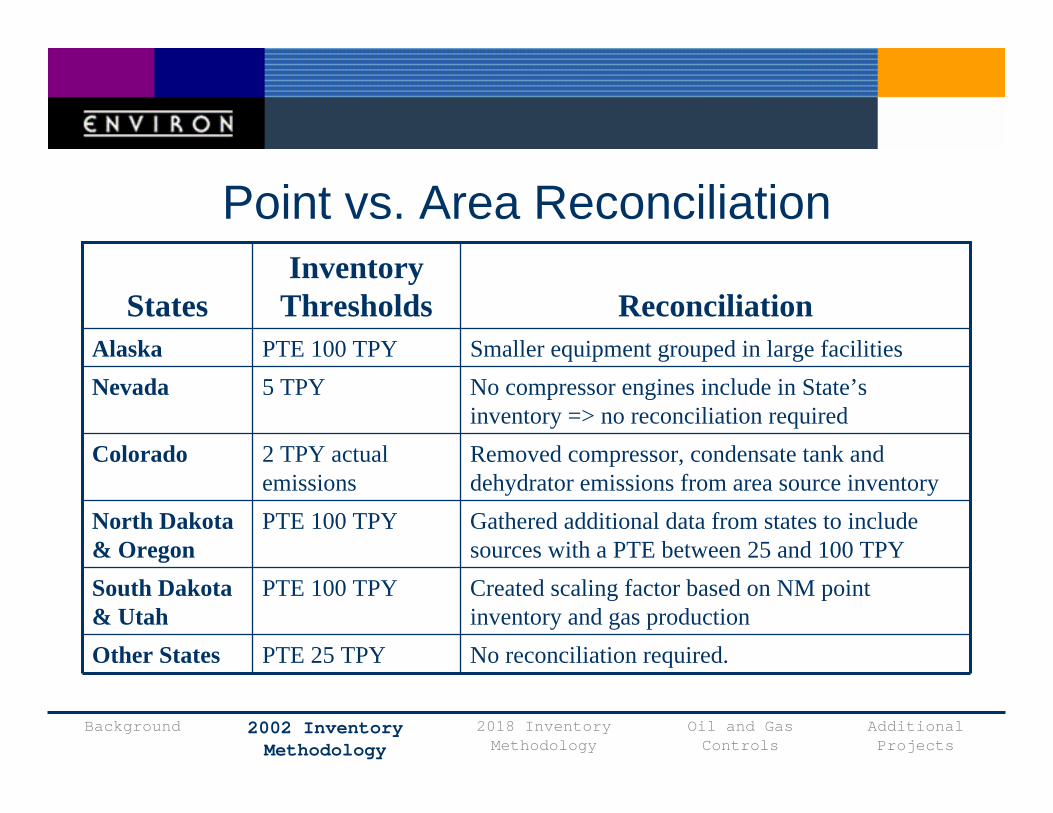
Point vs. Area Reconciliation
Additional Projects
Oil and Gas Controls
2018 Inventory Methodology
2002 Inventory Methodology
Background
Created scaling factor based on NM point inventory and gas production
PTE 100 TPYSouth Dakota & Utah
Gathered additional data from states to include sources with a PTE between 25 and 100 TPY
PTE 100 TPYNorth Dakota & Oregon
No reconciliation required.PTE 25 TPYOther States
Removed compressor, condensate tank and dehydrator emissions from area source inventory
2 TPY actual emissions
Colorado
No compressor engines include in State’s inventory => no reconciliation required
5 TPYNevadaSmaller equipment grouped in large facilitiesPTE 100 TPYAlaska
ReconciliationInventory
ThresholdsStates
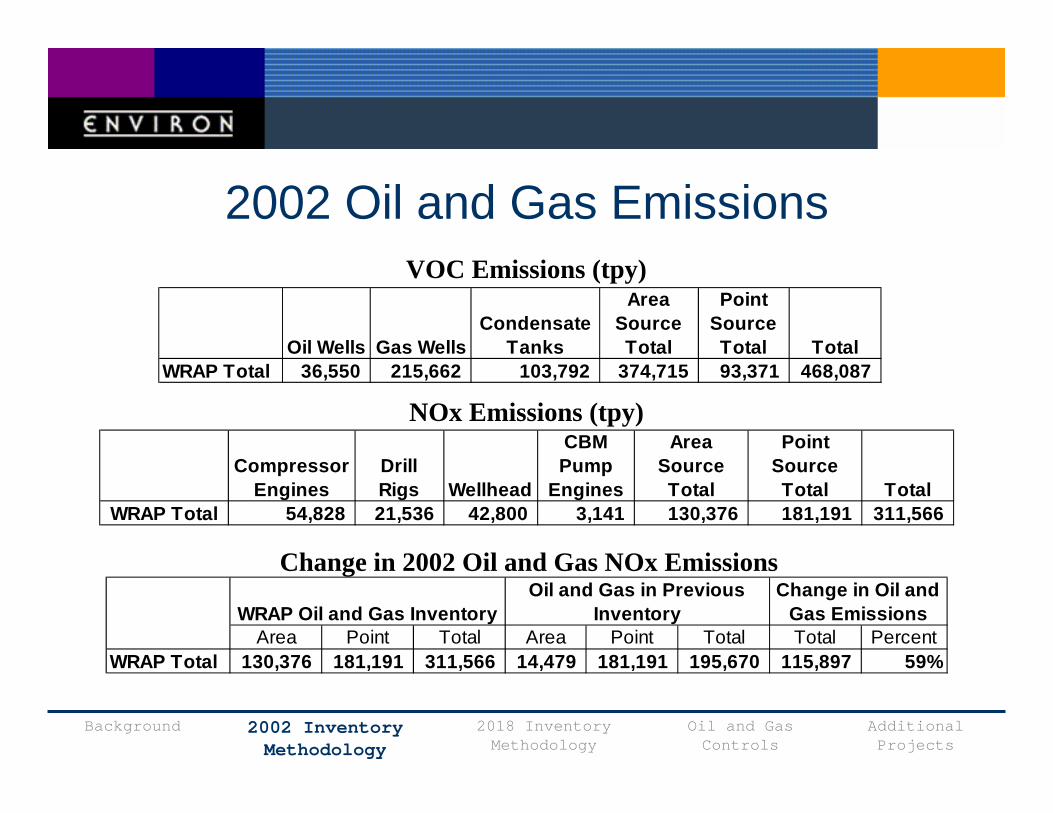
2002 Oil and Gas Emissions
WRAP Total 36,550 215,662 103,792 374,715 93,371 468,087
Point Source Total Total
Area Source TotalOil Wells Gas Wells
Condensate Tanks
WRAP Total 54,828 21,536 42,800 3,141 130,376 181,191 311,566 Total
Compressor Engines
Drill Rigs Wellhead
CBM Pump
Engines
Point Source Total
Area Source Total
Area Point Total Area Point Total Total PercentWRAP Total 130,376 181,191 311,566 14,479 181,191 195,670 115,897 59%
WRAP Oil and Gas InventoryOil and Gas in Previous
InventoryChange in Oil and
Gas Emissions
VOC Emissions (tpy)
NOx Emissions (tpy)
Change in 2002 Oil and Gas NOx Emissions
Additional Projects
Oil and Gas Controls
2018 Inventory Methodology
2002 Inventory Methodology
Background
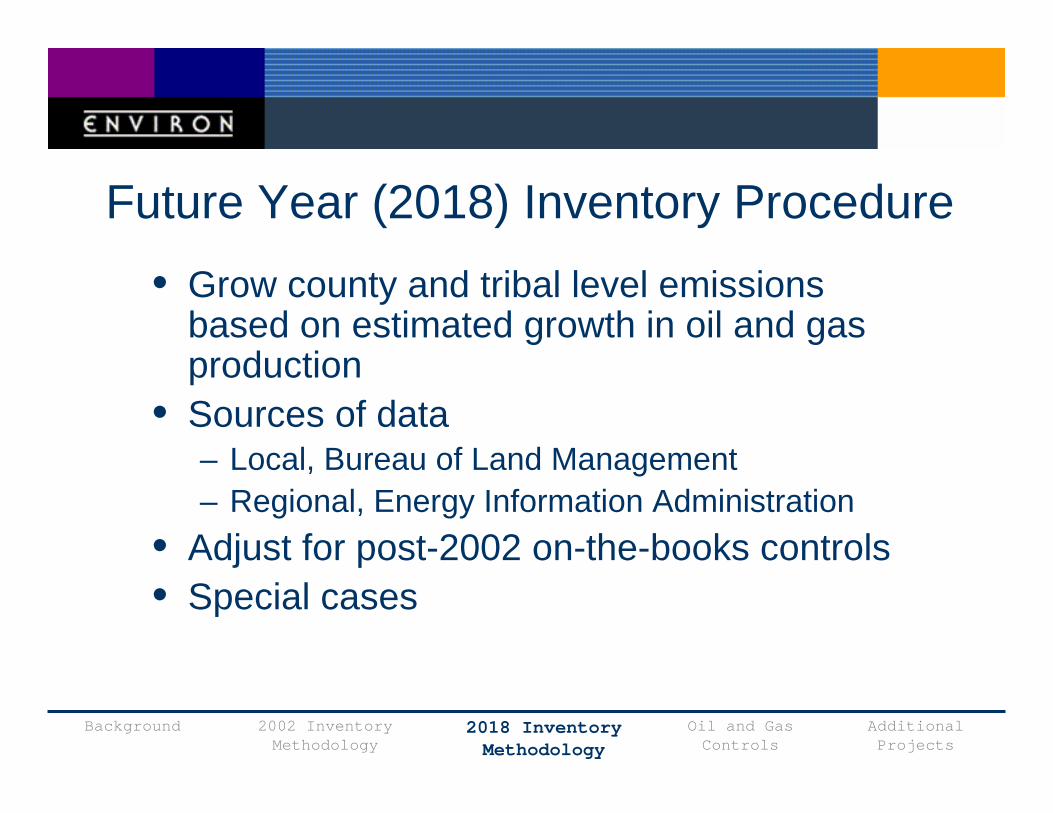
• Grow county and tribal level emissions based on estimated growth in oil and gas production
• Sources of data– Local, Bureau of Land Management– Regional, Energy Information Administration
• Adjust for post-2002 on-the-books controls• Special cases
Future Year (2018) Inventory Procedure
Additional Projects
Oil and Gas Controls
2018 Inventory Methodology
2002 Inventory Methodology
Background
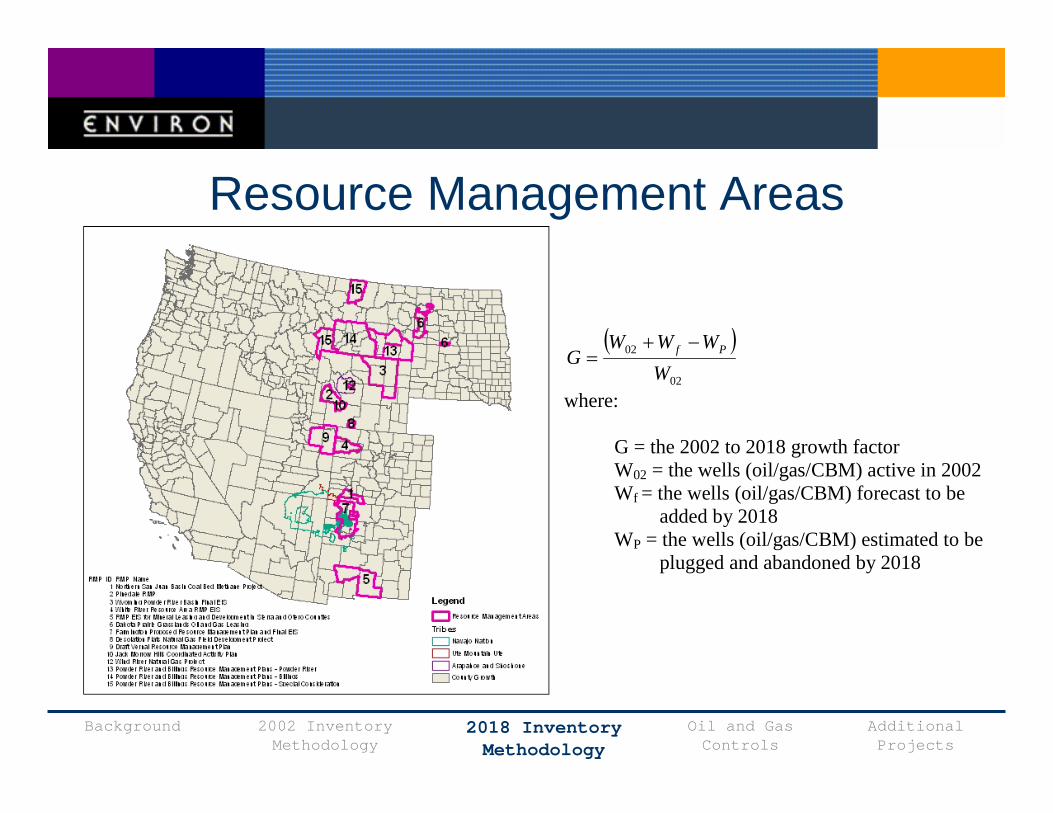
Resource Management Areas
( )
02
02
WWWW
G Pf −+=
where:
G = the 2002 to 2018 growth factor W02 = the wells (oil/gas/CBM) active in 2002 Wf = the wells (oil/gas/CBM) forecast to be
added by 2018 WP = the wells (oil/gas/CBM) estimated to be
plugged and abandoned by 2018
Additional Projects
Oil and Gas Controls
2018 Inventory Methodology
2002 Inventory Methodology
Background

Resulting Areas of Growth
Additional Projects
Oil and Gas Controls
2018 Inventory Methodology
2002 Inventory Methodology
Background

2018 Oil and Gas EmissionsVOC Emissions (tpy)
NOx Emissions (tpy)
Change in NOx Emissions, 2002 to 2018
Change in VOC Emissions, 2002 to 2018
WRAP Total 166,009 27,082 84,932 1,348 279,370 126,536 405,907
CBM Pump Engines
Area Source Total
Point Source Total Total
Compressor Engines Drill Rigs Wellhead
WRAP Total 43,248 648,762 194,895 886,904 100,811 987,715
Area Source Total
Point Source Total TotalOil Wells Gas Wells
Condensate Tanks
WRAP Total 203% 26% 98% -57% 114% -30% 30%
CBM Pump Engines
Area Source Total
Point Source Total Total
Compressor Engines Drill Rigs Wellhead
WRAP Total 18% 201% 88% 137% 8% 111%
Point Source Total Total
Area Source TotalOil Wells Gas Wells
Condensate Tanks
Additional Projects
Oil and Gas Controls
2018 Inventory Methodology
2002 Inventory Methodology
Background

Controls Included in WRAP Inventory
Federal emission standards
Drill rigs
All statescontrol with flare or vapor recovery (50 – 90% effective)
Completion: Flaring & Venting
Colorado*control with 90% efficiencyGlycol Dehydrators
Colorado*Montana, North Dakota, Wyoming
control with 98% efficiency using combustion, vapor recovery, etc…
Condensate Tanks
Montana, Utahuse line power
Federal emission standards
Wyomingemission limits on gas engines of 1-2 g/bhp-hr
Pump Engines
Federal emission standards, Colorado*
Wyoming, Utah
emission limits of 1-2 g/bhp-hrCompressors
Post 20022002ControlProcess
*Will apply only in nonattainment areas
Additional Projects
Oil and Gas Controls
2018 Inventory Methodology
2002 Inventory Methodology
Background

• Controls under development– Montana, proposed 25 tpy site cap– Utah, reporting and control requirements– Wyoming considering drill rig requirements
• EPA Natural Gas Star Program– Industry developed strategies to control emissions
from many oil and gas processes– http://www.epa.gov/gasstar/index.htm
• Northeast Texas compressor control demonstration
Additional Control Information
Additional Projects
Oil and Gas Controls
2018 Inventory Methodology
2002 Inventory Methodology
Background

Compressor Engine Control OptionSystem Design
Control System
Power Supply
Additional Projects
Oil and Gas Controls
2018 Inventory Methodology
2002 Inventory Methodology
Background

Compressor Engine Control OptionCost Effectiveness
• Annual emission reduction = 12.3 tons NOx• Annualized costs = $2,250• $2,250 / 12.3 tons NOx = $183 / ton NOx*
96%0.513.3
70024
97%0.412.7
75558
96%96%97%NOx Control Efficiency0.513.0
74236
0.50.3After (g NOx/hp-hr)
12.411.6Before (g NOx/hp-hr)
7238670640EngineEmissions Reductions Achieved
*Assumes 3% discount rate and five year project lifeAdditional Projects
Oil and Gas Controls
2018 Inventory Methodology
2002 Inventory Methodology
Background
• Northwest New Mexico area source inventory– Cover additional processes– Obtain improved activity data and emission
factors– Estimate SO2 emissions from additional sources
• Upcoming four corners PSD increment analysis expected to establish historical inventories
Additional Projects
Additional Projects
Oil and Gas Controls
2018 Inventory Methodology
2002 Inventory Methodology
Background

• WRAP oil and gas inventory documentation: http://www.wrapair.org/forums/ssjf/documents/eictts/oilgas.html
• WRAP emissions database: http://www.wrapedms.org• Contacts: [email protected] or
Additional Information
Additional Projects
Oil and Gas Controls
2018 Inventory Methodology
2002 Inventory Methodology
Background


