Energy Outlook – Global/Asian Region Oil and Gas Energy Forum Taipei, 4 July 2012 Copyright of Shell International BV 1 Alf D’Souza Senior Adviser/VP Government Relations, Asia-Pacific Taipei, 4 July 2012
Transcript
Energy Outlook – Global/Asian Region
Oil and Gas Energy Forum
Taipei, 4 July 2012
Copyright of Shell International BV 1
Alf D’SouzaSenior Adviser/VP Government Relations, Asia-Pacific
Taipei, 4 July 2012
DEFINITIONS AND CAUTIONARY NOTE
Resources: Our use of the term “resources” in this presentation includes quantities of oil and gas not yet classified as SEC proved oil and gas reserves or SEC proven mining reserves. Resources are consistent with the Society of Petroleum Engineers 2P and 2C definitions.The companies in which Royal Dutch Shell plc directly and indirectly owns investments are separate entities. In this presentation “Shell”, “Shell group” and “Royal Dutch Shell” are sometimes used for convenience where references are made to Royal Dutch Shell plc and its subsidiaries in general. Likewise, the words “we”, “us” and “our” are also used to refer to subsidiaries in general or to those who work for them. These expressions are also used where no useful purpose is served by identifying the particular company or companies. ‘‘Subsidiaries’’, “Shell subsidiaries” and “Shell companies” as used in this presentation refer to companies in which Royal Dutch Shell either directly or indirectly has control, by having either a majority of the voting rights or the right to exercise a controlling influence. The companies in which Shell has significant influence but not control are referred to as “associated companies” or “associates” and companies in which Shell has joint control are referred to as “jointly controlled entities”. In this presentation, associates and jointly controlled entities are also referred to as “equity-accounted investments”. The term “Shell interest” is used for convenience to indicate the direct and/or indirect (for example, through our 24% shareholding in Woodside Petroleum Ltd.) ownership interest held by Shell in a venture, partnership or company, after exclusion of all third-party interest.This presentation contains forward-looking statements concerning the financial condition, results of operations and businesses of Royal Dutch Shell. All statements other than
statements of historical fact are, or may be deemed to be, forward-looking statements. Forward-looking statements are statements of future expectations that are based on management’s current expectations and assumptions and involve known and unknown risks and uncertainties that could cause actual results, performance or events to differ materially from those expressed or implied in these statements. Forward-looking statements include, among other things, statements concerning the potential exposure of Royal Dutch Shell to market risks and statements expressing management’s expectations, beliefs, estimates, forecasts, projections and assumptions. These forward-looking statements are identified by their use of terms and phrases such as ‘‘anticipate’’, ‘‘believe’’, ‘‘could’’, ‘‘estimate’’, ‘‘expect’’, ‘‘intend’’, ‘‘may’’, ‘‘plan’’, ‘‘objectives’’, ‘‘outlook’’,
Copyright of Shell International BV 24 July 2012
are identified by their use of terms and phrases such as ‘‘anticipate’’, ‘‘believe’’, ‘‘could’’, ‘‘estimate’’, ‘‘expect’’, ‘‘intend’’, ‘‘may’’, ‘‘plan’’, ‘‘objectives’’, ‘‘outlook’’, ‘‘probably’’, ‘‘project’’, ‘‘will’’, ‘‘seek’’, ‘‘target’’, ‘‘risks’’, ‘‘goals’’, ‘‘should’’ and similar terms and phrases. There are a number of factors that could affect the future operations of Royal Dutch Shell and could cause those results to differ materially from those expressed in the forward-looking statements included in this presentation, including (without limitation): (a) price fluctuations in crude oil and natural gas; (b) changes in demand for Shell’s products; (c) currency fluctuations; (d) drilling and production results; (e) reserves estimates; (f) loss of market share and industry competition; (g) environmental and physical risks; (h) risks associated with the identification of suitable potential acquisition properties and targets, and successful negotiation and completion of such transactions; (i) the risk of doing business in developing countries and countries subject to international sanctions; (j) legislative, fiscal and regulatory developments including potential litigation and regulatory measures as a result of climate changes; (k) economic and financial market conditions in various countries and regions; (l) political risks, including the risks of expropriation and renegotiation of the terms of contracts with governmental entities, delays or advancements in the approval of projects and delays in the reimbursement for shared costs; and (m) changes in trading conditions. All forward-looking statements contained in this presentation are expressly qualified in their entirety by the cautionary statements contained or referred to in this section. Readers should not place undue reliance on forward-looking statements. Additional factors that may affect future results are contained in Royal Dutch Shell’s 20-F for the year ended 31 December, 2011 (available at www.shell.com/investor and www.sec.gov ). These factors also should be considered by the reader. Each forward-looking statement speaks only as of the date of this presentation, 21 April 2012. Neither Royal Dutch Shell nor any of its subsidiaries undertake any obligation to publicly update or revise any forward-looking statement as a result of new information, future events or other information. In light of these risks, results could differ materially from those stated, implied or inferred from the forward-looking statements contained in this presentation. There can be no assurance that dividend payments will match or exceed those set out in this presentation in the future, or that they will be made at all.We use certain terms in this presentation, such as resources, that the United States Securities and Exchange Commission (SEC) guidelines strictly prohibit us from including in
filings with the SEC. U.S. Investors are urged to consider closely the disclosure in our Form 20-F, File No 1-32575, available on the SEC website www.sec.gov. You can also obtain these forms from the SEC by calling 1-800-SEC-0330.
AGENDA
PART 1: TRENDS AND DRIVERS
PART 2: ENERGY DRIVERS
PART 3: ASIA ENERGY DEVELOPMENTS
PART 4: SHELL ENERGY SCENARIOS TO 2050 – SIGNALS &
Copyright of Shell International BV 34 July 2012
PART 4: SHELL ENERGY SCENARIOS TO 2050 – SIGNALS &
THE ENERGY SYSTEM TODAY SETS THE CONTEXT FOR THE FUTURE
31% 22% 29% 10% 5% 3%
Copyright of Shell International BV 124 July 2012
20% 55% 25%
World population 7 bln; 50% in urban environment Source: Shell; UN Population Division
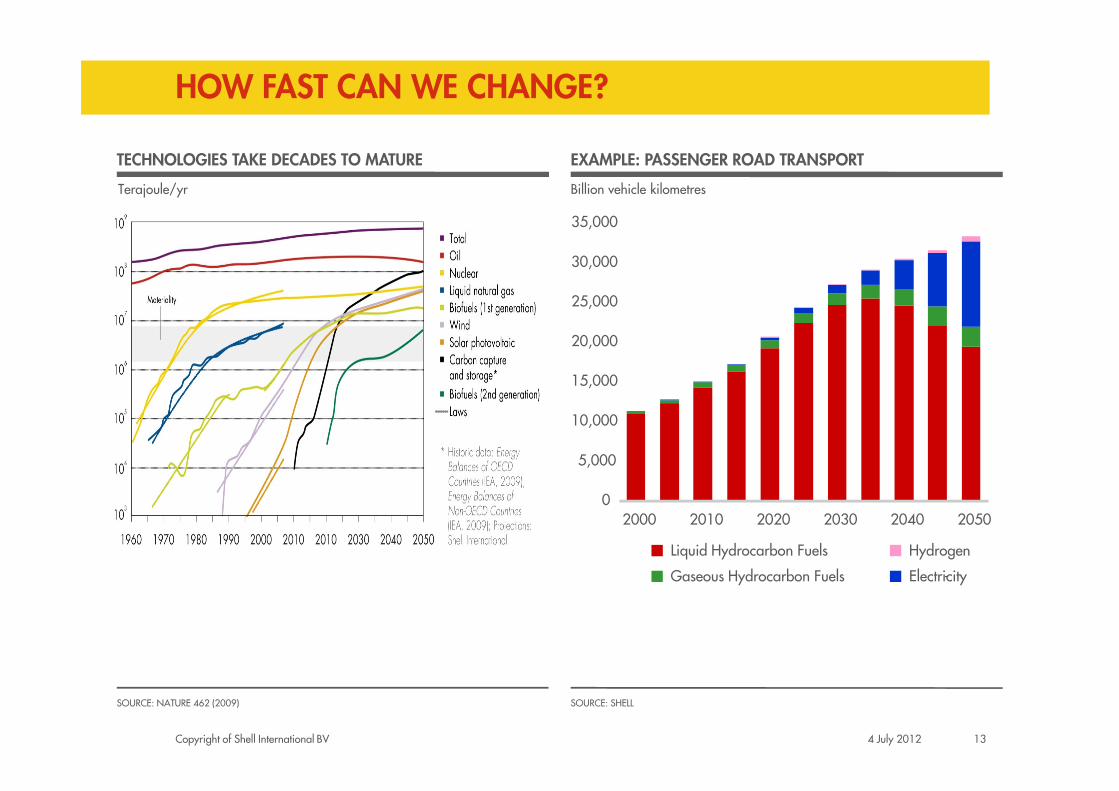
Terajoule/yr
TECHNOLOGIES TAKE DECADES TO MATURE
Billion vehicle kilometres
EXAMPLE: PASSENGER ROAD TRANSPORT
HOW FAST CAN WE CHANGE?
15,000
20,000
25,000
30,000
35,000
Copyright of Shell International BV 134 July 2012
SOURCE: NATURE 462 (2009) SOURCE: SHELL
0
5,000
10,000
2000 2010 2020 2030 2040 2050
Hydrogen
Electricity -Gaseous Hydrocarbon Fuels
Liquid Hydrocarbon Fuels
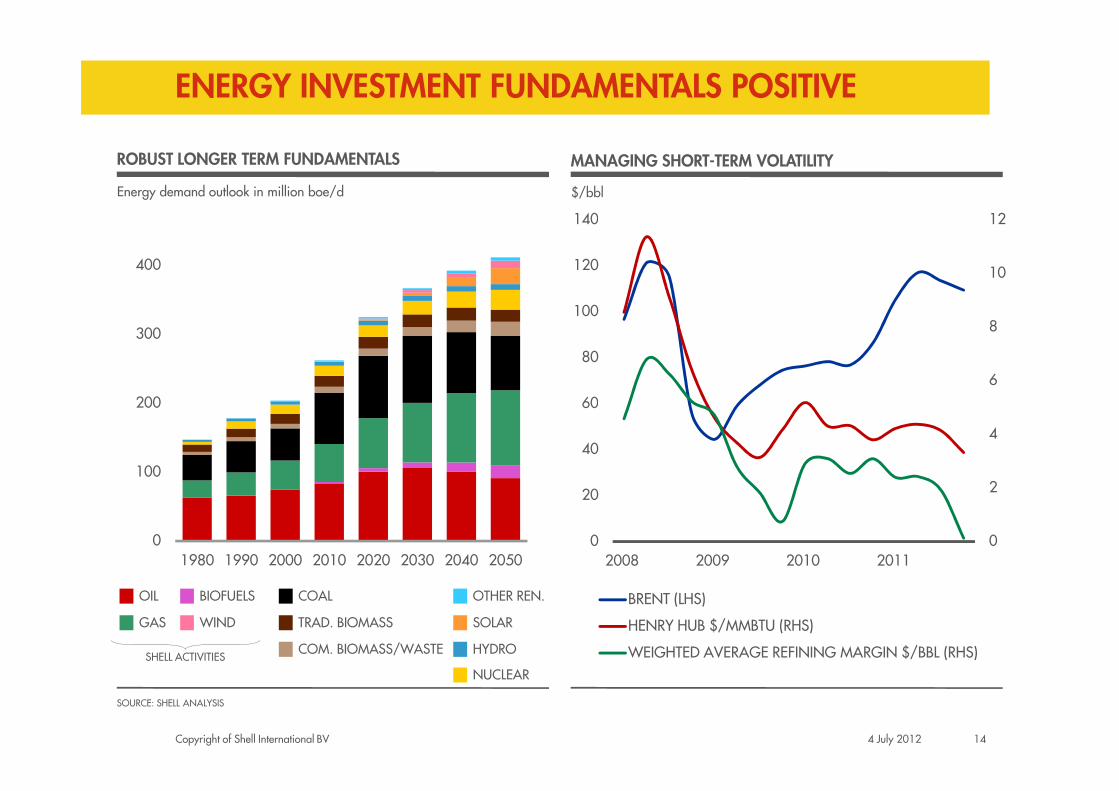
ROBUST LONGER TERM FUNDAMENTALS
ENERGY INVESTMENT FUNDAMENTALS POSITIVE
MANAGING SHORT-TERM VOLATILITY
$/bblEnergy demand outlook in million boe/d
6
8
10
12
60
80
100
120
140
200
300
400
Copyright of Shell International BV 144 July 2012
SOURCE: SHELL ANALYSIS
0
2
4
0
20
40
60
2008 2009 2010 2011
BRENT (LHS)
HENRY HUB $/MMBTU (RHS)
WEIGHTED AVERAGE REFINING MARGIN $/BBL (RHS)
0
100
200
1980 1990 2000 2010 2020 2030 2040 2050
OTHER REN.
WIND SOLAR
HYDRO
NUCLEAR
TRAD. BIOMASS
COM. BIOMASS/WASTE
COAL
GAS
BIOFUELSOIL
SHELL ACTIVITIES
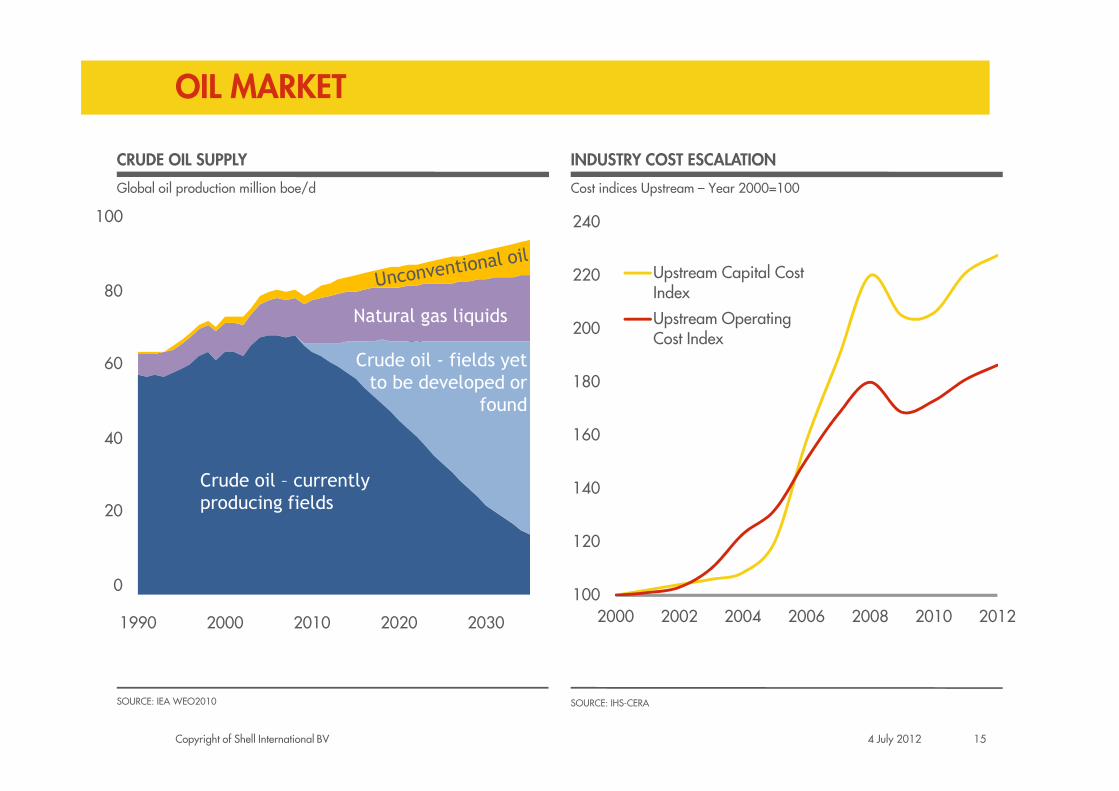
Global oil production million boe/d
CRUDE OIL SUPPLY
Cost indices Upstream – Year 2000=100
INDUSTRY COST ESCALATION
OIL MARKET
180
200
220
240
Upstream Capital Cost Index
Upstream Operating Cost IndexNew
60
80
100
Crude oil - fields yet
to be developed or
found
Natural gas liquids
Copyright of Shell International BV 154 July 2012
SOURCE: IEA WEO2010 SOURCE: IHS-CERA
100
120
140
160
2000 2002 2004 2006 2008 2010 2012
Existing0
20
40
1990 2000 2010 2020 2030
found
Crude oil – currently
producing fields
NATURAL GAS DEMAND GROWTH
NATURAL GAS OUTLOOK
UNCONVENTIONAL GAS RESOURCES
Tcf/yr
SOURCE: IEA, SHELL
Tcf
0
600
1200
SOURCE: IEA
0
100
200
1990 2000 2010 2020 2030
Copyright of Shell International BV 164 July 2012
0
5
10
15
20
25
2000 2002 2004 2006 2008 2010 2012
Brent
UK NBP
AP LNG
Henry Hub
SOURCE: PLATTS, NYMEX
ATTRACTIVE ECONOMICS FOR ELECTRICITY PRODUCERS
SOURCE: WOODMACKENZIE; SHELL ANALYSIS BASED ON EU DATA
CAPITAL COST
NATURAL GAS REGIONAL PRICES
$/MW hour
LONG-RUN MARGINAL COST
0 50 100 150 200
CCGT
Coal
Nuclear
Wind
Solar Thermal
$/MMBtu
100
150
Energy demand outlook in million boe/d
NON FOSSIL ENERGY GROWTH SHELL BIOFUELS - BRAZIL
ALTERNATIVE ENERGY
Copyright of Shell International BV 174 July 2012
0
50
1980 1990 2000 2010 2020 2030 2040 2050
SOURCE: IEA, SHELL
WIND
SOLAR
HYDRO/OTHER
NUCLEAR
BIOFUELS
COM. BIOMASS/WASTE
TRADITIONAL BIOMASS
ASIAN ENERGY DEVELOPMENTS
PART 3
Asia energy outlooks under current trends
ASIAN ENERGY DEVELOPMENTS
Copyright of Shell International BV 194 July 2012
Energy Mix
This outlook is based on many assumptions and interpretations of possible future choices from today’s perspective. Many uncertainties remain and many alternatives to this outlook are possible. It should be seen as a starting point for discussion and Shell by no means advocates this outlook as a preferred or inevitable one.
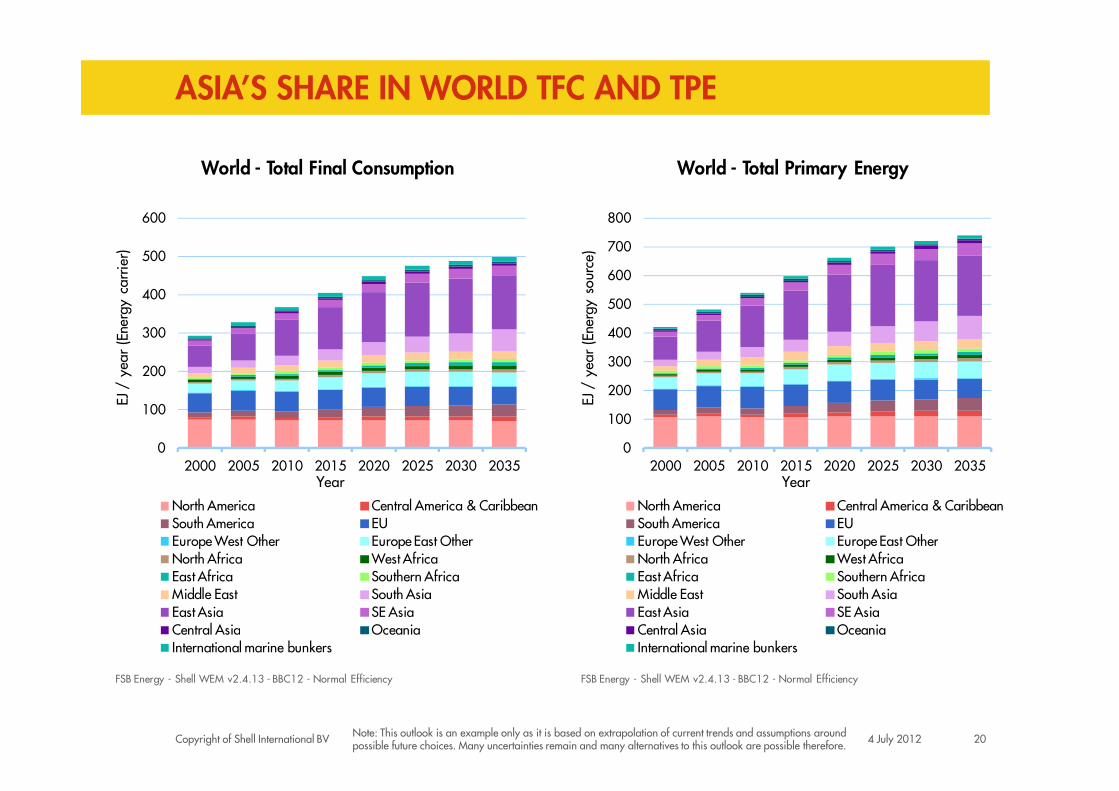
ASIA’S SHARE IN WORLD TFC AND TPE
200
300
400
500
600
700
800
EJ /
yea
r (E
nerg
y so
urce
)
World - Total Primary Energy
200
300
400
500
600
EJ /
yea
r (E
nerg
y ca
rrie
r)
World - Total Final Consumption
Copyright of Shell International BV 204 July 2012
0
100
200
2000 2005 2010 2015 2020 2025 2030 2035
EJ /
yea
r (E
nerg
y so
urce
)
Year
North America Central America & CaribbeanSouth America EUEurope West Other Europe East OtherNorth Africa West AfricaEast Africa Southern AfricaMiddle East South AsiaEast Asia SE AsiaCentral Asia OceaniaInternational marine bunkers
FSB Energy - Shell WEM v2.4.13 - BBC12 - Normal Efficiency
0
100
2000 2005 2010 2015 2020 2025 2030 2035
EJ /
yea
r (E
nerg
y ca
rrie
r)
Year
North America Central America & CaribbeanSouth America EUEurope West Other Europe East OtherNorth Africa West AfricaEast Africa Southern AfricaMiddle East South AsiaEast Asia SE AsiaCentral Asia OceaniaInternational marine bunkers
FSB Energy - Shell WEM v2.4.13 - BBC12 - Normal Efficiency
Note: This outlook is an example only as it is based on extrapolation of current trends and assumptions around possible future choices. Many uncertainties remain and many alternatives to this outlook are possible therefore.
500
1,000
1,500
2,000
2,500
mill
ion
peop
le
World - Population
SOUTH ASIA POPULATION AND GDP
5
10
15
20
25
USD
trill
ion
(PPP
, 20
10 U
SD)
World - GDP
Copyright of Shell International BV 214 July 2012
02000 2005 2010 2015 2020 2025 2030 2035
Year
South Asia
FSB Energy - Shell WEM v2.4.13 - BBC12 - Normal Efficiency
South AsiaIndiaPakistanBangladeshRest of South Asia
02000 2005 2010 2015 2020 2025 2030 2035
USD
trill
ion
(PPP
, 20
10 U
SD)
Year
South Asia
FSB Energy - Shell WEM v2.4.13 - BBC12 - Normal Efficiency
Note: This outlook is an example only as it is based on extrapolation of current trends and assumptions around possible future choices. Many uncertainties remain and many alternatives to this outlook are possible therefore.
SOUTH ASIA TFC AND TPE
20
30
40
50
60
70
80
90
EJ /
yea
r (E
nerg
y so
urce
)
South Asia - Total Primary Energy - By Source
10
20
30
40
50
60
EJ /
yea
r (E
nerg
y ca
rrie
r)
South Asia - Total Final Consumption - By Sector
Copyright of Shell International BV 224 July 2012
0
10
2000 2005 2010 2015 2020 2025 2030 2035Year
Oil Natural Gas
Coal Nuclear
Hydro-electricity Biofuels
Biomass & Waste Biomass - Traditional
Geothermal Solar
Wind Other Renewables
FSB Energy - Shell WEM v2.4.13 - BBC12 - Normal Efficiency
0
10
2000 2005 2010 2015 2020 2025 2030 2035Year
Industry Services
Passenger Transport Freight Transport
Residential Non Energy Use
FSB Energy - Shell WEM v2.4.13 - BBC12 - Normal Efficiency
South AsiaIndiaPakistanBangladeshRest of South Asia
Note: This outlook is an example only as it is based on extrapolation of current trends and assumptions around possible future choices. Many uncertainties remain and many alternatives to this outlook are possible therefore.
SE ASIA POPULATION AND GDP
2
3
4
5
6
7
8
9
USD
trill
ion
(PPP
, 20
10 U
SD)
World - GDP
200
300
400
500
600
700
800
mill
ion
peop
le
World - Population
Copyright of Shell International BV 234 July 2012
0
1
2
2000 2005 2010 2015 2020 2025 2030 2035
USD
trill
ion
(PPP
, 20
10 U
SD)
Year
SE Asia
FSB Energy - Shell WEM v2.4.17 - BBC12 - Version Release
0
100
2000 2005 2010 2015 2020 2025 2030 2035Year
SE Asia
FSB Energy - Shell WEM v2.4.17 - BBC12 - Version Release
SE Asian population grows x% pa from ~600 mln to 720 mln.
SE Asian GDP/capita growths 2.9% pa from 5,500 to 11,000 (2011-2035)
SE AsiaIndonesiaThailandMalaysiaVietnamPhilippinesSingapore
Note: This outlook is an example only as it is based on extrapolation of current trends and assumptions around possible future choices. Many uncertainties remain and many alternatives to this outlook are possible therefore.
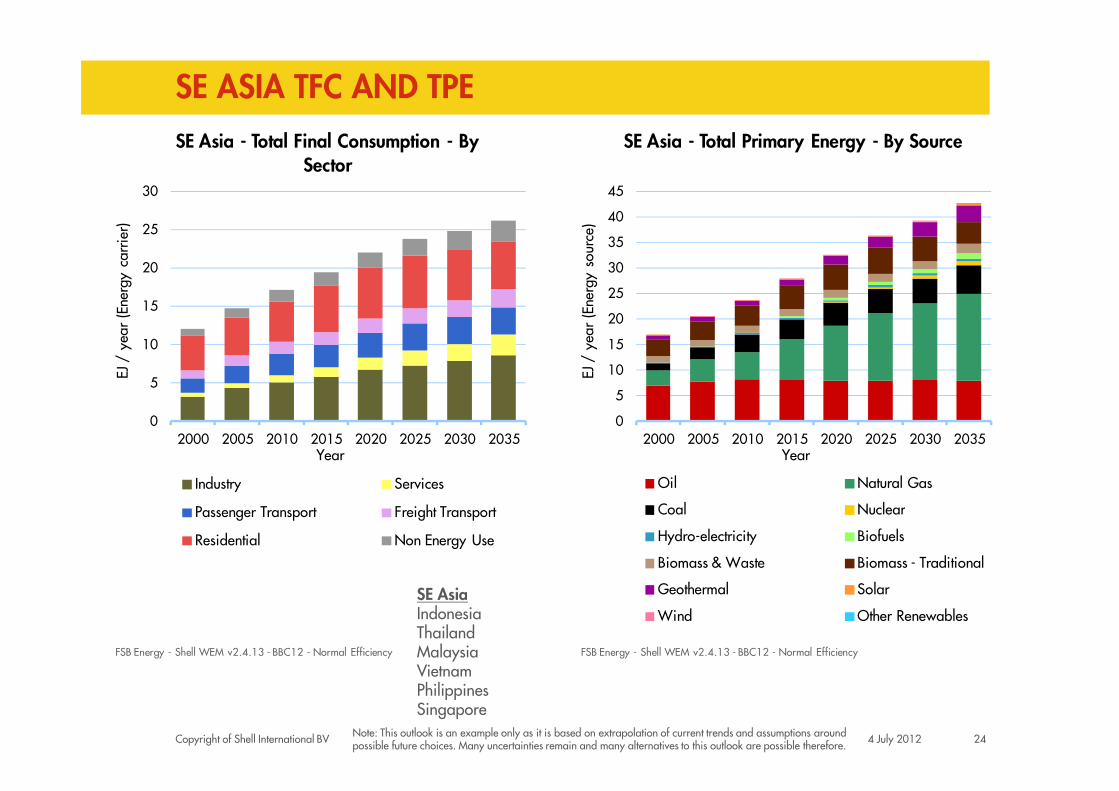
SE ASIA TFC AND TPE
5
10
15
20
25
30
EJ /
yea
r (E
nerg
y ca
rrie
r)SE Asia - Total Final Consumption - By
Sector
5
10
15
20
25
30
35
40
45
EJ /
yea
r (E
nerg
y so
urce
)
SE Asia - Total Primary Energy - By Source
Copyright of Shell International BV 244 July 2012
02000 2005 2010 2015 2020 2025 2030 2035
Year
Industry Services
Passenger Transport Freight Transport
Residential Non Energy Use
FSB Energy - Shell WEM v2.4.13 - BBC12 - Normal Efficiency
0
5
2000 2005 2010 2015 2020 2025 2030 2035Year
Oil Natural Gas
Coal Nuclear
Hydro-electricity Biofuels
Biomass & Waste Biomass - Traditional
Geothermal Solar
Wind Other Renewables
FSB Energy - Shell WEM v2.4.13 - BBC12 - Normal Efficiency
SE AsiaIndonesiaThailandMalaysiaVietnamPhilippinesSingapore
Note: This outlook is an example only as it is based on extrapolation of current trends and assumptions around possible future choices. Many uncertainties remain and many alternatives to this outlook are possible therefore.
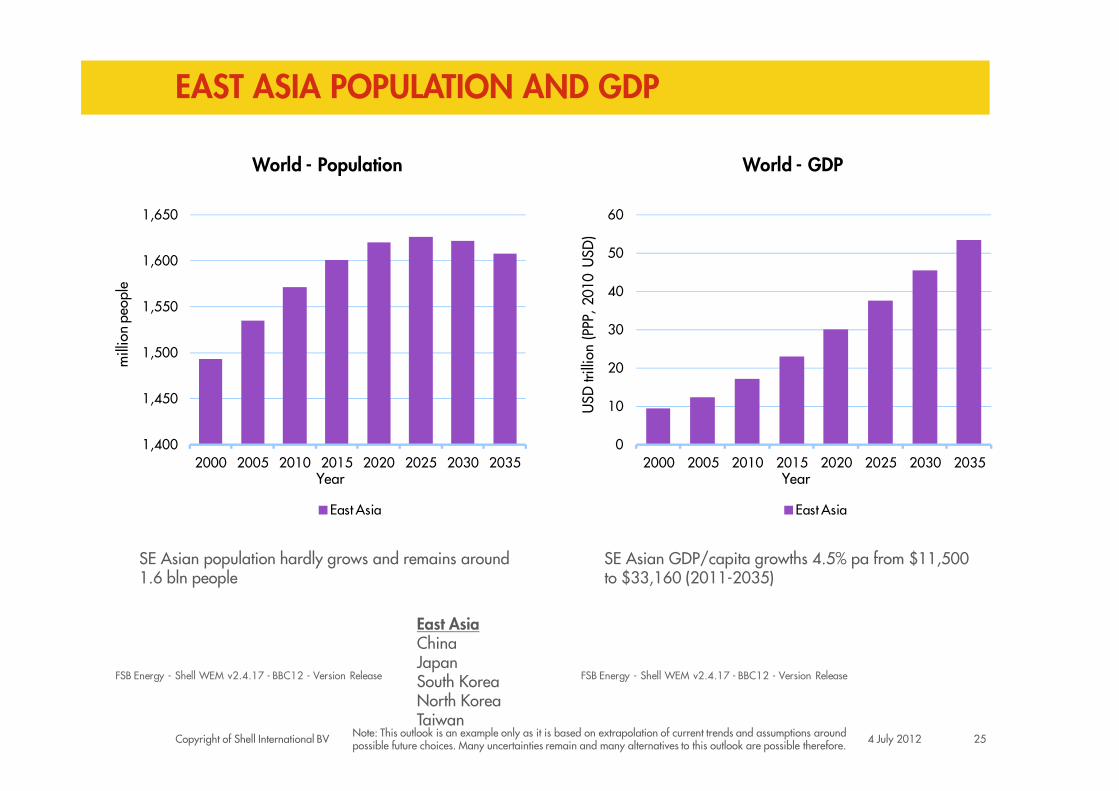
EAST ASIA POPULATION AND GDP
1,450
1,500
1,550
1,600
1,650
mill
ion
peop
le
World - Population
20
30
40
50
60
USD
trill
ion
(PPP
, 20
10 U
SD)
World - GDP
Copyright of Shell International BV 254 July 2012
1,400
1,450
2000 2005 2010 2015 2020 2025 2030 2035Year
East Asia
FSB Energy - Shell WEM v2.4.17 - BBC12 - Version Release
0
10
2000 2005 2010 2015 2020 2025 2030 2035
USD
trill
ion
(PPP
, 20
10 U
SD)
Year
East Asia
FSB Energy - Shell WEM v2.4.17 - BBC12 - Version Release
SE Asian population hardly grows and remains around 1.6 bln people
SE Asian GDP/capita growths 4.5% pa from $11,500 to $33,160 (2011-2035)
East AsiaChinaJapanSouth KoreaNorth KoreaTaiwan
Note: This outlook is an example only as it is based on extrapolation of current trends and assumptions around possible future choices. Many uncertainties remain and many alternatives to this outlook are possible therefore.
EAST ASIA TFC AND TPE
40
60
80
100
120
140
160
EJ /
yea
r (E
nerg
y ca
rrie
r)
East Asia - Total Final Consumption - By Sector
50
100
150
200
250
EJ /
yea
r (E
nerg
y so
urce
)
East Asia - Total Primary Energy - By Source
Copyright of Shell International BV 264 July 2012
0
20
2000 2005 2010 2015 2020 2025 2030 2035
EJ /
yea
r (E
nerg
y ca
rrie
r)
Year
Industry Services
Passenger Transport Freight Transport
Residential Non Energy Use
FSB Energy - Shell WEM v2.4.17 - BBC12 - Version Release
0
50
2000 2005 2010 2015 2020 2025 2030 2035
EJ /
yea
r (E
nerg
y so
urce
)
Year
Oil Natural Gas
Coal Nuclear
Hydro-electricity Biofuels
Biomass & Waste Biomass - Traditional
Geothermal Solar
Wind Other Renewables
FSB Energy - Shell WEM v2.4.17 - BBC12 - Version Release
East AsiaChinaJapanSouth KoreaNorth KoreaTaiwan
Note: This outlook is an example only as it is based on extrapolation of current trends and assumptions around possible future choices. Many uncertainties remain and many alternatives to this outlook are possible therefore.
SHELL ENERGY SCENARIOS TO 2050
SIGNALS & SIGNPOSTS
PART 4
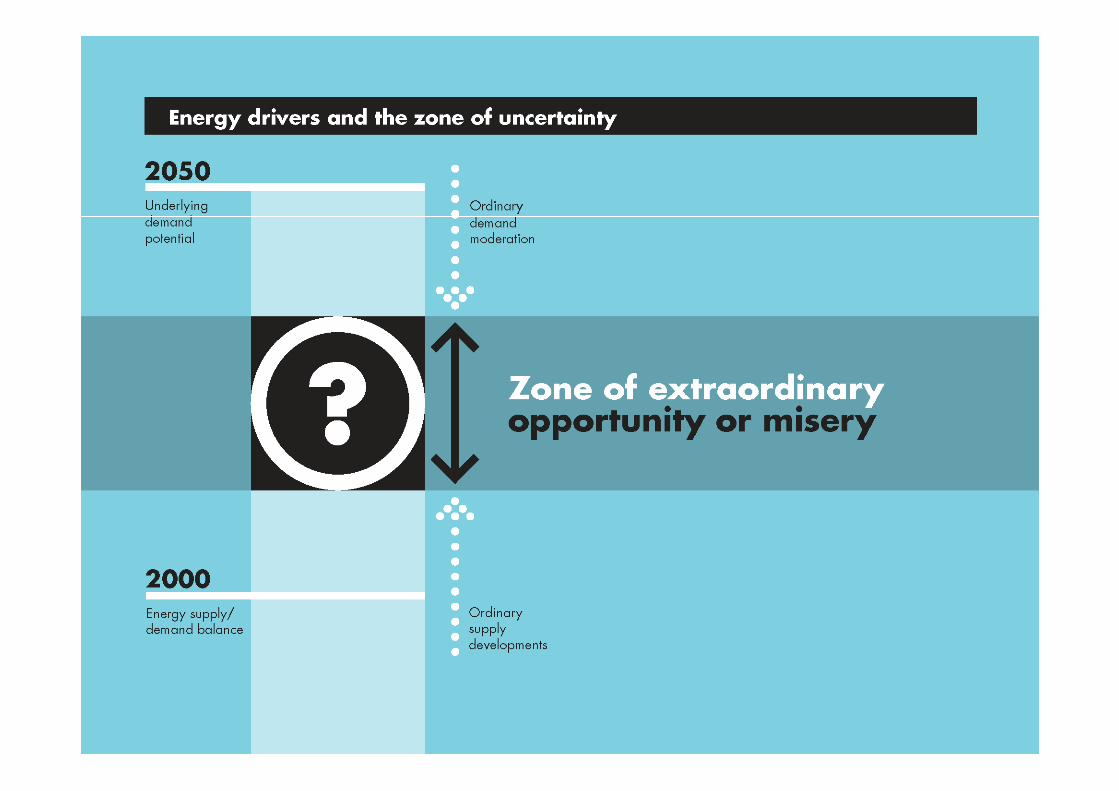
WHY DO WE USE SCENARIOS?
� Dealing with uncertainties greater, and time scales longer, than anyone can make predictions for
� Today’s complexity requires a broad dialogue with diverse communities to arrive at sustainable solutions
� Broaden peoples’ perspective
?
Copyright of Shell International BV 284 July 2012
� Broaden peoples’ perspective
� Challenging assumptions and mental models
� Develop strategies and test plans
� Identifying risks and opportunities
� Relevant to business and policy decision makers
� To ask “what if” questions, not necessarily give answers
� Not forecasts or predictions
2008 ENERGY SCENARIOS TO 20502008 ENERGY SCENARIOS TO 2050
National supply focusand reactive change
Copyright of Shell International BV 294 July 20126/15/2012 29
Emerging coalitionsand accelerated change
GREENER THAN BLUEPRINTS…?GREENER THAN BLUEPRINTS…?
� Blueprints lower CO2e than most
scenario analyses but still
650ppm by 2100*
� If 450ppm ≈2oC, Blueprints still
Copyright of Shell International BV 304 July 2012
� If 450ppm ≈2oC, Blueprints still
isn’t good enough
� Truly unprecedented pace of
transformational investment would
be required MIT analysis – September 2008
Key insights from Shell’s Energy Scenarios Key insights from Shell’s Energy Scenarios to 2050to 2050� The three hard truths that must be tackled together
�Accelerating demand from emerging economies
�Supply struggling to keep pace
�Climate change stresses rising
� Transformation in energy systems is inevitable
�Profound impact on mobility, buildings and electricity
Copyright of Shell International BV 314 July 2012
�Profound impact on mobility, buildings and electricity generation
� Technology plays an important role, but cannot do it alone –demand reduction and behaviour changes are also required
� Political and regulatory choices are pivotal – short and long term measures are necessary
� Blueprints approach offers more chance of a sustainable future…but more needs to be done ... 2o target will not be met
KEY DRIVERS IN GLOBAL POLITICSKEY DRIVERS IN GLOBAL POLITICS
� G20 vs G8 – a global role for more nations?
� China/US – a crucial new relationship between the established
and emerging world orders
� Policy paradigm – reshaping the liberal capitalist model.
Copyright of Shell International BV 324 July 2012
� Policy paradigm – reshaping the liberal capitalist model.
Re-emergence of state intervention and industrial policy
� Burdens of adjustment – choices on taxation, inflation
targets, and public spending will impact who bears the