THE ECONOMIC IMPACTS OF THE OIL AND NATURAL GAS INDUSTRY ON THE U.S. ECONOMY: EMPLOYMENT, LABOR INCOME AND VALUE ADDED Prepared for American Petroleum Institute September 8, 2009 National Economics & Statistics
Transcript
THE ECONOMIC IMPACTS OF THE OIL AND NATURAL GAS INDUSTRY ON THE U.S.
ECONOMY: EMPLOYMENT, LABOR INCOME AND VALUE ADDED
Prepared for
American Petroleum Institute
September 8, 2009 National Economics & Statistics
i
THE ECONOMIC IMPACTS OF THE OIL AND NATURAL GAS INDUSTRY ON THE U.S. ECONOMY: EMPLOYMENT, LABOR INCOME AND VALUE ADDED
TABLE OF CONTENTS
Page EXECUTIVE SUMMARY .......................................................................................................1 I. INTRODUCTION........................................................................................................4 II. INDUSTRY DEFINITION............................................................................................6 III. TOTAL ECONOMIC IMPACT ....................................................................................9 IV. ECONOMIC IMPACT BREAKDOWN: DIRECT, INDIRECT, AND INDUCED
IMPACTS .................................................................................................................15 APPENDICES: A. DETAILED STATE-BY-STATE OPERATIONAL IMPACT RESULTS ..................A-1 B. DATA SOURCES AND METHODOLOGY ...........................................................B-1
1
THE ECONOMIC IMPACTS OF THE OIL AND NATURAL GAS INDUSTRY ON THE U.S. ECONOMY: EMPLOYMENT, LABOR INCOME AND VALUE ADDED
Executive Summary The oil and natural gas industry, a vital link in the nation's energy supply, makes important contributions to the U.S. economy by providing an economical energy source for transportation and the production of other goods and services. The oil and natural gas industry currently supplies more than 60% of the nation's total energy demands and more than 99% of the fuel used by Americans in their cars and trucks1, while 900 of the next 1000 U.S. power plants are projected to use natural gas.2 In addition to the important products made available by the oil and natural gas industry, the industry also makes significant economic contributions as an employer and purchaser of goods and services. The oil and natural gas industry is one of the largest employers in the country, employing millions of Americans in exploring, producing, processing, transporting, and marketing oil and natural gas. Millions of jobs in other industries are supported by the oil and natural gas industry’s purchases of intermediate inputs and capital goods from other U.S. producers. These businesses include equipment suppliers, construction services, management services, food services, and many other types of support services. These supporting businesses, in turn, purchase goods and services, spurring additional economic activities. Further, employees and business owners make personal purchases out of the additional income that is generated by this process, sending more new demands rippling through the economy. The purpose of this report is to quantify the contribution of the U.S. oil and natural gas industry to the U.S. national and state economies in terms of employment, labor income (including wages and salaries and benefits, as well as proprietors' income), and value added.3 The direct impact is measured as the jobs, labor income, and value added within the oil and natural gas industry. The indirect impact is measured as the jobs, labor income, and value added occurring within other industries that provide goods and services to the oil and natural gas industry. The induced impact is measured as the jobs, labor income, and value added resulting from household spending of income earned either directly or indirectly from the oil and natural gas industry’s spending. The combination of these three effects comprises the total contribution of the U.S. oil and natural gas industry. At the national level, this report quantifies both the industry’s operational impact (due to purchases of intermediate inputs) and capital investment impact (due to purchases of new structures and equipment). The report does not address the economic effects of the use of oil and natural gas in the economy. In 2007, the most recent year for which data are available, PricewaterhouseCoopers estimates that, combining the operational and capital investment impacts, the U.S. oil and natural gas industry's total employment contribution to the national economy amounted to 9.2 million full-time and part-time jobs, accounting for 5.2 percent of the total employment in the country (see Table E-1). The associated labor income, 1 http://www.api.org/aboutoilgas/ and http://www.energy.gov/energysources/oil.htm 2 http://www.energy.gov/energysources/naturalgas.htm 3 Value added refers to the additional value created at a particular stage of production. It is a measure of the overall importance of an industry. Value added consists of: employee compensation, proprietors' income, income to capital owners from property, and indirect business taxes (i.e., those borne by consumers rather than producers).
2
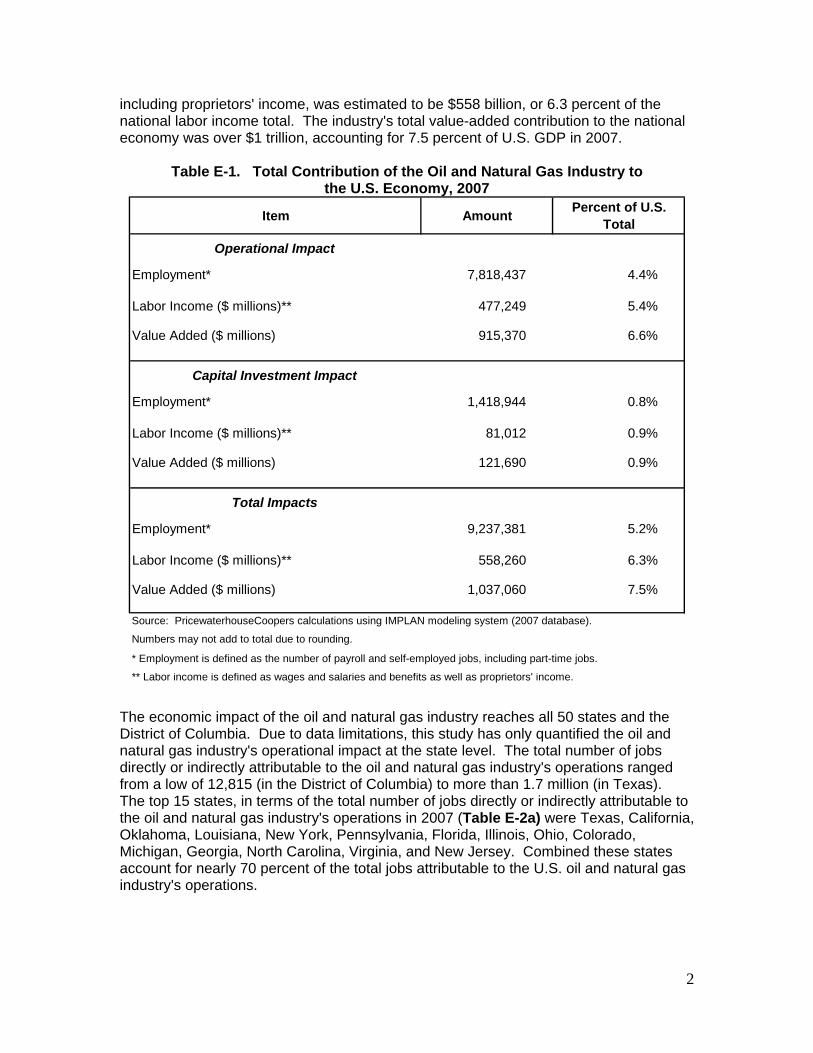
including proprietors' income, was estimated to be $558 billion, or 6.3 percent of the national labor income total. The industry's total value-added contribution to the national economy was over $1 trillion, accounting for 7.5 percent of U.S. GDP in 2007.
Table E-1. Total Contribution of the Oil and Natural Gas Industry to
the U.S. Economy, 2007
Item Amount Percent of U.S. Total
Operational Impact
Employment* 7,818,437 4.4%
Labor Income ($ millions)** 477,249 5.4%
Value Added ($ millions) 915,370 6.6%
Capital Investment Impact
Employment* 1,418,944 0.8%
Labor Income ($ millions)** 81,012 0.9%
Value Added ($ millions) 121,690 0.9%
Total Impacts
Employment* 9,237,381 5.2%
Labor Income ($ millions)** 558,260 6.3%
Value Added ($ millions) 1,037,060 7.5%
Source: PricewaterhouseCoopers calculations using IMPLAN modeling system (2007 database).
Numbers may not add to total due to rounding.
* Employment is defined as the number of payroll and self-employed jobs, including part-time jobs.
** Labor income is defined as wages and salaries and benefits as well as proprietors' income.
The economic impact of the oil and natural gas industry reaches all 50 states and the District of Columbia. Due to data limitations, this study has only quantified the oil and natural gas industry's operational impact at the state level. The total number of jobs directly or indirectly attributable to the oil and natural gas industry's operations ranged from a low of 12,815 (in the District of Columbia) to more than 1.7 million (in Texas). The top 15 states, in terms of the total number of jobs directly or indirectly attributable to the oil and natural gas industry's operations in 2007 (Table E-2a) were Texas, California, Oklahoma, Louisiana, New York, Pennsylvania, Florida, Illinois, Ohio, Colorado, Michigan, Georgia, North Carolina, Virginia, and New Jersey. Combined these states account for nearly 70 percent of the total jobs attributable to the U.S. oil and natural gas industry's operations.
3
Table E-2a. Total Operational Impact of the Oil and Natural Gas Industry, 2007 Top 15 States, Ranked by Total Employment Contribution
Amount Percent of State Total ($ Million) Percent of
State Total ($ Million) Percent of State Total
Texas 1,772,335 13.1% 140,941 19.5% 293,760 24.2%California 752,614 3.7% 54,122 4.6% 100,958 5.5%Oklahoma 348,627 16.3% 22,550 24.7% 47,839 31.3%Louisiana 330,053 13.4% 18,449 16.6% 35,986 20.6%New York 281,267 2.6% 21,452 3.0% 36,347 3.3%Pennsylvania 271,250 3.8% 14,494 4.1% 25,772 4.8%Florida 267,277 2.6% 11,441 2.6% 19,946 2.8%Illinois 260,001 3.5% 16,953 4.2% 31,323 5.0%Ohio 229,438 3.4% 11,121 3.7% 20,201 4.5%Colorado 190,408 6.0% 12,438 7.7% 24,099 9.3%Michigan 179,495 3.3% 9,820 3.8% 17,711 4.4%Georgia 145,806 2.7% 6,841 2.7% 12,032 3.0%North Carolina 145,779 2.7% 6,007 2.6% 10,623 2.9%Virginia 143,479 3.0% 6,923 2.7% 11,968 3.1%New Jersey 143,342 2.8% 9,461 3.1% 16,853 3.5%Source: PricewaterhouseCoopers calculations using IMPLAN modeling system (2007 database).Numbers may not add to total due to rounding.* Employment is defined as the number of payroll and self-employed jobs, including part-time jobs.** Labor income is defined as wages and salaries and benefits as well as proprietors' income.
Employment* Labor Income** Value AddedState
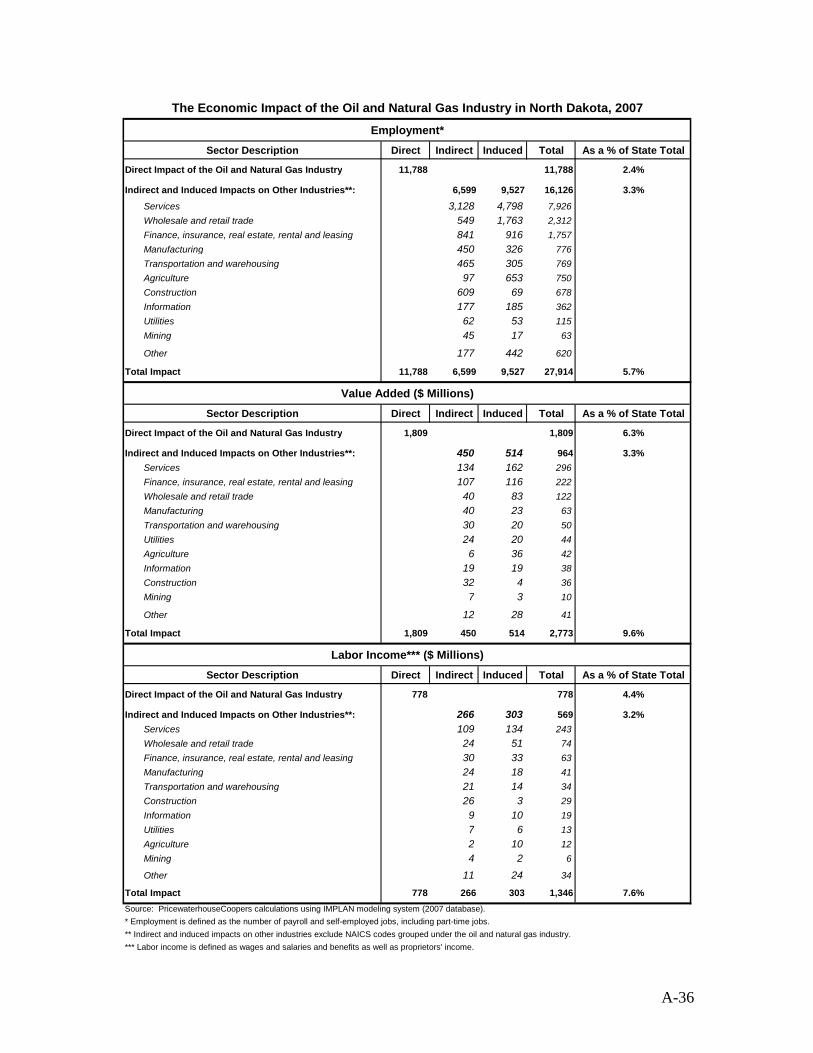
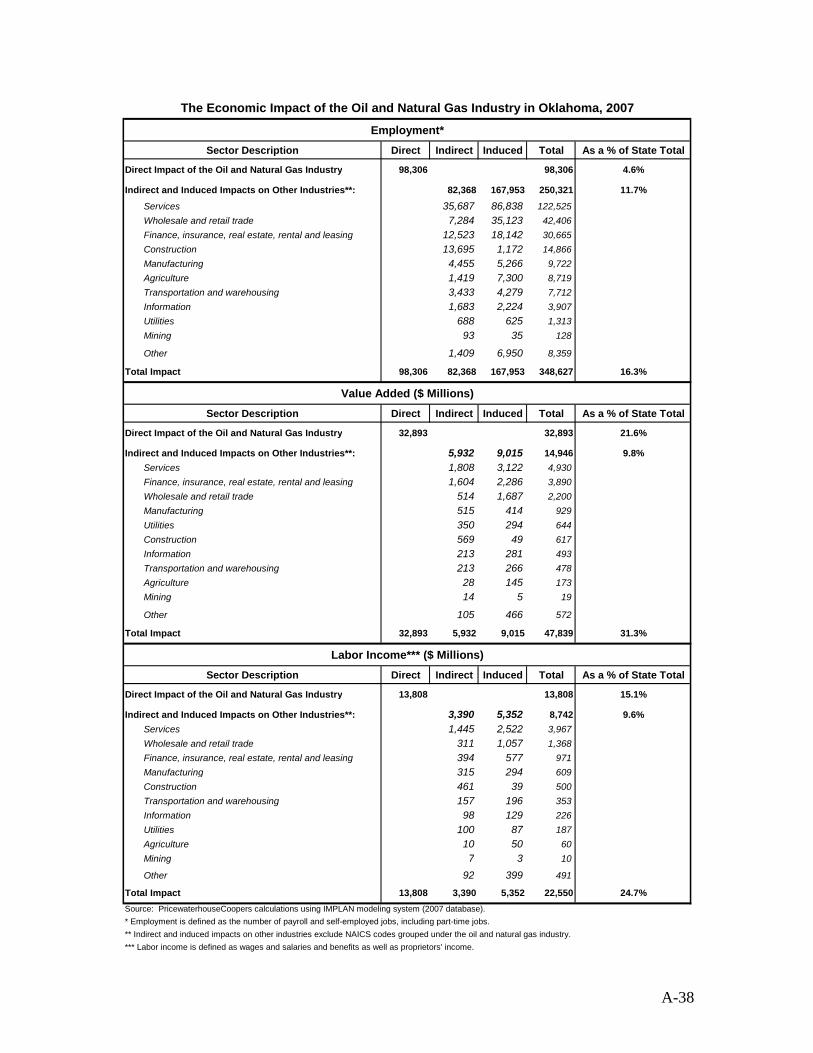
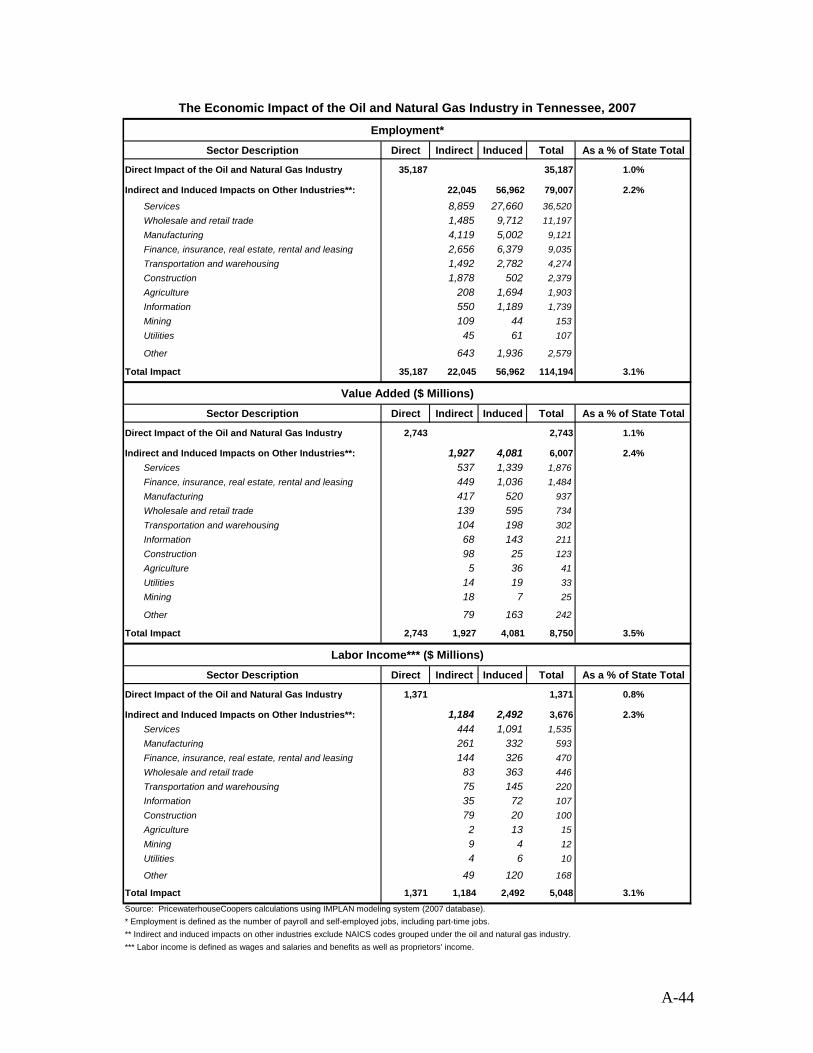
The oil and natural gas industry directly and indirectly supported 4 percent or more of the total employment in 15 states in 2007 (see Table E-2b): Wyoming (18.8 percent) Oklahoma (16.3 percent), Louisiana (13.4 percent), Texas (13.1 percent), Alaska (9.8 percent), New Mexico (8.1 percent), West Virginia (6.7 percent), Kansas (6.5 percent), Colorado (6.0 percent), North Dakota (5.7 percent), Mississippi (5.5 percent), Montana (5.3 percent), Utah (4.7 percent), Arkansas (4.4 percent) and Nebraska (4.0 percent).
Table E-2b. Total Operational Impact of the Oil and Natural Gas Industry, 2007
Top 15 States, Ranked by Employment Share of State Total
Amount Percent of State Total ($ Million) Percent of
State Total ($ Million) Percent of State Total
Wyoming 71,063 18.8% 4,060 24.3% 8,432 29.4%Oklahoma 348,627 16.3% 22,550 24.7% 47,839 31.3%Louisiana 330,053 13.4% 18,449 16.6% 35,986 20.6%Texas 1,772,335 13.1% 140,941 19.5% 293,760 24.2%Alaska 43,454 9.8% 3,143 13.5% 6,064 16.6%New Mexico 88,814 8.1% 4,307 9.5% 8,292 12.2%West Virginia 60,891 6.7% 2,740 7.4% 5,412 9.4%Kansas 119,051 6.5% 6,738 8.8% 14,029 11.4%Colorado 190,408 6.0% 12,438 7.7% 24,099 9.3%North Dakota 27,914 5.7% 1,346 7.6% 2,773 9.6%Mississippi 83,820 5.5% 3,609 6.5% 7,244 8.4%Montana 34,210 5.3% 1,584 7.0% 3,324 8.9%Utah 76,188 4.7% 3,960 5.9% 7,822 7.6%Arkansas 69,640 4.4% 2,884 4.9% 5,589 6.0%Nebraska 49,784 4.0% 2,743 5.6% 5,112 6.7%Source: PricewaterhouseCoopers calculations using IMPLAN modeling system (2007 database).Numbers may not add to total due to rounding.* Employment is defined as the number of payroll and self-employed jobs, including part-time jobs.** Labor income is defined as wages and salaries and benefits as well as proprietors' income.
Employment* Labor Income** Value AddedState
4
THE ECONOMIC IMPACTS OF THE OIL AND NATURAL GAS INDUSTRY ON THE U.S. ECONOMY: EMPLOYMENT, LABOR INCOME AND VALUE ADDED
I. Introduction The purpose of this report is to quantify the contribution of the U.S. oil and natural gas industry as an employer and purchaser of goods and services to the U.S. national and state economies in terms of employment, labor income (including wages and salaries and benefits, as well as proprietors' income), and value added.4 At the national level, this study quantifies both the industry's operational impact from its purchase of intermediate inputs and capital investment impact from its purchases of new structures and equipment, while at the state level, this study has only quantified the industry's operational impact due to data limitations. The economic effects of the use of oil and natural gas in the economy are beyond the scope of this analysis. In describing the economic impact of the U.S. oil and natural gas industry through its employment and purchases of goods and services, it is standard to consider three separate channels that in aggregate constitute the total economic impact of the oil and natural gas industry: direct impact, indirect impact, and induced impact.
• Direct impact is measured as the jobs, labor income, and value added within the oil and natural gas industry.
• Indirect impact is measured as the jobs, labor income, and value added occurring within other industries that provide goods and services to the oil and natural gas industry.
• Induced impact is measured as the jobs, labor income, and value added resulting from household spending of income earned either directly or indirectly from the oil and natural gas industry’s spending.
In total, these three effects result in the oil and natural gas industry having a widespread economic impact throughout all sectors of the U.S. economy and in all geographic areas.
Using the IMPLAN input-output modeling system, PricewaterhouseCoopers has built customized multiplier models for the U.S. as a whole, as well as the 50 states and the District of Columbia. The models document the oil and natural gas industry’s economic contributions at the national and state level in 2007, the most recent historical year for which a consistent set of national and state level data are available from the IMPLAN modeling system.5 The input-output multiplier models trace all the backward linkages among industries in a geographic region.6 They do not capture any forward linkages (i.e., the link between an industry producing a good or service and the consumers of that good or service). The rest of this report is organized as follows. Section II defines the oil and natural gas industry for this study. Section III presents the direct impact analysis, followed by 4 Value added refers to the additional value created at a particular stage of production. It is a measure of the overall importance of an industry. Value added consists of: employee compensation, proprietors' income, income to capital owners from property, and indirect business taxes (i.e., those borne by consumers rather than producers). 5 The IMPLAN input-output economic modeling system is supported by the Minnesota IMPLAN Group. Its current users include academia, federal, state, and local governments, and the private sector. 6 A backward linkage is between an industry and its suppliers.
5
indirect and induced impact analysis in Section IV. Detailed state-by-state operational impact results are presented in Appendix A. Data sources and methodology used in this research report are discussed in Appendix B.
6
II. Industry Definition In government economic statistics, the oil and natural gas industry encompasses a number of sectors. Oil and natural gas production is included in the “mining” sector; oil refining is part of the “manufacturing” sector; pipeline operations are included in the “transportation” sector; natural gas distribution is in the “utilities” sector; and oil marketing is considered part of the “wholesale and retail trade” sector. For the economic impact analysis, PricewaterhouseCoopers has defined the oil and natural gas industry based on the North American Industry Classification System (NAICS). Table 1 shows the composition of the industry as defined by PricewaterhouseCoopers, followed by detailed NAICS descriptions.
Table 1. Composition of Oil and Natural Gas Industry
NAICS IMPLAN SECTOR
Description
211 20 Oil and gas extraction (including NGL extraction) 213111 28 Drilling oil and gas wells 213112 29 Support activities for oil and gas operations 2212 32 Natural gas distribution (private) 2212 432* Natural gas distribution (public) 23712 36* Oil and gas pipeline and related structures construction 32411 115 Petroleum refineries 324191 118 Petroleum lubricating oil and grease manufacturing
32412
116,117 Asphalt paving, roofing, and saturated materials manufacturing
4247 319* Petroleum and petroleum products merchant wholesalers 486 337 Pipeline transportation 44711 326 Gasoline stations with convenience stores 44719 326 Other gasoline stations 45431 331* Fuel dealers
* Other activities outside the oil and natural gas industry are also included in this IMPLAN sector. NAICS 211. Oil and gas extraction. Establishments in this subsector operate and/or develop oil and gas field properties. Such activities may include exploration for crude petroleum and natural gas; drilling, completing, and equipping wells; operating separators, emulsion breakers, desilting equipment, and field gathering lines for crude petroleum and natural gas; and all other activities in the preparation of oil and gas up to the point of shipment from the producing property. This subsector includes the production of crude petroleum, the mining and extraction of oil from oil shale and oil sands, and the production of natural gas, sulfur recovery from natural gas, and recovery of hydrocarbon liquids. Establishments in this subsector include those that operate oil and gas wells on their own account or for others on a contract or fee basis. NAICS 213111. Drilling oil and gas wells. This subsector comprises establishments primarily engaged in drilling oil and gas wells for others on a contract or fee basis. This industry includes contractors that specialize in spudding in, drilling in, redrilling, and directional drilling.
7
NAICS 213112. Support activities for oil and gas operations. This subsector comprises establishments primarily engaged in performing support activities on a contract or fee basis for oil and gas operations (except site preparation and related construction activities). Services included are exploration (except geophysical surveying and mapping); excavating slush pits and cellars, well surveying; running, cutting, and pulling casings, tubes, and rods; cementing wells, shooting wells; perforating well casings; acidizing and chemically treating wells; and cleaning out, bailing, and swabbing wells. NAICS 2212. Natural gas distribution. This subsector comprises: (1) establishments primarily engaged in operating gas distribution systems (e.g., mains, meters); (2) establishments known as gas marketers that buy gas from the well and sell it to a distribution system; (3) establishments known as gas brokers or agents that arrange the sale of gas over gas distribution systems operated by others; and (4) establishments primarily engaged in transmitting and distributing gas to final consumers. Both privately and publicly owned establishments are included in this study. NAICS 23712. Oil and gas pipeline and related structures construction. This subsector comprises establishments primarily engaged in the construction of oil and gas lines, mains, refineries, and storage tanks. The work performed may include new work, reconstruction, rehabilitation, and repairs. Specialty trade contractors are included in this group if they are engaged in activities primarily related to oil and gas pipeline and related structures construction. All structures (including buildings) that are integral parts of oil and gas networks (e.g., storage tanks, pumping stations, and refineries) are included in this subsector. NAICS 32411. Petroleum refineries. This subsector comprises establishments primarily engaged in refining crude petroleum into refined petroleum. Petroleum refining involves one or more of the following activities: (1) fractionation; (2) straight distillation of crude oil; and (3) cracking. NAICS 324191. Petroleum lubricating oil and grease manufacturing. This subsector comprises establishments primarily engaged in blending or compounding refined petroleum to make lubricating oils and greases and/or re-refining used petroleum lubricating oils. NAICS 32412. Asphalt paving, roofing, and saturated materials manufacturing. This subsector comprises establishments primarily engaged in (1) manufacturing asphalt and tar paving mixtures and blocks and roofing cements and coatings from purchased asphaltic materials and/or (2) saturating purchased mats and felts with asphalt or tar from purchased asphaltic materials. NAICS 4247. Petroleum and petroleum products merchant wholesalers. This subsector comprises establishments with bulk liquid storage facilities primarily engaged in the merchant wholesale distribution of crude petroleum and petroleum products, including liquefied petroleum gas. NAICS 486. Pipeline transportation. Establishments in this subsector use transmission pipelines to transport products, such as crude oil, natural gas, refined petroleum products, and slurry. It also includes the storage of natural gas because the
8
storage is usually done by the pipeline establishment and because a pipeline is inherently a network in which all the nodes are interdependent. NAICS 44711. Gasoline stations with convenience stores. This subsector comprises establishments engaged in retailing automotive fuels (e.g., diesel fuel, gasohol, gasoline) in combination with convenience store or food mart items. These establishments can either be in a convenience store (i.e., food mart) setting or a gasoline station setting. These establishments may also provide automotive repair services. NAICS 44719. Other gasoline stations. This subsector comprises establishments known as gasoline stations (except those with convenience stores) primarily engaged in one of the following: (1) retailing automotive fuels (e.g., diesel fuel, gasohol, gasoline) or (2) retailing these fuels in combination with activities, such as providing repair services; selling automotive oils, replacement parts, and accessories; and/or providing food services NAICS 45431. Fuel dealers. This subsector comprises establishments primarily engaged in retailing heating oil, liquefied petroleum (LP) gas, and other fuels via direct selling.
9
III. Total Economic Impact This section presents the estimated total economic impact of the oil and natural gas industry on the U.S. national and state economies. As shown below, the oil and natural gas industry has a widespread economic impact throughout all sectors of the economy and across all 50 states and the District of Columbia. The total economic impact we have measured includes the direct impact (the jobs and value added within the oil and natural gas industry), the indirect impact (the jobs and value added occurring within other industries that provide goods and services to the oil and natural gas industry), and the induced impact (the jobs and value added resulting from household spending of income earned either directly or indirectly from the oil and natural gas industry’s spending). At the national level, both the industry's operational impact and capital investment impacts are included. At the state level, only the industry's operational impact is reported due to data limitations. The analysis was conducted using published government data sources and the IMPLAN input-output modeling system. A. National Impact As shown in Table 2, the total economic contribution of the oil and natural gas industry in terms of jobs, labor income (including wages and salaries and benefits as well as proprietors' income), and value added is significant. Employment PricewaterhouseCoopers estimates that at the national level, each job in the oil and natural gas industry supported more than three jobs elsewhere in the U.S. economy in 2007. In terms of operational impact, the oil and natural gas industry directly and indirectly contributed over 7.8 million full-time and part-time jobs to the national economy in 2007. Further, the oil and natural gas industry's capital investment contributed an additional 1.4 million jobs to the national economy. Combining both operational and capital investment impacts, the oil and natural gas industry's total employment contribution to the national economy amounted to 9.2 million full-time and part-time jobs in 2007, accounting for 5.2 percent of the total employment in the country. Labor Income The associated labor income (including wages and salaries and benefits, as well as proprietors' income) from the total jobs directly or indirectly supported by the oil and natural gas industry through its operational spending and capital investment was estimated to be $558 billion, or 6.3 percent of the national total labor income. Value Added Value added refers to the additional value created at a particular stage of production. Economists use the value-added method as a way to avoid double counting, i.e., the counting of the same input twice. It is a useful measure of the overall importance of an industry. The sum of value added across all industries in a country or region is, by definition, equivalent to its Gross Domestic Product (GDP). Value added consists of: employee compensation, proprietors' income, income to capital owners from property, and indirect business taxes (i.e., those borne by consumers rather than producers).
10
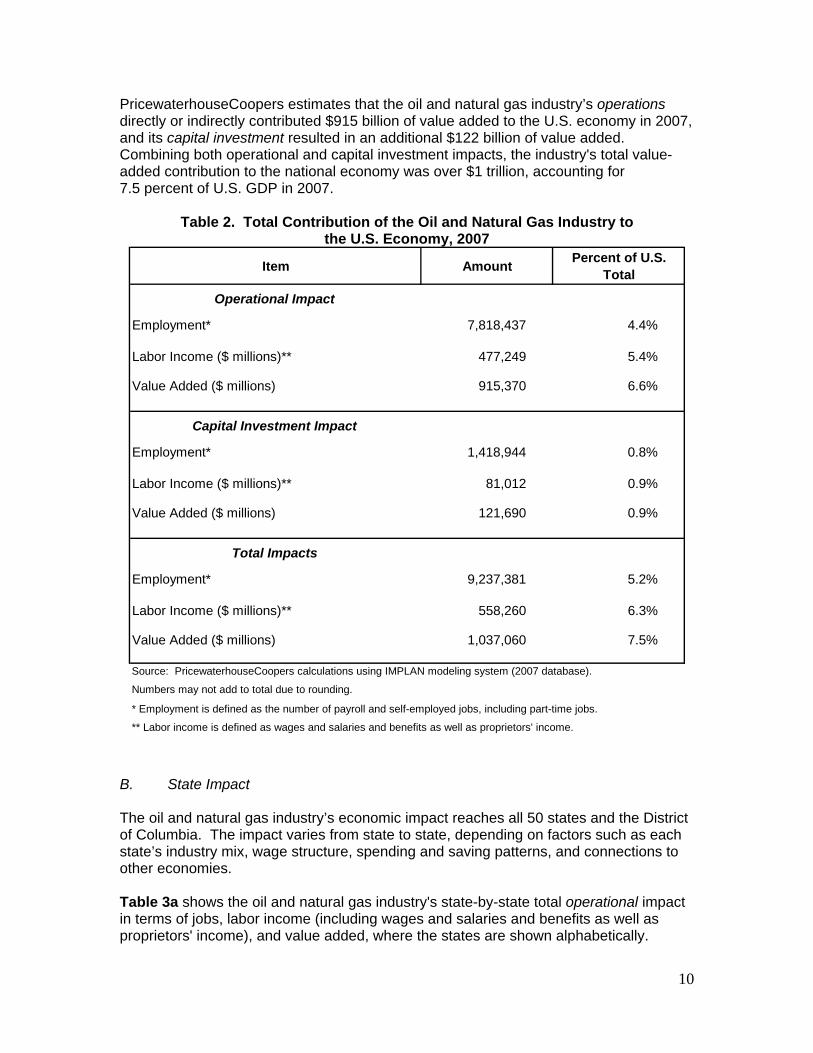
PricewaterhouseCoopers estimates that the oil and natural gas industry’s operations directly or indirectly contributed $915 billion of value added to the U.S. economy in 2007, and its capital investment resulted in an additional $122 billion of value added. Combining both operational and capital investment impacts, the industry's total value-added contribution to the national economy was over $1 trillion, accounting for 7.5 percent of U.S. GDP in 2007.
Table 2. Total Contribution of the Oil and Natural Gas Industry to the U.S. Economy, 2007
Item Amount Percent of U.S. Total
Operational Impact
Employment* 7,818,437 4.4%
Labor Income ($ millions)** 477,249 5.4%
Value Added ($ millions) 915,370 6.6%
Capital Investment Impact
Employment* 1,418,944 0.8%
Labor Income ($ millions)** 81,012 0.9%
Value Added ($ millions) 121,690 0.9%
Total Impacts
Employment* 9,237,381 5.2%
Labor Income ($ millions)** 558,260 6.3%
Value Added ($ millions) 1,037,060 7.5%
Source: PricewaterhouseCoopers calculations using IMPLAN modeling system (2007 database).
Numbers may not add to total due to rounding.
* Employment is defined as the number of payroll and self-employed jobs, including part-time jobs.
** Labor income is defined as wages and salaries and benefits as well as proprietors' income.
B. State Impact The oil and natural gas industry’s economic impact reaches all 50 states and the District of Columbia. The impact varies from state to state, depending on factors such as each state’s industry mix, wage structure, spending and saving patterns, and connections to other economies. Table 3a shows the oil and natural gas industry's state-by-state total operational impact in terms of jobs, labor income (including wages and salaries and benefits as well as proprietors' income), and value added, where the states are shown alphabetically.
11
Table 3b is the same as Table 3a, except that the states are ranked in order of the industry’s total employment contribution as a percent of each state’s total employment. The state-level results, as explained earlier, do not include the economic impact of the industry's significant capital investment.
12
Table 3a. Total Operational Impact of the Oil and Natural Gas Industry by State in 2007 (Sorted Alphabetically)
Amount Percent of State Total ($ Million) Percent of
U.S. Total 7,818,437 4.4% 477,249 5.4% 915,370 6.6%Source: PricewaterhouseCoopers calculations using IMPLAN modeling system (2007 database).Numbers may not add to total due to rounding.* Employment is defined as the number of payroll and self-employed jobs, including part-time jobs.** Labor income is defined as wages and salaries and benefits as well as proprietors' income.
Employment* Labor Income** Value AddedState
13
Table 3b. Total Operational Impact of the Oil and Natural Gas Industry by State in 2007 (Sorted by Employment Share of State Total)
Amount Percent of State Total ($ Million) Percent of
U.S. Total 7,818,437 4.4% 477,249 5.4% 915,370 6.6%Source: PricewaterhouseCoopers calculations using IMPLAN modeling system (2007 database).Numbers may not add to total due to rounding.* Employment is defined as the number of payroll and self-employed jobs, including part-time jobs.** Labor income is defined as wages and salaries and benefits as well as proprietors' income.
Employment* Labor Income** Value AddedState
14
Employment The total number of jobs directly or indirectly attributable to the oil and natural gas industry's operations as a percent of each state’s total employment in 2007 ranged from 1.5 percent (the District of Columbia) to nearly one in every five jobs (Wyoming). The oil and natural gas industry directly and indirectly supported more than 5 percent of the total employment in 12 states in 2007: Wyoming (18.8 percent) Oklahoma (16.3 percent), Louisiana (13.4 percent), Texas (13.1 percent), Alaska (9.8 percent), New Mexico (8.1 percent), West Virginia (6.7 percent), Kansas (6.5 percent), Colorado (6.0 percent), North Dakota (5.7 percent), Mississippi (5.5 percent) and Montana (5.3 percent). In these top 12 states, the oil and natural gas industry on average was directly or indirectly responsible for one in every nine jobs. Labor Income As a percent of each state’s total labor income (including wages and salaries and benefits as well as proprietors' income), the labor income from the total jobs directly and indirectly supported by the oil and natural gas industry's operations ranged from 1.4 percent (the District of Columbia) to one in every four dollars of labor income (Oklahoma) in 2007. The oil and natural gas industry’s total labor income contribution exceeded 5 percent of the state total in 14 states: Oklahoma (24.7 percent), Wyoming (24.3 percent), Texas (19.5 percent), Louisiana (16.6 percent), Alaska (13.5 percent), New Mexico (9.5 percent), Kansas (8.8 percent), Colorado (7.7 percent), North Dakota (7.6 percent), West Virginia (7.4 percent), Montana (7.0 percent), Mississippi (6.5 percent), Utah (5.9 percent), and Nebraska (5.6 percent). Value Added As a percent of each state’s economy, the oil and natural gas industry’s total value-added contribution from its operations ranged from 1.7 percent (the District of Columbia) to just under one in every three dollars of value added (Oklahoma) in 2007. The oil and natural gas industry’s total value-added contribution accounted for at least 5 percent of the state total in 17 states: Oklahoma (31.3 percent), Wyoming (29.4 percent), Texas (24.2 percent), Louisiana (20.6 percent), Alaska (16.6 percent), New Mexico (12.2 percent), Kansas (11.4 percent), North Dakota (9.6 percent), West Virginia (9.4 percent), Colorado (9.3 percent), Montana (8.9 percent), Mississippi (8.4 percent), Utah (7.6 percent), Nebraska (6.7 percent), Arkansas (6.0 percent), California (5.5 percent), and Illinois (5.0 percent).
15
IV. Economic Impact Breakdown: Direct, Indirect, and Induced Impacts As noted earlier, the total economic impact presented in the previous section includes the direct impact (the jobs, labor income, and value added within the oil and natural gas industry), the indirect impact (the jobs and value added occurring within other industries that provide goods and services to the oil and natural gas industry), and the induced impact (the jobs and value added resulting from household spending of income earned either directly or indirectly from the oil and natural gas industry’s spending). In this section, the three different economic impacts will be separately identified. Direct Impact Table 4 shows the direct impact of the oil and natural gas industry by NAICS subsectors for the country as a whole in terms of employment, labor income (including wages and salaries and benefits as well as proprietors' income), and value added. In 2007, the oil and natural gas industry directly provided 2.1 million jobs for American workers with approximately $200 billion in wages and salaries and fringe benefits and proprietors' income. The industry directly contributed over $450 billion to the national GDP.
Table 4. Direct Impact of the Oil and Natural Gas Industry in the U.S. Economy by Sub-sector, 2007
Employment* Labor Income** Value Added
Amount ($ Millons) ($ Millons)
211 Oil and gas extraction (including NGL extraction) 368,451 67,989 161,763
213111 Drilling oil and gas wells 87,996 8,215 41,986
213112 Support activities for oil and gas operations 205,662 16,843 22,276
2212 Natural gas distribution (private) 108,900 17,892 43,816
2212 Natural gas distribution (public) 8,654 538 770
23712 Oil and gas pipeline and related structures construction 97,817 4,930 5,312
32411 Petroleum refineries 70,410 31,055 85,483
324191 Petroleum lubricating oil and grease manufacturing 9,543 2,351 5,177
Total Oil and Natural Gas Industry 2,123,291 199,344 456,971Source: IMPLAN 2007 database, U.S. Census Bureau and U.S. Department of Labor.* Employment is defined as the number of payroll and self-employed jobs, including part-time jobs.** Labor income is defined as wages and salaries and benefits as well as proprietors' income.
NAICS Sub-sector Description
Table 5a shows the direct employment, labor income (including wages and salaries and benefits as well as proprietors' income) and value added impacts of the oil and natural
16
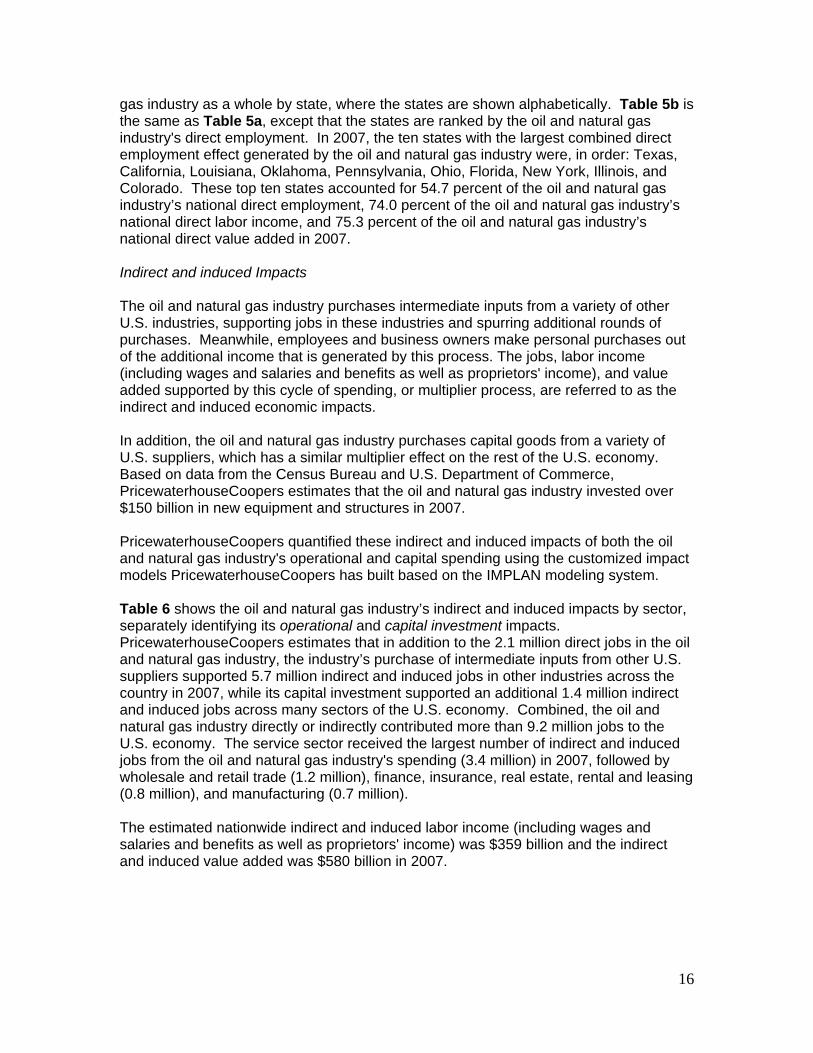
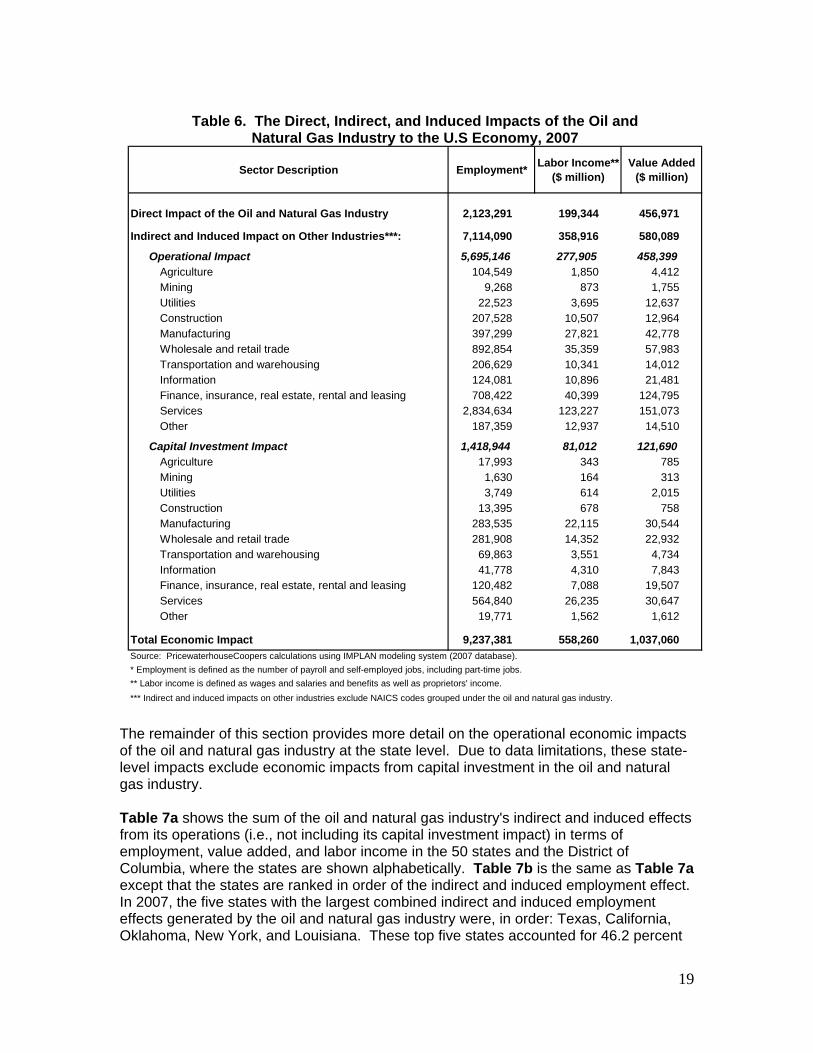
gas industry as a whole by state, where the states are shown alphabetically. Table 5b is the same as Table 5a, except that the states are ranked by the oil and natural gas industry's direct employment. In 2007, the ten states with the largest combined direct employment effect generated by the oil and natural gas industry were, in order: Texas, California, Louisiana, Oklahoma, Pennsylvania, Ohio, Florida, New York, Illinois, and Colorado. These top ten states accounted for 54.7 percent of the oil and natural gas industry’s national direct employment, 74.0 percent of the oil and natural gas industry’s national direct labor income, and 75.3 percent of the oil and natural gas industry’s national direct value added in 2007. Indirect and induced Impacts The oil and natural gas industry purchases intermediate inputs from a variety of other U.S. industries, supporting jobs in these industries and spurring additional rounds of purchases. Meanwhile, employees and business owners make personal purchases out of the additional income that is generated by this process. The jobs, labor income (including wages and salaries and benefits as well as proprietors' income), and value added supported by this cycle of spending, or multiplier process, are referred to as the indirect and induced economic impacts. In addition, the oil and natural gas industry purchases capital goods from a variety of U.S. suppliers, which has a similar multiplier effect on the rest of the U.S. economy. Based on data from the Census Bureau and U.S. Department of Commerce, PricewaterhouseCoopers estimates that the oil and natural gas industry invested over $150 billion in new equipment and structures in 2007. PricewaterhouseCoopers quantified these indirect and induced impacts of both the oil and natural gas industry's operational and capital spending using the customized impact models PricewaterhouseCoopers has built based on the IMPLAN modeling system. Table 6 shows the oil and natural gas industry’s indirect and induced impacts by sector, separately identifying its operational and capital investment impacts. PricewaterhouseCoopers estimates that in addition to the 2.1 million direct jobs in the oil and natural gas industry, the industry’s purchase of intermediate inputs from other U.S. suppliers supported 5.7 million indirect and induced jobs in other industries across the country in 2007, while its capital investment supported an additional 1.4 million indirect and induced jobs across many sectors of the U.S. economy. Combined, the oil and natural gas industry directly or indirectly contributed more than 9.2 million jobs to the U.S. economy. The service sector received the largest number of indirect and induced jobs from the oil and natural gas industry's spending (3.4 million) in 2007, followed by wholesale and retail trade (1.2 million), finance, insurance, real estate, rental and leasing (0.8 million), and manufacturing (0.7 million). The estimated nationwide indirect and induced labor income (including wages and salaries and benefits as well as proprietors' income) was $359 billion and the indirect and induced value added was $580 billion in 2007.
17
Table 5a. Direct Impact of the Oil and Natural Gas Industry by State, 2007 (Sorted Alphabetically)
Amount Percent of U.S. Total ($ Million) Percent of
U.S. Total 2,123,291 100% 199,344 100% 456,971 100%Source: PricewaterhouseCoopers calculations using IMPLAN modeling system (2007 database).Numbers may not add to total due to rounding.* Employment is defined as the number of payroll and self-employed jobs, including part-time jobs.
** Labor income is defined as wages and salaries and benefits as well as proprietors' income.
StateDirect Employment* Direct Labor Income** Direct Value Added
18
Table 5b. Direct Impact of the Oil and Natural Gas Industry by State, 2007 (Sorted by Direct Employment)
Amount Percent of U.S. Total ($ Million) Percent of
U.S. Total 2,123,291 100% 199,344 100% 456,971 100%Source: PricewaterhouseCoopers calculations using IMPLAN modeling system (2007 database).Numbers may not add to total due to rounding.* Employment is defined as the number of payroll and self-employed jobs, including part-time jobs.
** Labor income is defined as wages and salaries and benefits as well as proprietors' income.
StateDirect Employment* Direct Labor Income** Direct Value Added
19
Table 6. The Direct, Indirect, and Induced Impacts of the Oil and
Direct Impact of the Oil and Natural Gas Industry 2,123,291 199,344 456,971
Indirect and Induced Impact on Other Industries***: 7,114,090 358,916 580,089
Operational Impact 5,695,146 277,905 458,399 Agriculture 104,549 1,850 4,412 Mining 9,268 873 1,755 Utilities 22,523 3,695 12,637 Construction 207,528 10,507 12,964 Manufacturing 397,299 27,821 42,778 Wholesale and retail trade 892,854 35,359 57,983 Transportation and warehousing 206,629 10,341 14,012 Information 124,081 10,896 21,481 Finance, insurance, real estate, rental and leasing 708,422 40,399 124,795 Services 2,834,634 123,227 151,073 Other 187,359 12,937 14,510
Capital Investment Impact 1,418,944 81,012 121,690 Agriculture 17,993 343 785 Mining 1,630 164 313 Utilities 3,749 614 2,015 Construction 13,395 678 758 Manufacturing 283,535 22,115 30,544 Wholesale and retail trade 281,908 14,352 22,932 Transportation and warehousing 69,863 3,551 4,734 Information 41,778 4,310 7,843 Finance, insurance, real estate, rental and leasing 120,482 7,088 19,507 Services 564,840 26,235 30,647 Other 19,771 1,562 1,612
Total Economic Impact 9,237,381 558,260 1,037,060Source: PricewaterhouseCoopers calculations using IMPLAN modeling system (2007 database).* Employment is defined as the number of payroll and self-employed jobs, including part-time jobs.** Labor income is defined as wages and salaries and benefits as well as proprietors' income.*** Indirect and induced impacts on other industries exclude NAICS codes grouped under the oil and natural gas industry.
The remainder of this section provides more detail on the operational economic impacts of the oil and natural gas industry at the state level. Due to data limitations, these state-level impacts exclude economic impacts from capital investment in the oil and natural gas industry. Table 7a shows the sum of the oil and natural gas industry's indirect and induced effects from its operations (i.e., not including its capital investment impact) in terms of employment, value added, and labor income in the 50 states and the District of Columbia, where the states are shown alphabetically. Table 7b is the same as Table 7a except that the states are ranked in order of the indirect and induced employment effect. In 2007, the five states with the largest combined indirect and induced employment effects generated by the oil and natural gas industry were, in order: Texas, California, Oklahoma, New York, and Louisiana. These top five states accounted for 46.2 percent
20
of the oil and natural gas industry’s national combined indirect and induced employment, 47.4 percent of the oil and natural gas industry’s national combined indirect and induced labor income, and 47.8 percent of the oil and natural gas industry’s national combined indirect and induced value added in 2007. Table 8a shows the direct, indirect, induced and total employment contribution of the oil and natural gas industry from its operations in the 50 states and the District of Columbia, where the states are shown alphabetically. Table 8b is the same as Table 8a except that the states are ranked in order of the industry’s total employment contribution from its operations as a percent of each state’s total employment. Using this metric, the top five states in 2007 were, in order: Wyoming (18.8 percent), Oklahoma (16.3 percent), Louisiana (13.4 percent), Texas (13.1 percent), and Alaska (9.8 percent). Table 9a shows the direct, indirect, induced and total labor income contribution of the oil and natural gas industry from its operations in the 50 states and the District of Columbia, where the states are shown alphabetically. Table 9b is the same as Table 9a except the states are ranked in order of the industry's total contribution from its operations as a percent of each state's total labor income. The top five states by this metric in 2007 were, in order: Oklahoma (24.7 percent), Wyoming (24.3 percent), Texas (19.5 percent), Louisiana (16.6 percent), and Alaska (13.5 percent). Table 10a shows the direct, indirect, induced and total value-added contribution of the oil and natural gas industry from its operations in the 50 states and the District of Columbia, where the states are shown alphabetically. Table 10b is the same as Table 10a except that the states are ranked in order of the industry's total contribution from its operations to each state's GDP. The top five states by this metric in 2007 were, in order: Oklahoma (31.3 percent), Wyoming (29.4 percent), Texas (24.2 percent), Louisiana (20.6 percent), and Alaska (16.6 percent). More detailed state-by-state operational impact results are included in Appendix A. The primary data source for the direct impact of the oil and natural gas industry is the IMPLAN 2007 database. The IMPLAN database represents a consistent set of economic data processed from various published sources (such as the Bureau of Economic Analysis’s National Income and Product Accounts (NIPA) and Regional Economic Information System (REIS), the Census Bureau’s County Business Patterns (CBP), and the Bureau of Labor Statistics’ Covered Employee and Wages Program (CEW) in a variety of formats and under varying disclosure restrictions. In cases where a NAICS code in our definition of the oil and natural gas industry does not have a one-to-one correspondence with an IMPLAN sector, employment data from the Department of Labor and Census Bureau for the NAICS code were used and PricewaterhouseCoopers estimated the corresponding value added and labor income using the IMPLAN database. Appendix B provides a more detailed discussion of the data sources and estimating methodology.
21
Table 7a. Indirect and Induced Impacts of the Oil and Natural Gas Industry's Operations by State (Sorted Alphabetically), 2007
Amount Percent of U.S. Total ($ Million) Percent of
U.S. Total 5,695,146 100.0% 277,905 100.0% 458,399 100.0%Source: PricewaterhouseCoopers calculations using IMPLAN modeling system (2007 database).Numbers may not add to total due to rounding.* Employment is defined as the number of payroll and self-employed jobs, including part-time jobs.** Labor income is defined as wages and salaries and benefits as well as proprietors' income.
Employment* Value AddedLabor Income**State
22
Table 7b. Indirect and Induced Impacts of the Oil and Natural Gas Industry's Operations by State (Sorted by Employment Impact), 2007
Amount Percent of U.S. Total ($ Million) Percent of
U.S. Total 5,695,146 100.0% 277,905 100.0% 458,399 100.0%Source: PricewaterhouseCoopers calculations using IMPLAN modeling system (2007 database).Numbers may not add to total due to rounding.* Employment is defined as the number of payroll and self-employed jobs, including part-time jobs.** Labor income is defined as wages and salaries and benefits as well as proprietors' income.
Employment* Value AddedLabor Income**State
23
Table 8a. Employment Impact of the Oil and Natural Gas Industry's Operations by State (Sorted Alphabetically), 2007
State Direct Employment
Indirect Employment
Induced Employment
Total Contribution
Total Contribution as a % of State Total Employment
U.S. Total 2,123,291 1,661,138 4,034,007 7,818,437 4.4%Source: PricewaterhouseCoopers calculations using IMPLAN modeling system (2007 database).Numbers may not add to total due to rounding.Employment is defined as the number of payroll and self-employed jobs, including part-time jobs.
24
Table 8b. Employment Impact of the Oil and Natural Gas Industry's Operations by State (Sorted by Employment Share of State Total), 2007
State Direct Employment
Indirect Employment
Induced Employment
Total Contribution
Total Contribution as a % of State Total Employment
U.S. Total 2,123,291 1,661,138 4,034,007 7,818,437 4.4%Source: PricewaterhouseCoopers calculations using IMPLAN modeling system (2007 database).Numbers may not add to total due to rounding.Employment is defined as the number of payroll and self-employed jobs, including part-time jobs.
25
Table 9a. Impact of the Oil and Natural Gas Industry's Operations on Labor Income by State (Sorted Alphabetically), 2007 ($ Million)
State Direct Labor Income
Indirect Labor Income
Induced Labor Income
Total Contribution
Total Contribution as a % of State Total Labor Income
U.S. Total 199,344 97,947 179,958 477,249 5.4%Source: PricewaterhouseCoopers calculations using IMPLAN modeling system (2007 database).Numbers may not add to total due to rounding.Labor income includes wages and salaries and benefits as well as proprietors' income.
26
Table 9b. Impact of the Oil and Natural Gas Industry's Operations on Labor Income by State (Sorted by Labor Income Share of State Total), 2007 ($ Million)
State Direct Labor Income
Indirect Labor Income
Induced Labor Income
Total Contribution
Total Contribution as a % of State Total Labor Income
U.S. Total 199,344 97,947 179,958 477,249 5.4%Source: PricewaterhouseCoopers calculations using IMPLAN modeling system (2007 database).Numbers may not add to total due to rounding.Labor income includes wages and salaries and benefits as well as proprietors' income.
27
Table 10a. Impact of the Oil and Natural Gas Industry's Operations on Value Added by State (Sorted Alphabetically), 2007 ($ Million)
U.S. Total 456,971 158,934 299,464 915,370 6.6%Source: PricewaterhouseCoopers calculations using IMPLAN modeling system (2007 database).Numbers may not add to total due to rounding.
28
Table 10b. Impact of the Oil and Natural Gas Industry's Operations on Value Added by State (Sorted by Value Added Share of State Total), 2007 ($ Million)
U.S. Total 456,971 158,934 299,464 915,370 6.6%Source: PricewaterhouseCoopers calculations using IMPLAN modeling system (2007 database).Numbers may not add to total due to rounding.
Value Added ($ Millions)Sector Description Direct Indirect Induced Total As a % of State Total
Direct Impact of the Oil and Natural Gas Industry 3,513 3,513 2.1%
Indirect and Induced Impacts on Other Industries**: 1,458 2,866 4,324 2.6%Services 381 843 1,224Finance, insurance, real estate, rental and leasing 328 746 1,075Manufacturing 331 358 689Wholesale and retail trade 92 406 498Utilities 55 92 146Transportation and warehousing 56 87 143Information 42 84 126Construction 80 20 100Agriculture 8 62 70Mining 32 15 47
Other 53 154 207
Total Impact 3,513 1,458 2,866 7,836 4.7%
Labor Income*** ($ Millions)Sector Description Direct Indirect Induced Total As a % of State Total
Direct Impact of the Oil and Natural Gas Industry 1,678 1,678 1.5%
Indirect and Induced Impacts on Other Industries**: 879 1,705 2,584 2.4%Services 324 698 1,022Manufacturing 207 250 457Wholesale and retail trade 55 252 307Finance, insurance, real estate, rental and leasing 93 201 294Transportation and warehousing 41 63 104Construction 65 16 81Information 19 37 56Utilities 15 26 41Agriculture 5 32 37Mining 18 8 26
Other 37 121 159
Total Impact 1,678 879 1,705 4,262 3.9%Source: PricewaterhouseCoopers calculations using IMPLAN modeling system (2007 database).* Employment is defined as the number of payroll and self-employed jobs, including part-time jobs.** Indirect and induced impacts on other industries exclude NAICS codes grouped under the oil and natural gas industry.*** Labor income is defined as wages and salaries and benefits as well as proprietors' income.
A-3
The Economic Impact of the Oil and Natural Gas Industry in Alaska, 2007
Employment*Sector Description Direct Indirect Induced Total As a % of State Total
Direct Impact of the Oil and Natural Gas Industry 16,854 16,854 3.8%
Indirect and Induced Impacts on Other Industries**: 10,010 16,590 26,600 6.0%
Value Added ($ Millions)Sector Description Direct Indirect Induced Total As a % of State Total
Direct Impact of the Oil and Natural Gas Industry 3,974 3,974 10.9%
Indirect and Induced Impacts on Other Industries**: 945 1,145 2,090 5.7%Services 283 393 677Finance, insurance, real estate, rental and leasing 283 307 589Wholesale and retail trade 53 165 218Construction 117 10 127Information 43 47 90Utilities 48 32 80Transportation and warehousing 37 42 79Mining 31 11 42Manufacturing 14 27 41Agriculture 6 20 25
Other 31 92 123
Total Impact 3,974 945 1,145 6,064 16.6%
Labor Income*** ($ Millions)Sector Description Direct Indirect Induced Total As a % of State Total
Direct Impact of the Oil and Natural Gas Industry 1,953 1,953 8.4%
Indirect and Induced Impacts on Other Industries**: 525 665 1,190 5.1%Services 221 312 533Finance, insurance, real estate, rental and leasing 71 73 145Wholesale and retail trade 32 103 135Construction 94 8 103Transportation and warehousing 27 31 58Information 16 18 34Manufacturing 9 23 33Utilities 14 9 23Mining 10 3 13Agriculture 2 8 10
Other 27 77 103
Total Impact 1,953 525 665 3,143 13.5%Source: PricewaterhouseCoopers calculations using IMPLAN modeling system (2007 database).* Employment is defined as the number of payroll and self-employed jobs, including part-time jobs.** Indirect and induced impacts on other industries exclude NAICS codes grouped under the oil and natural gas industry.*** Labor income is defined as wages and salaries and benefits as well as proprietors' income.
A-4
The Economic Impact of the Oil and Natural Gas Industry in Arizona, 2007
Employment*Sector Description Direct Indirect Induced Total As a % of State Total
Direct Impact of the Oil and Natural Gas Industry 25,157 25,157 0.8%
Indirect and Induced Impacts on Other Industries**: 19,158 52,370 71,528 2.1%
Value Added ($ Millions)Sector Description Direct Indirect Induced Total As a % of State Total
Direct Impact of the Oil and Natural Gas Industry 2,592 2,592 1.1%
Indirect and Induced Impacts on Other Industries**: 1,742 3,944 5,686 2.3%Services 590 1,330 1,920Finance, insurance, real estate, rental and leasing 462 1,221 1,683Wholesale and retail trade 100 579 679Manufacturing 180 217 397Information 62 132 194Transportation and warehousing 57 106 162Construction 108 34 142Utilities 38 72 110Mining 71 32 103Agriculture 5 38 43
Other 68 184 252
Total Impact 2,592 1,742 3,944 8,278 3.4%
Labor Income*** ($ Millions)Sector Description Direct Indirect Induced Total As a % of State Total
Direct Impact of the Oil and Natural Gas Industry 1,261 1,261 0.8%
Indirect and Induced Impacts on Other Industries**: 1,067 2,326 3,393 2.2%Services 488 1,072 1,560Finance, insurance, real estate, rental and leasing 149 373 521Wholesale and retail trade 60 352 411Manufacturing 116 158 274Transportation and warehousing 42 78 120Construction 88 28 115Information 30 64 94Mining 26 12 38Utilities 11 21 32Agriculture 3 21 24
Other 55 150 205
Total Impact 1,261 1,067 2,326 4,653 3.0%Source: PricewaterhouseCoopers calculations using IMPLAN modeling system (2007 database).* Employment is defined as the number of payroll and self-employed jobs, including part-time jobs.** Indirect and induced impacts on other industries exclude NAICS codes grouped under the oil and natural gas industry.*** Labor income is defined as wages and salaries and benefits as well as proprietors' income.
A-5
The Economic Impact of the Oil and Natural Gas Industry in Arkansas, 2007
Employment*Sector Description Direct Indirect Induced Total As a % of State Total
Direct Impact of the Oil and Natural Gas Industry 26,533 26,533 1.7%
Indirect and Induced Impacts on Other Industries**: 14,493 28,613 43,106 2.7%
Value Added ($ Millions)Sector Description Direct Indirect Induced Total As a % of State Total
Direct Impact of the Oil and Natural Gas Industry 2,850 2,850 3.1%
Indirect and Induced Impacts on Other Industries**: 1,068 1,672 2,739 2.9%Services 301 494 794Finance, insurance, real estate, rental and leasing 223 368 591Manufacturing 184 192 376Wholesale and retail trade 83 235 318Information 71 113 184Transportation and warehousing 58 77 135Utilities 42 42 83Agriculture 11 65 76Construction 65 10 75Mining 8 3 11
Other 23 73 96
Total Impact 2,850 1,068 1,672 5,589 6.0%
Labor Income*** ($ Millions)Sector Description Direct Indirect Induced Total As a % of State Total
Direct Impact of the Oil and Natural Gas Industry 1,248 1,248 2.1%
Indirect and Induced Impacts on Other Industries**: 635 1,001 1,636 2.8%Services 250 410 659Manufacturing 112 134 246Wholesale and retail trade 50 147 197Finance, insurance, real estate, rental and leasing 59 95 154Transportation and warehousing 42 56 98Information 28 44 72Construction 53 8 61Agriculture 5 30 36Utilities 12 12 24Mining 4 2 6
Other 21 64 84
Total Impact 1,248 635 1,001 2,884 4.9%Source: PricewaterhouseCoopers calculations using IMPLAN modeling system (2007 database).* Employment is defined as the number of payroll and self-employed jobs, including part-time jobs.** Indirect and induced impacts on other industries exclude NAICS codes grouped under the oil and natural gas industry.*** Labor income is defined as wages and salaries and benefits as well as proprietors' income.
A-6
The Economic Impact of the Oil and Natural Gas Industry in California, 2007
Employment*Sector Description Direct Indirect Induced Total As a % of State Total
Direct Impact of the Oil and Natural Gas Industry 159,728 159,728 0.8%
Indirect and Induced Impacts on Other Industries**: 163,781 429,105 592,885 2.9%
Value Added ($ Millions)Sector Description Direct Indirect Induced Total As a % of State Total
Direct Impact of the Oil and Natural Gas Industry 45,525 45,525 2.5%
Indirect and Induced Impacts on Other Industries**: 17,719 37,714 55,433 3.0%Services 6,371 12,431 18,801Finance, insurance, real estate, rental and leasing 4,093 11,001 15,094Wholesale and retail trade 1,540 5,513 7,053Manufacturing 1,929 2,626 4,555Information 1,189 2,601 3,790Transportation and warehousing 556 902 1,458Construction 1,133 255 1,388Utilities 389 470 859Agriculture 69 541 610Mining 23 11 33
Other 426 1,364 1,790
Total Impact 45,525 17,719 37,714 100,958 5.5%
Labor Income*** ($ Millions)Sector Description Direct Indirect Induced Total As a % of State Total
Direct Impact of the Oil and Natural Gas Industry 19,957 19,957 1.7%
Indirect and Induced Impacts on Other Industries**: 11,423 22,741 34,164 2.9%Services 5,284 10,087 15,371Finance, insurance, real estate, rental and leasing 1,419 3,459 4,878Wholesale and retail trade 918 3,390 4,308Manufacturing 1,261 1,882 3,144Information 637 1,375 2,012Construction 919 207 1,126Transportation and warehousing 415 674 1,090Agriculture 39 303 342Utilities 112 141 253Mining 14 6 20
Other 404 1,218 1,622
Total Impact 19,957 11,423 22,741 54,122 4.6%Source: PricewaterhouseCoopers calculations using IMPLAN modeling system (2007 database).* Employment is defined as the number of payroll and self-employed jobs, including part-time jobs.** Indirect and induced impacts on other industries exclude NAICS codes grouped under the oil and natural gas industry.*** Labor income is defined as wages and salaries and benefits as well as proprietors' income.
A-7
The Economic Impact of the Oil and Natural Gas Industry in Colorado, 2007
Employment*Sector Description Direct Indirect Induced Total As a % of State Total
Direct Impact of the Oil and Natural Gas Industry 49,366 49,366 1.6%
Indirect and Induced Impacts on Other Industries**: 46,439 94,603 141,042 4.4%
Value Added ($ Millions)Sector Description Direct Indirect Induced Total As a % of State Total
Direct Impact of the Oil and Natural Gas Industry 12,364 12,364 4.8%
Indirect and Induced Impacts on Other Industries**: 4,648 7,087 11,735 4.5%Services 1,615 2,363 3,978Finance, insurance, real estate, rental and leasing 1,172 2,022 3,194Wholesale and retail trade 368 1,122 1,490Information 325 542 867Manufacturing 319 330 649Construction 418 50 468Transportation and warehousing 125 166 291Utilities 131 115 246Mining 85 28 112Agriculture 15 68 83
Other 76 281 357
Total Impact 12,364 4,648 7,087 24,099 9.3%
Labor Income*** ($ Millions)Sector Description Direct Indirect Induced Total As a % of State Total
Direct Impact of the Oil and Natural Gas Industry 5,358 5,358 3.3%
Indirect and Induced Impacts on Other Industries**: 2,875 4,205 7,080 4.4%Services 1,339 1,899 3,237Finance, insurance, real estate, rental and leasing 358 627 984Wholesale and retail trade 220 688 908Information 174 289 463Manufacturing 204 226 431Construction 339 40 379Transportation and warehousing 92 122 214Utilities 38 34 71Mining 36 12 48Agriculture 5 23 28
Other 71 246 317
Total Impact 5,358 2,875 4,205 12,438 7.7%Source: PricewaterhouseCoopers calculations using IMPLAN modeling system (2007 database).* Employment is defined as the number of payroll and self-employed jobs, including part-time jobs.** Indirect and induced impacts on other industries exclude NAICS codes grouped under the oil and natural gas industry.*** Labor income is defined as wages and salaries and benefits as well as proprietors' income.
A-8
The Economic Impact of the Oil and Natural Gas Industry in Connecticut, 2007
Employment*Sector Description Direct Indirect Induced Total As a % of State Total
Direct Impact of the Oil and Natural Gas Industry 15,327 15,327 0.7%
Indirect and Induced Impacts on Other Industries**: 11,841 35,518 47,359 2.2%
Value Added ($ Millions)Sector Description Direct Indirect Induced Total As a % of State Total
Direct Impact of the Oil and Natural Gas Industry 2,306 2,306 1.1%
Indirect and Induced Impacts on Other Industries**: 1,567 3,619 5,186 2.4%Finance, insurance, real estate, rental and leasing 427 1,238 1,665Services 535 1,127 1,662Manufacturing 320 405 725Wholesale and retail trade 70 434 504Information 72 172 243Transportation and warehousing 40 68 108Utilities 32 62 94Construction 41 19 59Agriculture 1 8 9Mining 4 2 6
Other 26 85 111
Total Impact 2,306 1,567 3,619 7,492 3.5%
Labor Income*** ($ Millions)Sector Description Direct Indirect Induced Total As a % of State Total
Direct Impact of the Oil and Natural Gas Industry 1,029 1,029 0.7%
Indirect and Induced Impacts on Other Industries**: 1,036 2,280 3,316 2.3%Services 434 924 1,358Finance, insurance, real estate, rental and leasing 216 594 810Manufacturing 208 252 459Wholesale and retail trade 41 256 296Information 38 89 127Transportation and warehousing 30 51 80Construction 33 15 48Utilities 9 18 27Agriculture 1 4 4Mining 3 1 4
Other 25 77 101
Total Impact 1,029 1,036 2,280 4,345 3.1%Source: PricewaterhouseCoopers calculations using IMPLAN modeling system (2007 database).* Employment is defined as the number of payroll and self-employed jobs, including part-time jobs.** Indirect and induced impacts on other industries exclude NAICS codes grouped under the oil and natural gas industry.*** Labor income is defined as wages and salaries and benefits as well as proprietors' income.
A-9
The Economic Impact of the Oil and Natural Gas Industry in Delaware, 2007
Employment*Sector Description Direct Indirect Induced Total As a % of State Total
Direct Impact of the Oil and Natural Gas Industry 4,548 4,548 0.9%
Indirect and Induced Impacts on Other Industries**: 3,096 7,793 10,889 2.0%
Value Added ($ Millions)Sector Description Direct Indirect Induced Total As a % of State Total
Direct Impact of the Oil and Natural Gas Industry 736 736 1.7%
Indirect and Induced Impacts on Other Industries**: 320 651 970 2.2%Services 117 215 333Finance, insurance, real estate, rental and leasing 82 229 312Wholesale and retail trade 25 75 100Manufacturing 36 55 91Utilities 17 13 30Transportation and warehousing 14 14 28Information 7 18 25Construction 13 4 17Agriculture 1 6 6Mining 0 0 1
Other 6 22 28
Total Impact 736 320 651 1,707 4.0%
Labor Income*** ($ Millions)Sector Description Direct Indirect Induced Total As a % of State Total
Direct Impact of the Oil and Natural Gas Industry 297 297 1.0%
Indirect and Induced Impacts on Other Industries**: 207 411 619 2.2%Services 98 179 277Finance, insurance, real estate, rental and leasing 36 98 134Manufacturing 22 38 61Wholesale and retail trade 15 46 61Transportation and warehousing 10 10 20Information 4 10 14Construction 11 4 14Utilities 5 4 8Agriculture 1 4 5Mining 0 0 0
Other 5 18 23
Total Impact 297 207 411 916 3.2%Source: PricewaterhouseCoopers calculations using IMPLAN modeling system (2007 database).* Employment is defined as the number of payroll and self-employed jobs, including part-time jobs.** Indirect and induced impacts on other industries exclude NAICS codes grouped under the oil and natural gas industry.*** Labor income is defined as wages and salaries and benefits as well as proprietors' income.
A-10
The Economic Impact of the Oil and Natural Gas Industry in the District of Columba, 2007
Employment*Sector Description Direct Indirect Induced Total As a % of District Total
Direct Impact of the Oil and Natural Gas Industry 1,713 1,713 0.2%
Indirect and Induced Impacts on Other Industries**: 2,614 8,488 11,102 1.3%
Value Added ($ Millions)Sector Description Direct Indirect Induced Total As a % of District Total
Direct Impact of the Oil and Natural Gas Industry 361 361 0.3%
Indirect and Induced Impacts on Other Industries**: 407 1,009 1,417 1.4%Services 254 539 793Finance, insurance, real estate, rental and leasing 80 222 302Information 37 99 137Wholesale and retail trade 6 22 28Utilities 4 8 13Transportation and warehousing 3 7 10Construction 6 2 8Manufacturing 2 4 7Agriculture 0 0 0Mining 0 0 0
Other 13 106 119
Total Impact 361 407 1,009 1,777 1.7%
Labor Income*** ($ Millions)Sector Description Direct Indirect Induced Total As a % of District Total
Direct Impact of the Oil and Natural Gas Industry 151 151 0.2%
Indirect and Induced Impacts on Other Industries**: 293 713 1,006 1.2%Services 210 454 664Finance, insurance, real estate, rental and leasing 33 78 111Information 21 55 76Wholesale and retail trade 4 13 17Construction 5 1 7Transportation and warehousing 2 4 6Manufacturing 2 2 4Utilities 1 2 4Agriculture 0 0 0Mining 0 0 0
Other 15 102 118
Total Impact 151 293 713 1,157 1.4%Source: PricewaterhouseCoopers calculations using IMPLAN modeling system (2007 database).* Employment is defined as the number of payroll and self-employed jobs, including part-time jobs.** Indirect and induced impacts on other industries exclude NAICS codes grouped under the oil and natural gas industry.*** Labor income is defined as wages and salaries and benefits as well as proprietors' income.
A-11
The Economic Impact of the Oil and Natural Gas Industry in Florida, 2007
Employment*Sector Description Direct Indirect Induced Total As a % of State Total
Direct Impact of the Oil and Natural Gas Industry 61,914 61,914 0.6%
Indirect and Induced Impacts on Other Industries**: 52,765 152,598 205,363 2.0%
Value Added ($ Millions)Sector Description Direct Indirect Induced Total As a % of State Total
Direct Impact of the Oil and Natural Gas Industry 4,636 4,636 0.7%
Indirect and Induced Impacts on Other Industries**: 4,552 10,758 15,311 2.2%Services 1,748 3,941 5,689Finance, insurance, real estate, rental and leasing 1,263 3,309 4,572Wholesale and retail trade 280 1,515 1,796Manufacturing 376 501 877Information 219 494 713Transportation and warehousing 138 284 422Construction 298 84 382Utilities 110 160 270Agriculture 15 117 132Mining 20 10 30
Other 85 344 429
Total Impact 4,636 4,552 10,758 19,946 2.8%
Labor Income*** ($ Millions)Sector Description Direct Indirect Induced Total As a % of State Total
Direct Impact of the Oil and Natural Gas Industry 2,291 2,291 0.5%
Indirect and Induced Impacts on Other Industries**: 2,808 6,343 9,150 2.0%Services 1,408 3,135 4,543Finance, insurance, real estate, rental and leasing 404 1,021 1,425Wholesale and retail trade 167 926 1,092Manufacturing 248 327 575Information 110 244 354Construction 241 68 309Transportation and warehousing 100 207 307Utilities 31 47 78Agriculture 8 58 66Mining 12 5 17
Other 79 305 384
Total Impact 2,291 2,808 6,343 11,441 2.6%Source: PricewaterhouseCoopers calculations using IMPLAN modeling system (2007 database).* Employment is defined as the number of payroll and self-employed jobs, including part-time jobs.** Indirect and induced impacts on other industries exclude NAICS codes grouped under the oil and natural gas industry.*** Labor income is defined as wages and salaries and benefits as well as proprietors' income.
A-12
The Economic Impact of the Oil and Natural Gas Industry in Georgia, 2007
Employment*Sector Description Direct Indirect Induced Total As a % of State Total
Direct Impact of the Oil and Natural Gas Industry 41,197 41,197 0.8%
Indirect and Induced Impacts on Other Industries**: 25,632 78,977 104,609 2.0%
Value Added ($ Millions)Sector Description Direct Indirect Induced Total As a % of State Total
Direct Impact of the Oil and Natural Gas Industry 3,297 3,297 0.8%
Indirect and Induced Impacts on Other Industries**: 2,489 6,246 8,735 2.2%Services 821 1,796 2,617Finance, insurance, real estate, rental and leasing 579 1,642 2,220Manufacturing 366 676 1,042Wholesale and retail trade 161 872 1,033Information 218 524 743Transportation and warehousing 108 249 358Utilities 78 164 242Construction 83 37 120Agriculture 11 83 93Mining 21 10 31
Other 44 192 236
Total Impact 3,297 2,489 6,246 12,032 3.0%
Labor Income*** ($ Millions)Sector Description Direct Indirect Induced Total As a % of State Total
Direct Impact of the Oil and Natural Gas Industry 1,630 1,630 0.6%
Indirect and Induced Impacts on Other Industries**: 1,546 3,664 5,210 2.0%Services 683 1,472 2,154Finance, insurance, real estate, rental and leasing 201 523 724Manufacturing 229 399 628Wholesale and retail trade 95 531 626Information 109 257 366Transportation and warehousing 80 184 264Construction 67 30 97Utilities 22 47 69Agriculture 6 44 49Mining 12 6 18
Other 43 171 213
Total Impact 1,630 1,546 3,664 6,841 2.7%Source: PricewaterhouseCoopers calculations using IMPLAN modeling system (2007 database).* Employment is defined as the number of payroll and self-employed jobs, including part-time jobs.** Indirect and induced impacts on other industries exclude NAICS codes grouped under the oil and natural gas industry.*** Labor income is defined as wages and salaries and benefits as well as proprietors' income.
A-13
The Economic Impact of the Oil and Natural Gas Industry in Hawaii, 2007
Employment*Sector Description Direct Indirect Induced Total As a % of State Total
Direct Impact of the Oil and Natural Gas Industry 4,019 4,019 0.5%
Indirect and Induced Impacts on Other Industries**: 3,406 11,114 14,521 1.7%
Value Added ($ Millions)Sector Description Direct Indirect Induced Total As a % of State Total
Direct Impact of the Oil and Natural Gas Industry 477 477 0.8%
Indirect and Induced Impacts on Other Industries**: 289 767 1,056 1.7%Services 109 303 412Finance, insurance, real estate, rental and leasing 74 199 273Wholesale and retail trade 17 84 101Information 14 31 44Transportation and warehousing 13 30 43Manufacturing 14 20 34Construction 21 7 28Utilities 11 15 27Agriculture 1 7 8Mining 2 1 2
Other 13 70 83
Total Impact 477 289 767 1,533 2.4%
Labor Income*** ($ Millions)Sector Description Direct Indirect Induced Total As a % of State Total
Direct Impact of the Oil and Natural Gas Industry 219 219 0.5%
Indirect and Induced Impacts on Other Industries**: 178 458 636 1.6%Services 89 233 321Finance, insurance, real estate, rental and leasing 20 50 70Wholesale and retail trade 10 52 63Transportation and warehousing 9 21 31Manufacturing 9 14 24Construction 17 6 23Information 6 14 21Utilities 3 4 7Agriculture 1 4 5Mining 1 0 1
Other 12 59 71
Total Impact 219 178 458 855 2.1%Source: PricewaterhouseCoopers calculations using IMPLAN modeling system (2007 database).* Employment is defined as the number of payroll and self-employed jobs, including part-time jobs.** Indirect and induced impacts on other industries exclude NAICS codes grouped under the oil and natural gas industry.*** Labor income is defined as wages and salaries and benefits as well as proprietors' income.
A-14
The Economic Impact of the Oil and Natural Gas Industry in Idaho, 2007
Employment*Sector Description Direct Indirect Induced Total As a % of State Total
Direct Impact of the Oil and Natural Gas Industry 7,765 7,765 0.8%
Indirect and Induced Impacts on Other Industries**: 4,192 12,043 16,235 1.8%
Value Added ($ Millions)Sector Description Direct Indirect Induced Total As a % of State Total
Direct Impact of the Oil and Natural Gas Industry 674 674 1.3%
Indirect and Induced Impacts on Other Industries**: 319 708 1,027 1.9%Services 114 228 342Finance, insurance, real estate, rental and leasing 75 171 246Wholesale and retail trade 18 107 126Manufacturing 42 59 102Agriculture 7 54 61Transportation and warehousing 13 21 34Information 10 22 32Construction 18 7 25Mining 13 6 19Utilities 5 10 15
Other 5 22 26
Total Impact 674 319 708 1,700 3.2%
Labor Income*** ($ Millions)Sector Description Direct Indirect Induced Total As a % of State Total
Direct Impact of the Oil and Natural Gas Industry 315 315 0.9%
Indirect and Induced Impacts on Other Industries**: 194 418 612 1.8%Services 93 186 279Wholesale and retail trade 11 65 76Manufacturing 28 44 72Finance, insurance, real estate, rental and leasing 21 48 69Transportation and warehousing 9 15 24Agriculture 3 19 22Construction 15 6 20Information 5 10 15Mining 5 2 7Utilities 1 3 4
Other 4 19 23
Total Impact 315 194 418 928 2.7%Source: PricewaterhouseCoopers calculations using IMPLAN modeling system (2007 database).* Employment is defined as the number of payroll and self-employed jobs, including part-time jobs.** Indirect and induced impacts on other industries exclude NAICS codes grouped under the oil and natural gas industry.*** Labor income is defined as wages and salaries and benefits as well as proprietors' income.
A-15
The Economic Impact of the Oil and Natural Gas Industry in Illinois, 2007
Employment*Sector Description Direct Indirect Induced Total As a % of State Total
Direct Impact of the Oil and Natural Gas Industry 55,581 55,581 0.7%
Indirect and Induced Impacts on Other Industries**: 51,421 152,999 204,420 2.7%
Value Added ($ Millions)Sector Description Direct Indirect Induced Total As a % of State Total
Direct Impact of the Oil and Natural Gas Industry 13,366 13,366 2.1%
Indirect and Induced Impacts on Other Industries**: 5,635 12,322 17,957 2.9%Services 1,991 4,153 6,144Finance, insurance, real estate, rental and leasing 1,265 3,722 4,987Wholesale and retail trade 393 1,787 2,180Manufacturing 1,003 1,029 2,032Information 193 467 660Transportation and warehousing 172 401 573Construction 354 75 429Utilities 149 225 374Agriculture 11 90 100Mining 30 14 43
Other 76 358 434
Total Impact 13,366 5,635 12,322 31,323 5.0%
Labor Income*** ($ Millions)Sector Description Direct Indirect Induced Total As a % of State Total
Direct Impact of the Oil and Natural Gas Industry 5,807 5,807 1.4%
Indirect and Induced Impacts on Other Industries**: 3,609 7,537 11,146 2.8%Services 1,633 3,414 5,047Finance, insurance, real estate, rental and leasing 466 1,325 1,792Manufacturing 630 697 1,327Wholesale and retail trade 234 1,088 1,323Transportation and warehousing 125 294 419Construction 287 61 348Information 97 232 329Utilities 42 64 106Agriculture 3 24 27Mining 16 8 24
Other 75 330 405
Total Impact 5,807 3,609 7,537 16,953 4.2%Source: PricewaterhouseCoopers calculations using IMPLAN modeling system (2007 database).* Employment is defined as the number of payroll and self-employed jobs, including part-time jobs.** Indirect and induced impacts on other industries exclude NAICS codes grouped under the oil and natural gas industry.*** Labor income is defined as wages and salaries and benefits as well as proprietors' income.
A-16
The Economic Impact of the Oil and Natural Gas Industry in Indiana, 2007
Employment*Sector Description Direct Indirect Induced Total As a % of State Total
Direct Impact of the Oil and Natural Gas Industry 37,898 37,898 1.0%
Indirect and Induced Impacts on Other Industries**: 26,315 63,142 89,458 2.4%
Value Added ($ Millions)Sector Description Direct Indirect Induced Total As a % of State Total
Direct Impact of the Oil and Natural Gas Industry 4,651 4,651 1.9%
Indirect and Induced Impacts on Other Industries**: 2,264 4,077 6,341 2.6%Services 524 1,238 1,762Manufacturing 747 716 1,463Finance, insurance, real estate, rental and leasing 396 940 1,336Wholesale and retail trade 159 579 738Transportation and warehousing 97 156 253Utilities 81 100 180Information 57 116 173Construction 126 29 154Agriculture 8 63 71Mining 30 14 44
Other 39 127 167
Total Impact 4,651 2,264 4,077 10,992 4.5%
Labor Income*** ($ Millions)Sector Description Direct Indirect Induced Total As a % of State Total
Direct Impact of the Oil and Natural Gas Industry 2,069 2,069 1.3%
Indirect and Induced Impacts on Other Industries**: 1,374 2,464 3,838 2.4%Services 431 1,011 1,442Manufacturing 456 477 933Wholesale and retail trade 95 355 450Finance, insurance, real estate, rental and leasing 114 261 375Transportation and warehousing 70 114 184Construction 102 23 125Information 26 53 79Utilities 23 29 53Mining 17 8 25Agriculture 2 18 20
Other 37 115 152
Total Impact 2,069 1,374 2,464 5,907 3.8%Source: PricewaterhouseCoopers calculations using IMPLAN modeling system (2007 database).* Employment is defined as the number of payroll and self-employed jobs, including part-time jobs.** Indirect and induced impacts on other industries exclude NAICS codes grouped under the oil and natural gas industry.*** Labor income is defined as wages and salaries and benefits as well as proprietors' income.
A-17
The Economic Impact of the Oil and Natural Gas Industry in Iowa, 2007
Employment*Sector Description Direct Indirect Induced Total As a % of State Total
Direct Impact of the Oil and Natural Gas Industry 22,758 22,758 1.1%
Indirect and Induced Impacts on Other Industries**: 10,834 29,662 40,496 2.0%
Value Added ($ Millions)Sector Description Direct Indirect Induced Total As a % of State Total
Direct Impact of the Oil and Natural Gas Industry 1,374 1,374 1.1%
Indirect and Induced Impacts on Other Industries**: 861 1,834 2,696 2.2%Finance, insurance, real estate, rental and leasing 207 489 696Services 199 482 681Manufacturing 218 234 452Wholesale and retail trade 54 247 301Agriculture 16 130 147Transportation and warehousing 36 66 102Information 33 67 100Utilities 28 44 72Construction 44 12 55Mining 7 3 10
Other 20 60 79
Total Impact 1,374 861 1,834 4,069 3.3%
Labor Income*** ($ Millions)Sector Description Direct Indirect Induced Total As a % of State Total
Direct Impact of the Oil and Natural Gas Industry 704 704 0.9%
Indirect and Induced Impacts on Other Industries**: 512 1,079 1,591 2.1%Services 164 392 556Manufacturing 129 161 290Finance, insurance, real estate, rental and leasing 75 178 253Wholesale and retail trade 32 150 183Transportation and warehousing 26 48 74Information 17 34 51Construction 35 9 45Agriculture 5 38 43Utilities 8 13 21Mining 3 2 5
Other 18 53 71
Total Impact 704 512 1,079 2,295 3.0%Source: PricewaterhouseCoopers calculations using IMPLAN modeling system (2007 database).* Employment is defined as the number of payroll and self-employed jobs, including part-time jobs.** Indirect and induced impacts on other industries exclude NAICS codes grouped under the oil and natural gas industry.*** Labor income is defined as wages and salaries and benefits as well as proprietors' income.
A-18
The Economic Impact of the Oil and Natural Gas Industry in Kansas, 2007
Employment*Sector Description Direct Indirect Induced Total As a % of State Total
Direct Impact of the Oil and Natural Gas Industry 38,790 38,790 2.1%
Indirect and Induced Impacts on Other Industries**: 21,713 58,548 80,260 4.4%
Value Added ($ Millions)Sector Description Direct Indirect Induced Total As a % of State Total
Direct Impact of the Oil and Natural Gas Industry 8,738 8,738 7.1%
Indirect and Induced Impacts on Other Industries**: 1,774 3,517 5,291 4.3%Services 479 1,081 1,560Finance, insurance, real estate, rental and leasing 422 860 1,283Wholesale and retail trade 170 595 765Manufacturing 206 292 498Information 125 226 351Transportation and warehousing 71 120 192Construction 165 21 186Utilities 85 86 170Agriculture 10 81 91Mining 5 2 7
Other 35 154 189
Total Impact 8,738 1,774 3,517 14,029 11.4%
Labor Income*** ($ Millions)Sector Description Direct Indirect Induced Total As a % of State Total
Direct Impact of the Oil and Natural Gas Industry 3,623 3,623 4.7%
Indirect and Induced Impacts on Other Industries**: 1,036 2,079 3,115 4.1%Services 397 884 1,281Wholesale and retail trade 102 370 473Finance, insurance, real estate, rental and leasing 113 240 353Manufacturing 131 219 350Construction 133 17 150Information 49 88 137Transportation and warehousing 50 85 135Utilities 24 24 48Agriculture 3 21 24Mining 3 1 4
Other 30 130 161
Total Impact 3,623 1,036 2,079 6,738 8.8%Source: PricewaterhouseCoopers calculations using IMPLAN modeling system (2007 database).* Employment is defined as the number of payroll and self-employed jobs, including part-time jobs.** Indirect and induced impacts on other industries exclude NAICS codes grouped under the oil and natural gas industry.*** Labor income is defined as wages and salaries and benefits as well as proprietors' income.
A-19
The Economic Impact of the Oil and Natural Gas Industry in Kentucky, 2007
Employment*Sector Description Direct Indirect Induced Total As a % of State Total
Direct Impact of the Oil and Natural Gas Industry 32,196 32,196 1.3%
Indirect and Induced Impacts on Other Industries**: 16,503 38,791 55,294 2.3%
Value Added ($ Millions)Sector Description Direct Indirect Induced Total As a % of State Total
Direct Impact of the Oil and Natural Gas Industry 2,992 2,992 2.0%
Indirect and Induced Impacts on Other Industries**: 1,294 2,426 3,721 2.4%Services 357 733 1,091Finance, insurance, real estate, rental and leasing 254 535 789Manufacturing 278 395 673Wholesale and retail trade 96 341 437Transportation and warehousing 55 113 168Information 37 69 106Mining 70 32 102Construction 77 14 91Utilities 32 38 69Agriculture 7 47 54
Other 33 109 142
Total Impact 2,992 1,294 2,426 6,712 4.4%
Labor Income*** ($ Millions)Sector Description Direct Indirect Induced Total As a % of State Total
Direct Impact of the Oil and Natural Gas Industry 1,405 1,405 1.4%
Indirect and Induced Impacts on Other Industries**: 791 1,457 2,248 2.3%Services 283 594 878Manufacturing 176 215 391Wholesale and retail trade 57 212 269Finance, insurance, real estate, rental and leasing 77 162 239Transportation and warehousing 40 83 122Construction 62 12 74Mining 38 18 56Information 17 32 50Agriculture 5 30 35Utilities 9 11 20
Other 26 89 114
Total Impact 1,405 791 1,457 3,653 3.7%Source: PricewaterhouseCoopers calculations using IMPLAN modeling system (2007 database).* Employment is defined as the number of payroll and self-employed jobs, including part-time jobs.** Indirect and induced impacts on other industries exclude NAICS codes grouped under the oil and natural gas industry.*** Labor income is defined as wages and salaries and benefits as well as proprietors' income.
A-20
The Economic Impact of the Oil and Natural Gas Industry in Louisiana, 2007
Employment*Sector Description Direct Indirect Induced Total As a % of State Total
Direct Impact of the Oil and Natural Gas Industry 109,003 109,003 4.4%
Indirect and Induced Impacts on Other Industries**: 84,767 136,283 221,050 9.0%
Value Added ($ Millions)Sector Description Direct Indirect Induced Total As a % of State Total
Direct Impact of the Oil and Natural Gas Industry 20,971 20,971 12.0%
Indirect and Induced Impacts on Other Industries**: 6,760 8,255 15,015 8.6%Services 2,357 3,002 5,359Finance, insurance, real estate, rental and leasing 1,603 2,162 3,765Wholesale and retail trade 665 1,393 2,059Manufacturing 494 329 823Transportation and warehousing 347 337 684Construction 612 63 675Utilities 337 216 553Information 196 228 424Agriculture 33 103 136Mining 11 4 15
Other 106 417 523
Total Impact 20,971 6,760 8,255 35,986 20.6%
Labor Income*** ($ Millions)Sector Description Direct Indirect Induced Total As a % of State Total
Direct Impact of the Oil and Natural Gas Industry 9,402 9,402 8.5%
Indirect and Induced Impacts on Other Industries**: 4,079 4,968 9,047 8.1%Services 1,830 2,380 4,210Wholesale and retail trade 402 878 1,280Finance, insurance, real estate, rental and leasing 450 583 1,033Transportation and warehousing 288 279 567Construction 495 51 547Manufacturing 307 217 523Information 96 111 207Utilities 97 66 163Agriculture 14 44 58Mining 6 2 8
Other 94 357 452
Total Impact 9,402 4,079 4,968 18,449 16.6%Source: PricewaterhouseCoopers calculations using IMPLAN modeling system (2007 database).* Employment is defined as the number of payroll and self-employed jobs, including part-time jobs.** Indirect and induced impacts on other industries exclude NAICS codes grouped under the oil and natural gas industry.*** Labor income is defined as wages and salaries and benefits as well as proprietors' income.
A-21
The Economic Impact of the Oil and Natural Gas Industry in Maine, 2007
Employment*Sector Description Direct Indirect Induced Total As a % of State Total
Direct Impact of the Oil and Natural Gas Industry 12,712 12,712 1.5%
Indirect and Induced Impacts on Other Industries**: 4,170 13,015 17,185 2.1%
Value Added ($ Millions)Sector Description Direct Indirect Induced Total As a % of State Total
Direct Impact of the Oil and Natural Gas Industry 846 846 1.8%
Indirect and Induced Impacts on Other Industries**: 315 787 1,102 2.3%Services 91 264 355Finance, insurance, real estate, rental and leasing 81 190 271Manufacturing 58 83 141Wholesale and retail trade 20 117 137Information 12 26 38Transportation and warehousing 15 19 34Agriculture 4 28 31Utilities 12 15 26Construction 10 5 15Mining 0 0 1
Other 12 41 53
Total Impact 846 315 787 1,948 4.0%
Labor Income*** ($ Millions)Sector Description Direct Indirect Induced Total As a % of State Total
Direct Impact of the Oil and Natural Gas Industry 382 382 1.2%
Indirect and Induced Impacts on Other Industries**: 190 479 668 2.1%Services 74 217 291Manufacturing 38 57 95Finance, insurance, real estate, rental and leasing 24 56 81Wholesale and retail trade 12 67 79Transportation and warehousing 11 14 25Information 6 13 19Construction 8 4 12Agriculture 1 9 10Utilities 3 4 8Mining 0 0 0
Other 11 37 48
Total Impact 382 190 479 1,051 3.3%Source: PricewaterhouseCoopers calculations using IMPLAN modeling system (2007 database).* Employment is defined as the number of payroll and self-employed jobs, including part-time jobs.** Indirect and induced impacts on other industries exclude NAICS codes grouped under the oil and natural gas industry.*** Labor income is defined as wages and salaries and benefits as well as proprietors' income.
A-22
The Economic Impact of the Oil and Natural Gas Industry in Maryland, 2007
Employment*Sector Description Direct Indirect Induced Total As a % of State Total
Direct Impact of the Oil and Natural Gas Industry 17,622 17,622 0.5%
Indirect and Induced Impacts on Other Industries**: 14,057 46,545 60,602 1.8%
Value Added ($ Millions)Sector Description Direct Indirect Induced Total As a % of State Total
Direct Impact of the Oil and Natural Gas Industry 1,509 1,509 0.5%
Indirect and Induced Impacts on Other Industries**: 1,432 3,746 5,178 1.9%Services 550 1,345 1,895Finance, insurance, real estate, rental and leasing 355 1,093 1,448Wholesale and retail trade 75 448 523Manufacturing 153 197 350Information 81 202 283Utilities 65 148 213Transportation and warehousing 44 85 129Construction 72 32 104Agriculture 3 19 22Mining 5 3 8
Other 30 174 203
Total Impact 1,509 1,432 3,746 6,688 2.4%
Labor Income*** ($ Millions)Sector Description Direct Indirect Induced Total As a % of State Total
Direct Impact of the Oil and Natural Gas Industry 730 730 0.4%
Indirect and Induced Impacts on Other Industries**: 917 2,274 3,190 1.7%Services 472 1,125 1,596Finance, insurance, real estate, rental and leasing 121 338 459Wholesale and retail trade 45 276 321Manufacturing 96 133 230Information 42 103 145Transportation and warehousing 33 64 97Construction 58 26 84Utilities 18 43 61Agriculture 1 7 8Mining 3 1 5
Other 28 157 185
Total Impact 730 917 2,274 3,920 2.1%Source: PricewaterhouseCoopers calculations using IMPLAN modeling system (2007 database).* Employment is defined as the number of payroll and self-employed jobs, including part-time jobs.** Indirect and induced impacts on other industries exclude NAICS codes grouped under the oil and natural gas industry.*** Labor income is defined as wages and salaries and benefits as well as proprietors' income.
A-23
The Economic Impact of the Oil and Natural Gas Industry in Massachusetts, 2007
Employment*Sector Description Direct Indirect Induced Total As a % of State Total
Direct Impact of the Oil and Natural Gas Industry 25,070 25,070 0.6%
Indirect and Induced Impacts on Other Industries**: 20,819 66,197 87,016 2.1%
Value Added ($ Millions)Sector Description Direct Indirect Induced Total As a % of State Total
Direct Impact of the Oil and Natural Gas Industry 3,754 3,754 1.0%
Indirect and Induced Impacts on Other Industries**: 2,454 5,989 8,443 2.3%Services 957 2,222 3,179Finance, insurance, real estate, rental and leasing 646 1,918 2,564Wholesale and retail trade 126 707 833Manufacturing 353 409 762Information 132 335 467Transportation and warehousing 50 100 150Utilities 45 82 127Construction 92 33 126Agriculture 3 23 26Mining 4 2 7
Other 45 157 201
Total Impact 3,754 2,454 5,989 12,197 3.3%
Labor Income*** ($ Millions)Sector Description Direct Indirect Induced Total As a % of State Total
Direct Impact of the Oil and Natural Gas Industry 1,690 1,690 0.7%
Indirect and Induced Impacts on Other Industries**: 1,671 3,881 5,552 2.2%Services 813 1,866 2,679Finance, insurance, real estate, rental and leasing 290 800 1,089Manufacturing 230 298 528Wholesale and retail trade 74 424 498Information 69 171 239Transportation and warehousing 37 74 111Construction 75 27 102Utilities 13 24 37Agriculture 1 11 12Mining 3 1 4
Other 67 186 253
Total Impact 1,690 1,671 3,881 7,242 2.9%Source: PricewaterhouseCoopers calculations using IMPLAN modeling system (2007 database).* Employment is defined as the number of payroll and self-employed jobs, including part-time jobs.** Indirect and induced impacts on other industries exclude NAICS codes grouped under the oil and natural gas industry.*** Labor income is defined as wages and salaries and benefits as well as proprietors' income.
A-24
The Economic Impact of the Oil and Natural Gas Industry in Michigan, 2007
Employment*Sector Description Direct Indirect Induced Total As a % of State Total
Direct Impact of the Oil and Natural Gas Industry 45,946 45,946 0.9%
Indirect and Induced Impacts on Other Industries**: 35,768 97,781 133,549 2.5%
Value Added ($ Millions)Sector Description Direct Indirect Induced Total As a % of State Total
Direct Impact of the Oil and Natural Gas Industry 7,369 7,369 1.9%
Indirect and Induced Impacts on Other Industries**: 3,367 6,975 10,342 2.6%Services 1,169 2,359 3,528Finance, insurance, real estate, rental and leasing 712 1,912 2,625Manufacturing 743 852 1,595Wholesale and retail trade 179 943 1,121Information 97 216 313Utilities 115 193 308Transportation and warehousing 94 179 273Construction 182 39 221Agriculture 9 68 77Mining 16 8 23
Other 50 208 257
Total Impact 7,369 3,367 6,975 17,711 4.4%
Labor Income*** ($ Millions)Sector Description Direct Indirect Induced Total As a % of State Total
Direct Impact of the Oil and Natural Gas Industry 3,426 3,426 1.3%
Indirect and Induced Impacts on Other Industries**: 2,162 4,232 6,394 2.5%Services 987 1,966 2,953Manufacturing 506 621 1,128Finance, insurance, real estate, rental and leasing 203 515 717Wholesale and retail trade 107 583 691Transportation and warehousing 69 133 202Construction 148 32 179Information 48 105 153Utilities 33 55 88Agriculture 4 25 29Mining 8 4 12
Other 49 193 242
Total Impact 3,426 2,162 4,232 9,820 3.8%Source: PricewaterhouseCoopers calculations using IMPLAN modeling system (2007 database).* Employment is defined as the number of payroll and self-employed jobs, including part-time jobs.** Indirect and induced impacts on other industries exclude NAICS codes grouped under the oil and natural gas industry.*** Labor income is defined as wages and salaries and benefits as well as proprietors' income.
A-25
The Economic Impact of the Oil and Natural Gas Industry in Minnesota, 2007
Employment*Sector Description Direct Indirect Induced Total As a % of State Total
Direct Impact of the Oil and Natural Gas Industry 33,430 33,430 0.9%
Indirect and Induced Impacts on Other Industries**: 22,734 57,544 80,278 2.3%
Value Added ($ Millions)Sector Description Direct Indirect Induced Total As a % of State Total
Direct Impact of the Oil and Natural Gas Industry 2,822 2,822 1.1%
Indirect and Induced Impacts on Other Industries**: 2,220 4,228 6,449 2.5%Services 825 1,426 2,251Finance, insurance, real estate, rental and leasing 471 1,189 1,661Wholesale and retail trade 178 590 768Manufacturing 365 398 763Information 75 164 239Transportation and warehousing 73 122 195Utilities 62 82 144Construction 91 25 116Agriculture 13 101 113Mining 29 14 42
Other 37 118 155
Total Impact 2,822 2,220 4,228 9,271 3.6%
Labor Income*** ($ Millions)Sector Description Direct Indirect Induced Total As a % of State Total
Direct Impact of the Oil and Natural Gas Industry 1,332 1,332 0.8%
Indirect and Induced Impacts on Other Industries**: 1,425 2,594 4,019 2.4%Services 658 1,157 1,815Finance, insurance, real estate, rental and leasing 177 433 610Manufacturing 248 287 534Wholesale and retail trade 106 354 460Transportation and warehousing 54 89 143Information 40 85 125Construction 74 20 94Utilities 17 23 41Agriculture 5 35 40Mining 13 6 19
Other 34 105 139
Total Impact 1,332 1,425 2,594 5,351 3.2%Source: PricewaterhouseCoopers calculations using IMPLAN modeling system (2007 database).* Employment is defined as the number of payroll and self-employed jobs, including part-time jobs.** Indirect and induced impacts on other industries exclude NAICS codes grouped under the oil and natural gas industry.*** Labor income is defined as wages and salaries and benefits as well as proprietors' income.
A-26
The Economic Impact of the Oil and Natural Gas Industry in Mississippi, 2007
Employment*Sector Description Direct Indirect Induced Total As a % of State Total
Direct Impact of the Oil and Natural Gas Industry 32,492 32,492 2.1%
Indirect and Induced Impacts on Other Industries**: 17,480 33,847 51,328 3.4%
Value Added ($ Millions)Sector Description Direct Indirect Induced Total As a % of State Total
Direct Impact of the Oil and Natural Gas Industry 4,133 4,133 4.8%
Indirect and Induced Impacts on Other Industries**: 1,215 1,897 3,111 3.6%Services 329 608 937Finance, insurance, real estate, rental and leasing 279 455 734Wholesale and retail trade 122 305 427Manufacturing 165 166 331Transportation and warehousing 73 72 145Utilities 73 58 131Construction 95 12 107Information 35 52 87Agriculture 11 62 73Mining 2 1 4
Other 30 104 135
Total Impact 4,133 1,215 1,897 7,244 8.4%
Labor Income*** ($ Millions)Sector Description Direct Indirect Induced Total As a % of State Total
Direct Impact of the Oil and Natural Gas Industry 1,770 1,770 3.2%
Indirect and Induced Impacts on Other Industries**: 711 1,127 1,838 3.3%Services 268 487 755Wholesale and retail trade 74 190 264Manufacturing 101 120 221Finance, insurance, real estate, rental and leasing 69 109 177Transportation and warehousing 53 53 106Construction 77 10 87Information 15 23 38Utilities 21 17 38Agriculture 5 28 33Mining 2 1 3
Other 27 90 117
Total Impact 1,770 711 1,127 3,609 6.5%Source: PricewaterhouseCoopers calculations using IMPLAN modeling system (2007 database).* Employment is defined as the number of payroll and self-employed jobs, including part-time jobs.** Indirect and induced impacts on other industries exclude NAICS codes grouped under the oil and natural gas industry.*** Labor income is defined as wages and salaries and benefits as well as proprietors' income.
A-27
The Economic Impact of the Oil and Natural Gas Industry in Missouri, 2007
Employment*Sector Description Direct Indirect Induced Total As a % of State Total
Direct Impact of the Oil and Natural Gas Industry 38,430 38,430 1.1%
Indirect and Induced Impacts on Other Industries**: 24,602 59,787 84,389 2.3%
Value Added ($ Millions)Sector Description Direct Indirect Induced Total As a % of State Total
Direct Impact of the Oil and Natural Gas Industry 3,018 3,018 1.3%
Indirect and Induced Impacts on Other Industries**: 2,129 3,968 6,096 2.6%Services 781 1,358 2,139Finance, insurance, real estate, rental and leasing 456 946 1,402Manufacturing 334 456 790Wholesale and retail trade 131 556 686Information 102 205 308Transportation and warehousing 82 138 220Construction 111 27 138Utilities 44 61 106Agriculture 8 60 69Mining 34 14 48
Other 45 145 191
Total Impact 3,018 2,129 3,968 9,115 3.9%
Labor Income*** ($ Millions)Sector Description Direct Indirect Induced Total As a % of State Total
Direct Impact of the Oil and Natural Gas Industry 1,499 1,499 1.0%
Indirect and Induced Impacts on Other Industries**: 1,343 2,411 3,754 2.5%Services 640 1,107 1,747Manufacturing 204 265 469Finance, insurance, real estate, rental and leasing 148 303 451Wholesale and retail trade 78 337 415Transportation and warehousing 59 100 159Information 50 99 149Construction 90 22 112Utilities 13 18 30Agriculture 3 22 25Mining 15 6 22
Other 44 131 175
Total Impact 1,499 1,343 2,411 5,253 3.4%Source: PricewaterhouseCoopers calculations using IMPLAN modeling system (2007 database).* Employment is defined as the number of payroll and self-employed jobs, including part-time jobs.** Indirect and induced impacts on other industries exclude NAICS codes grouped under the oil and natural gas industry.*** Labor income is defined as wages and salaries and benefits as well as proprietors' income.
A-28
The Economic Impact of the Oil and Natural Gas Industry in Montana, 2007
Employment*Sector Description Direct Indirect Induced Total As a % of State Total
Direct Impact of the Oil and Natural Gas Industry 12,852 12,852 2.0%
Indirect and Induced Impacts on Other Industries**: 7,974 13,383 21,357 3.3%
Value Added ($ Millions)Sector Description Direct Indirect Induced Total As a % of State Total
Direct Impact of the Oil and Natural Gas Industry 2,028 2,028 5.5%
Indirect and Induced Impacts on Other Industries**: 557 740 1,296 3.5%Services 143 242 385Finance, insurance, real estate, rental and leasing 145 212 357Wholesale and retail trade 48 105 153Utilities 42 28 69Transportation and warehousing 32 26 57Manufacturing 32 24 56Construction 46 6 52Mining 34 13 47Information 17 22 40Agriculture 5 24 28
Other 14 38 51
Total Impact 2,028 557 740 3,324 8.9%
Labor Income*** ($ Millions)Sector Description Direct Indirect Induced Total As a % of State Total
Direct Impact of the Oil and Natural Gas Industry 854 854 3.8%
Indirect and Induced Impacts on Other Industries**: 311 419 730 3.2%Services 119 197 316Wholesale and retail trade 29 65 94Finance, insurance, real estate, rental and leasing 38 53 91Construction 37 5 42Transportation and warehousing 21 17 39Manufacturing 20 17 36Utilities 12 8 20Information 8 10 18Mining 13 5 18Agriculture 2 8 10
Other 12 32 44
Total Impact 854 311 419 1,584 7.0%Source: PricewaterhouseCoopers calculations using IMPLAN modeling system (2007 database).* Employment is defined as the number of payroll and self-employed jobs, including part-time jobs.** Indirect and induced impacts on other industries exclude NAICS codes grouped under the oil and natural gas industry.*** Labor income is defined as wages and salaries and benefits as well as proprietors' income.
A-29
The Economic Impact of the Oil and Natural Gas Industry in Nebraska, 2007
Employment*Sector Description Direct Indirect Induced Total As a % of State Total
Direct Impact of the Oil and Natural Gas Industry 14,465 14,465 1.2%
Indirect and Induced Impacts on Other Industries**: 8,606 26,712 35,319 2.9%
Value Added ($ Millions)Sector Description Direct Indirect Induced Total As a % of State Total
Direct Impact of the Oil and Natural Gas Industry 2,874 2,874 3.8%
Indirect and Induced Impacts on Other Industries**: 662 1,576 2,238 2.9%Services 233 506 739Finance, insurance, real estate, rental and leasing 155 383 538Wholesale and retail trade 42 244 287Manufacturing 76 118 194Transportation and warehousing 38 88 126Agriculture 10 84 94Information 26 53 78Construction 45 10 55Utilities 3 6 10Mining 5 2 7
Other 28 80 109
Total Impact 2,874 662 1,576 5,112 6.7%
Labor Income*** ($ Millions)Sector Description Direct Indirect Induced Total As a % of State Total
Direct Impact of the Oil and Natural Gas Industry 1,364 1,364 2.8%
Indirect and Induced Impacts on Other Industries**: 416 963 1,379 2.8%Services 182 409 591Finance, insurance, real estate, rental and leasing 54 126 180Wholesale and retail trade 25 148 173Manufacturing 47 85 133Transportation and warehousing 25 58 83Information 15 31 46Construction 36 8 45Agriculture 3 28 31Mining 3 1 4Utilities 1 2 3
Other 23 67 90
Total Impact 1,364 416 963 2,743 5.6%Source: PricewaterhouseCoopers calculations using IMPLAN modeling system (2007 database).* Employment is defined as the number of payroll and self-employed jobs, including part-time jobs.** Indirect and induced impacts on other industries exclude NAICS codes grouped under the oil and natural gas industry.*** Labor income is defined as wages and salaries and benefits as well as proprietors' income.
A-30
The Economic Impact of the Oil and Natural Gas Industry in Nevada, 2007
Employment*Sector Description Direct Indirect Induced Total As a % of State Total
Direct Impact of the Oil and Natural Gas Industry 13,049 13,049 0.8%
Indirect and Induced Impacts on Other Industries**: 8,254 21,837 30,091 1.9%
Value Added ($ Millions)Sector Description Direct Indirect Induced Total As a % of State Total
Direct Impact of the Oil and Natural Gas Industry 1,227 1,227 1.0%
Indirect and Induced Impacts on Other Industries**: 859 1,753 2,612 2.1%Services 332 792 1,124Finance, insurance, real estate, rental and leasing 197 467 664Wholesale and retail trade 37 207 244Mining 87 41 128Manufacturing 60 58 119Construction 66 20 87Transportation and warehousing 28 50 78Information 23 47 70Utilities 17 22 39Agriculture 1 6 7
Other 10 44 54
Total Impact 1,227 859 1,753 3,839 3.1%
Labor Income*** ($ Millions)Sector Description Direct Indirect Induced Total As a % of State Total
Direct Impact of the Oil and Natural Gas Industry 594 594 0.8%
Indirect and Induced Impacts on Other Industries**: 505 989 1,494 2.0%Services 258 553 811Finance, insurance, real estate, rental and leasing 58 135 193Wholesale and retail trade 22 123 145Manufacturing 39 42 81Construction 54 16 70Transportation and warehousing 21 38 59Mining 28 13 40Information 11 22 33Utilities 5 6 11Agriculture 0 2 2
Other 9 38 48
Total Impact 594 505 989 2,088 2.7%Source: PricewaterhouseCoopers calculations using IMPLAN modeling system (2007 database).* Employment is defined as the number of payroll and self-employed jobs, including part-time jobs.** Indirect and induced impacts on other industries exclude NAICS codes grouped under the oil and natural gas industry.*** Labor income is defined as wages and salaries and benefits as well as proprietors' income.
A-31
The Economic Impact of the Oil and Natural Gas Industry in New Hampshire, 2007
Employment*Sector Description Direct Indirect Induced Total As a % of State Total
Direct Impact of the Oil and Natural Gas Industry 8,909 8,909 1.1%
Indirect and Induced Impacts on Other Industries**: 4,489 12,858 17,347 2.1%
Value Added ($ Millions)Sector Description Direct Indirect Induced Total As a % of State Total
Direct Impact of the Oil and Natural Gas Industry 821 821 1.4%
Indirect and Induced Impacts on Other Industries**: 422 939 1,360 2.3%Services 138 331 469Finance, insurance, real estate, rental and leasing 99 244 343Wholesale and retail trade 25 161 186Manufacturing 90 89 179Information 16 38 55Utilities 14 21 35Transportation and warehousing 11 16 27Construction 17 6 24Agriculture 1 9 11Mining 2 1 2
Other 7 22 30
Total Impact 821 422 939 2,181 3.6%
Labor Income*** ($ Millions)Sector Description Direct Indirect Induced Total As a % of State Total
Direct Impact of the Oil and Natural Gas Industry 372 372 0.9%
Indirect and Induced Impacts on Other Industries**: 267 580 847 2.1%Services 114 272 387Manufacturing 61 63 124Finance, insurance, real estate, rental and leasing 34 83 117Wholesale and retail trade 15 95 109Information 8 19 27Transportation and warehousing 8 12 20Construction 14 5 19Utilities 4 6 10Agriculture 1 3 4Mining 1 1 2
Other 7 21 28
Total Impact 372 267 580 1,218 3.1%Source: PricewaterhouseCoopers calculations using IMPLAN modeling system (2007 database).* Employment is defined as the number of payroll and self-employed jobs, including part-time jobs.** Indirect and induced impacts on other industries exclude NAICS codes grouped under the oil and natural gas industry.*** Labor income is defined as wages and salaries and benefits as well as proprietors' income.
A-32
The Economic Impact of the Oil and Natural Gas Industry in New Jersey, 2007
Employment*Sector Description Direct Indirect Induced Total As a % of State Total
Direct Impact of the Oil and Natural Gas Industry 32,434 32,434 0.6%
Indirect and Induced Impacts on Other Industries**: 29,900 81,008 110,908 2.2%
Value Added ($ Millions)Sector Description Direct Indirect Induced Total As a % of State Total
Direct Impact of the Oil and Natural Gas Industry 5,433 5,433 1.1%
Indirect and Induced Impacts on Other Industries**: 3,635 7,785 11,420 2.4%Services 1,366 2,579 3,945Finance, insurance, real estate, rental and leasing 716 2,196 2,912Wholesale and retail trade 326 1,125 1,451Manufacturing 605 746 1,351Information 219 519 738Transportation and warehousing 138 227 364Utilities 76 96 172Construction 112 43 155Agriculture 2 16 18Mining 9 4 13
Other 69 234 302
Total Impact 5,433 3,635 7,785 16,853 3.5%
Labor Income*** ($ Millions)Sector Description Direct Indirect Induced Total As a % of State Total
Direct Impact of the Oil and Natural Gas Industry 2,378 2,378 0.8%
Indirect and Induced Impacts on Other Industries**: 2,349 4,734 7,083 2.3%Services 1,094 2,065 3,159Finance, insurance, real estate, rental and leasing 301 822 1,123Wholesale and retail trade 193 676 869Manufacturing 362 455 817Information 111 259 370Transportation and warehousing 104 172 276Construction 90 35 125Utilities 22 29 51Agriculture 1 8 9Mining 5 2 7
Other 66 210 276
Total Impact 2,378 2,349 4,734 9,461 3.1%Source: PricewaterhouseCoopers calculations using IMPLAN modeling system (2007 database).* Employment is defined as the number of payroll and self-employed jobs, including part-time jobs.** Indirect and induced impacts on other industries exclude NAICS codes grouped under the oil and natural gas industry.*** Labor income is defined as wages and salaries and benefits as well as proprietors' income.
A-33
The Economic Impact of the Oil and Natural Gas Industry in New Mexico, 2007
Employment*Sector Description Direct Indirect Induced Total As a % of State Total
Direct Impact of the Oil and Natural Gas Industry 33,116 33,116 3.0%
Indirect and Induced Impacts on Other Industries**: 20,961 34,737 55,698 5.1%
Value Added ($ Millions)Sector Description Direct Indirect Induced Total As a % of State Total
Direct Impact of the Oil and Natural Gas Industry 4,812 4,812 7.1%
Indirect and Induced Impacts on Other Industries**: 1,501 1,980 3,481 5.1%Services 560 742 1,302Finance, insurance, real estate, rental and leasing 381 496 877Wholesale and retail trade 110 312 422Construction 127 16 142Manufacturing 71 67 138Utilities 67 53 120Transportation and warehousing 62 57 119Information 49 65 114Agriculture 10 36 46Mining 30 10 39
Other 35 127 162
Total Impact 4,812 1,501 1,980 8,292 12.2%
Labor Income*** ($ Millions)Sector Description Direct Indirect Induced Total As a % of State Total
Direct Impact of the Oil and Natural Gas Industry 2,183 2,183 4.8%
Indirect and Induced Impacts on Other Industries**: 930 1,194 2,124 4.7%Services 484 605 1,089Wholesale and retail trade 66 193 259Finance, insurance, real estate, rental and leasing 95 119 214Construction 102 13 115Manufacturing 45 50 94Transportation and warehousing 44 41 85Information 22 29 51Utilities 19 15 34Agriculture 4 15 20Mining 15 5 19
Other 32 110 143
Total Impact 2,183 930 1,194 4,307 9.5%Source: PricewaterhouseCoopers calculations using IMPLAN modeling system (2007 database).* Employment is defined as the number of payroll and self-employed jobs, including part-time jobs.** Indirect and induced impacts on other industries exclude NAICS codes grouped under the oil and natural gas industry.*** Labor income is defined as wages and salaries and benefits as well as proprietors' income.
A-34
The Economic Impact of the Oil and Natural Gas Industry in New York, 2007
Employment*Sector Description Direct Indirect Induced Total As a % of State Total
Direct Impact of the Oil and Natural Gas Industry 56,149 56,149 0.5%
Indirect and Induced Impacts on Other Industries**: 49,962 175,155 225,118 2.1%
Value Added ($ Millions)Sector Description Direct Indirect Induced Total As a % of State Total
Direct Impact of the Oil and Natural Gas Industry 10,544 10,544 1.0%
Indirect and Induced Impacts on Other Industries**: 7,161 18,642 25,803 2.3%Finance, insurance, real estate, rental and leasing 2,282 7,183 9,465Services 2,592 5,837 8,429Wholesale and retail trade 351 1,928 2,280Information 547 1,398 1,945Manufacturing 697 1,002 1,699Utilities 180 357 537Transportation and warehousing 158 335 493Construction 245 76 321Agriculture 7 57 64Mining 20 9 29
Other 83 459 542
Total Impact 10,544 7,161 18,642 36,347 3.3%
Labor Income*** ($ Millions)Sector Description Direct Indirect Induced Total As a % of State Total
Direct Impact of the Oil and Natural Gas Industry 4,767 4,767 0.7%
Indirect and Induced Impacts on Other Industries**: 4,795 11,890 16,685 2.3%Services 2,084 4,756 6,841Finance, insurance, real estate, rental and leasing 1,270 3,691 4,961Wholesale and retail trade 207 1,147 1,354Information 340 852 1,192Manufacturing 439 602 1,041Transportation and warehousing 117 249 367Construction 198 61 260Utilities 51 102 153Agriculture 3 24 27Mining 11 5 16
Other 74 400 474
Total Impact 4,767 4,795 11,890 21,452 3.0%Source: PricewaterhouseCoopers calculations using IMPLAN modeling system (2007 database).* Employment is defined as the number of payroll and self-employed jobs, including part-time jobs.** Indirect and induced impacts on other industries exclude NAICS codes grouped under the oil and natural gas industry.*** Labor income is defined as wages and salaries and benefits as well as proprietors' income.
A-35
The Economic Impact of the Oil and Natural Gas Industry in North Carolina, 2007
Employment*Sector Description Direct Indirect Induced Total As a % of State Total
Direct Impact of the Oil and Natural Gas Industry 44,040 44,040 0.8%
Indirect and Induced Impacts on Other Industries**: 25,416 76,323 101,739 1.9%
Value Added ($ Millions)Sector Description Direct Indirect Induced Total As a % of State Total
Direct Impact of the Oil and Natural Gas Industry 2,925 2,925 0.8%
Indirect and Induced Impacts on Other Industries**: 2,251 5,447 7,697 2.1%Services 703 1,598 2,301Finance, insurance, real estate, rental and leasing 561 1,454 2,015Manufacturing 479 912 1,391Wholesale and retail trade 130 718 848Information 93 218 310Transportation and warehousing 79 142 221Construction 90 36 126Utilities 45 78 124Agriculture 11 85 96Mining 16 8 24
Other 44 197 241
Total Impact 2,925 2,251 5,447 10,623 2.9%
Labor Income*** ($ Millions)Sector Description Direct Indirect Induced Total As a % of State Total
Direct Impact of the Oil and Natural Gas Industry 1,461 1,461 0.6%
Indirect and Induced Impacts on Other Industries**: 1,384 3,162 4,546 2.0%Services 585 1,318 1,903Manufacturing 300 476 776Finance, insurance, real estate, rental and leasing 174 437 611Wholesale and retail trade 77 442 519Transportation and warehousing 59 106 164Information 48 112 160Construction 73 29 102Agriculture 7 49 55Utilities 13 22 35Mining 8 4 12
Other 41 168 208
Total Impact 1,461 1,384 3,162 6,007 2.6%Source: PricewaterhouseCoopers calculations using IMPLAN modeling system (2007 database).* Employment is defined as the number of payroll and self-employed jobs, including part-time jobs.** Indirect and induced impacts on other industries exclude NAICS codes grouped under the oil and natural gas industry.*** Labor income is defined as wages and salaries and benefits as well as proprietors' income.
A-36
The Economic Impact of the Oil and Natural Gas Industry in North Dakota, 2007
Employment*Sector Description Direct Indirect Induced Total As a % of State Total
Direct Impact of the Oil and Natural Gas Industry 11,788 11,788 2.4%
Indirect and Induced Impacts on Other Industries**: 6,599 9,527 16,126 3.3%
Value Added ($ Millions)Sector Description Direct Indirect Induced Total As a % of State Total
Direct Impact of the Oil and Natural Gas Industry 1,809 1,809 6.3%
Indirect and Induced Impacts on Other Industries**: 450 514 964 3.3%Services 134 162 296Finance, insurance, real estate, rental and leasing 107 116 222Wholesale and retail trade 40 83 122Manufacturing 40 23 63Transportation and warehousing 30 20 50Utilities 24 20 44Agriculture 6 36 42Information 19 19 38Construction 32 4 36Mining 7 3 10
Other 12 28 41
Total Impact 1,809 450 514 2,773 9.6%
Labor Income*** ($ Millions)Sector Description Direct Indirect Induced Total As a % of State Total
Direct Impact of the Oil and Natural Gas Industry 778 778 4.4%
Indirect and Induced Impacts on Other Industries**: 266 303 569 3.2%Services 109 134 243Wholesale and retail trade 24 51 74Finance, insurance, real estate, rental and leasing 30 33 63Manufacturing 24 18 41Transportation and warehousing 21 14 34Construction 26 3 29Information 9 10 19Utilities 7 6 13Agriculture 2 10 12Mining 4 2 6
Other 11 24 34
Total Impact 778 266 303 1,346 7.6%Source: PricewaterhouseCoopers calculations using IMPLAN modeling system (2007 database).* Employment is defined as the number of payroll and self-employed jobs, including part-time jobs.** Indirect and induced impacts on other industries exclude NAICS codes grouped under the oil and natural gas industry.*** Labor income is defined as wages and salaries and benefits as well as proprietors' income.
A-37
The Economic Impact of the Oil and Natural Gas Industry in Ohio, 2007
Employment*Sector Description Direct Indirect Induced Total As a % of State Total
Direct Impact of the Oil and Natural Gas Industry 65,413 65,413 1.0%
Indirect and Induced Impacts on Other Industries**: 45,629 118,397 164,025 2.4%
Value Added ($ Millions)Sector Description Direct Indirect Induced Total As a % of State Total
Direct Impact of the Oil and Natural Gas Industry 8,442 8,442 1.9%
Indirect and Induced Impacts on Other Industries**: 4,013 7,746 11,759 2.6%Services 1,333 2,683 4,016Finance, insurance, real estate, rental and leasing 785 1,967 2,752Manufacturing 1,087 1,000 2,087Wholesale and retail trade 134 1,026 1,159Transportation and warehousing 144 269 413Information 123 266 389Utilities 106 147 253Construction 204 45 249Agriculture 10 70 79Mining 21 10 31
Other 68 263 331
Total Impact 8,442 4,013 7,746 20,201 4.5%
Labor Income*** ($ Millions)Sector Description Direct Indirect Induced Total As a % of State Total
Direct Impact of the Oil and Natural Gas Industry 3,795 3,795 1.3%
Indirect and Induced Impacts on Other Industries**: 2,552 4,774 7,326 2.5%Services 1,092 2,203 3,295Manufacturing 690 666 1,356Finance, insurance, real estate, rental and leasing 246 605 851Wholesale and retail trade 80 624 704Transportation and warehousing 106 199 305Construction 165 37 202Information 57 123 180Utilities 30 42 72Agriculture 3 22 25Mining 12 5 17
Other 71 249 319
Total Impact 3,795 2,552 4,774 11,121 3.7%Source: PricewaterhouseCoopers calculations using IMPLAN modeling system (2007 database).* Employment is defined as the number of payroll and self-employed jobs, including part-time jobs.** Indirect and induced impacts on other industries exclude NAICS codes grouped under the oil and natural gas industry.*** Labor income is defined as wages and salaries and benefits as well as proprietors' income.
A-38
The Economic Impact of the Oil and Natural Gas Industry in Oklahoma, 2007
Employment*Sector Description Direct Indirect Induced Total As a % of State Total
Direct Impact of the Oil and Natural Gas Industry 98,306 98,306 4.6%
Indirect and Induced Impacts on Other Industries**: 82,368 167,953 250,321 11.7%
Value Added ($ Millions)Sector Description Direct Indirect Induced Total As a % of State Total
Direct Impact of the Oil and Natural Gas Industry 32,893 32,893 21.6%
Indirect and Induced Impacts on Other Industries**: 5,932 9,015 14,946 9.8%Services 1,808 3,122 4,930Finance, insurance, real estate, rental and leasing 1,604 2,286 3,890Wholesale and retail trade 514 1,687 2,200Manufacturing 515 414 929Utilities 350 294 644Construction 569 49 617Information 213 281 493Transportation and warehousing 213 266 478Agriculture 28 145 173Mining 14 5 19
Other 105 466 572
Total Impact 32,893 5,932 9,015 47,839 31.3%
Labor Income*** ($ Millions)Sector Description Direct Indirect Induced Total As a % of State Total
Direct Impact of the Oil and Natural Gas Industry 13,808 13,808 15.1%
Indirect and Induced Impacts on Other Industries**: 3,390 5,352 8,742 9.6%Services 1,445 2,522 3,967Wholesale and retail trade 311 1,057 1,368Finance, insurance, real estate, rental and leasing 394 577 971Manufacturing 315 294 609Construction 461 39 500Transportation and warehousing 157 196 353Information 98 129 226Utilities 100 87 187Agriculture 10 50 60Mining 7 3 10
Other 92 399 491
Total Impact 13,808 3,390 5,352 22,550 24.7%Source: PricewaterhouseCoopers calculations using IMPLAN modeling system (2007 database).* Employment is defined as the number of payroll and self-employed jobs, including part-time jobs.** Indirect and induced impacts on other industries exclude NAICS codes grouped under the oil and natural gas industry.*** Labor income is defined as wages and salaries and benefits as well as proprietors' income.
A-39
The Economic Impact of the Oil and Natural Gas Industry in Oregon, 2007
Employment*Sector Description Direct Indirect Induced Total As a % of State Total
Direct Impact of the Oil and Natural Gas Industry 15,707 15,707 0.7%
Indirect and Induced Impacts on Other Industries**: 11,536 32,879 44,415 1.9%
Value Added ($ Millions)Sector Description Direct Indirect Induced Total As a % of State Total
Direct Impact of the Oil and Natural Gas Industry 1,313 1,313 0.9%
Indirect and Induced Impacts on Other Industries**: 984 2,196 3,180 2.1%Services 330 725 1,055Finance, insurance, real estate, rental and leasing 216 533 749Wholesale and retail trade 65 330 395Manufacturing 182 204 386Information 43 97 139Agriculture 13 102 115Transportation and warehousing 34 67 100Construction 50 16 66Utilities 19 30 49Mining 7 3 11
Other 27 88 115
Total Impact 1,313 984 2,196 4,494 3.0%
Labor Income*** ($ Millions)Sector Description Direct Indirect Induced Total As a % of State Total
Direct Impact of the Oil and Natural Gas Industry 635 635 0.6%
Indirect and Induced Impacts on Other Industries**: 619 1,335 1,955 2.0%Services 267 585 852Manufacturing 122 147 269Wholesale and retail trade 38 199 237Finance, insurance, real estate, rental and leasing 66 158 224Information 23 51 73Transportation and warehousing 24 49 73Construction 41 13 54Agriculture 6 43 48Utilities 5 9 14Mining 4 2 6
Other 24 79 103
Total Impact 635 619 1,335 2,590 2.6%Source: PricewaterhouseCoopers calculations using IMPLAN modeling system (2007 database).* Employment is defined as the number of payroll and self-employed jobs, including part-time jobs.** Indirect and induced impacts on other industries exclude NAICS codes grouped under the oil and natural gas industry.*** Labor income is defined as wages and salaries and benefits as well as proprietors' income.
A-40
The Economic Impact of the Oil and Natural Gas Industry in Pennsylvania, 2007
Employment*Sector Description Direct Indirect Induced Total As a % of State Total
Direct Impact of the Oil and Natural Gas Industry 73,792 73,792 1.0%
Indirect and Induced Impacts on Other Industries**: 55,084 142,374 197,457 2.7%
Value Added ($ Millions)Sector Description Direct Indirect Induced Total As a % of State Total
Direct Impact of the Oil and Natural Gas Industry 9,661 9,661 1.8%
Indirect and Induced Impacts on Other Industries**: 5,470 10,641 16,111 3.0%Services 1,923 3,809 5,732Finance, insurance, real estate, rental and leasing 1,079 2,798 3,877Manufacturing 1,098 1,076 2,173Wholesale and retail trade 376 1,491 1,867Information 193 411 605Transportation and warehousing 190 324 514Utilities 172 234 406Construction 275 68 343Mining 62 28 91Agriculture 11 77 88
Other 91 324 416
Total Impact 9,661 5,470 10,641 25,772 4.8%
Labor Income*** ($ Millions)Sector Description Direct Indirect Induced Total As a % of State Total
Direct Impact of the Oil and Natural Gas Industry 4,418 4,418 1.2%
Indirect and Induced Impacts on Other Industries**: 3,502 6,573 10,075 2.8%Services 1,580 3,146 4,726Manufacturing 678 684 1,362Finance, insurance, real estate, rental and leasing 367 904 1,271Wholesale and retail trade 223 898 1,121Transportation and warehousing 140 239 379Information 100 210 309Construction 223 55 278Utilities 49 68 117Mining 34 15 49Agriculture 5 36 41
Other 103 318 422
Total Impact 4,418 3,502 6,573 14,494 4.1%Source: PricewaterhouseCoopers calculations using IMPLAN modeling system (2007 database).* Employment is defined as the number of payroll and self-employed jobs, including part-time jobs.** Indirect and induced impacts on other industries exclude NAICS codes grouped under the oil and natural gas industry.*** Labor income is defined as wages and salaries and benefits as well as proprietors' income.
A-41
The Economic Impact of the Oil and Natural Gas Industry in Rhode Island, 2007
Employment*Sector Description Direct Indirect Induced Total As a % of State Total
Direct Impact of the Oil and Natural Gas Industry 4,265 4,265 0.7%
Indirect and Induced Impacts on Other Industries**: 2,714 9,181 11,895 2.0%
Value Added ($ Millions)Sector Description Direct Indirect Induced Total As a % of State Total
Direct Impact of the Oil and Natural Gas Industry 533 533 1.2%
Indirect and Induced Impacts on Other Industries**: 264 660 923 2.1%Services 89 247 336Finance, insurance, real estate, rental and leasing 68 187 256Manufacturing 56 61 117Wholesale and retail trade 11 80 91Information 12 29 40Transportation and warehousing 7 11 18Utilities 4 10 14Construction 8 4 12Agriculture 0 3 3Mining 1 0 1
Other 7 29 36
Total Impact 533 264 660 1,456 3.4%
Labor Income*** ($ Millions)Sector Description Direct Indirect Induced Total As a % of State Total
Direct Impact of the Oil and Natural Gas Industry 242 242 0.8%
Indirect and Induced Impacts on Other Industries**: 167 414 581 2.0%Services 75 204 279Finance, insurance, real estate, rental and leasing 25 63 89Manufacturing 34 42 76Wholesale and retail trade 7 48 55Information 6 15 21Transportation and warehousing 5 8 13Construction 7 3 10Utilities 1 3 4Agriculture 0 1 1Mining 0 0 1
Other 7 25 32
Total Impact 242 167 414 822 2.8%Source: PricewaterhouseCoopers calculations using IMPLAN modeling system (2007 database).* Employment is defined as the number of payroll and self-employed jobs, including part-time jobs.** Indirect and induced impacts on other industries exclude NAICS codes grouped under the oil and natural gas industry.*** Labor income is defined as wages and salaries and benefits as well as proprietors' income.
A-42
The Economic Impact of the Oil and Natural Gas Industry in South Carolina, 2007
Employment*Sector Description Direct Indirect Induced Total As a % of State Total
Direct Impact of the Oil and Natural Gas Industry 23,372 23,372 1.0%
Indirect and Induced Impacts on Other Industries**: 11,368 33,562 44,930 1.8%
Value Added ($ Millions)Sector Description Direct Indirect Induced Total As a % of State Total
Direct Impact of the Oil and Natural Gas Industry 1,246 1,246 0.8%
Indirect and Induced Impacts on Other Industries**: 928 2,118 3,046 2.0%Services 237 640 877Finance, insurance, real estate, rental and leasing 216 552 768Manufacturing 261 290 552Wholesale and retail trade 44 301 345Information 33 75 109Utilities 34 65 99Transportation and warehousing 34 59 93Construction 41 17 57Agriculture 4 30 35Mining 4 2 5
Other 20 87 107
Total Impact 1,246 928 2,118 4,292 2.8%
Labor Income*** ($ Millions)Sector Description Direct Indirect Induced Total As a % of State Total
Direct Impact of the Oil and Natural Gas Industry 640 640 0.7%
Indirect and Induced Impacts on Other Industries**: 558 1,270 1,828 1.9%Services 198 519 716Manufacturing 165 206 371Finance, insurance, real estate, rental and leasing 64 158 223Wholesale and retail trade 26 186 212Transportation and warehousing 25 44 69Information 15 34 49Construction 33 13 46Utilities 10 19 28Agriculture 2 16 18Mining 2 1 3
Other 18 75 93
Total Impact 640 558 1,270 2,468 2.5%Source: PricewaterhouseCoopers calculations using IMPLAN modeling system (2007 database).* Employment is defined as the number of payroll and self-employed jobs, including part-time jobs.** Indirect and induced impacts on other industries exclude NAICS codes grouped under the oil and natural gas industry.*** Labor income is defined as wages and salaries and benefits as well as proprietors' income.
A-43
The Economic Impact of the Oil and Natural Gas Industry in South Dakota, 2007
Employment*Sector Description Direct Indirect Induced Total As a % of State Total
Direct Impact of the Oil and Natural Gas Industry 8,223 8,223 1.5%
Indirect and Induced Impacts on Other Industries**: 3,224 8,495 11,719 2.1%
Value Added ($ Millions)Sector Description Direct Indirect Induced Total As a % of State Total
Direct Impact of the Oil and Natural Gas Industry 715 715 2.3%
Indirect and Induced Impacts on Other Industries**: 243 501 744 2.3%Finance, insurance, real estate, rental and leasing 75 144 220Services 54 143 197Wholesale and retail trade 18 69 88Manufacturing 33 37 69Agriculture 5 37 42Information 10 18 28Transportation and warehousing 12 15 27Utilities 11 13 23Construction 15 3 18Mining 3 1 5
Other 7 21 27
Total Impact 715 243 501 1,459 4.6%
Labor Income*** ($ Millions)Sector Description Direct Indirect Induced Total As a % of State Total
Direct Impact of the Oil and Natural Gas Industry 342 342 1.8%
Indirect and Induced Impacts on Other Industries**: 135 286 422 2.2%Services 44 118 162Finance, insurance, real estate, rental and leasing 22 45 67Wholesale and retail trade 11 42 53Manufacturing 21 27 48Transportation and warehousing 9 11 20Construction 12 3 15Agriculture 1 11 12Information 4 8 12Utilities 3 4 7Mining 2 1 2
Other 6 18 24
Total Impact 342 135 286 763 3.9%Source: PricewaterhouseCoopers calculations using IMPLAN modeling system (2007 database).* Employment is defined as the number of payroll and self-employed jobs, including part-time jobs.** Indirect and induced impacts on other industries exclude NAICS codes grouped under the oil and natural gas industry.*** Labor income is defined as wages and salaries and benefits as well as proprietors' income.
A-44
The Economic Impact of the Oil and Natural Gas Industry in Tennessee, 2007
Employment*Sector Description Direct Indirect Induced Total As a % of State Total
Direct Impact of the Oil and Natural Gas Industry 35,187 35,187 1.0%
Indirect and Induced Impacts on Other Industries**: 22,045 56,962 79,007 2.2%
Value Added ($ Millions)Sector Description Direct Indirect Induced Total As a % of State Total
Direct Impact of the Oil and Natural Gas Industry 2,743 2,743 1.1%
Indirect and Induced Impacts on Other Industries**: 1,927 4,081 6,007 2.4%Services 537 1,339 1,876Finance, insurance, real estate, rental and leasing 449 1,036 1,484Manufacturing 417 520 937Wholesale and retail trade 139 595 734Transportation and warehousing 104 198 302Information 68 143 211Construction 98 25 123Agriculture 5 36 41Utilities 14 19 33Mining 18 7 25
Other 79 163 242
Total Impact 2,743 1,927 4,081 8,750 3.5%
Labor Income*** ($ Millions)Sector Description Direct Indirect Induced Total As a % of State Total
Direct Impact of the Oil and Natural Gas Industry 1,371 1,371 0.8%
Indirect and Induced Impacts on Other Industries**: 1,184 2,492 3,676 2.3%Services 444 1,091 1,535Manufacturing 261 332 593Finance, insurance, real estate, rental and leasing 144 326 470Wholesale and retail trade 83 363 446Transportation and warehousing 75 145 220Information 35 72 107Construction 79 20 100Agriculture 2 13 15Mining 9 4 12Utilities 4 6 10
Other 49 120 168
Total Impact 1,371 1,184 2,492 5,048 3.1%Source: PricewaterhouseCoopers calculations using IMPLAN modeling system (2007 database).* Employment is defined as the number of payroll and self-employed jobs, including part-time jobs.** Indirect and induced impacts on other industries exclude NAICS codes grouped under the oil and natural gas industry.*** Labor income is defined as wages and salaries and benefits as well as proprietors' income.
A-45
The Economic Impact of the Oil and Natural Gas Industry in Texas, 2007
Employment*Sector Description Direct Indirect Induced Total As a % of State Total
Direct Impact of the Oil and Natural Gas Industry 432,147 432,147 3.2%
Indirect and Induced Impacts on Other Industries**: 421,747 918,441 1,340,188 9.9%
Total Impact 432,147 421,747 918,441 1,772,335 13.1%
Value Added ($ Millions)Sector Description Direct Indirect Induced Total As a % of State Total
Direct Impact of the Oil and Natural Gas Industry 185,760 185,760 15.3%
Indirect and Induced Impacts on Other Industries**: 42,108 65,893 108,000 8.9%Services 13,213 20,228 33,441Finance, insurance, real estate, rental and leasing 11,550 19,292 30,841Wholesale and retail trade 4,108 12,728 16,836Manufacturing 3,162 3,617 6,779Utilities 2,436 2,164 4,600Construction 3,958 375 4,333Information 1,516 2,155 3,671Transportation and warehousing 1,309 1,879 3,188Agriculture 131 710 841Mining 95 29 124
Other 631 2,715 3,346
Total Impact 185,760 42,108 65,893 293,760 24.2%
Labor Income*** ($ Millions)Sector Description Direct Indirect Induced Total As a % of State Total
Direct Impact of the Oil and Natural Gas Industry 77,924 77,924 10.8%
Indirect and Induced Impacts on Other Industries**: 24,742 38,276 63,017 8.7%Services 10,907 16,378 27,285Wholesale and retail trade 2,465 7,885 10,350Finance, insurance, real estate, rental and leasing 3,113 5,506 8,619Manufacturing 1,966 2,472 4,438Construction 3,209 304 3,513Transportation and warehousing 958 1,376 2,335Information 728 1,034 1,762Utilities 713 663 1,376Agriculture 51 276 327Mining 54 17 70
Other 578 2,365 2,943
Total Impact 77,924 24,742 38,276 140,941 19.5%Source: PricewaterhouseCoopers calculations using IMPLAN modeling system (2007 database).* Employment is defined as the number of payroll and self-employed jobs, including part-time jobs.** Indirect and induced impacts on other industries exclude NAICS codes grouped under the oil and natural gas industry.*** Labor income is defined as wages and salaries and benefits as well as proprietors' income.
A-46
The Economic Impact of the Oil and Natural Gas Industry in Utah, 2007
Employment*Sector Description Direct Indirect Induced Total As a % of State Total
Direct Impact of the Oil and Natural Gas Industry 21,404 21,404 1.3%
Indirect and Induced Impacts on Other Industries**: 17,713 37,072 54,785 3.4%
Value Added ($ Millions)Sector Description Direct Indirect Induced Total As a % of State Total
Direct Impact of the Oil and Natural Gas Industry 4,167 4,167 4.0%
Indirect and Induced Impacts on Other Industries**: 1,383 2,272 3,655 3.5%Services 447 747 1,193Finance, insurance, real estate, rental and leasing 310 602 912Wholesale and retail trade 127 386 513Manufacturing 194 181 376Transportation and warehousing 60 83 143Information 49 85 134Construction 88 19 106Utilities 40 39 79Mining 36 13 49Agriculture 5 22 27
Other 28 96 123
Total Impact 4,167 1,383 2,272 7,822 7.6%
Labor Income*** ($ Millions)Sector Description Direct Indirect Induced Total As a % of State Total
Direct Impact of the Oil and Natural Gas Industry 1,742 1,742 2.6%
Indirect and Induced Impacts on Other Industries**: 843 1,375 2,218 3.3%Services 366 611 978Wholesale and retail trade 76 232 307Finance, insurance, real estate, rental and leasing 93 178 271Manufacturing 111 121 232Transportation and warehousing 44 60 104Construction 71 15 86Information 25 44 69Mining 17 6 23Utilities 11 11 23Agriculture 2 7 9
Other 28 89 117
Total Impact 1,742 843 1,375 3,960 5.9%Source: PricewaterhouseCoopers calculations using IMPLAN modeling system (2007 database).* Employment is defined as the number of payroll and self-employed jobs, including part-time jobs.** Indirect and induced impacts on other industries exclude NAICS codes grouped under the oil and natural gas industry.*** Labor income is defined as wages and salaries and benefits as well as proprietors' income.
A-47
The Economic Impact of the Oil and Natural Gas Industry in Vermont, 2007
Employment*Sector Description Direct Indirect Induced Total As a % of State Total
Direct Impact of the Oil and Natural Gas Industry 6,008 6,008 1.4%
Indirect and Induced Impacts on Other Industries**: 2,120 6,031 8,151 1.9%
Value Added ($ Millions)Sector Description Direct Indirect Induced Total As a % of State Total
Direct Impact of the Oil and Natural Gas Industry 384 384 1.6%
Indirect and Induced Impacts on Other Industries**: 157 360 516 2.1%Services 42 128 170Finance, insurance, real estate, rental and leasing 41 82 123Manufacturing 30 36 66Wholesale and retail trade 8 51 60Utilities 8 13 21Information 6 13 19Transportation and warehousing 7 8 15Construction 7 3 10Agriculture 1 8 10Mining 2 1 3
Other 6 16 21
Total Impact 384 157 360 900 3.6%
Labor Income*** ($ Millions)Sector Description Direct Indirect Induced Total As a % of State Total
Direct Impact of the Oil and Natural Gas Industry 178 178 1.1%
Indirect and Induced Impacts on Other Industries**: 94 220 314 1.9%Services 34 104 138Manufacturing 21 26 46Finance, insurance, real estate, rental and leasing 11 24 35Wholesale and retail trade 5 30 35Transportation and warehousing 5 6 11Information 3 6 9Construction 6 2 8Utilities 2 4 6Agriculture 0 3 4Mining 1 1 2
Other 6 15 21
Total Impact 178 94 220 492 3.0%Source: PricewaterhouseCoopers calculations using IMPLAN modeling system (2007 database).* Employment is defined as the number of payroll and self-employed jobs, including part-time jobs.** Indirect and induced impacts on other industries exclude NAICS codes grouped under the oil and natural gas industry.*** Labor income is defined as wages and salaries and benefits as well as proprietors' income.
A-48
The Economic Impact of the Oil and Natural Gas Industry in Virginia, 2007
Employment*Sector Description Direct Indirect Induced Total As a % of State Total
Direct Impact of the Oil and Natural Gas Industry 47,908 47,908 1.0%
Indirect and Induced Impacts on Other Industries**: 25,182 70,388 95,571 2.0%
Value Added ($ Millions)Sector Description Direct Indirect Induced Total As a % of State Total
Direct Impact of the Oil and Natural Gas Industry 3,755 3,755 1.0%
Indirect and Induced Impacts on Other Industries**: 2,570 5,642 8,212 2.1%Services 1,090 1,960 3,050Finance, insurance, real estate, rental and leasing 574 1,524 2,098Wholesale and retail trade 108 637 746Manufacturing 263 447 710Information 165 401 566Transportation and warehousing 80 142 222Utilities 65 106 171Construction 114 39 153Mining 41 19 60Agriculture 6 39 44
Other 64 328 392
Total Impact 3,755 2,570 5,642 11,968 3.1%
Labor Income*** ($ Millions)Sector Description Direct Indirect Induced Total As a % of State Total
Direct Impact of the Oil and Natural Gas Industry 1,825 1,825 0.7%
Indirect and Induced Impacts on Other Industries**: 1,697 3,400 5,098 2.0%Services 951 1,663 2,614Finance, insurance, real estate, rental and leasing 182 453 635Wholesale and retail trade 64 388 452Manufacturing 172 243 415Information 75 178 252Transportation and warehousing 58 104 162Construction 92 32 124Utilities 19 30 49Mining 22 10 32Agriculture 2 16 18
Other 60 284 344
Total Impact 1,825 1,697 3,400 6,923 2.7%Source: PricewaterhouseCoopers calculations using IMPLAN modeling system (2007 database).* Employment is defined as the number of payroll and self-employed jobs, including part-time jobs.** Indirect and induced impacts on other industries exclude NAICS codes grouped under the oil and natural gas industry.*** Labor income is defined as wages and salaries and benefits as well as proprietors' income.
A-49
The Economic Impact of the Oil and Natural Gas Industry in Washington, 2007
Employment*Sector Description Direct Indirect Induced Total As a % of State Total
Direct Impact of the Oil and Natural Gas Industry 25,362 25,362 0.7%
Indirect and Induced Impacts on Other Industries**: 21,724 59,531 81,254 2.1%
Value Added ($ Millions)Sector Description Direct Indirect Induced Total As a % of State Total
Direct Impact of the Oil and Natural Gas Industry 3,300 3,300 1.1%
Indirect and Induced Impacts on Other Industries**: 2,178 4,854 7,032 2.3%Services 666 1,471 2,136Finance, insurance, real estate, rental and leasing 475 1,247 1,722Wholesale and retail trade 203 678 881Manufacturing 267 400 667Information 192 456 648Transportation and warehousing 81 133 215Construction 122 38 160Agriculture 17 137 154Utilities 30 32 62Mining 19 7 26
Other 105 256 361
Total Impact 3,300 2,178 4,854 10,333 3.4%
Labor Income*** ($ Millions)Sector Description Direct Indirect Induced Total As a % of State Total
Direct Impact of the Oil and Natural Gas Industry 1,489 1,489 0.7%
Indirect and Induced Impacts on Other Industries**: 1,379 2,924 4,303 2.2%Services 556 1,191 1,747Wholesale and retail trade 120 402 522Finance, insurance, real estate, rental and leasing 146 364 510Manufacturing 186 312 497Information 100 234 334Transportation and warehousing 59 97 157Construction 99 30 129Agriculture 9 66 75Utilities 9 10 18Mining 9 4 13
Other 86 216 301
Total Impact 1,489 1,379 2,924 5,792 2.9%Source: PricewaterhouseCoopers calculations using IMPLAN modeling system (2007 database).* Employment is defined as the number of payroll and self-employed jobs, including part-time jobs.** Indirect and induced impacts on other industries exclude NAICS codes grouped under the oil and natural gas industry.*** Labor income is defined as wages and salaries and benefits as well as proprietors' income.
A-50
The Economic Impact of the Oil and Natural Gas Industry in West Virginia, 2007
Employment*Sector Description Direct Indirect Induced Total As a % of State Total
Direct Impact of the Oil and Natural Gas Industry 26,420 26,420 2.9%
Indirect and Induced Impacts on Other Industries**: 14,085 20,386 34,471 3.8%
Value Added ($ Millions)Sector Description Direct Indirect Induced Total As a % of State Total
Direct Impact of the Oil and Natural Gas Industry 3,188 3,188 5.5%
Indirect and Induced Impacts on Other Industries**: 1,067 1,157 2,224 3.9%Services 260 397 657Finance, insurance, real estate, rental and leasing 233 248 481Wholesale and retail trade 74 181 256Manufacturing 137 99 236Construction 127 9 136Mining 87 39 126Utilities 61 43 104Transportation and warehousing 35 35 70Information 32 36 68Agriculture 5 13 18
Other 16 57 73
Total Impact 3,188 1,067 1,157 5,412 9.4%
Labor Income*** ($ Millions)Sector Description Direct Indirect Induced Total As a % of State Total
Direct Impact of the Oil and Natural Gas Industry 1,438 1,438 3.9%
Indirect and Induced Impacts on Other Industries**: 613 688 1,302 3.5%Services 216 324 540Wholesale and retail trade 45 112 157Manufacturing 81 59 140Construction 103 7 110Finance, insurance, real estate, rental and leasing 50 56 105Mining 48 22 70Transportation and warehousing 24 24 48Information 14 16 30Utilities 17 12 30Agriculture 1 4 5
Other 15 51 66
Total Impact 1,438 613 688 2,740 7.4%Source: PricewaterhouseCoopers calculations using IMPLAN modeling system (2007 database).* Employment is defined as the number of payroll and self-employed jobs, including part-time jobs.** Indirect and induced impacts on other industries exclude NAICS codes grouped under the oil and natural gas industry.*** Labor income is defined as wages and salaries and benefits as well as proprietors' income.
A-51
The Economic Impact of the Oil and Natural Gas Industry in Wisconsin, 2007
Employment*Sector Description Direct Indirect Induced Total As a % of State Total
Direct Impact of the Oil and Natural Gas Industry 31,978 31,978 0.9%
Indirect and Induced Impacts on Other Industries**: 19,065 52,778 71,843 2.0%
Value Added ($ Millions)Sector Description Direct Indirect Induced Total As a % of State Total
Direct Impact of the Oil and Natural Gas Industry 1,787 1,787 0.8%
Indirect and Induced Impacts on Other Industries**: 1,625 3,425 5,050 2.2%Services 442 1,064 1,506Manufacturing 577 577 1,154Finance, insurance, real estate, rental and leasing 294 818 1,112Wholesale and retail trade 80 470 551Transportation and warehousing 62 117 180Information 52 118 170Utilities 33 69 101Agriculture 10 76 86Construction 42 22 64Mining 8 4 13
Other 26 90 115
Total Impact 1,787 1,625 3,425 6,837 3.0%
Labor Income*** ($ Millions)Sector Description Direct Indirect Induced Total As a % of State Total
Direct Impact of the Oil and Natural Gas Industry 931 931 0.6%
Indirect and Induced Impacts on Other Industries**: 1,026 2,097 3,122 2.1%Services 359 870 1,229Manufacturing 363 380 743Finance, insurance, real estate, rental and leasing 107 275 382Wholesale and retail trade 47 277 325Transportation and warehousing 46 87 133Information 27 61 88Construction 34 18 52Utilities 9 19 29Agriculture 3 22 25Mining 5 2 7
Other 26 84 110
Total Impact 931 1,026 2,097 4,053 2.7%Source: PricewaterhouseCoopers calculations using IMPLAN modeling system (2007 database).* Employment is defined as the number of payroll and self-employed jobs, including part-time jobs.** Indirect and induced impacts on other industries exclude NAICS codes grouped under the oil and natural gas industry.*** Labor income is defined as wages and salaries and benefits as well as proprietors' income.
A-52
The Economic Impact of the Oil and Natural Gas Industry in Wyoming, 2007
Employment*Sector Description Direct Indirect Induced Total As a % of State Total
Direct Impact of the Oil and Natural Gas Industry 32,029 32,029 8.5%
Indirect and Induced Impacts on Other Industries**: 16,929 22,105 39,034 10.3%
Value Added ($ Millions)Sector Description Direct Indirect Induced Total As a % of State Total
Direct Impact of the Oil and Natural Gas Industry 5,762 5,762 20.1%
Indirect and Induced Impacts on Other Industries**: 1,349 1,321 2,670 9.3%Services 362 425 786Finance, insurance, real estate, rental and leasing 376 366 742Wholesale and retail trade 115 236 351Construction 151 11 163Utilities 89 51 140Transportation and warehousing 67 46 113Manufacturing 63 28 91Mining 56 22 78Information 35 33 68Agriculture 9 14 23
Other 26 89 116
Total Impact 5,762 1,349 1,321 8,432 29.4%
Labor Income*** ($ Millions)Sector Description Direct Indirect Induced Total As a % of State Total
Direct Impact of the Oil and Natural Gas Industry 2,590 2,590 15.5%
Indirect and Induced Impacts on Other Industries**: 734 736 1,470 8.8%Services 273 325 598Wholesale and retail trade 70 146 216Finance, insurance, real estate, rental and leasing 90 85 175Construction 123 9 132Transportation and warehousing 44 30 75Manufacturing 37 18 55Mining 32 13 45Utilities 25 15 40Information 15 15 30Agriculture 2 3 5
Other 22 77 99
Total Impact 2,590 734 736 4,060 24.3%Source: PricewaterhouseCoopers calculations using IMPLAN modeling system (2007 database).* Employment is defined as the number of payroll and self-employed jobs, including part-time jobs.** Indirect and induced impacts on other industries exclude NAICS codes grouped under the oil and natural gas industry.*** Labor income is defined as wages and salaries and benefits as well as proprietors' income.
B-1
Appendix B: Data Sources and Methodology This Appendix describes the methodology used to derive the results for the study. It first discusses the data sources PricewaterhouseCoopers utilized to develop estimates of direct economic contributions by the oil and natural gas industry. It then describes the development of the indirect and induced impact estimates. I. Estimates of Direct Economic Contributions This study uses the IMPLAN input-output modeling system and its most recent database (for the year 2007 - released in October 2008) as the primary data sources. The IMPLAN modeling system is similar to the Regional Input-Output Modeling System developed by the U.S. Department of Commerce. The U.S. Forest Service, in cooperation with the Federal Emergency Management Agency and the Bureau of Land Management, developed IMPLAN (Impact Analysis for Planning) to help with land resource planning issues. It was later refined by the Minnesota IMPLAN Group. The system has been in use since 1979. Its current users include academia, federal, state, and local governments, and the private sector. The IMPLAN database represents a consistent set of economic data processed from various published sources (such as the Bureau of Economic Analysis’s National Income and Product Accounts (NIPA) and Regional Economic Information System (REIS), the Census Bureau’s County Business Patterns (CBP), and the Bureau of Labor Statistics’ Covered Employee and Wages Program (CEW) in a variety of formats and under varying disclosure restrictions. The IMPLAN input-output modeling system was used to construct customized economic impact models for the United States and the 50 states and the District of Columbia for the oil and natural gas industry. The IMPLAN sectors that correspond to PricewaterhouseCoopers' definition of the oil and natural gas industry are shown in Table 1 of the report. The direct employment in the oil and natural gas industry was used in each model to drive the impact analysis.7 Direct value added and labor income (including wages and salaries and benefits as well as proprietors' income) corresponding to the national or state-specific direct employment in the oil and natural gas industry were obtained from each model. In general, most subsectors of the oil and natural gas industry as defined by PricewaterhouseCoopers have a one-to-one correspondence to an IMPLAN sector, thus the 2007 employment for these subsectors were directly obtained from the customized IMPLAN national or state impact models. The exceptions are four NAICS codes: NAICS 2212 ("Natural gas distribution - public"), NAICS 23712 ("Oil and gas pipeline and related structures construction"), NAICS 4247 ("Petroleum and petroleum products wholesalers"), and NAICS 45431 ("Fuel dealers"). Each is included as part of a larger IMPLAN sector. PricewaterhouseCoopers undertook the following procedure to estimate employment for the four NAICS sectors. First, employment numbers for these sectors were obtained by combining paid employee counts from the U.S. Department of Labor's Bureau of Labor Statistics (BLS) with establishment counts from Nonemployer Statistics (NES) provided 7 Employment is defined as the number of payroll and self-employed jobs, including part-time jobs.
B-2
by the Census Bureau.8 Each nonemployer establishment was assumed to have one owner who acts as the business’s sole employee. In our analysis, data were obtained at both the national level and for each of the 50 states and the District of Columbia. For the four NAICS sectors, in some states the paid employee or nonemployer establishment counts were suppressed because of the small number of establishments in these sectors. Since counts were available for these sectors at the national-level and for larger sector aggregations at the state-level, a “raking” process was used to estimate the state-level employee count for the sector of interest. The raking process uses information from known sectors to impute information for the sectors with suppressed data. For example, NAICS sector 45431 ("Fuel Dealers") is one of two sub-sectors in NAICS sector 4543 ("Nonstore Retailers"). A matrix was set up with 51 rows representing the 50 states and the District of Columbia and two columns. Thus, each cell in the matrix represents the total employment for a state and sub-sector within sector 4543. When the exact count was not known for a particular cell, the starting values were determined by allocating the difference between the total national employment in the industry and the sum of the known values across the states based on the number of establishments provided in the BLS database. Because not all cell values were known, the column totals did not match the national employment counts from BLS. Similarly, the row totals did not match the known state-level totals for sector 4543. A standard raking algorithm was used to adjust the unknown cell values so that both the column and row totals matched the corresponding BLS sub-sector and state sector totals.9 There were two exceptions to the above methodology for filling in missing values at the state level. First, NES does not report data for all detailed industry sectors. In particular, while NES provides data for NAICS 2371 (“Utility System Construction”), it does not provide data for the NAICS 23712 ("Oil and Gas Pipeline and Related Structures Construction"). As a result, PricewaterhouseCoopers used establishment data from the latest CBP database (currently for 2006) to apportion the NAICS 2371 nonemployer establishments to NAICS 23712. For example, according to CBP, there were 304 establishments with paid employees in NAICS 2371 in Alabama, 36 of which were in NAICS 23712. As such, 11.8 percent (36/304) of Alabama’s 209 nonemployer establishments in NAICS 2371 were assumed to be in NAICS sector 23712. State level estimates were then scaled to match the estimated national total for NAICS 23712. The second exception was for public-sector employment in NAICS 2212. For this sector it was not possible to use the standard raking procedure as industry control totals were not readily available. Instead, employees per establishment for the public-sector employment in NAICS 22 (“Utilities”) from BLS were used to obtain initial values for states with only establishment missing values. These initial values were then scaled to match the difference between the known national total for the public sector employment in NAICS 2212 and the sum of the employment for the same NAICS code in states with known values. Estimates of the oil and natural gas industry's new capital investment in 2007 are obtained from the Annual Capital Expenditure Survey published by the Census Bureau. 8 A nonemployer is a business without paid employees. Most nonemployers are self-employed individuals operating very small unincorporated businesses, which may or may not be the owner’s principal source of income. 9 Oh, H.L. and Scheuren, F. (1987). Modified Raking Ratio Estimation. Survey Methodology, vol. 13, no. 2, pp. 209-219.
B-3
For quantifying the economic impact of the oil and natural gas industry's capital investment, its capital spending is translated into purchases of capital assets by type through the use of the so-called "capital flow matrix" from the U.S. Department of Commerce. II. Estimates of Indirect and Induced Economic Contributions Estimates of indirect and induced economic contributions by the oil and natural gas industry were derived based on the IMPLAN models for the country as a whole and for each of the 50 states and the District of Columbia. The IMPLAN models are built around an “input-output” table that relates the purchases that each industry has made from other industries to the value of the output of each industry. To meet the demand for goods and services from an industry, purchases are made in other industries according to the patterns recorded in the input-output table. These purchases in turn spark still more purchases by the industry's suppliers, and so on. Meanwhile, employees and business owners make personal purchases out of the additional income that is generated by this process, sending more new demands rippling through the economy. Multipliers describe these iterations. The Type I multiplier measures the direct and indirect effects of a change in economic activity. It captures the inter-industry effects only, i.e., industries buying from local industries. The Type II (Social Accounting Matrix or SAM) multiplier captures the direct and indirect effects and, in addition, it also reflects induced effects (i.e., changes in spending from households as income increases or decreases due to the changes in production). The indirect and induced contributions by the oil and natural gas industry on other sectors of the economy in terms of employment, labor income (including wages and salaries and benefits as well as proprietors' income), and value added were calculated through the multiplier process built in each model.10 Because IMPLAN state models capture only the indirect and induced effects within each state, the indirect and induced effects crossing state borders (“cross-state spillover effects”) are not captured by the IMPLAN state models. As such, if not adjusted, the state-level indirect and induced impacts calculated by the IMPLAN state models would not add up to the overall impact captured by the national model, which includes the cross-state effects. PricewaterhouseCoopers allocated the cross-state indirect and induced employment, labor income, and value added effects across the 50 states and the District of Columbia in proportion to each state’s share of the total national employment, labor income, and value added. The allocation was done at the industry level. The state indirect and induced effects reported throughout this study include such allocation of the cross-state spillover effects.
10 Because the IMPLAN models are used for total impact analysis (as opposed to marginal impact analysis) in this study, necessary adjustments are made to the initial indirect and induced impact estimates to prevent double-counting. For instance, any indirect or induced effects from the initial estimates for IMPLAN sectors that are fully mapped to the oil and natural gas industry are removed. Similarly, indirect and induced effects for IMPLAN sectors that are partially mapped to the oil and natural gas industry are proportionately adjusted.