Oil and Gas Trends and their Impact on the Generator Set Market The generator set market for oil & gas will start stabilizing and witnessing slight growth from 2018 Pritil Gunjan Program Manager, Energy and Power Group July 2016
Transcript
Oil and Gas Trends and their Impact on the
Generator Set Market The generator set market for oil & gas will start stabilizing and witnessing
slight growth from 2018
Pritil Gunjan
Program Manager, Energy and Power Group
July 2016
2
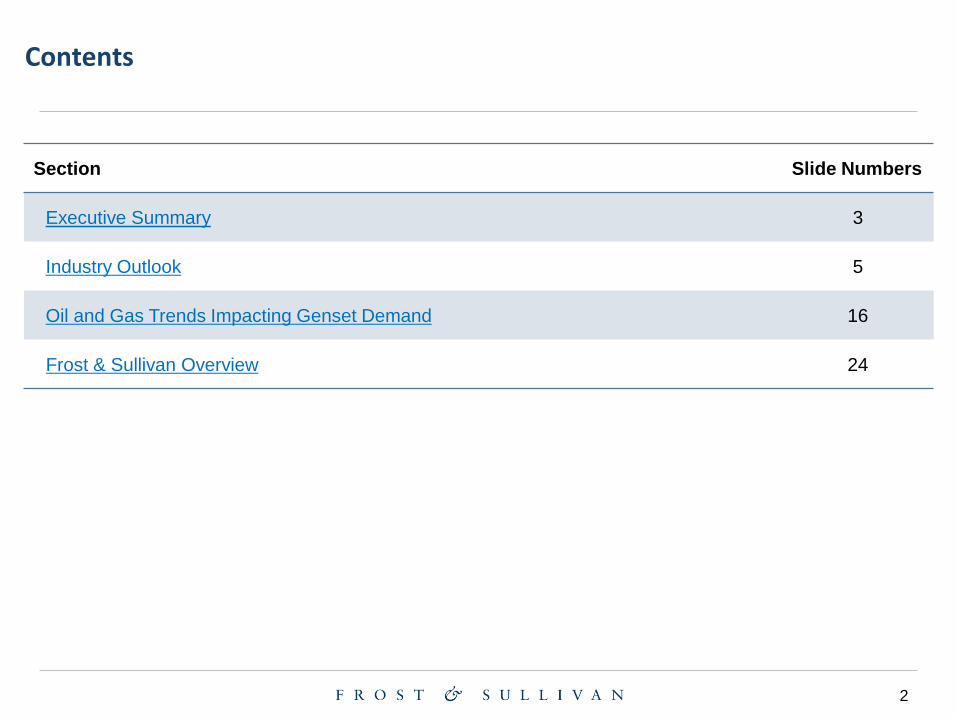
Section Slide Numbers
Executive Summary 3
Industry Outlook 5
Oil and Gas Trends Impacting Genset Demand 16
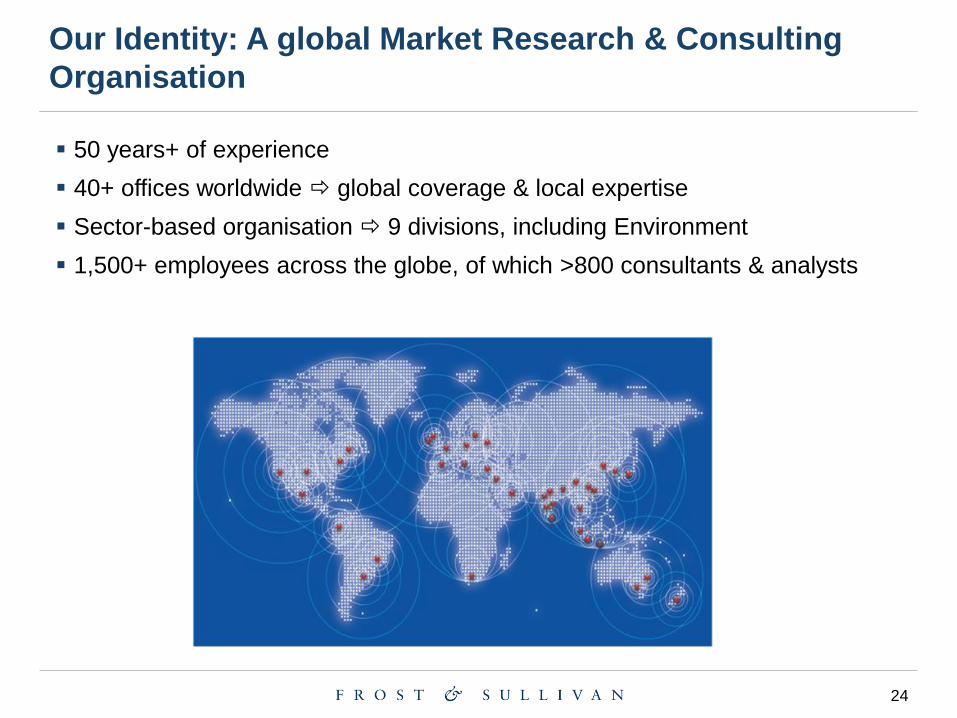
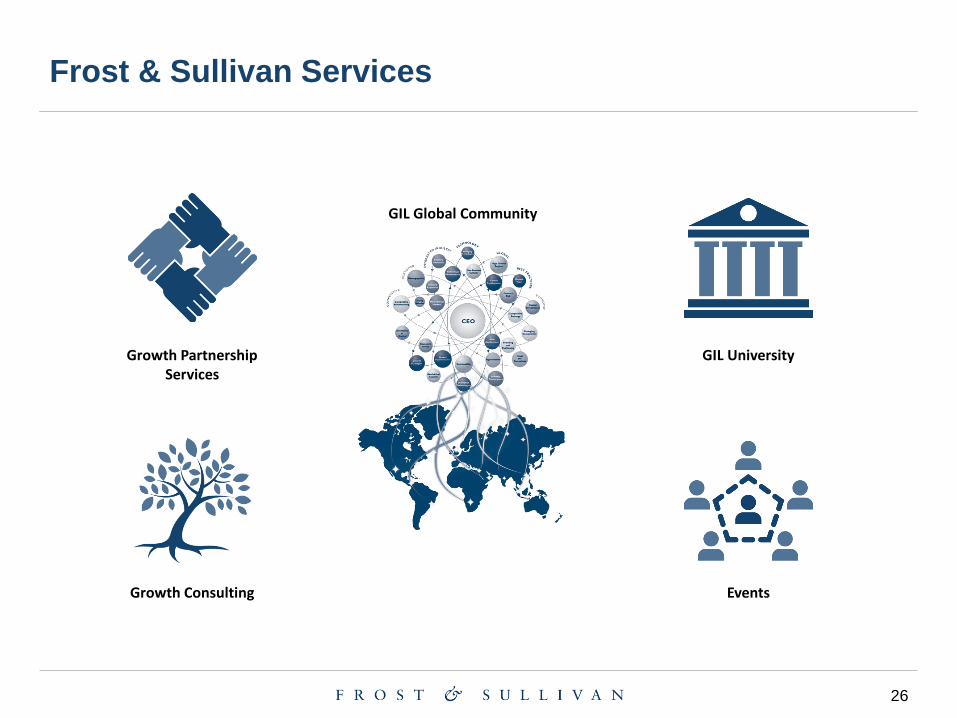
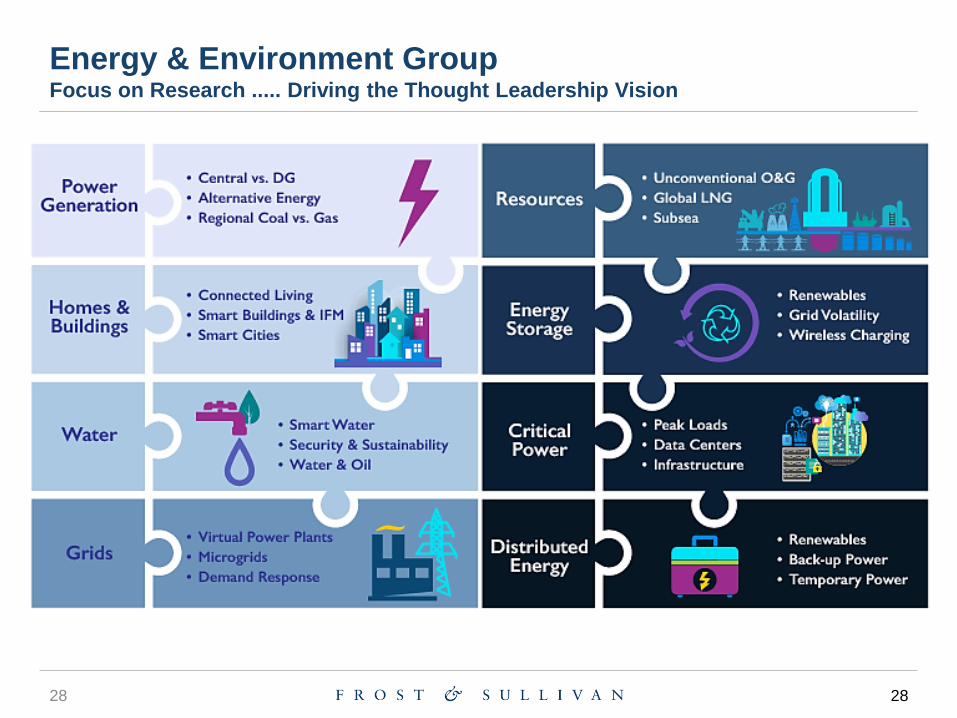
Frost & Sullivan Overview 24
Contents
3
Executive Summary
4
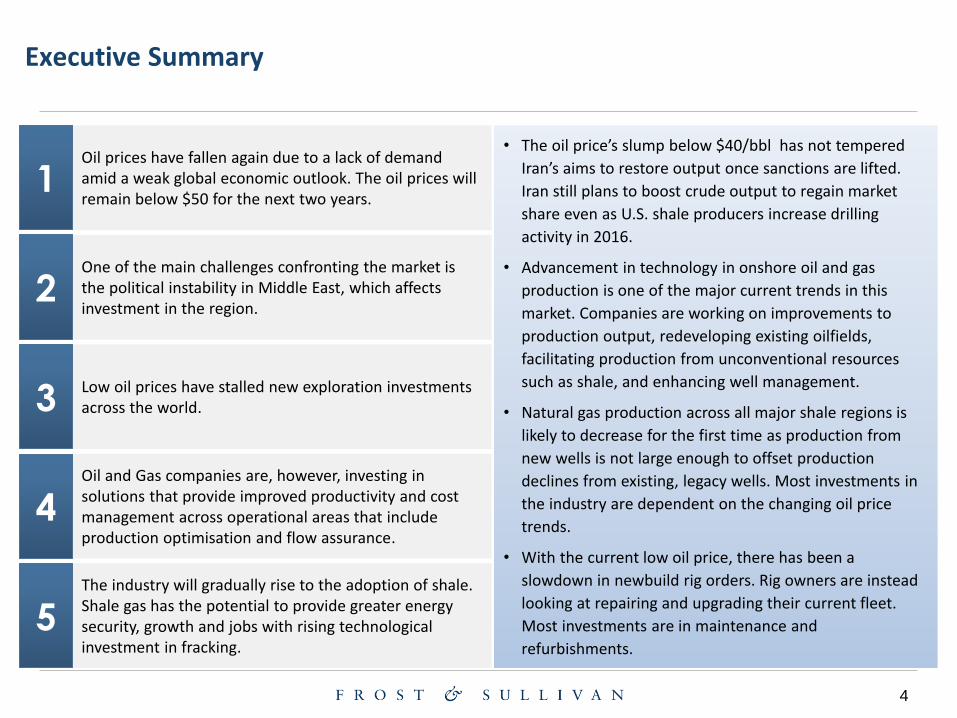
One of the main challenges confronting the market is the political instability in Middle East, which affects investment in the region.
Low oil prices have stalled new exploration investments across the world.
Oil prices have fallen again due to a lack of demand amid a weak global economic outlook. The oil prices will remain below $50 for the next two years.
Executive Summary
Oil and Gas companies are, however, investing in solutions that provide improved productivity and cost management across operational areas that include production optimisation and flow assurance.
The industry will gradually rise to the adoption of shale. Shale gas has the potential to provide greater energy security, growth and jobs with rising technological investment in fracking.
• The oil price’s slump below $40/bbl has not tempered
Iran’s aims to restore output once sanctions are lifted.
Iran still plans to boost crude output to regain market
share even as U.S. shale producers increase drilling
activity in 2016.
• Advancement in technology in onshore oil and gas
production is one of the major current trends in this
market. Companies are working on improvements to
production output, redeveloping existing oilfields,
facilitating production from unconventional resources
such as shale, and enhancing well management.
• Natural gas production across all major shale regions is
likely to decrease for the first time as production from
new wells is not large enough to offset production
declines from existing, legacy wells. Most investments in
the industry are dependent on the changing oil price
trends.
• With the current low oil price, there has been a
slowdown in newbuild rig orders. Rig owners are instead
looking at repairing and upgrading their current fleet.
Most investments are in maintenance and
refurbishments.
2
3
1
4
5
5
Industry Outlook
6
2014 2030 2020
2020
Note: All values in mb/d (million barrels/ day)
2014 2020 2030
2014 2020 2030
2014 2020 2030 2014 2020 2030
2014 2020 2030
2014 2030
North America
Latin America
Europe
Russia and CIS
China
Africa
The Middle East
22.5 21.9 19.6
6.0 6.2 6.7
12.9 9.9
8.3 3.0 3.1 3.2
10.2
12.9 15.0
3.6 4.0 4.4
7.5 8.2 9.3
2014 2020 2030
India
3.7 4.7
6.9
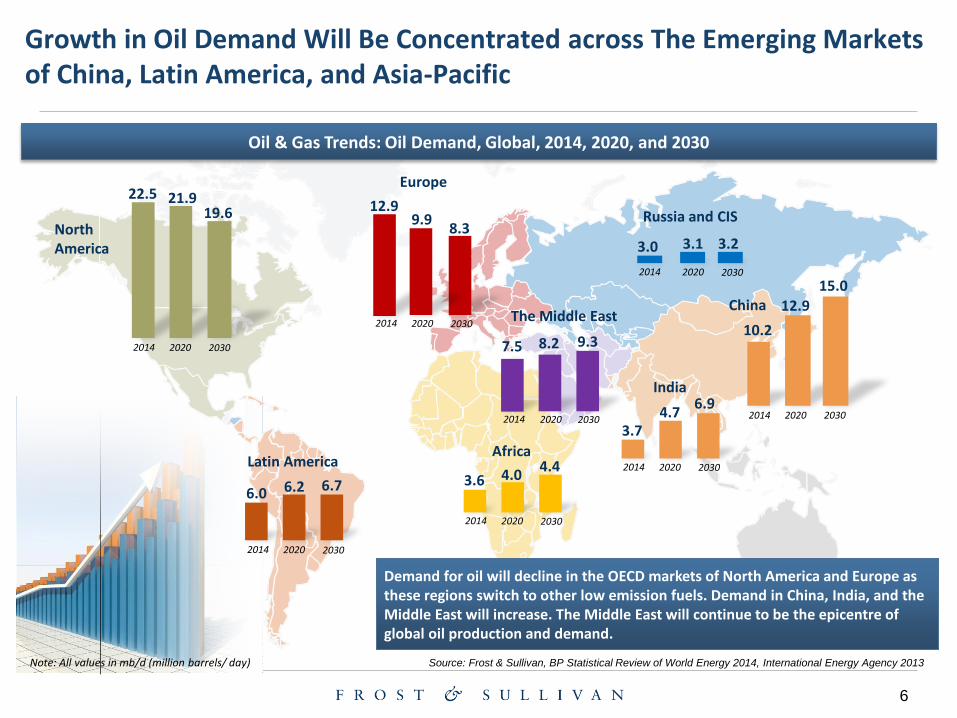
Demand for oil will decline in the OECD markets of North America and Europe as these regions switch to other low emission fuels. Demand in China, India, and the Middle East will increase. The Middle East will continue to be the epicentre of global oil production and demand.
Source: Frost & Sullivan, BP Statistical Review of World Energy 2014, International Energy Agency 2013
Growth in Oil Demand Will Be Concentrated across The Emerging Markets of China, Latin America, and Asia-Pacific
Oil & Gas Trends: Oil Demand, Global, 2014, 2020, and 2030
7
Oil & Gas Trends: Gas Price Trends, Global, 2008–2020
• The shale story in the United States is unlikely to be replicated in the other countries within the next 10 years. The
exploration technology is kept between a small number of key US companies who need time and local support to develop
shale plays across other regions. China, Latin America, and Australia are well positioned to be those next countries and
regions in the long run.
• European countries are the newly opened export markets for the United States. Gas prices are forecast to decline due to a
rise in cheap imported gas volumes. The United States is expected to become a net gas exporter by 2018, and with
increasing volumes of gas produced, the investments in LNG infrastructure in the United States will have a direct impact on
the price of gas in Europe and other US gas importing destinations.
Source: BP Statistical Review of World Energy 2014, International Energy Agency 2013; Frost & Sullivan
Asia-Pacific is a Hub of Investment as Long-term Projects Continue
• LNG projects are usually planned for the long term and are capital intensive. Hence, much of the construction activity is
continuing, despite the recent downturn in prices.
• The main focus of activity is Asia-Pacific, particularly China. Improving the gas infrastructure and boosting the use of natural
gas in the power generation sector remain long-term priorities.
Oil & Gas Trends: LNG Liquefaction Facility by Region, Global, 2014 and 2020
Oil & Gas Trends: Key LNG Exporters and Importers, Global, 2015
Oil & Gas Trends: LNG Regasification Facility by Region, Global, 2014 and 2020
0
20
40
60
80
100
120
140
160
1802014 2020
Cap
acit
y (B
cf/d
)
LNG Exporters LNG Importers
0
50
100
150
200
250
300
350
400
2014
13
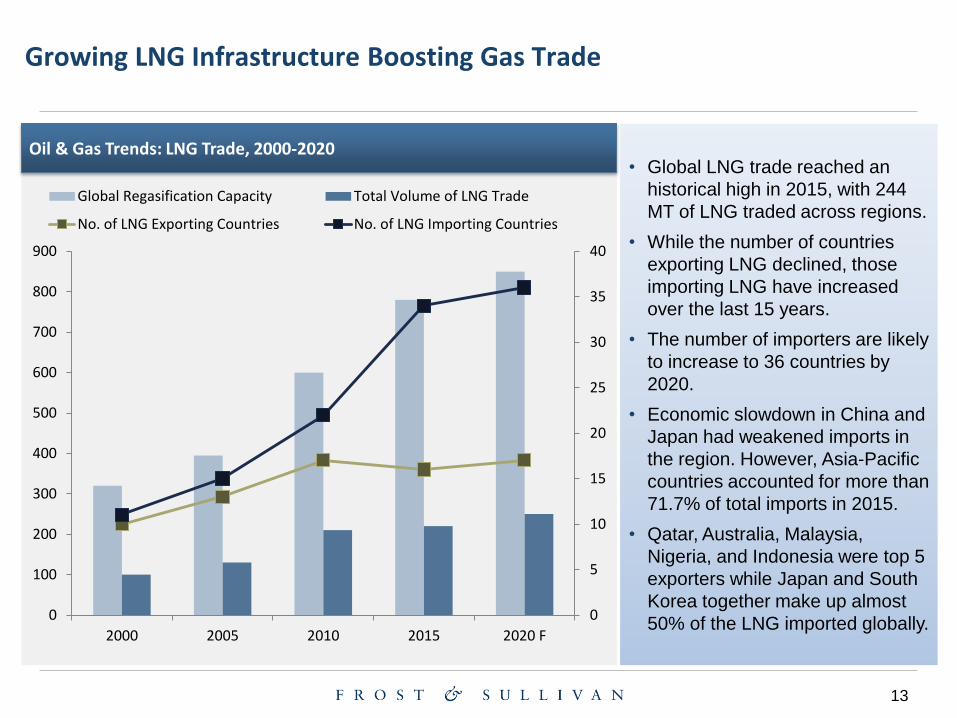
Growing LNG Infrastructure Boosting Gas Trade
Oil & Gas Trends: LNG Trade, 2000-2020 • Global LNG trade reached an
historical high in 2015, with 244
MT of LNG traded across regions.
• While the number of countries
exporting LNG declined, those
importing LNG have increased
over the last 15 years.
• The number of importers are likely
to increase to 36 countries by
2020.
• Economic slowdown in China and
Japan had weakened imports in
the region. However, Asia-Pacific
countries accounted for more than
71.7% of total imports in 2015.
• Qatar, Australia, Malaysia,
Nigeria, and Indonesia were top 5
exporters while Japan and South
Korea together make up almost
50% of the LNG imported globally. 0
5
10
15
20
25
30
35
40
0
100
200
300
400
500
600
700
800
900
2000 2005 2010 2015 2020 F
Global Regasification Capacity Total Volume of LNG Trade
No. of LNG Exporting Countries No. of LNG Importing Countries
14
Key projects in the Global Oil and Gas Market
Jacobs Engineering Group Inc. was recently selected by ExxonMobil to perform engineering, procurement
and construction management (EPCM) services for its Crude Flexibility Engineering and Construction
Project at the ExxonMobil Refinery in Beaumont, Texas.
Rosneft and Statoil ASA completed drilling works as part of the Pilot Project at the PK1 layer of the North-
Komsomolskoye field in Russia. During this year the companies jointly drilled 2 horizontal exploitation
wells.
Wärtsilä has secured two contracts to supply seawater/propane-based regasification modules to South
Korean shipyard Hyundai Heavy Industries (HHI). The systems will be installed on FSRU vessels owned by
both Norway-based Höegh LNG and Russian energy company Gazprom.
Singapore's Keppel Offshore & Marine has signed an agreement to acquire the offshore rigs business of
the US-based Cameron, in a transaction valued at $100m.
Italian company Eni has discovered a huge gas reserve in the Zohr 1X NFW well at its Zohr Prospect in
Mediterranean Sea offshore Egypt. They are likely to develop it in the next 2 years.
The Nigerian National Petroleum Corporation (NNPC) has cancelled its previously signed offshore
processing agreements (OPAs) with the Duke Oil Company, Aiteo Energy Resources, and Sahara Energy
Resources (Nig). The profitability and timeframes were not favourable enough.
France-based Total has agreed to divest all of its interests in the Frigg UK Pipeline (FUKA), the Shetland
Island Regional Gas Export System (SIRGE) gas pipelines, and the St Fergus Gas Terminal to UK's North Sea
Midstream Partners, in a transaction valued at £585m ($905m)
15
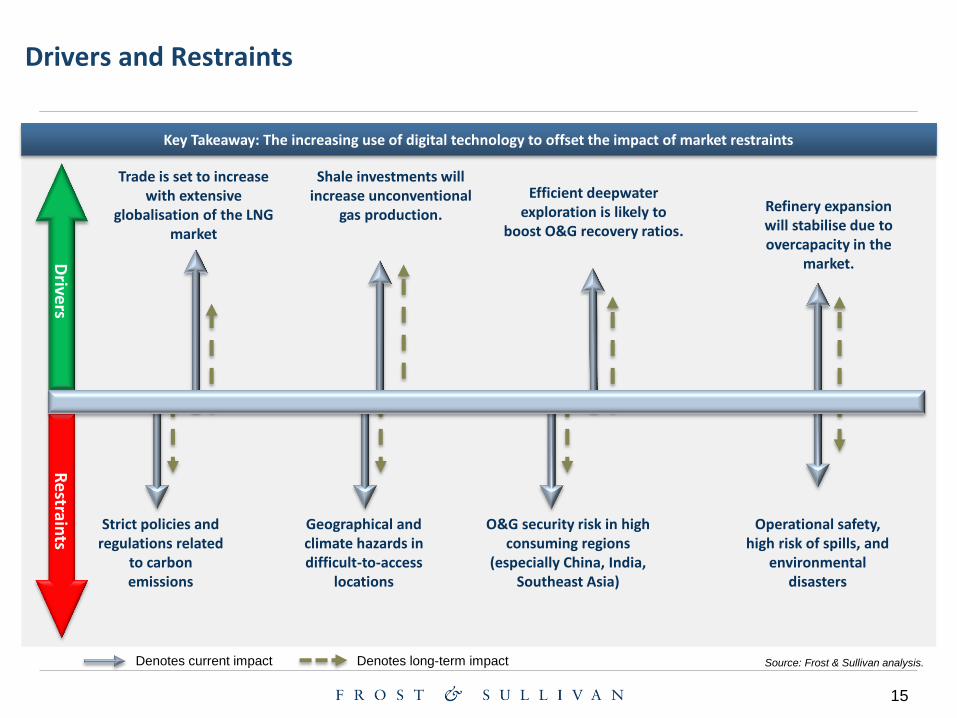
Key Takeaway: The increasing use of digital technology to offset the impact of market restraints
Denotes long-term impact
Drive
rs R
estrain
ts
Denotes current impact
Trade is set to increase with extensive
globalisation of the LNG market
Shale investments will increase unconventional
gas production.
Efficient deepwater exploration is likely to
boost O&G recovery ratios.
Strict policies and regulations related
to carbon emissions
Refinery expansion will stabilise due to overcapacity in the
market.
Operational safety, high risk of spills, and
environmental disasters
Geographical and climate hazards in difficult-to-access
locations
O&G security risk in high consuming regions
(especially China, India, Southeast Asia)
Drivers and Restraints
Source: Frost & Sullivan analysis.
16
Oil and Gas Trends Impacting the Genset
Demand
17
Falling Oil Prices Affects Gensets Sales
Source: Frost & Sullivan
Due to the fall in oil prices, many projects have been cancelled. Over the past two years close to $380 billion worth of oil and gas projects have been cancelled and $170 billion of CAPEX spending cut between 2016 and 2020.
Major oil and gas companies such as Royal Dutch Shell, Chevron Corp. and Woodside Petroleum have postponed and even cancelled many projects. ConocoPhilips in May announced that it would cut its spending by a further $700 million in 2016, while Exxon Mobil announced a 25% cut in its capital spending. BP cut jobs globally and especially in the North Sea.
Oil and Gas companies are however investing in solutions that provide improved productivity and cost management across operational areas that include production optimisation and flow assurance.
Genset packagers with a big focus on the oil and gas sector have witnessed a slump in their revenues and are now focusing on other applications such as datacenters, renewable energy support (hybrid power systems), and so on for newer opportunities.
18
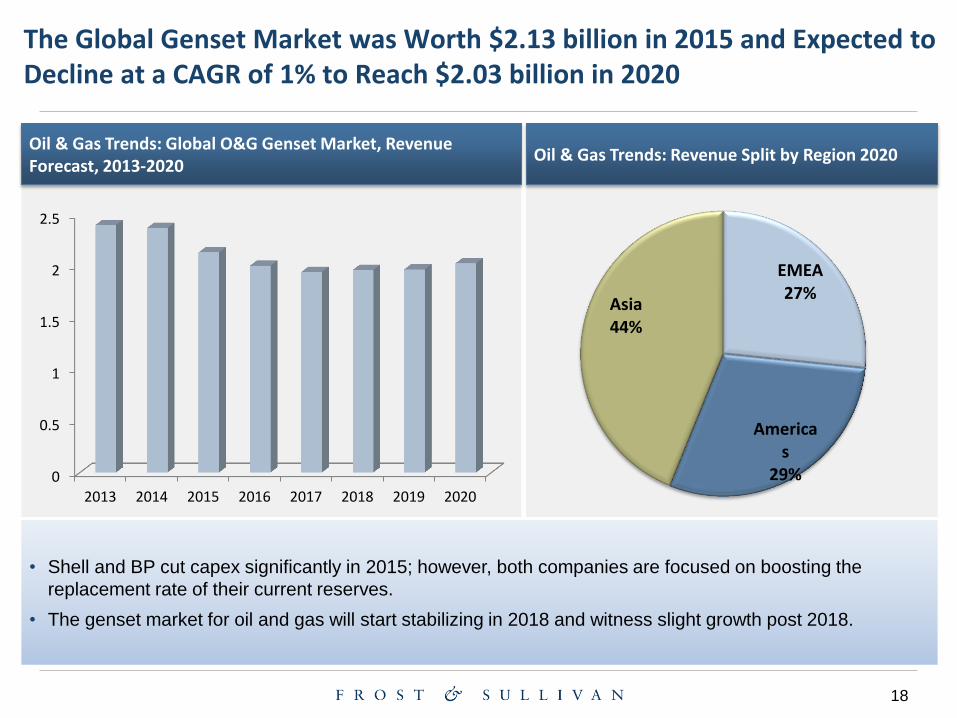
The Global Genset Market was Worth $2.13 billion in 2015 and Expected to Decline at a CAGR of 1% to Reach $2.03 billion in 2020
Oil & Gas Trends: Global O&G Genset Market, Revenue Forecast, 2013-2020
Oil & Gas Trends: Revenue Split by Region 2020
• Shell and BP cut capex significantly in 2015; however, both companies are focused on boosting the
replacement rate of their current reserves.
• The genset market for oil and gas will start stabilizing in 2018 and witness slight growth post 2018.
EMEA 27%
Americas
29%
Asia 44%
0
0.5
1
1.5
2
2.5
2013 2014 2015 2016 2017 2018 2019 2020
19
E&P Drilling Activities and Rig Development are Supported by Increased Onshore Genset Revenue
• Low O&G prices and improvement in energy demand will lead to further investments in the upstream O&G
sector. A significant development in the upstream sector has been multiple mergers and acquisitions in the
last two years.
• The upstream E&P sector will continue to witness modest growth as investments in shale exploration
continue to rise. Most notable were Rosneft’s acquisition of TNK-BP, CNOOC’s acquisition of Nexen, and
SapuraKencana’s acquisition of Seadrill.
Oil & Gas Trends: Global Genset Market, Revenue Forecast, 2013-2020
Estimated timeline for mainstream commercialisation
Market Development and Technology Roadmap
Source: Frost & Sullivan
Mobile gen-sets gain
momentum as non-stationary
units used for emergency and
temporary power needs.
Digitized Engine
Management Systems
are commercialised to
coordinate operations
across multiple systems.
Remote management
enables smart operations
from a Smartphone/
hand held device.
Dual fuel/flexi fuel engines
get a market boost as a
reliable power source run on
both gas and diesel fuel.
Hybrid power
system (renewable)
retrofitting diesel gen-sets
with wind turbines/
solar photovoltaic
(PV) systems.
Hybrid power system
(battery) will economically
incorporate a battery as an
alternative power source.
High speed engines
improve efficiency for industrial
end users who require a better
start up performance.
Generator paralleling
technology is enabled by
sophisticated digital systems.
Advanced fuel and
emission technology drives
growth in the environmentally
conscious European market.
21
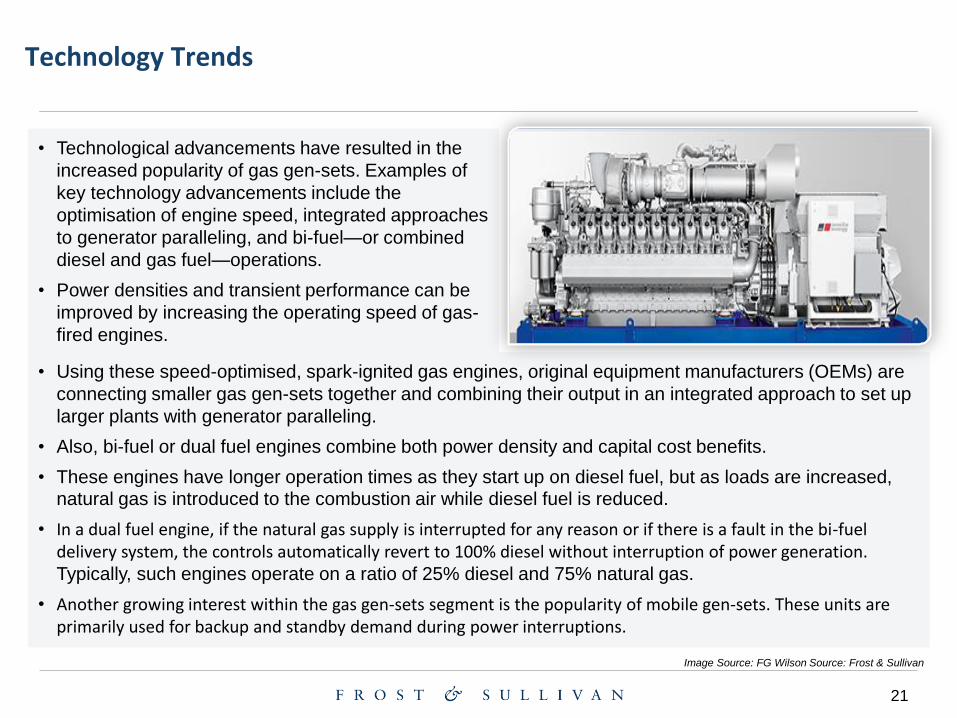
• Technological advancements have resulted in the
increased popularity of gas gen-sets. Examples of
key technology advancements include the
optimisation of engine speed, integrated approaches
to generator paralleling, and bi-fuel—or combined
diesel and gas fuel—operations.
• Power densities and transient performance can be
improved by increasing the operating speed of gas-
fired engines.
• Using these speed-optimised, spark-ignited gas engines, original equipment manufacturers (OEMs) are
connecting smaller gas gen-sets together and combining their output in an integrated approach to set up
larger plants with generator paralleling.
• Also, bi-fuel or dual fuel engines combine both power density and capital cost benefits.
• These engines have longer operation times as they start up on diesel fuel, but as loads are increased, natural gas is introduced to the combustion air while diesel fuel is reduced.
• In a dual fuel engine, if the natural gas supply is interrupted for any reason or if there is a fault in the bi-fuel delivery system, the controls automatically revert to 100% diesel without interruption of power generation. Typically, such engines operate on a ratio of 25% diesel and 75% natural gas.
• Another growing interest within the gas gen-sets segment is the popularity of mobile gen-sets. These units are primarily used for backup and standby demand during power interruptions.
Technology Trends
Image Source: FG Wilson Source: Frost & Sullivan
22
Frost & Sullivan takes no responsibility for the incorrect information supplied to us by
manufacturers or users. Quantitative market information is based primarily on interviews
and therefore is subject to fluctuation. Frost & Sullivan research services are limited
publications containing valuable market information provided to a select group of
customers. Our customers acknowledge, when ordering or downloading, that Frost &
Sullivan Research Services are for customers’ internal use and not for general publication
or disclosure to third parties. No part of this Research Service may be given, lent, resold
or disclosed to noncustomers without written permission. Furthermore, no part may be
reproduced, stored in a retrieval system, or transmitted in any form or by any means,
electronic, mechanical, photocopying, recording or otherwise, without the permission of