www.eia.govU.S. Energy Information Administration Independent Statistics & Analysis
Oil and natural gas: market outlook and drivers
for
2016 Intellectual Capital Conference
May 25, 2016 | Baltimore, MD
by
Howard Gruenspecht, Deputy Administrator
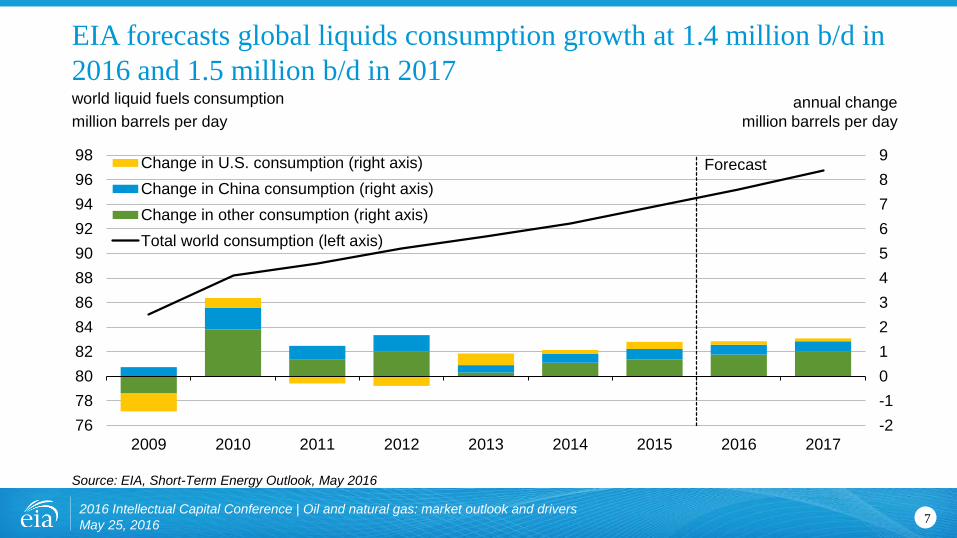
world supply and demand
million barrels per day
implied stock change
million barrels per day
2016 Intellectual Capital Conference | Oil and natural gas: market outlook and drivers
May 25, 2016
Global supply has consistently exceeded demand since the start of 2014;
EIA forecasts a return to market balance in the second half of 2017
Source: EIA, Short-Term Energy Outlook, May 2016
2
Forecast
-3
-2
-1
0
1
2
3
4
5
6
82
84
86
88
90
92
94
96
98
100
2011-Q1 2012-Q1 2013-Q1 2014-Q1 2015-Q1 2016-Q1 2017-Q1
Implied stock change and balance (right axis)
World production (left axis)
World consumption (left axis)
0
20
40
60
80
100
120
Jan Apr Jul Oct Jan Apr Jul Oct Jan Apr Jul Oct Jan Apr Jul Oct Jan Apr Jul Oct
Historical Spot Price
STEO Forecast
NYMEX Futures Price
Current 95% NYMEX futures price confidence interval
2013 2014 2015 2016 2017
WTI price
dollars per barrel
EIA expects WTI oil prices to remain low compared to recent history,
but the market-implied confidence band is very wide
Source: EIA, Short-Term Energy Outlook, May 2016
32016 Intellectual Capital Conference | Oil and natural gas: market outlook and drivers
May 25, 2016
U.S. tight oil production
million barrels of oil per day
U.S. dry shale gas production
billion cubic feet per day
The U.S. has experienced a rapid increase in natural gas and oil
production from shale and other tight resources
Sources: EIA derived from state administrative data collected by DrillingInfo Inc. Data are through February 2016 and represent EIA’s official
tight oil & shale gas estimates, but are not survey data. State abbreviations indicate primary state(s).
42016 Intellectual Capital Conference | Oil and natural gas: market outlook and drivers
May 25, 2016
-2
-1.5
-1
-0.5
0
0.5
1
Q4 Q1 Q2 Q3 Q4 Q1 Q2 Q3 Q4 Q1 Q2 Q3 Q4
2014 2015 2016 2017
Total U.S. Production
Lower 48
Alaska
Federal Gulf of Mexico
U.S. crude oil production growth by area
change from fourth quarter, 2014 (million barrels per day)
Long lead times and past investment are contributing to growth from
the Gulf of Mexico as Lower 48 production declines
Source: EIA, Short-Term Energy Outlook, May 2016
52016 Intellectual Capital Conference | Oil and natural gas: market outlook and drivers
May 25, 2016
Source: EIA, Short-Term Energy Outlook and Drilling Productivity Report, May 2016; International Energy Agency
Crude supply trends outside the United States (red areas below) are key to future
oil market balance: geopolitical developments, exporter decisions, and the timing
and magnitude of supply effects stemming from reduced investment all matter
62016 Intellectual Capital Conference | Oil and natural gas: market outlook and drivers
May 25, 2016
Shale Regions
5.60
Other Lower 480.87
AK0.47GOM
1.66
2016 oil production, million barrels per day
REST OF WORLD
= 72.72
Shale Regions
5.10
Other Lower 480.79
AK0.45GOM
1.85
2017 oil production, million barrels per day
REST OF WORLD
= 72.88
Forecast
-2
-1
0
1
2
3
4
5
6
7
8
9
76
78
80
82
84
86
88
90
92
94
96
98
2009 2010 2011 2012 2013 2014 2015 2016 2017
Change in U.S. consumption (right axis)
Change in China consumption (right axis)
Change in other consumption (right axis)
Total world consumption (left axis)
world liquid fuels consumption
million barrels per day
annual change
million barrels per day
EIA forecasts global liquids consumption growth at 1.4 million b/d in
2016 and 1.5 million b/d in 2017
Source: EIA, Short-Term Energy Outlook, May 2016
72016 Intellectual Capital Conference | Oil and natural gas: market outlook and drivers
May 25, 2016
0
1
2
3
4
5
6
7
Jan-12 Jun-12 Nov-12 Apr-13 Sep-13 Feb-14 Jul-14 Dec-14 May-15 Oct-15 Mar-16
2013 2014 2015 2016 2017
GDP growth in non-OECD countries
annual expectations by date of forecast
Non-OECD economic growth projections, a key driver of oil demand,
have been reduced over the course of recent STEO forecasts
Source: EIA, Short-Term Energy Outlook, May 2016
82016 Intellectual Capital Conference | Oil and natural gas: market outlook and drivers
May 25, 2016
U.S. Outlook
2016 Intellectual Capital Conference | Oil and natural gas: market outlook and drivers
May 25, 20169
0
20
40
60
80
100
120
1980 1990 2000 2010 2020 2030 2040 2020 2030 2040
U.S. primary energy consumption
quadrillion Btu
2016 Intellectual Capital Conference | Oil and natural gas: market outlook and drivers
May 25, 2016
Reductions in energy intensity largely offset effects of economic and
population growth, leading to slow projected growth in energy use
Source: EIA, Annual Energy Outlook 2016
10
29%
9%
16%
36%
8%
Coal
ProjectionsHistory 2015
1%Liquid biofuels
32% of
U.S. total
8%
14%
33%
12%
1%
Projections2015
AEO2016 Reference No CPP
Natural gas
Renewables
Nuclear
Petroleum and other liquids
33%
8%
10%
34%
14%
1%
(excluding biofuels)
Combination of increased tight oil production and higher fuel
efficiency drives projected decline in oil imports
11
0
5
10
15
20
25
1970 1980 1990 2000 2010 2020 2030 2040
U.S. liquid fuels supply
million barrels per day
Note: “Other” includes refinery gain, biofuels production, all stock withdrawals, and other domestic sources of liquid fuels
Source: EIA, Annual Energy Outlook 2016
2016 Intellectual Capital Conference | Oil and natural gas: market outlook and drivers
May 25, 2016
History
Natural gas
plant liquids
Other crude oil production
(excluding tight oil starting in
2000)
Net petroleum and other liquids
imports
23%
25%
24%
Other
17%
Tight oil
production
10%
25%
19%
2020
23%
12%
21%
2015
7%
21%
12%
25%
35%
2040
AEO2016 Reference
In the transportation sector, motor gasoline use declines; diesel fuel, jet
fuel, and natural gas use all grow
12
0
5
10
15
20
25
30
1990 2000 2010 2020 2030 2040
transportation energy consumption by fuel
quadrillion Btu
Source: EIA, Annual Energy Outlook 2016
2016 Intellectual Capital Conference | Oil and natural gas: market outlook and drivers
May 25, 2016
History 2015
58%
Motor gasoline
Jet fuel
CNG/LNG
10%
2%
2%
3%
Other*
Diesel
24%
2030
49%
13%
3%
30%
1%
2040
Ethanol
4%
4%
*Includes aviation gasoline, propane, residual fuel oil,
lubricants, electricity, and liquid hydrogen
14%
44%
31%
5%
AEO2016 Reference
Takeaways – Natural gas
• North American natural gas production is more likely to be limited by demand than
supply
• U.S. natural gas demand growth is likely to be concentrated in electricity and industrial
uses; natural gas exports and use in the transportation sector, where little natural gas
is used today, are also likely to grow
• Potential challenges to natural gas demand growth include
– Slow growth in U.S. electricity demand
– Competition from offshore “stranded” gas for global LNG exports and siting of gas-intensive
industries.
– Long-term cheap oil would be another significant challenge to LNG exports
– Extent and nature of global price convergence in natural gas markets
• Future policies that target particular sources or uses of energy or energy-related
emissions can really matter for future natural gas demand
2016 Intellectual Capital Conference | Oil and natural gas: market outlook and drivers
May 25, 201613
2016 Intellectual Capital Conference | Oil and natural gas: market outlook and drivers
May 25, 2016
Natural gas prices are projected to remain below $5 per million British
thermal units through most of the projection period with or without the Clean
Power Planaverage Henry Hub spot prices for natural gas
2015 dollars per million Btu
14
Source: EIA, Annual Energy Outlook 2016
0
3
6
9
12
2005 2010 2015 2020 2025 2030 2035 2040
AEO2016 Reference
No CPP
AEO2015 Reference
History Projections2015
0
10
20
30
40
50
1980 1985 1990 1995 2000 2005 2010 2015 2020 2025 2030 2035 2040
U.S. energy production and consumption
quadrillion Btu
2016 Intellectual Capital Conference | Oil and natural gas: market outlook and drivers
May 25, 2016
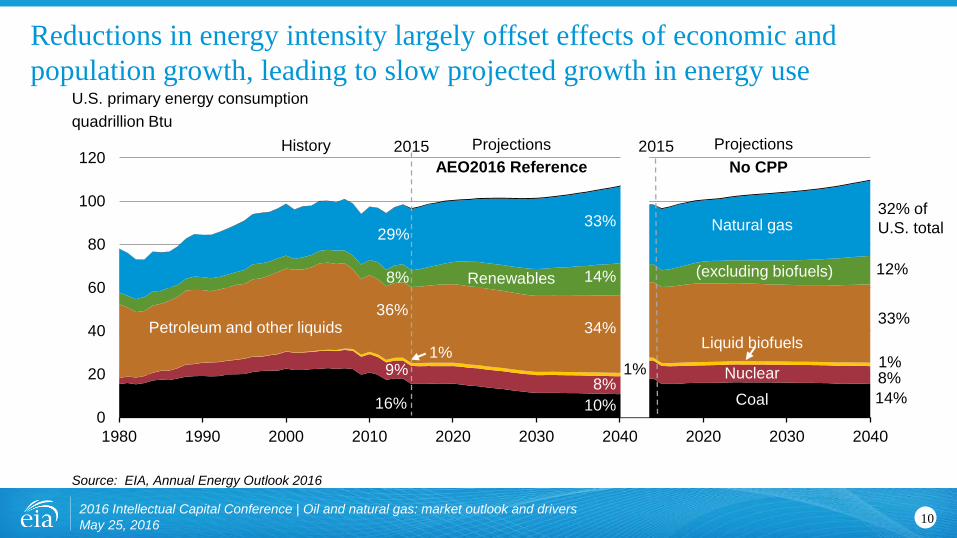
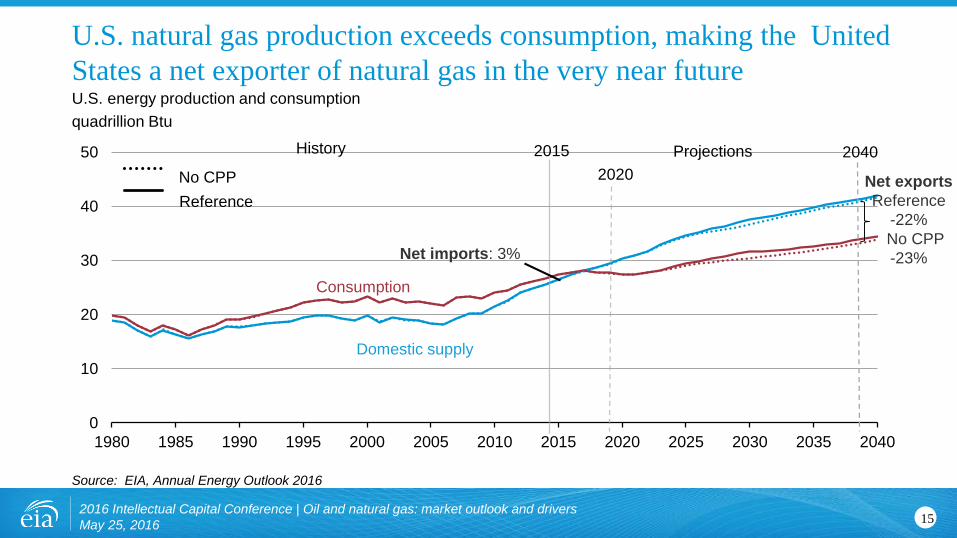
U.S. natural gas production exceeds consumption, making the United
States a net exporter of natural gas in the very near future
Source: EIA, Annual Energy Outlook 2016
15
History Projections2015
Net exports
Reference
-22%
No CPP
-23%
Consumption
Domestic supply
Net imports: 3%
2020
2040
Reference
No CPP
Shale resources remain the dominant source of U.S. natural gas
production growth
16
0
20
40
60
80
100
120
0
5
10
15
20
25
30
35
40
45
1990 2000 2010 2020 2030 2040
U.S. dry natural gas production
trillion cubic feet
Source: EIA, Annual Energy Outlook 2016
2016 Intellectual Capital Conference | Oil and natural gas: market outlook and drivers
May 25, 2016
Tight gas
Coalbed methane
Other lower 48
onshore
Shale gas and
tight oil plays
AlaskaLower 48 offshore
History2015
Projections
AEO2016 Reference
2016 Intellectual Capital Conference | Oil and natural gas: market outlook and drivers
May 25, 2016
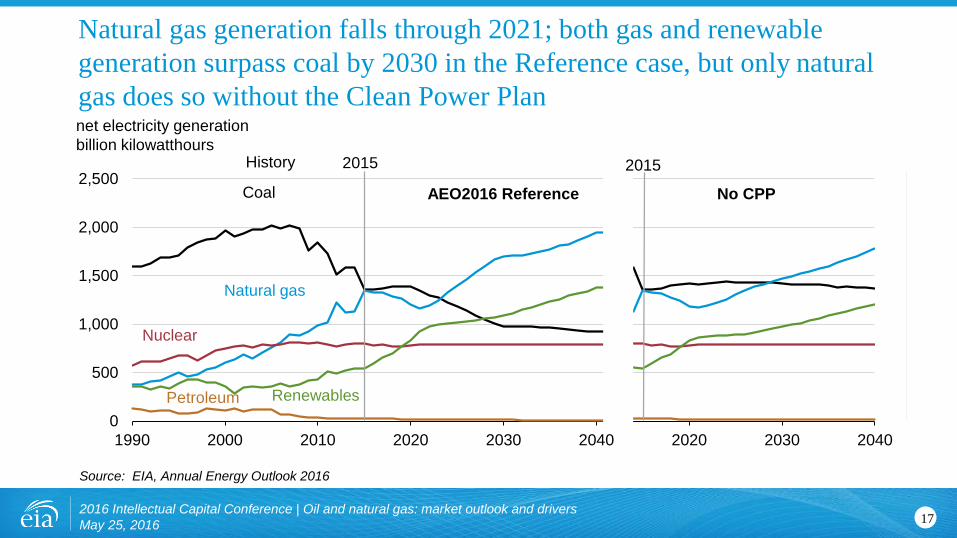
Natural gas generation falls through 2021; both gas and renewable
generation surpass coal by 2030 in the Reference case, but only natural
gas does so without the Clean Power Plan
17
0
500
1,000
1,500
2,000
2,500
1990 2000 2010 2020 2030 2040 2020 2030 2040
AEO2016 Reference No CPP
2015History 2015
Nuclear
Petroleum
Natural gas
Coal
Renewables
net electricity generation
billion kilowatthours
Source: EIA, Annual Energy Outlook 2016
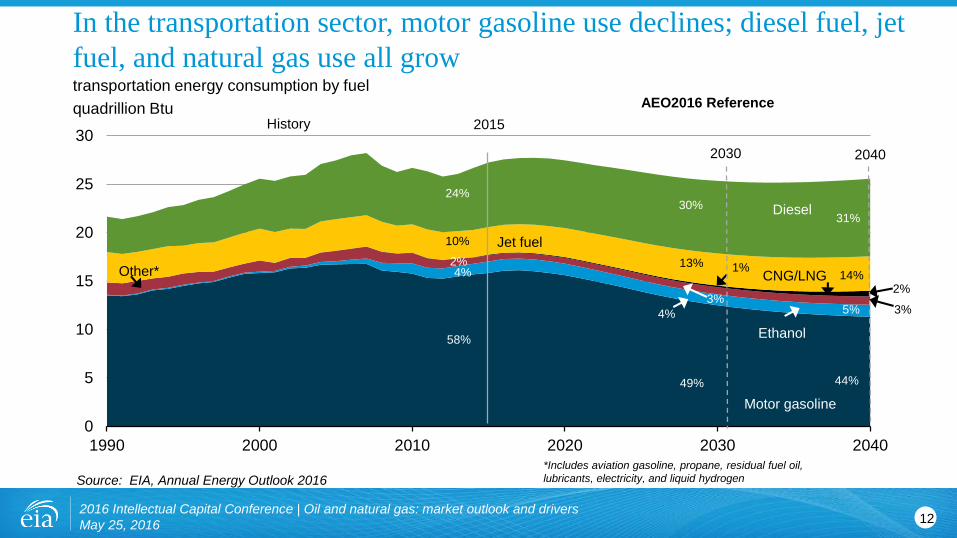
Natural gas consumption growth is led by electricity generation and
industrial uses; natural gas use rises in all sectors except residential
18
0
10
20
30
40
50
60
70
80
90
100
0
5
10
15
20
25
30
35
40
2005 2015 Reference No CPP Reference No CPP Reference No CPP
U.S. dry gas consumption
trillion cubic feet billion cubic feet per day
Source: EIA, Annual Energy Outlook 2016
2016 Intellectual Capital Conference | Oil and natural gas: market outlook and drivers
May 25, 2016
ProjectionsHistory
Electric powerIndustrial*Residential Transportation**
12.6
4.6
1.7
11.2
3.7
9.1
4.6
0.9
9.6
3.2
*Includes combined heat-and-power and lease, plant, and export liquefaction fuel
Commercial
12.5
4.6
1.7
12.0
3.7
20402020 2030
**Includes pipeline fuel
Global crude oil prices
Nominal dollars per barrel, monthly average
2016 Intellectual Capital Conference | Oil and natural gas: market outlook and drivers
May 25, 2016
World oil prices move together due to arbitrage
Sources: Bloomberg, Thomson Reuters
19
select global natural gas and crude oil prices with average monthly LNG prices in Japan
U.S. dollars per million British thermal unit
2016 Intellectual Capital Conference | Oil and natural gas: market outlook and drivers
May 25, 2016
North American natural gas prices are low compared to prices in the
rest of the world, although spreads have narrowed recently
Source: EIA, Bloomberg L.P.
20
Global Energy Outlook
2016 Intellectual Capital Conference | Oil and natural gas: market outlook and drivers
May 25, 201621
Key findings in the IEO2016 Reference case
• World energy consumption increases 48% increase (1.4% compound annual growth rate) between 2012 and 2040. Non-OECD Asia (including China and India) account for more than half of the increase.
• The industrial sector continues to account for the largest share of delivered energy consumption; the world industrial sector still consumes over half of global delivered energy in 2040.
• Renewable energy is the world’s fastest-growing energy source, increasing by 2.6%/year; nuclear energy grows by 2.3%/year, from 4% of the global total in 2012 to 6% in 2040.
• Fossil fuels continue to supply more than three-fourths of world energy use in 2040.
2016 Intellectual Capital Conference | Oil and natural gas: market outlook and drivers
May 25, 201622
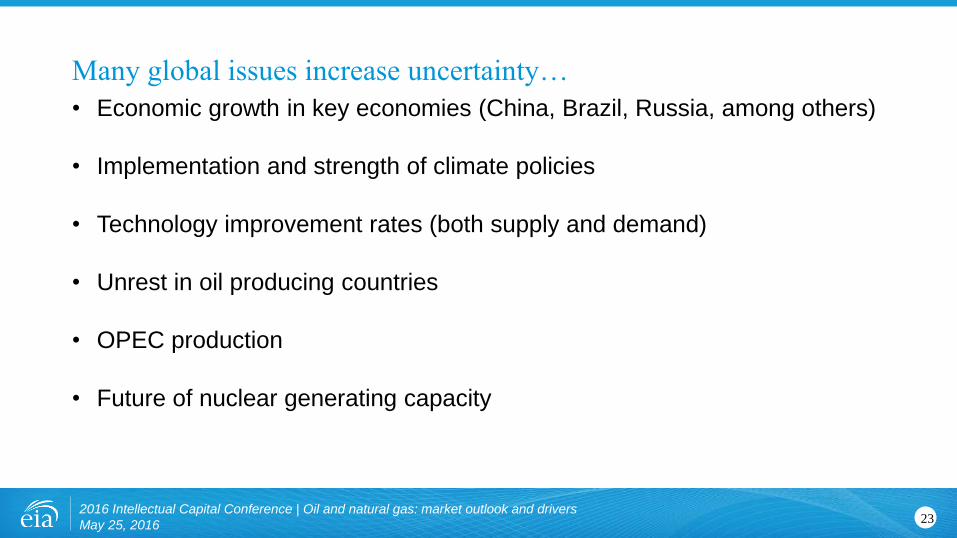
Many global issues increase uncertainty…
• Economic growth in key economies (China, Brazil, Russia, among others)
• Implementation and strength of climate policies
• Technology improvement rates (both supply and demand)
• Unrest in oil producing countries
• OPEC production
• Future of nuclear generating capacity
2016 Intellectual Capital Conference | Oil and natural gas: market outlook and drivers
May 25, 201623
-4
-2
0
2
4
6
U.S. OECDEurope
Japan SouthKorea
China India Brazil MiddleEast
Africa Russia
Energy Intensity GDP per capita Population
average annual percent change (2012–40)
percent per year
2016 Intellectual Capital Conference | Oil and natural gas: market outlook and drivers
May 25, 2016
Economic activity and population drive increases in energy use; energy
intensity (E/GDP) improvements moderate this trend
Source: EIA, International Energy Outlook 2016
24
0
50
100
150
200
250
1990 2000 2010 2020 2030 2040
Coal
Petroleum and other liquid fuels
Natural gas Renewables
Nuclear
Coal with U.S. CPP
Renewables with
U.S. CPP
Share of
total energy
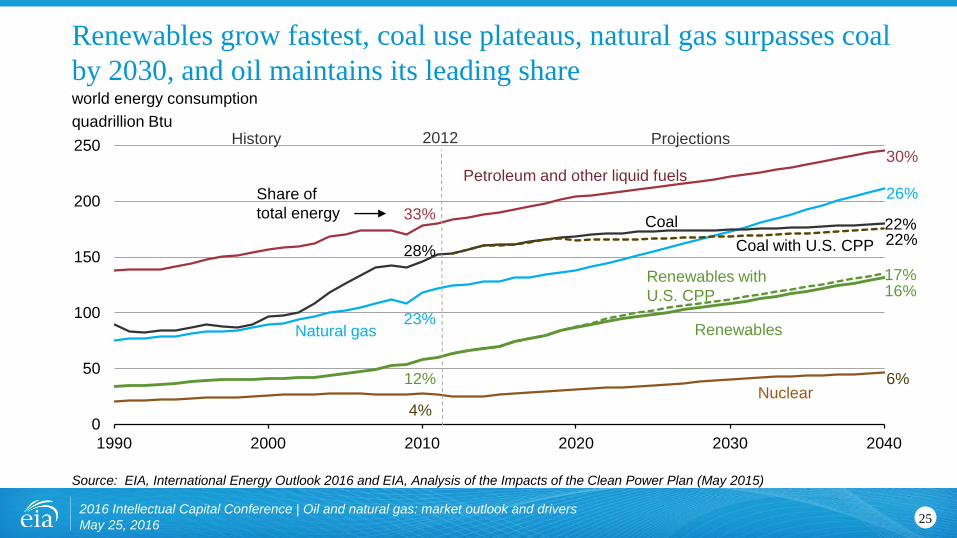
world energy consumption
quadrillion Btu
2016 Intellectual Capital Conference | Oil and natural gas: market outlook and drivers
May 25, 2016
Renewables grow fastest, coal use plateaus, natural gas surpasses coal
by 2030, and oil maintains its leading share
Source: EIA, International Energy Outlook 2016 and EIA, Analysis of the Impacts of the Clean Power Plan (May 2015)
25
History Projections2012
33%
30%
28%
22%
23%
26%
12%
17%
4%
6%
22%
16%
40
50
60
70
1990 2000 2010 2020 2030 2040
Non-OECD
OECD
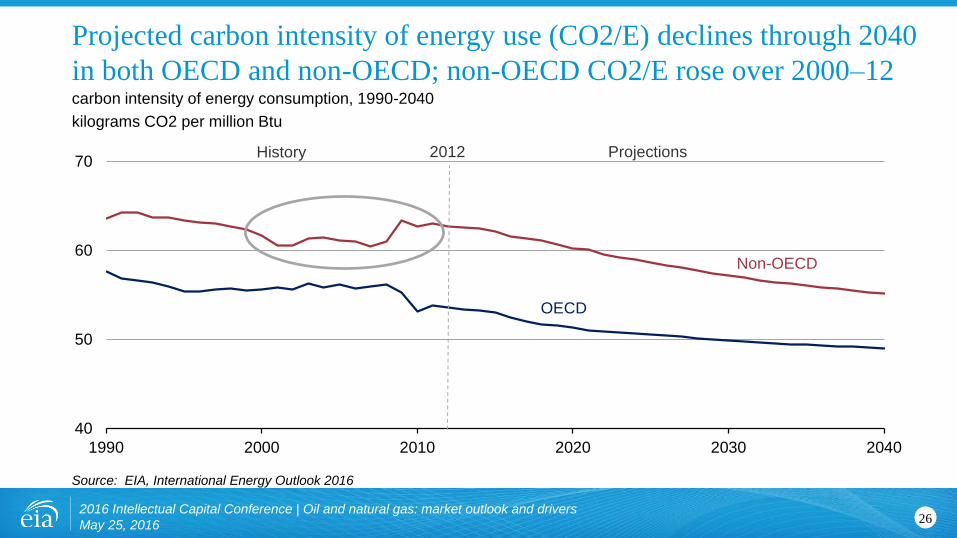
carbon intensity of energy consumption, 1990-2040
kilograms CO2 per million Btu
2016 Intellectual Capital Conference | Oil and natural gas: market outlook and drivers
May 25, 2016
Projected carbon intensity of energy use (CO2/E) declines through 2040
in both OECD and non-OECD; non-OECD CO2/E rose over 2000–12
Source: EIA, International Energy Outlook 2016
26
History Projections2012
-1
1
3
5
7
9
1990 2000 2010 2020 2030 2040
Non-OECD electricity
Non-OECD GDP
OECD GDP
OECD electricity
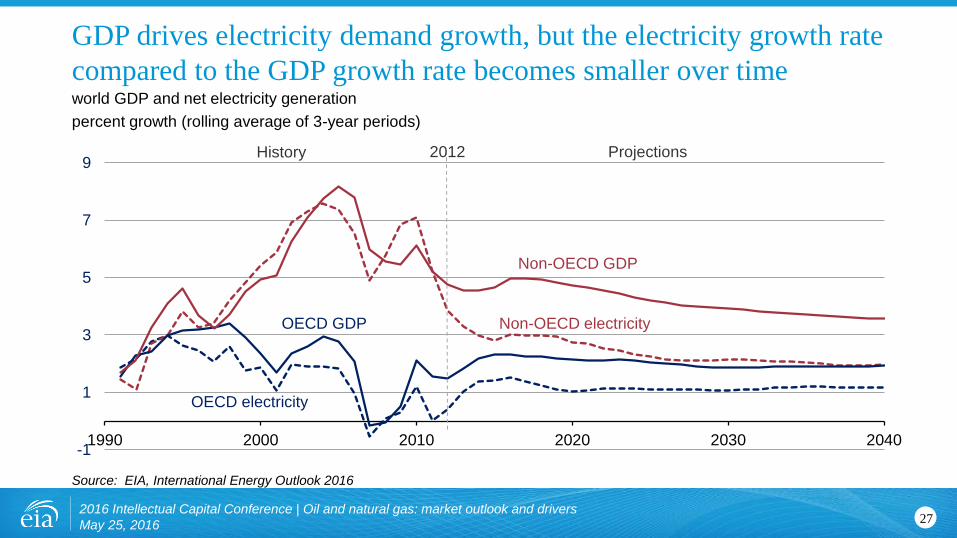
world GDP and net electricity generation
percent growth (rolling average of 3-year periods)
2016 Intellectual Capital Conference | Oil and natural gas: market outlook and drivers
May 25, 2016
GDP drives electricity demand growth, but the electricity growth rate
compared to the GDP growth rate becomes smaller over time
Source: EIA, International Energy Outlook 2016
27
History Projections2012
0
10
20
30
40
2012 2020 2025 2030 2035 2040
world net electricity generation by source
trillion kilowatthours
2016 Intellectual Capital Conference | Oil and natural gas: market outlook and drivers
May 25, 2016
Renewables, natural gas, and coal all contribute roughly the same
amount of global net electricity generation in 2040
Source: EIA, International Energy Outlook 2016
28
Liquids
Other renewables
Natural gas
Coal
Nuclear
Hydropower
passenger-miles per capita (left-axis) and GDP per capita (horizontal-axis) for
selected country groupings 2010–40
2016 Intellectual Capital Conference | Oil and natural gas: market outlook and drivers
May 25, 2016
Passenger-miles per person will rise as GDP per capita grows; travel
growth is largely outside the OECD
Source: EIA, International Energy Outlook 2016
29
0
2,000
4,000
6,000
8,000
10,000
12,000
$0 $10,000 $20,000 $30,000 $40,000 $50,000 $60,000
OECD
China
Other
non-OECD Asia
Africa
India
0 10 20 30 40
OECD Europe
OECD Asia
OECD Americas
Africa
Non-OECD Europe and Eurasia
Non-OECD Americas
Middle East
Non-OECD Asia
2012
2020
2040
world petroleum and other liquid fuels consumption
million barrels per day
2016 Intellectual Capital Conference | Oil and natural gas: market outlook and drivers
May 25, 2016
Most of the growth in world oil consumption occurs in the non-OECD
regions — especially Asia
Source: EIA, International Energy Outlook 2016
30
0
10
20
30
40
50
60
2000 2010 2020 2030 2040
Non-OPEC crude and lease condensate
OPEC crude and lease condensate
Other liquids
world production of petroleum and other liquid fuels
million barrels per day
2016 Intellectual Capital Conference | Oil and natural gas: market outlook and drivers
May 25, 2016
Liquid fuels supplies from both OPEC and non-OPEC producers
increase through 2040
Source: Current thinking
31
History Projections2012
Actual Current Thinking
1973–85 2000–12 2013–25
World Liquids Demand +3 +12 +9 to +13
OECD -4 -2 -2 to 0
Non-OECD +7 +15 +11 to +13
World Liquids Supply -1 +12 +9 to +13
Non-OPEC Supply +13 + 6 + 9 to +12
OPEC Production -14 + 6 -3 to +4
LONGER TERM PERSPECTIVE: Can OPEC cohere? – Change in
world liquid fuel balances for two 12-year historical periods with EIA
projections for 2013-25 (million barrels per day)
322016 Intellectual Capital Conference | Oil and natural gas: market outlook and drivers
May 25, 2016
world natural gas consumption
trillion cubic feet
2016 Intellectual Capital Conference | Oil and natural gas: market outlook and drivers
May 25, 2016
Non-OECD nations account for ¾ of projected growth in natural gas
consumption
Source: Current Thinking
33
0
30
60
90
120
150
2012 2020 2025 2030 2035 2040
OECD Non-OECD
0 5 10 15 20
Other OECD
Non-OECD Europe and Eurasia
Other non-OECD
OECD Americas
Middle East
Non-OECD Asia
China Other
Other
Other
Other
Iran Saudi Arabia
United States
Russia
world change in natural gas production, 2012–40
trillion cubic feet
2016 Intellectual Capital Conference | Oil and natural gas: market outlook and drivers
May 25, 2016
Non-OECD Asia, Middle East, and OECD Americas account for the
largest increases in natural gas production
Source: EIA, International Energy Outlook 2016
34
0
10
20
30
40
2012 2040 2012 2040 2012 2040
natural gas production by type
trillion cubic feet
2016 Intellectual Capital Conference | Oil and natural gas: market outlook and drivers
May 25, 2016
Shale gas, tight gas, and coalbed methane become increasingly important
to gas supplies, not only for the U.S., but also China and Canada
Note: Other natural gas includes natural gas produced from structural and stratigraphic traps (e.g. reservoirs), historically referred to as
‘conventional’ production.
Source: Current thinking
35
China Canada
Shale gas
Other gas
United States
Coalbed methane
Tight gas
For more informationU.S. Energy Information Administration home page | www.eia.gov
Annual Energy Outlook | www.eia.gov/aeo
Short-Term Energy Outlook | www.eia.gov/steo
International Energy Outlook | www.eia.gov/ieo
Monthly Energy Review | www.eia.gov/mer
Today in Energy | www.eia.gov/todayinenergy
International Energy Portal | www.eia.gov/beta/international/?src=home-b1
362016 Intellectual Capital Conference | Oil and natural gas: market outlook and drivers
May 25, 2016