16
Remarks by Marianne Kah Chief Economist Oil and Natural Gas Outlook: Implications for Alaska The Alliance – Meet Alaska January 9, 2015

Remarks by Marianne Kah
Chief Economist
Oil and Natural Gas Outlook: Implications for Alaska The Alliance – Meet Alaska
January 9, 2015

Cautionary Statement
The following presentation includes forward-looking statements. These statements relate to future events, such as anticipated revenues, earnings, business strategies, competitive position or other aspects of our operations or operating results or the industries or markets in which we operate or participate in general. Actual outcomes and results may differ materially from what is expressed or forecast in such forward-looking statements. These statements are not guarantees of future performance and involve certain risks, uncertainties and assumptions that may prove to be incorrect and are difficult to predict such as oil and gas prices; operational hazards and drilling risks; potential failure to achieve, and potential delays in achieving expected reserves or production levels from existing and future oil and gas development projects; unsuccessful exploratory activities; unexpected cost increases or technical difficulties in constructing, maintaining or modifying company facilities; international monetary conditions and exchange controls; potential liability for remedial actions under existing or future environmental regulations or from pending or future litigation; limited access to capital or significantly higher cost of capital related to illiquidity or uncertainty in the domestic or international financial markets; general domestic and international economic and political conditions, as well as changes in tax, environmental and other laws applicable to ConocoPhillips’ business and other economic, business, competitive and/or regulatory factors affecting ConocoPhillips’ business generally as set forth in ConocoPhillips’ filings with the Securities and Exchange Commission (SEC). We caution you not to place undue reliance on our forward-looking statements, which are only as of the date of this presentation or as otherwise indicated, and we expressly disclaim any responsibility for updating such information.
Use of non-GAAP financial information – This presentation may include non-GAAP financial measures, which help facilitate comparison of company operating performance across periods and with peer companies. Any non-GAAP measures included herein will be accompanied by a reconciliation to the nearest corresponding GAAP measure in an appendix.
Cautionary Note to U.S. Investors – The SEC permits oil and gas companies, in their filings with the SEC, to disclose only proved, probable and possible reserves. We use the term "resource" in this presentation that the SEC’s guidelines prohibit us from including in filings with the SEC. U.S. investors are urged to consider closely the oil and gas disclosures in our Form 10-K and other reports and filings with the SEC. Copies are available from the SEC and from the ConocoPhillips website.
January 9, 2015 2
Challenging Oil and Natural Gas Outlook
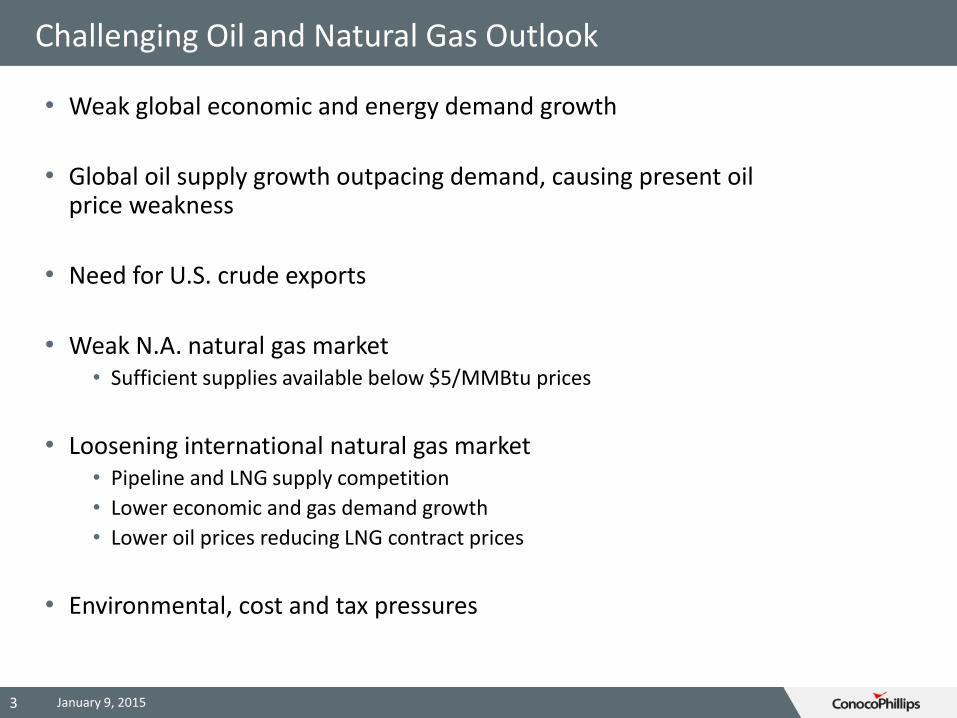
• Weak global economic and energy demand growth
• Global oil supply growth outpacing demand, causing present oil price weakness
• Need for U.S. crude exports
• Weak N.A. natural gas market • Sufficient supplies available below $5/MMBtu prices
• Loosening international natural gas market • Pipeline and LNG supply competition
• Lower economic and gas demand growth
• Lower oil prices reducing LNG contract prices
• Environmental, cost and tax pressures
January 9, 2015 3

2.5%
3.0%
3.5%
4.0%
4.5%
5.0%
IMF’s Global GDP Growth
------------------------------ Date of Forecast -----------------------------
Apr. 2011
Sep. 2011
Apr. 2012
Oct. 2012
Apr. 2013
Oct. 2013
Apr. 2014
Oct. 2014
Downward Revisions to Global Economic Growth Forecasts
Downward revision has been a constant theme
2012
2013 2014
2015
Percent
4
Source: IMF semi-annual forecasts
January 9, 2015

Brent Crude Market Outlook
5
0
0.2
0.4
0.6
0.8
1
1.2
1.4
1.6
1.8
2
0.0
0.2
0.4
0.6
0.8
1.0
1.2
1.4
1.6
1.8
2.0
2014 2015 2016$50
$70
$90
$110
$130
$150
2014 2015 2016 2017 2018 2019 2020
Expert Range
Global Oil Demand vs. Non-OPEC Supply Growth
Mill
ion
Bar
rels
pe
r D
ay
Demand
Non-OPEC Supply
U.S.
Other Market Brent Price Outlook
Re
al 2
01
4 D
olla
rs p
er
Bar
rel
Source: IEA 12/14 Monthly & Medium Term, U.S. includes NGLs Notes: 2014 Brent price is annual average; Futures from 1/5/2015
$40
$60
$80
$100
$120
$140
2007 2008 2009 2010 2011 2012 2013 2014
Historical Brent Crude Price
Stable range until recently
Do
llar
s p
er
Bar
rel
Recent weakness in economic and oil demand growth lowered prices
Futures
January 9, 2015

U.S. Oil Production is Set to Expand
Source: Rystad Energy Upstream Database
0
2
4
6
8
10
12
14
16
18
2005 2010 2015 2020 2025 2030
Mill
ion
Bar
rels
pe
r D
ay
Conventional Production
U.S. Tight Oil
NGLs
Alaska Crude
EIA’s High Resource Case
U.S. Crude, Condensate, Natural Gas Liquids Forecast
Source: U.S. Department of Energy, EIA Annual Energy Outlook 2014, various forecasts
Liquids production has returned to levels not seen since 1972
6 January 9, 2015

Oil & Gas Has Spurred Growth in the Broader U.S. Economy
4%
5%
6%
7%
8%
9%
10%
2007 2008 2009 2010 2011 2012 2013 2014
U.S. Unemployment Rate
Source: U.S. Bureau of Labor Statistics.
Energy production prevented U.S. downturn from being worse, and spurred recovery
0.9
1.0
1.1
1.2
1.3
1.4
1.5
1.6
1.7
2007 2008 2009 2010 2011 2012 2013 2014
Oil and Gas Sector Expanded While Other Sectors Lagged Index of Job Growth: Jan. 2007 = 1.0
Oil and Gas Sector Jobs +67%
Total Private Sector +2%
Source: U.S. Bureau of Labor Statistics (Total Private Sector Jobs, NAICS 211000 and 213112).
7
-12%
-10%
-8%
-6%
-4%
-2%
0%
2%
1998 2000 2002 2004 2006 2008 2010 2012 2014
Manufacturing Employment Reversed a 12-year Decline (Annual % change)
January 9, 2015

In-Migration of Manufacturing: U.S. Industrial “Re-shoring”
China
U.S.
30
35
40
45
50
55
60
2008 2009 2010 2011 2012 2013 2014
Below 50 = Contraction
11.4
11.8
12.2
12.6
13.0
13.4
13.8
2008 2009 2010 2011 2012 2013 2014
Source: Markit Source: U.S. Bureau of Labor Statistics
U.S. Manufacturing PMI Consistently Ahead vs. China Since Early 2011
Above 50 = Expansion
8
Affordable energy has given U.S. industry a competitive advantage
January 9, 2015
Millions Index
U.S. Manufacturing Employment: Gained about 750,000 Jobs Since 2010

Changing Pattern of U.S. Crude Imports
(2)
0
2
4
6
8
10
2010 2012 2014 2016 2018 2020 2022
Exports and/or refinery
additions required
Heavy
Medium
Light Sour
Light Sweet
Light Sweet
Source: U.S. Department of Energy, EIA; Turner, Mason & Co.
• Declining light, sweet crude imports, with year round exports needed by 2017 • Condensates and super light
crudes are already in surplus • Seasonal exports needed before
then during U.S. refinery turnarounds / outages
• Eventual reductions in light, sour
and medium crude imports
• U.S. likely to maintain heavy crude imports that better matches domestic refinery configuration
Need for exports of surplus light, sweet crudes
9 January 9, 2015
U.S. Crude Imports/(Exports)
Million Barrels per Day

Case for ANS Crude Exports
West Coast imports of ANS face stiffer competition from Lower-48, Canada & South America
10
Do
llars
per
Bar
rel
Rail Unloading Capacity on West Coast
Current West Coast rail unloading capacity ~300 MBD Could reach 1250 MBD capacity by end-2016
Source: ConocoPhillips, Various; Platts for prices
Puget Sound 110 MBD Currently Operating +120 MBD Planned
Portland/SW WA 60 MBD Currently Operating +300 MBD Planned
San Francisco Area 39 MBD Currently Operating +280 MBD Planned
Bakersfield Area 28 MBD Currently Operating +250 MBD Planned
L.A. Area 72 MBD Currently Operating
-10
-5
0
5
2010 2011 2012 2013 2014 2015
ANS (Long Beach) - Brent Price Differential
January 9, 2015
-5
0
5
10
15
20
25
30
2010 2011 2012 2013 2014 2015
ANS (Long Beach) - WTI Price Differential
Do
llars
pe
r B
arre
l
ANS premium to WTI dissipating
ANS falling relative to Brent

Ability to Export L48 Crude Would Increase U.S. Oil Production
• Lifting the ban on U.S. Lower 48 crude exports would increase production by 1.5 to 3.0 MMBD by 2020
• 10-20% increase
• Removing domestic crude price discounts caused by the ban would increase investment in new production
• More wells and plays would become economic
• Increased cash flow to invest
0.0
0.5
1.0
1.5
2.0
2.5
3.0
3.5
2015 2020
Reference
HighResource
Source: NERA prepared for Brookings Institution, “Economic Benefits of Lifting the Crude Oil Export Ban,” Sept. 9, 2014.
Incremental U.S. Crude Production from Lifting Export Ban in 2015
Million Barrels per Day
Increased production comes with significant economic benefits to the U.S.
11 January 9, 2015
Benefits of U.S. Crude Oil Exports
• Would lower consumer fuel costs at the pump by $18 billion annually
• U.S. economy could gain $135 billion and about one million jobs at its peak
• Reduce nation’s oil import bill by $67 billion annually
• Increase government revenues by $1.3 trillion between 2016-2030
• Strengthen U.S. geopolitical position
More jobs & economic development would result from continued growth in U.S. oil production
Source: IHS Global Inc., “U.S. Crude Oil Export Decision: Assessing the Impact of the Export Ban and Free Trade on the U.S. Economy,” May 29, 2014
12 January 9, 2015

Gasoline Prices Are Set Globally by International Crude Prices
0.0
1.0
2.0
3.0
4.0
2009 2010 2011 2012 2013 2014
U.S. Gulf
New York
N.W. Europe
Singapore
40
60
80
100
120
140
2009 2010 2011 2012 2013 2014
U.S. Gulf
New York
Brent
WTI
Spot Gasoline Prices
U.S. Gasoline Prices vs. International & Domestic Crude Prices
Refined product prices around the world track each other demonstrating
that US gasoline prices are set globally.
Refined product prices more closely track international crude prices (Brent) than US domestic crude prices (WTI).
U.S. crude exports should lower U.S. gasoline prices Source: Bloomberg
13 January 9, 2015
Dollars per Gallon Dollars per Barrel

U.S. LNG Exports
Japan LNG
U.K. Spot
U.S.
0
2
4
6
8
10
12
14
16
18
20
20
04
20
05
20
06
20
07
20
08
20
09
20
10
20
11
20
12
20
13
20
14
No
min
al $
/MM
btu
Wide Divergence Between Pricing in Major Markets
Source: Bloomberg; U.S. Department of Energy, EIA, AEO 2005-2014
14
2005
2007
2008
2010
2013
(10)
(5)
0
5
10
15
20
2010 2015 2020 2025
Net Exporter
2014
Net Importer
Historical U.S. Department of Energy Projections
Bill
ion
Cu
bic
Fe
et p
er
Day
U.S. is poised to become an LNG exporter
January 9, 2015

Alaska Activities Announced Since Tax reform (SB21) Passed
• Added two rigs to the Kuparuk rig fleet
• Investment has decreased Kuparuk Unit
field decline from 7% to 1%
• Two new-build rigs are on order – deliver 2016
• Rotary rig Doyon 142
• Coil tubing drill rig Nabors CDR-3
• New Drill site at Kuparuk (DS-2S) – Approved October 2014
• Evaluating plans for additional development in NPRA (GMT-1)
• In dialogue with Federal Government for acceptable terms
• Pre-engineering for viscous oil expansion in Kuparuk (1H NEWS)
*Gross dollars
15 January 9, 2015
Implications for Alaska
• Alaska North Slope oil needs to be cost competitive, especially in today’s low oil price environment
• ANS crude export option driven by increased flows of competing crude oils to the U.S. West Coast
• Relatively low natural gas prices in Lower 48 makes those LNG projects competitive and they are helping set global LNG prices
• With stiff competition, Alaska LNG needs to be competitive with regard to cost and fiscal terms
January 9, 2015 16


