22 July 2015 1 Harshad Borawake ([email protected]); +91 22 3982 5432 OMCs in new era; transforming from cyclical to structural plays Increasing valuation multiples, revised fair values imply 26-34% upsides OMCs are set to transform into structural investment plays. The twin tailwinds of oil sector reforms and low oil prices should boost earnings and valuations. OMCs’ economic moat is widening, led by (1) scope for meaningful increase in marketing margin and profitability, (2) slower ramp-up by private marketers, (3) high volume growth, aided by expected GDP boost, and (4) improving balance sheet. This should lend greater predictability and sustainability to earnings. OMC stocks have risen sharply (up 33-120%) in the last one year, backed by higher earnings. However, re-rating is pending, in our view. OMCs’ EV has grown just 16-60% against an expected 140-220% increase in profits by FY16. We increase our valuation multiple as we expect marketing business to command higher valuations as pricing freedom will improve profitability meaningfully. We assign EV/EBITDA multiple of 5.5-6x for refining and 8x for marketing (v/s 6x earlier for overall EBITDA), resulting in 26-34% upside in OMC’s. Our revised fair value estimates are INR1,170 for HPCL (34% upside), INR1,206 for BPCL (26% upside), and INR574 for IOCL (29% upside). Maintain Buy. Decadal policy inaction corrected; macros to support in medium term Marred by under-recoveries, oil marketing companies’ (OMCs) profit/market cap share dropped from a high of 25%/40% in FY04 to 9%/17% in FY15. We expect this gap to reduce, led by (a) recent auto fuel deregulation, with LPG and kerosene reforms, and (b) supportive macro environment. Recent crude price correction is akin to 1986, when OPEC hiked production to protect market share. Capex cuts by E&P companies have sowed seeds for future price rise. However, shale oil’s short discovery-to-production period and improving economics will elongate market share battle, keeping oil prices subdued in the medium term, in our view. OMCs’ earnings to increase, become more predictable; re-rating inevitable Auto fuel deregulation is a significant reform, as (a) it gives pricing power to OMCs, (b) frees OMCs’ working capital and reduces fiscal burden on government/upstream, and (c) promotes efficiency, with private player entry. This reform will not only increase and make OMCs’ earnings more predictable, but also help them tide over extreme inventory and refining margin volatility. While we expect OMCs’ earnings to grow 140-220% by FY16, their EVs have moved up just 16-60% in the last two years. They should re-rate in line with structural positives like (a) pricing power, (b) near monopoly status, (c) steady volume growth, and (d) strengthening balance sheets and high payouts. OMCs well poised to benefit from likely petroleum market evolution We expect PSU OMC’s to benefit in shift from ‘regulated deregulation’ to ‘deregulation’ era due to its infrastructure reach and scale along with at-par retail outlet service levels. OMCs’ profit normalization has entered phase-2. In phase-1, interest cost reduction had driven profits; in phase-2, higher marketing margins and operational efficiencies are likely to drive profits. Of the three OMCs, HPCL provides highest upside led by its high sensitivity to marketing margins, while BPCL which has multiple triggers, stands out for its superior return ratios. Oil & Gas Sector Update | 22 July 2015 BPCL: Financial & Valuation (INR b) Consolidated Y/E Mar 2015 2016E 2017E Sales 2,424 2,459 2,445 EBITDA 96.0 103.3 112.0 Adj. PAT 48.1 54.7 58.8 Adj. EPS(INR) 66.5 75.6 81.3 EPS Gr. (%) 22.9 13.7 7.5 BV/Sh(INR) 310.4 356.8 407.7 RoE (%) 23.0 22.7 21.3 RoCE (%) 17.2 19.0 18.5 Payout* % 35.1 38.7 37.4 Valuation P/E (x) 14.3 12.6 11.7 P/BV (x) 3.1 2.7 2.3 EV/EBITDA x 9.0 8.3 7.9 Div. Yld (%) 2.3 2.7 2.8 *Based on standalone HPCL: Financial & Valuation (INR b) Y/E March 2015 2016E 2017E Sales 2,064 1,724 1,861 EBITDA 54.2 59.9 66.0 Adj. PAT 27.3 29.0 31.8 Adj. EPS (INR) 80.6 85.4 93.7 EPS Gr. (%) 57.6 5.9 9.7 BV/Sh.(INR) 473 518 579 RoE (%) 17.6 17.2 17.1 RoCE (%) 11.0 12.8 13.0 Payout (%) 35.6 35.6 35.1 Valuations P/E (x) 10.9 10.2 9.3 P/BV (x) 1.9 1.7 1.5 EV/EBITDA (x) 7.3 6.4 5.7 Div. Yield (%) 2.8 3.0 3.2 IOCL: Financial & Valuation (INR b) Y/E March 2015 2016E 2017E Sales 4,483 3,283 3,682 EBITDA 93.4 216.0 241.6 Adj. PAT 32.4 108.4 124.8 AdjEPS(INR) 13.4 44.7 51.4 EPS Gr. (%) -39.2 234.3 15.1 BV/Sh.(INR) 294 322 374 RoE (%) 4.7 14.5 14.8 RoCE (%) 6.3 14.4 14.5 Payout (%) 41.0 37.7 37.4 Valuations P/E (x) 32.8 9.8 8.5 P/BV (x) 1.5 1.4 1.2 EV/EBITDAx 16.1 6.8 5.8 Div. Yld (%) 1.1 3.2 3.6 Investors are advised to refer through disclosures made at the end of the Research Report. Motilal Oswal research is available on www.motilaloswal.com/Institutional-Equities , Bloomberg, Thomson Reuters, Factset and S&P Capital. Motilal Oswal values your support in the Asiamoney Brokers Poll 2015 for India Research, Sales and Trading team. We request your ballot .
OMCs in new era; transforming from cyclical to structural plays Increasing valuation multiples, revised fair values imply 26-34% upsides
OMCs are set to transform into structural investment plays. The twin tailwinds of oil sector reforms and low oil prices should boost earnings and valuations.
OMCs’ economic moat is widening, led by (1) scope for meaningful increase in marketing margin and profitability, (2) slower ramp-up by private marketers, (3) high volume growth, aided by expected GDP boost, and (4) improving balance sheet. This should lend greater predictability and sustainability to earnings.
OMC stocks have risen sharply (up 33-120%) in the last one year, backed by higher earnings. However, re-rating is pending, in our view. OMCs’ EV has grown just 16-60% against an expected 140-220% increase in profits by FY16.
We increase our valuation multiple as we expect marketing business to command higher valuations as pricing freedom will improve profitability meaningfully. We assign EV/EBITDA multiple of 5.5-6x for refining and 8x for marketing (v/s 6x earlier for overall EBITDA), resulting in 26-34% upside in OMC’s.
Our revised fair value estimates are INR1,170 for HPCL (34% upside), INR1,206 for BPCL (26% upside), and INR574 for IOCL (29% upside). Maintain Buy.
Decadal policy inaction corrected; macros to support in medium term Marred by under-recoveries, oil marketing companies’ (OMCs) profit/market
cap share dropped from a high of 25%/40% in FY04 to 9%/17% in FY15. We expect this gap to reduce, led by (a) recent auto fuel deregulation, with LPG
and kerosene reforms, and (b) supportive macro environment. Recent crude price correction is akin to 1986, when OPEC hiked production to
protect market share. Capex cuts by E&P companies have sowed seeds for future price rise. However, shale oil’s short discovery-to-production period and improving economics will elongate market share battle, keeping oil prices subdued in the medium term, in our view.
OMCs’ earnings to increase, become more predictable; re-rating inevitable Auto fuel deregulation is a significant reform, as (a) it gives pricing power to
OMCs, (b) frees OMCs’ working capital and reduces fiscal burden on government/upstream, and (c) promotes efficiency, with private player entry.
This reform will not only increase and make OMCs’ earnings more predictable, but also help them tide over extreme inventory and refining margin volatility.
While we expect OMCs’ earnings to grow 140-220% by FY16, their EVs have moved up just 16-60% in the last two years. They should re-rate in line with structural positives like (a) pricing power, (b) near monopoly status, (c) steady volume growth, and (d) strengthening balance sheets and high payouts.
OMCs well poised to benefit from likely petroleum market evolution We expect PSU OMC’s to benefit in shift from ‘regulated deregulation’ to
‘deregulation’ era due to its infrastructure reach and scale along with at-par retail outlet service levels.
OMCs’ profit normalization has entered phase-2. In phase-1, interest cost reduction had driven profits; in phase-2, higher marketing margins and operational efficiencies are likely to drive profits. Of the three OMCs, HPCL provides highest upside led by its high sensitivity to marketing margins, while BPCL which has multiple triggers, stands out for its superior return ratios.
Investors are advised to refer through disclosures made at the end of the Research Report. Motilal Oswal research is available on www.motilaloswal.com/Institutional-Equities, Bloomberg, Thomson Reuters, Factset and S&P Capital.
Motilal Oswal values your support in the Asiamoney Brokers Poll 2015 for India
Research, Sales and Trading team. We request your ballot.
Decadal policy inaction corrected; expect macro support Under-recoveries to be non-issue; with likely subdued oil, subsidy reforms
Marred by under-recoveries, oil marketing companies’ (OMCs) profit/market cap share dropped from a high of 25%/40% in FY04 to 9%/17% in FY15.
We expect this gap to reduce, led by (a) recent auto fuel deregulation, with LPG and kerosene reforms, and (b) supportive macro environment.
Recent crude price correction is akin to 1986, when OPEC hiked production to protect market share. Capex cuts by E&P companies have sowed seeds for future price rise. However, shale oil’s short discovery-to-production period and improving economics will elongate market share battle, keeping oil prices subdued in the medium term, in our view.
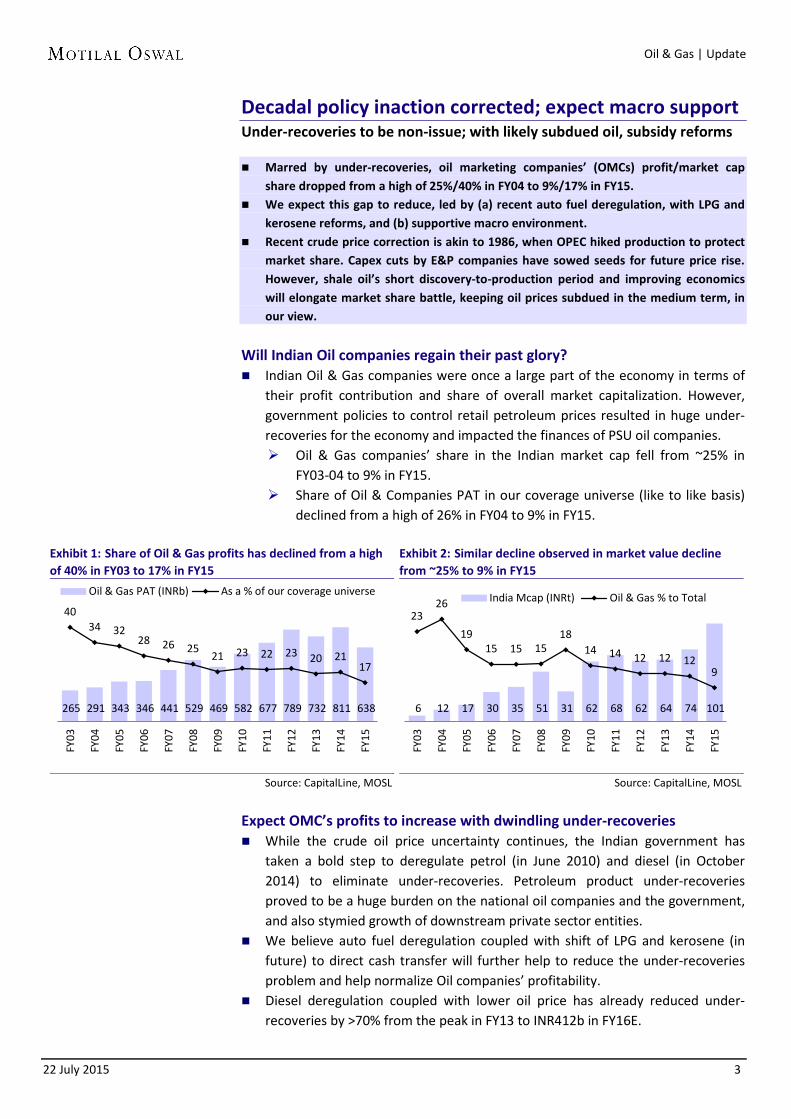
Will Indian Oil companies regain their past glory? Indian Oil & Gas companies were once a large part of the economy in terms of
their profit contribution and share of overall market capitalization. However, government policies to control retail petroleum prices resulted in huge under-recoveries for the economy and impacted the finances of PSU oil companies. Oil & Gas companies’ share in the Indian market cap fell from ~25% in
FY03-04 to 9% in FY15. Share of Oil & Companies PAT in our coverage universe (like to like basis)
declined from a high of 26% in FY04 to 9% in FY15.
Exhibit 1: Share of Oil & Gas profits has declined from a high of 40% in FY03 to 17% in FY15
Source: CapitalLine, MOSL
Exhibit 2: Similar decline observed in market value decline from ~25% to 9% in FY15
Source: CapitalLine, MOSL
Expect OMC’s profits to increase with dwindling under-recoveries While the crude oil price uncertainty continues, the Indian government has
taken a bold step to deregulate petrol (in June 2010) and diesel (in October 2014) to eliminate under-recoveries. Petroleum product under-recoveries proved to be a huge burden on the national oil companies and the government, and also stymied growth of downstream private sector entities.
We believe auto fuel deregulation coupled with shift of LPG and kerosene (in future) to direct cash transfer will further help to reduce the under-recoveries problem and help normalize Oil companies’ profitability.
Diesel deregulation coupled with lower oil price has already reduced under-recoveries by >70% from the peak in FY13 to INR412b in FY16E.
Oil & Gas PAT (INRb) As a % of our coverage universe
6 12 17 30 35 51 31 62 68 62 64 74 101
23 26
19 15 15 15
18 14 14 12 12 12
9
FY03
FY04
FY05
FY06
FY07
FY08
FY09
FY10
FY11
FY12
FY13
FY14
FY15
India Mcap (INRt) Oil & Gas % to Total
22 July 2015 4
Oil & Gas | Update
Directionally, we believe that Indian Oil & Gas companies are set for continued profitable growth backed by normalized profit and underlying volume growth, supported by the likely uptick in the domestic economy.
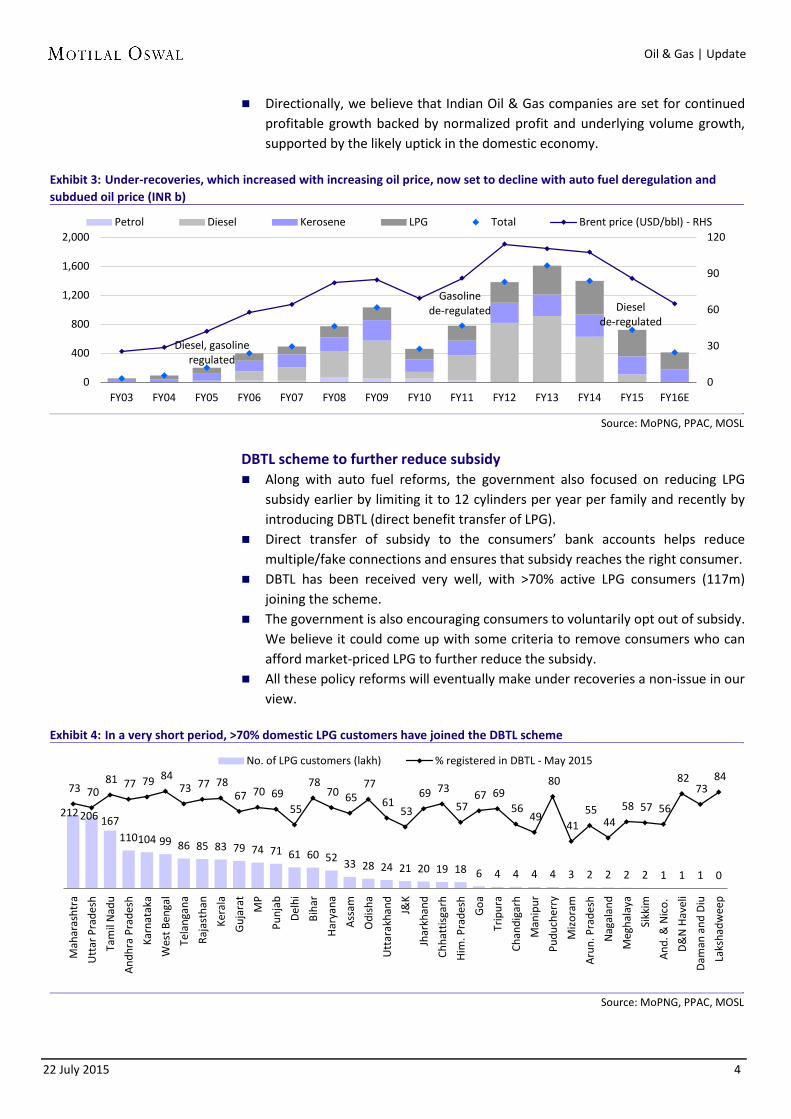
Exhibit 3: Under-recoveries, which increased with increasing oil price, now set to decline with auto fuel deregulation and subdued oil price (INR b)
Source: MoPNG, PPAC, MOSL
DBTL scheme to further reduce subsidy Along with auto fuel reforms, the government also focused on reducing LPG
subsidy earlier by limiting it to 12 cylinders per year per family and recently by introducing DBTL (direct benefit transfer of LPG).
Direct transfer of subsidy to the consumers’ bank accounts helps reduce multiple/fake connections and ensures that subsidy reaches the right consumer.
DBTL has been received very well, with >70% active LPG consumers (117m) joining the scheme.
The government is also encouraging consumers to voluntarily opt out of subsidy. We believe it could come up with some criteria to remove consumers who can afford market-priced LPG to further reduce the subsidy.
All these policy reforms will eventually make under recoveries a non-issue in our view.
Exhibit 4: In a very short period, >70% domestic LPG customers have joined the DBTL scheme
No. of LPG customers (lakh) % registered in DBTL - May 2015
22 July 2015 5
Oil & Gas | Update
Recent crude price fall similar to 1986, but will OPEC strategy work again? In the last 10 months, crude oil price has declined by over 50% without a decline
in demand. Crude price decline of such magnitude was seen only twice in the last three decades and only once along with economic recession.
Exhibit 5: Brent crude declined >50% to reach below USD50/bbl in the recent quarters
Source: Bloomberg, MOSL
Exhibit 6: Such sharp decline was seen only twice in the last three decades
Source: Bloomberg, MOSL
The recent oil price collapse is more comparable to 1986’s. Faced with global oil
price decline, Saudi Arabia played a key role as a swing producer and cut its production from a peak of 10mmbbl/d in 1980-81 to 2.3mmbbl/d in August 1985. However, as it saw the increasing trend of non-OPEC production (then again by Gulf of Mexico in the US and North Sea in UK), it decided to abandon its swing producer role and increased production to maintain its market share. This resulted in crude price fall of ~58% to USD9.9/bbl by July 1986.
The 1986 oil price fall resulted in a decline in US oil production, as OPEC increased its production as well as market share.
Exhibit 7: OPEC swiftly changes its position from production cut to increase to protect its market share
*US includes USA, Canada and Mexico
Exhibit 8: North America production has increased rapidly in the last five years, again threatening OPEC’s market share
Source: BP Statistical Review, IEA, EIA, MOSL
0
25
50
75
100
125
150
Jun-85 Jun-91 Jun-97 Jun-03 Jun-09 Jun-15
Brent Crude Price monthly average (USD/bbl)
(100)
(50)
0
50
100
150
Jun-85 Jun-91 Jun-97 Jun-03 Jun-09 Jun-15
Brent Crude Price YoY Chg (%)
10.2
- -
-
-
1.5 0.8 -
63.0
-
1.2 1.0
2.4
57.5
8.0
- - 2.2
65.4
1980 OPEC US UK Non OPEC
1985 OPEC US UK Non OPEC
1990
1980-1985-1990 Production change bridge (mmbbl/d)
-
-
0.6 -
81.1
2.6
5.3
- 0.3
88.7
2009 OPEC US UK Non OPEC
2014 OPEC US UK Non OPEC
2019
2009-2014 Production change bridge (mmbbl/d)
?
22 July 2015 6
Oil & Gas | Update
Exhibit 9: OPEC cut its production in pre-1985 demand decline era, but with increasing US/UK production, it abandoned its swing producer role to maintain market share
Source: BP Statistical Review, MOSL
Capex cuts by E&P companies have already sowed seeds for future price rise.
However, this time around, we believe the OPEC’s market share battle will be for longer period, keeping oil prices subdued in the interim. Crude prices have been declining for over six months now; there is no
meaningful impact on US shale oil production yet. Current situation is different from 1986, as the OPEC fight is against
unconventional US oil production (shale oil/gas), for which lead time for production is very short and breakeven levels (supported by technological advances and lowering service equipment charges) are continuously reducing.
OPEC economics are resilient in terms of crude production costs, but these countries also have pressures in terms of their breakeven budget prices to support the economy. This along with the recent Iran deal (will boost exports by ~1mmbbl/d) will keep the oil market more than well supplied resulting in subdued price trend
Exhibit 10: Led by declining crude prices, E&P companies have cut their capex plans, sowing the seeds for the next price rise
North-America production share (%) UK production share (%)
-10% -10% -10% -12% -13% -15% -16% -17% -20%
-26% -30%
-35% -37%
Tota
l
LUKO
IL
Stat
oil
Exxo
n
Mob
il
Chev
ron
Shel
l
Hes
s
Eni
BP
Enca
na
OM
V
Cono
co
Phill
ips
Petr
obra
s
22 July 2015 7
Oil & Gas | Update
Exhibit 11: However, US shale play companies are continuously reducing breakeven oil prices (WTI Price in USD/bbl)
Source: NASWellData, Rystad Energy
Exhibit 12: Coupled with higher fiscal breakeven for OPEC countries, OPEC’s market share battle could be elongated, keeping oil prices subdued in the interim
Source: IMF
0
40
80
120
160
Bakken Eagle Ford Permian Delaware
Permian Midland
Niobrara
2011 2012 2013 2014 2015
0
40
80
120
160
Kuw
ait
Turk
men
ista
n
Qat
ar
Kaza
khst
an
Iraq
UA
E
Azer
baija
n
S. A
rabi
a
Om
an
Bahr
ain
Iran
Alge
ria
Liby
a
Yem
en
GCC Non-GCC CCAOE
Update baseline for 2015 USD57
22 July 2015 8
Oil & Gas | Update
OMCs’ earnings to increase, become predictable Last two-year EV improvement lags fundamentals, expect re-rating
Auto fuel deregulation is a significant reform, as (a) it gives pricing power to OMCs, (b) frees OMCs’ working capital and reduces fiscal burden on government/upstream, and (c) promotes efficiency, with private player entry.
This reform will not only increase and make OMCs’ earnings more predictable, but also help them tide over extreme inventory and refining margin volatility.
While we expect OMCs’ earnings to grow 140-220% by FY16, their EVs have moved up just 13-56% in the last two years. They should re-rate in line with structural positives like (a) pricing power, (b) near monopoly status, (c) steady volume growth, and (d) strengthening balance sheets and payouts.
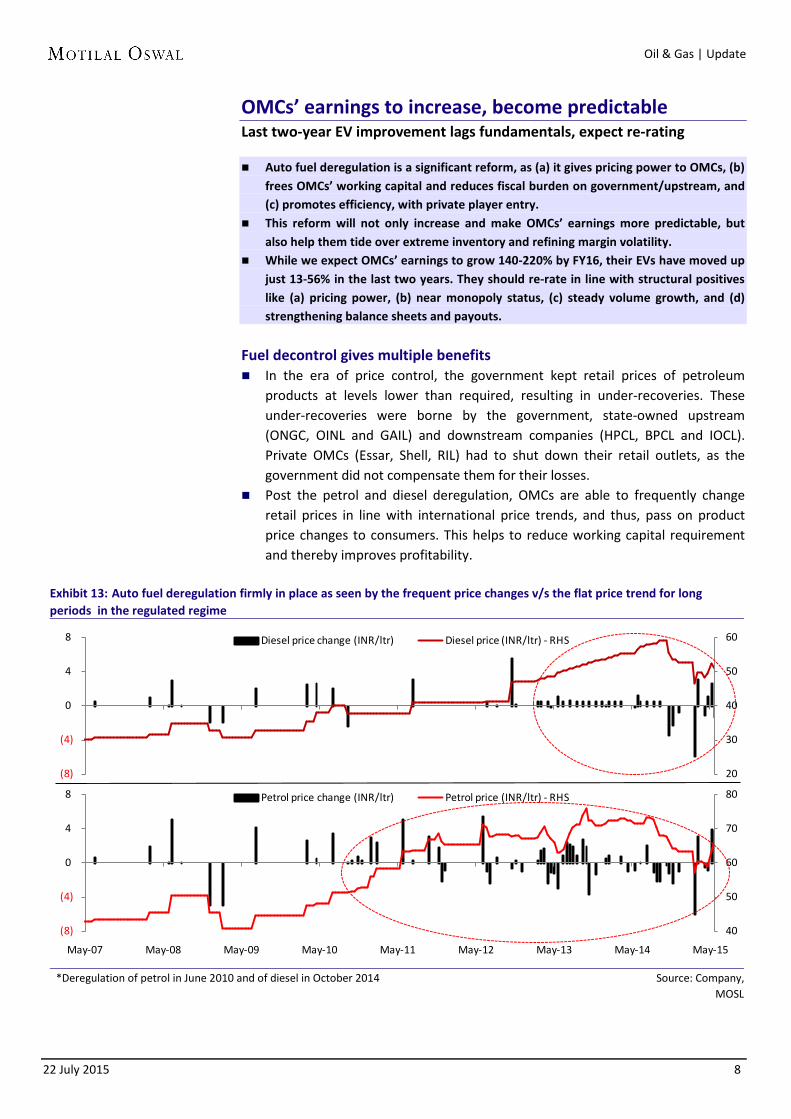
Fuel decontrol gives multiple benefits In the era of price control, the government kept retail prices of petroleum
products at levels lower than required, resulting in under-recoveries. These under-recoveries were borne by the government, state-owned upstream (ONGC, OINL and GAIL) and downstream companies (HPCL, BPCL and IOCL). Private OMCs (Essar, Shell, RIL) had to shut down their retail outlets, as the government did not compensate them for their losses.
Post the petrol and diesel deregulation, OMCs are able to frequently change retail prices in line with international price trends, and thus, pass on product price changes to consumers. This helps to reduce working capital requirement and thereby improves profitability.
Exhibit 13: Auto fuel deregulation firmly in place as seen by the frequent price changes v/s the flat price trend for long periods in the regulated regime
*Deregulation of petrol in June 2010 and of diesel in October 2014 Source: Company,
Petrol price change (INR/ltr) Petrol price (INR/ltr) - RHS
22 July 2015 9
Oil & Gas | Update
In the controlled price regime, in case of rising international prices, OMCs had to bear the losses till the time government compensated through subsidy, which was typically delayed by 3-5 months.
Delayed subsidy led to OMCs using debt to fund working capital requirement, thus straining their balance sheets as well as income statements. Interest on under-recovery related debt was not compensated by the government.
Exhibit 14: OMCs’ debt increased rapidly during the regulated price regime…
Source: Company, MOSL
Exhibit 15: …as did interest cost, which we now expect to reduce
Source: Company, MOSL
Exhibit 16: Interest coverage ratio (x) – OMCs’ financial position improving
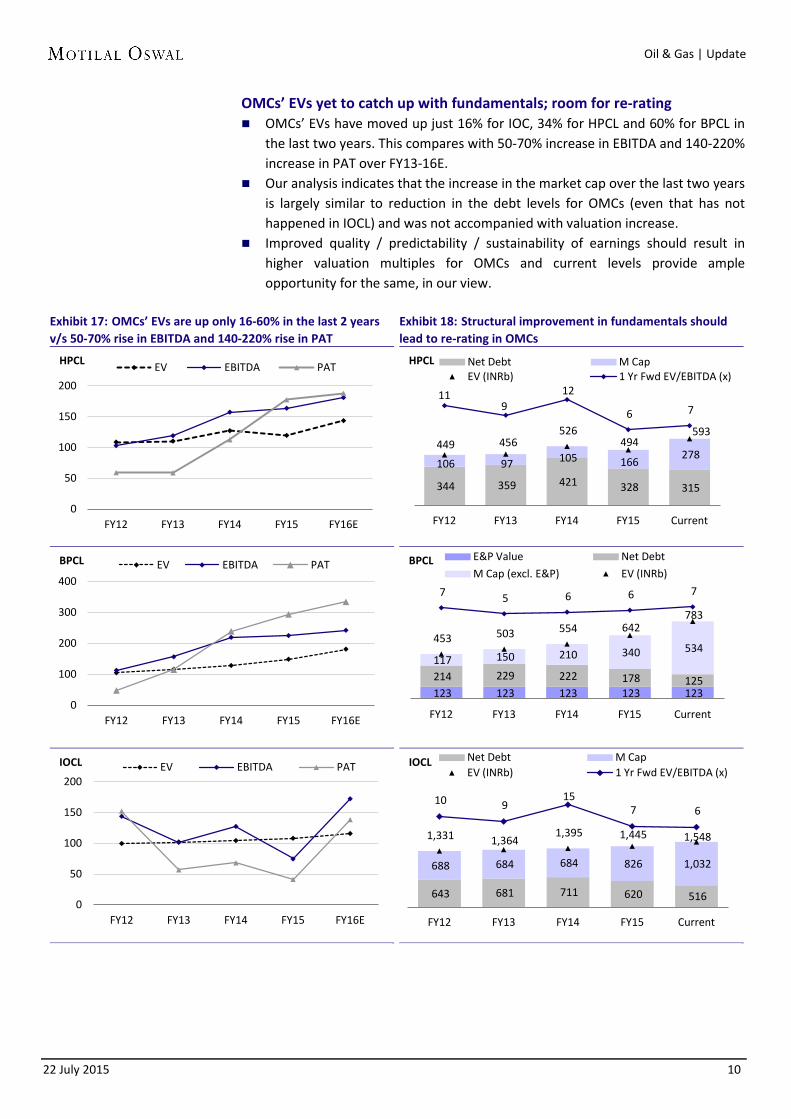
OMCs’ EVs yet to catch up with fundamentals; room for re-rating OMCs’ EVs have moved up just 16% for IOC, 34% for HPCL and 60% for BPCL in
the last two years. This compares with 50-70% increase in EBITDA and 140-220% increase in PAT over FY13-16E.
Our analysis indicates that the increase in the market cap over the last two years is largely similar to reduction in the debt levels for OMCs (even that has not happened in IOCL) and was not accompanied with valuation increase.
Improved quality / predictability / sustainability of earnings should result in higher valuation multiples for OMCs and current levels provide ample opportunity for the same, in our view.
Exhibit 17: OMCs’ EVs are up only 16-60% in the last 2 years v/s 50-70% rise in EBITDA and 140-220% rise in PAT
Exhibit 18: Structural improvement in fundamentals should lead to re-rating in OMCs
0
50
100
150
200
FY12 FY13 FY14 FY15 FY16E
EV EBITDA PAT HPCL
344 359 421 328 315
106 97 105 166 278
449 456 526
494 593
11 9
12
6 7
FY12 FY13 FY14 FY15 Current
Net Debt M Cap EV (INRb) 1 Yr Fwd EV/EBITDA (x)
HPCL
0
100
200
300
400
FY12 FY13 FY14 FY15 FY16E
EV EBITDA PAT BPCL
123 123 123 123 123 214 229 222 178 125
117 150 210 340 534 453 503 554 642
783
7 5 6 6 7
FY12 FY13 FY14 FY15 Current
E&P Value Net Debt
M Cap (excl. E&P) EV (INRb) BPCL
0
50
100
150
200
FY12 FY13 FY14 FY15 FY16E
EV EBITDA PAT IOCL
643 681 711 620 516
688 684 684 826 1,032
1,331 1,364 1,395 1,445 1,548
10 9 15
7 6
FY12 FY13 FY14 FY15 Current
Net Debt M Cap EV (INRb) 1 Yr Fwd EV/EBITDA (x)
IOCL
22 July 2015 11
Oil & Gas | Update
Poised to benefit from petroleum market evolution After interest cost reduction, marketing margins to drive profitability growth
We expect PSU OMC’s to benefit in the shift from ‘regulated deregulation’ to ‘deregulation’ era due to its infra reach and scale along with at-par outlet services.
OMCs’ profit normalization has entered phase-2. In phase-1, interest cost reduction had driven profits; in phase-2, operational efficiencies are likely to drive profits.
Of the three OMCs, HPCL (refer report dated July 1, 2015) provides highest upside led by its high sensitivity to marketing margins, while BPCL (refer report dated June 22, 2015) which has multiple triggers, stands out for its superior return ratios.
Indian petroleum retail market is on the cusp of evolution led by recent diesel de-regulation. It has crossed the regulated era and is in the midst of “regulated de-regulation” era which typically is accompanied with the private player entry. Indian fuel retailing has already evolved from a pure fuel dispensing station to a multiservice fuel station in pockets, but still has to go a long way to adapt the new age business model on a mass scale. While, availability of the last mile nation-wide infrastructure is an advantage for PSU OMC’s, nevertheless they too will have to adopt new strategies to improve profitability and protect/grow their market share. We note some of the likely evolutionary stages in exhibit 19, depicting the different horizons in the evolution of Indian petroleum market.
Exhibit 19: Evolution of Indian petroleum retail market
In phase-2 of profit normalization We had divided OMCs’ earnings improvement process into two phases (refer
our March 2013 report “Landmark reforms – Oil PSUs to benefit”). Phase-1 included financial benefit from reduction of interest cost, led by lowering of working capital related loans (used to fund under-recoveries till the government compensated), which we believe is near completion.
Over the last few years, government subsidy receivables constituted 30-40% of the OMCs’ debt. With diesel deregulation, this would reduce to a minimal level, leading to reduction in debt and interest cost.
Exhibit 20: Receivables from the government used to form 30-40% of the OMCs’ debt
Source: Company, MOSL
Exhibit 21: OMCs’ balance sheets to improve; net debt to reduce by >50% (INRb)
Exhibit 22: OMCs’ net debt to equity to reduce significantly (x)
Source: Company, MOSL
Phase-2 is difficult but more rewarding, as it improves earnings quality and also
imparts more sustainability. In phase-2, we expect earnings to improve through higher marketing margins,
but this would also be challenging, as the OMCs would have to compete with private players that are attempting to re-enter.
Unlike the previous deregulation period (2004-2006), we expect OMCs to have a smoother ride in competing with private players. In 2004-2006, OMCs were ill-prepared to face private competition. However, we believe it was an eye opener for the OMCs that later
responded by improving on all key parameters – service, quality, look & feel of outlets, and reach. (For more details, please refer to the section ‘Private entry unlikely to dent OMCs’ volumes’ in our report, Marketing freedom: A win-win for all; OMCs to turn into structural investment plays.
On the marketing margin front, in 4QFY15, OMCs showed the flexibility to balance earnings in the face of inventory movements impacting profitability. OMCs had increased auto fuel marketing margins from the regulated INR1.4/liter to INR3/liter.
While the current level of margins is ~INR1.8/liter, we expect them to improve gradually over the coming quarters to INR2.25-2.5/liter.
Expect OMCs’ marketing margins to move up The next big earnings jump for OMCs would come from likely higher marketing margin in diesel. We believe OMCs could at least earn additional marketing margin of INR0.5-1/liter. Even if private players take market share as high as 15%, OMCs can report 3-4% volume growth. How much marketing margins did OMCs earn in regulated scenario? The marketing margin component for OMCs’ marketing sales was fixed by the
government in 2006 (it was INR1.4/liter in 2014 for diesel). Despite the cost increases of 8-10%, OMCs got only ~4% annual escalation. This
led to a severe reduction in the marketing division’s profitability.
What is the global trend? Global comparison shows that the current marketing margin in diesel in India at
INR1.4/liter is ~60% below global average. Our view In the current scenario of deregulation, we expect OMCs’ marketing division
profitability to increase meaningfully. Who will benefit the most? HPCL being the highest leveraged to marketing volumes (standalone
marketing/refining ratio of 2x), we estimate an EPS increase of INR15.5 for INR0.5/liter increase in diesel marketing margins, followed by BPCL and IOCL.
Exhibit 23: Global diesel marketing margins are well above India’s regulated level margins (INR/liter)
Source: Company, MOSL
Exhibit 24: HPCL has the highest marketing / refining ratio among OMCs
Source: Company, MOSL
HPCL has the highest sensitivity to marketing margins among OMCs Diesel deregulation benefitted OMCs in terms of lower interest cost (WC
reduction). The next leg of earnings increase will be from higher marketing margins (similar to petrol).
Diesel gross marketing margins at INR1.4/liter (including cost of INR0.8-0.9/liter) in India are INR2-3/liter lower than global averages.
Further, given the economics of private players (new marginal players) and global margin trend, earning additional INR0.5-1/liter marketing margin consistently on diesel should be possible for state-owned OMCs.
We model additional INR0.5/0.6/liter in our estimates for FY16/FY17.
1.40
3.00 1.90
4.80
3.01
4.50
2.83 1.77
3.49 3.40
Indi
a
(pre
der
egul
atio
n)
Indi
a (4
QFY
15)
Indi
a (F
Y16E
)
Chev
ron
(N
ew Z
eala
nd)
CST
(US)
Park
land
Fue
l (C
anad
a)
Thai
land
S.Af
rica
- Pe
trol
S. A
fric
a - D
iese
l
Aust
ralia
1.4 1.3
1.5 1.5
1.6 1.7
1.8 1.9
2.0 1.9
1.3 1.2 1.2
1.3
1.4 1.3
1.4 1.4 1.5 1.5
1.3 1.3 1.4
1.3
1.4 1.4
1.4 1.4 1.4 1.4
FY06 FY07 FY08 FY09 FY10 FY11 FY12 FY13 FY14 FY15
HPCL BPCL IOCL Marketing to refining volume ratio (x)
22 July 2015 15
Oil & Gas | Update
Exhibit 25: Marketing margin increase to significantly boost OMCs’ earnings
Source: Company, MOSL
Private competition fears unfounded; OMCs better prepared We also do not see any threat from private players on marketing margins, as
apart from Central-Western India players (RIL, Essar) private players do not have infrastructural reach to transport petroleum products economically.
We believe that private players are unlikely to dent OMCs’ volumes as: Pump economics have turned unfavorable unlike during 2004-07 OMCs’ control over logistics handicaps private players to compete beyond the
proximity of their refineries OMCs’ service levels have improved considerably, as they have addressed adulteration issues to a greater extent increased network and reach tied up with high volume fleet operators
Why we think OMCs will not suffer like telecom, airlines Entry of private players into a sector where PSUs had monopoly has led to a
large business loss for PSU companies. Telecom and Airlines are cases in point. It could be argued that state-owned OMCs will meet similar fate. However, we
Exhibit 26: Key dissimilarities between Telecom/Airlines and Petroleum Marketing before private player entry Key parameters Telecom / Airlines Petroleum Marketing Operational Efficiency Monopoly, hence no comparison to measure
operational efficiency Competition within PSU OMCs in place, hence
operational efficiencies achieved Service quality In telecom, clearly customers had to wait long to
get new phone connections, service levels were very poor
PSU OMCs learned lesson in a hard way during the previous de-regulation period and has upped their service levels at par with private or global players
Infrastructure Large asset was an advantage in telecom, but advent of wireless technology made this advantage irrelevant
As the petroleum product has to be physically delivered, any technology change will not replace the need for the physical infrastructure.
Equal access to airport facilities, availability of planes on lease gave level playing field for private airlines
Replication of the PSU infrastructure will be difficult to justify at current costs and scale for private players, unless they take a 10-15 year business view
Source: MOSL
In our view, eventual winners in the petroleum retail business will be players who can modernize (value/service to customers, non-fuel retail), have scale (reach to cater fleet operators), have multi-fuel outlets, and can be efficient (profitability focus, real-time monitoring). Even in the worst case scenario, we expect OMCs to report 3-4% volume CAGR, factoring 10% market share for private players.
Exhibit 27: Even at 10% private market share, expect OMCs’ volume CAGR at 3-4%
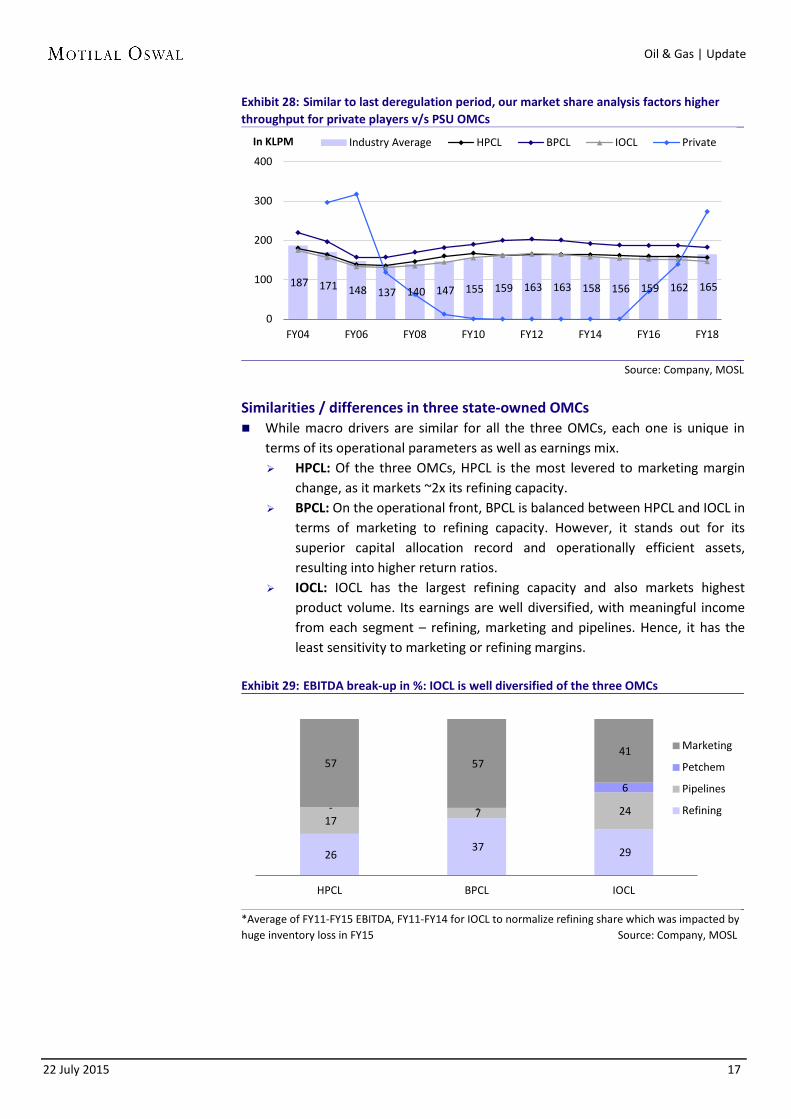
Exhibit 28: Similar to last deregulation period, our market share analysis factors higher throughput for private players v/s PSU OMCs
Source: Company, MOSL
Similarities / differences in three state-owned OMCs While macro drivers are similar for all the three OMCs, each one is unique in
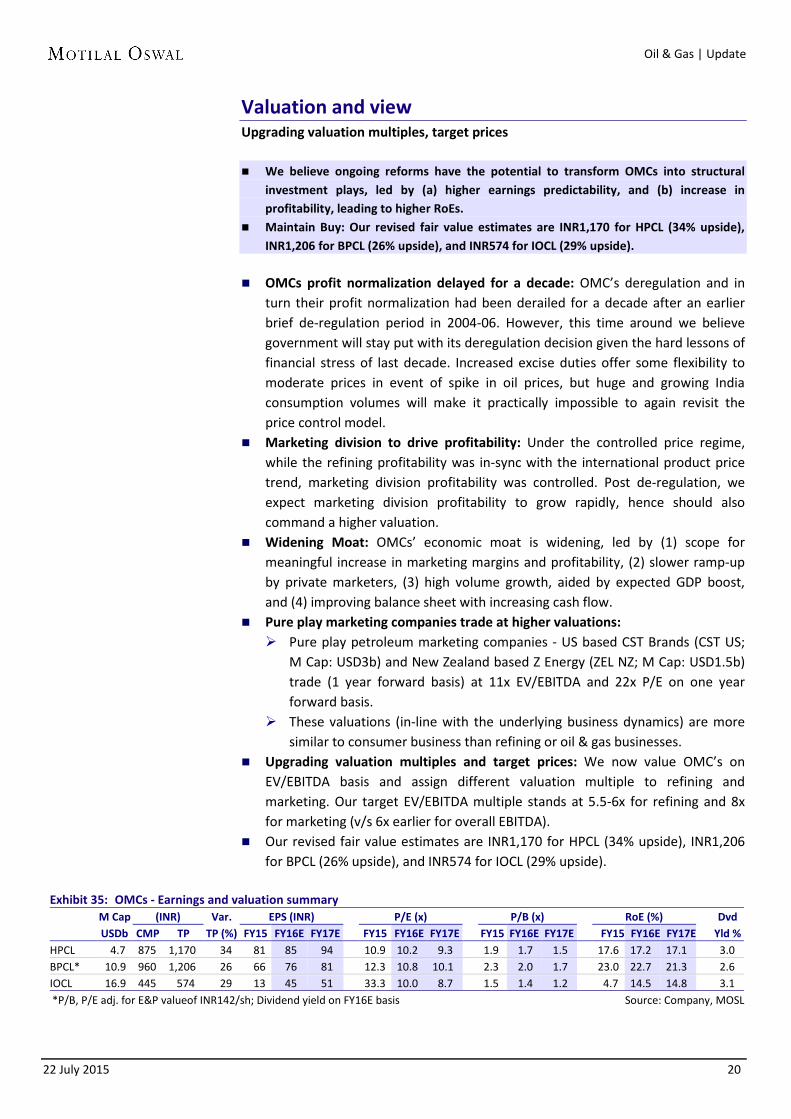
terms of its operational parameters as well as earnings mix. HPCL: Of the three OMCs, HPCL is the most levered to marketing margin
change, as it markets ~2x its refining capacity. BPCL: On the operational front, BPCL is balanced between HPCL and IOCL in
terms of marketing to refining capacity. However, it stands out for its superior capital allocation record and operationally efficient assets, resulting into higher return ratios.
IOCL: IOCL has the largest refining capacity and also markets highest product volume. Its earnings are well diversified, with meaningful income from each segment – refining, marketing and pipelines. Hence, it has the least sensitivity to marketing or refining margins.
Exhibit 29: EBITDA break-up in %: IOCL is well diversified of the three OMCs
*Average of FY11-FY15 EBITDA, FY11-FY14 for IOCL to normalize refining share which was impacted by huge inventory loss in FY15 Source: Company, MOSL
Exhibit 30: OMCs – relative positioning in the key operating parameters
*Includes Paradeep in IOCL refining capacity Source: Company, MOSL
Exhibit 31: BPCL has highest return ratios among the three OMCs
Source: Company, MOSL
Exhibit 32: DuPont analysis: Higher profitability led by superior operational performance helps BPCL to report higher RoE
Source: Company, MOSL
0
6
12
18
24
FY10 FY11 FY12 FY13 FY14 FY15
HPCL BPCL IOCL RoE (%)
0.0
1.3
2.5
3.8
5.0
FY10 FY11 FY12 FY13 FY14 FY15
HPCL BPCL IOCL Linear (BPCL)
PAT Margin (%)
2.0
2.8
3.5
4.3
5.0
FY10 FY11 FY12 FY13 FY14 FY15
HPCL BPCL IOCL
Total asset turnover (x)
2.0
2.5
3.0
3.5
4.0
FY10 FY11 FY12 FY13 FY14 FY15
HPCL BPCL IOCL
Equity Multiplier (x)
22 July 2015 19
Oil & Gas | Update
Exhibit 33: Comparing GRM performance – trend in-line for three OMCs, BPCL stands out in recent years (USD/bbl)
Source: Company, MOSL
Exhibit 34: Improving distillate yield helps to counter inventory losses
Source: Company, MOSL
0.0
1.5
3.0
4.5
6.0
FY10 FY11 FY12 FY13 FY14 FY15
HPCL BPCL IOCL GRM (USD/bbl)
65
70
75
80
85
FY10 FY11 FY12 FY13 FY14 FY15
HPCL BPCL IOCL Distillate Yield (%)
22 July 2015 20
Oil & Gas | Update
Valuation and view Upgrading valuation multiples, target prices We believe ongoing reforms have the potential to transform OMCs into structural
investment plays, led by (a) higher earnings predictability, and (b) increase in profitability, leading to higher RoEs.
Maintain Buy: Our revised fair value estimates are INR1,170 for HPCL (34% upside), INR1,206 for BPCL (26% upside), and INR574 for IOCL (29% upside).
OMCs profit normalization delayed for a decade: OMC’s deregulation and in
turn their profit normalization had been derailed for a decade after an earlier brief de-regulation period in 2004-06. However, this time around we believe government will stay put with its deregulation decision given the hard lessons of financial stress of last decade. Increased excise duties offer some flexibility to moderate prices in event of spike in oil prices, but huge and growing India consumption volumes will make it practically impossible to again revisit the price control model.
Marketing division to drive profitability: Under the controlled price regime, while the refining profitability was in-sync with the international product price trend, marketing division profitability was controlled. Post de-regulation, we expect marketing division profitability to grow rapidly, hence should also command a higher valuation.
Widening Moat: OMCs’ economic moat is widening, led by (1) scope for meaningful increase in marketing margins and profitability, (2) slower ramp-up by private marketers, (3) high volume growth, aided by expected GDP boost, and (4) improving balance sheet with increasing cash flow.
Pure play marketing companies trade at higher valuations: Pure play petroleum marketing companies - US based CST Brands (CST US;
M Cap: USD3b) and New Zealand based Z Energy (ZEL NZ; M Cap: USD1.5b) trade (1 year forward basis) at 11x EV/EBITDA and 22x P/E on one year forward basis.
These valuations (in-line with the underlying business dynamics) are more similar to consumer business than refining or oil & gas businesses.
Upgrading valuation multiples and target prices: We now value OMC’s on EV/EBITDA basis and assign different valuation multiple to refining and marketing. Our target EV/EBITDA multiple stands at 5.5-6x for refining and 8x for marketing (v/s 6x earlier for overall EBITDA).
Our revised fair value estimates are INR1,170 for HPCL (34% upside), INR1,206 for BPCL (26% upside), and INR574 for IOCL (29% upside).
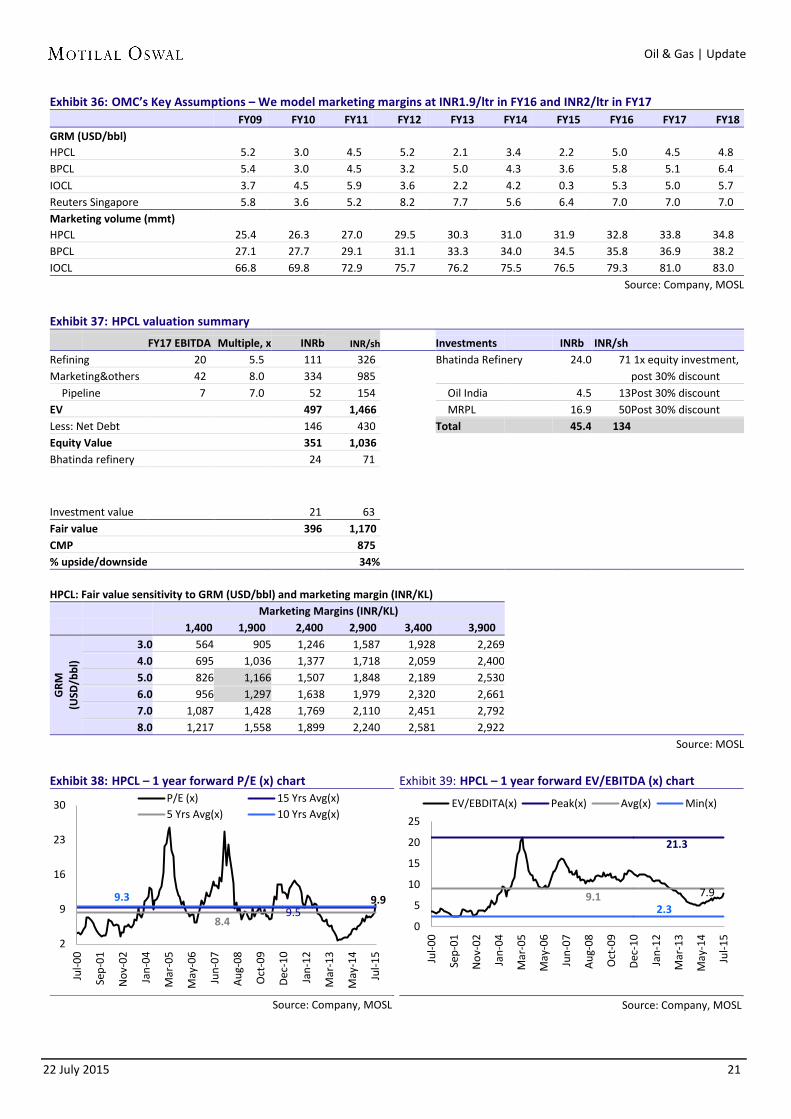
Exhibit 35: OMCs - Earnings and valuation summary
M Cap (INR) Var. EPS (INR) P/E (x) P/B (x) RoE (%) Dvd
Disclosures This document has been prepared by Motilal Oswal Securities Limited (hereinafter referred to as Most) to provide information about the company(ies) and/sector(s), if any, covered in the report and may be distributed by it and/or its affiliated company(ies). This report is for personal information of the selected recipient/s and does not construe to be any investment, legal or taxation advice to you. This research report does not constitute an offer, invitation or inducement to invest in securities or other investments and Motilal Oswal Securities Limited (hereinafter referred as MOSt) is not soliciting any action based upon it. This report is not for public distribution and has been furnished to you solely for your general information and should not be reproduced or redistributed to any other person in any form. This report does not constitute a personal recommendation or take into account the particular investment objectives, financial situations, or needs of individual clients. Before acting on any advice or recommendation in this material, investors should consider whether it is suitable for their particular circumstances and, if necessary, seek professional advice. The price and value of the investments referred to in this material and the income from them may go down as well as up, and investors may realize losses on any investments. Past performance is not a guide for future performance, future returns are not guaranteed and a loss of original capital may occur.
MOSt and its affiliates are a full-service, integrated investment banking, investment management, brokerage and financing group. We and our affiliates have investment banking and other business relationships with a some companies covered by our Research Department. Our research professionals may provide input into our investment banking and other business selection processes. Investors should assume that MOSt and/or its affiliates are seeking or will seek investment banking or other business from the company or companies that are the subject of this material and that the research professionals who were involved in preparing this material may educate investors on investments in such business. The research professionals responsible for the preparation of this document may interact with trading desk personnel, sales personnel and other parties for the purpose of gathering, applying and interpreting information. Our research professionals are paid on the profitability of MOSt which may include earnings from investment banking and other business.
MOSt generally prohibits its analysts, persons reporting to analysts, and members of their households from maintaining a financial interest in the securities or derivatives of any companies that the analysts cover. Additionally, MOSt generally prohibits its analysts and persons reporting to analysts from serving as an officer, director, or advisory board member of any companies that the analysts cover. Our salespeople, traders, and other professionals or affiliates may provide oral or written market commentary or trading strategies to our clients that reflect opinions that are contrary to the opinions expressed herein, and our proprietary trading and investing businesses may make investment decisions that are inconsistent with the recommendations expressed herein. In reviewing these materials, you should be aware that any or all of the foregoing among other things, may give rise to real or potential conflicts of interest. MOSt and its affiliated company(ies), their directors and employees and their relatives may; (a) from time to time, have a long or short position in, act as principal in, and buy or sell the securities or derivatives thereof of companies mentioned herein. (b) be engaged in any other transaction involving such securities and earn brokerage or other compensation or act as a market maker in the financial instruments of the company(ies) discussed herein or act as an advisor or lender/borrower to such company(ies) or may have any other potential conflict of interests with respect to any recommendation and other related information and opinions.; however the same shall have no bearing whatsoever on the specific recommendations made by the analyst(s), as the recommendations made by the analyst(s) are completely independent of the views of the affiliates of MOSt even though there might exist an inherent conflict of interest in some of the stocks mentioned in the research report Reports based on technical and derivative analysis center on studying charts company's price movement, outstanding positions and trading volume, as opposed to focusing on a company's fundamentals and, as such, may not match with a report on a company's fundamental analysis. In addition MOST has different business segments / Divisions with independent research separated by Chinese walls catering to different set of customers having various objectives, risk profiles, investment horizon, etc, and therefore may at times have different contrary views on stocks sectors and markets.
Unauthorized disclosure, use, dissemination or copying (either whole or partial) of this information, is prohibited. The person accessing this information specifically agrees to exempt MOSt or any of its affiliates or employees from, any and all responsibility/liability arising from such misuse and agrees not to hold MOSt or any of its affiliates or employees responsible for any such misuse and further agrees to hold MOSt or any of its affiliates or employees free and harmless from all losses, costs, damages, expenses that may be suffered by the person accessing this information due to any errors and delays. The information contained herein is based on publicly available data or other sources believed to be reliable. Any statements contained in this report attributed to a third party represent MOSt’s interpretation of the data, information and/or opinions provided by that third party either publicly or through a subscription service, and such use and interpretation have not been reviewed by the third party. This Report is not intended to be a complete statement or summary of the securities, markets or developments referred to in the document. While we would endeavor to update the information herein on reasonable basis, MOSt and/or its affiliates are under no obligation to update the information. Also there may be regulatory, compliance, or other reasons that may prevent MOSt and/or its affiliates from doing so. MOSt or any of its affiliates or employees shall not be in any way responsible and liable for any loss or damage that may arise to any person from any inadvertent error in the information contained in this report. MOSt or any of its affiliates or employees do not provide, at any time, any express or implied warranty of any kind, regarding any matter pertaining to this report, including without limitation the implied warranties of merchantability, fitness for a particular purpose, and non-infringement. The recipients of this report should rely on their own investigations.
This report is intended for distribution to institutional investors. Recipients who are not institutional investors should seek advice of their independent financial advisor prior to taking any investment decision based on this report or for any necessary explanation of its contents.
Most and it’s associates may have managed or co-managed public offering of securities, may have received compensation for investment banking or merchant banking or brokerage services, may have received any compensation for products or services other than investment banking or merchant banking or brokerage services from the subject company in the past 12 months. Most and it’s associates have not received any compensation or other benefits from the subject company or third party in connection with the research report. Subject Company may have been a client of Most or its associates during twelve months preceding the date of distribution of the research report
MOSt and/or its affiliates and/or employees may have interests/positions, financial or otherwise of over 1 % at the end of the month immediately preceding the date of publication of the research in the securities mentioned in this report. To enhance transparency, MOSt has incorporated a Disclosure of Interest Statement in this document. This should, however, not be treated as endorsement of the views expressed in the report.
Motilal Oswal Securities Limited is registered as a Research Analyst under SEBI (Research Analyst) Regulations, 2014. SEBI Reg. No. INH000000412
There are no material disciplinary action that been taken by any regulatory authority impacting equity research analysis activities
Analyst Certification The views expressed in this research report accurately reflect the personal views of the analyst(s) about the subject securities or issues, and no part of the compensation of the research analyst(s) was, is, or will be directly or indirectly related to the specific recommendations and views expressed by research analyst(s) in this report. The research analysts, strategists, or research associates principally responsible for preparation of MOSt research receive compensation based upon various factors, including quality of research, investor client feedback, stock picking, competitive factors and firm revenues
Disclosure of Interest Statement Companies where there is interest Analyst ownership of the stock No Served as an officer, director or employee No
A graph of daily closing prices of securities is available at www.nseindia.com and http://economictimes.indiatimes.com/markets/stocks/stock-quotes
Regional Disclosures (outside India) This report is not directed or intended for distribution to or use by any person or entity resident in a state, country or any jurisdiction, where such distribution, publication, availability or use would be contrary to law, regulation or which would subject MOSt & its group companies to registration or licensing requirements within such jurisdictions.
For U.S. Motilal Oswal Securities Limited (MOSL) is not a registered broker - dealer under the U.S. Securities Exchange Act of 1934, as amended (the"1934 act") and under applicable state laws in the United States. In addition MOSL is not a registered investment adviser under the U.S. Investment Advisers Act of 1940, as amended (the "Advisers Act" and together with the 1934 Act, the "Acts), and under applicable state laws in the United States. Accordingly, in the absence of specific exemption under the Acts, any brokerage and investment services provided by MOSL, including the products and services described herein are not available to or intended for U.S. persons.
This report is intended for distribution only to "Major Institutional Investors" as defined by Rule 15a-6(b)(4) of the Exchange Act and interpretations thereof by SEC (henceforth referred to as "major institutional investors"). This document must not be acted on or relied on by persons who are not major institutional investors. Any investment or investment activity to which this document relates is only available to major institutional investors and will be engaged in only with major institutional investors. In reliance on the exemption from registration provided by Rule 15a-6 of the U.S. Securities Exchange Act of 1934, as amended (the "Exchange Act") and interpretations thereof by the U.S. Securities and Exchange Commission ("SEC") in order to conduct business with Institutional Investors based in the U.S., MOSL has entered into a chaperoning agreement with a U.S. registered broker-dealer, Motilal Oswal Securities International Private Limited. ("MOSIPL"). Any business interaction pursuant to this report will have to be executed within the provisions of this chaperoning agreement.
The Research Analysts contributing to the report may not be registered /qualified as research analyst with FINRA. Such research analyst may not be associated persons of the U.S. registered broker-dealer, MOSIPL, and therefore, may not be subject to NASD rule 2711 and NYSE Rule 472 restrictions on communication with a subject company, public appearances and trading securities held by a research analyst account.
For Singapore Motilal Oswal Capital Markets Singapore Pte Limited is acting as an exempt financial advisor under section 23(1)(f) of the Financial Advisers Act(FAA) read with regulation 17(1)(d) of the Financial Advisors Regulations and is a subsidiary of Motilal Oswal Securities Limited in India. This research is distributed in Singapore by Motilal Oswal Capital Markets Singapore Pte Limited and it is only directed in Singapore to accredited investors, as defined in the Financial Advisers Regulations and the Securities and Futures Act (Chapter 289), as amended from time to time. In respect of any matter arising from or in connection with the research you could contact the following representatives of Motilal Oswal Capital Markets Singapore Pte Limited: Kadambari Balachandran Email : [email protected] Contact : (+65) 68189233 / 65249115 Office Address : 21 (Suite 31),16 Collyer Quay,Singapore 04931