29
Oil Market and OPEC Behaviour: Looking Ahead Dr Bassam Fattouh Oxford Institute for Energy Studies London, Shell Centre 2 February 2011
Oil Market and OPEC Behaviour:
Looking Ahead
Dr Bassam Fattouh
Oxford Institute for Energy Studies
London, Shell Centre
2 February 2011
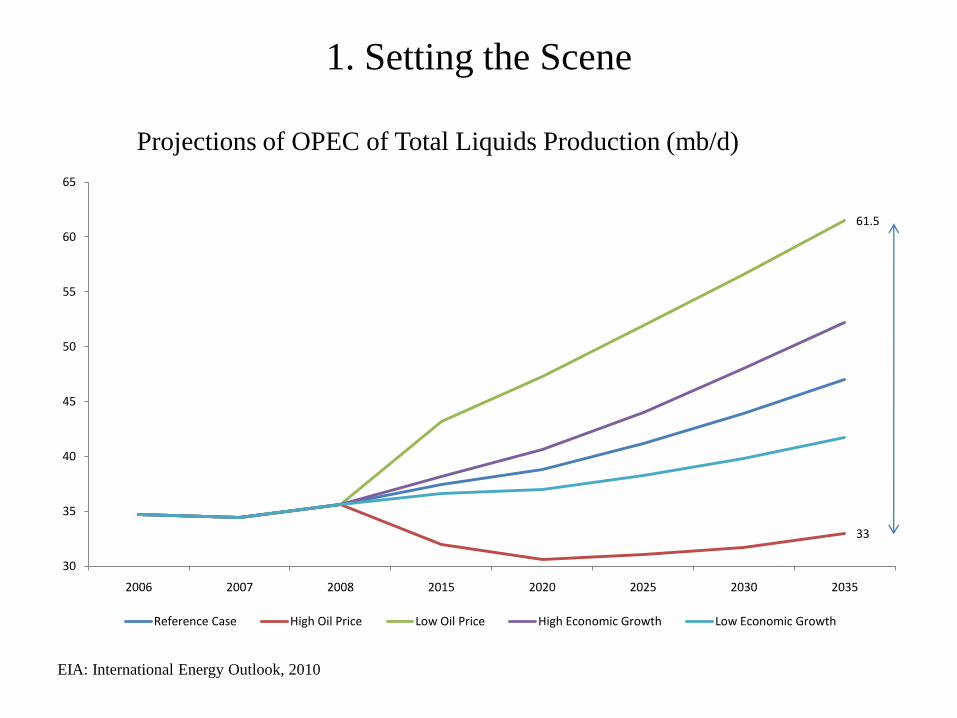
1. Setting the Scene
EIA: International Energy Outlook, 2010
Projections of OPEC of Total Liquids Production (mb/d)
33
61.5
30
35
40
45
50
55
60
65
2006 2007 2008 2015 2020 2025 2030 2035
Reference Case High Oil Price Low Oil Price High Economic Growth Low Economic Growth

Underlying Assumptions
• Estimates based on “call on OPEC”
– OPEC adjust its output and market share by filling gap between world oil demand and non-OPEC supply
– OPEC output treated as „residual‟ in projections
• Underlying key assumptions:
– OPEC/producers within OPEC are passive players• Not sensitive to fluctuating
market share
• OPEC doesn‟t or can‟t behave strategically
– Symmetric behaviour• Behaves symmetrically in a
rising and falling markets
OPEC Market Share
30%
35%
40%
45%
50%
55%
2006 2007 2008 2015 2020 2025 2030 2035
Reference Case High Oil Price
Low Oil Price High Economic Growth
Low Economic Growth
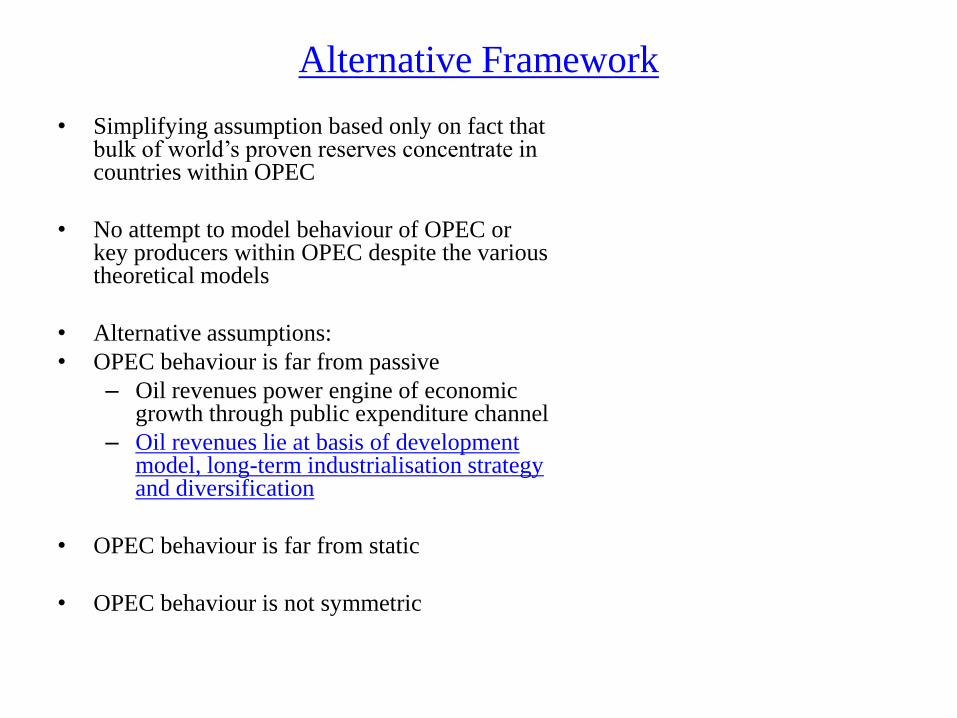
Alternative Framework
• Simplifying assumption based only on fact that bulk of world‟s proven reserves concentrate in countries within OPEC
• No attempt to model behaviour of OPEC or key producers within OPEC despite the various theoretical models
• Alternative assumptions:
• OPEC behaviour is far from passive
– Oil revenues power engine of economic growth through public expenditure channel
– Oil revenues lie at basis of development model, long-term industrialisation strategy and diversification
• OPEC behaviour is far from static
• OPEC behaviour is not symmetric

Oil Exporters‟ Economic Development Model
Hydrocarbon Revenues
The twin balances:
Finance Government Expenditure
(social, capital, current)
Finance Import Requirements
Diversify economic base
Industrial Development
Build the human capital base
Promote role of private sector
Generate Sustainable Growth Generate Employment
Oil revenues key for long term economic political and social stability
Oil revenues key for improving standards of living
Oil revenues key for transition from „depletion-led‟ development to „sustainable
development‟

The Demographics and Employment Challenge
Age Group
Saudi Arabia Official Unemployment rate
(percent)
Source: SAMA
0
500,000
1,000,000
1,500,000
2,000,000
2,500,000
3,000,000
0-4
5-9
10
-14
15
-19
20
-24
25
-29
30
-34
35
-39
40
-44
45
-49
50
-54
55
-59
60
-64
65
-69
70
-74
75
-79
80
& o
ver
Sixty six percent of population less than age of 30
Population Age Structure (Saudi‟s Only)
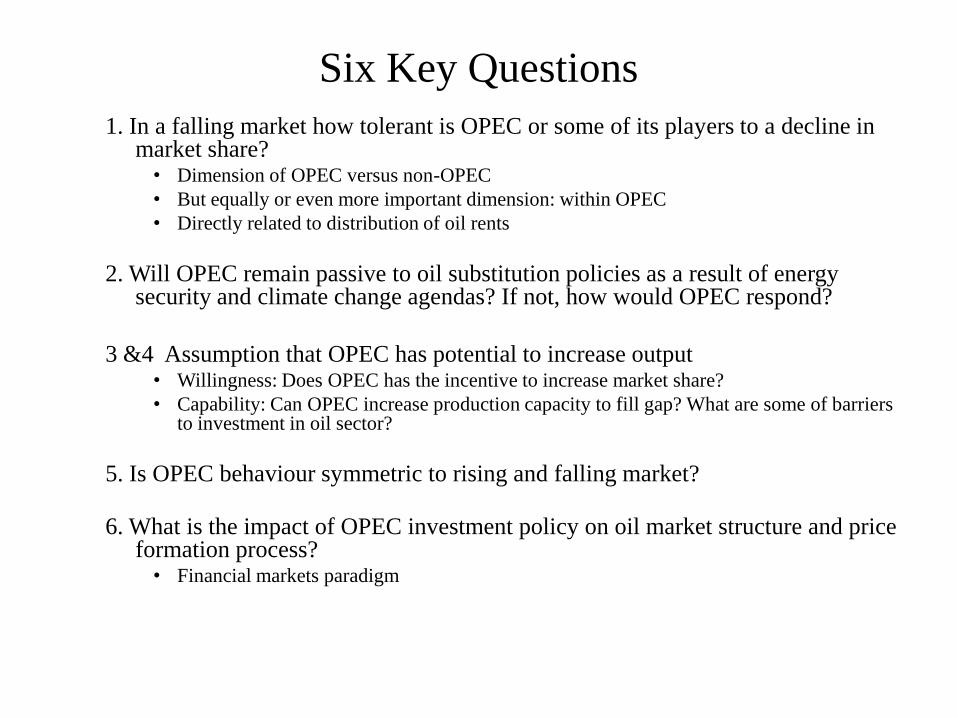
Six Key Questions
1. In a falling market how tolerant is OPEC or some of its players to a decline in market share?
• Dimension of OPEC versus non-OPEC
• But equally or even more important dimension: within OPEC
• Directly related to distribution of oil rents
2. Will OPEC remain passive to oil substitution policies as a result of energy security and climate change agendas? If not, how would OPEC respond?
3 &4 Assumption that OPEC has potential to increase output• Willingness: Does OPEC has the incentive to increase market share?
• Capability: Can OPEC increase production capacity to fill gap? What are some of barriers to investment in oil sector?
5. Is OPEC behaviour symmetric to rising and falling market?
6. What is the impact of OPEC investment policy on oil market structure and price formation process?
• Financial markets paradigm

2. OPEC‟s Evolving Role and Endogenous Shifts
• OPEC behaviour evolves over time– Protect income of members, price administrator, swing/residual producer, spare capacity
manager, inventory manager, price signaller,.....
• OPEC as a residual producer– Non-OPEC suppliers produce at maximum capacity
– OPEC takes non-OPEC supply as given and adjusts its output through the quota system to keep prices above a „certain floor‟; the price not necessarily maximise OPEC revenue
– “… the revenue maximization objective which theory postulates and core producers would dearly like to achieve is not credible. One has to become content with a second best: to obtain through the pricing policy more revenues than would have accrued under a competitive market structure. This more may be much better than nothing but is likely to be very different from the optimum” (Mabro, 1992)
• Non-OPEC has strategic advantage; OPEC squeezed both from supply and demand side– Decline in demand affects call on OPEC
– Rise in non-OPEC supply affects call on OPEC
– Deal with uncertainty on the demand and the supply side
• OPEC can be described as a residual producer but..... – Switch in residual producer status possible
– Switches instigated by market conditions, change in strategic interest, response in behaviour of other market players
– Switches associated with sharp price movements

Price Wars and Collusion
• Stigler (1964): Price wars often signal collapse of collusion
• Modern games theory (Green and Porter, 1984): Price wars are
„equilibrium punishments‟ aimed at stabilizing collusion
– Solution to problems of imperfect information (not able to observe compliance)
– inability to monitor compliance among members
• Price wars can be of „strategic‟ nature
– No ambiguity: some members publicly announce they would like to increase production
above quota (positive shock: large finds, low cost reserves, change in political regime;
etc)
– Previously collusive agreement no longer stable
– Country can signal this by instigating a price war
– Players respond by cutting output to accommodate new low cost producer
– Price war: method of credible communication/signaling among colluding firms
• Price wars method of allowing for a different distribution of rents
– Possible to have two collusive equilibria
– Instigate a price war to cause players to move from one equilibrium to another
– No new information but signal used to alter expectations and beliefs to achieve a
different distribution of rents
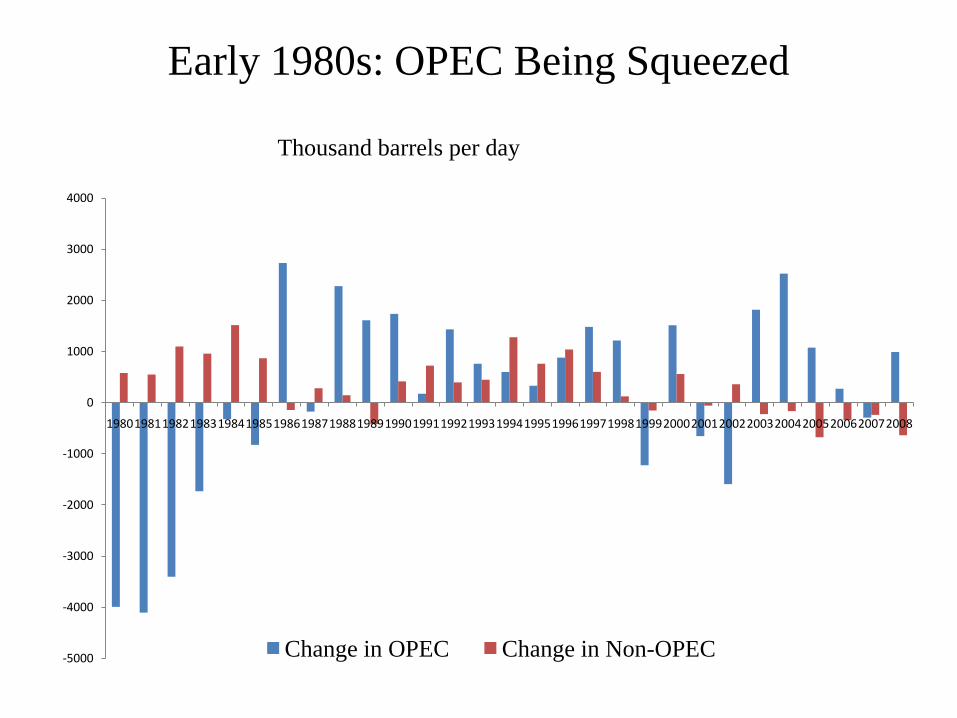
Early 1980s: OPEC Being Squeezed
-5000
-4000
-3000
-2000
-1000
0
1000
2000
3000
4000
19801981198219831984198519861987198819891990199119921993199419951996199719981999200020012002200320042005200620072008
Change in OPEC Change in Non-OPEC
Thousand barrels per day

The First Price War: 1986-1988
-5000
-4000
-3000
-2000
-1000
0
1000
2000
3000
19801981198219831984198519861987198819891990199119921993199419951996199719981999200020012002200320042005200620072008
Change in Saudi Arabia Oil Production Change in OPEC (Minus Saudi Arabia)

Venezuela‟s Challenge
Venezuela production vs Quota (000 b/d)
________________Source: Energy Intelligence Group OMI data, Morse (2007)
18
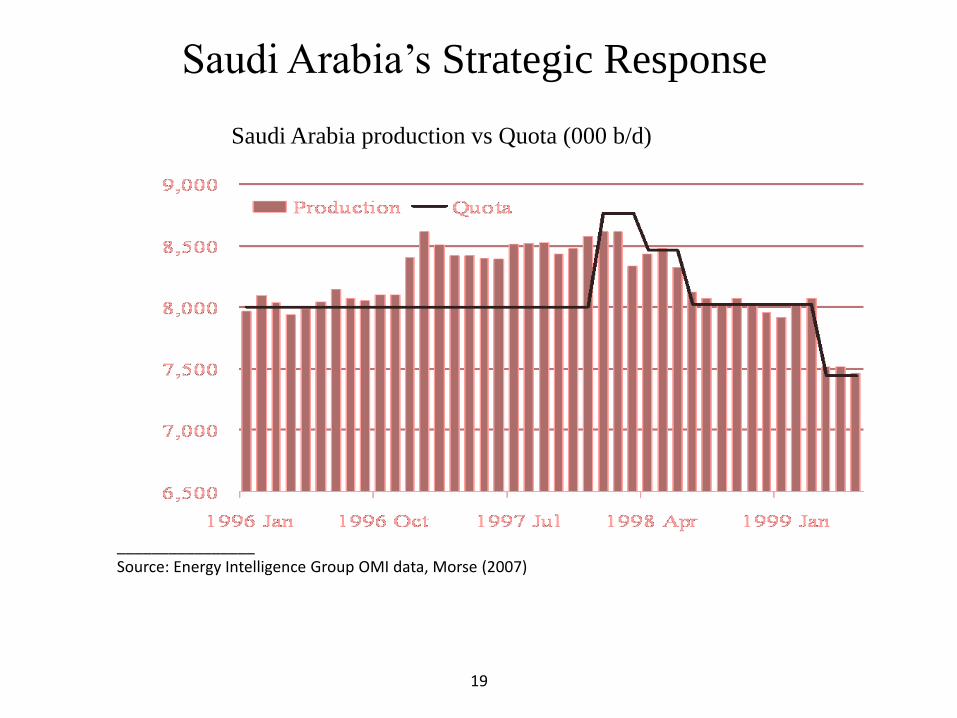
Saudi Arabia‟s Strategic Response
Saudi Arabia production vs Quota (000 b/d)
________________Source: Energy Intelligence Group OMI data, Morse (2007)
19

Is Iraq the New Challenge for OPEC in the 2000s?
-
2,000
4,000
6,000
8,000
10,000
12,000
'10 '11 '12 '13 '14 '15 '16 '17 '18 '19 '20 '21 '22 '23 '24 '25 '26 '27 '28 '29 '30
mb
oe
/d
Will entry of Iraq instigate a strategic price
war?
• Mixed signals so far
• Cross the bridge once when we come to it
Iraq Production: The Official Target

Obstacles to Collusion
• Three critical problems that any collusion must solve if it is to
endure
– Coordination
– Entry
– Cheating
• The issue of entry easiest
– OPEC protected by barriers to entry that stem from ownership and
control of low-cost oil reserves
– Production of crude oil from non-OPEC sources does expand when
OPEC cuts production and pushes prices up but scope become more
limited
– Entry from within OPEC remains an issue

OPEC as a Heterogonous Entity & Coordination
• Economic and demographic heterogeneity– Interests of individual OPEC members do not naturally align behind a
single “correct” price or production target
• Agreement not only about total amount of oil to be produced by OPEC but how to divide it between individual members– Any given set of quotas determines not only overall profit of OPEC, but
also individual revenues that accrue to each member
– Limited means by which to redistribute earnings among members
• Low-cost, long-lived reserves, and long-horizons– Reluctant to pursue severe output cuts since too-high prices would induce
technological development and new forms of energy
• Smaller reserves and shorter horizons – Prefer deeper production cuts and rise in oil price to maximize revenues
– Manifested in many instances (including disruptions within OPEC like in 1990s)
• “Price hawks” with little power versus “price makers”
• Emergence of clear leadership of Saudi Arabia, professionalization of decision in recent years makes coordination effort easier

Excess Capacity and Coordination• Countries producing below capacity less
incentive to reach agreements on production cuts– Incentive to cheat becomes high especially for
exporting countries with large need for revenues
• Easier to negotiate and reach agreements on preferred utilization rates as many of the member countries would be producing close to or at their maximum capacity
• Excess capacity has two effects on collusion
– Increases incentive for firms to cheat and deviate from agreement
– But implies a more severe punishment for deviating firm and hence less incentive to cheat
– Trade-off works under assumption of power symmetry
• Benign environment for collusion – Price hawks producing close to capacity
– The ability to punish concentrated within the hands of the leader
0
0.5
1
1.5
2
2.5
3
3.5
4
Spare Capacity vs Dec 2010 Supply
3. Climate Change Agenda, Demand Reduction,
and OPEC Response
• Literature on climate change/carbon tax implicitly assumes passive behaviour from producers to oil substitution polices & energy taxes induce only a small loss of welfare as tax revenues kept in domestic economy
• More realistic: producers do not act passively, want to maximise share of rent
• Potential responses– Will divert part of the rent to their pockets through raising prices at front which in
turn will accelerate demand reduction
– Remaining oil demand high inelastic (demand destroyed first is the easiest) and OPEC would then decrease its supply and increase oil prices so as to take full advantage of the „captive‟ residual oil demand
– OPEC will increase its quotas and thus provoke a decrease of oil prices in order to induce a rebound of global oil demand and drive out non-OPEC supply
• Some simulation results not clear on effectiveness of policy (Loulou et al 2008)
– OPEC would derive no advantage in flooding the oil market
– OPEC‟s profits are lower even if drives out non-OPEC supply
– OPEC strategies have almost no impact on the global emissions and climate with and without a climate constraint
• Area in need of further research

4. Does OPEC have Incentive to Increase Market Share?
The more OPEC increases its
market share the lower the payoff
• Higher output offset by lower
prices
Does not have incentive to let
market share rise rapidly
• High oil prices compensate
for the lower market share
Source: IMF (2005)
Profitability of Various OPEC Market Strategies
Al-Qahtani (2004): Neither Saudi Arabia nor
OPEC fully exercises market power
• Could realize higher economic profits
by producing less and driving up crude
prices
•Reasons behind the deviation from the
optimal production levels may include
an array of social and political objectives

OPEC Market Share Stable in Recent Years
1973, 0.53
1985, 0.30
1981, 0.17
1985, 0.06
1991, 0.14
0
0.1
0.2
0.3
0.4
0.5
0.6
19
65
19
66
19
67
19
68
19
69
19
70
19
71
19
72
19
73
19
74
19
75
19
76
19
77
19
78
19
79
19
80
19
81
19
82
19
83
19
84
19
85
19
86
19
87
19
88
19
89
19
90
19
91
19
92
19
93
19
94
19
95
19
96
19
97
19
98
19
99
20
00
20
01
20
02
20
03
20
04
20
05
20
06
20
07
20
08
OPEC Share of Total World Production Saudi Arabia Share of Total World Production

5. Does OPEC has Capability to increase Production?
• OPEC is not an organisation to decide or coordinate investment plans among member countries
– Decision left completely to individual countries
– Affected by general market conditions and local factors
• Determinants of investment in OPEC
– Under-ground factors
– Above ground constraints
• Wars and conflict
• Sanctions
• Organisation of the oil sector & capability of National Oil Company
• Relationship between government and NOC & flow of funds back into industry
• Fiscal system and openness to foreign investment
– Inter-generational considerations and optimisation of the reserve base
– Call on OPEC• „Security of demand‟ vs „security of supply‟
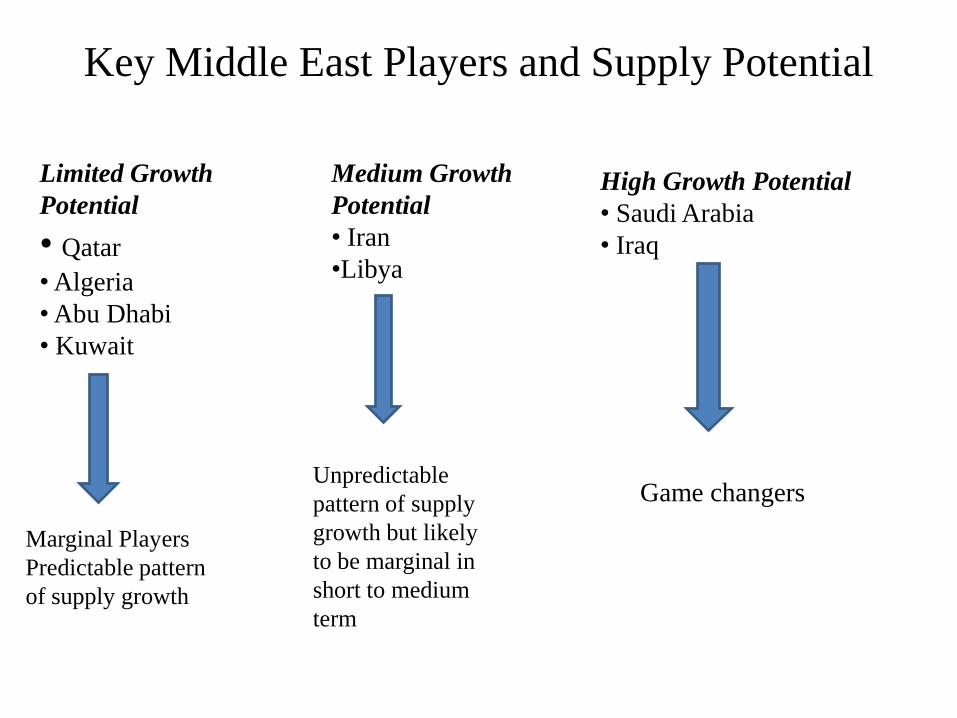
Key Middle East Players and Supply Potential
Limited Growth
Potential
• Qatar
• Algeria
• Abu Dhabi
• Kuwait
Medium Growth
Potential
• Iran
•Libya
High Growth Potential
• Saudi Arabia
• Iraq
Marginal Players
Predictable pattern
of supply growth
Unpredictable
pattern of supply
growth but likely
to be marginal in
short to medium
term
Game changers
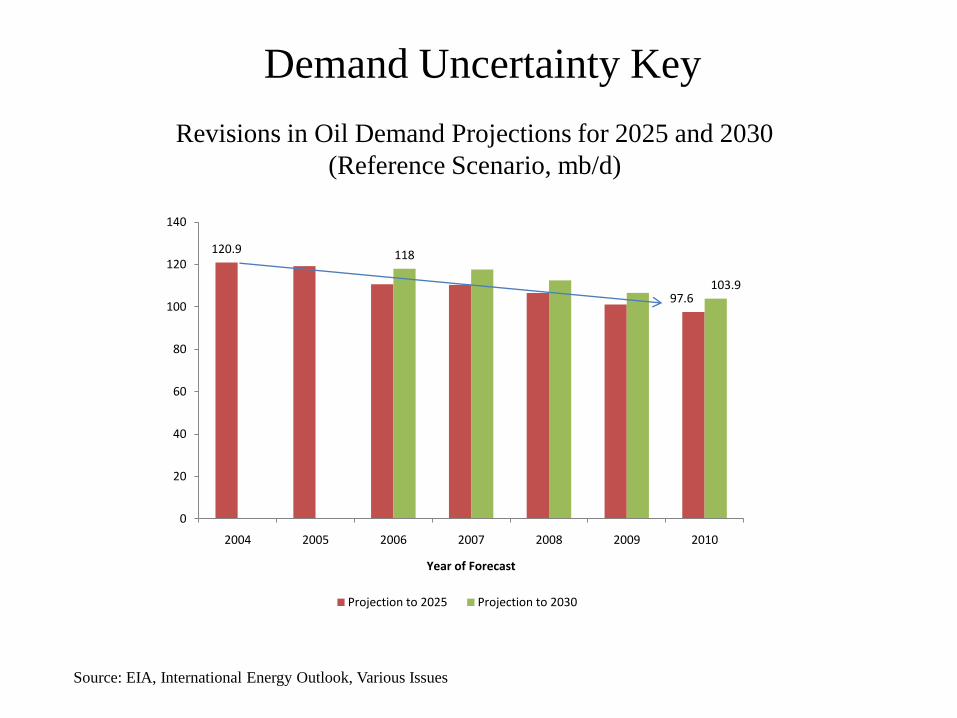
Revisions in Oil Demand Projections for 2025 and 2030
(Reference Scenario, mb/d)
Source: EIA, International Energy Outlook, Various Issues
Demand Uncertainty Key
120.9
97.6
118
103.9
0
20
40
60
80
100
120
140
2004 2005 2006 2007 2008 2009 2010
Year of Forecast
Projection to 2025 Projection to 2030
6. OPEC & Oil Market Structure
• Allows production and investment to shift towards high cost
producers in non-OPEC countries and oil substitutes
• Keep a „floor‟ on oil price so both low cost and high cost
producer co-exist – Ali Naimi, justified $75 target price as “price that marginal producers need to maintain
investments sufficient to provide adequate supplies for future oil consumption needs”
• Implications:
– Oil price, marginal cost and price indeterminacy
• Very low cost floor for crude oil production in OPEC and a very high price
ceiling set by production in non-OPEC and substitutes & futures market
participants‟ expectations
• Market can clear at any price within a wide range depending on market
conditions, perceived short-term elasticities, and interaction among market
participants
• Important implications on short term and long term price behaviour
• OPEC‟s role in influencing the oil price through signalling
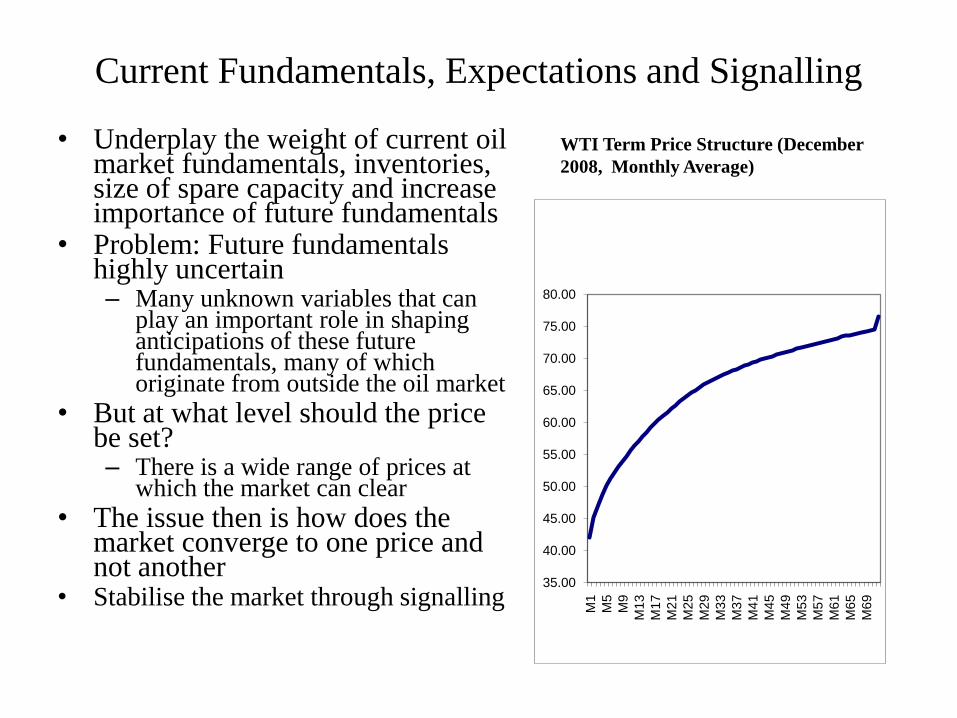
Current Fundamentals, Expectations and Signalling
• Underplay the weight of current oil market fundamentals, inventories, size of spare capacity and increase importance of future fundamentals
• Problem: Future fundamentals highly uncertain– Many unknown variables that can
play an important role in shaping anticipations of these future fundamentals, many of which originate from outside the oil market
• But at what level should the price be set?– There is a wide range of prices at
which the market can clear
• The issue then is how does the market converge to one price and not another
• Stabilise the market through signalling 35.00
40.00
45.00
50.00
55.00
60.00
65.00
70.00
75.00
80.00
M1
M5
M9
M13
M17
M21
M25
M29
M33
M37
M41
M45
M49
M53
M57
M61
M65
M69
WTI Term Price Structure (December
2008, Monthly Average)

Some Signals More Visible than others
Market players can coordinate on choosing a box without communicating with each
other
There is nothing special about the red box other than the fact that it helps players
coordinate their decisions
Such an equilibrium is known as the focal point
Focal Point more visible in falling markets

6. Is OPEC Behaviour Symmetric?
Too High Price
Prospects for economic growth
(especially in developing countries)
Threatens oil demand growth
Too Low Oil Price
Undermines economic development
and social progress
Threatens oil supply growth
“necessity of being proactive under all market conditions”

Asymmetry in OPEC Response
In a Falling Market
Objective
Defend oil prices from falling below some level deemed unacceptable
Mechanism
Impose quotas and implement
output cuts
Issues from Market Perspective
How would the market respond
to announcement of cuts?
Will OPEC be able to
implement the cut?
In Rising Market
Objective:
Increase output in response to customers'
demand at market determined prices Consider itself as price taker
Not to impose a ceiling on oil prices
OPEC was not created to bring prices down
Mechanism
No mechanism exists
OPEC does not offer discounts or auction
spare capacity to bring prices down
Issues
Internal and external political constraints
Learning process about impact of oil price
shocks on growth
Asymmetry in OPEC response
• In a rising market OPEC‟s role is to continue to supply upon demand
– Learning process about the impact of oil shocks on growth
• Lower oil intensity of GDP
• Oil shocks just like many other things that hit the economy
• Offsetting policy responses
• Monetary policy response if no change in inflationary expectations
• Budget deficits
– Implications: Global economy can grow with persistent rise in oil price
– OPEC does not always have the tools to bring prices down
– Political constraints
• Implication: Feedback mechanism from OPEC absent
– Affected market‟s long term expectations
– Contributed in parallel to the parallel shift in the back end of the curve


