OIL MARKET OUTLOOK AND OIL MARKET OUTLOOK AND OIL MARKET OUTLOOK AND OIL MARKET OUTLOOK AND WHAT NEXT FOR THE SOUTH WHAT NEXT FOR THE SOUTH WHAT NEXT FOR THE SOUTH WHAT NEXT FOR THE SOUTH EAST ASIAN EAST ASIAN EAST ASIAN EAST ASIAN OFFSHORE OFFSHORE OFFSHORE OFFSHORE MARKET MARKET MARKET MARKET VIJAY KRISHNAN
Transcript
OIL MARKET OUTLOOK AND OIL MARKET OUTLOOK AND OIL MARKET OUTLOOK AND OIL MARKET OUTLOOK AND WHAT NEXT FOR THE SOUTH WHAT NEXT FOR THE SOUTH WHAT NEXT FOR THE SOUTH WHAT NEXT FOR THE SOUTH
EAST ASIAN EAST ASIAN EAST ASIAN EAST ASIAN OFFSHORE OFFSHORE OFFSHORE OFFSHORE MARKETMARKETMARKETMARKET
VIJAY KRISHNAN
rystad energyrystad energyrystad energyrystad energy
introduction
Office locations• Rystad Energy is an independent
databases and consulting services firm, started in 2004, headquartered in Oslo, Norway.
• Provides a range of upstream E&P and oilfield service business intelligence data solutions built from a bottom up perspective across every single asset
• A leading advisor within strategy, market analysis and business development
• Publishing standard and customized research reports on high impact industry topics
• Insight and deliveries based on proprietary, fundamental research from primary sources
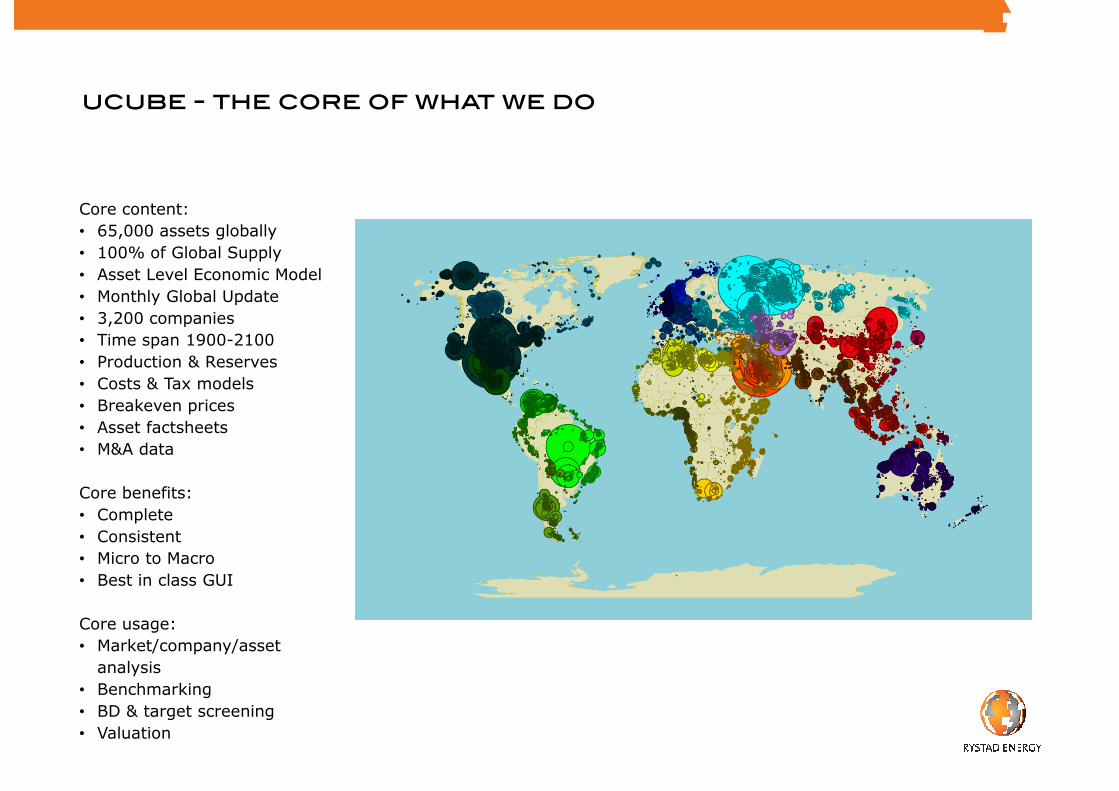
Core content:
• 65,000 assets globally
• 100% of Global Supply
• Asset Level Economic Model
• Monthly Global Update
• 3,200 companies
• Time span 1900-2100
• Production & Reserves
• Costs & Tax models
• Breakeven prices
• Asset factsheets
• M&A data
Core benefits:
• Complete
• Consistent
• Micro to Macro
• Best in class GUI
Core usage:
• Market/company/asset
analysis
• Benchmarking
• BD & target screening
• Valuation
ucube - the core of what we do
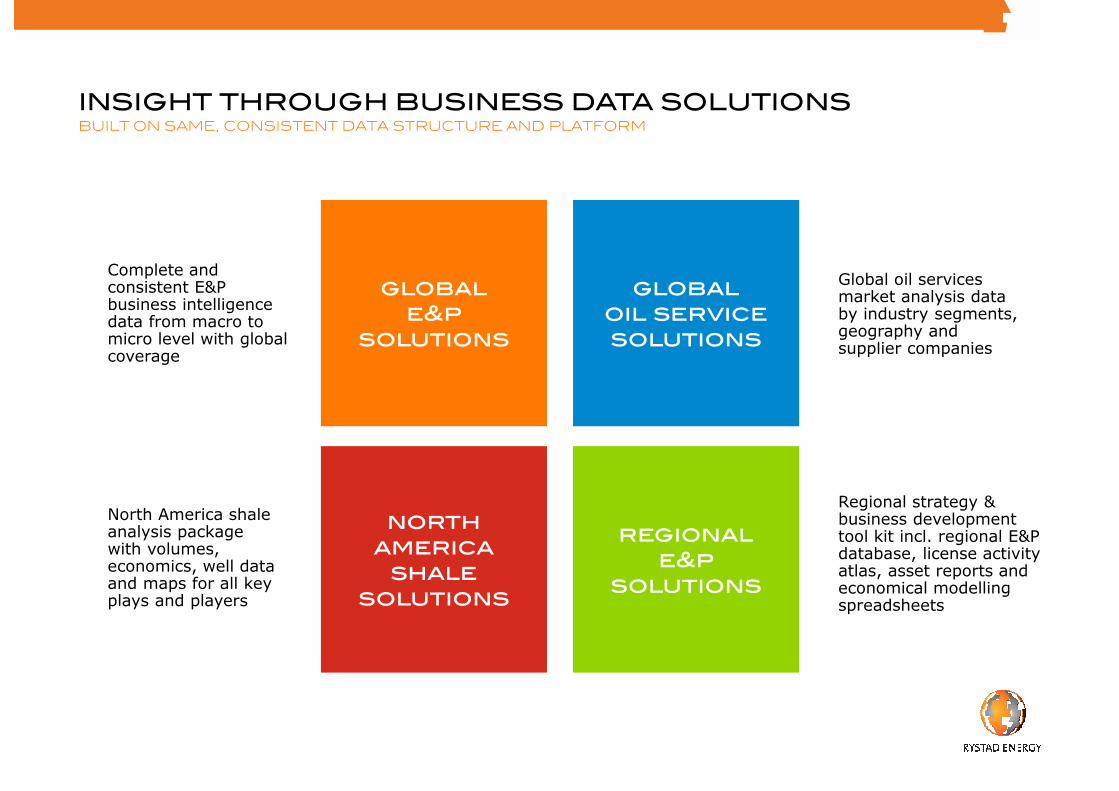
INSIGHT THROUGH BUSINESS DATA SOLUTIONSBUILT ON SAME, CONSISTENT DATA STRUCTURE AND PLATFORM
Complete and consistent E&P business intelligence data from macro to micro level with global coverage
North America shale analysis package with volumes, economics, well data and maps for all key plays and players
Global oil services market analysis data by industry segments, geography and supplier companies
Regional strategy & business development tool kit incl. regional E&P database, license activity atlas, asset reports and economical modelling spreadsheets
regional
e&p
solutions
regional
e&p
solutions
global
e&p
solutions
global
e&p
solutions
global
oil service
solutions
global
oil service
solutions
north
america
shale
solutions
north
america
shale
solutions
Rystad EnergyOil & gas
knowledge house
NOCs
Majors
E&Ps
Investment banks
Investors
Consulting firms
Oilfield service
Governments/Organizations
SERVING ALL OIL & GAS CLIENT SEGMENTS
JW19
Slide 5
JW19 Work more on colour coding here and use company specific coloursJulia Weiss, 30/11/2016
How we got here: the generic commodity cycle
Higher
reinvestment
increases
production
Production
outpaces
demand
Demand
outpaces
productionLow reinvestment
hurts production
Prices drop,
hurting cash
flow and
returns
Cash flow
declines,
spending
cuts, lay offs
Increased
investment,
capacity
issues
Higher prices
improve cash
flows
A commodity market with no “price maker” endlessly repeats this cycle
The cycle begins: in 2014, a large imbalance between supply and demand was looming
Stocks draw in 2017 on cuts, in medium term still tight Stocks draw in 2017 on cuts, in medium term still tight Stocks draw in 2017 on cuts, in medium term still tight Stocks draw in 2017 on cuts, in medium term still tight market due to lack of sanctioningmarket due to lack of sanctioningmarket due to lack of sanctioningmarket due to lack of sanctioning
Source: Rystad Energy research and analysis
• Global liquids supply and demand
• Million bbl/d
11
82
84
86
88
90
92
94
96
98
100
102
104
2012 2013 2014 2015 2016 2017 2018 2019 2020 2021
Total Demand
Total Supply
ForecastHistorical
9.0
9.2
9.4
9.6
9.8
10.0
10.2
10.4
10.6
10.8
Jan
-14
Ma
r-1
4
Ma
y-1
4
Jul-
14
Se
p-1
4
No
v-1
4
Jan
-15
Ma
r-1
5
Ma
y-1
5
Jul-
15
Se
p-1
5
No
v-1
5
Jan
-16
Ma
r-1
6
Ma
y-1
6
Jul-
16
Se
p-1
6
No
v-1
6
Jan
-17
Ma
r-1
7
Ma
y-1
7
Jul-
17
Se
p-1
7
No
v-1
7
KSA RE base case
KSA Target cut
KSA prepared to force compliance and we expect KSA prepared to force compliance and we expect KSA prepared to force compliance and we expect KSA prepared to force compliance and we expect production to be cut below target in 1H 17production to be cut below target in 1H 17production to be cut below target in 1H 17production to be cut below target in 1H 17
• KSA base case crude production, monthly
• Million bbl/d
12
• * This is the scenario called «Full 2017 Cuts + Natural Decline» in the OPEC scenarios on slide 4.
• Source: Rystad Energy research and analysis
ForecastHistorical
Full compliance through maintenance, while Iran Full compliance through maintenance, while Iran Full compliance through maintenance, while Iran Full compliance through maintenance, while Iran increases production through Augincreases production through Augincreases production through Augincreases production through Aug----17171717
Source: Rystad Energy research and analysis
• Selected OPEC countries crude production base case vs. OPEC agreement 30-Nov target production
Six OPEC members struggle to maintain production Six OPEC members struggle to maintain production Six OPEC members struggle to maintain production Six OPEC members struggle to maintain production regardless of the OPEC agreementregardless of the OPEC agreementregardless of the OPEC agreementregardless of the OPEC agreement
*Rest OPEC = Qatar, Ecuador and Gabon. Source: Rystad Energy research and analysis
• Selected OPEC countries crude production base case vs. OPEC agreement 30-Nov target production
• Million bbl/d
14
ForecastHistorical
Production Production Production Production to to to to drop by 260 drop by 260 drop by 260 drop by 260 kbblkbblkbblkbbl/d in 1H 17 against the /d in 1H 17 against the /d in 1H 17 against the /d in 1H 17 against the reference reference reference reference level, level, level, level, mostly through mostly through mostly through mostly through declinesdeclinesdeclinesdeclines
Source: Rystad Energy research and analysis
0.4
0.6
0.8
1.0
1.2
1.4
1.6
1.8
2.0
2.2Ja
n-1
6
Fe
b-1
6
Ma
r-1
6
Ap
r-1
6
Ma
y-1
6
Jun
-16
Jul-
16
Au
g-1
6
Se
p-1
6
Oct
-16
No
v-1
6
De
c-1
6
Jan
-17
Fe
b-1
7
Ma
r-1
7
Ap
r-1
7
Ma
y-1
7
Jun
-17
Jul-
17
Au
g-1
7
Se
p-1
7
Oct
-17
No
v-1
7
De
c-1
7
ForecastHistorical
Mexico
Kazakhstan
Oman
Azerbaijan
Malaysia
Other non-OPEC
• .
• Liquids production profile for non-OPEC countries
• Million bbl/d
1
5
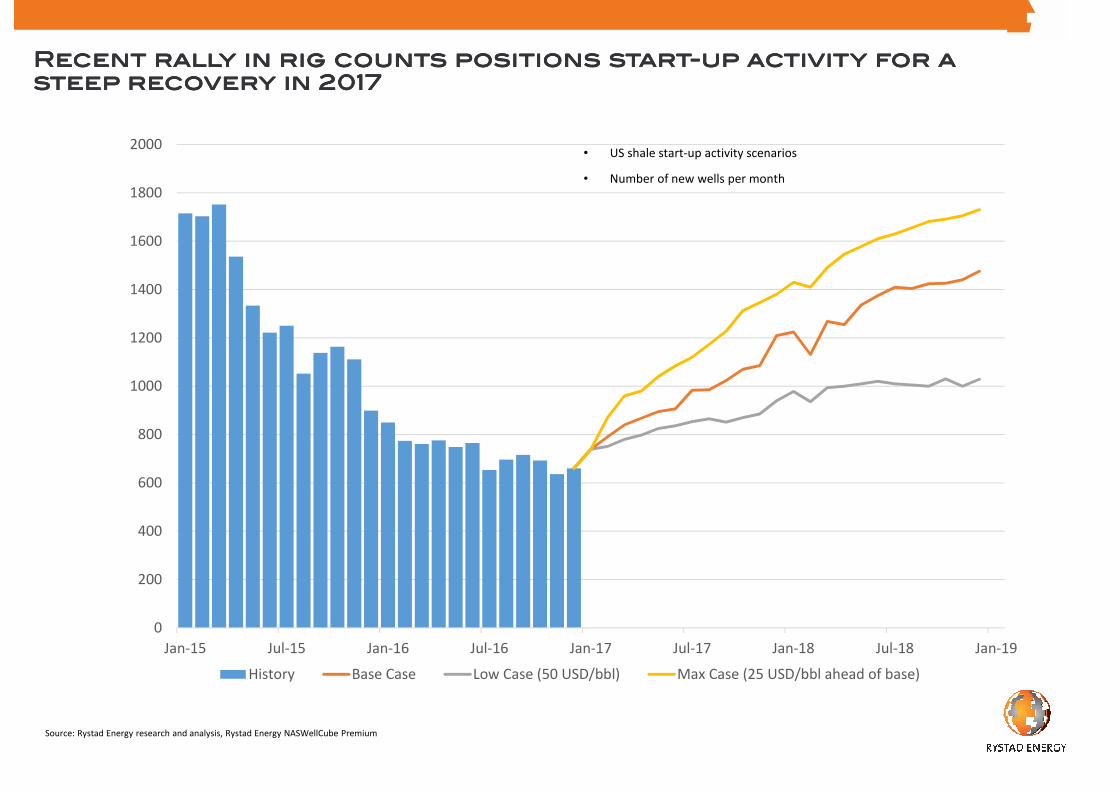
Recent rally in rig counts positions startRecent rally in rig counts positions startRecent rally in rig counts positions startRecent rally in rig counts positions start----up activity for a up activity for a up activity for a up activity for a steep recovery in 2017steep recovery in 2017steep recovery in 2017steep recovery in 2017
Source: Rystad Energy research and analysis, Rystad Energy NASWellCube Premium
History Base Case Low Case (50 USD/bbl) Max Case (25 USD/bbl ahead of base)
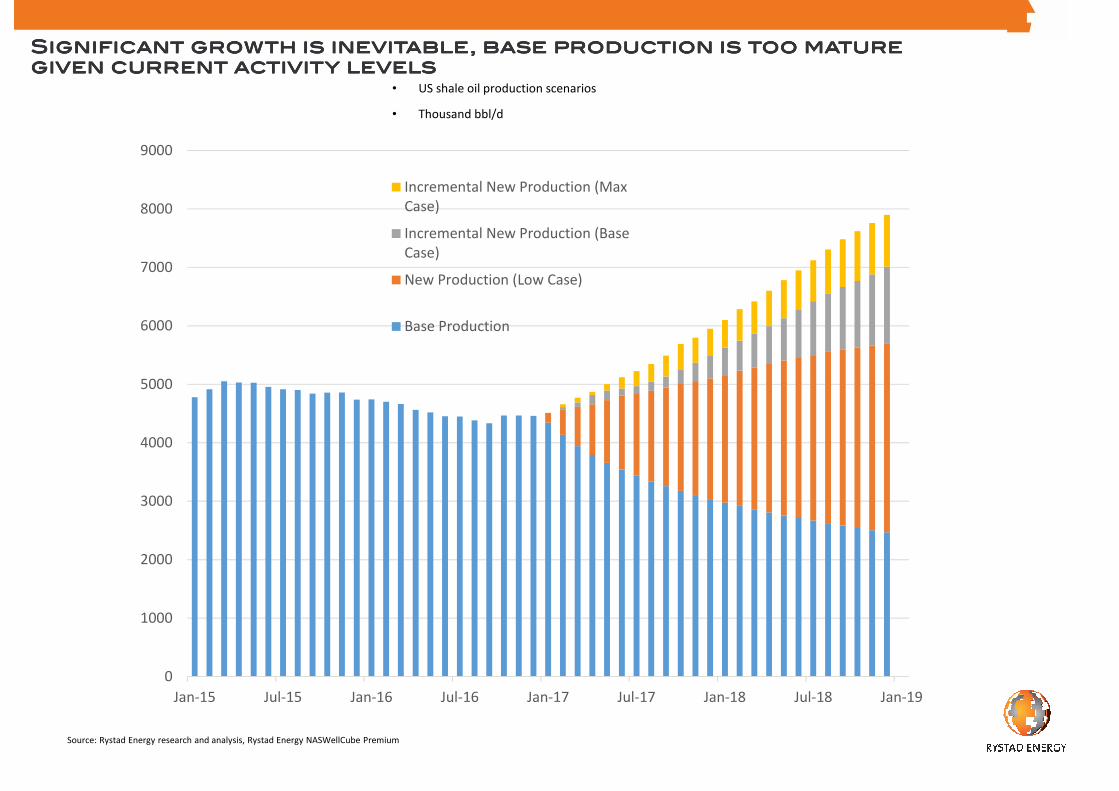
Significant growth is inevitable, base production is too mature Significant growth is inevitable, base production is too mature Significant growth is inevitable, base production is too mature Significant growth is inevitable, base production is too mature given current activity levelsgiven current activity levelsgiven current activity levelsgiven current activity levels
Source: Rystad Energy research and analysis, Rystad Energy NASWellCube Premium
Weaker 1Q and stronger remainder of the year demand Weaker 1Q and stronger remainder of the year demand Weaker 1Q and stronger remainder of the year demand Weaker 1Q and stronger remainder of the year demand result in overall higher 2017 growthresult in overall higher 2017 growthresult in overall higher 2017 growthresult in overall higher 2017 growth
Source: Rystad Energy research and analysis
• World liquids demand growth y/y
• Million bbl/d
1
8
ICE Brent crude historical front month price, latest five ICE Brent crude historical front month price, latest five ICE Brent crude historical front month price, latest five ICE Brent crude historical front month price, latest five year futures curve and UCube base caseyear futures curve and UCube base caseyear futures curve and UCube base caseyear futures curve and UCube base case
4560
67
59
62
0
20
40
60
80
100
120
140
Nov-10 Nov-11 Nov-12 Nov-13 Nov-14 Nov-15 Nov-16 Nov-17UCube base case Futures curve Brent front month
Source: Bloomberg, Rystad Energy research and analysis
E&P companies to keep investment flat E&P companies to keep investment flat E&P companies to keep investment flat E&P companies to keep investment flat in 2017 with some positive in 2017 with some positive in 2017 with some positive in 2017 with some positive upside riskupside riskupside riskupside risk
revision of the short and long termservice market. This is the effect of
more clarity around oil supply and
E&P companies being cautious
before the OPEC meeting.
The short term service segment
purchases from 2015-2017 is now at
-9.5%, down from -8.8%.
Long term we still see an average
growth of 10%.
Source: Rystad Energy DCube
Purchases of oilfield servicesUSD Billion
Average 62 USD/Average 62 USD/Average 62 USD/Average 62 USD/bblbblbblbbl oil price in 2017 suggests broadly flat growth oil price in 2017 suggests broadly flat growth oil price in 2017 suggests broadly flat growth oil price in 2017 suggests broadly flat growth for the OFS marketfor the OFS marketfor the OFS marketfor the OFS market
2015 2017 2021Short term Long term
CAGR-9.5%
CAGR10.0%
100
5447
62
75
8897
105
0
20
40
60
80
100
120
2014 2016 2018 2020
Brent Oil Price with Rystad Forward CurveUSD/bbl
Floater fixture volumes and rig rates have been trending Floater fixture volumes and rig rates have been trending Floater fixture volumes and rig rates have been trending Floater fixture volumes and rig rates have been trending downwardsdownwardsdownwardsdownwards
14 12
38
1629
4533
54
3750
78
39
123
58
101
57
2939
1728
7
28
14
27
7 11 10 13 13 11 60
20
40
60
80
100
120
140
160
180
200
0
100
200
300
400
500
600
1Q09 1Q10 1Q11 1Q12 1Q13 1Q14 1Q15 1Q16
Rig Supply Years (rhs)
Rig Rate USD (lhs)
Rig rates (kUSD/day) # fixed rig years
The same situation for The same situation for The same situation for The same situation for jackupsjackupsjackupsjackups but lower activitybut lower activitybut lower activitybut lower activity
*As of 22.09.2016Source: RigCube September 2016
- 30
- 20
- 10
0
10
20
30
40
50
60
70
80
90
100
1975 1980 1985 1990 1995 2000 2005 2010 2015 2020
Construction
Retired
Jackup construction and retirement
Number of units
19 units retired in 2015
20 units retired in 2016*
Jackups
2015 & 2016 with largest number of retired rigs in more than 40 years2015 & 2016 with largest number of retired rigs in more than 40 years2015 & 2016 with largest number of retired rigs in more than 40 years2015 & 2016 with largest number of retired rigs in more than 40 years
*As of 22.09.2016Source: RigCube September 2016
Floaters
Floater construction and retirement
Number of units
- 30
- 25
- 20
- 15
- 10
- 5
0
5
10
15
20
25
30
35
1975 1980 1985 1990 1995 2000 2005 2010 2015 2020
Semisubmersible
Drillships
Retired Semisubmersible
Retired Drillship
28 units retired in 2015
22 units retired in
2016*
Utilization will start to recover during 2018 assuming no further Utilization will start to recover during 2018 assuming no further Utilization will start to recover during 2018 assuming no further Utilization will start to recover during 2018 assuming no further retirementsretirementsretirementsretirements
* Total supply is gross supply for the fleet and includes all rigs, including ready stacked and cold stacked.Source: RigCube September 201625
• Global supply* and demand for floating drilling rigs
• Number of rigs
Implied77% 81% 84% 86% 84% 81% 79% 82% 85% 82%
73%57% 51% 53% 60% 65%
0
50
100
150
200
250
300
350
400
2005 2010 2015 2020
Demand Total supply
Historical average 83%
Utiliz
ation
Tota
l fleet
Floaters
Recovery from 2018 for all segments Recovery from 2018 for all segments Recovery from 2018 for all segments Recovery from 2018 for all segments
Source: DCube November 2016
• Purchases of oilfield services
• Annual change
6%5%
-20%
-18%
0%
9% 9%10%
-30%
-25%
-20%
-15%
-10%
-5%
0%
5%
10%
15%
20%
2013 2014 2015 2016 2017 2018 2019 2017-2021
CAGR
Maintenance and Operations
EPCI
Subsea
Drilling Contractors
Well Services and Commodities
Seismic
All OFS Purhases
But the rebound varies across regions and segments in 2017 But the rebound varies across regions and segments in 2017 But the rebound varies across regions and segments in 2017 But the rebound varies across regions and segments in 2017 Oilfield service growth
Source: DCube
-40%
-30%
-20%
-10%
0%
10%
20%
30%
2015 2016 2017 2018
-40%
-30%
-20%
-10%
0%
10%
20%
30%
2015 2016 2017 2018
-40%
-30%
-20%
-10%
0%
10%
20%
30%
2015 2016 2017 2018
-40%
-30%
-20%
-10%
0%
10%
20%
30%
2015 2016 2017 2018
-40%
-30%
-20%
-10%
0%
10%
20%
30%
2015 2016 2017 2018
North America
South America Africa and Middle East Asia and CIS
Europe
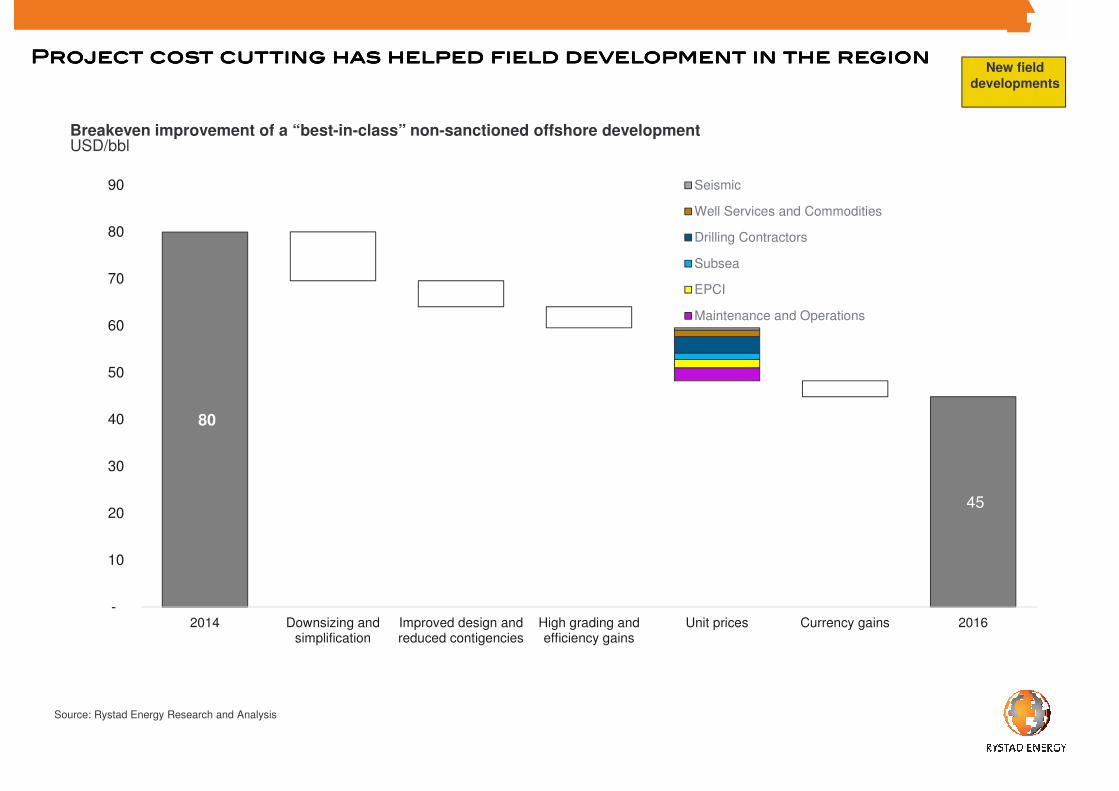
Project cost cutting has helped field development in the regionProject cost cutting has helped field development in the regionProject cost cutting has helped field development in the regionProject cost cutting has helped field development in the region
Source: Rystad Energy Research and Analysis
Breakeven improvement of a “best-in-class” non-sanctioned offshore developmentUSD/bbl
80
45
-
10
20
30
40
50
60
70
80
90
2014 Downsizing andsimplification
Improved design andreduced contigencies
High grading andefficiency gains
Unit prices Currency gains 2016
Seismic
Well Services and Commodities
Drilling Contractors
Subsea
EPCI
Maintenance and Operations
49.3
7.3
New field
developments
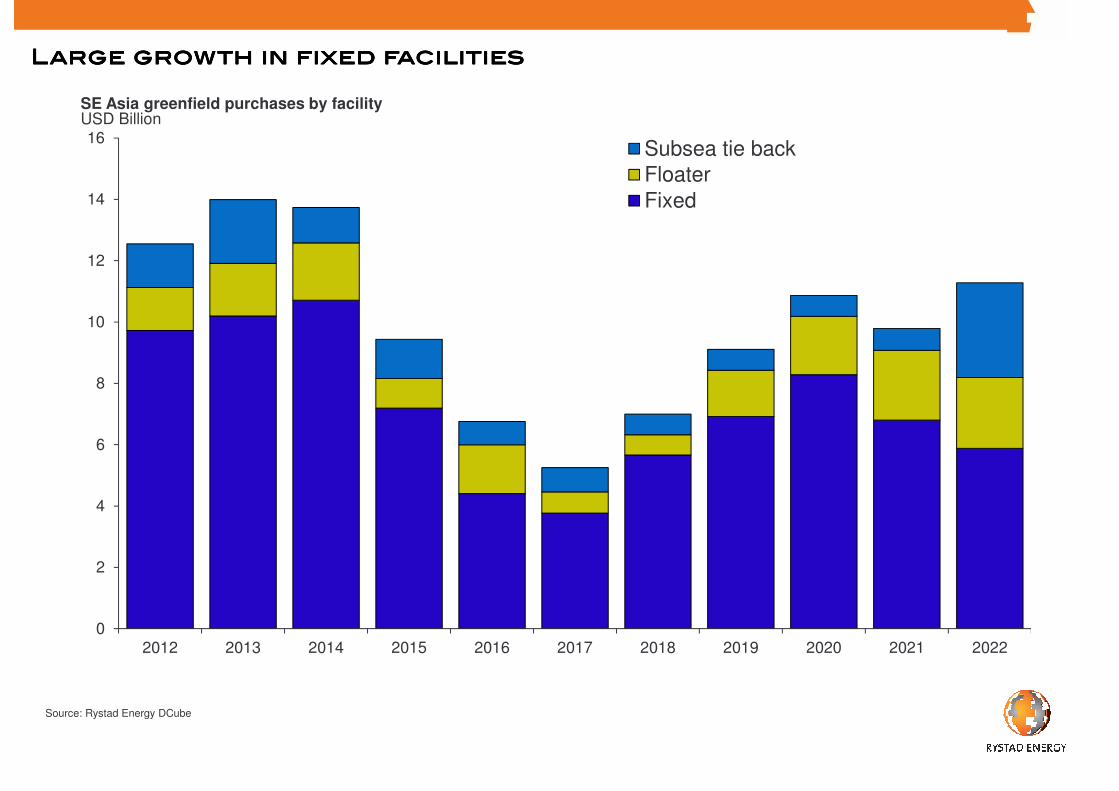
Shallow water investments drive the decline in Southeast Asia, but Shallow water investments drive the decline in Southeast Asia, but Shallow water investments drive the decline in Southeast Asia, but Shallow water investments drive the decline in Southeast Asia, but also the rebound…also the rebound…also the rebound…also the rebound…
Offshore purchases from investments by supply segmentUSD billions
- 26%
- 33%CAGR: 16%
Southeast Asian growth will come from new developments and Southeast Asian growth will come from new developments and Southeast Asian growth will come from new developments and Southeast Asian growth will come from new developments and Brownfield investmentBrownfield investmentBrownfield investmentBrownfield investment
Source: Rystad Energy DCube
SE Asia purchases of offshore oilfield servicesUSD Billion
SE Asia purchases of offshore oilfield servicesUSD Billion
Although lower volumes, there are still exciting opportunities Although lower volumes, there are still exciting opportunities Although lower volumes, there are still exciting opportunities Although lower volumes, there are still exciting opportunities around the world!around the world!around the world!around the world!
Mozambique:
•Coral FLNG
•Area 1 LNG
•Area 4 LNG
Brazil:
•Libra Pilot
•Sepia
•Buzios
•Marlim revitalization
West Africa:
•Bonga SW
•Zabazaba/Etan
GoM:
•Appomattox
•Mad Dog Phase 2
•Shenandoah
North Sea:
• Johan Castberg
•Wisting
•Alta/Gotha
•Culzean
Australia:
• Browse FLNG
India:
•KG-DWN-98/2
Indonesia:
•Abadi FLNG/onshore
•Gendalo-Gehem
Mediterranean:
•Leviathan
•Zohr
Legend
Size of circle =
1 BUSD
Offshore capex 2017-2022USD billion
Source: Rystad Energy research and analysis, DCube
Spending in Offshore Southeast AsiaSpending in Offshore Southeast AsiaSpending in Offshore Southeast AsiaSpending in Offshore Southeast Asia
3
3
Greenfield
Exploration
Brownfield
33
Greenfield
Exploration
Brownfield
Petronas, Shell, Chevron and Total are the biggest spenders Petronas, Shell, Chevron and Total are the biggest spenders Petronas, Shell, Chevron and Total are the biggest spenders Petronas, Shell, Chevron and Total are the biggest spenders during the recoveryduring the recoveryduring the recoveryduring the recovery
Source: Rystad Energy DCube
SE Asia purchases of offshore oilfield servicesUSD Billion
Investment in greenfield projects favors large fieldsInvestment in greenfield projects favors large fieldsInvestment in greenfield projects favors large fieldsInvestment in greenfield projects favors large fields