16
Oil palm and Green Economy in Indonesia: lessons from East Kalimantan LEDs Asia Forum, Jogjakarta, 10-13 November 2014 Krystof Obidzinski, CIFOR
| Date post: | 15-Jul-2015 |
| Category: |
Environment |
| Upload: | center-for-international-forestry-research-cifor |
| View: | 717 times |
| Download: | 0 times |

Oil palm and Green Economy in Indonesia: lessons from East Kalimantan
LEDs Asia Forum, Jogjakarta, 10-13 November 2014
Krystof Obidzinski, CIFOR

1. Background: Indonesia CO2 emissions
1.2 Gt

2. GHG emissions in East Kalimantan

3. GHG emissions and Green Economy in E. Kalimantan
BAU Scenario
GE = Reduce GHG 15.7% by 2020 (RAN-GRK)
Source: McKinsey Report
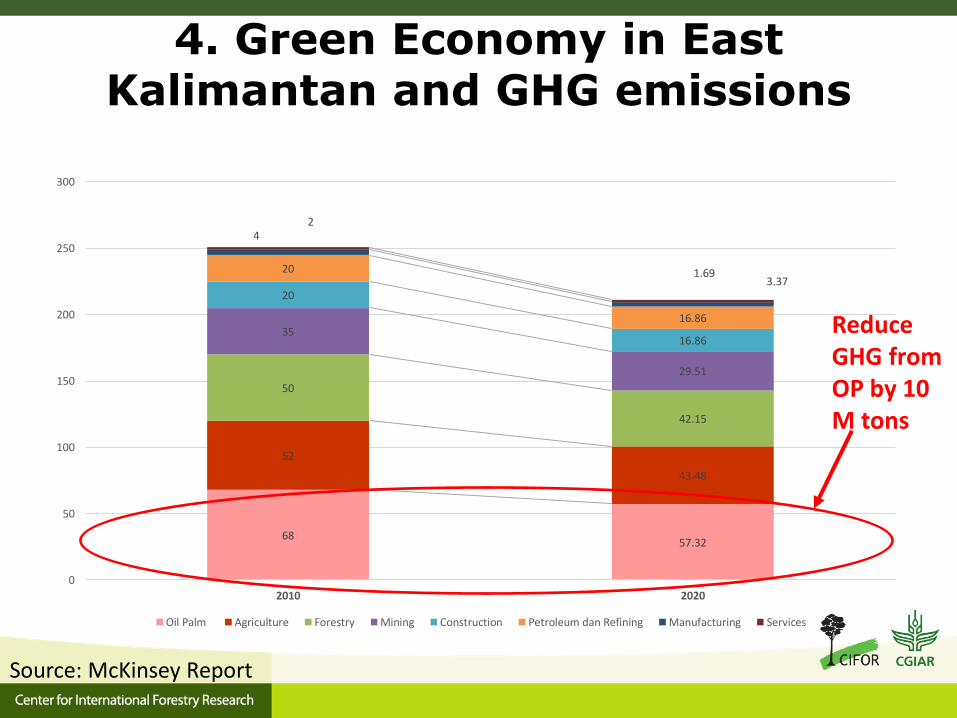
4. Green Economy in East Kalimantan and GHG emissions
68 57.32
52
43.48
50
42.15
35
29.51
20
16.86
20
16.86
4
3.37
2
1.69
0
50
100
150
200
250
300
2010 2020
Oil Palm Agriculture Forestry Mining Construction Petroleum dan Refining Manufacturing Services
Reduce GHG from OP by 10 M tons
Source: McKinsey Report

5. Scenarios
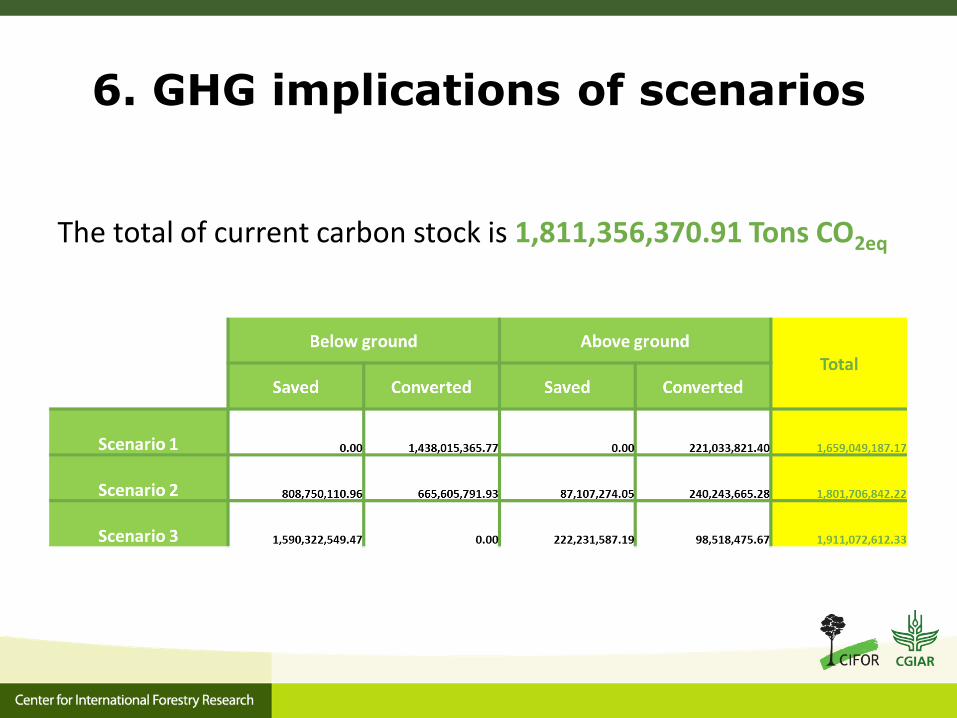
6. GHG implications of scenarios
The total of current carbon stock is 1,811,356,370.91 Tons CO2eq
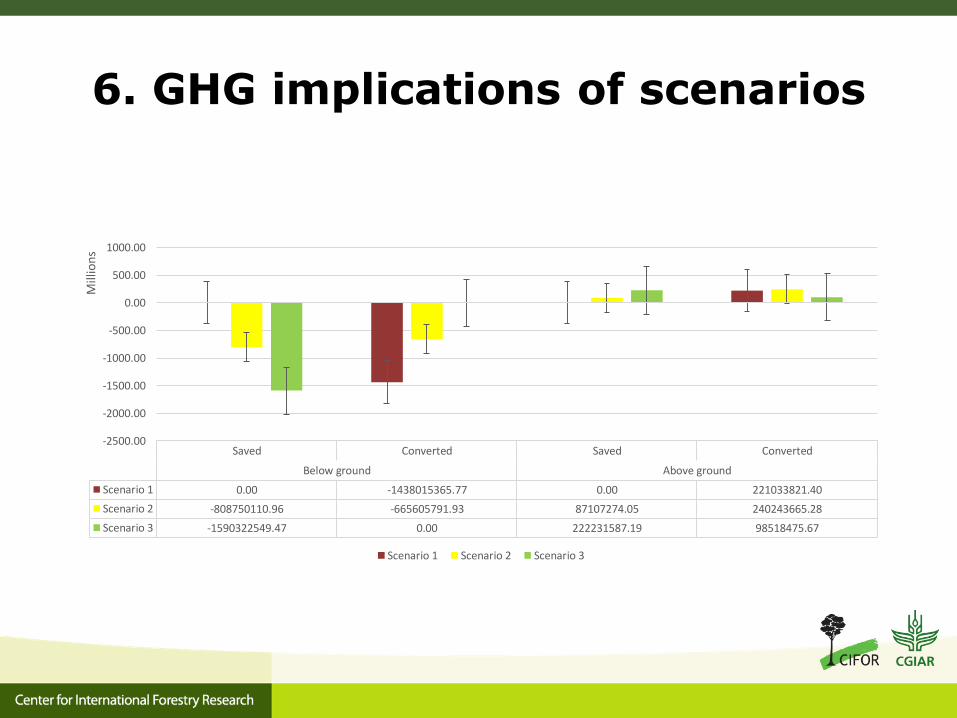
6. GHG implications of scenarios
Saved Converted Saved Converted
Below ground Above ground
Scenario 1 0.00 -1438015365.77 0.00 221033821.40
Scenario 2 -808750110.96 -665605791.93 87107274.05 240243665.28
Scenario 3 -1590322549.47 0.00 222231587.19 98518475.67
-2500.00
-2000.00
-1500.00
-1000.00
-500.00
0.00
500.00
1000.00
Mill
ion
s
Scenario 1 Scenario 2 Scenario 3

Landcover in East Kalimantan in 2011

Land cover in East Kalimantan under Scenario 1

Land cover in East Kalimantan under Scenario 2

Land cover in East Kalimantan under Scenario 3

Indicative value of ecosystem services Lost under each scenario
25.73
20.01
6.27
0.00 5.00 10.00 15.00 20.00 25.00 30.00
SCENARIO 1
SCENARIO 2
SCENARIO 3
USD Billions
Source: Constanza et al 2014

Conclusions Scenario 3 most optimal for GHG reduction in OP to
meet the Green Economy target
PES loss also lowest
However, Scenario 3 results in 1.6 M ha (50%) of allocated plantation area being taken out of development
Degraded land is all under commercial concessions and thus unavailable to offset the loss of the plantation area
Scenario 3 has the additionality of 100M tons of CO2 eq, thus the cut off threshold of 35 tons of CO2 /ha could be adjusted upwards to 45-50 tons of CO2 /ha
This would enable OP to be in line with the GE target and keep the loss of the plantation area to below 1 M ha

Commercial land availability in East Kalimantan


