27
Oil Price Recovery: What does that mean for steel? Nicole J. Leonard, Senior Consultant Commodities Consulting, Bentek Energy

No content below the line No content below the line
Oil Price Recovery: What does that mean for steel? Nicole J. Leonard, Senior Consultant Commodities Consulting, Bentek Energy

No content below the line No content below the line
Why I’m bearish short-term oil prices, bullish long-term prices
2

No content below the line No content below the line
Crude and liquids drive drilling and production activity, not much gas-by-rail activity
$- $2.00 $4.00 $6.00 $8.00
$10.00 $12.00 $14.00 $16.00 $18.00 $20.00
$/M
MB
tu E
quiv
alen
t
Historical Commodity Price Spreads
Brent WTI Mont Belvieu HH CAPP
3 Source: S&P Global Platts Analytics

No content below the line No content below the line
Bentek maintains bearish stance through 2017, remains bullish compared to the market
4
$-
$20.00
$40.00
$60.00
$80.00
$100.00
$120.00
$140.00
$/bb
l
Bentek’s Brent Price Forecast
History Feb-15 Current
Source: S&P Global Platts Analytics, Bentek
Volatility driven by
supply uncertainty

No content below the line No content below the line
OPEC cuts seem to be on target, risks and duration create uncertainty and volatility
5
(0.60)
(0.50)
(0.40)
(0.30)
(0.20)
(0.10)
0.00
0.10
0.20
MM
b/d
Change in OPEC Production by Country (Oct – Jan)
Change in Production Proposed Cut
Proposed cut: 1.2 MMb/d Platts estimate: 0.9 MMb/d
Source: S&P Global Platts Estimates

No content below the line No content below the line
Non-OPEC countries still planning supply growth
6
Moho, Congo 140 Mb/d in
2017
Edvard Greig, Norway
100 Mb/d in 2017
Cidade de Itaguai FPSO, Brazil
150 Mb/d in 2017
Filanvovsky and Pyakyakhinskoye 110 Mb/d in 2017
GLOBAL SUPPLY PROJECTS RAMPING UP IN 2017
Canadian Oil Sands ~300 Mb/d in 2017
*
*
* * *
* * *
* * *
* Non-OPEC countries participating in production cut. Source: S&P Global Platts Analytics Bentek

No content below the line No content below the line
“But don’t worry, America still has more oil than we can use in 500 years.”
7
$25
$45
$65
$85
$105
$125
$/bb
l
Historical Brent Prices and Forward Curve
Hisory Forward Curve (Mar 3)
Source: S&P Global Platts Analytics, Bentek

No content below the line No content below the line
Bakken 40/+9 (30%)
Anadarko 113/+41 (57%)
Niobrara 26/+8 (44%)
Eagle Ford 74/+28 (61%)
Permian 318/+166 (112%)
Active rig count: Mar 3, 2017 / Change in rig count from Mar 4, 2016
Rigs return to oil plays on higher prices, rigs also return to gas plays on bullish market
TOTAL US 874/+353
(68%)
US Rig Count (Oct ’14)
2,143 -60% from
peak
Source: S&P Global Platts Analytics RigData 8

No content below the line No content below the line
Do breakevens even matter?
9
Henry Hub (Jan 19):
$3.26/MMbtu
Source: S&P Global Platts Analytics Bentek 9

No content below the line No content below the line
Prices remain above breakeven floor, yet production does not recover
10
$0
$1
$2
$3
$4
$5
$6
$7
50
55
60
65
70
75
Pric
e ($
/Mm
btu)
Prod
uctio
n (B
cf/d
)
US Natural Gas Production v Prices
ProductionHenry Hub Natural Gas PriceAvg Gas Breakeven Price
$0
$20
$40
$60
$80
$100
$120
5
6
6
7
7
8
8
9
9
10
10
Pric
e ($
/Mm
btu)
Prod
uctio
n (M
Mb/
d)
US Crude Oil Production v Prices
ProductionWTI Crude Oil PriceAvg Oil Breakeven Price
Source: S&P Global Platts Analytics

No content below the line No content below the line
What happened to efficiencies or has debt finally crippled US producers?
11
-$40
-$20
$0
$20
$40
$60
$80
$bn
Debt/Stock Issued v Repaid
Issuance of Common Stock Repurchase of Common Stock
Total Debt Repaid Total Debt Issued
Balance
Source: S&P Global Platts Analytics Bentek, S&P Capital IQ
0.0
0.2
0.4
0.6
0.8
1.0
1.2
1.4
1.6
$bn
US/Canada E&P Net Debt/EBITDA

No content below the line No content below the line
Public producers selling, not acquiring, selling mostly private money and independents
12
-$15-$10
-$5$0$5
$10$15$20
bn$
US/Canada Acquisitions v Divestitures
Divestitures Sale of Property Cash Acquisitions
0.00.51.01.52.02.53.03.54.04.5
bn$
Publically Announced Private M&A by Value
Source: S&P Global Platts Analytics Bentek, S&P Capital IQ
No content below the line No content below the line
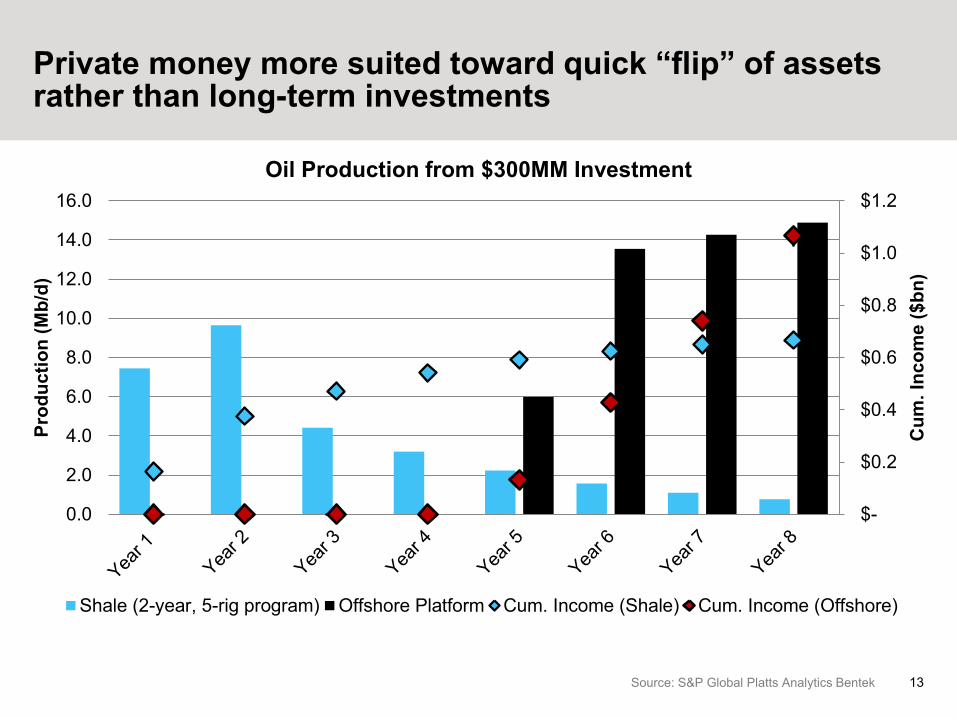
Private money more suited toward quick “flip” of assets rather than long-term investments
13
$-
$0.2
$0.4
$0.6
$0.8
$1.0
$1.2
0.0
2.0
4.0
6.0
8.0
10.0
12.0
14.0
16.0
Cum
. Inc
ome
($bn
)
Prod
uctio
n (M
b/d)
Oil Production from $300MM Investment
Shale (2-year, 5-rig program) Offshore Platform Cum. Income (Shale) Cum. Income (Offshore)
Source: S&P Global Platts Analytics Bentek

No content below the line No content below the line
Who’s investing in the long-term, low-decline assets?
14
$-
$20.00
$40.00
$60.00
$80.00
$100.00
$120.00
$140.00
$/bb
l
Bentek’s Brent Price Forecast
History Feb-15 Current
Source: S&P Global Platts Analytics, Bentek
Prices incent production growth to meet demand growth
No content below the line No content below the line
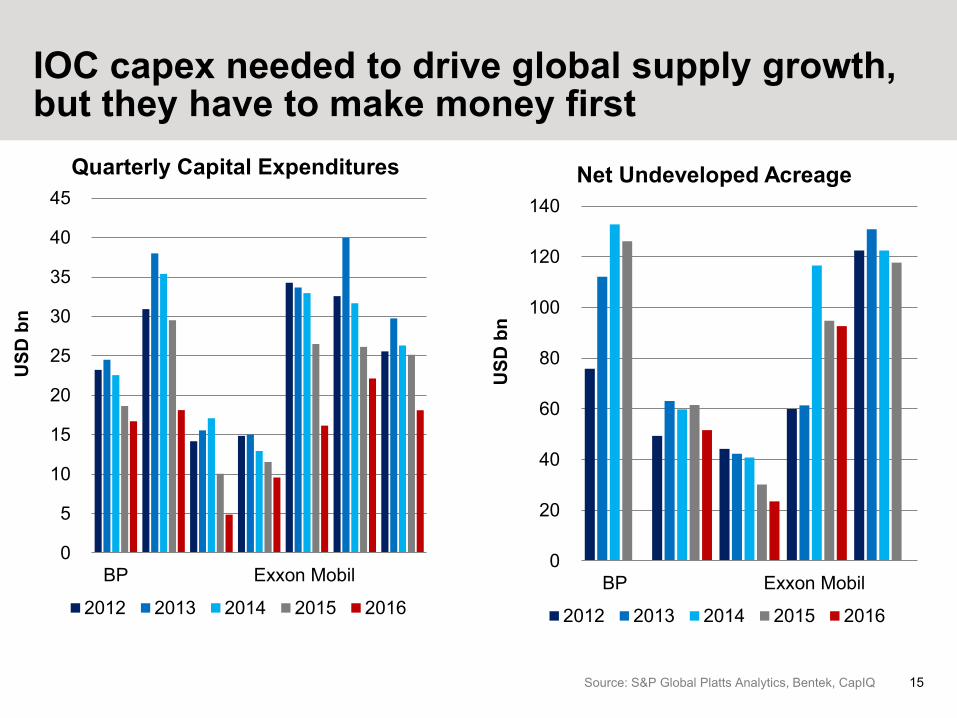
IOC capex needed to drive global supply growth, but they have to make money first
15
0
5
10
15
20
25
30
35
40
45
BP Exxon Mobil
USD
bn
Quarterly Capital Expenditures
2012 2013 2014 2015 2016
Source: S&P Global Platts Analytics, Bentek, CapIQ
0
20
40
60
80
100
120
140
BP Exxon Mobil
USD
bn
Net Undeveloped Acreage
2012 2013 2014 2015 2016

No content below the line No content below the line
Exports drive natural gas demand growth of over 15 Bcf/d in just five years
16 Source: S&P Global Platts Analytics, Bentek
-5.0
0.0
5.0
10.0
15.0
20.0
Bcf
/d
US Natural Gas Demand Growth from 2016
Mexico ExportsLNG ExportIndustrialRes/CommPower Burn

No content below the line No content below the line
Higher gas prices on higher exports could drive drilling activity in dry gas plays
17
$1.50
$2.00
$2.50
$3.00
$3.50
$4.00
$4.50
$/M
Mbt
u
Henry Hub Price Forecast v NYMEX Forward Curve
Bentek NYMEX Forward Curve
Source: S&P Global Platts Analytics, Bentek

No content below the line No content below the line
What does this mean for steel?
18

No content below the line No content below the line
Three-year rig forecast suggests a return to 80% of previous rig count in high case
19
0200400600800
1,0001,2001,4001,600
# of
act
ive
rigs
RigData’s Historical and Forecast Rig Count
Actual Low Case Base Case High Case
Source: S&P Global Platts Analytics, Bentek

No content below the line No content below the line
0
1,000
2,000
3,000
4,000
5,000
6,000
7,000
8,000
9,000
10,000
Anadarko Delaware DJ Basin Eagle Ford Marcellus Midland
Late
ral L
engt
h (fe
et)
Producer-Reported Average Lateral Lengths by Play
2013 2014 2015 2016
Lateral lengths increase 20% YOY, differs on geology of play, expected to increase
20 Source: S&P Global Platts Analytics, Bentek

No content below the line No content below the line
All drilling is getting deeper, resulting in 45% increase in steel demand per well since 2010
21
0
5,000
10,000
15,000
20,000
25,000
Wel
l Dep
th
Historical Oil/Gas Well Depths by Producing Area
Northeast Wet Gas Permian Delaware Denver-Julesburg Permian MidlandEagle Ford Bakken Average US

No content below the line No content below the line
Drilling activity not expected to reach shale-revolution levels, incremental 22,000 wells/year expected
0
5,000
10,000
15,000
20,000
25,000
30,000
35,000
40,000
45,000
# of
wel
ls d
rille
d
Historical and Forecasted Wells Drilled in North America
Drilled Forecast
Source: S&P Global Platts Analytics, Bentek, RigData 22

No content below the line No content below the line
Steel demand in West Texas expected to grow to 2014 levels, prime steel demand area for E&P
23
0.00.51.01.52.02.53.03.54.0
Mill
ion
Tons
Historical and Forecasted Steel Tube and Casing Demand in the Permian
Delaware NM Midland Delaware TX Permian Other
Assumptions: 2016 average well depth/lateral length held constant

No content below the line No content below the line
Line pipe demand could grow, pipeline projects at risk on less production
Source: Bentek
0%
10%
20%
30%
40%
50%
60%
70%
80%
90%
100%
0
2,000
4,000
6,000
8,000
10,000
12,000
14,000
2016 2017 2018 TBD
% o
f mile
s at
risk
Mile
s of
Lin
e Pi
pe
Miles of New Pipeline and Risk to Completion
Miles of Line Pipe % of miles at risk

No content below the line No content below the line
Energy demand consolidating in the US Gulf Coast, fewer long-haul pipelines needed
25
690 Mb/d of new pipeline capacity announced in the Permian this year
Eagle Ford rig count doubles since
October
Crude exports to grow to +1.0 MMb/d
by 2023
USGC accounts for 54% of total US crude demand
Refined products exports growing 15% every year
Natural gas liquids export and petchem
demand growth

No content below the line No content below the line
Key Takeaways
26
- Short-term oil market could be oversupplied once OPEC resumes production and if US private equity buoys US production.
- Long-term oil supply is being overlooked due to market optimism around US shale production, but investment is needed now for long-term supply growth to meet demand.
- Increasing natural gas demand in the US for exports as LNG and to Mexico could spur dry gas drilling and the need for new pipelines over the next ten years.
- Oil and gas wells are getting deeper and utilizing more steel than historically, though the number of wells drilled are unlikely to reach pre-price collapse levels.
- Less line pipe needed as US energy market centralizes in the US Gulf Coast, but a resurgence in drilling elsewhere would require more pipe.
No content below the line No content below the line
Questions?
Nicole Leonard, Project Manager, Oil & Gas Consulting
[email protected] Direct: (720) 264-6680


