Oil Shale Development Economics October 17, 2007 Khosrow Biglarbigi Hitesh Mohan INTEK, INC. INTEK 27 th Oil Shale Symposium The Colorado Energy Research Institute & The Colorado School of Mines October 15 – 17, 2007
Transcript
Oil Shale Development Economics
October 17, 2007
Khosrow BiglarbigiHitesh MohanINTEK, INC.
INTEK
27th Oil Shale SymposiumThe Colorado Energy Research Institute & The Colorado School of Mines
Production Costs: Oil & Gas Journal, July 14, 2003, V. 101.27Production Volumes: Canadian Association of Petroleum Producers, Historical Statistics
O & M Costs
0.00
5.00
10.00
15.00
20.00
25.00
30.00
35.00
40.00
1981 1984 1994 1998 1999 2001 2003 2005
Pro
du
ctio
n C
ost
, 20
04 U
S $
0
0.1
0.2
0.3
0.4
0.5
0.6
0.7
0.8
0.9
1
Alb
erta
Oil
San
ds
Pro
du
ctio
n,
MM
Bb
l/D
ay
Production Costs: Oil & Gas Journal, July 14, 2003, V. 101.27Production Volumes: Canadian Association of Petroleum Producers, Historical Statistics
O & M Costs
Canadian Oil Sands
First Generation Projects
*Inclusive of mining, retort, & upgrading
*
*
Item Unit Range
Capital Cost K$/SDB 40-55
O&M Cost $/Bbl 12-20
7
However, the Capital Costs are IncreasingHowever, the Capital Costs are Increasing(Source: CAPP, March 2007)*(Source: CAPP, March 2007)*
0
20 000
40 000
60 000
80 000
100 000
120 000
Suncor -Millenium
Albian Syncrude- Aurora 2& UE 1 *
Nexen-OPTI
CNRL -Horizon
Shell -Muskeg &Scotford
Cap
ital
$ p
er b
bl/
day
ProductionStart Date 2001 2003 2006 2007 2008 2010
Capital Cost of 100,000 bbl/ day project$3.3 billion $10 billion
*Presented at the 2007 EIA conference, Washington. D.C.
8
Economic Price for Oil Shale TechnologyEconomic Price for Oil Shale Technology
Generic Projects (Price: $/Bbl)
TrueIn-Situ
SurfaceMining
UndergroundMining
ModifiedIn-Situ
$35.00$43.00
$52.00$57.00
0
10
20
30
40
50
60
70
2004
Dol
lars
Rate of Return – 15%
9
Breakdown of Economic Price for Breakdown of Economic Price for Generic Surface ProjectGeneric Surface Project
$43/Bbl
Cost of Capital$8
Operating Costs$17
Risk Premium$4
Transfer Payments$6
Taxes$8
10
Cashflow of a Generic Oil Shale ProjectCashflow of a Generic Oil Shale Project
-1000
-800
-600
-400
-200
0
200
400
600
800
1000
1200
5 10 15 20 25 30 35 40
After Tax
Before Tax
Year
Cu
mu
lati
ve D
isco
un
ted
Aft
er T
ax C
ash
flow
(M
M$)
Room for Government Action
11
Impact of Incentives on Generic CashflowImpact of Incentives on Generic Cashflow
-1000
-800
-600
-400
-200
0
200
400
600
800
1000
1200
5 10 15 20 25 30 35 40
After Tax
Before Tax
Year
Cu
mu
lati
ve D
isco
un
ted
Aft
er T
ax C
ash
flow
(M
M$)
$10/Bbl Production Credit$5/Bbl Production Credit15% investment Credit10% Investment CreditAccelerated Depreciation
12
Projected Production Potential (BOE)Projected Production Potential (BOE)(Shale Oil in the U.S.)(Shale Oil in the U.S.)
Base
Tax Incentives
RD&D
Measured
Accelerated
* ** ** *
13
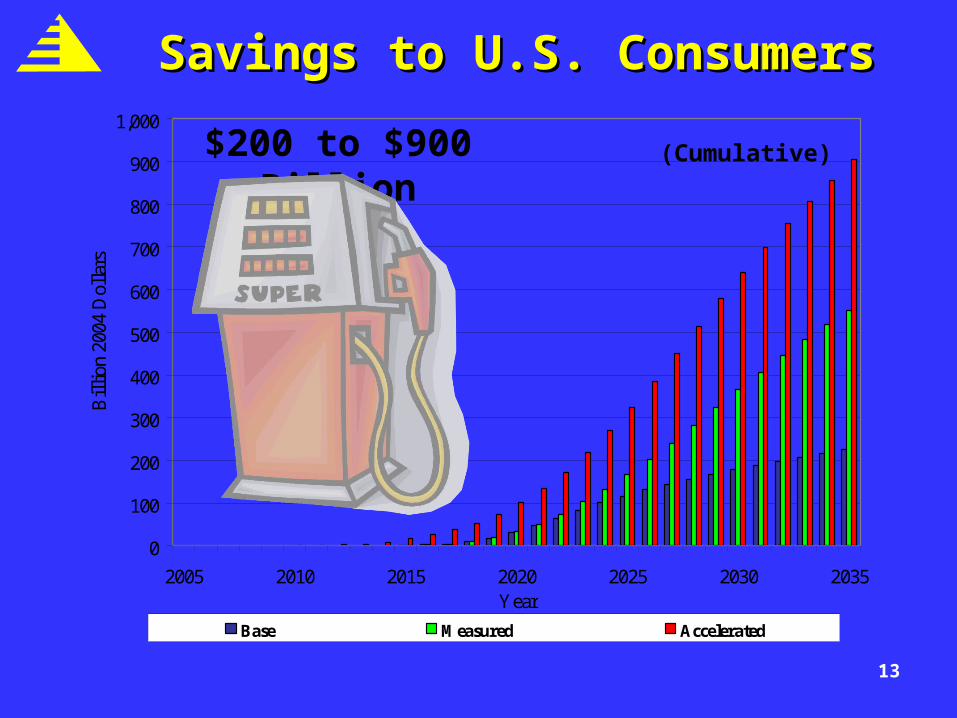
0
100
200
300
400
500
600
700
800
900
1,000
2005 2010 2015 2020 2025 2030 2035Year
Bil
lion
200
4 D
olla
rs
Base Measured Accelerated
Savings to U.S. ConsumersSavings to U.S. Consumers
(Cumulative)$200 to $900 Billion
14
0
200
400
600
800
1,000
1,200
1,400
2005 2010 2015 2020 2025 2030 2035
Year
Bil
lion
200
4 D
olla
rs
Base Measured Accelerated
Contribution to GDPContribution to GDP
(Cumulative)Up to $1.2 Trillion
15
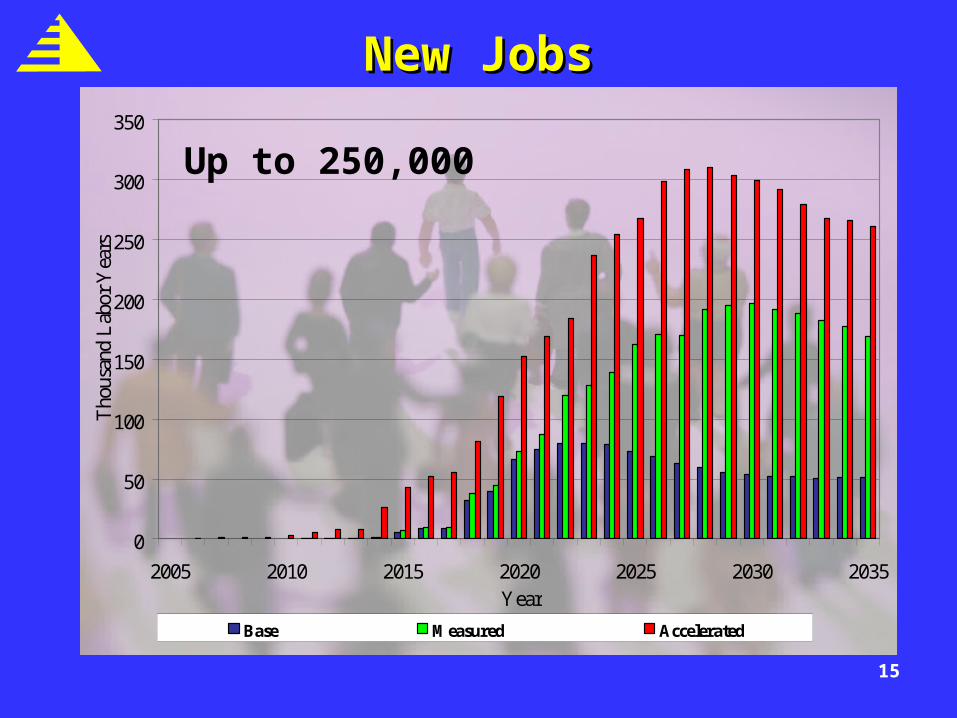
0
50
100
150
200
250
300
350
2005 2010 2015 2020 2025 2030 2035Year
Tho
usan
d L
abor
Yea
rs
Base Measured Accelerated
New JobsNew Jobs
Up to 250,000
16
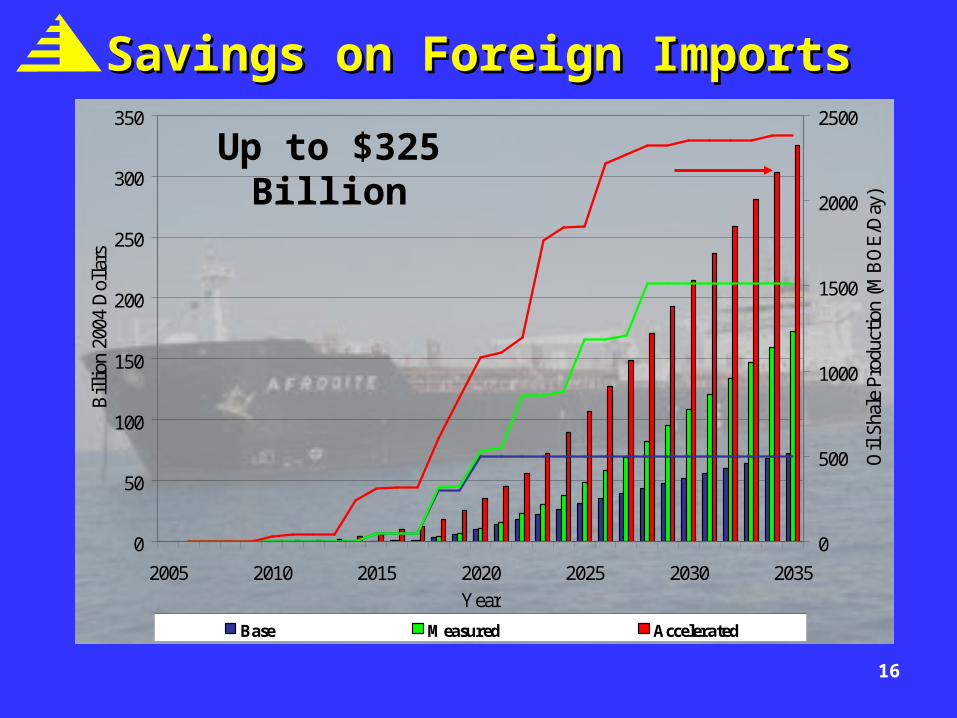
0
50
100
150
200
250
300
350
2005 2010 2015 2020 2025 2030 2035
Year
Bil
lion
200
4 D
olla
rs
0
500
1000
1500
2000
2500
Oil
Sha
le P
rodu
ctio
n (M
BO
E/D
ay)
Base Measured Accelerated
Savings on Foreign ImportsSavings on Foreign Imports
Up to $325 Billion
17
0
10
20
30
40
50
60
70
80
90
2005 2010 2015 2020 2025 2030 2035Year
Bil
lion
200
4 D
olla
rs
0
500
1000
1500
2000
2500
Oil
Sha
le D
aily
Pro
duct
ion
(MB
OE
/Day
)
Base Measured Accelerated
Direct Local, State, And Federal Revenues Will Direct Local, State, And Federal Revenues Will Increase by $25 to $85 Billion by 2035Increase by $25 to $85 Billion by 2035