Page 1
Journal of Environmental Science and Sustainable Development Journal of Environmental Science and Sustainable Development
Volume 2 Issue 1 Article 2
7-31-2019
OIL SPILL RESPONSE PREPAREDNESS MODEL THROUGH OIL SPILL RESPONSE PREPAREDNESS MODEL THROUGH
COMMUNITY PARTICIPATION IN TELUK PENYU BEACH, CILACAP COMMUNITY PARTICIPATION IN TELUK PENYU BEACH, CILACAP
REGENCY REGENCY
Tri Edhi Budhi Soesilo School of Environmental Science, Universitas Indonesia, Jakarta 10430, [email protected]
Chiquita Tri Rezki School of Environmental Science, Universitas Indonesia, Jakarta 10430
Ihya Sulthonuddin School of Environmental Science, Universitas Indonesia, Jakarta 10430
Follow this and additional works at: https://scholarhub.ui.ac.id/jessd
Part of the Environmental Studies Commons
Recommended Citation Recommended Citation Soesilo, Tri Edhi Budhi; Rezki, Chiquita Tri; and Sulthonuddin, Ihya (2019). OIL SPILL RESPONSE PREPAREDNESS MODEL THROUGH COMMUNITY PARTICIPATION IN TELUK PENYU BEACH, CILACAP REGENCY. Journal of Environmental Science and Sustainable Development, 2(1), 1-14. Available at: https://doi.org/10.7454/jessd.v2i1.38
This Review Article is brought to you for free and open access by the School of Environmental Science at UI Scholars Hub. It has been accepted for inclusion in Journal of Environmental Science and Sustainable Development by an authorized editor of UI Scholars Hub.
Page 2
Journal of Environmental Science and Sustainable Development
Volume 2, Issue 1, Page 1–14
ISSN: 2655-6847
Homepage: http://jessd.ui.ac.id/
DOI: https://doi.org/10.7454/jessd.v2i1.38 1
OIL SPILL RESPONSE PREPAREDNESS MODEL THROUGH COMMUNITY
PARTICIPATION IN TELUK PENYU BEACH, CILACAP REGENCY
Tri Edhi Budhi Soesilo*, Chiquita Tri Rezki, and Ihya Sulthonuddin
School of Environmental Science, Universitas Indonesia, Central Jakarta 10430, Indonesia
*Corresponding author: e-mail: [email protected]
(Received: 16 July 2019; Accepted: 25 July 2019; Published: 31 July 2019)
Abstract
In Indonesia, oil spill incidents often occur; thus, it has become a matter of national concern. Cilacap
Regency is one of the regions in Indonesia that is prone to oil spills, with a history of frequent oil spill
incidents during 2000–2018. Oil spill response preparedness needs the integrated effort between
government and communities to minimize the environmental impacts of oil spills. A problem usually
encountered is the lack of integration of community participation in the oil spill contingency plan
because of the limited knowledge of the community regarding oil spill response preparedness. This
study aimed to build an oil spill response preparedness model through community participation in
Teluk Penyu Beach, Cilacap Regency. This study used the system dynamics modeling method.
Results showed that the oil spill volumes in the waters (decay behavior) and on the beach (goal-
seeking behavior) rapidly decreased after 240 h (10 days). In conclusion, oil spill response
preparedness needs the integration between company and community participation by increasing
knowledge through community involvement in a combination of oil spill response exercises.
Keywords: Cilacap; model; oil spill; preparedness; response; system dynamics
1. Introduction
Oil spills are the release of hydrocarbons/oils either directly or indirectly to the marine
environment (Presidential Regulation of the Republic of Indonesia Number 109 of 2006
concerning the Management of Emergency Oil Spills in the Sea). In Indonesia, oil spill
incidents often occur; thus, it has become a matter of national and international concern (The
Special Task Force for Upstream Oil and Gas Business Activities, 2017). The statistics show
that, in 2016, several oil spill incidents occurred, with a total volume of 787,277 barrels in the
upstream sector (The Directorate General of Oil and Gas, 2017). An international oil spill that
had a considerable impact on Indonesia’s marine area was the oil spill caused by the Montara
offshore oil drilling in 2009, with a spill volume of 27,600 t in the Timor Sea. Furthermore, a
recent oil spill incident that occurred in Indonesia is the oil spill in Balikpapan Bay on April
2018 caused by leaks from underwater pipelines cracked by ship anchors (The Directorate
General of Oil and Gas, 2018). Cilacap Regency is one of the regions in Indonesia that is
prone to oil spills. Oil spill incidents have occurred in Cilacap Regency in 2000, 2004, 2007,
2008, 2010, 2015, and 2016 (Yulianingsih, 2012; Oil Spill Combat Team Indonesia, 2016).
Page 3
Journal of Environmental Science and Sustainable Development 2(1): 1–14
DOI: https://doi.org/10.7454/jessd.v2i1.38 2
Most of these oil spills originated from tankers involved in shipping activities in Cilacap
Regency.
Oil spills have a considerable impact on the environment, as well as on the
socioeconomic aspects, of coastal communities (International Tanker Owner Pollution
Federation, 2014). The oil spill incident that occurred in Cilacap District in 2010 covered the
turtle habitat, crane habitat on the Teluk Penyu Beach, and waterbird habitat on the estuary of
the Donan River with oil layers (Mauludiyah, 2015). Oil spills in the waters also directly
affect the social activities of coastal communities (International Tanker Owner Pollution
Federation, 2014). The oil spill incident in Cilacap Regency disrupted the use of the
environment for beach tourism, pier, transportation facilities, and fishing and cultivation
areas (Mauludiyah, 2015). Moreover, the economic valuation of the oil spill incident in
Cilacap Regency in 2010 yielded an economic loss of Rp. 1.9 trillion (Mauludiyah, 2015).
The occurrence of oil spills should be avoided by implementing mitigation and
preparedness activities involving the participation of companies, governments, and
communities in the stages before, during, and after the incident (Xiong, Long, Tang, Wan, &
Li, 2015; Hyder, Wright, Kirby, & Brant, 2017). Moreover, the impacts of oil spills should be
mitigated. Oil spill response in several cases only involved community participation during
the occurrence of oil spills. Community participation has not been integrated into the pre-
disaster or oil spill prevention plan of several companies. Teluk Penyu Beach, Cilacap
Regency was selected because of its history of frequent oil spills and the involvement of the
community in oil spill response in several occurrences. Efforts to minimize the
environmental, social, and economic impacts of oil spills include oil spill response
preparedness. These efforts should be implemented in an integrated manner by every
component, i.e., the polluters, the government, and the community (Xiong et al., 2015; Hyder
et al., 2017). Several responses to international oil spills have integrated these three
components by maximizing community participation to ensure a more effective oil spill
cleanup (Sargisson, Hunt, Hanlen, Smith, & Hamerton, 2012; Hunt, Smith, Hamerton, &
Sargisson, 2014; Hyder et al., 2017). Oil spill response preparedness is an effort to prevent
the impacts of oil spills on the environmental, social, and economic aspects (Lynch, 1994).
Oil spill response preparedness will be effective if supported by contingency planning,
policies and regulations, response decision-making, cleanup technologies, and strict
implementation (Ivanova, 2011; Kurtz, 2013; Smith, Hamerton, Hunt, & Sargisson, 2016;
Xiong et al., 2015; Chen, Ye, Zhang, Jing, & Lee, 2018). On the basis of these problems and
concerns, this research aims to build an oil spill response preparedness model through
community participation in Teluk Penyu Beach, Cilacap Regency.
2. Methods
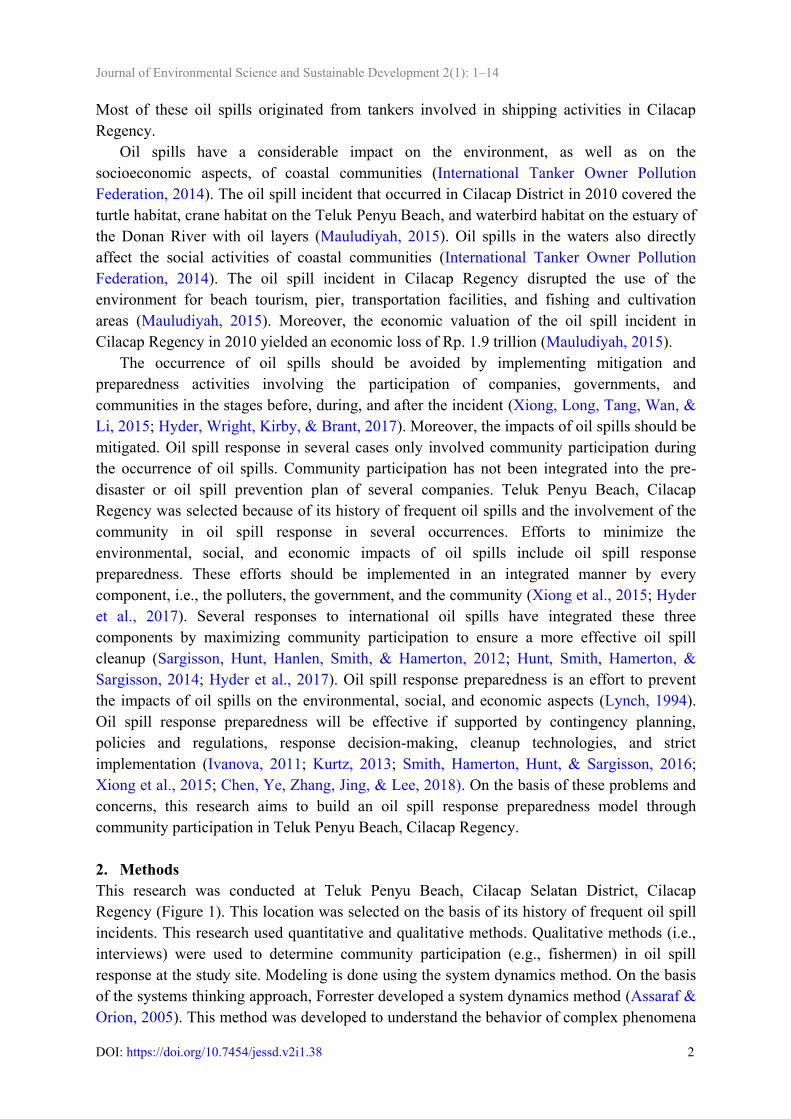
This research was conducted at Teluk Penyu Beach, Cilacap Selatan District, Cilacap
Regency (Figure 1). This location was selected on the basis of its history of frequent oil spill
incidents. This research used quantitative and qualitative methods. Qualitative methods (i.e.,
interviews) were used to determine community participation (e.g., fishermen) in oil spill
response at the study site. Modeling is done using the system dynamics method. On the basis
of the systems thinking approach, Forrester developed a system dynamics method (Assaraf &
Orion, 2005). This method was developed to understand the behavior of complex phenomena
Page 4
Journal of Environmental Science and Sustainable Development 2(1): 1–14
DOI: https://doi.org/10.7454/jessd.v2i1.38 3
from the relationships between variables over time (Assaraf & Orion, 2005). System
dynamics is defined as a method for learning a complex, dynamic, and nonlinear system by
managing feedback (Soesilo & Karuniasa, 2014). The system dynamics method aims to
predict system performance in the future on the basis of optimal work results (Muhammadi,
Aminullah, & Soesilo, 2001).
Figure 1. Teluk Penyu Beach, Cilacap Selatan District, Cilacap Regency
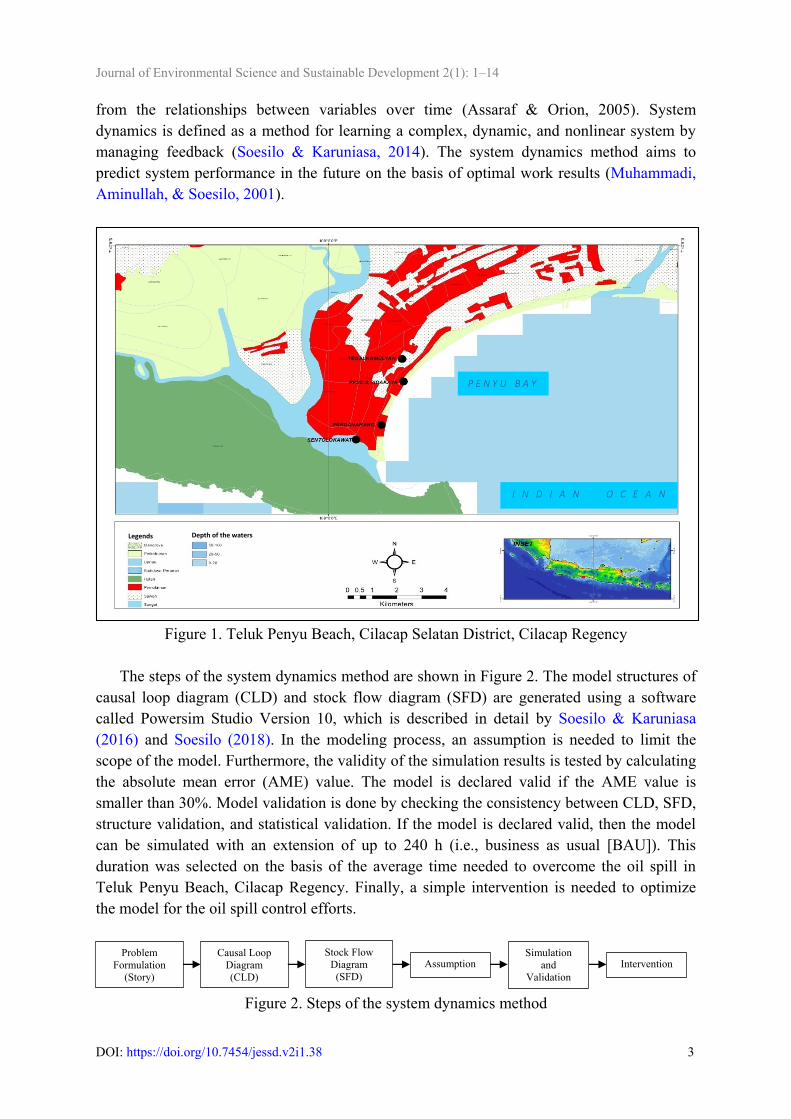
The steps of the system dynamics method are shown in Figure 2. The model structures of
causal loop diagram (CLD) and stock flow diagram (SFD) are generated using a software
called Powersim Studio Version 10, which is described in detail by Soesilo & Karuniasa
(2016) and Soesilo (2018). In the modeling process, an assumption is needed to limit the
scope of the model. Furthermore, the validity of the simulation results is tested by calculating
the absolute mean error (AME) value. The model is declared valid if the AME value is
smaller than 30%. Model validation is done by checking the consistency between CLD, SFD,
structure validation, and statistical validation. If the model is declared valid, then the model
can be simulated with an extension of up to 240 h (i.e., business as usual [BAU]). This
duration was selected on the basis of the average time needed to overcome the oil spill in
Teluk Penyu Beach, Cilacap Regency. Finally, a simple intervention is needed to optimize
the model for the oil spill control efforts.
Figure 2. Steps of the system dynamics method
Legends
Depth of the waters
Problem
Formulation
(Story)
Causal Loop
Diagram
(CLD)
Stock Flow
Diagram
(SFD)
Assumption Simulation
and
Validation
Intervention
Legends Depth of the waters
P E N Y U B A Y
I N D I A N O C E A N
Page 5
Journal of Environmental Science and Sustainable Development 2(1): 1–14
DOI: https://doi.org/10.7454/jessd.v2i1.38 4
3. Results and Discussion
Oil spill incidents in Teluk Penyu Beach have environmental, social, and economic impacts.
The relationship between environmental, social, and economic subsystems in the oil spill
incident in Teluk Penyu Beach, Cilacap Selatan District, Cilacap Regency was analyzed using
system dynamics modeling. The results and discussions in this section follow the order of the
steps of the system dynamics method described previously.
3.1 Causal Loop Diagram
The causal loop between model variables that comprise the CLD oil spill subsystem is shown
in Figure 3. The CLD structure shows the formation of five loops composed of one loop with
the feedback loop reinforcing (R) or positive feedback loop (+), which means that the
behavior formed is exponential growth or collapse, and four loops with the feedback loop
balancing (B) or negative feedback loop (−), which means that the behavior formed is goal
seeking or decay. Loop R1 is the main loop formed by 11 variables, i.e., “Oil spill volume in
the waters,” “The rate of oil spill spread in the waters,” “Oil spill area in the waters,” “The
rate of losing fish catches,” “Economic loss of fisheries,” “Total economic losses,” “GAP
economy,” “Economic factor,” “Community participation,” “PTM on the beach,” “Oil spill
volume on the beach,” and back to “Oil spill volume in the waters.”
Loop B1 is formed by eight variables, i.e., “Oil spill volume on the beach,” “Oil spills
along the shoreline,” “Economic loss of communities,” “Total economic losses,” “GAP
economy,” “Economic factor,” “Community participation,” “PTM on the beach,” and back to
“Oil spill volume on the beach.” Loop B2 is formed by five variables, i.e., “Oil spill volume
on the beach,” “Oil spills along the shoreline,” “Fishermen affected,” “Community
participation,” “PTM on the beach,” and back to “Oil spill volume on the beach.” Loop B3 is
formed by two variables, i.e., “Oil spill volume on the beach,” “Evaporation process on the
beach,” and back to “Oil spill volume on the beach.” Loop B4 is formed by two variables,
i.e., “Oil spill volume in the water,” “Evaporation process in the waters,” and back to “Oil
spill volume on the beach.”
Page 6
Journal of Environmental Science and Sustainable Development 2(1): 1–14
DOI: https://doi.org/10.7454/jessd.v2i1.38 5
Figure 3. CLD of the oil spill response preparedness model
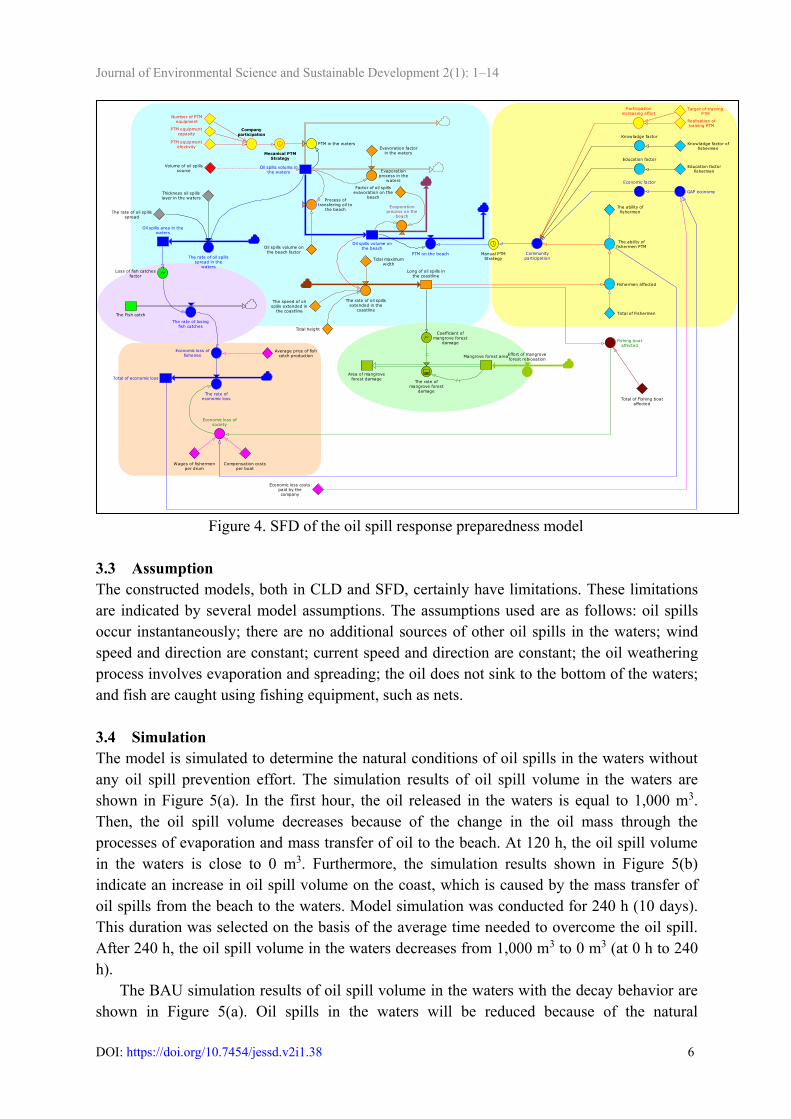
3.2 Stock Flow Diagram
The second structure is the SFD shown in Figure 4. The model simulated the oil spill incident
in 2015, with an estimated spill source volume of 1,000 m3. The simulation duration of 120 h
(5 days) is in accordance with the response implemented by Pertamina RU IV Cilacap during
oil spill incident prevention. Data on 1,000 m3 oil spill volume and 120 h duration are
considered the reference data. The variables in the model are adjusted to the real conditions in
this study.
Education
factors Knowladge
factors
The rate of oil spills spread
in the waters
Evaporation process
on the beach
Oil spills area
in the waters
The rate of
losing fish catches
Economic loss
of fisheries
Economic GAP
PTM on the beach
Community
participation
+
+
+
+
+
-
+
-
-
R1
Oil spills long
on the coastline
Fishermen
affected
+
+
+
B2
+
+
Evaporation process
in the waters
B4+
- B3
+
-
Area of
mangrove forest
damage
+
Oil spills source volume
in the waters
+
Economic loss
of society
B1
+
+
Economic factors
-
+
-
Total of
economic loss
Oil spills
volume
in the watersOil spills
volume
on the beach
Page 7
Journal of Environmental Science and Sustainable Development 2(1): 1–14
DOI: https://doi.org/10.7454/jessd.v2i1.38 6
Figure 4. SFD of the oil spill response preparedness model
3.3 Assumption
The constructed models, both in CLD and SFD, certainly have limitations. These limitations
are indicated by several model assumptions. The assumptions used are as follows: oil spills
occur instantaneously; there are no additional sources of other oil spills in the waters; wind
speed and direction are constant; current speed and direction are constant; the oil weathering
process involves evaporation and spreading; the oil does not sink to the bottom of the waters;
and fish are caught using fishing equipment, such as nets.
3.4 Simulation
The model is simulated to determine the natural conditions of oil spills in the waters without
any oil spill prevention effort. The simulation results of oil spill volume in the waters are
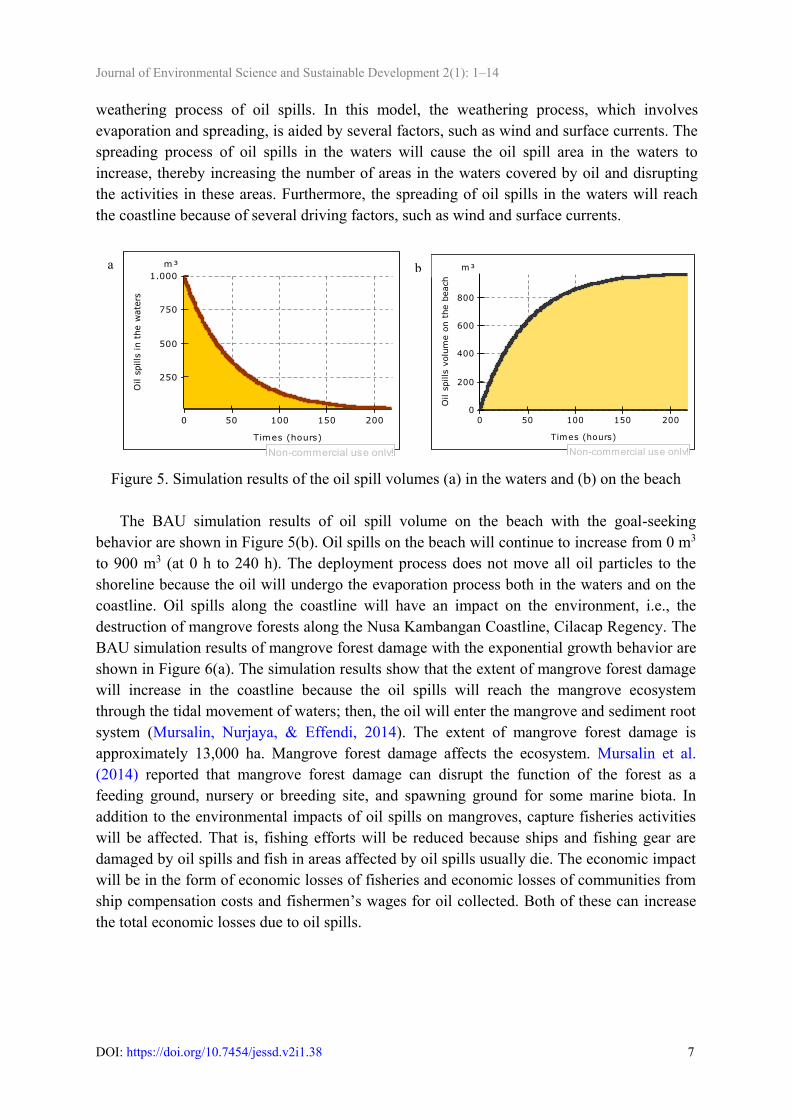
shown in Figure 5(a). In the first hour, the oil released in the waters is equal to 1,000 m3.
Then, the oil spill volume decreases because of the change in the oil mass through the
processes of evaporation and mass transfer of oil to the beach. At 120 h, the oil spill volume
in the waters is close to 0 m3. Furthermore, the simulation results shown in Figure 5(b)
indicate an increase in oil spill volume on the coast, which is caused by the mass transfer of
oil spills from the beach to the waters. Model simulation was conducted for 240 h (10 days).
This duration was selected on the basis of the average time needed to overcome the oil spill.
After 240 h, the oil spill volume in the waters decreases from 1,000 m3 to 0 m3 (at 0 h to 240
h).
The BAU simulation results of oil spill volume in the waters with the decay behavior are
shown in Figure 5(a). Oil spills in the waters will be reduced because of the natural
Volume of oil spillssource
Oil spills volume inthe waters Evaporation
process in thewaters
Evavoration factorin the waters
Process oftransfering oil to
the beach
Oil spills volume onthe beach factor
Oil spills volume onthe beach
Long of oil spills inthe coastline
The rate of oil spillsextended in the
coastline
Tidal height
Tidal maximumwidth
The speed of oilspills extended in
the coastline
Evaporationprocess on the
beach
Factor of oil spillsevavoration on the
beach
PTM on the beach
Coefficient ofmangrove forest
damage
Area of mangroveforest damage
The rate ofmangrove forest
damage
Mangrove forest areaEffort of mangroveforest rebiosation
The Fish catch
Economic loss offisheries
Total of economic loss
The rate ofeconomic loss
Average price of fishcatch production
The ability offishermen PTM
Knowladge factor offishermen
Education factorfishermen
Total of Fishermen
The ability offishermen
Fishermen affected
Communityparticipation
Oil spills area in thewaters
Thickness oil spillslayer in the waters
The rate of oil spillsspread in the
waters
Economic loss ofsociety
Fishing boataffected
Total of Fishing boataffected
Compensation costsper boat
Wages of fishermenper drum
Manual PTMStrategy
Economic loss costspaid by thecompany
Knowladge factor
Education factor
GAP economy
PTM in the waters
Number of PTMequipment
PTM equipmentcapasity
PTM equipmentefectivity
Companyparticipation
The rate of losingfish catches
The rate of oil spillsspread
Economic factor
Loss of fish catchesfactor
Mecanical PTMStrategy
Participationincreasing effort
Target of trainingPTM
Realisation oftraining PTM
Page 8
Journal of Environmental Science and Sustainable Development 2(1): 1–14
DOI: https://doi.org/10.7454/jessd.v2i1.38 7
weathering process of oil spills. In this model, the weathering process, which involves
evaporation and spreading, is aided by several factors, such as wind and surface currents. The
spreading process of oil spills in the waters will cause the oil spill area in the waters to
increase, thereby increasing the number of areas in the waters covered by oil and disrupting
the activities in these areas. Furthermore, the spreading of oil spills in the waters will reach
the coastline because of several driving factors, such as wind and surface currents.
Figure 5. Simulation results of the oil spill volumes (a) in the waters and (b) on the beach
The BAU simulation results of oil spill volume on the beach with the goal-seeking
behavior are shown in Figure 5(b). Oil spills on the beach will continue to increase from 0 m3
to 900 m3 (at 0 h to 240 h). The deployment process does not move all oil particles to the
shoreline because the oil will undergo the evaporation process both in the waters and on the
coastline. Oil spills along the coastline will have an impact on the environment, i.e., the
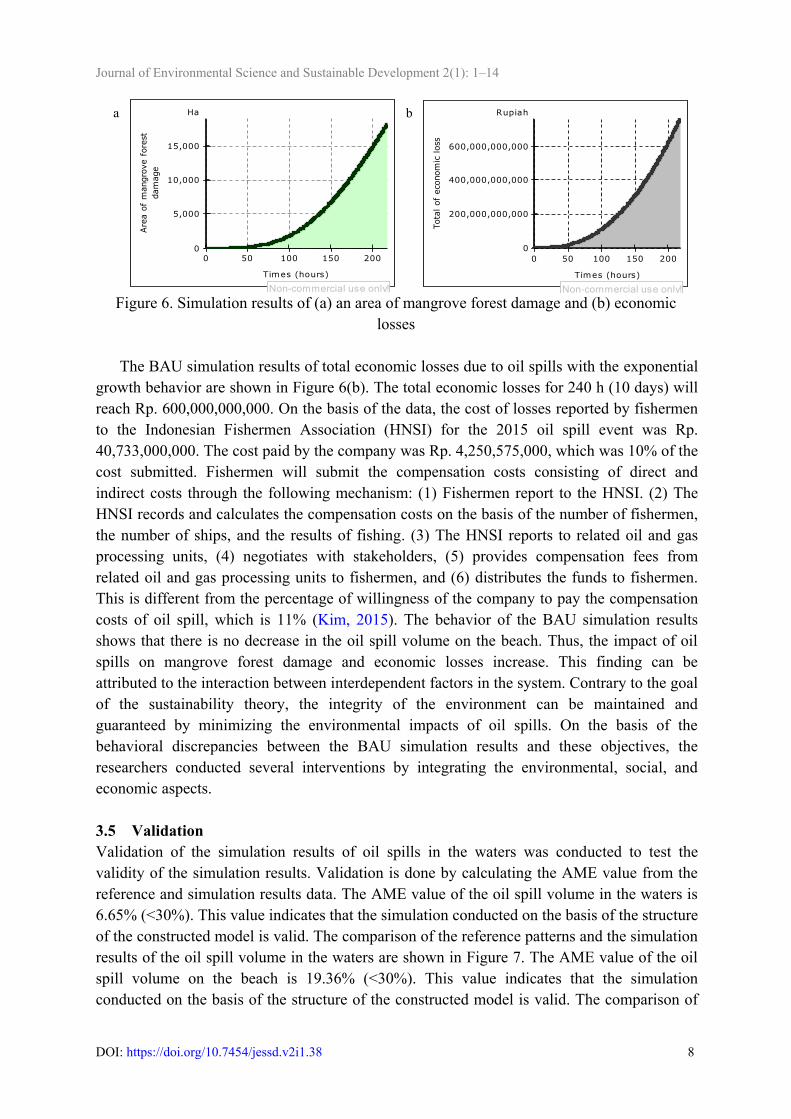
destruction of mangrove forests along the Nusa Kambangan Coastline, Cilacap Regency. The
BAU simulation results of mangrove forest damage with the exponential growth behavior are
shown in Figure 6(a). The simulation results show that the extent of mangrove forest damage
will increase in the coastline because the oil spills will reach the mangrove ecosystem
through the tidal movement of waters; then, the oil will enter the mangrove and sediment root
system (Mursalin, Nurjaya, & Effendi, 2014). The extent of mangrove forest damage is
approximately 13,000 ha. Mangrove forest damage affects the ecosystem. Mursalin et al.
(2014) reported that mangrove forest damage can disrupt the function of the forest as a
feeding ground, nursery or breeding site, and spawning ground for some marine biota. In
addition to the environmental impacts of oil spills on mangroves, capture fisheries activities
will be affected. That is, fishing efforts will be reduced because ships and fishing gear are
damaged by oil spills and fish in areas affected by oil spills usually die. The economic impact
will be in the form of economic losses of fisheries and economic losses of communities from
ship compensation costs and fishermen’s wages for oil collected. Both of these can increase
the total economic losses due to oil spills.
0 50 100 150 200
250
500
750
1.000
m³
Times (hours)
Oil s
pills
in t
he w
ate
rs
Non-commercial use only!
a
0 50 100 150 2000
200
400
600
800
m³
Times (hours)O
il s
pills
volu
me o
n t
he b
each
Non-commercial use only!
b
Page 9
Journal of Environmental Science and Sustainable Development 2(1): 1–14
DOI: https://doi.org/10.7454/jessd.v2i1.38 8
Figure 6. Simulation results of (a) an area of mangrove forest damage and (b) economic
losses
The BAU simulation results of total economic losses due to oil spills with the exponential
growth behavior are shown in Figure 6(b). The total economic losses for 240 h (10 days) will
reach Rp. 600,000,000,000. On the basis of the data, the cost of losses reported by fishermen
to the Indonesian Fishermen Association (HNSI) for the 2015 oil spill event was Rp.
40,733,000,000. The cost paid by the company was Rp. 4,250,575,000, which was 10% of the
cost submitted. Fishermen will submit the compensation costs consisting of direct and
indirect costs through the following mechanism: (1) Fishermen report to the HNSI. (2) The
HNSI records and calculates the compensation costs on the basis of the number of fishermen,
the number of ships, and the results of fishing. (3) The HNSI reports to related oil and gas
processing units, (4) negotiates with stakeholders, (5) provides compensation fees from
related oil and gas processing units to fishermen, and (6) distributes the funds to fishermen.
This is different from the percentage of willingness of the company to pay the compensation
costs of oil spill, which is 11% (Kim, 2015). The behavior of the BAU simulation results
shows that there is no decrease in the oil spill volume on the beach. Thus, the impact of oil
spills on mangrove forest damage and economic losses increase. This finding can be
attributed to the interaction between interdependent factors in the system. Contrary to the goal
of the sustainability theory, the integrity of the environment can be maintained and
guaranteed by minimizing the environmental impacts of oil spills. On the basis of the
behavioral discrepancies between the BAU simulation results and these objectives, the
researchers conducted several interventions by integrating the environmental, social, and
economic aspects.
3.5 Validation
Validation of the simulation results of oil spills in the waters was conducted to test the
validity of the simulation results. Validation is done by calculating the AME value from the
reference and simulation results data. The AME value of the oil spill volume in the waters is
6.65% (<30%). This value indicates that the simulation conducted on the basis of the structure
of the constructed model is valid. The comparison of the reference patterns and the simulation
results of the oil spill volume in the waters are shown in Figure 7. The AME value of the oil
spill volume on the beach is 19.36% (<30%). This value indicates that the simulation
conducted on the basis of the structure of the constructed model is valid. The comparison of
0 50 100 150 2000
5,000
10,000
15,000
Ha
Times (hours)
Are
a o
f m
angro
ve f
ore
st
dam
age
Non-commercial use only!
a
0 50 100 150 200
0
200,000,000,000
400,000,000,000
600,000,000,000
Rupiah
Times (hours)
Tota
l of
econom
ic loss
Non-commercial use only!
b
Page 10
Journal of Environmental Science and Sustainable Development 2(1): 1–14
DOI: https://doi.org/10.7454/jessd.v2i1.38 9
the reference data and the simulation results of the oil spill volume in the waters are shown in
Figure 7. After determining that the constructed and simulated model is valid, intervention is
needed.
Figure 7. Comparison of the oil spill volumes (a) in the waters and (b) on the beach
3.6 Intervention
Interventions are implemented to reduce the oil spill volumes in the waters and on the coast.
The intervention scenario of the CLD structure is shown in Figure 8. New variables in the
CLD structure after entering the intervention scenario include “PTM in the waters,”
“Company participation,” “Number of PTM equipment,” PTM equipment capacity,” “PTM
equipment effectivity,” and “Participation increases effort.” The intervention scenario aims to
minimize the environmental impacts of oil spills. The intervention involved increasing efforts
to prevent oil spills, increasing efforts to overcome mechanical oil spills by companies in the
waters, and increasing efforts to deal with manual oil spills by communities on the beach. Oil
spill response preparedness in the waters uses oil spill prevention equipment, such as oil
booms, oil skimmers, and temporary oil storage tanks, supported by ships. Oil spill response
preparedness on the beach increases the participation of fishermen through manual oil spill
prevention exercises and schemes. Effective oil spill response preparedness is an effort that
involves the participation of all components of the state, be it society or government (Xiong et
al., 2015; Hyder et al., 2017; Sulistyono, 2017). This effort can work effectively with the
increased communication between stakeholders (Walker, Pavia, Bostrom, Leschine, &
Starbird, 2015). The intervention scenario of the SFD structure is shown in Figure 9.
0
200
400
600
800
1000
1200
0 50 100 150
Data Referensi Data Simulasi
a
Simulation Reference
m3
1,000
800
600
400
200
0
0 50 100 150
Times (hours)
0
200
400
600
800
1000
0 50 100 150
Data Referensi
Data Simulasi
b
Simulation
Reference
m3
800
600
400
200
0
0 50 100 Times
(hours)
Page 11
Journal of Environmental Science and Sustainable Development 2(1): 1–14
DOI: https://doi.org/10.7454/jessd.v2i1.38 10
Figure 8. CLD of the oil spill response preparedness model (intervention scenario)
The results of the intervention scenario show that the oil spill volumes in the waters and
on the beach are decreasing rapidly. The results of the intervention scenario of the oil spill
volumes in the waters and on the beach are shown in Figures 10(a) and 10(b).
Figure 9. SFD of the oil spill response preparedness model (intervention scenario)
Education
factors Knowladge
factors
The rate of oil spills spread
in the waters
Evaporation process
on the beach
Oil spills area
in the waters
The rate of
losing fish catches
Economic loss
of fisheries
Economic GAP
PTM on the beach
Community
participation
+
+
+
+
+
-
+
-
-
R1
Oil spills long
on the coastline
Fishermen
affected
+
+
+
B2
+
+
Evaporation process
in the waters
B4+
- B3
+
-
Area of
mangrove forest
damage
+
Oil spills source volume
in the waters
+
Economic loss
of society
B1
+
+
Economic factors
-
+
PTM in the
waters -
Company
paticipation
Number of
PTM equitment
PTM equipment
capacity
PTM equipment
efectivity
+
++
+
Participation
increasing effort
+
Total of
economic loss
Oil spills
volume
in the watersOil spills
volume
on the beach
Volume of oil spillssource
Oil spills volume inthe waters Evaporation
process in thewaters
Evavoration factorin the waters
Process oftransfering oil to
the beach
Oil spills volume onthe beach factor
Oil spills volume onthe beach
Long of oil spills inthe coastline
The rate of oil spillsextended in the
coastline
Tidal height
Tidal maximumwidth
The speed of oilspills extended in
the coastline
Evaporationprocess on the
beach
Factor of oil spillsevavoration on the
beach
PTM on the beach
Coefficient ofmangrove forest
damage
Area of mangroveforest damage
The rate ofmangrove forest
damage
Mangrove forest areaEffort of mangroveforest rebiosation
The Fish catch
Economic loss offisheries
Total of economic loss
The rate ofeconomic loss
Average price of fishcatch production
The ability offishermen PTM
Knowladge factor offishermen
Education factorfishermen
Total of Fishermen
The ability offishermen
Fishermen affected
Communityparticipation
Oil spills area in thewaters
Thickness oil spillslayer in the waters
The rate of oil spillsspread in the
waters
Economic loss ofsociety
Fishing boataffected
Total of Fishing boataffected
Compensation costsper boat
Wages of fishermenper drum
Manual PTMStrategy
Economic loss costspaid by thecompany
Knowladge factor
Education factor
GAP economy
PTM in the waters
Number of PTMequipment
PTM equipmentcapasity
PTM equipmentefectivity
Companyparticipation
The rate of losingfish catches
The rate of oil spillsspread
Economic factor
Loss of fish catchesfactor
Mecanical PTMStrategy
Participationincreasing effort
Target of trainingPTM
Realisation oftraining PTM
Page 12
Journal of Environmental Science and Sustainable Development 2(1): 1–14
DOI: https://doi.org/10.7454/jessd.v2i1.38 11
The results show that oil spills in the waters decrease naturally through the processes of
evaporation and mass transfer of oil to the beach, which is accelerated by efforts to overcome
oil spills. On the basis of the efforts to increase the number of oil spill prevention equipment
in the waters by increasing the participation of fishermen on the beach, a decrease in
environmental impacts, such as mangrove forest damage, can be observed, as shown in Figure
11(a).
Figure 10. Intervention scenario of oil spill volumes (a) in the waters and (b) on the beach
Figure 11. Intervention scenario of (a) an area of mangrove forest damage and (b) total
economic losses
Efforts to mitigate oil spills can reduce the area of oil spills in the waters. Active
fishermen provide information about oil spills to the HNSI and conduct field surveys to
support the information provided. Some quotes from structured interviews based on the
questionnaire support this fact, “If there is an oil spill, the fishermen immediately report to the
pillars, together with the head of the pillars of fishermen to the HNSI, then we directly survey
the field, see the location, and take samples and photos” (Indonesian Fishermen Association,
Cilacap Regency, 2018). Economic losses can also be reduced. The results of the intervention
scenario of economic losses are shown in Figure 11(b), in which the original loss of Rp.
600,000,000,000 decreased to Rp. 60,000,000,000. The best intervention scenario of oil spill
response preparedness is a combination of increasing the response to oil spills in the waters
and on the coast. This result indicates the importance of the integration of oil spill prevention
through community participation of both companies and fishermen. Xiong et al. (2015),
0 50 100 150 200
0
250
500
750
1.000
m³
Times (hours)
Oil s
pills
in t
he w
ate
rs
Non-commercial use only!
a
0 50 100 150 200
0
50
100
150
m³
Times (hours)O
il s
pills
volu
me o
n t
he b
each
Non-commercial use only!
b
0 50 100 150 2000
5,000
10,000
Ha
Times (hours)
Are
a o
f m
angro
ve f
ore
st
dam
age
Non-commercial use only!
a
0 50 100 150 200
0
20,000,000,000
40,000,000,000
60,000,000,000
Rupiah
Times (hours)
Tota
l of
econom
ic loss
Non-commercial use only!
b
Page 13
Journal of Environmental Science and Sustainable Development 2(1): 1–14
DOI: https://doi.org/10.7454/jessd.v2i1.38 12
Hyder et al. (2017), and Sulistyono (2017) reported that the integration of participation
between state components (i.e., governments, companies, and communities) can optimize
environmental management and protection. Knowledge related to community oil spills has
been relatively high. Thus, efforts have been made not to increase public knowledge but to
increase community participation, which could be in the form of community involvement in
various forms of activities, such as delivering information, conducting surveys, sampling, and
performing oil spill prevention operations.
4. Conclusion
On the basis of the results and discussions, we conclude that oil spill response preparedness
through community participation in Teluk Penyu Beach, Cilacap Regency has been
effectively simulated by system dynamics modeling. The oil spill response preparedness
model is valid, with the AME value of 6.65%, as well as decay and goal-seeking behavior.
Oil spill response preparedness needs the integration between company and community
participation by increasing knowledge through community involvement in a combination of
oil spill response exercises.
References
Assaraf, O. B. Z., & Orion, N. (2005). Development of system thinking skills in the context
of earth system education. Journal of Research in Science Teaching, 42(5), 518–560.
https://doi.org/10.1002/tea.20061
Chen, B., Ye, X., Zhang, B., Jing, L., & Lee, K. (2018). Marine oil spills—Preparedness and
countermeasures. World Seas: an Environmental Evaluation (Second Edition). Elsevier
Ltd. https://doi.org/10.1016/b978-0-12-805052-1.00025-5
Hunt, S., Smith, K., Hamerton, H., & Sargisson, R. J. (2014). An incident control centre in
action: Response to the rena oil spill in New Zealand. Journal of Contingencies and Crisis
Management, 22(1), 63–66. https://doi.org/10.1111/1468-5973.12036
Hyder, K., Wright, S., Kirby, M., & Brant, J. (2017). The role of citizen science in monitoring
small-scale pollution events. Marine Pollution Bulletin, 120(1–2), 51–57.
https://doi.org/10.1016/j.marpolbul.2017.04.038
International Tanker Owner Pollution Federation. (2014). Effects of oil pollution on the
marine environment. Technical Information Paper, ITOPF. Retrieved from
https://www.itopf.org/fileadmin/data/Documents/TIPS%20TAPS/TIP_13_Effects_of_Oil
_Pollution_on_the_Marine_Environment.pdf
Ivanova, M. (2011). Oil spill emergency preparedness in the Russian Arctic: A study of the
Murmansk region. Polar Research, 30(SUPPL.1).
https://doi.org/10.3402/polar.v30i0.7285
Kim, S. K. (2015). Marine pollution response in Northeast Asia and the NOWPAP regime.
Ocean Development and International Law, 46(1), 17–32.
https://doi.org/10.1080/00908320.2014.929470
Kurtz, R. S. (2013). Oil spill causation and the deepwater horizon spill. Review of Policy
Research, 30(4), 366–380. https://doi.org/10.1111/ropr.12026
Lynch, M. (1994). A small oil spill prevention education strategy. Coastal Management,
22(4), 405–412. https://doi.org/10.1080/08920759409362247
Page 14
Journal of Environmental Science and Sustainable Development 2(1): 1–14
DOI: https://doi.org/10.7454/jessd.v2i1.38 13
Mauludiyah. (2015). Valuasi Ekonomi Dampak Lingkungan Akibat Tumpahan Minyak di
Perairan Cilacap. Marine Journal, 1(1), 8–18.
https://doi.org/http://jurnalsaintek.uinsby.ac.id/index.php/marine/article/view/34
Muhammadi, Aminullah, E., & Soesilo, T. E. B. (2001). Analysis of system dynamics,
environment, social, economic, management (Analisis sistem dinamis, lingkungan hidup,
sosial, ekonomi, manajemen). Jakarta: UMJ Press.
Mursalin, M., Nurjaya, I. W., & Effendi, H. (2014). Analyze of environmental sensitivity for
OSCP (oil spill contingency plan) at Southern Coast of Mahakam Delta, East Kalimantan
Province. Journal of Natural Resources and Environmental Management, 4(1), 84–95.
https://doi.org/https://doi.org/10.29244/jpsl.4.1.84
Oil Spill Combat Team Indonesia. (2016). Oil spill combat report of Kepulauan Seribu.
Bekasi: PT OSCT Indonesia.
Sargisson, R. J., Hunt, S., Hanlen, P., Smith, K., & Hamerton, H. (2012). Volunteering: A
community response to the Rena oil spill in New Zealand. Journal of Contingencies and
Crisis Management, 20(4), 208–218. https://doi.org/10.1111/1468-5973.12001
Smith, K., Hamerton, H., Hunt, S., & Sargisson, R. J. (2016). Local volunteers respond to the
Rena oil spill in Maketū, New Zealand. Kotuitui, 11(1), 1–10.
https://doi.org/10.1080/1177083X.2015.1009474
Soesilo, T. E. B. (2018). Practice of environmental modelling with system dynamics: software
powersim studio ver. 10 (Pelatihan permodelan lingkungan dengan system dynamics:
software powersim studio ver. 10). Jakarta: School of Environmental Science of
Universitas Indonesia.
Soesilo, T. E. B., & Karuniasa, M. (2014). System dynamics modeling (Permodelan system
dynamics). Depok: Faculty of Economics and Business of Universitas Indonesia.
Soesilo, T. E. B., & Karuniasa, M. (2016). System dynamics training modules (Modul
pelatihan system dynamics). Jakarta: School of Environmental Science of Universitas
Indonesia.
Sulistyono. (2017). Impact of oil spill in sea water in oil and gas industry activities and its
control methods (Dampak tumpahan minyak (oil spill) di perairan laut pada kegiatan
industri migas dan metode penanggulangannya). Forum Teknologi, 3(1), 49–52. Retrieved
from http://pusdiklatmigas.esdm.go.id/file/t7-_Dampak_Tumpahan_---_Sulistyono.pdf
The Directorate General of Oil and Gas. (2017). Improvement & harmonization of emergency
oil spills & chemicals in Indonesia (Peningkatan & harmonisasi tanggap darurat
tumpahan minyak & bahan kimia di Indonesia). Forum for the Prevention of Oil Spills
and Hazardous Toxic Chemicals.
The Directorate General of Oil and Gas. (2018). Lesson learned Balikpapan Bay oil spill
(Lesson learned tumpahan minyak Teluk Balikpapan). Forum for the Prevention of Oil
Spills and Hazardous Toxic Chemicals.
The Special Task Force for Upstream Oil and Gas Business Activities. (2017). Maintaining
HSE standards in challenging times (Mempertahankan standar HSE dalam masa yang
penuh tantangan). Forum for the Prevention of Oil Spills and Hazardous Toxic
Chemicals.
Walker, A. H., Pavia, R., Bostrom, A., Leschine, T. M., & Starbird, K. (2015).
Communication practices for oil spills: Stakeholder engagement during preparedness and
Page 15
Journal of Environmental Science and Sustainable Development 2(1): 1–14
DOI: https://doi.org/10.7454/jessd.v2i1.38 14
response. Human and Ecological Risk Assessment: An International Journal, 2(3), 667–
690. https://doi.org/10.1080/10807039.2014.947869
Xiong, S., Long, H., Tang, G., Wan, J., & Li, H. (2015). The management in response to
marine oil spill from ships in China: A systematic review. Marine Pollution Bulletin,
96(1–2), 7–17. https://doi.org/10.1016/j.marpolbul.2015.05.027
Yulianingsih, I. (2012). Economic risk analysis of oil spill in the Coastal Waters of Cilacap:
Case study shrimp fisheries (Analisis risiko ekonomi tumpahan minyak di Perairan
Pesisir Cilacap: Studi kasus perikanan udang). Central Library of Bogor Agricultural
University. Retrieved from https://repository.ipb.ac.id/handle/123456789/60769