Page 1
OIL WELL EXPLORER: DATA MINING AND INFORMATION VISUALIZATION
APPLIED IN OIL & GAS DOMAIN
Bachelor of Science Thesis
Computer Engineering
Rodrigo Augusto de Oliveira e Silva Supervisor: Bruno José Torres Fernandes Co-supervisor: Xin Wang
Page 2
ii
Universidade de Pernambuco Escola Politécnica de Pernambuco
Graduação em Engenharia de Computação
RODRIGO AUGUSTO DE OLIVEIRA E SILVA
OIL WELL EXPLORER: DATA MINING AND INFORMATION VISUALIZATION
APPLIED IN OIL & GAS DOMAIN
Monografia apresentada como requisito parcial para obtenção do diploma de Bacharel em Engenharia de Computação pela Escola Politécnica de Pernambuco –
Universidade de Pernambuco.
Recife, Novembro de 2014.
Page 4
iv
This work is dedicated to my family and friends, who always supported me when I most needed.
Page 5
v
Acknowledgment
Firstly, I would like to thank God, for all the blessings he has brought to me. Many
people were present in my life during the time I entered university. I would like to
express my most sincere and deep acknowledge to them.
I would like to thank my family for always trusting me and helping me during my life
trajectory. I want to thank my girlfriend and all my friends for making my life easier by
comforting me in the toughest situations.
I am thankful to all the friends I made in university since 2009, specially Bruno
Yamashita, for all the enjoyment we had during harsh times while taking courses, and
Marinho Moreira, for being not only a friend, but also a menthor to me. I express my
warm thanks to my supervisor, Dr. Bruno Fernandes, for willing to consider new ideas
and advising me when I needed.
I am very thankful to the people I met in University of Calgary, who shared their
knowledge with me and became good friends of mine. I would like to thank Dequan
Zhou and Xiaodung Sun for supporting me during the period we were labmates. I am
very grateful to Bingjie Wei for being a great friend and helping me with the research
and development of this work. Last, but not least, I would like to thank Dr. Xin Wang
for providing her support, vision, and guidance in my research.
Page 6
vi
“Of all possessions wisdom alone is immortal.” Isocrates
Page 7
vii
Abstract
Gas and oil companies produce a massive amount of data related to the oil extraction
process. Without a software to support, it is complicated to process and analyze the
entire collected data. The Steam-Assisted Gravity Drainage (SAGD) is a recent
technology used for the extraction of heavy oil around the world. In Canada, specially
in the province of Alberta, there are various gas and oil companies that currently apply
SAGD technology in oil extraction, generating large amounts of data. However, the gas
and oil software industry has a lack of systems capable of applying sophisticated
techniques to assist the knowledge extraction by processing data. This work proposes
the creation of a web-based application to visualize SAGD data with similar features
present in software available in the market. Using information visualization and data
mining, the application can assist petroleum experts to investigate hidden patterns in
the data and analyze it with the use of visual representations to uncover unknown
characteristics.
Page 8
viii
Resumo
Empresas de gás e óleo produzem uma quantidade massiva de dados relacionados
ao processo de extração de óleo. Sem o uso de software para dar suporte, é
complicado processar e analisar todos os dados coletados. Drenagem por gravidade
auxiliada por vapor (SAGD – do inglês, Steam-Assisted Gravity Drainage) é uma
tecnologia recente usada para a extração de óleo pesado ao redor do mundo. No
Canadá, especialmente na província de Alberta, existem várias empresas de gás e
óleo que atualmente aplicam tecnologia SAGD na extração de óleo, gerando grande
quantidade de dados. No entanto, a indústria de software voltada a área de gás e óleo
tem uma carência de sistemas capazes de aplicar técnicas sofisticadas para assistir
a extração de conhecimento através do processamento de dados. Este trabalho
propõe a criação de uma aplicação baseada na Web para a visualização de dados
SAGD com funcionalidades similares às presentes em software disponíveis no
mercado. Usando visualização de informações e mineração de dados, a aplicação
pode assistir especialistas em petróleo a investigar padrões escondidos nos dados e
analisá-los com o uso de representações visuais para descobrir características
desconhecidas.
Page 9
ix
Table of Contents
LIST OF FIGURES ......................................................................................... XI
LIST OF TABLES ......................................................................................... XIII
TABLE OF SYMBOLS AND ACRONYMS ................................................... XIV
CHAPTER 1: INTRODUCTION ........................................................................ 1
1.1 Problem Characterization ................................................................... 1
1.2 Objectives and Goals ......................................................................... 2
1.3 Document Structure ........................................................................... 2
CHAPTER 2: BACKGROUND AND GAS AND OIL SOFTWARE .................. 3
2.1 Steam Assisted Gravity Drainage ....................................................... 3
2.2 Data Mining ........................................................................................ 5
2.3 Information Visualization .................................................................... 8
2.4 Geographic Information System ....................................................... 10
2.5 Gas and Oil Software ....................................................................... 11
2.6 Discussion ........................................................................................ 13
CHAPTER 3: OIL WELL EXPLORER ............................................................ 14
3.1 Data Gathering ................................................................................. 14
3.2 Architecture ...................................................................................... 16
3.3 Technology and Project Decisions ................................................... 17
3.4 Application Overview ........................................................................ 20
3.5 Features ........................................................................................... 22
3.5.1 Highlight ................................................................................................ 22
3.5.2 Search .................................................................................................. 22
3.5.3 Polygon Selection ................................................................................. 23
3.5.4 Filter ...................................................................................................... 24
3.5.5 Data Mining ........................................................................................... 25
3.5.6 Visualization .......................................................................................... 30
3.5.7 Export ................................................................................................... 37
3.6 Discussion ........................................................................................ 37
CHAPTER 4: CONCLUSION AND FUTURE WORK ..................................... 39
Page 10
x
4.1 Conclusion ............................................................................................ 39
4.2 Future Work .......................................................................................... 39
REFERENCES ............................................................................................... 41
Page 11
xi
List of Figures
Figure 1. Scheme of oil extration using SAGD technology. ......................................... 4
Figure 2. Representation of knowledge discovery as a sequence of steps. ................ 5
Figure 3. Example of data clustering. On the left, a two-dimensional data distribution
and, on the right, the same data grouped in three distinct clusters. ...................... 7
Figure 4. Numerical values mapped to a visual representation using bars. Larger
numbers are represented in taller bars. ................................................................. 9
Figure 5. Visual Variables. ........................................................................................ 10
Figure 6. Scheme illustrating how GIS combines different data into a map. ............. 11
Figure 7. Geographical location of Alberta, Canada. ................................................. 14
Figure 8. Geospatial distribution of the wells from Firebag project. ........................... 15
Figure 9. Application architecture. ............................................................................. 16
Figure 10. Oil Well Explorer main interface. .............................................................. 21
Figure 11. Highlighting wells...................................................................................... 22
Figure 12. Searching wells by status. Only the wells matching the status “Drilled and
Cased” are shown. .............................................................................................. 23
Figure 13. Selecting wells based on their underground location. .............................. 24
Figure 14. Filtering wells with Drillers Total Depth values between 1500 and 1600. . 25
Figure 15. Wells classified by pads. .......................................................................... 26
Figure 16. Numerical classification by average oil production into five classes, using
equal interval method. ......................................................................................... 27
Figure 17. Clustering wells into four clusters by considering steam injection, oil
production, and steam-oil ratio. ........................................................................... 28
Figure 18. ARM applied to the wells data. ................................................................. 29
Figure 19. Emphasize the wells that match both parts of the ARM expression. ........ 29
Figure 20. Bar chart of average injection hours. ........................................................ 30
Page 12
xii
Figure 21. Pie chart of well current status. ................................................................ 31
Figure 22. Well status timeline of a well. ................................................................... 32
Figure 23. Highlighting the drilled and cased status period in well status timeline. ... 32
Figure 24. Visualization of injection time series data. ................................................ 33
Figure 25. Visualization of production time series data. ............................................ 34
Figure 26. Visualization of SOR time series data. ..................................................... 35
Figure 27. Visualization of SOR time series data with area chart. ............................. 35
Figure 28. Visualization of SOR time series data with bar chart. ............................... 36
Figure 29. Visualization of SOR time series data with scatter chart. ......................... 36
Figure 30. Visualization of SOR time series data of a smaller period of time. ........... 37
Page 13
xiii
List of Tables
Table 1. Technologies used to support the development of the application. ............. 19
Page 14
xiv
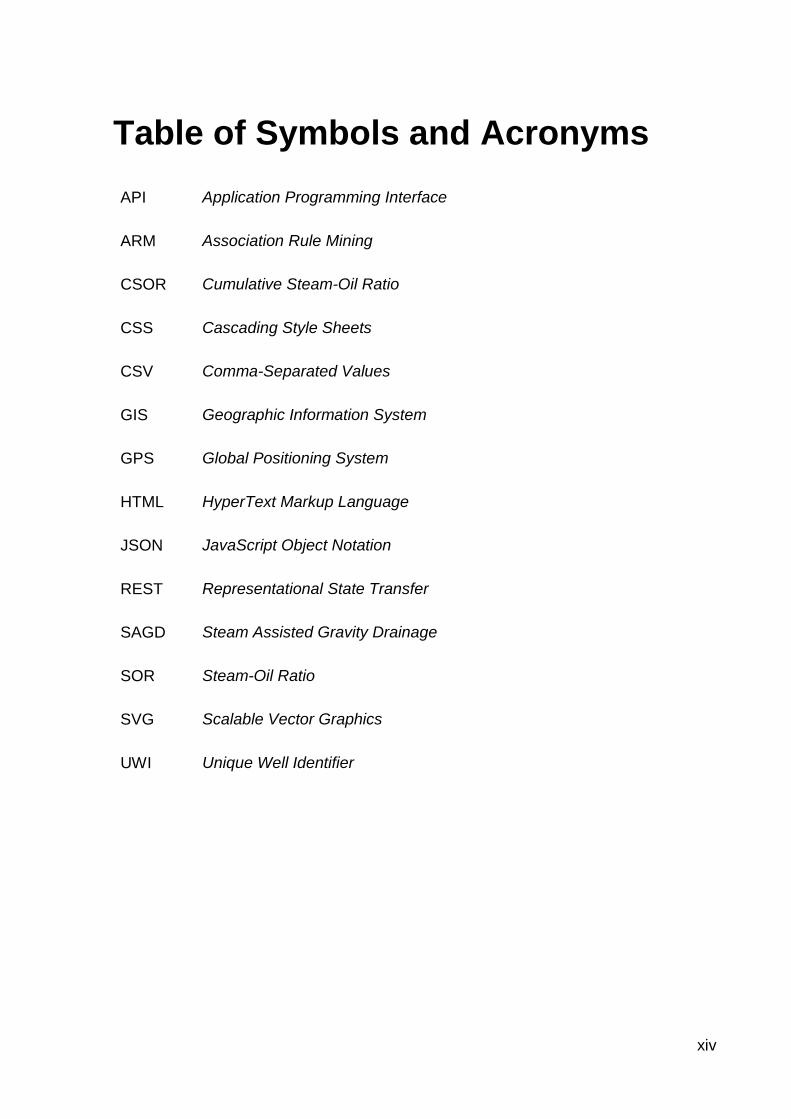
Table of Symbols and Acronyms
API Application Programming Interface
ARM Association Rule Mining
CSOR Cumulative Steam-Oil Ratio
CSS Cascading Style Sheets
CSV Comma-Separated Values
GIS Geographic Information System
GPS Global Positioning System
HTML HyperText Markup Language
JSON JavaScript Object Notation
REST Representational State Transfer
SAGD Steam Assisted Gravity Drainage
SOR Steam-Oil Ratio
SVG Scalable Vector Graphics
UWI Unique Well Identifier
Page 15
Chapter 1 – Introduction
Rodrigo Augusto de Oliveira e Silva 1
Chapter 1:
Introduction
The aim of this chapter is to explain the reasons that originated this work, followed by
the characteristics of the explored problem. The main and specific objectives are
described as well as the structure of the document and the focus of the subsequent
chapters.
1.1 Problem Characterization
There are many resources of heavy oil around the world. Canada is abundant in this
substance, containing almost the same amount compared to the light oil reserves in
the whole Middle East. Many different techniques were used to produce heavy oil, such
as open pit mining approach and cyclic steaming technology. However, they have
serious limitations, which did not allow them to be applied widely in the extraction
process. In the late 1970s, Steam Assisted Gravity Drainage (SAGD) process was
developed and introduced in the province of Alberta, which is proved, from theory and
from scaled model experiments, simpler and more economical to operate and more
efficient to recover oil bitumen (Butler, 1998). Nowadays SAGD is being widely used
as a thermal production technology, which extracts oil bitumen from Alberta’s
subsurface oil sands deposits.
The whole gas and oil industry has been generating large amounts of data related to
oil and natural gas exploration, development and production. Besides, with new data
acquisition, processing and archiving solutions, the gas and oil related data grows
exponentially. During commercial SAGD process – which is comprised of start-up,
ramp-up, conventional SAGD and blow-down – four stages of operations, the steam
circulation, heat transition and chamber distribution change dynamically due to a
combination of reasons like operation conditions, reservoir heterogeneity and wellbore
hydraulics. Data that are related to the dynamics include petro-physical parameters for
reservoir characterization, injected and produced instances and amounts, and
parameters for steam chamber. Estimating those data quickly can help technical
Page 16
Chapter 1 – Introduction
Rodrigo Augusto de Oliveira e Silva 2
petroleum professionals to diagnose any abnormal chamber development and
recovery rate, and make further decisions on corrective or improving actions (Zhu &
Zeng, 2014).
In order to manage and understand all the data from the SAGD wells, data visualization
and data mining techniques are required. In Canada, the petroleum industry has a
need for systems and tools providing the aforementioned techniques to support
experts in their data analysis activities. This work proposes a web based application,
which makes use of more complex data mining and visualization techniques, to assist
petroleum experts to understand better SAGD wells data, to find patterns in it, and,
consequently, to help them in the decision making process.
1.2 Objectives and Goals
The main objective of this work is to create a web-based application to facilitate the
understanding and visualization of SAGD wells data. This work specifically aims to:
Investigate how to intuitively present SAGD data to users;
Research and make use of different visualization and data mining
techniques to ease data comprehension;
Research the main features presented by software used in oil and gas
Canadian organizations to ensure they will be present in the application.
1.3 Document Structure
This document is divided into four chapters. Chapter 2 discusses about background
knowledge and related works that were taken into consideration for the development
of this work. Chapter 3 describes the developed application, detailing how it was
designed and what are its characteristics. Lastly, Chapter 4 summarizes the main
contributions and exposes future work.
Page 17
Chapter 2 – Background and Gas and Oil Software
Rodrigo Augusto de Oliveira e Silva 3
Chapter 2:
Background and Gas and Oil
Software
This chapter presents the concepts used for the development of this work. Section 2.1
will describe the domain, detailing the process involved in this technology for oil
extraction. The following three sections present the background knowledge associated
with the proposed application, detailing motivation, concepts and techniques. Section
2.5 analyzes contributions of existing software related to the domain this work is
involved. Contributions from prior research on the design of the Oil Well Explorer are
presented in Chapter 3.
2.1 Steam Assisted Gravity Drainage
Steam Assisted Gravity Drainage is a specialized drilling method used when the oil to
extract is not conventional crude oil (Butler, 1998). Oil sand, a type of unconventional
petroleum deposit, for instance, is a mixture of bitumen, sand and water. The oil in the
oil sand can be extremely hard and embedded in tons of sand, so the extraction
process must be different in order to separate the oil from the rest. Gas and oil
companies are currently using SAGD technology to extract this kind of oil that is deep
underground. Figure 1 illustrates the SAGD oil extraction process.
Page 18
Chapter 2 – Background and Gas and Oil Software
Rodrigo Augusto de Oliveira e Silva 4
Figure 1. Scheme of oil extration using SAGD technology.
Extracted from http://www.drillingcontractor.org/dea-164-what-does-a-next-gen-ranging-mwd-look-
like-18151.
The entire process consists of liquefying the oil, by using steam, to melt it away from
the sand while it is below the surface. The water used in the process to generate steam
is improper to consume or use in agriculture, as it contains too much salt. Typically,
SAGD employs a horizontal well pair configuration with an upper injection well and a
lower production well drilled with five meters separation in parallel (Parmar, Zhao, &
Graham, 2009). Natural gas is used to heat the water to make steam, which is injected
into the top well, the injector, to heat up the reservoir and form a chamber. In about a
month, period to liquefy the oil, gravity makes the water from the steam and the oil drip
into the bottom well, the producer, through small slots that serve as a filter to block the
sand (How steam-assisted gravity drainage (SAGD) works, 2014; Unconventional
Technology & Innovation - SAGD, 2014). After that, the water and the oil are pumped
from the producer well to the surface, where they are separated. The water is reused
to, once again, make steam, while the oil is sent to the refineries though pipelines. After
getting to the surface, the oil receives a light oil or natural gas liquid to avoid getting
hard again, flowing freely through the pipe.
Page 19
Chapter 2 – Background and Gas and Oil Software
Rodrigo Augusto de Oliveira e Silva 5
2.2 Data Mining
Data mining has been a term heavily used in the information industry in recent years
with the huge increase in data acquisition. The massive amount of data to analyze
complicates the extraction of useful information and knowledge. Data mining is the
exploration and analysis of large amount of data to discover patterns and rules in them
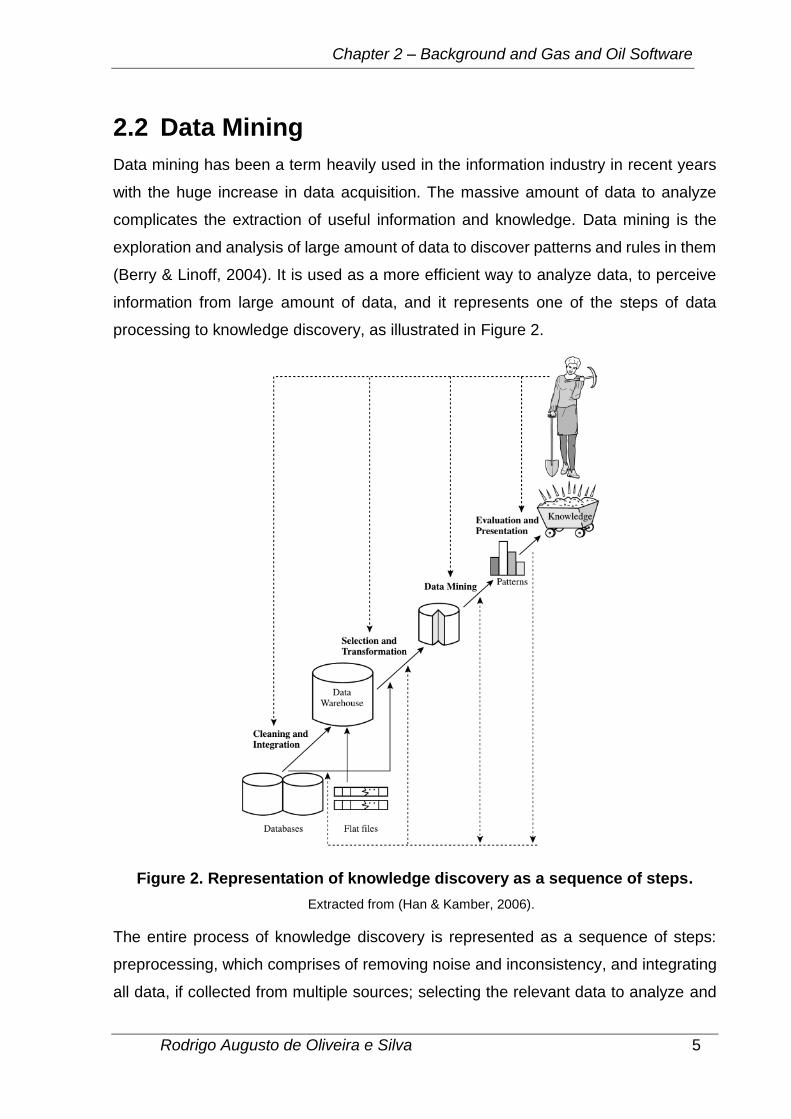
(Berry & Linoff, 2004). It is used as a more efficient way to analyze data, to perceive
information from large amount of data, and it represents one of the steps of data
processing to knowledge discovery, as illustrated in Figure 2.
Figure 2. Representation of knowledge discovery as a sequence of steps.
Extracted from (Han & Kamber, 2006).
The entire process of knowledge discovery is represented as a sequence of steps:
preprocessing, which comprises of removing noise and inconsistency, and integrating
all data, if collected from multiple sources; selecting the relevant data to analyze and
Page 20
Chapter 2 – Background and Gas and Oil Software
Rodrigo Augusto de Oliveira e Silva 6
excluding what is not of interest; transforming the data, if applicable, to a form better
suited for data mining techniques; making use of data mining techniques and methods
to extract data patterns; evaluating the patterns discovered from the application of data
mining techniques, usually done by a domain expert; and finally presenting the
knowledge extracted, by using visualization representations techniques, discussed in
the next section.
Data mining is involved with different classes of tasks, such as anomaly detection,
association rule mining (ARM), clustering or grouping, classification, regression and
summarization.
Classification is the problem of assigning objects to a predefined set of classes (Berry
& Linoff, 2004). It is associated with various tasks used nowadays around the world,
such as: classifying credit applicants as low, medium, or high risk; assigning an email
as spam or non-spam; and assigning a diagnosis to a person by considering identified
symptoms.
Differently from classification, cluster analysis does not categorize objects into known
classes. It tries to organize, separate data in groups, so that objects in the same group
are more similar than objects in different groups, but its intention is not to establish
rules for separating future data into categories or clusters (Jain & Dubes, 1988). A
cluster consists of similar objects grouped together. It is also defined as an aggregation
of points in space such that the distance between two points in the same cluster is
smaller than the distance between a point in a cluster and another that does not belong
to it. An example of grouping data can be seen in the following figure.
Page 21
Chapter 2 – Background and Gas and Oil Software
Rodrigo Augusto de Oliveira e Silva 7
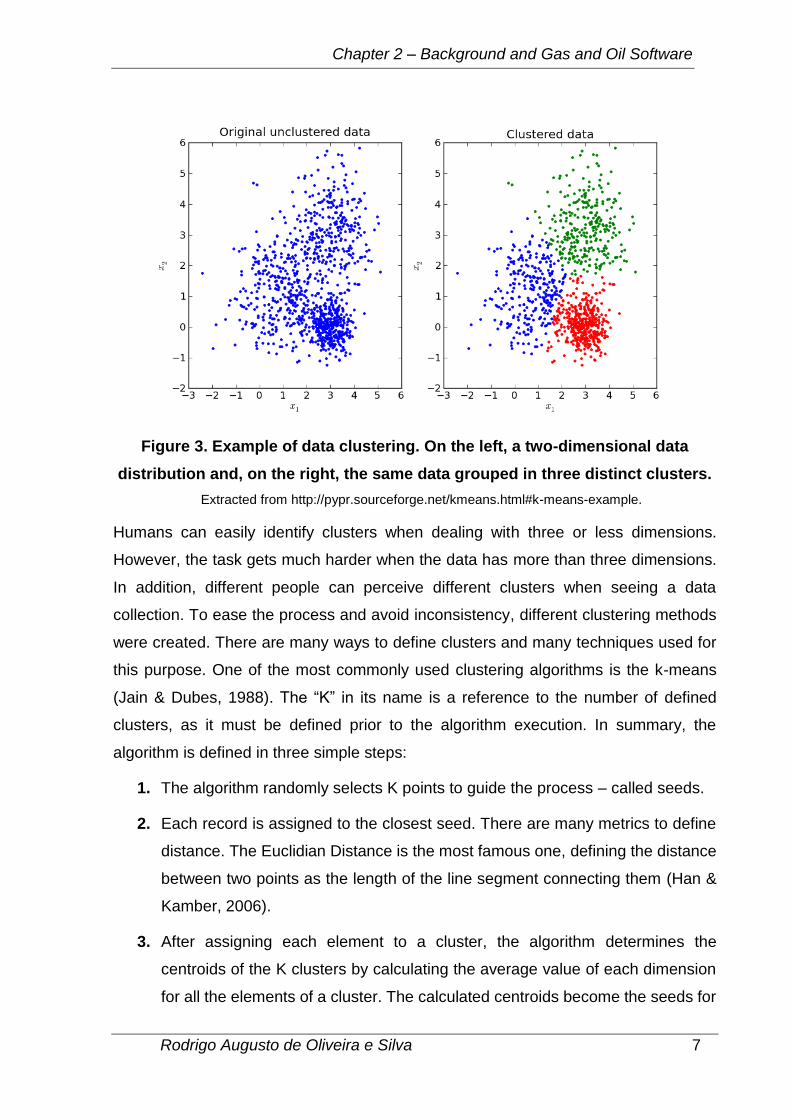
Figure 3. Example of data clustering. On the left, a two-dimensional data
distribution and, on the right, the same data grouped in three distinct clusters.
Extracted from http://pypr.sourceforge.net/kmeans.html#k-means-example.
Humans can easily identify clusters when dealing with three or less dimensions.
However, the task gets much harder when the data has more than three dimensions.
In addition, different people can perceive different clusters when seeing a data
collection. To ease the process and avoid inconsistency, different clustering methods
were created. There are many ways to define clusters and many techniques used for
this purpose. One of the most commonly used clustering algorithms is the k-means
(Jain & Dubes, 1988). The “K” in its name is a reference to the number of defined
clusters, as it must be defined prior to the algorithm execution. In summary, the
algorithm is defined in three simple steps:
1. The algorithm randomly selects K points to guide the process – called seeds.
2. Each record is assigned to the closest seed. There are many metrics to define
distance. The Euclidian Distance is the most famous one, defining the distance
between two points as the length of the line segment connecting them (Han &
Kamber, 2006).
3. After assigning each element to a cluster, the algorithm determines the
centroids of the K clusters by calculating the average value of each dimension
for all the elements of a cluster. The calculated centroids become the seeds for
Page 22
Chapter 2 – Background and Gas and Oil Software
Rodrigo Augusto de Oliveira e Silva 8
the next iteration and the steps two and three repeat until the clusters do not
change anymore.
ARM is used to find frequent patterns, or called strong association rules, with two
measures of rule interestingness – support and confidence. An association rule is
comprised of an antecedent part (if) and a consequent (then) part. For example, a rule
can be represented by “computer => antivirus_software [support = 2%, confidence =
60%]” meaning if a customer buys a computer, the customer will tend to buy antivirus
software as well (Han & Kamber, 2006). There are two metrics to evaluate a rule:
support and confidence. The support number indicates that 2% out of all the
transaction records in the database have both a computer and a software. The
confidence number indicates that 60% of the customers who purchased the computer
also purchased the software. Frequent if and then patterns satisfying minimum support
and minimum confidence are identified as strong association rules.
To discuss about other data mining techniques and to go into further details about
classification and ARM is beyond the scope of this work.
2.3 Information Visualization
Extracting useful information from data is getting harder due to the huge increasing in
amount of data collected every day. Analyzing data is an old activity practiced by
mathematicians and statisticians for many years. However, evaluating data based on
numbers is not always straightforward, as many patterns can be hidden in it. To
mitigate this problem, different visualization techniques can be used, as humans can
identify patterns and perceive information more easily by interpreting visual
representations (Murray, 2013). Information Visualization as defined by Card et al.
(1999) is:
“The use of computer-supported, interactive, visual representations of abstract data to
amplify cognition.”
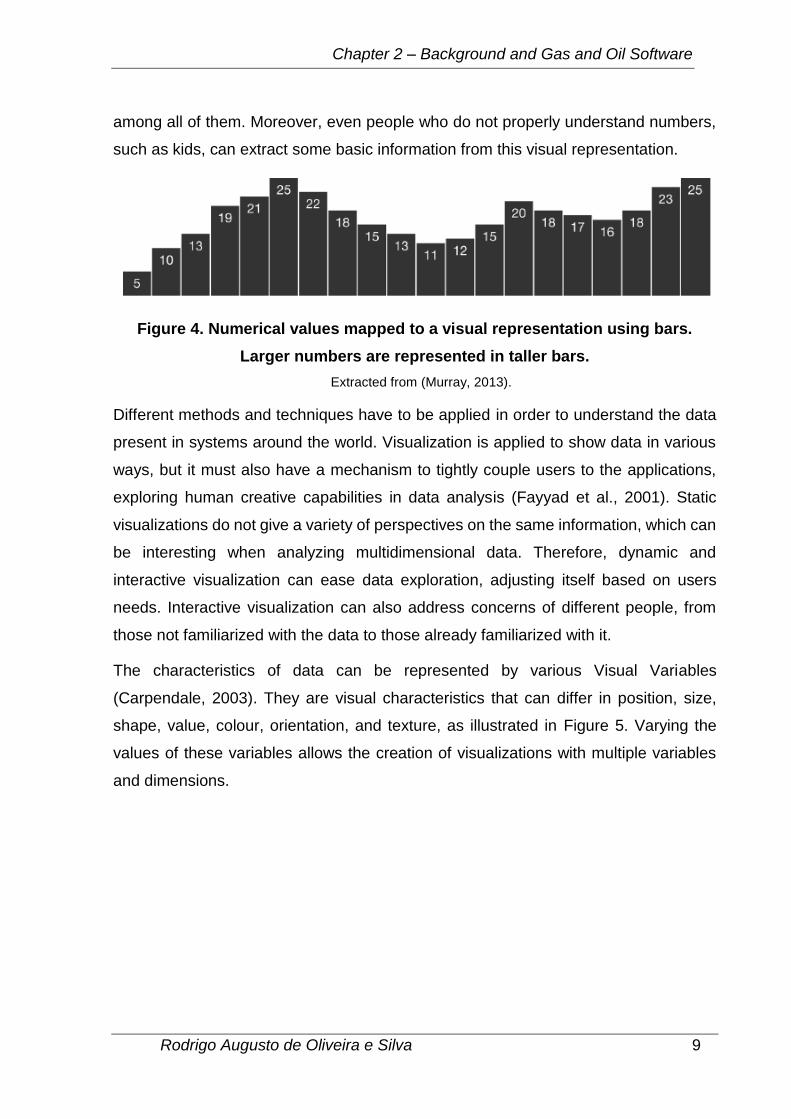
Figure 4 shows an example of how visual representations can enhance the data
understanding. In it, numerical values are mapped to a bar chart and for example, just
by looking to it, is possible to say which numbers are the largest and the smallest
Page 23
Chapter 2 – Background and Gas and Oil Software
Rodrigo Augusto de Oliveira e Silva 9
among all of them. Moreover, even people who do not properly understand numbers,
such as kids, can extract some basic information from this visual representation.
Figure 4. Numerical values mapped to a visual representation using bars.
Larger numbers are represented in taller bars.
Extracted from (Murray, 2013).
Different methods and techniques have to be applied in order to understand the data
present in systems around the world. Visualization is applied to show data in various
ways, but it must also have a mechanism to tightly couple users to the applications,
exploring human creative capabilities in data analysis (Fayyad et al., 2001). Static
visualizations do not give a variety of perspectives on the same information, which can
be interesting when analyzing multidimensional data. Therefore, dynamic and
interactive visualization can ease data exploration, adjusting itself based on users
needs. Interactive visualization can also address concerns of different people, from
those not familiarized with the data to those already familiarized with it.
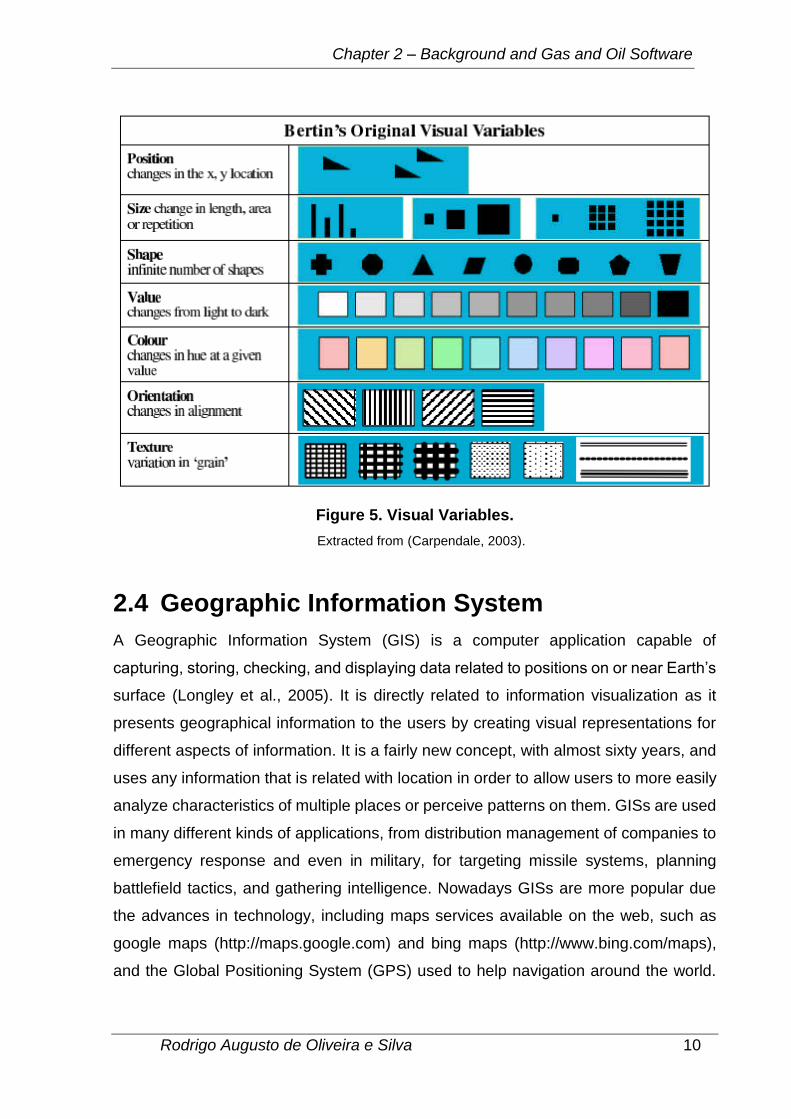
The characteristics of data can be represented by various Visual Variables
(Carpendale, 2003). They are visual characteristics that can differ in position, size,
shape, value, colour, orientation, and texture, as illustrated in Figure 5. Varying the
values of these variables allows the creation of visualizations with multiple variables
and dimensions.
Page 24
Chapter 2 – Background and Gas and Oil Software
Rodrigo Augusto de Oliveira e Silva 10
Figure 5. Visual Variables.
Extracted from (Carpendale, 2003).
2.4 Geographic Information System
A Geographic Information System (GIS) is a computer application capable of
capturing, storing, checking, and displaying data related to positions on or near Earth’s
surface (Longley et al., 2005). It is directly related to information visualization as it
presents geographical information to the users by creating visual representations for
different aspects of information. It is a fairly new concept, with almost sixty years, and
uses any information that is related with location in order to allow users to more easily
analyze characteristics of multiple places or perceive patterns on them. GISs are used
in many different kinds of applications, from distribution management of companies to
emergency response and even in military, for targeting missile systems, planning
battlefield tactics, and gathering intelligence. Nowadays GISs are more popular due
the advances in technology, including maps services available on the web, such as
google maps (http://maps.google.com) and bing maps (http://www.bing.com/maps),
and the Global Positioning System (GPS) used to help navigation around the world.
Page 25
Chapter 2 – Background and Gas and Oil Software
Rodrigo Augusto de Oliveira e Silva 11
Furthermore, Figure 6 shows how GISs overlay data of different areas to create a
unique representation for them.
Figure 6. Scheme illustrating how GIS combines different data into a map.
Extracted from (GIS (geographic information system), 2014).
2.5 Gas and Oil Software
The whole gas and oil industry has been generating large amounts of data related to
oil and natural gas exploration, development and production. Besides, with new data
acquisition and processing solutions, the gas and oil related data grows exponentially
(Holdaway, 2014). Applications assisting in storing and managing the huge and ever-
growing quantities of gas and oil data are definitely in demand. In Alberta, some gas
and oil data companies have commercial products such as Accumap by IHS®
(http://www.ihs.com/products/oil-gas/ep-data/tools/accumap), GeoCarta by Divestco®
(http://www.divestco.com/Solutions/Geological/GeoCarta.aspx), and geoScout by
geoLogic® (http://www.geologic.com/products-services/geoscout) that provide
software solutions for users to access data from different domains like mineral land,
geology and geophysics, engineering and midstream data.
Page 26
Chapter 2 – Background and Gas and Oil Software
Rodrigo Augusto de Oliveira e Silva 12
The displaying of gas and oil data necessitates a GIS environment within the data
management and analysis system. For petroleum objects like wells, pipelines,
facilities, GIS can manage the spatial components of different objects in databases
and apply spatial analysis and modeling efficiently across the system. GeoCarta by
Divestco is a software tool attached to ArcMap, the central application used in ArcGIS
(http://www.esri.com/software/arcgis), and has an additional interface for data
management (GeoCarta GIS for All, 2014). ArcMap and the database management
system work interactively for searching and locating for oil and gas related objects.
Those spatial objects can be either located in the intuitive mapping interface or
searched by its industry standard location description, the unique well identifier (UWI),
in the data management interface; and the searched results are synchronized in both
interfaces. GeoCarta simplifies the workflows for accessing and exploring disparate
gas and oil spatial or relational data by integrating a GIS environment.
As for installing those software, normally it is required to obtain the software package
and the license number. With software or database updated, new packages need to
be installed. As for GeoCarta, ArcGIS Desktop is required to be installed as well since
it is the mapping interface. It is desired to facilitate more convenient access to the latest
software and data. WebGISs, GIS system built based on web technologies, can give
users access to the system and make use of the mapping and analytical functionalities
as long as they have access to the Internet. Different thematic applications like flood
management and ecological restoration have employed WebGIS technology, proving
an interactive, flexible tool (Lienert et al., 2011; Freyman & Glennemeier, 2014).
The aforementioned commercial software basically focus on data management, but
have limited analysis functionality for the gas and oil data. In terms of analyzing the
large quantities of data in oil and gas industry, visualization tools and other digital
techniques have helped with exploring data, making decisions and improving
production (Evans et al., 2002).
Graphic methods like diagrams, charts, plots and other forms of visualizations are the
most common and straightforward ways to summarize datasets. Bar charts, pie charts,
line graphs, and other kinds of graphs are implemented in some commercial gas and
oil data management systems like GeoCarta and AccuMap, providing users
quantitative or qualitative observations for numerical and categorical data. Moreover,
Page 27
Chapter 2 – Background and Gas and Oil Software
Rodrigo Augusto de Oliveira e Silva 13
cross-plots are commonly used to visualize the relationships between some reservoir
characteristics or production data (Sharma et al., 2010). To determine the reservoir
drive mechanism, a cross-plot can be plotted between recovery efficiency and
reservoir pressure or gas-oil ratio and cumulative oil (Zangl & Hannerer, 2003).
Information is implied in the shape of the resulting curve or some extrapolated trend
lines.
2.6 Discussion
The analyzed software are extremely powerful for various kinds of applications, as
geographical data is used in many businesses around the world. While these software
can precisely present information to users, mainly related to geographical coordinates,
when dealing with SAGD data, for example, users may not be able to extract useful
knowledge from the data due to the lack of more data mining and information
visualization techniques. Employing some of the available techniques discussed in this
chapter can enhance data understanding and consequently support some of the critical
decisions made in a company. The techniques by themselves are insuficient, as the
way to present information to users also must be taken into consideration.
The proposed application integrates the aforementioned concepts and techniques to
provide features not available in related systems. Details of the application and its
features are described in the following chapter.
Page 28
Chapter 3 – Oil Well Explorer
Rodrigo Augusto de Oliveira e Silva 14
Chapter 3:
Oil Well Explorer
This chapter describes the developed application, detailing about the data gathering
and processing, selected technologies, architecture, and the main features of it.
3.1 Data Gathering
Considering the quantity of data that SAGD projects could have been generating,
public available data are limited and scattered. Some SAGD in situ and surface
facilities collect real-time data, which are compiled and only distributed within the
organizations. Through Alberta Energy Regulator, annual reports on in situ
performance of each SAGD projects in Alberta are accessible, containing summary
information on geology and geophysics, drilling and well instrumentation, seismic, and
operation performance, displayed in forms of maps and graphs (In Situ Performance
Presentations, 2014).
Figure 7. Geographical location of Alberta, Canada.
Extracted and adapted from http://maps.google.com.
Page 29
Chapter 3 – Oil Well Explorer
Rodrigo Augusto de Oliveira e Silva 15
On the other hand, data can be obtained through commercial software platforms, which
purchase oil and gas data through some oil and gas companies or specialized data
companies. In this work, data on wells in Alberta SAGD projects were collected from
Alberta Energy Regulator and Divestco GeoCarta. The province of Alberta was
selected because most of the gas and oil companies using SAGD have projects
currently in activity. Moreover, Alberta Energy Regulator provides reports with some
public data and in addition to Divestco GeoCarta, which was available during the
development of this work, more data could be collected.
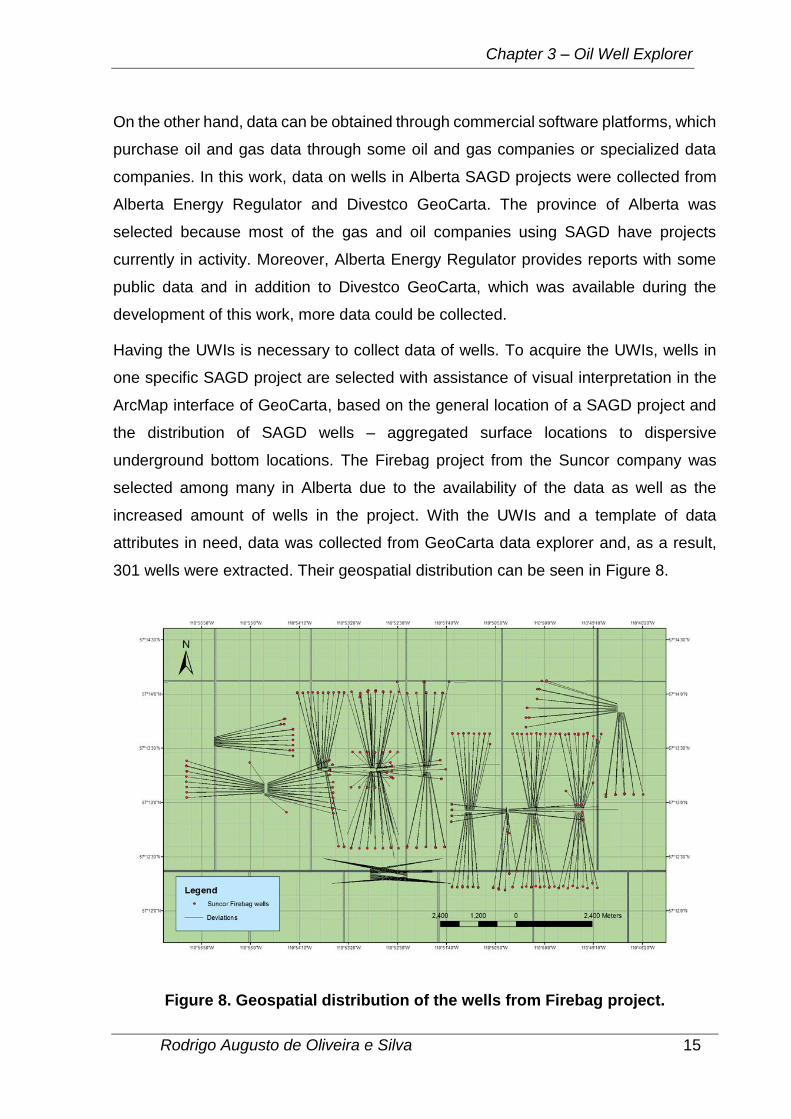
Having the UWIs is necessary to collect data of wells. To acquire the UWIs, wells in
one specific SAGD project are selected with assistance of visual interpretation in the
ArcMap interface of GeoCarta, based on the general location of a SAGD project and
the distribution of SAGD wells – aggregated surface locations to dispersive
underground bottom locations. The Firebag project from the Suncor company was
selected among many in Alberta due to the availability of the data as well as the
increased amount of wells in the project. With the UWIs and a template of data
attributes in need, data was collected from GeoCarta data explorer and, as a result,
301 wells were extracted. Their geospatial distribution can be seen in Figure 8.
Figure 8. Geospatial distribution of the wells from Firebag project.
Page 30
Chapter 3 – Oil Well Explorer
Rodrigo Augusto de Oliveira e Silva 16
Produced using the software Divestco Geocarta.
The wells contained a huge number of atributes which were not important for the study.
Therefore, the raw data was trimmed and finally added into the database, containing,
at the end of the entire process, time series of injection and production in addition to
basic attributes, such as latitude, longitude, type, operator, status history, and depth,
among others.
3.2 Architecture
The architecture of the application, internal organization, created files and the relation
between them, is illustrated in the following figure.
Figure 9. Application architecture.
The application consists of three main components: database, Data Processing Server
and Client Server. The database is managed by PostgreSQL and currently does not
receive any request to update or insert new records, only retrieve the stored data.
The Data Processing Server is the responsible to directly access the database, by
using the node-postgres module, as well as executing the k-means clustering
algorithm, present in the clusterfck module. The decision to execute the clustering
Page 31
Chapter 3 – Oil Well Explorer
Rodrigo Augusto de Oliveira e Silva 17
method in the data processing server took into consideration the necessity of a short
response time combined with a lower memory cost when using the application, as the
algorithm might have to process high dimensionality data, significantly increasing the
memory needed.
Lastly, the Client Server contains the files associated with the other functionalities,
represented by both internal and external modules, and the graphical user interface of
the application, represented by the index.html and style.css. The main.js file is the
starting point, as it has the responsibility to initialize the other scripts. The internal
modules consist of scripts created to fulfil the tasks that each module were meant to
execute. The architecture of them resembles the Model-View-Controller (MVC)
pattern, which separates the information used in the application from the way it is
presented to the users (Leff & Rayfield, 2001). Nearly all scripts were created in two
separated files, the view and the controller. As in the MVC pattern, the views deal with
elements in interface and how the data is shown to the user, the controllers send the
processed data to the view, and the model is diffused in the data processing server.
Lastly, the internal modules use functions provided by the external modules, taking
advantage of the tested third party implementations described previously.
The data processing server and the client server communicate with each other through
a Representational State Transfer (REST) Application Programming Interface (API).
For the communication to be successful, it needs a form of representation that both
servers can understand, a data-interchange format, which in this case is JavaScript
Object Notation (JSON). The data processing server waits for a call from the client
server, processes whatever it needs, and sends data back to the client server, which
interprets and updates the application accordingly.
3.3 Technology and Project Decisions
Selecting the best technologies to support the development is a fundamental step in
the development process of a system or application. Their capacities, simplifications,
performance, problems and flexibilities must be taken into account when comparing
different technologies that can produce similar results. Developing a web application
includes dealing at least with HyperText Markup Language (HTML) and Cascading
Style Sheets (CSS), while other technologies can be included if needed to achieve
Page 32
Chapter 3 – Oil Well Explorer
Rodrigo Augusto de Oliveira e Silva 18
aimed goals. This application uses HTML5 and CSS3 to deal with the graphical
interface, as they are the newest versions and provide various facilities to freely modify
and adjust elements conveniently.
The application was built using JavaScript as programming language. JavaScript was
selected due to many reasons: it is a relatively easy language to use that resembles
other object-oriented languages; it is executed on the client side, avoiding excessive
communication with the web server and, therefore, reducing the processing time; and
it has a huge amount of third party libraries, plugins and modules that can be used to
accelerate the development (JavaScript, 2014).
The server was developed with the use of Node.js, an open source cross-platform
runtime environment (Kiessling, 2012). It was chosen because it is mainly developed
in JavaScript, it can run in different operational systems, it was built to optimize an
application’s throughput and scalability, and the communication with the database is
simplified. The database, in its turn, is managed by the PostgreSQL, an open source
object-relational database system that runs on all major operating systems (About
PostgreSQL, 2014). It has a good, stable performance, high quality of code and
documentation, and a great open source community.
Google Maps API was chosen to give some of the GISs capabilities, providing a web
mapping service used to display a map with different perspectives and identify
locations based on latitude and longitude coordinates (Google Maps Embed API,
2014). It was used in the development of the application because the development is
done with JavaScript, it is simple to use, has an extensive documentation with various
different examples, and since it is famous around the world more people should be
able to better understand it, including GIS experts.
Other technologies had to be used to support the development of specific tasks in the
application. All the different technologies were selected by considering their
advantages and related issues, availability of documentation, quality of community
feedback, and the facility of integration, as it would directly impact the development
process duration. The following table describes the selected technologies, their
purpose, and how they contributed to the development of the application.
Page 33
Chapter 3 – Oil Well Explorer
Rodrigo Augusto de Oliveira e Silva 19
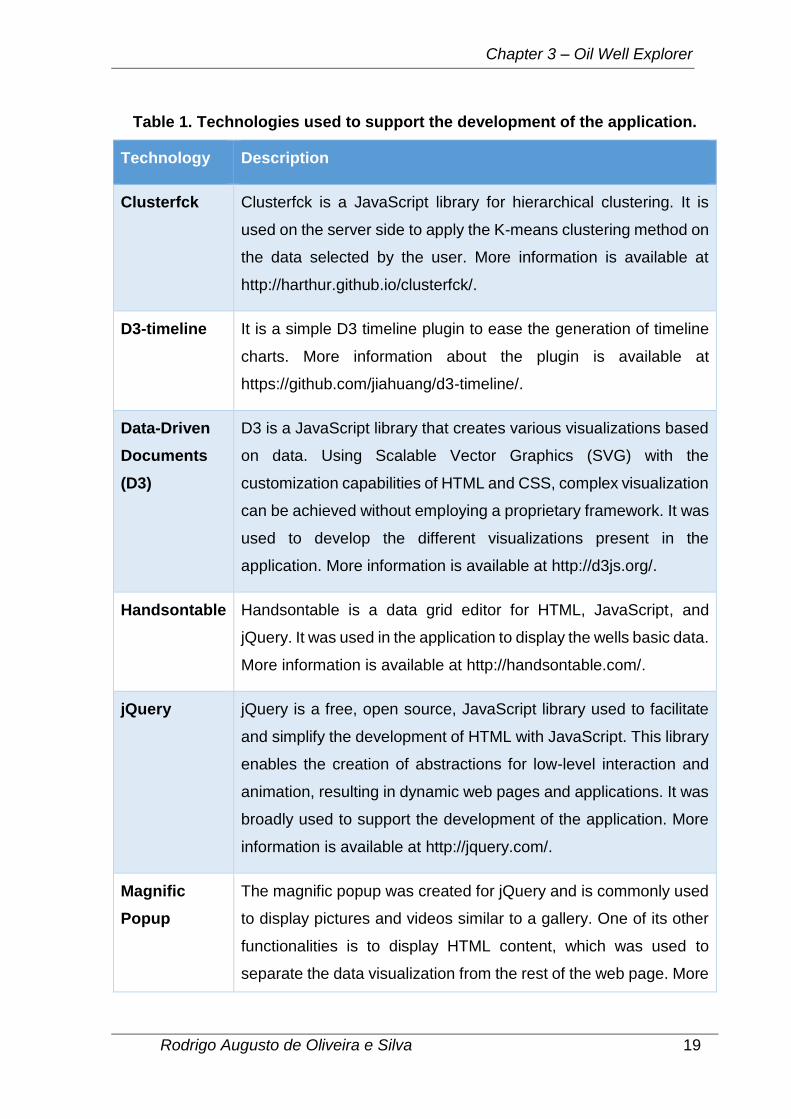
Table 1. Technologies used to support the development of the application.
Technology Description
Clusterfck Clusterfck is a JavaScript library for hierarchical clustering. It is
used on the server side to apply the K-means clustering method on
the data selected by the user. More information is available at
http://harthur.github.io/clusterfck/.
D3-timeline It is a simple D3 timeline plugin to ease the generation of timeline
charts. More information about the plugin is available at
https://github.com/jiahuang/d3-timeline/.
Data-Driven
Documents
(D3)
D3 is a JavaScript library that creates various visualizations based
on data. Using Scalable Vector Graphics (SVG) with the
customization capabilities of HTML and CSS, complex visualization
can be achieved without employing a proprietary framework. It was
used to develop the different visualizations present in the
application. More information is available at http://d3js.org/.
Handsontable Handsontable is a data grid editor for HTML, JavaScript, and
jQuery. It was used in the application to display the wells basic data.
More information is available at http://handsontable.com/.
jQuery jQuery is a free, open source, JavaScript library used to facilitate
and simplify the development of HTML with JavaScript. This library
enables the creation of abstractions for low-level interaction and
animation, resulting in dynamic web pages and applications. It was
broadly used to support the development of the application. More
information is available at http://jquery.com/.
Magnific
Popup
The magnific popup was created for jQuery and is commonly used
to display pictures and videos similar to a gallery. One of its other
functionalities is to display HTML content, which was used to
separate the data visualization from the rest of the web page. More
Page 34
Chapter 3 – Oil Well Explorer
Rodrigo Augusto de Oliveira e Silva 20
information about the plugin is available at
http://dimsemenov.com/plugins/magnific-popup/.
Node-
postgres
The communication between the PostgreSQL and the server is not
natively available. The node-postgres is a PostgreSQL client for
Node.js that allows them to exchange data. More information is
available at https://github.com/brianc/node-postgres/.
Rickshaw Rickshaw is a Javascript toolkit built on D3 that is capable of
creating interactive time series graphs. It was used in the
visualization of time series data in the visualization module. More
information is available at http://code.shutterstock.com/rickshaw/.
3.4 Application Overview
The Oil Well Explorer is a single page application, focusing on a better user experience
by providing a more fluid usability. It was designed in this manner to resemble a
desktop application, without the necessity of loading a new page for each task
executed by the users.
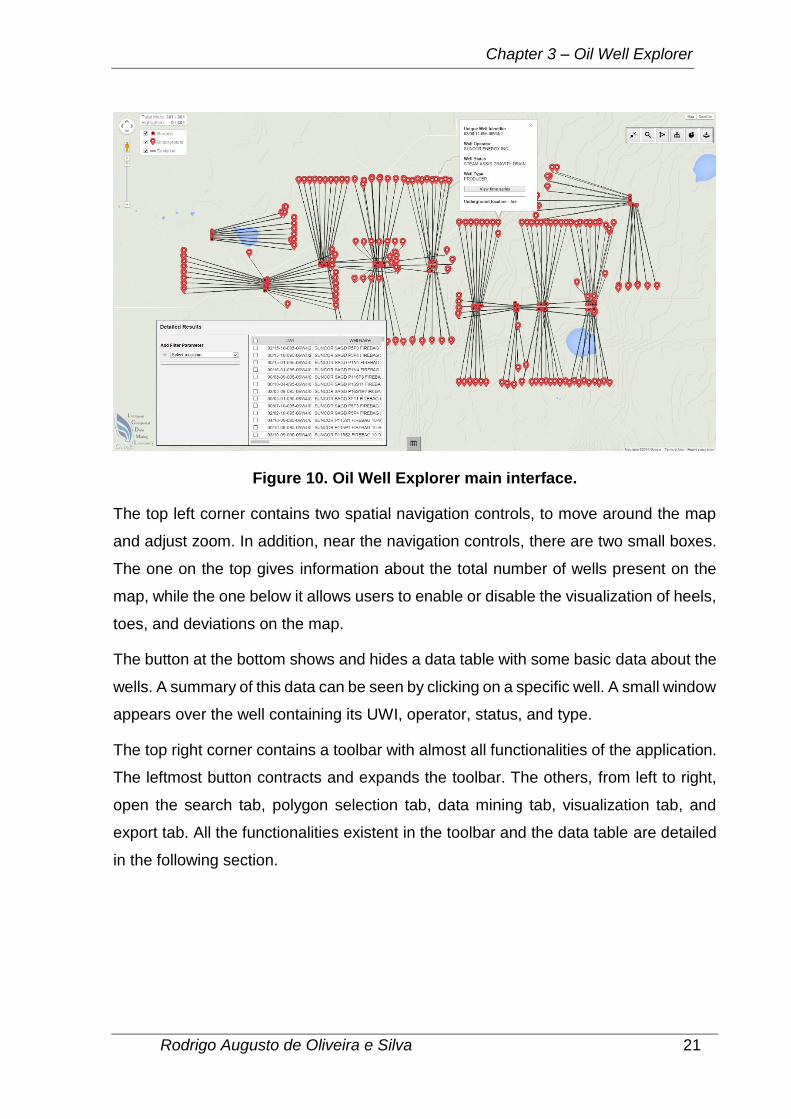
The main interface of the application is illustrated in Figure 10. A map fills the entire
application window and other manipulation elements are located over it. It
automatically adjust the location and zoom to display all the existing wells. Two
locations are needed to represent the wells properly: the heel, surface location, and
the toe, bottom location. A different shape is used for each one: the heel is represented
by small red circles with a black circle inside and the toe, on the other hand, is
represented by the red pins with a white circle inside. The collected data does not
contain information about the underground trajectory of the well, from heel to toe, called
deviation. Therefore, it is represented as a rough approximation by a straight line
between both locations.
Page 35
Chapter 3 – Oil Well Explorer
Rodrigo Augusto de Oliveira e Silva 21
Figure 10. Oil Well Explorer main interface.
The top left corner contains two spatial navigation controls, to move around the map
and adjust zoom. In addition, near the navigation controls, there are two small boxes.
The one on the top gives information about the total number of wells present on the
map, while the one below it allows users to enable or disable the visualization of heels,
toes, and deviations on the map.
The button at the bottom shows and hides a data table with some basic data about the
wells. A summary of this data can be seen by clicking on a specific well. A small window
appears over the well containing its UWI, operator, status, and type.
The top right corner contains a toolbar with almost all functionalities of the application.
The leftmost button contracts and expands the toolbar. The others, from left to right,
open the search tab, polygon selection tab, data mining tab, visualization tab, and
export tab. All the functionalities existent in the toolbar and the data table are detailed
in the following section.
Page 36
Chapter 3 – Oil Well Explorer
Rodrigo Augusto de Oliveira e Silva 22
3.5 Features
This section describes and details all the existent features in the Oil Well Explorer,
displaying figures to enhance understanding and to present the changes in interface
associated with the feature usage flow. The seven features are highlight, search,
polygon selection, filter, data mining, visualization, and export.
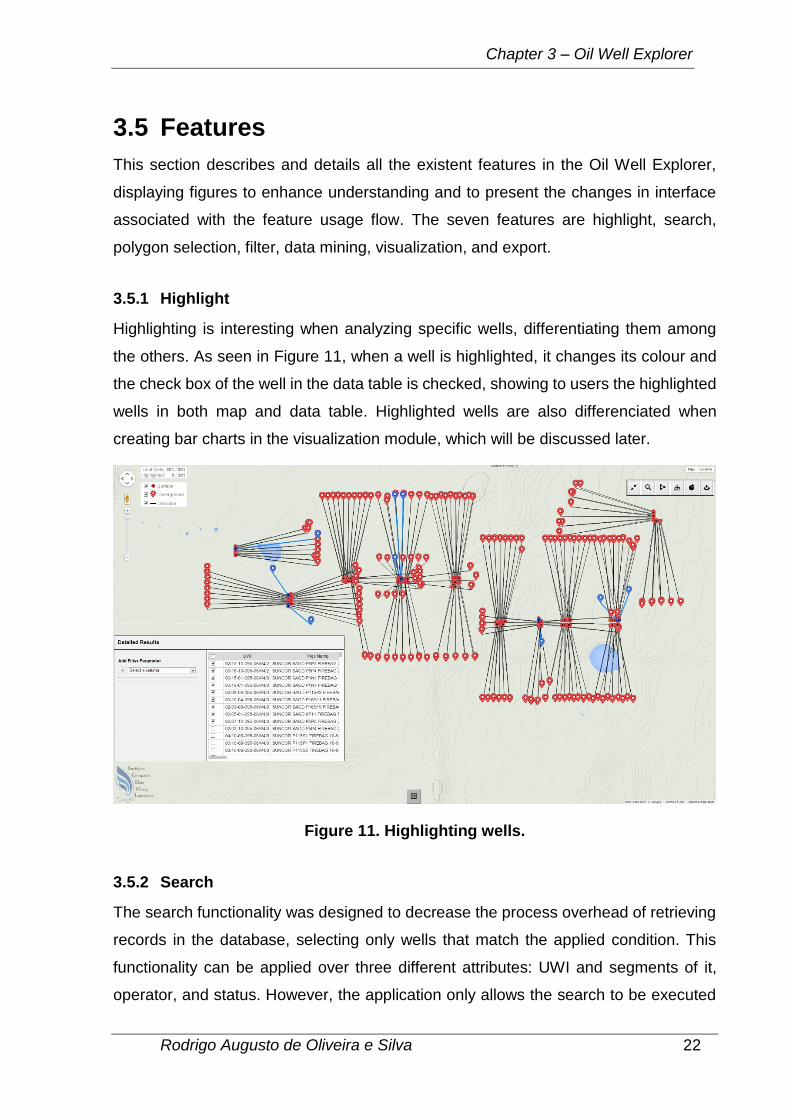
3.5.1 Highlight
Highlighting is interesting when analyzing specific wells, differentiating them among
the others. As seen in Figure 11, when a well is highlighted, it changes its colour and
the check box of the well in the data table is checked, showing to users the highlighted
wells in both map and data table. Highlighted wells are also differenciated when
creating bar charts in the visualization module, which will be discussed later.
Figure 11. Highlighting wells.
3.5.2 Search
The search functionality was designed to decrease the process overhead of retrieving
records in the database, selecting only wells that match the applied condition. This
functionality can be applied over three different attributes: UWI and segments of it,
operator, and status. However, the application only allows the search to be executed
Page 37
Chapter 3 – Oil Well Explorer
Rodrigo Augusto de Oliveira e Silva 23
on one attribute at a time. When a new search value is entered, the map will update
accordingly, displaying only the matching wells, as seen in Figure 12.
Figure 12. Searching wells by status. Only the wells matching the status
“Drilled and Cased” are shown.
When a search is executed, a small data table appears under the search menu,
showing the UWI, operator and status of the matching wells.
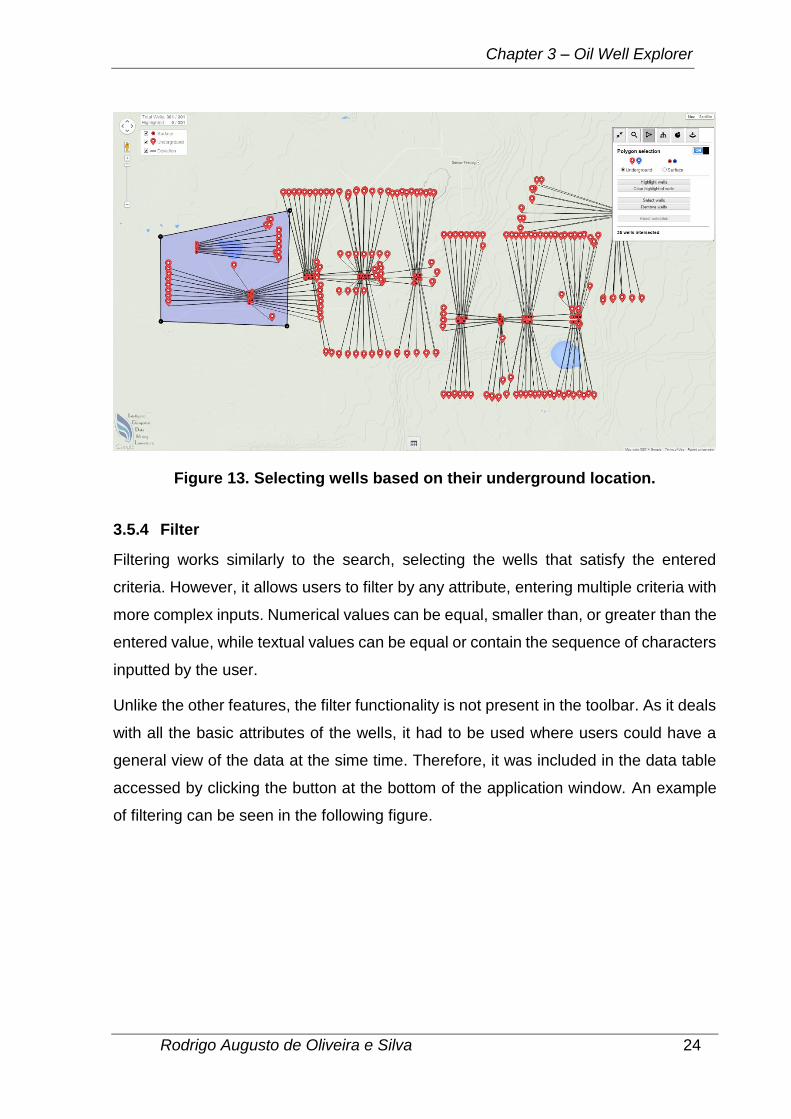
3.5.3 Polygon Selection
The polygon selection is a convenient tool to make use when the interest is not to focus
on wells with the same attribute, as done in the search, but to choose them based on
their geographical location. Users can define a polygon with three or more vertices and
move it around the map to mark the area of interest, being able to select or remove the
intersected wells and highlight or clear the highlighted ones. Furthermore, the toolbar
contains the option to only intersect the wells based on their surface or underground
locations. As soon as the polygon is created on the map and it overlays one or more
wells, a message is displayed at the bottom of the toolbar, showing the number of wells
intersected. Figure 13 illustrates the highlight functionality.
Page 38
Chapter 3 – Oil Well Explorer
Rodrigo Augusto de Oliveira e Silva 24
Figure 13. Selecting wells based on their underground location.
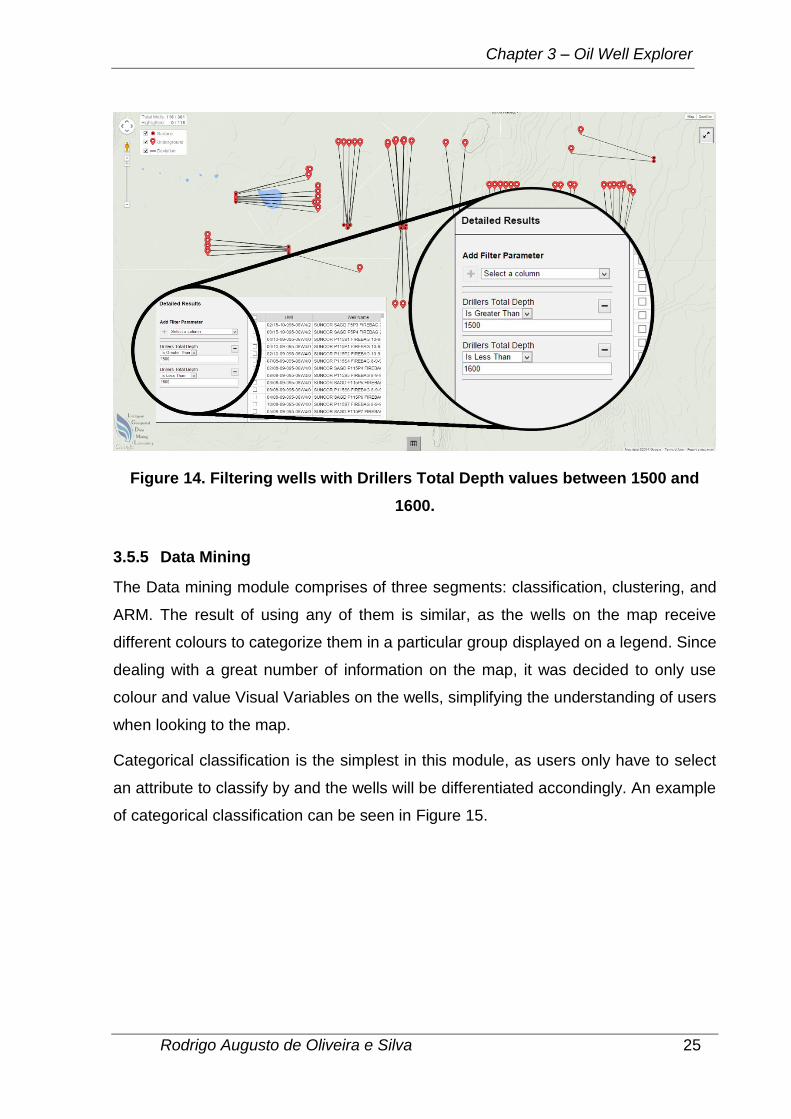
3.5.4 Filter
Filtering works similarly to the search, selecting the wells that satisfy the entered
criteria. However, it allows users to filter by any attribute, entering multiple criteria with
more complex inputs. Numerical values can be equal, smaller than, or greater than the
entered value, while textual values can be equal or contain the sequence of characters
inputted by the user.
Unlike the other features, the filter functionality is not present in the toolbar. As it deals
with all the basic attributes of the wells, it had to be used where users could have a
general view of the data at the sime time. Therefore, it was included in the data table
accessed by clicking the button at the bottom of the application window. An example
of filtering can be seen in the following figure.
Page 39
Chapter 3 – Oil Well Explorer
Rodrigo Augusto de Oliveira e Silva 25
Figure 14. Filtering wells with Drillers Total Depth values between 1500 and
1600.
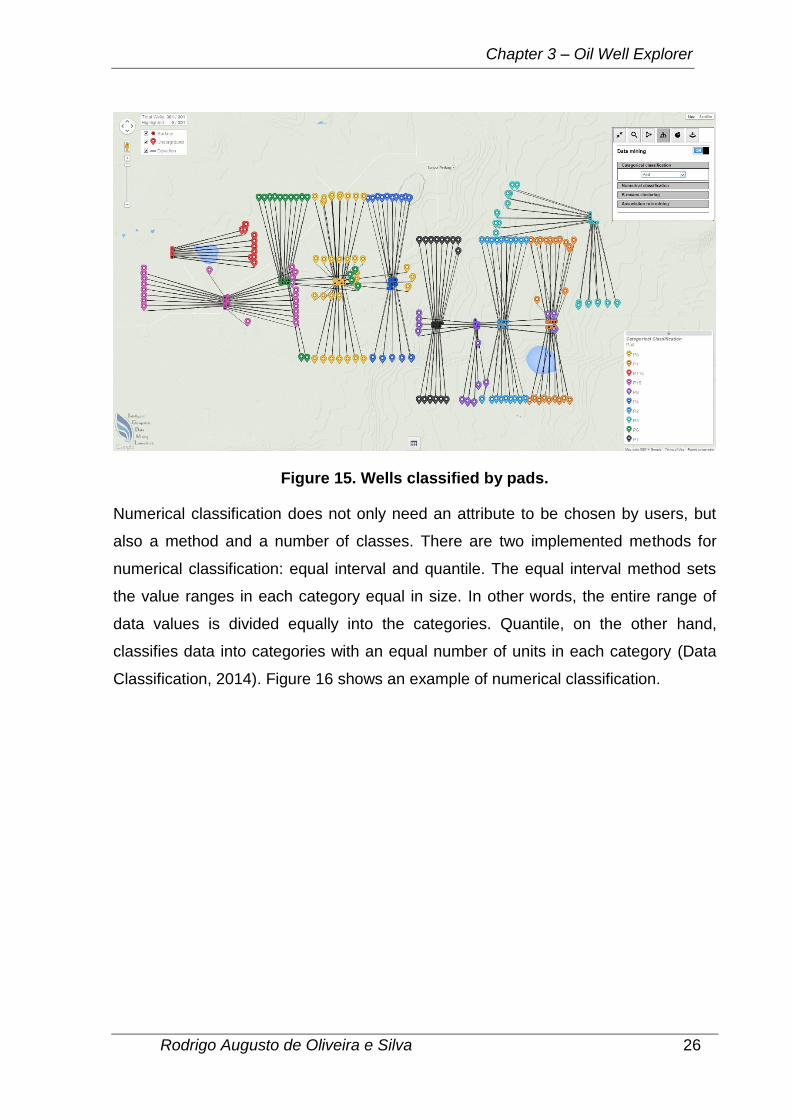
3.5.5 Data Mining
The Data mining module comprises of three segments: classification, clustering, and
ARM. The result of using any of them is similar, as the wells on the map receive
different colours to categorize them in a particular group displayed on a legend. Since
dealing with a great number of information on the map, it was decided to only use
colour and value Visual Variables on the wells, simplifying the understanding of users
when looking to the map.
Categorical classification is the simplest in this module, as users only have to select
an attribute to classify by and the wells will be differentiated accondingly. An example
of categorical classification can be seen in Figure 15.
Page 40
Chapter 3 – Oil Well Explorer
Rodrigo Augusto de Oliveira e Silva 26
Figure 15. Wells classified by pads.
Numerical classification does not only need an attribute to be chosen by users, but
also a method and a number of classes. There are two implemented methods for
numerical classification: equal interval and quantile. The equal interval method sets
the value ranges in each category equal in size. In other words, the entire range of
data values is divided equally into the categories. Quantile, on the other hand,
classifies data into categories with an equal number of units in each category (Data
Classification, 2014). Figure 16 shows an example of numerical classification.
Page 41
Chapter 3 – Oil Well Explorer
Rodrigo Augusto de Oliveira e Silva 27
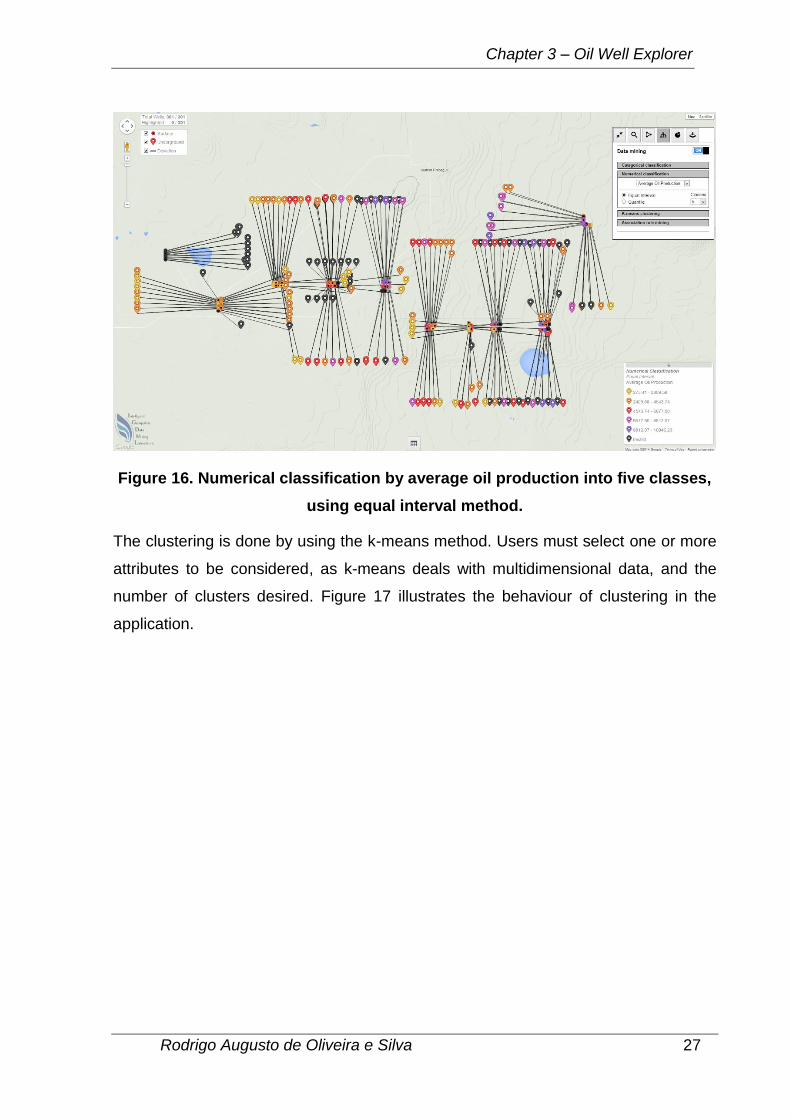
Figure 16. Numerical classification by average oil production into five classes,
using equal interval method.
The clustering is done by using the k-means method. Users must select one or more
attributes to be considered, as k-means deals with multidimensional data, and the
number of clusters desired. Figure 17 illustrates the behaviour of clustering in the
application.
Page 42
Chapter 3 – Oil Well Explorer
Rodrigo Augusto de Oliveira e Silva 28
Figure 17. Clustering wells into four clusters by considering steam injection, oil
production, and steam-oil ratio.
The ARM was not implemented in the application due to time constraints. However, it
was added as a proof of concept since its output is similar to the other methods applied.
The method was applied using an external software named Weka
(http://www.cs.waikato.ac.nz/ml/weka/) and the results of it were included in the
application. There were five expressions in the results that seemed to be interesting,
relating injection data in the if part of the statement with production data in the then
part. These rules were used to show how the ARM would behave in the application, as
seen in Figure 18. When the ARM is applied, a small table appears showing the
encountered rules and the confidence of each, in percentage and fraction. Selecting
any rule will update the map with the corresponding colour: dark blue for the wells that
match the if and then parts of the expression; light blue for the ones that match the if
part but not the then; and black for the ones that do not match any part of the rule.
Page 43
Chapter 3 – Oil Well Explorer
Rodrigo Augusto de Oliveira e Silva 29
Figure 18. ARM applied to the wells data.
Clicking on one of the pins located in the table will highlight the wells with the same
colour, while the others will have their opacity reduced. This behaviour also occurs in
the legends of the methods mentioned before and can be seen in Figure 19.
Figure 19. Emphasize the wells that match both parts of the ARM expression.
Page 44
Chapter 3 – Oil Well Explorer
Rodrigo Augusto de Oliveira e Silva 30
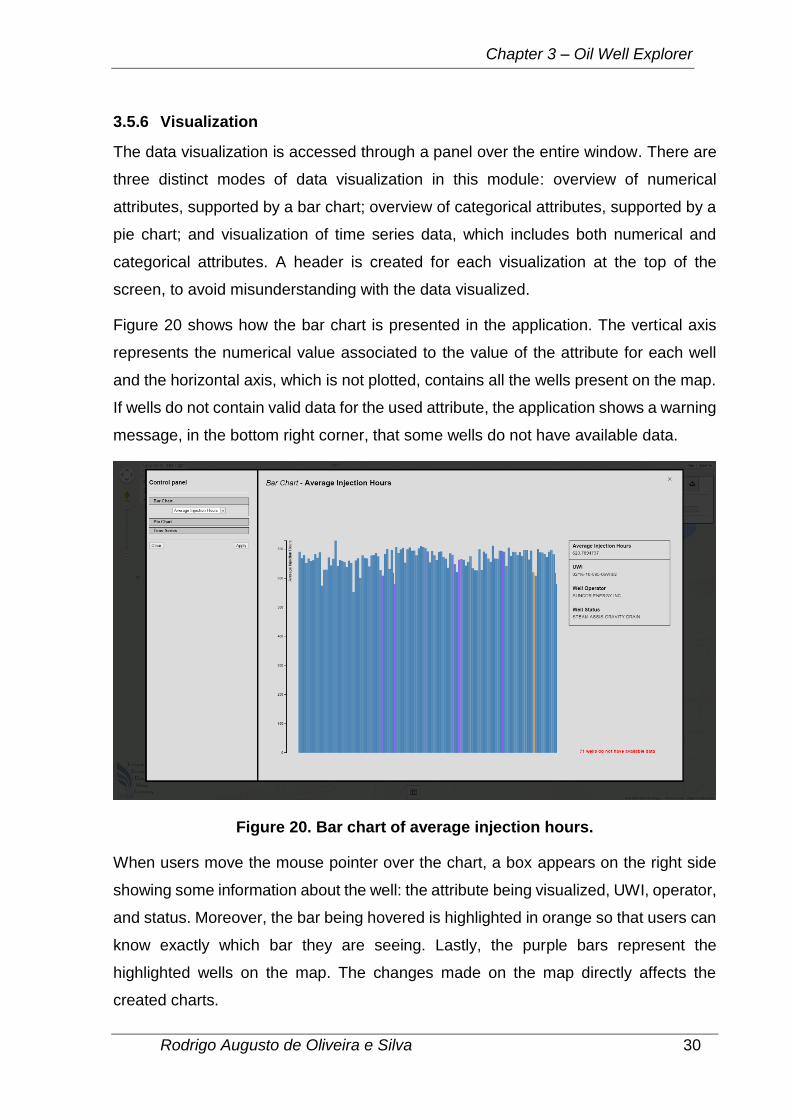
3.5.6 Visualization
The data visualization is accessed through a panel over the entire window. There are
three distinct modes of data visualization in this module: overview of numerical
attributes, supported by a bar chart; overview of categorical attributes, supported by a
pie chart; and visualization of time series data, which includes both numerical and
categorical attributes. A header is created for each visualization at the top of the
screen, to avoid misunderstanding with the data visualized.
Figure 20 shows how the bar chart is presented in the application. The vertical axis
represents the numerical value associated to the value of the attribute for each well
and the horizontal axis, which is not plotted, contains all the wells present on the map.
If wells do not contain valid data for the used attribute, the application shows a warning
message, in the bottom right corner, that some wells do not have available data.
Figure 20. Bar chart of average injection hours.
When users move the mouse pointer over the chart, a box appears on the right side
showing some information about the well: the attribute being visualized, UWI, operator,
and status. Moreover, the bar being hovered is highlighted in orange so that users can
know exactly which bar they are seeing. Lastly, the purple bars represent the
highlighted wells on the map. The changes made on the map directly affects the
created charts.
Page 45
Chapter 3 – Oil Well Explorer
Rodrigo Augusto de Oliveira e Silva 31
The pie chart works similarly to the bar chart, considering only the data of the wells
present on the map. In this case, categorical data is displayed and the users cannot
see which wells fall into which category. As seen in Figure 21, the pie chart is displayed
with a legend by its right side, making clear which category is being represented by
which colour. The legend contains the name of the category, the number of wells that
fall in the category, and the percentage that it represents among all of them.
Figure 21. Pie chart of well current status.
The third and last part of the visualization deals with time series data. For now, it is
possible to analyze only one well at a time. There are data visualizations of injection,
production, steam-oil ratio (SOR), and status. The latter consists of categorical data,
and its visualization can be seen in the following figure.
Page 46
Chapter 3 – Oil Well Explorer
Rodrigo Augusto de Oliveira e Silva 32
Figure 22. Well status timeline of a well.
Moreover, if the bar is hovered by the mouse pointer, the corresponding legend is
highlighted and a small box appears on the right side, displaying the period duration
with the initial and end dates. This behaviour can be seen in Figure 23.
Figure 23. Highlighting the drilled and cased status period in well status
timeline.
Page 47
Chapter 3 – Oil Well Explorer
Rodrigo Augusto de Oliveira e Silva 33
The injection, production, and SOR share the same interface and controls, only varying
the data displayed. This visualization allows users to adapt it according to their needs,
selecting single or multiple attributes to be displayed, changing interpolation
parameters, and changing the type of the chart. The attributes are plotted in the same
chart but are not in the same unit, so users must select the ones that they want to
compare and analyze.
The injection shows the amount of gas, steam, and water injected, in addition to the
pressure inside the well and the number of hours spent in the process. It can be seen
in Figure 24.
Figure 24. Visualization of injection time series data.
Similarly, the visualization of production data can be seen in Figure 25. On the other
hand, it contains far more attributes, making users select the ones they have interest
in.
Page 48
Chapter 3 – Oil Well Explorer
Rodrigo Augusto de Oliveira e Silva 34
Figure 25. Visualization of production time series data.
Lastly, the visualization of SOR contains the summary of what is essential to analyze
a well performance: injected steam, oil produced, SOR, and cumulative steam-oil ratio
(CSOR). To calculate the SOR and CSOR a well pair is needed, one injector and one
producer. Therefore, the visualization cannot be built if there are no data from both
wells. The following figure illustrates the SOR data visualization, showing the SOR and
CSOR while hiding the steam and oil values.
Page 49
Chapter 3 – Oil Well Explorer
Rodrigo Augusto de Oliveira e Silva 35
Figure 26. Visualization of SOR time series data.
As mentioned before, users have the possibility to change the chart type in order to
see the data in another perspective. They can choose among line, as presented in
Figure 26, area, bar, and scatter, seen in Figure 27, Figure 28, and Figure 29
respectively.
Figure 27. Visualization of SOR time series data with area chart.
Page 50
Chapter 3 – Oil Well Explorer
Rodrigo Augusto de Oliveira e Silva 36
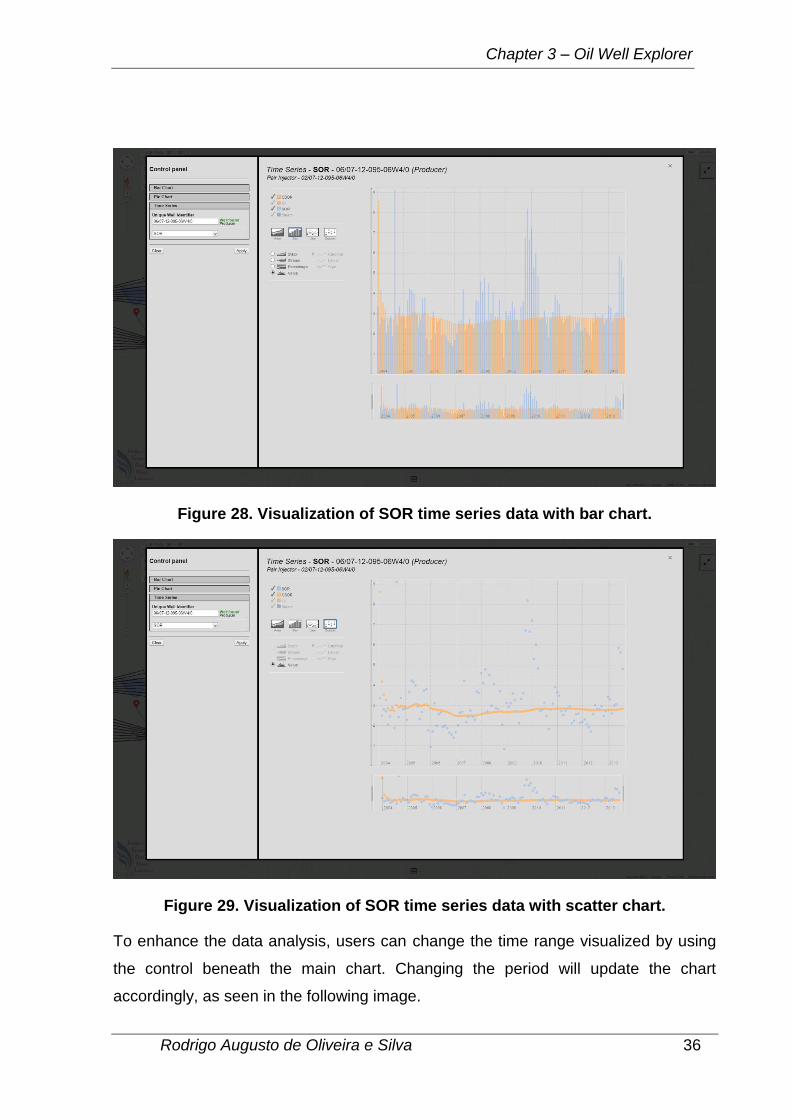
Figure 28. Visualization of SOR time series data with bar chart.
Figure 29. Visualization of SOR time series data with scatter chart.
To enhance the data analysis, users can change the time range visualized by using
the control beneath the main chart. Changing the period will update the chart
accordingly, as seen in the following image.
Page 51
Chapter 3 – Oil Well Explorer
Rodrigo Augusto de Oliveira e Silva 37
Figure 30. Visualization of SOR time series data of a smaller period of time.
3.5.7 Export
The export function allows users to save a Comma-Separated Values (CSV) file to
their local contents. The grouped data will only contain records of the wells that are
present in the map so that the wells data can be intuitively selected by using other
functionalities. Time series data of the wells are not included, since they are private
and extremely important for the well analysis and decision making.
3.6 Discussion
After finishing the development, the application was presented to several people from
academia and industry of diverse areas, including Computer Science, Software
Engineering, and Geomatics Engineering. It was generally well received and it
generated discussion about improvements and possible future works.
The presentation towards academia had the presence of doctors, masters, and
bachelors in university, who were mainly looking for research opportunities. People
from three areas showed interest in the application: information visualization,
discussing about various different ways the information could also be displayed to
users; human computer interaction, exploring the possibility of using a multi-display
Page 52
Chapter 3 – Oil Well Explorer
Rodrigo Augusto de Oliveira e Silva 38
collaborative environment with multiple people interacting with the application at the
same time; and geospatial data mining, discussing about the usage of techniques to
predict oil production based on the properties of wells.
The application was also presented to three directors of a Canadian gas and oil
company, who were looking for new ideas to improve their software and to create new
ones. They exposed interest, mainly due to the data visualization and data mining
capabilities applied in a web application, giving feedback with a commercial
perspective of features to add and next steps to take. They also considered the
possibility of a partnership with university, working together with students to help both
parts with the development of new systems.
Page 53
Chapter 4 – Conclusion and Future Work
Rodrigo Augusto de Oliveira e Silva 39
Chapter 4:
Conclusion and Future Work
This last chapter is intended to the final considerations of this work, discussing
about what was achieved, what can be improved and incorporated in the future.
4.1 Conclusion
The amount of data accumulated by the oil extraction companies is huge and it keeps
increasing every day. These companies need to use software to help the experts
process and analyze the stored data. In Canada, the software used in gas and oil
companies do not always provide techniques to assist experts in finding patterns
hidden in the data.
This work had the main objective of developing a web based application to display and
explore data collected in the SAGD oil extraction process. A dataset of one SAGD
project in the province of Alberta was collected, archived, processed, and successfully
utilized in the application. By using free components provided by third parties it was
possible to build a WebGIS with basic features similar to commercial software currently
in the market. Furthermore, it was shown that information visualization and data mining
techniques can support people to understand a great amount of data, to perceive
hidden patterns in it, and to investigate the spatial distribution of the patterns.
Is it hoped that this work promotes, in the future, the creation of systems and
applications based on the web for domains that depend on the use of GISs, not
exclusively related to gas and oil.
4.2 Future Work
Various improvements and ideas of new features to add were discussed during the
development of this work. Some of them are the following:
1. To include more SAGD projects from other gas and oil companies in the
application from different parts of Canada or even from other countries. With
Page 54
Chapter 4 – Conclusion and Future Work
Rodrigo Augusto de Oliveira e Silva 40
more data the application would have to be adapted based on some big data
concepts, maybe even using a non-relational database to accelerate the data
retrieval due to the data relationship complexity;
2. To add different levels of authentication, in which general users and
administrators have access to different information and features;
3. To include new types of interactive visualizations, as well as the visualization
of multiple wells, easing comparison of and analysis of related wells;
4. To implement ARM and add other techniques towards data prediction and
optimization, such as artificial neural network, fuzzy logic, and evolutionary
computation.
5. To perform a better requirements elicitation as well as evaluating the
application using qualitative methods, such as surveys and interviews, in order
to identify features that require further improvement.
Page 55
References
Rodrigo Augusto de Oliveira e Silva 41
References
About PostgreSQL. (2014, May 13). Retrieved from PostgreSQL:
http://www.postgresql.org/about/
Berry, M. J., & Linoff, G. S. (2004). Data Mining Techniques: for marketing, sales,
and customer relationship management. United States of America: Wiley
Publishing.
Butler, R. (1998, July). SAGD Comes of AGE! Journal of Canadian Petroleum
Technology, 37(07), 9-12.
Card, S. K., Mackinlay, J., & Shneiderman, B. (1999). Readings in Information
Visualization: Using Vision to Think. San Diego, United States of America:
Morgan Kaufmann.
Carpendale, M. S. (2003). Considering Visual Variables as a Basis for Representing
Information. University of Calgary, Department of Computer Science. Calgary:
Computer Science TR# 2001-693.
Data Classification. (2014, June 18). Retrieved from National Center for Geographic
Information and Analysis:
http://www.ncgia.ucsb.edu/cctp/units/unit47/html/comp_class.html
Evans, F., Volz, W., Dorn, G., Fröhlich, B., & Roberts, D. M. (2002). Future trends in
oil and gas visualization. IEEE Visualization (pp. 567-570). Washington DC:
IEEE Computer Society.
Fayyad, U., Grinstein, G., & Wierse, A. (2001). Information Visualization in Data
Mining and Knowledge Discovery. San Francisco, United States of America:
Morgan Kaufmann.
Freyman, W. A., & Glennemeier, K. A. (2014). Restoration Map: A Web-based Tool
for Spatial and Participatory Adaptive Management of Ecological Restoration
Projects. Ecological Restoration, 32(1), 3-6.
GeoCarta GIS for All. (2014, September 29). Retrieved from Divestco:
http://www.divestco.com/getdoc/57469f91-64dc-4e11-aa2b-
e454b26c99b9/2012-12-GeoCarta.aspx
Page 56
References
Rodrigo Augusto de Oliveira e Silva 42
GIS (geographic information system). (2014, October 14). Retrieved from National
Geographic:
http://education.nationalgeographic.com/education/encyclopedia/geographic-
information-system-gis/?ar_a=1
Google Maps Embed API. (2014, May 4). Retrieved from Google Developers:
https://developers.google.com/maps/documentation/embed/guide
Han, J., & Kamber, M. (2006). Data Mining Concepts and Techniques. San
Francisco, United States of America: Morgan Kaufmann.
Holdaway, K. R. (2014). Harness Oil and Gas Big Data with Analytics: Optimize
Exploration and Production with Data-Driven Models. Hoboken, New Jersey,
United States of America: John Wiley & Sons.
How steam-assisted gravity drainage (SAGD) works. (2014, August 05). Retrieved
from Cenovus Energy Website:
http://www.cenovus.com/operations/technology/sagd.html
In Situ Performance Presentations. (2014, October 16). Retrieved from Alberta
Energy Regulator Web site: http://www.aer.ca/data-and-publications/activity-
and-data/in-situ-performance-presentations
Jain, A. K., & Dubes, R. C. (1988). Algorithms for Clustering Data. Englewood Cliffs:
Prentice-Hall.
JavaScript. (2014, May 20). Retrieved from Wikipedia: The Free Encyclopedia:
http://en.wikipedia.org/wiki/JavaScript
Kiessling, M. (2012). The Node Beginner Book: A comprehensive Node.js tutorial.
lulu.com.
Leff, A., & Rayfield, J. T. (2001). Web-application development using the
Model/View/Controller design pattern. Enterprise Distributed Object
Computing Conference (pp. 118-127). Seattle: IEEE.
Lienert, C., Weingartner, R., & Hurni, L. (2011). An interactive, web-based, real-time
hydrological map information system. Hydrolocial Sciences Journal, 56(1), 1-
16.
Page 57
References
Rodrigo Augusto de Oliveira e Silva 43
Longley, P. A., Goodchild, M. F., Maguire, D. J., & Rhind, D. W. (2005). Geographic
Information Systems and Science (2nd ed.). Chichester, England: John Wiley
& Sons Ltd.
Murray, S. (2013). Interactive Data Visualization for the Web. Sebastopol, United
States of America: O'Reilly Media.
Parmar, G., Zhao, L., & Graham, J. (2009). Start-up of SAGD Wells: History Match,
Wellbore Design and Operation. Journal of Canadian Petroleum Technology,
48(01), 42-48.
Sharma, A., Srinivasan, S., & Lake, L. W. (2010). Classification of Oil and Gas
Reservoirs Based on Recovery Factor: A Data-Mining Approach. SPE Annual
Technical Conference and Exhibition. Florence: Society of Petroleum
Engineers.
Steam-assisted gravity drainage (SAGD). (2014, September 22). Retrieved from
Cenovus Energy Web site:
http://www.cenovus.com/operations/technology/sagd.html
Unconventional Technology & Innovation - SAGD. (2014, August 10). Retrieved from
ConocoPhillips Website: http://www.conocophillips.ca/technology-and-
innovation/unconventional/Pages/sagd.aspx
Zangl, G., & Hannerer, J. (2003). Data Mining: Applications in the Petroleum Industry.
Round Oak Publishing.
Zhu, L., & Zeng, F. (2014). A Condensation Heating Model for Evaluating Early-
Period SAGD Performance. Transport in Porous Media, 104(2), 363-383.