Page 1
1
BLOOM ENERGY INITIATIONJuly 13, 2021
OILFIELD SERVICES & GREEN ENERGY
Vaibhav (Vebs) Vaishnav | Analyst
Coker Palmer Institutional
713-344-0852 (O) / 281-546-0315 (M)
[email protected]
BLOOM ENERGY CORP.
A Bird In Hand Is Worth Two In The Bush; Initiate At Sector Outperform; $24 PT
Quick Take: We are initiating on BE at Sector Outperform as (1) the company’s
growth is driven by products and markets where the company already has a strong
track record; (2) our preference for stationary power over on-road mobility
applications and (3) decent valuation. Our price target is $24, ~5% above current
levels.
Thesis
We are initiating on Bloom Energy (BE) at Sector Outperform and PT of $24, ~5%
above current levels.
▪ BE’s growth is driven by products and markets where the company already has a
strong track record including expansion in 1) the U.S. market from lower cost, 2)
Korean market driven by country’s hydrogen policy and 3) in marine products
based on existing agreement with Samsung Heavy Industries. Any green
hydrogen market revenues ($750M by 2025 as per BE) would provide upside to
our estimates, however such upside estimates are already accounted for in our
current financial estimates for peers.
▪ We prefer stationary power applications over on-road mobility applications for
hydrogen. They have track record, can use grey, blue as well as green hydrogen,
do not need extensive infrastructure like hydrogen refueling station and are closer
to being competitive even at current costs. BE fits the bill.
▪ Our BE price target is ~$24 implying ~5% upside. Essentially, we do not have to
give credit for a new product that has not been built yet or tested and a market
where the company has never sold much. And still our valuation implies ~5%
upside to stock price vs. downside for peers.
Risks to Thesis
▪ BE could end up being capacity constrained if a facility in addition to a 200 MW
facility currently under construction is not announced soon.
▪ We are giving credit to company for selling products internationally and in the
marine product without a strong track record.
Key Catalysts
▪ Potentially a combined heat & power (CHP) contract in South Korea.
▪ A commercial carbon capture product sale and a large biogas commercial win.
Valuation
Our BE price target is ~$24 implying ~5% upside. Our PT is based on DCF through
2040. We model explicitly through 2030, then 10% revenue growth through 2040.
We model 8.0% WACC assuming 6.0% market premium and 2.0% risk-free rate.
We also model 2.0% perpetuity growth. A 10% WACC implies ~$16 PT.
How Are We Differentiated
▪ Detailed Korean stationary power market demand analysis and market share.
▪ Detailed end-market revenues and units sold analysis.
▪ DCF methodology for valuation vs. arbitrary EV/EBITDA or EV/Sales multiples.
Sector Initiation Reports
▪ Hydrogen Sector
▪ Bloom Energy
▪ Ballard Power
▪ Chart Industries
▪ FuelCell Energy
▪ Plug Power
Page 2
2
BLOOM ENERGY INITIATIONJuly 13, 2021
Table Of Contents
▪ Investment Thesis 3
▪ Risks To Thesis 10
▪ Financial Assumptions & Model 12
▪ Company Background 19
▪ Company History 27
▪ Executives Officers & Directors 28
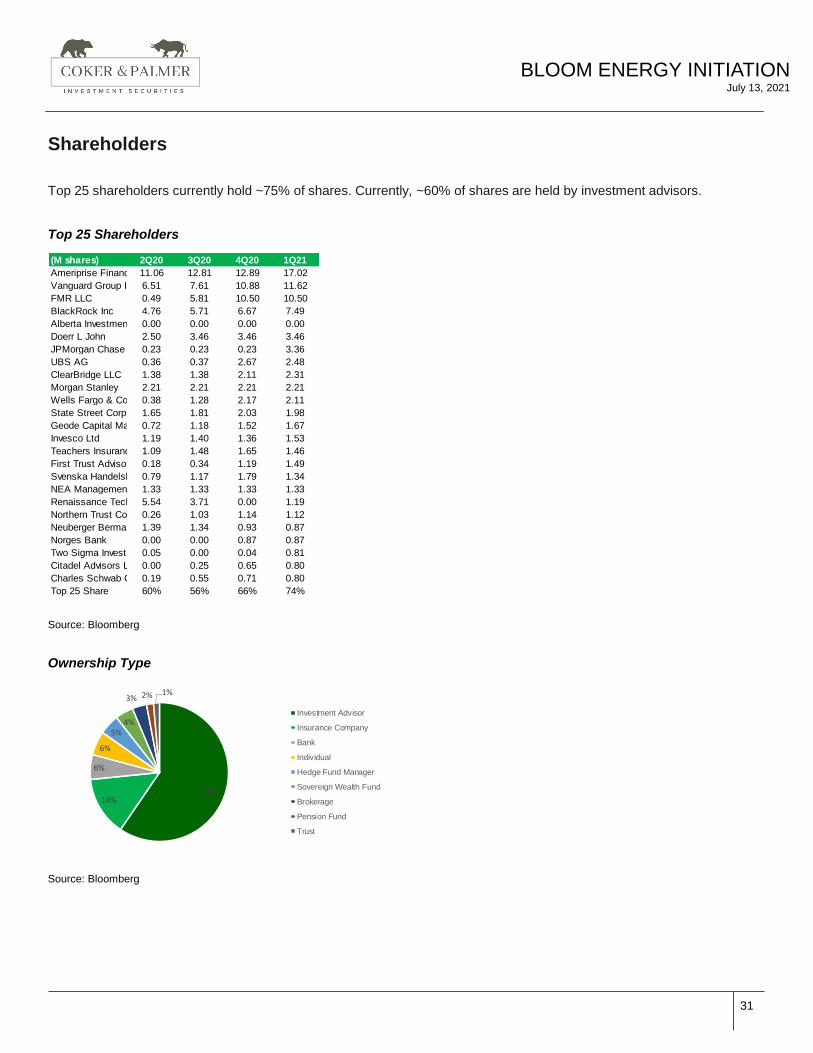
▪ Shareholders 31
Page 3
3
BLOOM ENERGY INITIATIONJuly 13, 2021
Investment Thesis
Bloom Energy, Inc. (BE), was incorporated in Delaware on Jan. 18, 2001, as Ion America Corp. and later renamed in
2006. Bloom Energy manufactures solid oxide fuel-cell based power generation platform called Bloom Energy Servers
that provide clean and resilient power to businesses, essential services, and critical infrastructure. Bloom Energy
Servers produce nearly 50% less carbon emission vs. average U.S. combustion power generation. BE is in process of
expanding to all 50 states in the U.S. from currently 10 as the declining cost of electricity produced by Energy Server
makes it more competitive. Korean hydrogen policy too should drive growth where BE has ~35% market share. The
company is also in process of commercialization and expansion of five new products (1) carbon capture that can be
added to Bloom Server for sequestering carbon for further uses, (2) biogas driven Energy Servers, (2) Energy Servers
powered by renewable or green hydrogen fuel, (4) electrolyzers that produce renewable hydrogen and (5) marine
product.
We rate Bloom Energy (BE) at Sector Outperform with PT of $24, ~5% above current levels. We like BE as (1) the
company’s growth is driven by products and markets where the company already has a strong track record; (2) our
preference for stationary power over on-road mobility applications and (3) decent valuations. Our PT is based on DCF
through 2040. We model explicitly through 2030, then 10% revenue growth through 2040. We model 8.0% WACC
assuming 6.0% market premium and 2.0% risk-free rate. We also model 2.0% perpetuity growth. A 10% WACC implies
~$16 PT.
As compared to other “pure” hydrogen companies, BE is a simple story based on products and markets where the
company already has a strong track record. BE has sold Bloom Energy Server for past 10+ years and expansion in 1)
the U.S. market from lower cost, 2) Korean market driven by country’s hydrogen policy and 3) in marine products based
on existing agreement with Samsung Heavy Industries drives revenues and profitability growth. We do not have to rely
on aggressive assumptions such as providing credit for a product that has not been tested yet, assume a market share
where the company does not have any track record or assume a significant expansion in margins to arrive at valuation
near or above stock price. BE is entering the green hydrogen market where the company expects $750M revenues by
2025. But, we are not giving BE any credit in our financial model for green hydrogen, carbon capture product and Baker
Hughes (BKR, Top Pick) agreement as we do not feel comfortable making aggressive assumptions that we have to
make for Ballard Power (BLDP), FuelCell (FCEL) and Plug Power (PLUG). Our lack of credit is not because we have
any doubts in BE’s capability as the company already has booked orders for electrolyzers and hydrogen power fuel
cells in Korea. Any green hydrogen market revenues would provide upside to our estimates, however such estimates
are already accounted for in our current financial estimates for BLDP, FCEL and PLUG.
A Bird In Hand Is Worth Two In The Bush
We prefer companies with an established track record “a bird in the hand is worth two in the bush”. BE fits the bill as its
growth is driven by Bloom Energy Server where the company has strong track record. It starts to become difficult for
our comfort level to provide credit to companies that do not have a commercial product or a prototype yet and then
assume they will have a successful product and gain some market share and economic margins where they do not
have any/long track record.
BE manufactures Energy Servers that convert natural gas and/or biogas into power for stationary purposes. The
company has a strong track record with installed base of ~570 MW globally, including ~200 MW in Korea. Their
products do not have the risk of “if and when green hydrogen economics work”. Their current products already reduce
carbon emissions by ~50% compared to traditional power generation. Additionally, the company is in process of
commercializing carbon capture add-on that could remove CO2 from the process to be used for storage or other
applications, i.e., power generation can be completely decarbonized. Lastly, the company also has product that can use
green hydrogen to produce power.
The company has earned $700-900M in revenues each year in 2018-20 and expected to generate close to $1B in 2021
vs. PLUG generating $185-335M and BLDP about $100M in 2018-20. However, it compares unfavorably to Chart
Industries (GTLS) that earned $1.2B in revenues and $135M FCF in 2020. But, at the least this implies BE is closer to
gaining scale where margins can begin to improve.
Most importantly to us is the fact that while forecasting financial BE, revenues predominantly are being generated from
products and markets where the company has a strong track record, i.e., in the U.S and Korea selling Bloom Energy
Server. We do not have to give credit for a new product that has not been built yet or tested and a market where the
Page 4
4
BLOOM ENERGY INITIATIONJuly 13, 2021
company has never sold much. And still our valuation implies ~5% upside to stock price vs. downside for peers.
Admittedly, we are giving credit to a new marine product. We model one vessel in 2024 and increasing to five (~250
MW) by 2025. It implies ~10% revenue share by 2024. However, we think there is more credibility around marine
product for BE given they have an agreement in place where the customer is ratifying the potential revenue opportunity.
On June 29, 2020, Samsung Heavy Industries, one of the largest ship builder, and BE signed a joint development
agreement to design and develop fuel cell powered ships. Samsung’s goal is to replace all existing main engines and
generator engines with solid oxide fuel cells to align with the International Maritime Organization’s 2030 and 2050
environmental targets. Following commercialization, the two companies anticipate that the market for Bloom Energy
Servers on SHI ships could grow to 300 MW annually.
We are also giving credit to company for selling products internationally, outside Korea given the company has hired a
team of ~10 senior people in April 2021 focusing on Australia, European countries such as UK, German, France, Italy,
Spain and Portugal, Southeast Asia including Thailand, Singapore and Malaysia, the Middle East and North Africa.
However, such revenues amount to ~5% of total revenues in 2024.
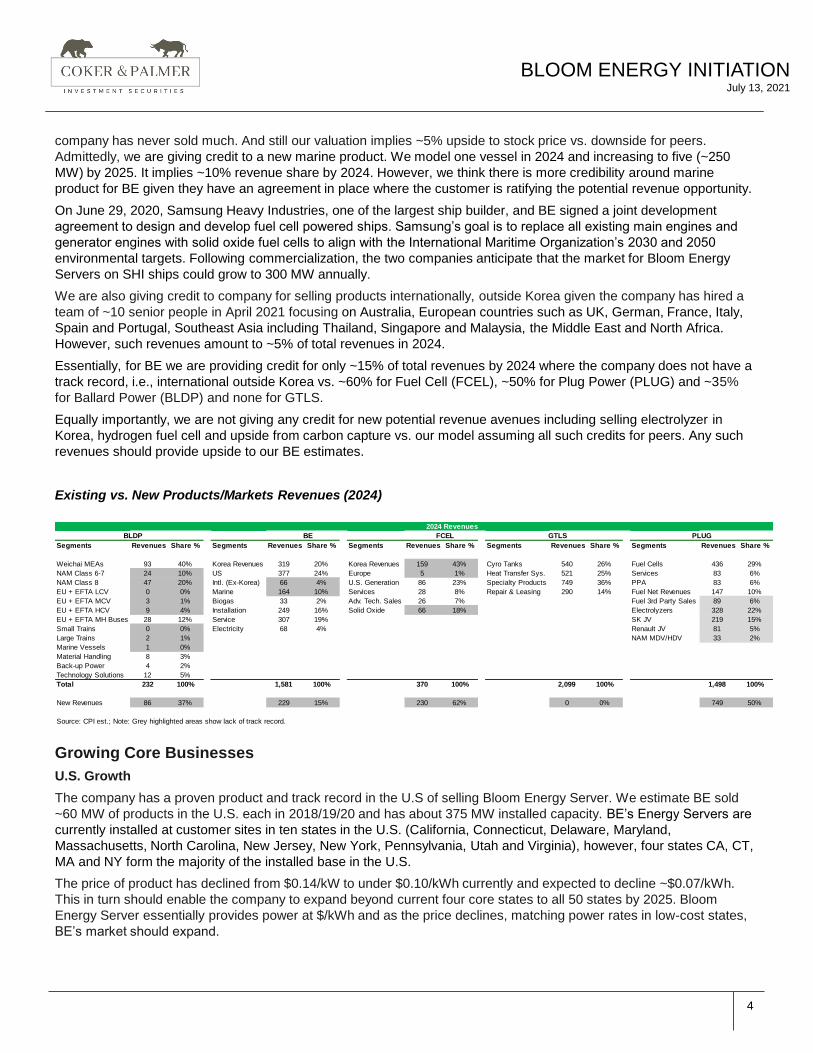
Essentially, for BE we are providing credit for only ~15% of total revenues by 2024 where the company does not have a
track record, i.e., international outside Korea vs. ~60% for Fuel Cell (FCEL), ~50% for Plug Power (PLUG) and ~35%
for Ballard Power (BLDP) and none for GTLS.
Equally importantly, we are not giving any credit for new potential revenue avenues including selling electrolyzer in
Korea, hydrogen fuel cell and upside from carbon capture vs. our model assuming all such credits for peers. Any such
revenues should provide upside to our BE estimates.
Existing vs. New Products/Markets Revenues (2024)
Growing Core Businesses
U.S. Growth
The company has a proven product and track record in the U.S of selling Bloom Energy Server. We estimate BE sold
~60 MW of products in the U.S. each in 2018/19/20 and has about 375 MW installed capacity. BE’s Energy Servers are
currently installed at customer sites in ten states in the U.S. (California, Connecticut, Delaware, Maryland,
Massachusetts, North Carolina, New Jersey, New York, Pennsylvania, Utah and Virginia), however, four states CA, CT,
MA and NY form the majority of the installed base in the U.S.
The price of product has declined from $0.14/kW to under $0.10/kWh currently and expected to decline ~$0.07/kWh.
This in turn should enable the company to expand beyond current four core states to all 50 states by 2025. Bloom
Energy Server essentially provides power at $/kWh and as the price declines, matching power rates in low-cost states,
BE’s market should expand.
2024 Revenues
BLDP BE FCEL GTLS PLUG
Segments Revenues Share % Segments Revenues Share % Segments Revenues Share % Segments Revenues Share % Segments Revenues Share %
Weichai MEAs 93 40% Korea Revenues 319 20% Korea Revenues 159 43% Cyro Tanks 540 26% Fuel Cells 436 29%
NAM Class 6-7 24 10% US 377 24% Europe 5 1% Heat Transfer Sys. 521 25% Services 83 6%
NAM Class 8 47 20% Intl. (Ex-Korea) 66 4% U.S. Generation 86 23% Specialty Products 749 36% PPA 83 6%
EU + EFTA LCV 0 0% Marine 164 10% Services 28 8% Repair & Leasing 290 14% Fuel Net Revenues 147 10%
EU + EFTA MCV 3 1% Biogas 33 2% Adv. Tech. Sales 26 7% Fuel 3rd Party Sales 89 6%
EU + EFTA HCV 9 4% Installation 249 16% Solid Oxide 66 18% Electrolyzers 328 22%
EU + EFTA MH Buses 28 12% Service 307 19% SK JV 219 15%
Small Trains 0 0% Electricity 68 4% Renault JV 81 5%
Large Trains 2 1% NAM MDV/HDV 33 2%
Marine Vessels 1 0%
Material Handling 8 3%
Back-up Power 4 2%
Technology Solutions 12 5%
Total 232 100% 1,581 100% 370 100% 2,099 100% 1,498 100%
New Revenues 86 37% 229 15% 230 62% 0 0% 749 50%
Source: CPI est.; Note: Grey highlighted areas show lack of track record.
Page 5
5
BLOOM ENERGY INITIATIONJuly 13, 2021
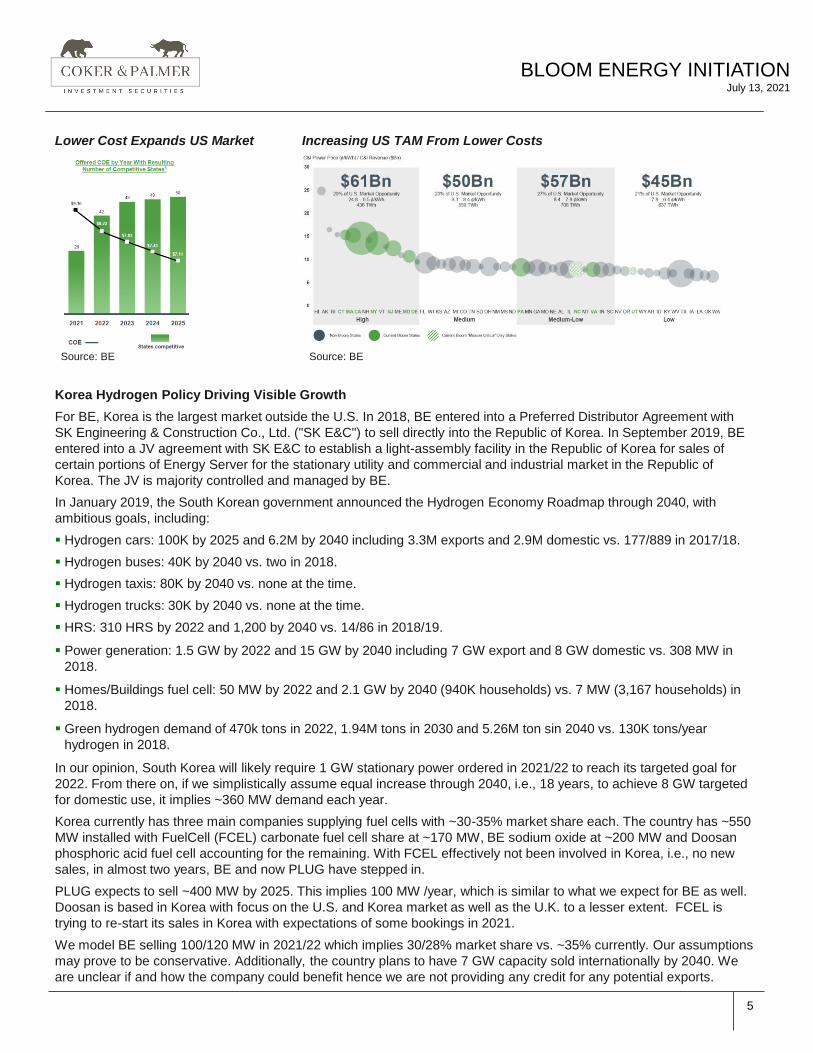
Lower Cost Expands US Market Increasing US TAM From Lower Costs
Source: BE Source: BE
Korea Hydrogen Policy Driving Visible Growth
For BE, Korea is the largest market outside the U.S. In 2018, BE entered into a Preferred Distributor Agreement with
SK Engineering & Construction Co., Ltd. ("SK E&C") to sell directly into the Republic of Korea. In September 2019, BE
entered into a JV agreement with SK E&C to establish a light-assembly facility in the Republic of Korea for sales of
certain portions of Energy Server for the stationary utility and commercial and industrial market in the Republic of
Korea. The JV is majority controlled and managed by BE.
In January 2019, the South Korean government announced the Hydrogen Economy Roadmap through 2040, with
ambitious goals, including:
▪ Hydrogen cars: 100K by 2025 and 6.2M by 2040 including 3.3M exports and 2.9M domestic vs. 177/889 in 2017/18.
▪ Hydrogen buses: 40K by 2040 vs. two in 2018.
▪ Hydrogen taxis: 80K by 2040 vs. none at the time.
▪ Hydrogen trucks: 30K by 2040 vs. none at the time.
▪ HRS: 310 HRS by 2022 and 1,200 by 2040 vs. 14/86 in 2018/19.
▪ Power generation: 1.5 GW by 2022 and 15 GW by 2040 including 7 GW export and 8 GW domestic vs. 308 MW in
2018.
▪ Homes/Buildings fuel cell: 50 MW by 2022 and 2.1 GW by 2040 (940K households) vs. 7 MW (3,167 households) in
2018.
▪ Green hydrogen demand of 470k tons in 2022, 1.94M tons in 2030 and 5.26M ton sin 2040 vs. 130K tons/year
hydrogen in 2018.
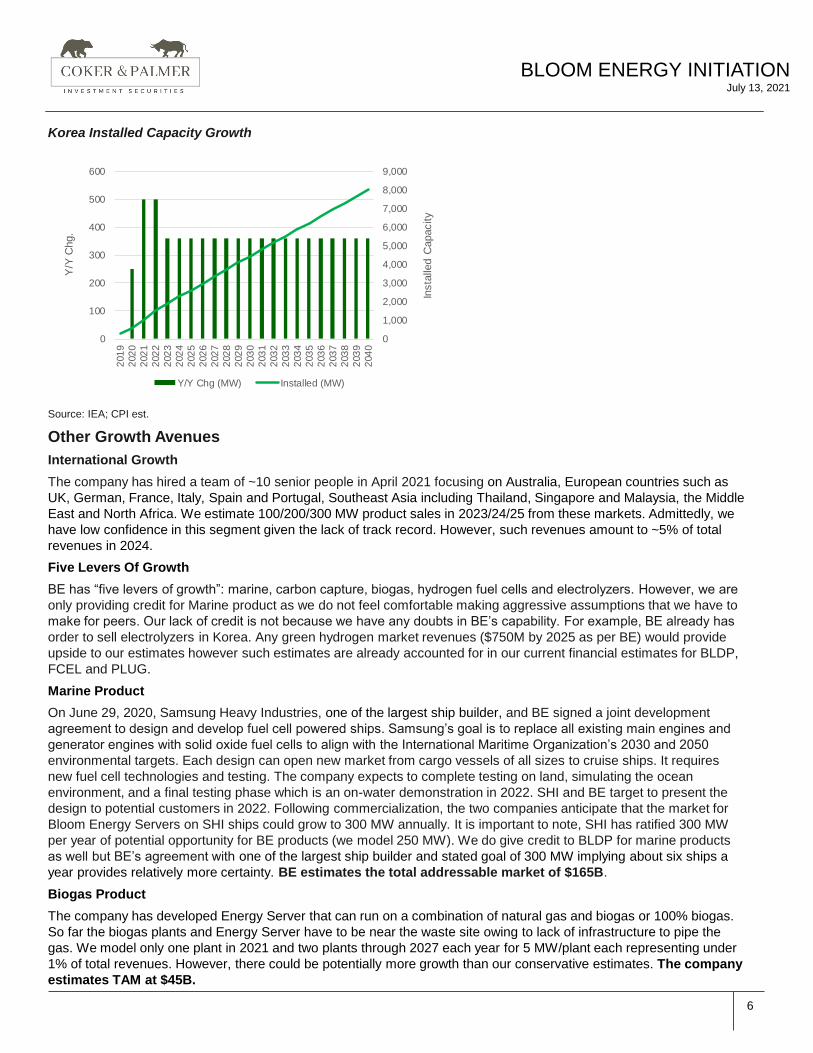
In our opinion, South Korea will likely require 1 GW stationary power ordered in 2021/22 to reach its targeted goal for
2022. From there on, if we simplistically assume equal increase through 2040, i.e., 18 years, to achieve 8 GW targeted
for domestic use, it implies ~360 MW demand each year.
Korea currently has three main companies supplying fuel cells with ~30-35% market share each. The country has ~550
MW installed with FuelCell (FCEL) carbonate fuel cell share at ~170 MW, BE sodium oxide at ~200 MW and Doosan
phosphoric acid fuel cell accounting for the remaining. With FCEL effectively not been involved in Korea, i.e., no new
sales, in almost two years, BE and now PLUG have stepped in.
PLUG expects to sell ~400 MW by 2025. This implies 100 MW /year, which is similar to what we expect for BE as well.
Doosan is based in Korea with focus on the U.S. and Korea market as well as the U.K. to a lesser extent. FCEL is
trying to re-start its sales in Korea with expectations of some bookings in 2021.
We model BE selling 100/120 MW in 2021/22 which implies 30/28% market share vs. ~35% currently. Our assumptions
may prove to be conservative. Additionally, the country plans to have 7 GW capacity sold internationally by 2040. We
are unclear if and how the company could benefit hence we are not providing any credit for any potential exports.
Page 6
6
BLOOM ENERGY INITIATIONJuly 13, 2021
Korea Installed Capacity Growth
Source: IEA; CPI est.
Other Growth Avenues
International Growth
The company has hired a team of ~10 senior people in April 2021 focusing on Australia, European countries such as
UK, German, France, Italy, Spain and Portugal, Southeast Asia including Thailand, Singapore and Malaysia, the Middle
East and North Africa. We estimate 100/200/300 MW product sales in 2023/24/25 from these markets. Admittedly, we
have low confidence in this segment given the lack of track record. However, such revenues amount to ~5% of total
revenues in 2024.
Five Levers Of Growth
BE has “five levers of growth”: marine, carbon capture, biogas, hydrogen fuel cells and electrolyzers. However, we are
only providing credit for Marine product as we do not feel comfortable making aggressive assumptions that we have to
make for peers. Our lack of credit is not because we have any doubts in BE’s capability. For example, BE already has
order to sell electrolyzers in Korea. Any green hydrogen market revenues ($750M by 2025 as per BE) would provide
upside to our estimates however such estimates are already accounted for in our current financial estimates for BLDP,
FCEL and PLUG.
Marine Product
On June 29, 2020, Samsung Heavy Industries, one of the largest ship builder, and BE signed a joint development
agreement to design and develop fuel cell powered ships. Samsung’s goal is to replace all existing main engines and
generator engines with solid oxide fuel cells to align with the International Maritime Organization’s 2030 and 2050
environmental targets. Each design can open new market from cargo vessels of all sizes to cruise ships. It requires
new fuel cell technologies and testing. The company expects to complete testing on land, simulating the ocean
environment, and a final testing phase which is an on-water demonstration in 2022. SHI and BE target to present the
design to potential customers in 2022. Following commercialization, the two companies anticipate that the market for
Bloom Energy Servers on SHI ships could grow to 300 MW annually. It is important to note, SHI has ratified 300 MW
per year of potential opportunity for BE products (we model 250 MW). We do give credit to BLDP for marine products
as well but BE’s agreement with one of the largest ship builder and stated goal of 300 MW implying about six ships a
year provides relatively more certainty. BE estimates the total addressable market of $165B.
Biogas Product
The company has developed Energy Server that can run on a combination of natural gas and biogas or 100% biogas.
So far the biogas plants and Energy Server have to be near the waste site owing to lack of infrastructure to pipe the
gas. We model only one plant in 2021 and two plants through 2027 each year for 5 MW/plant each representing under
1% of total revenues. However, there could be potentially more growth than our conservative estimates. The company
estimates TAM at $45B.
0
1,000
2,000
3,000
4,000
5,000
6,000
7,000
8,000
9,000
0
100
200
300
400
500
600
201
9
202
0
202
1
202
2
202
3
202
4
202
5
202
6
202
7
202
8
202
9
203
0
203
1
203
2
203
3
203
4
203
5
203
6
203
7
203
8
203
9
204
0
Insta
lled C
apacity
Y/Y
Chg.
Y/Y Chg (MW) Installed (MW)
Page 7
7
BLOOM ENERGY INITIATIONJuly 13, 2021
Biogas captured from cow manure contains approximately 65% methane, which has a 25x greater impact on global
warming than CO2 emissions and accounts for 10% of U.S. greenhouse gas emissions. There is an estimated 320 MW
of economically viable dairy biogas in California. Both small and large dairies deploying the new CalBio-Bloom Energy
biogas solution will be eligible to apply for Department of Food and Agriculture (CDFA) grants.
As per American Biogas Council, the U.S. has over 2,200 sites producing biogas in all 50 states: 250 anaerobic
digesters on farms, 1,269 water resource recovery facilities using an anaerobic digester (~860 currently use the biogas
they produce), 66 stand-alone systems that digest food waste, and 652 landfill gas projects. For comparison, Europe
has over 10,000 operating digesters and some communities are essentially fossil fuel free because of them.
The American Biogas Council counts 14,958 new sites ripe for development today: 8,574 dairy, poultry, and swine
farms and 3,878 water resource recovery facilities (including ~380 who are making biogas but not using it) that could
support new biogas systems, plus 2,036 food scrap-only systems and utilizing the gas at 415 landfills who are flaring
their gas. If fully realized, according to an assessment conducted with the USDA, EPA and DOE as part of the Federal
Biogas Opportunities Roadmap, plus data from ABC, these new biogas systems could produce 103 trillion kilowatt
hours of electricity each year and reduce the emissions equivalent of removing 117 million passenger vehicles from the
road. Bottomline, there is strong potential growth from new biogas products.
Carbon Capture
Bloom Energy Servers produce nearly 50% less carbon emission vs. average U.S. combustion power generation.
However, the company is in process of commercializing carbon capture that can be added to Bloom Server for
sequestering carbon for further uses. This would allow carbon neutral power generation using natural gas or carbon
negative using biogas. The company has a prototype testing in its lab. The company expects demonstration projects in
2022 with first commercial projects in 2023. The price increase from carbon capture add-on is not significant and could
be only ~10% higher.
Electrolyzers And Green Hydrogen Fuel Cell
In 2020, the company announced its intention to enter the commercial hydrogen market by introducing hydrogen-
powered fuel cells and electrolyzers that produce renewable hydrogen. These products would be first introduced to the
South Korean market in 2021 and later in the U.S. The company expects $750M potential revenues by 2025. However,
we are not providing any credit for it for now.
BE has a product that can utilize 100% of input as green hydrogen to produce power. The company has already
deployed 100 kW of solid-oxide fuel cell powered solely by hydrogen in South Korea. BE will supply 1.8 MW of
hydrogen-powered fuel cells through a multi-stage deployment from late 2021 into 2022. Additionally, the company also
can sell electrolyzers. BE has already won award to supply its solid oxide electrolyzer cells (SOEC), which will be
capable of producing green hydrogen via solar and battery, in Korea in 2022.
BE Growth Avenues
Source: BE
Page 8
8
BLOOM ENERGY INITIATIONJuly 13, 2021
Baker Hughes Agreement
Outside “five levers of growth” BE’s agreement with BKR could be a growth opportunity too. On May 5, 2021, BE and
BKR agreed to collaborate on the potential commercialization and deployment of integrated, low carbon power
generation and hydrogen solutions. Both will begin collaborating on potential customer engagements immediately, with
the objective of launching pilot projects over the next 2-3 years and fully commercializing and scaling applications,
products and solutions shortly thereafter. We have not provided any credit in our financial model. The companies will
focus efforts in three areas:
▪ Micro grids with BE’s base fuel cells using natural gas and BKR’s gas turbines with launch expected in few months.
▪ Utilizing BKR’s compression expertise for compression, transport and delivery of hydrogen via pipeline with BE’s
hydrogen production capacity using electrolyzers. This can be used in process industries such as steel refining.
▪ Mutual collaboration using BKR’s 3-D printing technology, AI to analyze BE’s datapoints provided by Energy Servers
to make them more efficient, etc.
We Prefer Stationary Power Over On-Road Mobility Applications
We prefer stationary power applications over on-road mobility applications for hydrogen. One they have track record,
two they can use grey, blue as well as green hydrogen, three they do not need extensive infrastructure like hydrogen
refueling station (HRS) and four they are closer to being competitive even at current costs. BE fits the bill.
▪ As opposed to mobility applications where companies are still building prototypes for new category of vehicles in new
markets such as BLDP for MDCV in Europe/U.S. with MAHLE and later for HDCV or PLUG with Renault JV,
BE/FCEL have installed ~575/250 MW over past five to ten years. Especially, BE has installed the same product in
the U.S. and Korea creating a strong track record.
▪ Stationary power FC can run on natural gas or biogas utilizing existing infrastructure. Stationary power FC generates
~50% lower carbon emission vs. traditional power generation. Companies have developed carbon capture add-on
fulfilling the decarbonization goal.
▪ There is relatively less risk of scaling up with stationary power vs. mobility applications. Stationary power do not need
scaling up for HRS, a must if mobility applications were to enjoy higher penetration.
▪ Lastly, the stationary power produced already competes with electricity provided by grids in many states in the U.S.
With costs still expected to decline, stationary power can potentially compete with grid electricity costs in all 50 U.S.
states.
Relatively Decent Valuation
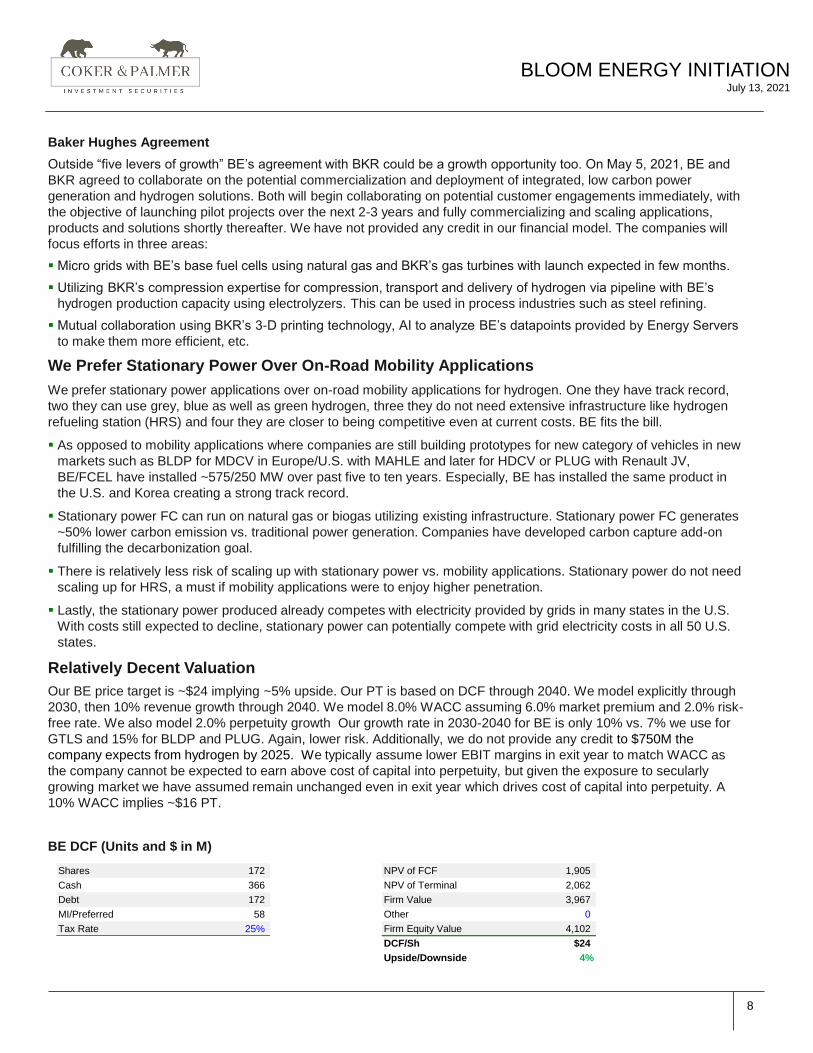
Our BE price target is ~$24 implying ~5% upside. Our PT is based on DCF through 2040. We model explicitly through
2030, then 10% revenue growth through 2040. We model 8.0% WACC assuming 6.0% market premium and 2.0% risk-
free rate. We also model 2.0% perpetuity growth Our growth rate in 2030-2040 for BE is only 10% vs. 7% we use for
GTLS and 15% for BLDP and PLUG. Again, lower risk. Additionally, we do not provide any credit to $750M the
company expects from hydrogen by 2025. We typically assume lower EBIT margins in exit year to match WACC as
the company cannot be expected to earn above cost of capital into perpetuity, but given the exposure to secularly
growing market we have assumed remain unchanged even in exit year which drives cost of capital into perpetuity. A
10% WACC implies ~$16 PT.
BE DCF (Units and $ in M)
Shares 172
Cash 366
Debt 172
MI/Preferred 58
Tax Rate 25%
NPV of FCF 1,905
NPV of Terminal 2,062
Firm Value 3,967
Other 0
Firm Equity Value 4,102
DCF/Sh $24
Upside/Downside 4%
Page 9
9
BLOOM ENERGY INITIATIONJuly 13, 2021
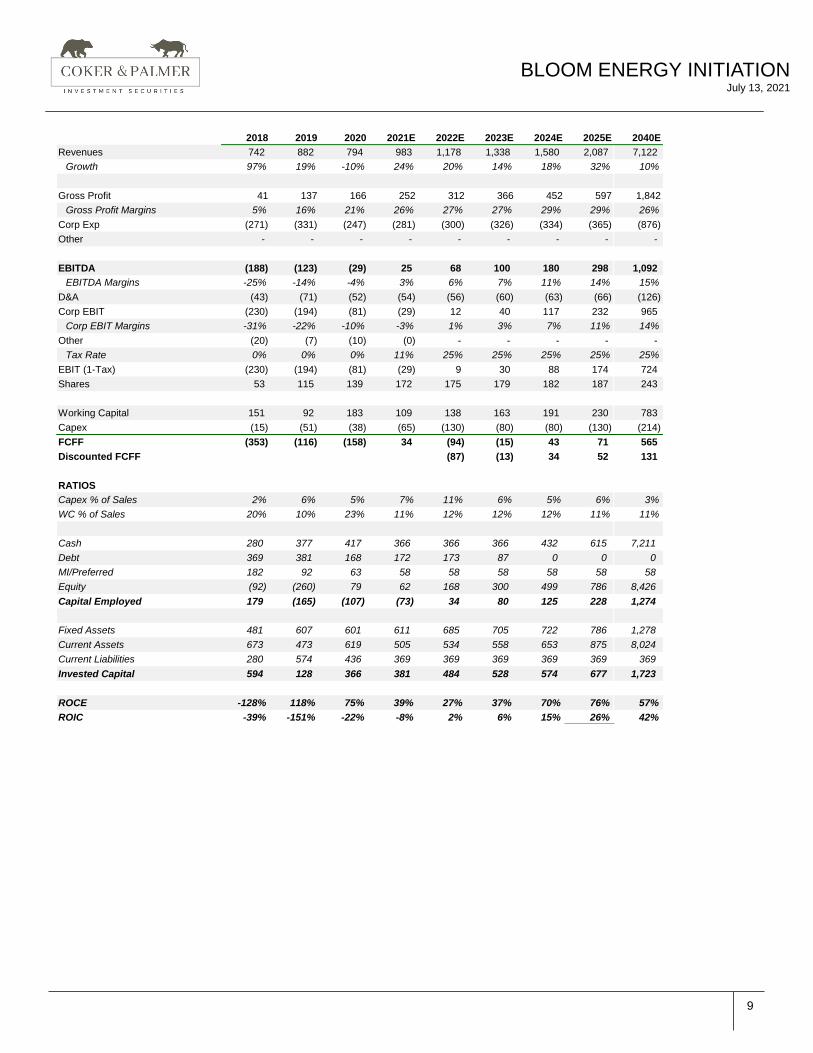
2018 2019 2020 2021E 2022E 2023E 2024E 2025E 2040E
Revenues 742 882 794 983 1,178 1,338 1,580 2,087 7,122
Growth 97% 19% -10% 24% 20% 14% 18% 32% 10%
Gross Profit 41 137 166 252 312 366 452 597 1,842
Gross Profit Margins 5% 16% 21% 26% 27% 27% 29% 29% 26%
Corp Exp (271) (331) (247) (281) (300) (326) (334) (365) (876)
Other - - - - - - - - -
EBITDA (188) (123) (29) 25 68 100 180 298 1,092
EBITDA Margins -25% -14% -4% 3% 6% 7% 11% 14% 15%
D&A (43) (71) (52) (54) (56) (60) (63) (66) (126)
Corp EBIT (230) (194) (81) (29) 12 40 117 232 965
Corp EBIT Margins -31% -22% -10% -3% 1% 3% 7% 11% 14%
Other (20) (7) (10) (0) - - - - -
Tax Rate 0% 0% 0% 11% 25% 25% 25% 25% 25%
EBIT (1-Tax) (230) (194) (81) (29) 9 30 88 174 724
Shares 53 115 139 172 175 179 182 187 243
Working Capital 151 92 183 109 138 163 191 230 783
Capex (15) (51) (38) (65) (130) (80) (80) (130) (214)
FCFF (353) (116) (158) 34 (94) (15) 43 71 565
Discounted FCFF (87) (13) 34 52 131
RATIOS
Capex % of Sales 2% 6% 5% 7% 11% 6% 5% 6% 3%
WC % of Sales 20% 10% 23% 11% 12% 12% 12% 11% 11%
Cash 280 377 417 366 366 366 432 615 7,211
Debt 369 381 168 172 173 87 0 0 0
MI/Preferred 182 92 63 58 58 58 58 58 58
Equity (92) (260) 79 62 168 300 499 786 8,426
Capital Employed 179 (165) (107) (73) 34 80 125 228 1,274
Fixed Assets 481 607 601 611 685 705 722 786 1,278
Current Assets 673 473 619 505 534 558 653 875 8,024
Current Liabilities 280 574 436 369 369 369 369 369 369
Invested Capital 594 128 366 381 484 528 574 677 1,723
ROCE -128% 118% 75% 39% 27% 37% 70% 76% 57%
ROIC -39% -151% -22% -8% 2% 6% 15% 26% 42%
Page 10
10
BLOOM ENERGY INITIATIONJuly 13, 2021
Catalysts
▪ BE is hoping to win a combined heat & power (CHP) contract in South Korea where they can utilize heat emissions
which should improve product efficiency.
▪ We expect first commercial sale of carbon capture product shortly.
▪ We also expect a large biogas commercial win with a large technology company.
▪ We think the company will likely have to expand production capacity in 2022.
Risks To Thesis
Upside Risks
$750M Green Hydrogen Revenues
In 2020, the company announced its intention to enter the commercial hydrogen market by introducing hydrogen-
powered fuel cells and electrolyzers that produce renewable hydrogen. BE has a product that can utilize 100% of input
as green hydrogen to produce power. The company has already deployed 100 kW of solid-oxide fuel cell powered
solely by hydrogen in South Korea. BE will supply 1.8 MW of hydrogen-powered fuel cells through a multi-stage
deployment from late 2021 into 2022. Additionally, the company also can sell electrolyzers. Korea’s hydrogen needs
could reach 470k tons in 2022, 1.94M tons in 2030 and 5.26M tons in 2040 vs. 130K tons/year hydrogen in 2018. BE
has already won award to supply its solid oxide electrolyzer cells (SOEC), which will be capable of producing green
hydrogen via solar and battery, in Korea in 2022. The company has ~35% market share in Korea fuel cell market
providing a solid base. The company expects $750M potential revenues by 2025. However, we are not providing any
credit for it for now and could provide upside. Carbon capture products and BKR agreement too can provide upside.
Downside Risks
Modeling Assumptions
▪ We are giving credit to company for selling products internationally, outside Korea given the company has hired a
team of ~10 senior people in April 2021 focusing on Australia, European countries such as UK, German, France, Italy,
Spain and Portugal, Southeast Asia including Thailand, Singapore and Malaysia, the Middle East and North Africa.
However, such revenues amount to ~5% of total revenues in 2024.
▪ We are assuming installation margins improve to breakeven by 2023, a year after the company expectations, but we
have less clarity on the pathway.
▪ We are assuming Services margins improve to 20% by 2025 vs. (-21%) in 2020. The company has worked hard on
improving margins. Services are priced at 20% margins for the last few years. However, product issues were hurting
margins. The company has implemented cost savings initiatives. The product reliability has increased as well. Given
the replacement cost is already baked into service agreements at the time of sale of the module, any improvement in
cost and life extensions should help BE’s service margins. Additionally, Services margins already turned positive in
1Q21, a year earlier than original company forecast.
▪ We have assumed Products margins at ~40% in line with company guidance vs. ~37% currently. Stable margins
while reducing pricing to pass on cost benefits is not without risk, albeit we have provided same credit to peers too.
Additionally, international margins could be dilutive initially as the company tries to establish a presence.
▪ Lastly, there is a modest risk from restatements as we have seen for peers and the company itself. Bloom's
previously issued consolidated financial statements as of and for the year ended 12M2018, as well as the unaudited
interim financial statements for the three-month period ended March 31, 2019, the three- and six-month periods
ended June 30, 2019 and 2018 and the three- and nine-month periods ended September 30, 2019 and 2018, were
restated due to misstatements related to Managed Services Agreements and similar arrangements. The revenue for
the Managed Services Agreements and similar transactions were to be recognized over the duration of the contract
instead of upfront. In addition, even though the impact of these misstatements to periods prior to the three months
ended June
Page 11
11
BLOOM ENERGY INITIATIONJuly 13, 2021
30, 2018 was not material to warrant restatement of reported figures, however, BE’s consolidated financial
statements as of and for the year ended December 31, 2017, selected financial data as of and for the year ended
December 31, 2016 and the relevant unaudited selected quarterly financial data for the three months period ended
March 31, 2018 were revised to correct these misstatements. Essentially, revenues for 2017/2018/9M2019 were
reduced by $10/109/70M as a result.
Potential Manufacturing Capacity Constraints
The company could end up being capacity constrained if a facility in addition to a 200 MW facility currently under
construction is not announced soon. The company is building a 200 MW new manufacturing facility for its Bloom 7.5
model. The company will continue to use its current 200 MW manufacturing facility to build Bloom 5.0 and 80 MW of
servicing Bloom 5.0. Gradually, the company will use all of current 200 MW facility for servicing Bloom 5.0 as well.
However, we model the company should be able to sell ~210 MW in 2022 increasing to ~425 MW by 2025 and 600
MW+ in 2029. Accordingly, we model the company will spend $50M each year in 2022/25/29 to expand building
capacity by 200 MW each time.
BE has been very deliberate about its manufacturing facility set up where the company can stand up a copy of its
existing manufacturing line in a year. This same manufacturing facility can build Bloom Server and future growth
products such as electrolyzers, marine power and carbon capture enabled systems.
Stock Based Compensation Dilution
We are not big fans of significant stock-based compensation (SBC). We think of SBC as true cost even if non-cash.
The company had $180/191/74M SBC in 2018/19/20 despite negative EBITDA. Given the technology and company
was in nascent stage, we can somewhat understand the reasoning. However, with the company on a significant growth
path, our comfort level is low with SBC. We model $75M SBC in 2021 growing annually by 5%. This implies 3M shares
addition each year at current share price. It implies share count could grow to ~205M by 2030 vs. ~170M currently or
17% dilution.
Execution Risk
Execution risk around scaling up from about 130 MW sold in our estimate in 2020 to ~700 GW by 2030. Oil Services
industry has witnessed several companies failing at scaling up despite having decent products. Even larger companies
have had execution issues.
Page 12
BLOOM ENERGY INITIATIONJuly 13, 2021
Financial Assumptions & Model
Page 13
13
BLOOM ENERGY INITIATIONJuly 13, 2021
Financial Assumptions & Model
Company Guidance
2021 guide
▪ Revenues $950M - $1B with 180-190 MW shipments; 2H > 1H
▪ Non-GAAP Gross Margins ~25%
▪ Non-GAAP Operating Margins ~3%
▪ CFO Approaching positive
▪ $150M Services revenues with positive margins vs. 2022 earlier
▪ Cash use in 1H21 as build inventories for delivery in 2H21
2025 Guide
▪ Revs 20-25% CAGR by 2025 vs. $780M revs in 2020
▪ Annual cost/kW reduction of 15%
▪ Non GGAP Gross Margins 30%
• Maintain Product margins at ~40%
• Services margins of 20%
• Installation breakeven by 2022
▪ Non-GAAP Operating Margins 15%
• R&D 8-9% of revenues
• SG&A 7-8% of revenues
Products Segment
BE’s product sales backlog was $1.0B, equivalent to 1,994 systems, or 199.4 MW as of 2020 end vs. $1.1B, equivalent
to 1,983 systems, or 198.3 MW as of 2019 end. Typically at least 50% of backlog is deployed within the next 12
months. As 2020 end the backlog comprised of direct purchase (including Third Party PPAs) 90% and Managed
Services Agreements 10% vs 93/7% at 2019 end respectively.
South Korea
The company has ~200 MW capacity of the ~550 MW installed in South Korea. Korea’s policy aims to get to 1.5 GW by
2022 and 8 GW domestically by 2040. We assume the country demand to grow 500 MW in 2021/22 and ~375 MW
each year thereafter to hit its target. We model BE selling 100/120 MW in 2021/22 which implies 30/28% market share
vs. ~35% currently. Our assumptions may prove to be conservative. Beyond 2022, we continue to assume 30% market
share implying ~115 MW addition each year. We model $3,500/kW price in 2021/22 and then declining 10% each year
through 2030 to ~$1,500/kW.
U.S.
We estimate BE sold ~60 MW of products in the U.S. each in 2018/19/20. The price of product has declined from
$0.14/kW to under $0.10/kWh and expected to decline further to ~$0.07/kWh. This in turn should enable the company
to expand into other states in the country beyond current four core states, CA, CT, MA and NY, where most of BE’s
products have been sold. Accordingly, we assume ~20% growth in 2021-24 and 15% thereafter through 2030. The
company has a proven product and track record in the U.S.
Page 14
14
BLOOM ENERGY INITIATIONJuly 13, 2021
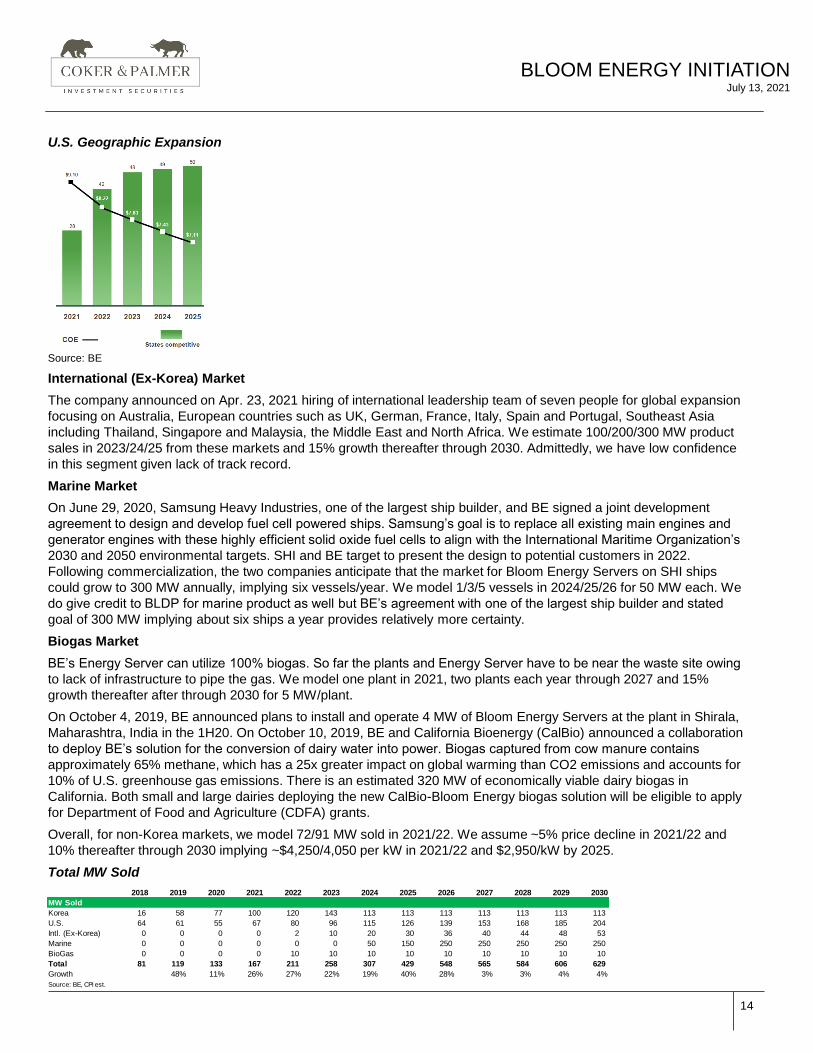
U.S. Geographic Expansion
Source: BE
International (Ex-Korea) Market
The company announced on Apr. 23, 2021 hiring of international leadership team of seven people for global expansion
focusing on Australia, European countries such as UK, German, France, Italy, Spain and Portugal, Southeast Asia
including Thailand, Singapore and Malaysia, the Middle East and North Africa. We estimate 100/200/300 MW product
sales in 2023/24/25 from these markets and 15% growth thereafter through 2030. Admittedly, we have low confidence
in this segment given lack of track record.
Marine Market
On June 29, 2020, Samsung Heavy Industries, one of the largest ship builder, and BE signed a joint development
agreement to design and develop fuel cell powered ships. Samsung’s goal is to replace all existing main engines and
generator engines with these highly efficient solid oxide fuel cells to align with the International Maritime Organization’s
2030 and 2050 environmental targets. SHI and BE target to present the design to potential customers in 2022.
Following commercialization, the two companies anticipate that the market for Bloom Energy Servers on SHI ships
could grow to 300 MW annually, implying six vessels/year. We model 1/3/5 vessels in 2024/25/26 for 50 MW each. We
do give credit to BLDP for marine product as well but BE’s agreement with one of the largest ship builder and stated
goal of 300 MW implying about six ships a year provides relatively more certainty.
Biogas Market
BE’s Energy Server can utilize 100% biogas. So far the plants and Energy Server have to be near the waste site owing
to lack of infrastructure to pipe the gas. We model one plant in 2021, two plants each year through 2027 and 15%
growth thereafter after through 2030 for 5 MW/plant.
On October 4, 2019, BE announced plans to install and operate 4 MW of Bloom Energy Servers at the plant in Shirala,
Maharashtra, India in the 1H20. On October 10, 2019, BE and California Bioenergy (CalBio) announced a collaboration
to deploy BE’s solution for the conversion of dairy water into power. Biogas captured from cow manure contains
approximately 65% methane, which has a 25x greater impact on global warming than CO2 emissions and accounts for
10% of U.S. greenhouse gas emissions. There is an estimated 320 MW of economically viable dairy biogas in
California. Both small and large dairies deploying the new CalBio-Bloom Energy biogas solution will be eligible to apply
for Department of Food and Agriculture (CDFA) grants.
Overall, for non-Korea markets, we model 72/91 MW sold in 2021/22. We assume ~5% price decline in 2021/22 and
10% thereafter through 2030 implying ~$4,250/4,050 per kW in 2021/22 and $2,950/kW by 2025.
Total MW Sold
2018 2019 2020 2021 2022 2023 2024 2025 2026 2027 2028 2029 2030
MW Sold
Korea 16 58 77 100 120 143 113 113 113 113 113 113 113
U.S. 64 61 55 67 80 96 115 126 139 153 168 185 204
Intl. (Ex-Korea) 0 0 0 0 2 10 20 30 36 40 44 48 53
Marine 0 0 0 0 0 0 50 150 250 250 250 250 250
BioGas 0 0 0 0 10 10 10 10 10 10 10 10 10
Total 81 119 133 167 211 258 307 429 548 565 584 606 629
Growth 48% 11% 26% 27% 22% 19% 40% 28% 3% 3% 4% 4%
Source: BE, CPI est.
Page 15
15
BLOOM ENERGY INITIATIONJuly 13, 2021
We model gross margins ~37% for Product segment in 2021 vs. 36% for 2020 and growing to ~40% by 2024 in line
with company guidance.
Installation segment
The company provides installation services for products sold in the U.S., not for products sold in Korea. The company
is trying to outsource installation work even within the U.S. given its low margin profile. We model the share of U.S. jobs
where the company provides installation to reduce from 100% in 2021 to 80% by 2025 and 50% thereafter. We model
$1,500/kW of installation price implying 5/21% revenues growth in 2021/22 to $107/130M. More importantly , we model
(-10%/-5%) margins in 2021/22 vs. about (-15%) in 2020. Thereafter we model breakeven gross margins. The
company expects to be breakeven by 2022.
Service Segment
The company provides one year of warranty on new products and then is covered under long term service agreement.
Accordingly, Service revenues should grow driven by installation each year with a year lag. However, given annual
installations are a small part of cumulative deployments, we model Services revenues based on cumulative
deployments. We model ~$200/kW of Service revenues on total deployments vs. $221/211/193 per kW in 2018/19/20.
This implies 43/21% revenues growth to ~$155/190M in 2021/22.
The company has worked hard on improving margins. Services are priced at 20% margins. However, product issues
were hurting margins. The company has implemented cost savings initiatives. The product reliability has increased as
well. Given the replacement cost is already baked into service agreements at the time of sale of the module, any
improvement in cost and life extensions should help BE’s service margins. We model 1% margins in 2021 improving to
20% by 2025, giving credit to company’s guidance.
Electricity Segment
This is not a core business for the company. We model flat revenues and margins.
Line Items
▪ We model R&D of $98/108M in 2021/22. We model R&D as share of sales to decline from 10/9% in 2021/22 to 5% by
2025 and eventually to 2% by 2030.
▪ We model SG&A of ~$185/190M in 2021/22. We model SG&A as share of sales to decline from 18/16% in 2021/22 to
12% by 2025 and eventually to 10% by 2030.
▪ We model $65/130M capex in 2021/22. We assume BE will have to increase capacity in 2022 and again in 2025/29.
Each 200 MW capacity expansion is about $50M capex. Longer term we model 3% capex to sales.
▪ We model essentially neutral change in working capital (receivables plus inventory minus payables) in 2021 despite
higher revenues as inventory is expected to decline. We assume working capital /sales remain at 11% of ~45 net
days.
Page 16
16
Source: Bloomberg; Company reports; CPI est.
Company Model (US$M)
BLOOM ENERGY INITIATIONJuly 13, 2021
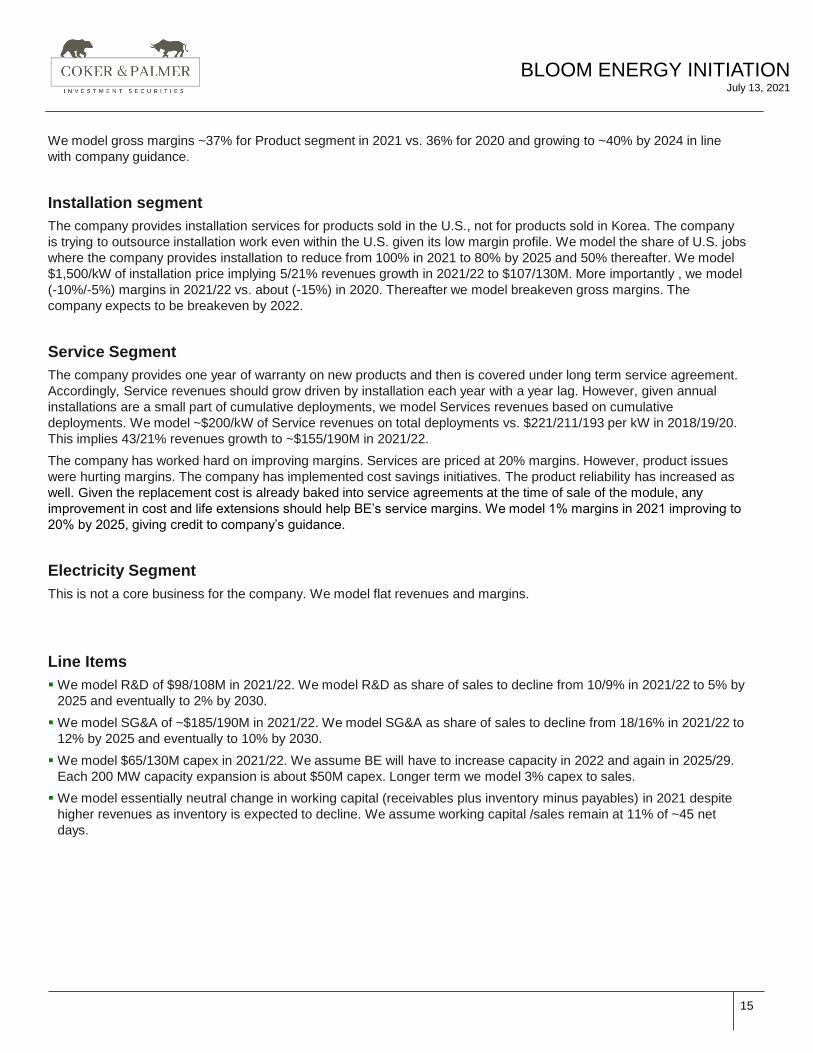
Summary 1Q20 2Q20 3Q20 4Q20 1Q21E 2Q21E 3Q21E 4Q21E 2019 2020 2021E 2022E 2023E 2024E 2025E 2040E
Revenue 157 188 200 249 194 254 262 273 882 794 983 1,178 1,338 1,580 2,087 7,122
Consensus 176 174 235 221 208 233 259 289 786 794 974 1,210 1,529 1,877 2,308 -
EBITDA (33) (17) 13 9 (1) 6 8 12 (123) (29) 25 68 100 180 298 1,092
Consensus (19) (4) 11 17 10 14 24 30 97 45 84 140 232 276 375 -
EPS ($0.50) ($0.34) ($0.09) ($0.16) ($0.14) ($0.02) ($0.01) $0.01 ($2.16) ($1.04) ($0.16) $0.13 $0.25 $0.58 $1.03 $3.06
Consensus ($0.12) ($0.12) ($0.12) $0.00 ($0.07) ($0.06) $0.00 $0.02 ($0.30) ($0.67) ($0.18) $0.10 $0.10 $0.10 $0.00 $0.00
Products
Korea Market
Units Sold (100 KW) - Korea 161 156 137 317 0 0 0 0 579 772 1,000 1,200 1,425 1,125 1,125 1,125
Growth % 253% 33% 30% 20% 19% -21% 0% 0%
Product Revenues/Acceptance ($/KW) 3,500 3,500 3,500 3,500 3,150 2,835 2,552 1,507
Growth % 0% 0% 0% 0% -10% -10% -10% 0%
Korea Revenue 56 54 48 111 0 0 0 0 203 270 350 420 449 319 287 169
Growth % 253% 33% 30% 20% 7% -29% -10% 0%
Units Sold (100 KW) - US 615 554 665 798 958 1,150 1,322 10,758
Growth % -5% -10% 20% 20% 20% 20% 15% 15%
Units Sold (100 KW) - Intl. Ex Korea 0 15 100 200 300 2,441
Growth % 567% 100% 50% 15%
Units Sold (100 KW) - Marine 500 1,500 2,500
Vessel 1 3 5
MW / Vessel 0 50 50
Units Sold (100 KW) - Biogas 50 100 100 100 100 708
Plant 1 2 2 2 2 14
MW/Plant 5 5 5 5 5 5
Non Korean Units Sold (100 KW) 615 554 715 913 1,158 1,950 3,222 16,407
Growth % -5% -10% 29% 28% 27% 68% 65% 12%
Non-Korea Product Revenues ($M) 460 249 305 370 422 639 950 2858
Product Revenue / Acceptance ($/kW) 7,483 4,484 4,259 4,046 3,642 3,278 2,950 1,742
Growth % 6% -40% -5% -5% -10% -10% -10% 0%
Products Revenue 100 116 131 172 138 164 170 179 663 519 651 790 870 957 1,238 3,027
Change % -37% 17% 13% 31% -20% 19% 4% 5% 29% -22% 26% 21% 10% 10% 29% 12%
Product Cost (72) (83) (72) (105) (87) (104) (108) (113) (492) (333) (412) (498) (540) (574) (743)
Product Gross Margin 27% 28% 45% 39% 37% 37% 37% 37% 26% 36% 37% 37% 38% 40% 40%
Page 17
17
Source: Bloomberg; Company reports; CPI est.
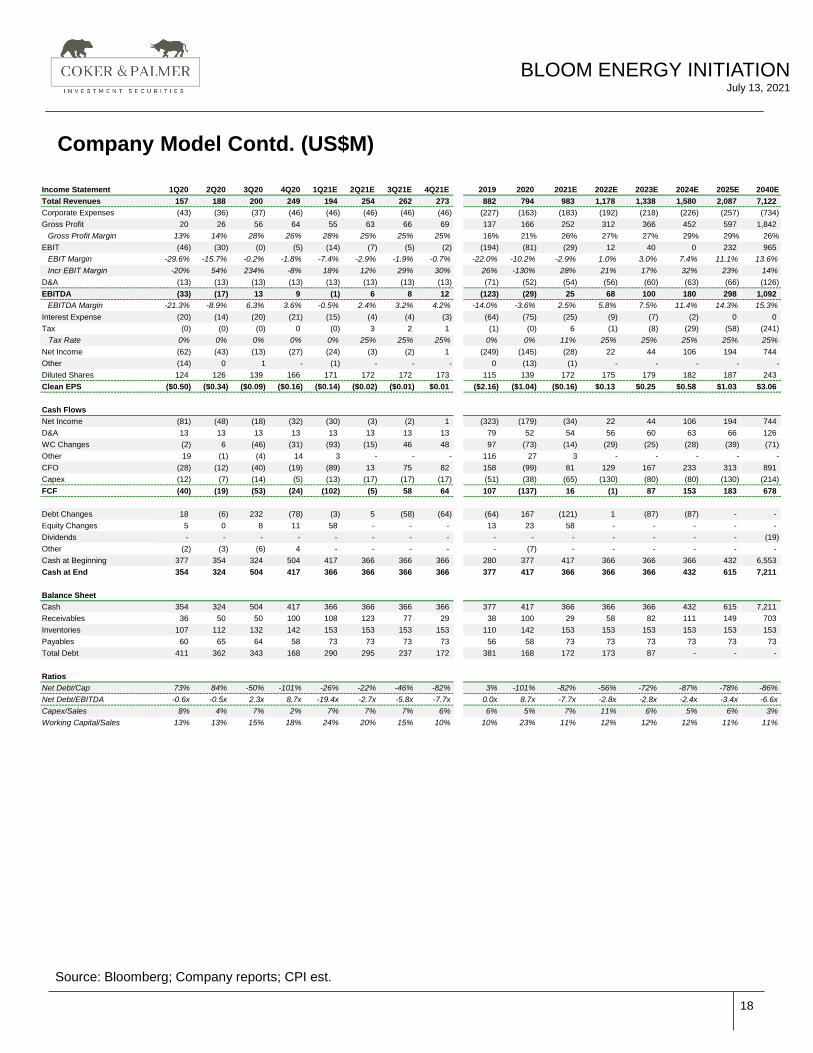
Company Model Contd. (US$M)
BLOOM ENERGY INITIATIONJuly 13, 2021
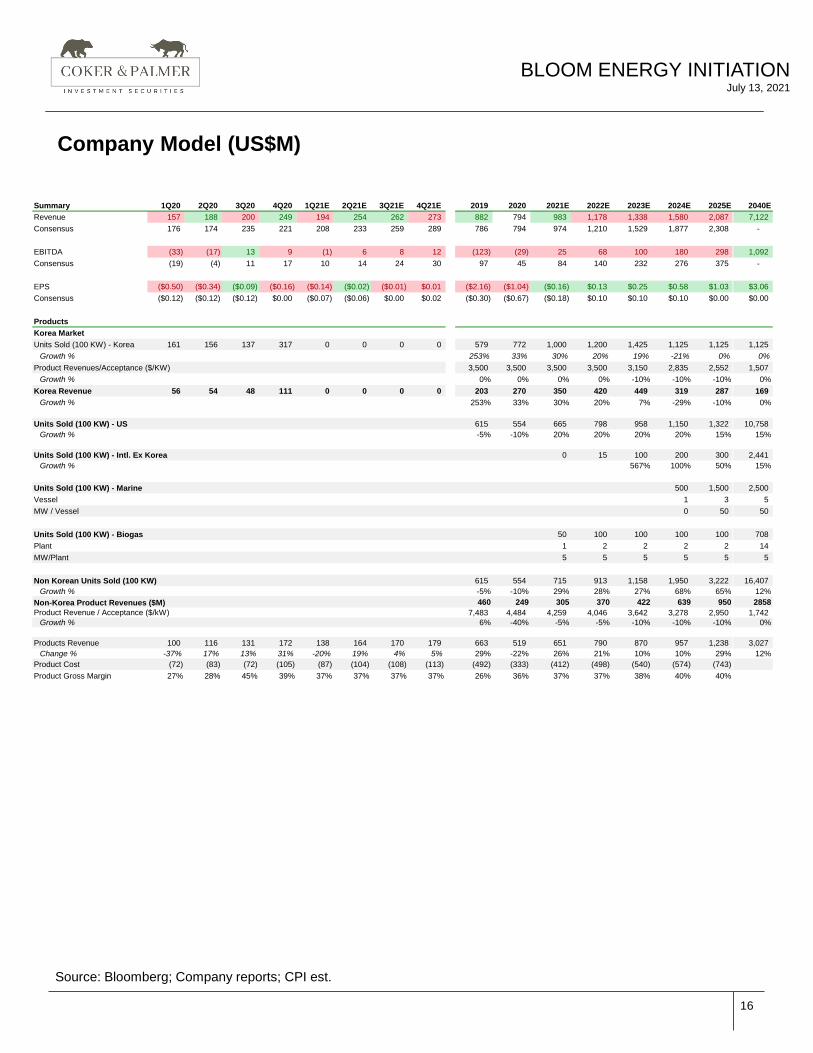
Installation 1Q20 2Q20 3Q20 4Q20 1Q21E 2Q21E 3Q21E 4Q21E 2019 2020 2021E 2022E 2023E 2024E 2025E 2040E
Units Sold (100 KW) - Korea 579 772 1,000 1,200 1,425 1,125 1,125 1,125
Non-Korea Units Sold (100 KW) 615 554 715 913 1,158 1,950 3,222 16,407
Inst. Revenue/ Acceptance ($/kW) 1,188 1,838 1,500 1,500 1,500 1,500 1,500 1,500
Change % -16% 55% -18% 0% 0% 0% 0% 0%
Installation Revenue 17 30 27 29 3 35 35 35 73 102 107 130 156 249 387 1,231
Change % 15% 80% -11% 8% -91% 1212% 0% 0% -20% 40% 5% 21% 20% 59% 56% 12%
Installation Gross Profit (4) (8) (1) (1) (2) (3) (3) (3) (15) (15) (11) (7) 0 0 0
Installation Gross Margin -25% -28% -5% -3% -74% -8% -8% -8% -21% -14% -10% -5% 0% 0% 0%
Service
Cumulative MW deployed 481 512 543 568 604 647 693 740 456 568 740 951 1,209 1,518 1,953 16,742
Service Revenue $/kW 209 205 192 226 241 236 232 227 211 193 212 200 201 202 202 202
Change % -7% -2% -6% 18% 7% -2% -2% -2% -5% -8% 10% -6% 1% 0% 0% 0%
Service Revenue 25 26 26 32 36 38 40 42 96 110 157 190 243 307 395 3,384
Change % -2% 4% 0% 23% 13% 5% 5% 5% 17% 14% 43% 21% 28% 26% 29% 12%
Service Gross Profit (6) (2) (7) (7) 0 0 0 0 (5) (23) 2 4 12 46 79
Service Gross Margin -23% -9% -27% -23% 1% 1% 1% 1% -5% -21% 1% 2% 5% 15% 20%
Electricity
Electricity revenue 15 16 16 17 17 17 17 17 96 110 157 190 243 307 395 3,384
Change % 0% 2% 6% 1% 2% 0% 0% 0% 17% 14% 43% 21% 28% 26% 29% 12%
Electricity Gross Profit 0 0 0 0 0 0 0 0 (14) 17 23 23 23 23 23
Electricity Gross Margin 19% 26% 32% 30% 33% 33% 33% 33% -28% 27% 33% 33% 33% 33% 33%
Page 18
18
Source: Bloomberg; Company reports; CPI est.
Company Model Contd. (US$M)
BLOOM ENERGY INITIATIONJuly 13, 2021
Income Statement 1Q20 2Q20 3Q20 4Q20 1Q21E 2Q21E 3Q21E 4Q21E 2019 2020 2021E 2022E 2023E 2024E 2025E 2040E
Total Revenues 157 188 200 249 194 254 262 273 882 794 983 1,178 1,338 1,580 2,087 7,122
Corporate Expenses (43) (36) (37) (46) (46) (46) (46) (46) (227) (163) (183) (192) (218) (226) (257) (734)
Gross Profit 20 26 56 64 55 63 66 69 137 166 252 312 366 452 597 1,842
Gross Profit Margin 13% 14% 28% 26% 28% 25% 25% 25% 16% 21% 26% 27% 27% 29% 29% 26%
EBIT (46) (30) (0) (5) (14) (7) (5) (2) (194) (81) (29) 12 40 0 232 965
EBIT Margin -29.6% -15.7% -0.2% -1.8% -7.4% -2.9% -1.9% -0.7% -22.0% -10.2% -2.9% 1.0% 3.0% 7.4% 11.1% 13.6%
Incr EBIT Margin -20% 54% 234% -8% 18% 12% 29% 30% 26% -130% 28% 21% 17% 32% 23% 14%
D&A (13) (13) (13) (13) (13) (13) (13) (13) (71) (52) (54) (56) (60) (63) (66) (126)
EBITDA (33) (17) 13 9 (1) 6 8 12 (123) (29) 25 68 100 180 298 1,092
EBITDA Margin -21.3% -8.9% 6.3% 3.6% -0.5% 2.4% 3.2% 4.2% -14.0% -3.6% 2.5% 5.8% 7.5% 11.4% 14.3% 15.3%
Interest Expense (20) (14) (20) (21) (15) (4) (4) (3) (64) (75) (25) (9) (7) (2) 0 0
Tax (0) (0) (0) 0 (0) 3 2 1 (1) (0) 6 (1) (8) (29) (58) (241)
Tax Rate 0% 0% 0% 0% 0% 25% 25% 25% 0% 0% 11% 25% 25% 25% 25% 25%
Net Income (62) (43) (13) (27) (24) (3) (2) 1 (249) (145) (28) 22 44 106 194 744
Other (14) 0 1 - (1) - - - 0 (13) (1) - - - - -
Diluted Shares 124 126 139 166 171 172 172 173 115 139 172 175 179 182 187 243
Clean EPS ($0.50) ($0.34) ($0.09) ($0.16) ($0.14) ($0.02) ($0.01) $0.01 ($2.16) ($1.04) ($0.16) $0.13 $0.25 $0.58 $1.03 $3.06
Cash Flows
Net Income (81) (48) (18) (32) (30) (3) (2) 1 (323) (179) (34) 22 44 106 194 744
D&A 13 13 13 13 13 13 13 13 79 52 54 56 60 63 66 126
WC Changes (2) 6 (46) (31) (93) (15) 46 48 97 (73) (14) (29) (25) (28) (39) (71)
Other 19 (1) (4) 14 3 - - - 116 27 3 - - - - -
CFO (28) (12) (40) (19) (89) 13 75 82 158 (99) 81 129 167 233 313 891
Capex (12) (7) (14) (5) (13) (17) (17) (17) (51) (38) (65) (130) (80) (80) (130) (214)
FCF (40) (19) (53) (24) (102) (5) 58 64 107 (137) 16 (1) 87 153 183 678
Debt Changes 18 (6) 232 (78) (3) 5 (58) (64) (64) 167 (121) 1 (87) (87) - -
Equity Changes 5 0 8 11 58 - - - 13 23 58 - - - - -
Dividends - - - - - - - - - - - - - - - (19)
Other (2) (3) (6) 4 - - - - - (7) - - - - - -
Cash at Beginning 377 354 324 504 417 366 366 366 280 377 417 366 366 366 432 6,553
Cash at End 354 324 504 417 366 366 366 366 377 417 366 366 366 432 615 7,211
Balance Sheet
Cash 354 324 504 417 366 366 366 366 377 417 366 366 366 432 615 7,211
Receivables 36 50 50 100 108 123 77 29 38 100 29 58 82 111 149 703
Inventories 107 112 132 142 153 153 153 153 110 142 153 153 153 153 153 153
Payables 60 65 64 58 73 73 73 73 56 58 73 73 73 73 73 73
Total Debt 411 362 343 168 290 295 237 172 381 168 172 173 87 - - -
Ratios
Net Debt/Cap 73% 84% -50% -101% -26% -22% -46% -82% 3% -101% -82% -56% -72% -87% -78% -86%
Net Debt/EBITDA -0.6x -0.5x 2.3x 8.7x -19.4x -2.7x -5.8x -7.7x 0.0x 8.7x -7.7x -2.8x -2.8x -2.4x -3.4x -6.6x
Capex/Sales 8% 4% 7% 2% 7% 7% 7% 6% 6% 5% 7% 11% 6% 5% 6% 3%
Working Capital/Sales 13% 13% 15% 18% 24% 20% 15% 10% 10% 23% 11% 12% 12% 12% 11% 11%
Page 19
BLOOM ENERGY INITIATIONJuly 13, 2021
Company Background
Page 20
20
BLOOM ENERGY INITIATIONJuly 13, 2021
Company Overview
Bloom Energy, Inc. (BE), was incorporated in Delaware on Jan. 18, 2001, as Ion America Corp and later renamed in
2006. BE manufactures solid oxide fuel-cell based power generation platform called Bloom Energy Servers (“Server”)
that provides clean and resilient power to businesses, essential services, and critical infrastructure. Bloom Energy
Servers produce nearly 50% less carbon emission vs. average U.S. combustion power generation. The company is in
process of commercialization and expansion of five new products (1) carbon capture that can be added to Bloom
Server for sequestering carbon for further uses, (2) biogas driven Energy Servers, (2) Energy Servers powered by
renewable or green hydrogen fuel, (4) electrolyzers to produce renewable hydrogen and (5) marine product.
Bloom Energy Server
The Bloom Energy Server delivers reliable, resilient and cleaner energy through distributed power generation system. It
can provide 24X7 baseload power. It can use natural gas, biogas and hydrogen to produce power. Its scalable to work
for small and large-scale solutions for power and transportation industry. Essentially the company provides electricity in
two ways, one in parallel to grid where the customer can arbitrage electricity from the grid vs fuel cell and second an
AlwaysOn option where resiliency is more important. Predominantly, the Server is used as primary source of power.
The Bloom Energy Server, based on solid oxide fuel cell technology, converts fuel (natural gas, biogas or hydrogen)
into electricity through an electrochemical process without combustion. Each individual fuel cell is composed of three
layers, an electrolyte sandwiched between a cathode and an anode. The electrolyte is a solid ceramic material, and the
anode and cathode are made from inks that coat the electrolyte. Multiple fuel cells form stacks and multiple stacks form
a 50kW power module. A typical Server includes multiple power modules that can produce up to 300kW of power in a
footprint roughly equivalent to that of half a standard 30-foot shipping container. They can be stacked together to form
up to tens of MW stack. The Server is modular, i.e., more capacity can be added later to existing server. Please see
our “Deep Dive Into Mobility TAM – Hydrogen Sector Initiation” report for types of hydrogen fuel and how a
fuel cell works.
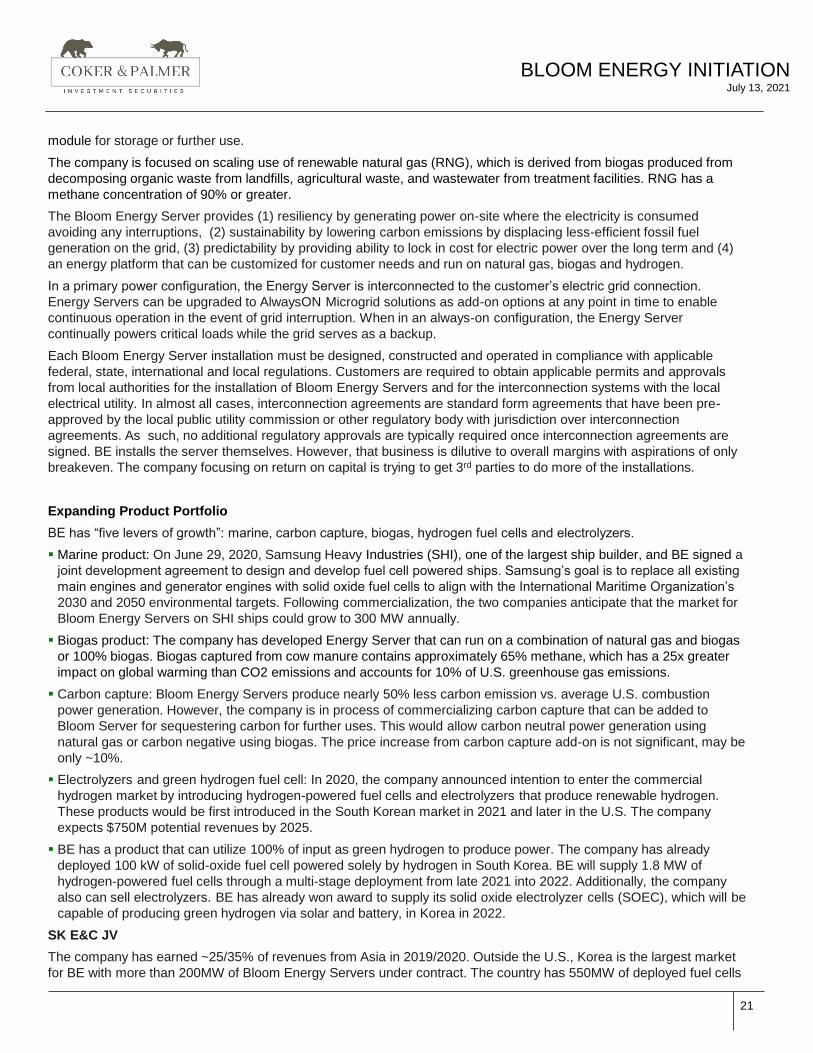
Solid Oxide Fuel Cell Schematic
Source: BE
Essentially, the primary input is standard low-pressure natural gas, biogas or hydrogen and out put is electrical power,
which can be connected to customer’s main electrical feed avoiding the grid. Natural gas or biogas after treating
modestly, if needed, along with some water is used as input with power, water and significantly less carbon dioxide (vs.
traditional power) is the output. The Server can utilize existing underground natural gas infrastructure. Nitrogen and
carbon are not mixed in the reaction making it feasible and cost-effective to capture CO2 emissions with carbon capture
Page 21
21
BLOOM ENERGY INITIATIONJuly 13, 2021
module for storage or further use.
The company is focused on scaling use of renewable natural gas (RNG), which is derived from biogas produced from
decomposing organic waste from landfills, agricultural waste, and wastewater from treatment facilities. RNG has a
methane concentration of 90% or greater.
The Bloom Energy Server provides (1) resiliency by generating power on-site where the electricity is consumed
avoiding any interruptions, (2) sustainability by lowering carbon emissions by displacing less-efficient fossil fuel
generation on the grid, (3) predictability by providing ability to lock in cost for electric power over the long term and (4)
an energy platform that can be customized for customer needs and run on natural gas, biogas and hydrogen.
In a primary power configuration, the Energy Server is interconnected to the customer’s electric grid connection.
Energy Servers can be upgraded to AlwaysON Microgrid solutions as add-on options at any point in time to enable
continuous operation in the event of grid interruption. When in an always-on configuration, the Energy Server
continually powers critical loads while the grid serves as a backup.
Each Bloom Energy Server installation must be designed, constructed and operated in compliance with applicable
federal, state, international and local regulations. Customers are required to obtain applicable permits and approvals
from local authorities for the installation of Bloom Energy Servers and for the interconnection systems with the local
electrical utility. In almost all cases, interconnection agreements are standard form agreements that have been pre-
approved by the local public utility commission or other regulatory body with jurisdiction over interconnection
agreements. As such, no additional regulatory approvals are typically required once interconnection agreements are
signed. BE installs the server themselves. However, that business is dilutive to overall margins with aspirations of only
breakeven. The company focusing on return on capital is trying to get 3rd parties to do more of the installations.
Expanding Product Portfolio
BE has “five levers of growth”: marine, carbon capture, biogas, hydrogen fuel cells and electrolyzers.
▪ Marine product: On June 29, 2020, Samsung Heavy Industries (SHI), one of the largest ship builder, and BE signed a
joint development agreement to design and develop fuel cell powered ships. Samsung’s goal is to replace all existing
main engines and generator engines with solid oxide fuel cells to align with the International Maritime Organization’s
2030 and 2050 environmental targets. Following commercialization, the two companies anticipate that the market for
Bloom Energy Servers on SHI ships could grow to 300 MW annually.
▪ Biogas product: The company has developed Energy Server that can run on a combination of natural gas and biogas
or 100% biogas. Biogas captured from cow manure contains approximately 65% methane, which has a 25x greater
impact on global warming than CO2 emissions and accounts for 10% of U.S. greenhouse gas emissions.
▪ Carbon capture: Bloom Energy Servers produce nearly 50% less carbon emission vs. average U.S. combustion
power generation. However, the company is in process of commercializing carbon capture that can be added to
Bloom Server for sequestering carbon for further uses. This would allow carbon neutral power generation using
natural gas or carbon negative using biogas. The price increase from carbon capture add-on is not significant, may be
only ~10%.
▪ Electrolyzers and green hydrogen fuel cell: In 2020, the company announced intention to enter the commercial
hydrogen market by introducing hydrogen-powered fuel cells and electrolyzers that produce renewable hydrogen.
These products would be first introduced in the South Korean market in 2021 and later in the U.S. The company
expects $750M potential revenues by 2025.
▪ BE has a product that can utilize 100% of input as green hydrogen to produce power. The company has already
deployed 100 kW of solid-oxide fuel cell powered solely by hydrogen in South Korea. BE will supply 1.8 MW of
hydrogen-powered fuel cells through a multi-stage deployment from late 2021 into 2022. Additionally, the company
also can sell electrolyzers. BE has already won award to supply its solid oxide electrolyzer cells (SOEC), which will be
capable of producing green hydrogen via solar and battery, in Korea in 2022.
SK E&C JV
The company has earned ~25/35% of revenues from Asia in 2019/2020. Outside the U.S., Korea is the largest market
for BE with more than 200MW of Bloom Energy Servers under contract. The country has 550MW of deployed fuel cells
Page 22
22
BLOOM ENERGY INITIATIONJuly 13, 2021
implying ~35% market share for BE. In 2018, Bloom Energy Japan sold Energy Servers (8.5 MW) in The Republic of
Korea to a utility company, Korea South-East Power Company. Later, BE entered into a Preferred Distributor
Agreement with SK Engineering & Construction Co., Ltd. ("SK E&C") to sell directly into the Republic of Korea. The
Preferred Distributor Agreement has an initial term expiring on December 31, 2021, and thereafter will automatically be
renewed for three-year renewal terms unless either party terminates this agreement by prior written notice under
certain circumstances.
In September 2019, BE entered into a JV agreement with SK E&C to establish a light-assembly facility in the Republic
of Korea for sales of certain portions of Energy Server for the stationary utility and commercial and industrial market in
the Republic of Korea. The facility became operational in July 2020. The JV is majority controlled and managed by BE,
however, it is not consolidated on BE’s financial statements. Other than a nominal initial capital contribution by BE, the
JV will be funded by SK E&C. SK E&C currently acting as a distributor for Energy Servers for the stationary utility and
commercial and industrial market in the Republic of Korea, will be the primary customer for the products assembled by
the JV. The company has sold and could continue to sell products in South Korea through or outside the JV.
As mentioned earlier, South Korea has a stated policy of reaching 1.5 GW by 2022 and 8 GW domestic power
generation from fuel cell by 2040 vs. ~500 MW in 2020. South Korea will likely require 1 GW ordered in 2021/22 to
reach its targeted goal for 2022. From there on, if we simplistically assume equal increase through 2040, it implies ~360
MW demand each year.
Additionally, South Korea is targeting 310 hydrogen refueling station (HRS) by 2022 and 1,200 by 2040 vs. 86 in 2019.
Additionally, South Korea expects hydrogen demand to increase to 470K TPD by 2022, 1.9M TPD by 2030 and 5.3M
TPD by 2040 vs. 130K TPD in 2018. This bodes well for BE’s new electrolyzer business.
International Growth
BE is trying to expand internationally beyond Korea, Japan and India. The company has hired a team of ~10 senior
people in April 2021 focusing on Australia, European countries such as UK, German, France, Italy, Spain and Portugal,
Southeast Asia including Thailand, Singapore and Malaysia, the Middle East and North Africa.
Sales Process
BE’s sales cycle is typically 12 to 18 months. BE markets Energy Servers primarily through a single direct sales
organization supported by project finance, business development, government affairs, legal and regulatory, and
marketing teams. In addition, the company works with multiple partners to generate customer leads and develop
projects. BE sells Energy Server primarily through direct sales channels. A large part of company’s direct sales force is
focused on expansion efforts in the U.S. and internationally.
▪ In India, Bloom Energy (India) Pvt. Ltd., wholly-owned indirect subsidiary, conducts sales; however, the company is
currently evaluating the Indian market potentially for channel partners.
▪ In Japan, sales are conducted under a Japanese joint venture with subsidiaries of SoftBank Corp, called Bloom
Energy Japan Limited.
▪ In Korea, BE entered into a Preferred Distributor Agreement with SK Engineering & Construction Co., Ltd. ("SK E&C")
to enable the company to sell directly into the Republic of Korea. The Preferred Distributor Agreement has an initial
term expiring on December 31, 2021, and thereafter will automatically be renewed for three-year renewal terms
unless either party terminates this agreement by prior written notice under certain circumstances.
The company sells the products via (1) direct sale, (2) traditional lease, (3) managed services and (4) purchase power
agreements (PPA). Mostly the customers arrange for natural gas or bio-gas themselves. Most of the sales are done in
PPAs where the customer pays $/kWH.
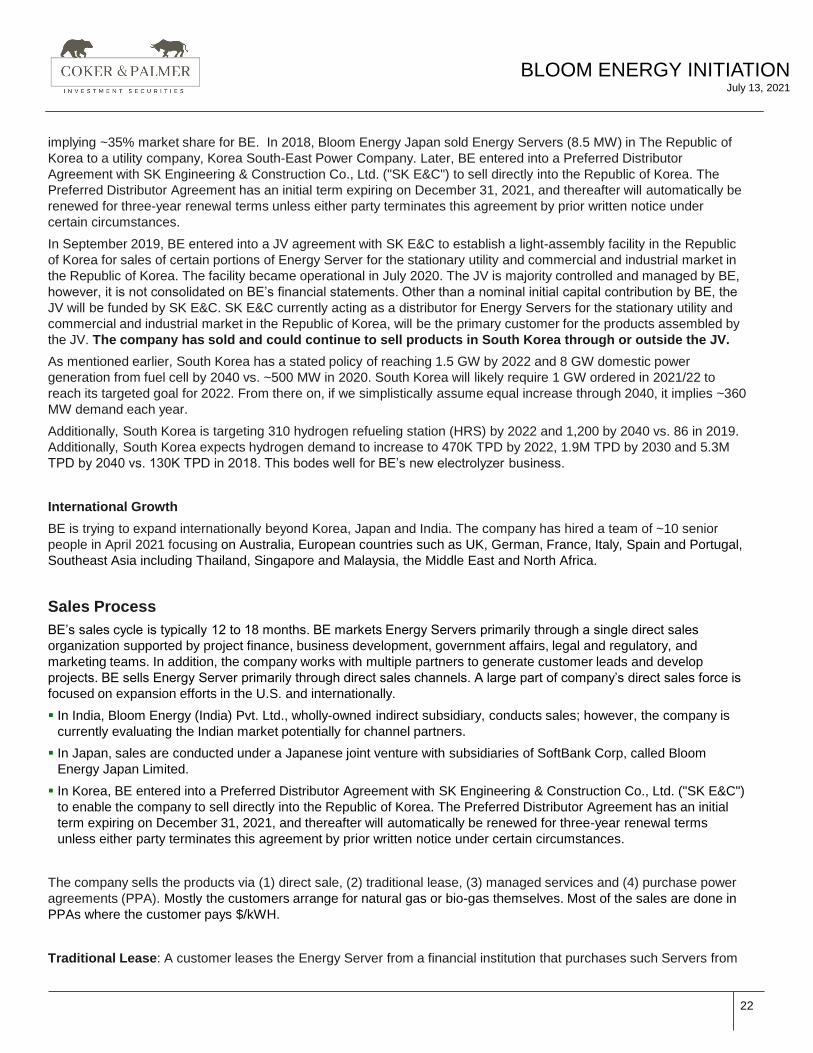
Traditional Lease: A customer leases the Energy Server from a financial institution that purchases such Servers from
Page 23
23
BLOOM ENERGY INITIATIONJuly 13, 2021
BE once commissioning is completed. The customer enters into a lease directly with a financier. After the standard
one-year warranty period, the customer almost always enters into a services agreement with BE for operations and
maintenance work for an annual service payment. The price for service agreement is set at the time of lease. The term
of a lease in a Traditional Lease option ranges from five to ten years. At the end of lease period if the customer does
not renew or purchase Energy Server (s), BE can remarket to a third party. Any proceeds of such a sale are allocated
between BE and the financing partner as agreed at the time of such sale.
Traditional Lease Model
Source: BE 10-K
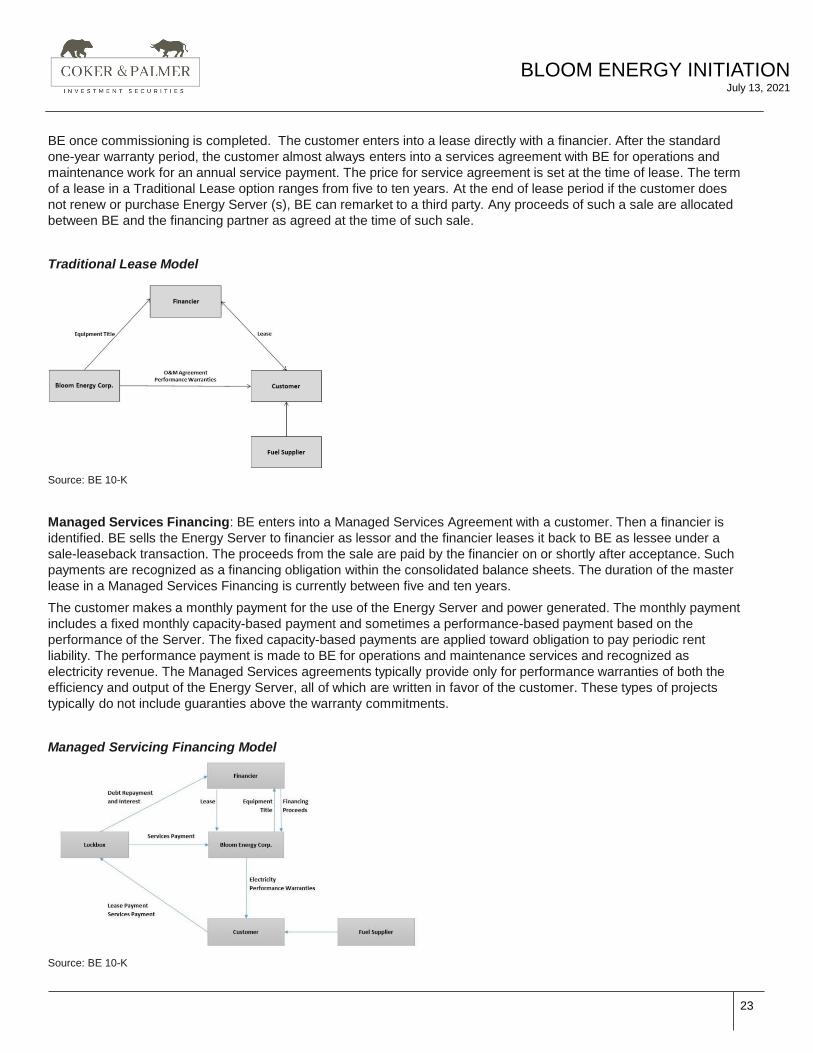
Managed Services Financing: BE enters into a Managed Services Agreement with a customer. Then a financier is
identified. BE sells the Energy Server to financier as lessor and the financier leases it back to BE as lessee under a
sale-leaseback transaction. The proceeds from the sale are paid by the financier on or shortly after acceptance. Such
payments are recognized as a financing obligation within the consolidated balance sheets. The duration of the master
lease in a Managed Services Financing is currently between five and ten years.
The customer makes a monthly payment for the use of the Energy Server and power generated. The monthly payment
includes a fixed monthly capacity-based payment and sometimes a performance-based payment based on the
performance of the Server. The fixed capacity-based payments are applied toward obligation to pay periodic rent
liability. The performance payment is made to BE for operations and maintenance services and recognized as
electricity revenue. The Managed Services agreements typically provide only for performance warranties of both the
efficiency and output of the Energy Server, all of which are written in favor of the customer. These types of projects
typically do not include guaranties above the warranty commitments.
Managed Servicing Financing Model
Source: BE 10-K
Page 24
24
BLOOM ENERGY INITIATIONJuly 13, 2021
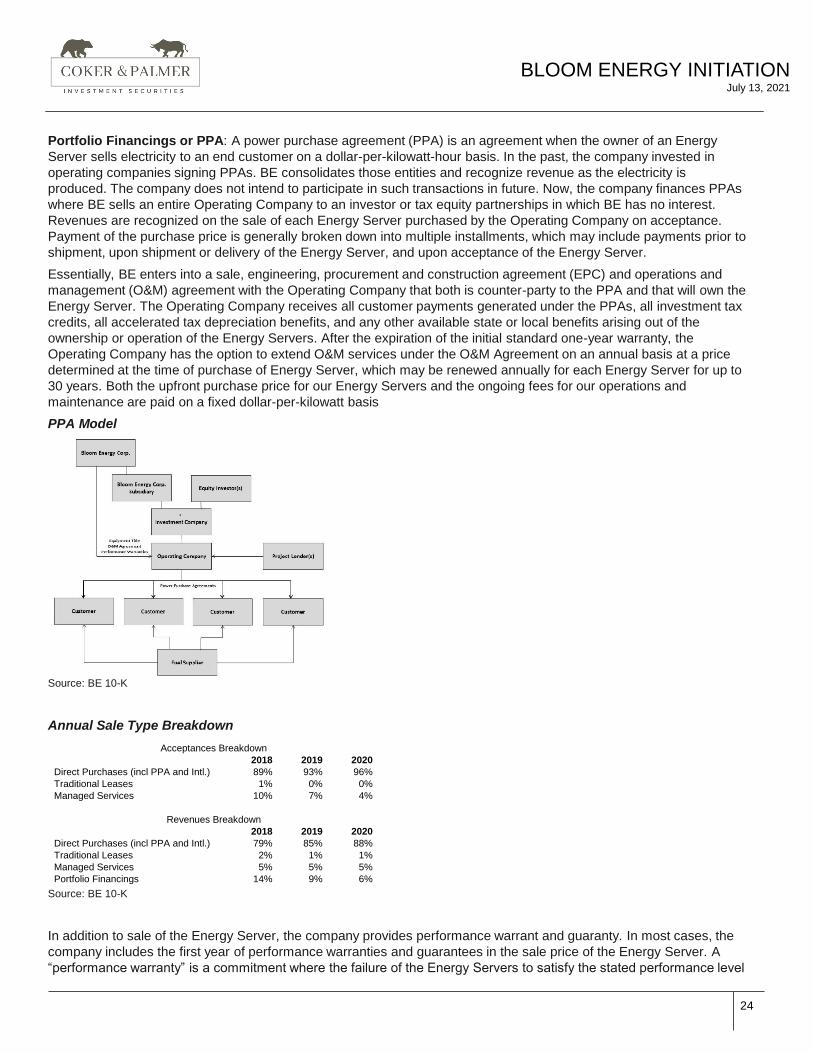
Portfolio Financings or PPA: A power purchase agreement (PPA) is an agreement when the owner of an Energy
Server sells electricity to an end customer on a dollar-per-kilowatt-hour basis. In the past, the company invested in
operating companies signing PPAs. BE consolidates those entities and recognize revenue as the electricity is
produced. The company does not intend to participate in such transactions in future. Now, the company finances PPAs
where BE sells an entire Operating Company to an investor or tax equity partnerships in which BE has no interest.
Revenues are recognized on the sale of each Energy Server purchased by the Operating Company on acceptance.
Payment of the purchase price is generally broken down into multiple installments, which may include payments prior to
shipment, upon shipment or delivery of the Energy Server, and upon acceptance of the Energy Server.
Essentially, BE enters into a sale, engineering, procurement and construction agreement (EPC) and operations and
management (O&M) agreement with the Operating Company that both is counter-party to the PPA and that will own the
Energy Server. The Operating Company receives all customer payments generated under the PPAs, all investment tax
credits, all accelerated tax depreciation benefits, and any other available state or local benefits arising out of the
ownership or operation of the Energy Servers. After the expiration of the initial standard one-year warranty, the
Operating Company has the option to extend O&M services under the O&M Agreement on an annual basis at a price
determined at the time of purchase of Energy Server, which may be renewed annually for each Energy Server for up to
30 years. Both the upfront purchase price for our Energy Servers and the ongoing fees for our operations and
maintenance are paid on a fixed dollar-per-kilowatt basis
PPA Model
Source: BE 10-K
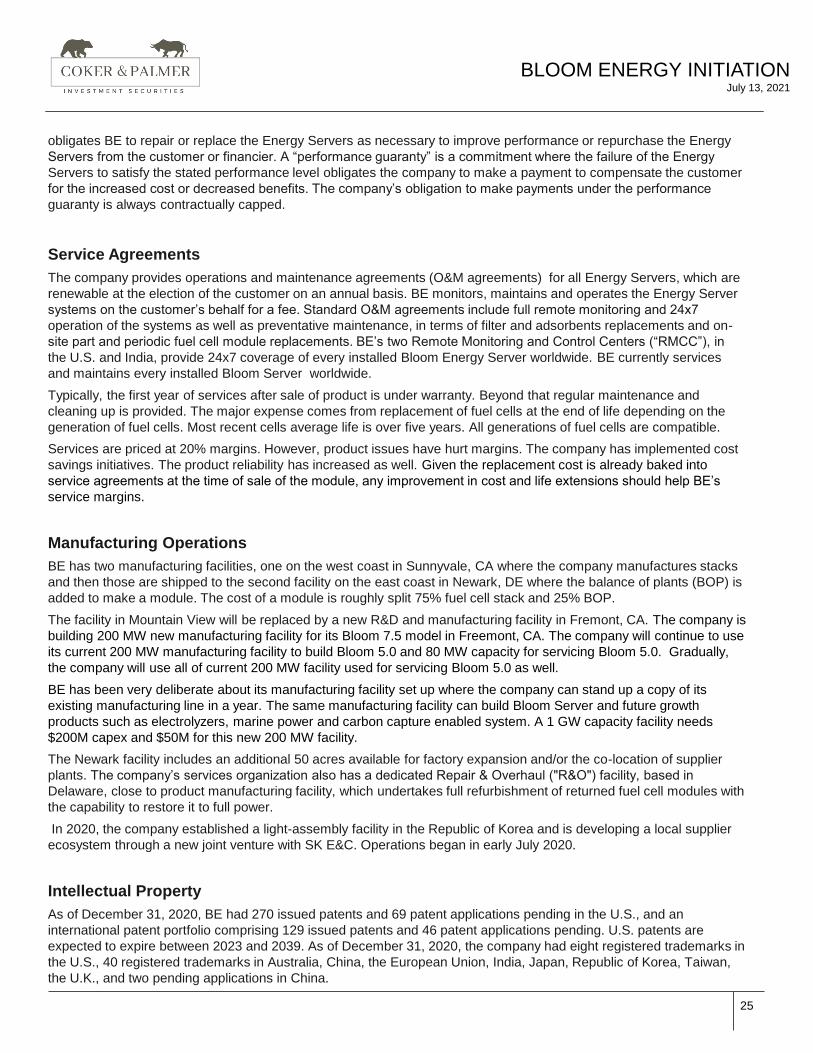
Annual Sale Type Breakdown
Source: BE 10-K
In addition to sale of the Energy Server, the company provides performance warrant and guaranty. In most cases, the
company includes the first year of performance warranties and guarantees in the sale price of the Energy Server. A
“performance warranty” is a commitment where the failure of the Energy Servers to satisfy the stated performance level
Acceptances Breakdown
2018 2019 2020
Direct Purchases (incl PPA and Intl.) 89% 93% 96%
Traditional Leases 1% 0% 0%
Managed Services 10% 7% 4%
Revenues Breakdown
2018 2019 2020
Direct Purchases (incl PPA and Intl.) 79% 85% 88%
Traditional Leases 2% 1% 1%
Managed Services 5% 5% 5%
Portfolio Financings 14% 9% 6%
Page 25
25
BLOOM ENERGY INITIATIONJuly 13, 2021
obligates BE to repair or replace the Energy Servers as necessary to improve performance or repurchase the Energy
Servers from the customer or financier. A “performance guaranty” is a commitment where the failure of the Energy
Servers to satisfy the stated performance level obligates the company to make a payment to compensate the customer
for the increased cost or decreased benefits. The company’s obligation to make payments under the performance
guaranty is always contractually capped.
Service Agreements
The company provides operations and maintenance agreements (O&M agreements) for all Energy Servers, which are
renewable at the election of the customer on an annual basis. BE monitors, maintains and operates the Energy Server
systems on the customer’s behalf for a fee. Standard O&M agreements include full remote monitoring and 24x7
operation of the systems as well as preventative maintenance, in terms of filter and adsorbents replacements and on-
site part and periodic fuel cell module replacements. BE’s two Remote Monitoring and Control Centers (“RMCC”), in
the U.S. and India, provide 24x7 coverage of every installed Bloom Energy Server worldwide. BE currently services
and maintains every installed Bloom Server worldwide.
Typically, the first year of services after sale of product is under warranty. Beyond that regular maintenance and
cleaning up is provided. The major expense comes from replacement of fuel cells at the end of life depending on the
generation of fuel cells. Most recent cells average life is over five years. All generations of fuel cells are compatible.
Services are priced at 20% margins. However, product issues have hurt margins. The company has implemented cost
savings initiatives. The product reliability has increased as well. Given the replacement cost is already baked into
service agreements at the time of sale of the module, any improvement in cost and life extensions should help BE’s
service margins.
Manufacturing Operations
BE has two manufacturing facilities, one on the west coast in Sunnyvale, CA where the company manufactures stacks
and then those are shipped to the second facility on the east coast in Newark, DE where the balance of plants (BOP) is
added to make a module. The cost of a module is roughly split 75% fuel cell stack and 25% BOP.
The facility in Mountain View will be replaced by a new R&D and manufacturing facility in Fremont, CA. The company is
building 200 MW new manufacturing facility for its Bloom 7.5 model in Freemont, CA. The company will continue to use
its current 200 MW manufacturing facility to build Bloom 5.0 and 80 MW capacity for servicing Bloom 5.0. Gradually,
the company will use all of current 200 MW facility used for servicing Bloom 5.0 as well.
BE has been very deliberate about its manufacturing facility set up where the company can stand up a copy of its
existing manufacturing line in a year. The same manufacturing facility can build Bloom Server and future growth
products such as electrolyzers, marine power and carbon capture enabled system. A 1 GW capacity facility needs
$200M capex and $50M for this new 200 MW facility.
The Newark facility includes an additional 50 acres available for factory expansion and/or the co-location of supplier
plants. The company’s services organization also has a dedicated Repair & Overhaul ("R&O") facility, based in
Delaware, close to product manufacturing facility, which undertakes full refurbishment of returned fuel cell modules with
the capability to restore it to full power.
In 2020, the company established a light-assembly facility in the Republic of Korea and is developing a local supplier
ecosystem through a new joint venture with SK E&C. Operations began in early July 2020.
Intellectual Property
As of December 31, 2020, BE had 270 issued patents and 69 patent applications pending in the U.S., and an
international patent portfolio comprising 129 issued patents and 46 patent applications pending. U.S. patents are
expected to expire between 2023 and 2039. As of December 31, 2020, the company had eight registered trademarks in
the U.S., 40 registered trademarks in Australia, China, the European Union, India, Japan, Republic of Korea, Taiwan,
the U.K., and two pending applications in China.
Page 26
26
BLOOM ENERGY INITIATIONJuly 13, 2021
Competition
BE’s Energy Server competes with traditional central grid system, solar power, wind power, traditional co-generation
systems that deliver electric power and heat from combustion sources and traditional backup equipment such as diesel
generators. The company also competes with fuel cell providers such as PLUG (Proton Exchange Membrane), FCEL
(Molten Carbonate) and Doosan (Phosphoric Acid).
Customers
BE’s Energy Servers are currently installed at customer sites in ten states in the U.S. (California, Connecticut,
Delaware, Maryland, Massachusetts, North Carolina, New Jersey, New York, Pennsylvania, Utah and Virginia),
however, four states CA, CT, MA and NY form the majority of the installed base in the U.S. Internationally, the company
has products installed in Korea, India, and Japan.
The company’s customers are among the largest multi-national corporations and some of the largest utility companies
in the U.S. and the Republic of Korea. The U.S. is currently BE’s biggest market and installed base of Bloom Energy
Servers. Some of the largest customers in the U.S. include AT&T, Caltech, Delmarva Power & Light Company, Equinix,
The Home Depot, Kaiser Permanente, and The Wonderful Company. The company also works with a number of U.S.
financing partners, such as Southern PowerSecure Holdings, Inc. ("The Southern Company"), Duke Energy One, Inc.,
Key Equipment Finance, a division of KeyBank National Association, and Assured Guaranty Municipal Corporation,
who purchase BE’s Energy Servers and deploy the systems at end-customers’ facilities in order to provide the
electricity as a service. Outside the U.S., Korea is the largest market for BE with more than 200MW of Bloom Energy
Servers under contract. S&K has contributed 23/24% of 2019/20 revenues while Duke Energy generated 28% of
revenues in 2020.
Page 27
27
BLOOM ENERGY INITIATIONJuly 13, 2021
Company History
▪ 2021
– May 18: Announced an agreement with Idaho National Laboratory to independently test the use of nuclear energy
to create clean hydrogen through Bloom Energy’s solid oxide, high-temperature electrolyzer.
– May 5: Announced collaboration with Baker Hughes on the potential commercialization and deployment of
integrated, low carbon power generation and hydrogen solutions.
– Apr. 23: Announced international leadership for expansion targeting Australia, Europe (UK, France, Italy, Spain
and Portugal), Southeast Asia, Middle East/North Africa. Also opened an office in Dubai, UAE.
– Feb. 2: Hydrogen Forward coalition formed to advance hydrogen in the U.S. The founding members include Air
Liquide, Anglo American, Bloom Energy, CF Industries, Chart Industries, Cummins Inc., Hyundai, Linde,
McDermott, Shell and Toyota.
▪ 2020
– Nov. 18: Won a competitive Request for Proposal to supply solid-oxide fuel cells (SOFC) powered by 100%
hydrogen and electrolyzers to an industrial complex in Changwon, Korea. BE will supply 1.8 MW of hydrogen-
powered fuel cells through a multi-stage deployment from late 2021 into 2022.
– Jul. 15: Announced BE is entering the commercial hydrogen market by introducing hydrogen-powered fuel cells
and electrolyzers that produce renewable hydrogen. These products will be first introduced to the South Korean
market in 2021 through an expanded partnership with SK E&C.
– Mar. 30: Gregory Cameron named CFO.
▪ 2019
– Sept. 15: BE and Samsung Heavy Industries Team Up to Build Ships Powered by Solid Oxide Fuel Cells.
– Aug. 19: Introduces ‘AlwaysON’ Microgrid Solution to Provide Power Resiliency During Grid Outages.
– Jul. 1: Duke Energy to Offer Bloom Energy Distributed Fuel Cell Technology to Customers. Duke will purchase
~37MW of Bloom Energy Servers.
– Feb. 5: BE and SK D&D Announce Distributorship Agreement for fuel cell deployments in South Korea.
– Announced ability to operate Energy Servers on renewable hydrogen
▪ 2018:
– First site deployed in South Korea in 4Q18.
– Completed an IPO selling 20.7M shares.
▪ 2016: First site deployed in India in 2Q16.
▪ 2013:
– Largest utility scale deployment of 30MW in Delaware for Delmarva in Nov. 2013.
– First side deployed in Japan in Jun. 2013.
▪ 2012: Largest commercial customer deployment of 12MW for a major consumer technology company’s data center in
Dec. 2012.
▪ 2010:
– First deployment under a PPA financing in Oct. 2010.
– 2010: Public unveiling of Bloom Energy Server and announcement of industry-leading customers including
Google, Walmart, eBay, Coca-Cola, Staples, FedEx, Bank of America, and Cox Enterprises.
▪ 2008: First commercial deployment of 400 kW for a major internet company in Aug. 2008.
▪ 2006: Changed name on Sept. 20, 2006 to Bloom Energy Corp.
▪ 2001: Incorporated in Delaware on Jan. 18, 2001, as Ion America Corp.
Page 28
28
BLOOM ENERGY INITIATIONJuly 13, 2021
Executive Officers and Directors
KR Sridhar – Founder, Chairman, Chief Executive Officer, since 2002
▪ Prior to founding Bloom, served as director of the Space Technologies Laboratory at the University of Arizona where
he was also a professor of Aerospace and Mechanical Engineering.
▪ Has served as an advisor to NASA and has led major consortia of industry, academia and national labs.
▪ Currently serves as a strategic limited partner at Kleiner Perkins.
▪ Served on many technical committees, panels and advisory boards and has several publications and patents.
Gregory Cameron - Executive Vice President and Chief Financial Officer, since April 2020
▪ President & CEO of Global Operations for GE Company, from 2018 through 2019.
▪ President & CEO of GE Capital’s Global Legacy Solutions, from 2016 through 2018.
▪ Prior to 2016, he served in various senior roles with General Electric, including as Chief Financial Officer, Americas-
GE Capital from 2009 through 2016.
Board MembersMary K. Bush – Independent Director, since 2017
▪ President of Bush International, LLC, an advisor to U.S. corporations and foreign governments on international capital
markets, strategic business, economic and governance matters since 1991.
▪ Held several Presidential appointments, including the U.S. Government’s representative on the International
Monetary Fund Board and Director of Sallie Mae Bank.
▪ Former head of the Federal Home Loan Bank System during the aftermath of the Savings and Loan crisis and was
advisor to the Deputy Secretary of the U.S. Treasury Department.
▪ Earlier in her career, managed global banking and corporate finance relationships at New York money center banks
including Citibank, N.A., Banker’s Trust Company, and JPMorgan Chase Bank, N.A.
▪ Director of Briggs & Stratton, Inc. from 2004 to March 2009, of United Continental Holdings, Inc. from 2006 to 2010, of
the Pioneer Family of Mutual Funds from 1997 to 2012 and of Marriott International, Inc. from 2008 to 2020.
▪ Member of Kennedy Center’s Community Advisory Board.
▪ Chairman of the Capital Partners for Education, a not-for-profit organization that mentors young people through high
school and college.
Jeffrey Immelt – Independent Director, since 2019
▪ Venture partner at NEA since January 2018.
▪ Former Chairman and CEO of General Electric (“GE”), a diversified industrial company, for 16 years from 2001 to
2017 where he revamped the company’s strategy, global footprint, workforce and culture.
▪ Chaired the President’s Council on Jobs and Competitiveness under the Obama Administration.
▪ Member of The American Academy of Arts & Sciences.
Page 29
29
BLOOM ENERGY INITIATIONJuly 13, 2021
Eddy Zervigon - Independent Director, since 2007
▪ CEO of Quantum Xchange, a cybersecurity company, since September 2020.
▪ Special Advisor at Riverside Management Group, a boutique merchant bank, since 2012.
▪ Previously, he was a Managing Director in the Principal Investments Group at Morgan Stanley & Co. LLC, a global
financial services firm, from 1997 to 2012.
▪ Prior to joining Morgan Stanley, Mr. Zervigon was a Certified Public Accountant at Coopers & Lybrand (now
PricewaterhouseCoopers LLP), a public accounting firm.
▪ Served as a director of DigitalGlobe, Inc., a builder and operator of satellites for digital imaging, where he served as a
member of the audit and compensation committees from 2004 to 2017.
▪ Previously served as a board member of MMCinemas, Impsat Fiber Networks, Inc., TVN Entertainment Corporation
and Stadium Capital Management, LLC.
John T. Chambers – Independent Director, since 2018
▪ Founder and Chief Executive Officer at JC2 Ventures, a venture capital firm, since March 2017.
▪ Executive Chairman of the board of Cisco Systems, Inc. (“Cisco”), a networking and information technology company,
from July 2015 to December 2017 and as Chairman of the board of Cisco from November 2006 to July 2015.
▪ Cisco’s Chief Executive Officer from January 1995 until July 2015 and President from January 1995 to November
2006.
▪ Employed by Wang Laboratories, Inc., a former computer-based office information processing systems company,
from 1982 to 1990, where, in his last role, he was the Senior Vice President of U.S. Operations.
▪ Chairman of the US-India Strategic Partnership Forum.
▪ Appointed Global Ambassador of the French Tech by President Emmanuel Macron of France.
L. John Doerr – Independent Director, since 2002
▪ General Partner of Kleiner Perkins Caufield & Byers, a venture capital firm (together with its affiliates, “Kleiner
Perkins”), since August 1980.
▪ Former director of Amazon.com, Inc., an e-commerce company, from June 1996 to May 2010, and Zynga, Inc., a
provider of social game services, from April 2013 to May 2017.
Michael Boskin – Independent Director, since 2019
▪ Tully M. Friedman Professor of Economics and Wohlford Family Hoover Institution Senior Fellow at Stanford
University, where he has been on the faculty since 1971.
▪ CEO and President of Boskin & Co., Inc. since 1980.
▪ Chairman of the President’s Council of Economic Advisers from 1989 to 1993.
▪ Former director of ExxonMobil from 1996 to 2018.
General Colin L. Powell – Director, since 2009
▪ Served as the 65th U.S. Secretary of State from January 2001 to January 2005.
▪ Served 35 years in the U.S. Army, rising to the rank of Four-Star General and from 1989 to 1993 as the 12th
Chairman of the Joint Chiefs of Staff.
▪ Chairman of the Board of Visitors of the Colin Powell School at the City College of New York since 1994.
▪ Founder and Chairman Emeritus of the America’s Promise Alliance, a nonprofit organization advocating for the
strength and well-being of America’s children and youth.
Page 30
30
BLOOM ENERGY INITIATIONJuly 13, 2021
Scott Sandell – Independent Director, since 2003
▪ Currently serves as the Managing General Partner at global venture capital firm New Enterprise Associates, Inc.
(“NEA”) since April 2017
▪ Joined NEA in January 1996 and as has been a General Partner since September 2000 and served as Co-
Managing General Partner from March 2015 to April 2017
▪ Served as head of the firm’s technology investing practice for 10 years and has led NEA’s China investing
activities for over a decade
▪ Prior to joining NEA in 1996, worked as a Product Manager for Windows 95 at Microsoft Corporation.
▪ Started career at Boston Consulting Group, a global management consulting firm, and later joined C-ATS Software,
Inc., a software development company.
▪ Previously served on the boards of, among others, Data Domain, Inc., Fusion-io, Inc., Neoteris, Inc., NetIQ
Corporation, Playdom, Inc., Spreadtrum Communications, Inc., Tableau Software Inc., WebEx Communications, Inc.
and Workday, Inc.
▪ Currently serves on the Board of Advisors for the Thayer School of Engineering at Dartmouth.
▪ Former Chairman of the Board of the National Venture Capital Association, a trade organization for venture capital
and private equity firms, from 2014 to 2015.
Page 31
31
BLOOM ENERGY INITIATIONJuly 13, 2021
Shareholders
Top 25 shareholders currently hold ~75% of shares. Currently, ~60% of shares are held by investment advisors.
Top 25 Shareholders
Source: Bloomberg
Ownership Type
Source: Bloomberg
(M shares) 2Q20 3Q20 4Q20 1Q21
Ameriprise Financial Inc11.06 12.81 12.89 17.02
Vanguard Group Inc/The6.51 7.61 10.88 11.62
FMR LLC 0.49 5.81 10.50 10.50
BlackRock Inc 4.76 5.71 6.67 7.49
Alberta Investment Management Corp0.00 0.00 0.00 0.00
Doerr L John 2.50 3.46 3.46 3.46
JPMorgan Chase & Co0.23 0.23 0.23 3.36
UBS AG 0.36 0.37 2.67 2.48
ClearBridge LLC 1.38 1.38 2.11 2.31
Morgan Stanley 2.21 2.21 2.21 2.21
Wells Fargo & Co 0.38 1.28 2.17 2.11
State Street Corp 1.65 1.81 2.03 1.98
Geode Capital Management LLC0.72 1.18 1.52 1.67
Invesco Ltd 1.19 1.40 1.36 1.53
Teachers Insurance & Annuity Association of America1.09 1.48 1.65 1.46
First Trust Advisors LP0.18 0.34 1.19 1.49
Svenska Handelsbanken0.79 1.17 1.79 1.34
NEA Management Co LLC1.33 1.33 1.33 1.33
Renaissance Technologies LLC5.54 3.71 0.00 1.19
Northern Trust Corp 0.26 1.03 1.14 1.12
Neuberger Berman Group LLC1.39 1.34 0.93 0.87
Norges Bank 0.00 0.00 0.87 0.87
Two Sigma Investments LP0.05 0.00 0.04 0.81
Citadel Advisors LLC0.00 0.25 0.65 0.80
Charles Schwab Corp/The0.19 0.55 0.71 0.80
Top 25 Share 60% 56% 66% 74%
58%14%
6%
6%
5%4%
3% 2% 1%
Investment Advisor
Insurance Company
Bank
Individual
Hedge Fund Manager
Sovereign Wealth Fund
Brokerage
Pension Fund
Trust
Page 32
32
BLOOM ENERGY INITIATIONJuly 13, 2021
Appendix A – Required Disclosures
Analyst Certification
I, Vaibhav (Vebs) Vaishnav, certify that to the best of my knowledge, the views and opinions in our research reports
accurately reflect my personal views about the subject company (companies) and its (their) securities. I have not and
will not receive direct or indirect compensation related to the specific recommendations or opinions of this report.
Unless otherwise stated, the individuals listed on the cover page of this report are analysts for Coker Palmer
Institutional (CPI). Coker Palmer Institutional (CPI) is the brand name used to distinguish Coker & Palmer’s institutional
only, sell side equity research operations.
Important Disclosures
Conflicts of Interest: You should assume that as of the publication date of any report or letter, CPI (possibly along with
or through our members, partners, affiliates, employees, and/or consultants) along with our clients and/or investors has
a position in the subject companies or derivatives of subject companies mentioned in this report, and therefore stands
to realize gains based on the price movements of stocks covered in this report. Following publication of any report or
letter, we intend to continue transacting in the securities covered therein, and we may be long, short, or neutral at any
time hereafter regardless of our initial recommendation.
Analyst Compensation
Analysts are not directly compensated based on investment banking fees, but analysts’ compensation is based on
overall firm profitability, which may or may not include investment-banking fees. CPI has not received investment-
banking income from the subject companies in the previous 12 months. Investors should expect that Coker & Palmer
may seek and may be seeking compensation for investment banking and non-investment banking related services and
production from any or all companies mentioned within this report.
Conflicts
Vaibhav (Vebs) Vaishnav, Oilfield Services & Green Energy Analyst, does not hold any stocks from those sectors in his
personally managed accounts.
In the normal course of offering investment and banking products and services to clients, CPI may act in several
capacities (including issuer, market maker, underwriter and distributor agent) simultaneously with respect to a product,
giving rise to potential conflicts of interest. CPI uses controls such as information barriers to manage conflicts should
they arise.
CPI has not been involved with any investment banking/consulting activities in the Oilfield Services and/or Green
Energy sector in the past six months.
Rating Methodology
Coker Palmer Institutional (CPI) is restarting formal rating systems. The firm has a three-tiered rating system, with
ratings of Sector Outperform, Sector Perform, and Sector Underperform. Each Research Analyst assigns a rating that is
relative to his or her coverage universe or an index identified by the Research Analyst that includes, but is not limited to,
stocks covered by the Research Analyst.
The rating assigned to each security covered in this report is based on the CPI Research Analyst’s 12-month view on
the security. Research Analysts may sometimes express in research reports shorter-term views on these securities that
may impact the price of the equity security in a manner directly counter to the Research Analyst’s 12-month view.
Page 33
33
BLOOM ENERGY INITIATIONJuly 13, 2021
Appendix A – Required Disclosures Contd.
These shorter term views are based upon catalysts or events that may have a shorter-term impact on the market price
of the equity securities discussed in research reports, including but not limited to the inherent volatility of the
marketplace. Any such shorter-term views expressed in research report are distinct from and do not affect the
Research Analyst’s 12-month view and are clearly noted as such.
Ratings
Sector Outperform (SO)
The stock is expected to outperform the average 12-month total return of the analyst’s coverage universe or an index
identified by the analyst that includes, but is not limited to, stocks covered by the analyst.
Sector Perform (SP)
The stock is expected to perform approximately in-line with the average 12-month total return of the analyst’s coverage
universe or an index identified by the analyst that includes, but is not limited to, stocks covered by the analyst.
Sector Underperform (SU)
The stock is expected to underperform the average 12-month total return of the analyst’s coverage universe or an index
identified by the analyst that includes, but is not limited to, stocks covered by the analyst.
Price Target Methodology:
Coker Palmer Institutional (CPI) price targets are essentially based on DCF methodology.
Valuation/Risk Factors
Oilfield Services (OFS) business is inherently risky. OFS investors should be fully aware of these risks, which include,
but are not limited to, volatile natural gas, NGL’s and crude oil prices, demand for and competition for a company’s
product and/or service, asset quality, customer risks, changes in operating costs, company capital structures, operating
and working capital needs and ability to raise both debt and equity capital to fund operations. We value OFS equities on
many different metrics, including but not limited to, our subjective view as to the quality of management, discounted
cash flows, net asset values, enterprise value to EBITDA or cash flow multiples, price to earnings or cash flow
multiples, reinvestment risk and full cycle economics. These factors are uncertain and our outlook is subject to change,
sometimes quite quickly. Any changes in the above factors can impede achievement of our valuation assessments.
Coker & Palmer Institutional Ratings Distribution
Category Count Percent
Sector Outperform 4 29%
Sector Perform 4 29%
Sector Underperform 6 43%
Total 14 100%
Page 34
34
BLOOM ENERGY INITIATIONJuly 13, 2021
Appendix A – Required Disclosures Contd.
Green Energy businesses are inherently risky. The industry is still at a nascent stage and long-term viability is still not
established. Investors should be fully aware of these risks, which include, but are not limited to, viability of new products
and markets targeted, volatile commodity prices, demand for and competition for a company’s product and/or service,
asset quality, customer risks, changes in operating costs, company capital structures, operating and working capital
needs and ability to raise both debt and equity capital to fund operations. We value Green Energy equities on many
different metrics, including but not limited to, our subjective view as to the quality of management, discounted cash
flows, net asset values, enterprise value to EBITDA or cash flow multiples, price to earnings or cash flow multiples,
reinvestment risk and full cycle economics. These factors are uncertain and our outlook is subject to change,
sometimes quite quickly. Any changes in the above factors can impede achievement of our valuation assessments.
The Exploration and Production (E&P) business in inherently risky. Investors in E&P equities should be fully aware of
these risks, which include, but are not limited to, volatile natural gas, NGL’s and crude oil prices, regional pricing
differences, field and company asset quality, reserve depletion factors, drilling risks, operating costs, company capital
structures, operating and working capital needs and ability to raise both debt and equity capital to fund operations. .
E&P Valuation Methods used to determine the Price Target: We value E&P companies on many different metrics,
including, but not limited to, our estimate of net asset value (NAV), enterprise value to EBITDA or cash flow multiples,
price/earnings or cash flow multiples, discounted cash flow analysis and breakup/acquisition values. All our estimates
and valuations are highly and inherently uncertain. They are based on, but not limited to, our outlook for the commodity
price, our subjective view as to the quality of management, net asset value, quality of the proven and unproven reserves
and resources, ability to develop and produce these reserves/resources, financial strength, cash flow, access to capital,
and full cycle economics of investments. These factors are uncertain and our outlook is subject to change, sometimes
quite quickly. Any changes in the above factors can impede achievement of our valuation assessments.
Industrials: This category might cover many different types of companies with various business models and various
factors affecting the operations and stock prices, some of which include overall economic growth, end market demand,
product inventories and competition. Some of these companies might have various energy-related exposure through
both sales and/or costs. In general, industrial company risks include, but not limited to, high fixed operating costs, rising
input costs, currency and commodity price fluctuations, variable demand, inventory levels, quality of management,
competition and obsolesce.
E&P, Oilfield Service, Industrials, Green Energy, as well as investments in the other subsectors we follow are subject to
a myriad of external factors, including but not limited to, commodity price risk, geopolitical risk, changes in interest
rates, the value of worldwide currencies, especially the U.S. dollar, changing regulations, both domestically and abroad,
regulatory enforcement levels, and changes in domestic or global economic fundamentals. Please see specific
companies' most recent SEC filings, including 10-Ks, 10-Qs, 8-Ks, and proxy filings for additional risks and
considerations. For companies based outside the US, please see country specific regulatory filings for additional risks
and considerations.